Preprint
Article

Unraveling Shikimate Dehydrogenase Inhibition by 6-Nitroquinazoline-2,4-diol and its Impact on Soybean and Maize Growth

Altmetrics

Downloads

97

Views

55

Comments

0

A peer-reviewed article of this preprint also exists.

Submitted:

18 March 2024

Posted:

19 March 2024

You are already at the latest version

Alerts
Abstract
The shikimate pathway is crucial for the biosynthesis of aromatic amino acids in plants and represents a promising target for developing new herbicides. This work aimed to identify inhibitors of shikimate dehydrogenase (SDH), a key enzyme of the shikimate pathway that catalyzes the conversion of 3-dehydroshikimate to shikimate. Virtual screening and molecular docking were performed on the SDH active site of Arabidopsis thaliana (AtSDH), and 6-nitroquinazoline-2,4-diol (NQD) was identified as a potential inhibitor. In vitro assays showed that NQD decreased the activity of AtSDH by reducing Vmax while keeping KM unchanged, indicating noncompetitive inhibition. In vivo, hydroponic experiments revealed that NQD reduced the root length of soybean and maize. Additionally, NQD increased the total protein content and certain amino acids. Soybean roots uptake NQD more efficiently than maize roots. Furthermore, NQD reduced shikimate accumulation in glyphosate-treated soybean roots, suggesting its potential to restrict the flow of metabolites along the shikimate pathway in soybean. Simultaneous treatment of maize seedlings with glyphosate and NQD accumulated gallic acid in the roots, indicating that NQD inhibits SDH in vivo. Overall, the data indicate that NQD inhibits SDH both in vitro and in vivo, providing valuable insights into the potential development of herbicides targeting SDH.
Keywords: 
Subject: Biology and Life Sciences  -   Plant Sciences

1. Introduction

The shikimate pathway converts carbohydrate precursors derived from glycolysis and the phosphate pentose pathway into chorismate, which acts as the precursor for phenylalanine, tyrosine, and tryptophan. Typically, up to 20% of the fixed carbon is channeled into the shikimate pathway, but this percentage tends to increase during plant stress or rapid growth periods [1]. These aromatic amino acids are essential for plant growth, development, and responses to changes in their environment [2,3,4,5]. The pathway starts with erythrose-4-phosphate and phosphoenolpyruvate, derived from the pentose phosphate pathway and glycolysis, respectively. It involves seven enzymatic reactions that produce chorismate, a precursor of aromatic amino acids [6] (Figure 1). The pathway is present in plants, bacteria, fungi, and some apicomplexan parasites but varies in the regulation, organization, and cellular location of the enzymes [7,8,9]. The biosynthesis of amino acids, including aromatic, branched chain, and glutamine, involves enzymes that are targeted by some herbicides [10].
Weeds compete with cultivated plants for vital resources such as water, nutrients, and sunlight, reducing agricultural productivity [11]. Synthetic herbicides have brought about greater weed control efficiency. However, excessive, and indiscriminate use without implementing other management practices resulted in the emergence of resistant weeds. In addition, this problem has been worsened by the emergence of several multiple or cross-resistant species [10]. Therefore, it is crucial to explore novel molecules and mechanisms of action to overcome this complex situation. In this way, shikimate pathway enzymes are potential candidates for developing novel herbicides. This is because these enzymes are not present in animals, and the herbicide glyphosate effectively targets 5-enolpyruvylshikimate 3-phosphate synthase (EPSP synthase), a crucial enzyme in this biochemical pathway [12]. EPSP synthase catalyzes the condensation of shikimate 3-phosphate and phosphoenolpyruvate to produce EPSP. Therefore, herbicides limit the biosynthesis of aromatic amino acids and further proteins [6].
The bifunctional enzyme 3-dehydroquinate dehydratase/shikimate dehydrogenase (DHQD/SDH) is responsible for catalyzing the third and fourth reactions of the shikimate pathway in plants. In contrast, monofunctional enzymes catalyze these reactions in bacteria, and they are a component of the pentafunctional complex AROM (reactions 2 to 5; Figure 1) in fungi [3,4,13]. Also known as shikimate:NADP+ oxidoreductase (EC 1.1.1.25), SDH catalyzes the NADPH-dependent reduction of 3-dehydroshikimate to shikimate [6]. SDH has been investigated for its medical potential as a site of action for novel antibiotics against microorganisms such as Mycobacterium tuberculosis [14], Staphylococcus aureus [15,16] and Toxoplasma gondii [17]. At the plant level, the foremost evaluation of SDH as a new site of action for herbicides was performed by Baillie et al. [18]. Using purified SDH from etiolated pea (Pisum sativum) shoots, several 1,6-dihydroxy-2-oxoisonicotinic acid derivatives were tested in vitro. The results showed that some derivatives acted as irreversible enzyme inhibitors, but none displayed any potential herbicidal actions. Also, a study showed that epigallocatechin gallate and epicatechin gallate can effectively inhibit Arabidopsis thaliana DHQD/SDH (AtDHQD/SDH) when tested in vitro. However, the potential use of these compounds as herbicides has yet to be evaluated in vivo [19]. Recently, Ma et al. [20] discovered that drupacine, a natural compound extracted from Cephalotaxus sinensis, can target SDH. Molecular docking simulations indicated that drupacine has a higher binding energy with SDH. As a result, the inhibition of SDH by drupacine could potentially disrupt the biosynthesis of aromatic amino acids, leading to abnormal growth and eventual death of weed seedlings [21].
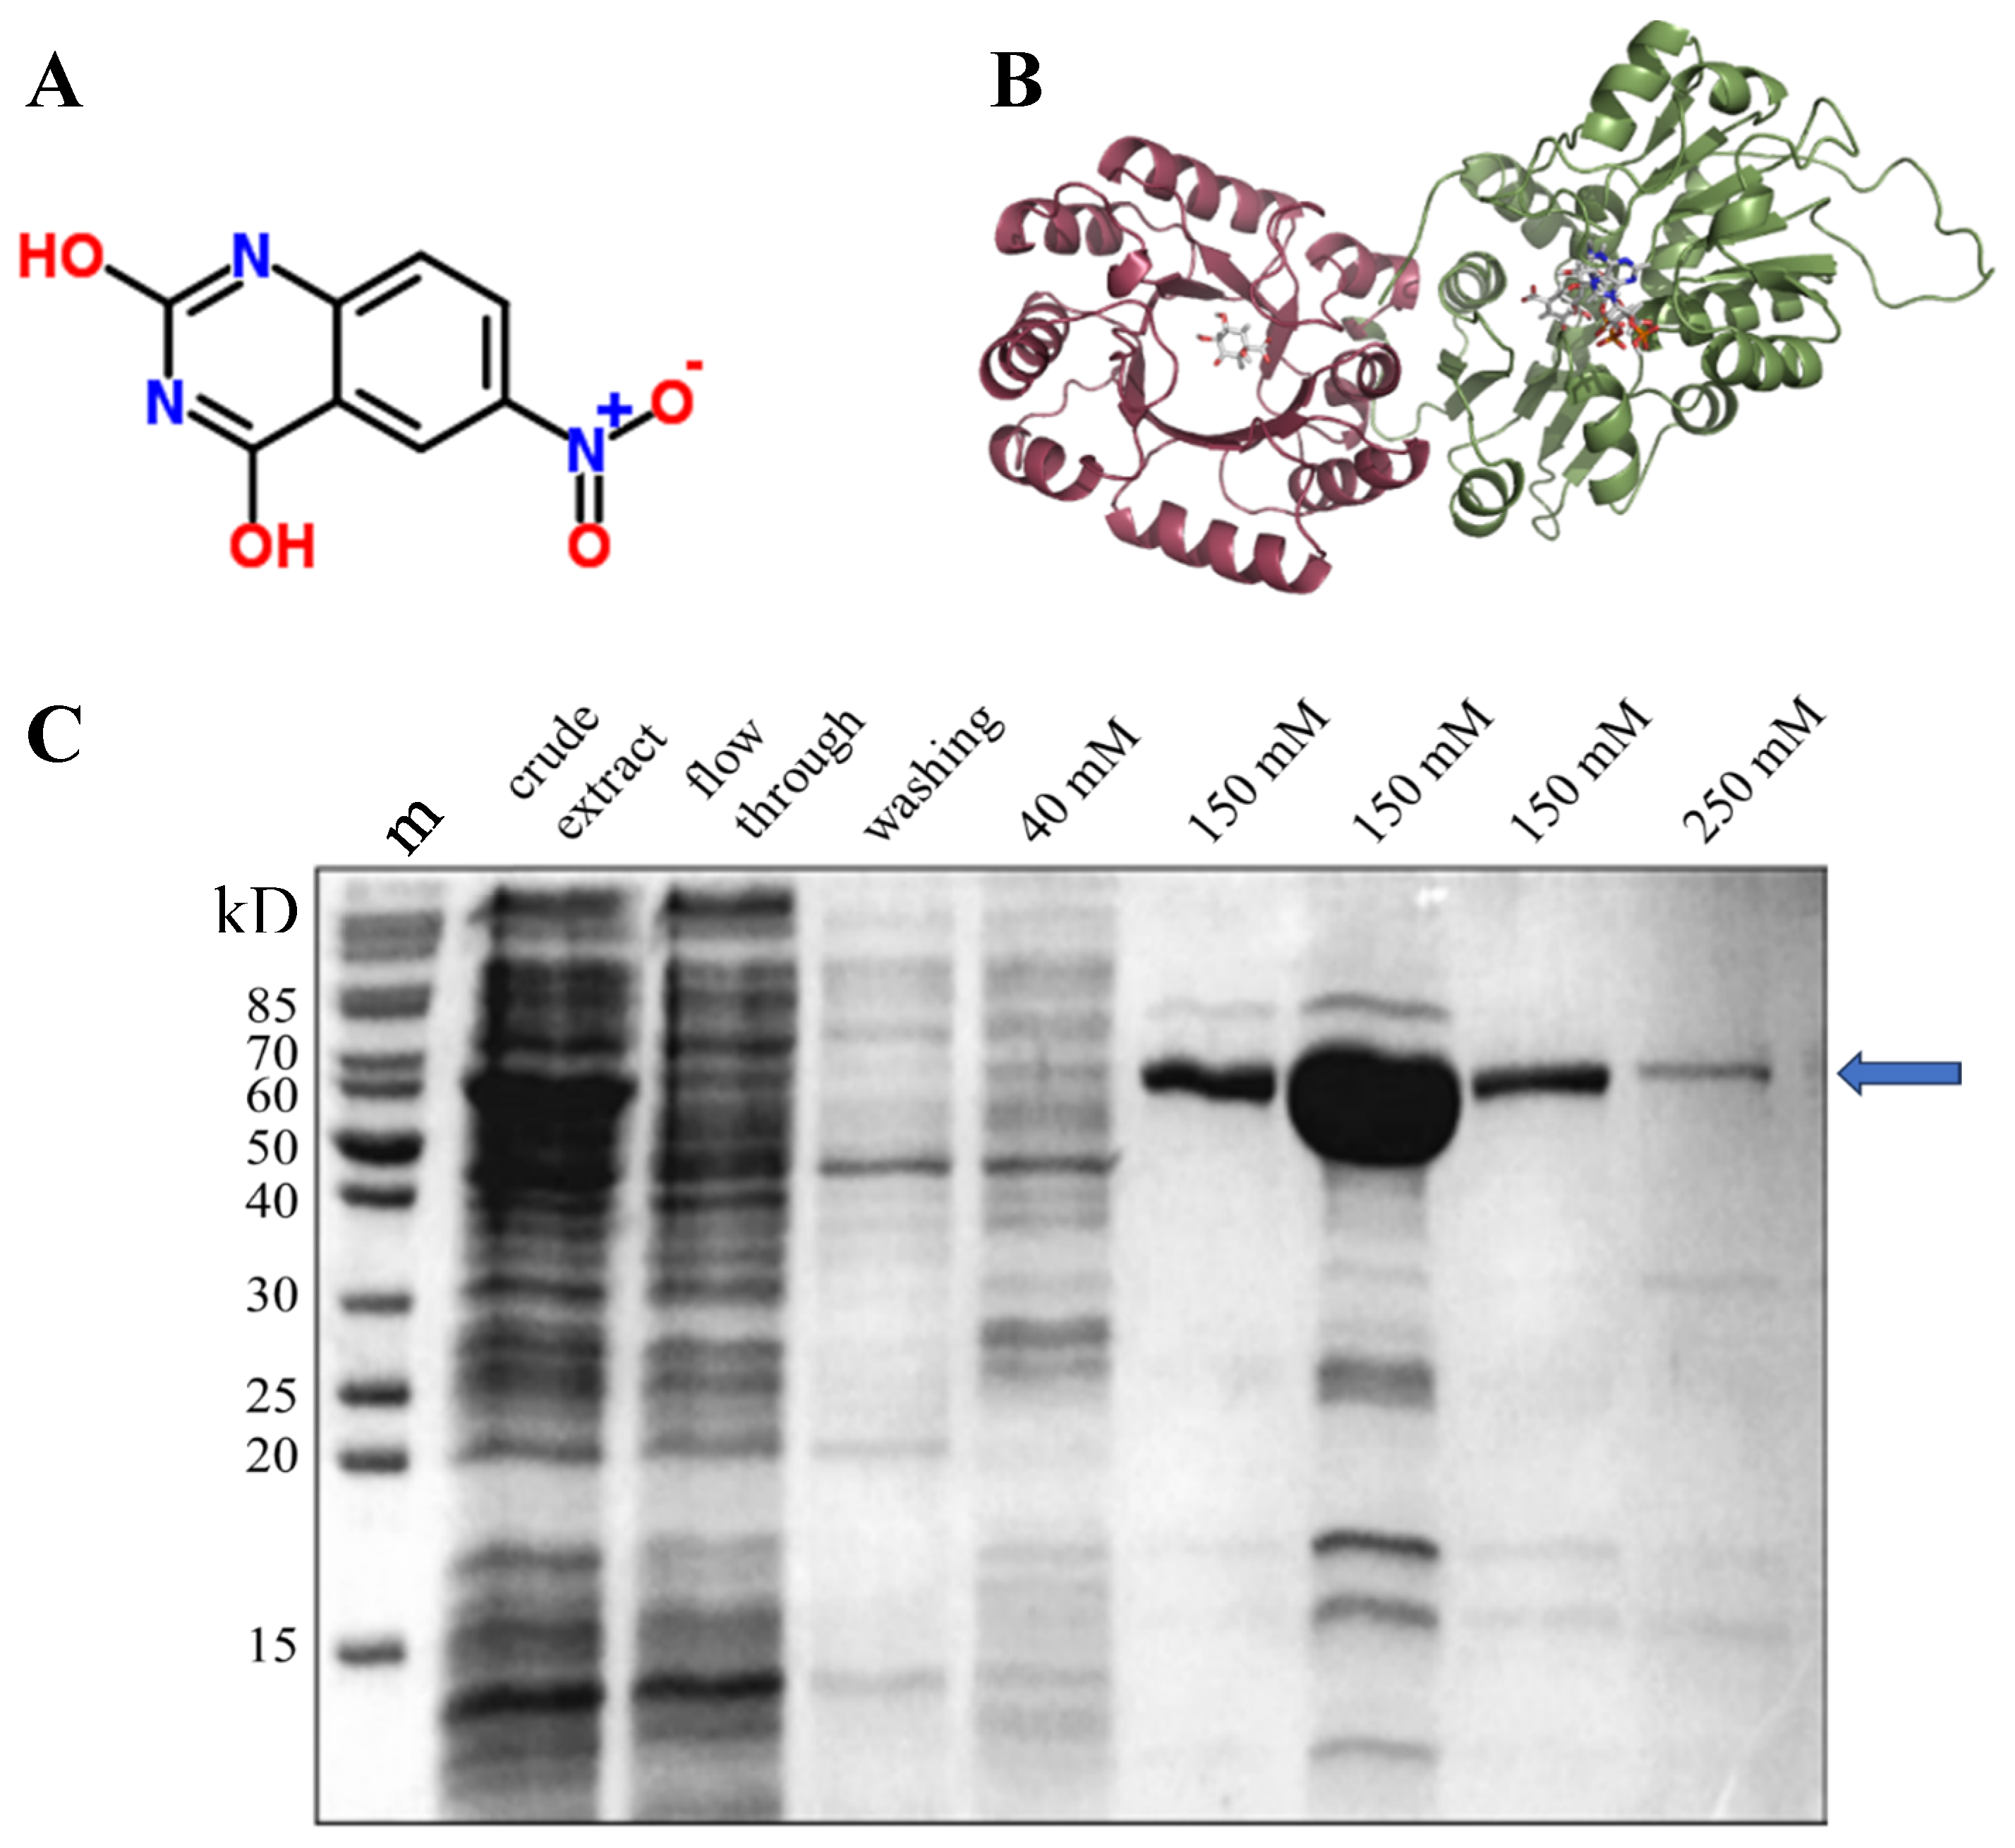
Because this subject has yet to be extensively explored, we decided to expand the study on SDH inhibition as a potential target for herbicides. The original purpose of this study was to employ in silico tools for prospecting potential SDH inhibitors. In silico experiments revealed 6-nitroquinazoline-2,4-diol (NQD) (depicted in Figure 2A) as a highly promising inhibitor of shikimate dehydrogenase (SDH). Notably, NQD exhibited a superior docking score compared to the substrate DHK and all other compounds under consideration. Afterward, the inhibitory action and effectiveness of NQD were evaluated using in vitro kinetic enzyme assays with AtDHQD/SDH (Figure 2B). To evaluate the potential of NQD as an herbicide in practical in vivo scenarios, we conducted experiments using hydroponically cultivated soybean (Glycine max) and maize (Zea mays) seedlings. We chose soybean, a C3 dicot, and maize, a C4 monocot, as our model plants for comparing their metabolic responses to NQD exposure. Based on our previous studies, we determined that growing soybean and maize seedlings in a hydroponic system would be the most effective method to evaluate the molecules with biological activities [22,23,24,25]. This system provides optimal growth conditions, easy access for treatment, and minimizes the risk of compound adsorption to the soil or substrate, thereby maximizing the biological activity of the NQD.

2. Materials and Methods

2.1. Three-dimensional structure of AtDHQD/SDH

The Protein Data Bank database (PDB ID: 207s) provided the crystallographic structure of the AtDHQD/SDH (EC 4.2.1.10). The structure was obtained in the presence of the cofactor NADPH and the ligand 3-dehydroshikimate (DHK) [26]. An OH group was added to DHK ligand (residue 9241) forming the 3-dehydroquinate (DHQ) ligand, which is the substrate of this domain. The structural waters were maintained, and the remaining ions were removed from the crystallization solution. The Modeller program [27] was used to model the crystallographic structure gaps caused by lack of electron density between residues 436 to 454 and 510 to 511 based on the amino acid sequence (UniProt ID: Q9SQT8). S-Hydroxycysteine heteroatoms were replaced by cysteines, and alternative side chain conformations were removed through the PDBSet program [28].
The modeled structure of AtDHQD/SDH was subjected to molecular dynamics simulations with the NAMD2 program [29] to minimize the structure's energy and maximize protein interaction with its ligands. The force field used for the protein and the cofactor was Charmm [30], and for the ligands, the force fields were generated by the SwissParam server [31] in the same manner. Minimization occurred in cycles. In the first cycle, the protein atoms, water, and salts were subjected to 20000 steps of minimization by the conjugate gradient (CG), while the ligand atoms and cofactors were held fixed in space. In the second cycle, all atoms in the system were subjected to another 10000 steps of minimization by CG. The spatial coordinates of AtDHQD/SDH originating from this second cycle were used in the docking simulations.
Molecular docking protocols were set up for each protein domain using AutoDock version 4.2.3 [32] and Molegro version 6.0 software [33]. The protocols were confirmed by reproducing the crystallographic ligand pose in all replications with a root mean square distance (rmsd) less than 0.5 Å.

2.2. Docking simulations and virtual scanning

In the context of the SDH domain, the Pyrx graphical interface [34] was used to facilitate the application of the AutoDock program. The standard search and ranking algorithm were employed, with the search restrictions set at 40 units along the x-, y-, and z-axes, respectively. These search dimensions were applied to a grid with a spacing of 0.375 Å and were centered on the DHK ligand. The Molegro program was also utilized, using the PLANTS score function for the ranking process. The search procedure employed the Iterated Simplex (Ant Colony Optimization) function. It used x, y, and z of 37.34, 42.42, and 84.16 Å, respectively, and a search radius of 8 Å centered on the ligand. The docking simulations used the exogenous ligand (ZINC103687345), provided in *.sdf format.
Simulations of virtual screening were conducted using the Sigma library (Sigma-Aldrich, MO, USA). DHK was included in the library as the best-classified molecule compared to the substrate. Selected molecules were downloaded in *.sdf format. After the first screening, the compounds underwent three additional screenings using AutoDock and four more using Molegro to eliminate false positives and ensure reproducibility.

2.3. Expression and purification of the DHQD/SDH protein

The research group of the Department of Cell and Systems Biology (University of Toronto, Canada) cloned the AtDHQ/SDH nucleotide sequence into the pET28 bacterial vector using the Nde I and Bam HI restriction sites [13]. Dr. Dinesh Christendat kindly provided this plasmid, which contains the AtDHQ/SDH wild-type gene. The protein was expressed from the ∆88DHQ-SDH plasmid construct in modified pET28, expressing residues 89-603 of the enzyme. The Nde I and Bam HI restriction sites were used, and the histidine tail was found at the C-terminal end.
The ∆88DHQ-SDH protein was expressed according to Singh and Christendat [13], with modifications and using an E. coli BL21 (DE3) strain grown in Luria-Bertani (LB) liquid medium supplemented with 50 μg mL–1 kanamycin. First, a preculture was incubated overnight at 37 °C under agitation. Then, 500 μL of this preculture was added to 50 mL of LB liquid medium with kanamycin. After reaching optical density (OD) at 600 nm between 0.6 and 0.8, the cultures were induced with 0.4 mM β-D-thiogalactopyranoside (IPTG) for 20 h at 18 °C under agitation. After induction, the cells were separated by centrifugation (5000 g, 15 min, 4 °C) and stored for purification.
The ∆88DHQ-SDH protein was purified using a nickel affinity chromatography column (GE Healthcare, Uppsala, Sweden). During purification and dialysis, 10 mM Tris-HCl buffer (pH 7.5) with 500 mM NaCl was used. Elution was performed with the same buffer having 40-, 150-, and 250-mM imidazole. After that, fractions were separated using polyacrylamide gel electrophoresis (SDS-PAGE) (Figure 2C). The sample with the highest enzyme concentration was dialyzed, and the protein concentration and identity were determined by the Bradford method [35] and mass spectrometry, respectively. For the latter, protein was digested according to Villén and Gygi [36], with some modifications. An aliquot (50 µL) obtained from purification was treated with 8 M urea and 5 mM dithiothreitol (DTT) (1:1) at 56 °C for 25 min. Then, it was cooled to room temperature, and 14 mM iodoacetamide was added, and it was kept protected from light for 30 min. Afterward, 5 mM DTT was added and kept at rest for another 15 min at room temperature, protected from light. To decrease the urea concentration to 0.8 M, 400 µL of 50 mM ammonium bicarbonate followed by 1 mM CaCl2 was added, and the sample was digested at 37 °C for 16–20 h by adding 20 µL of trypsin (1:50). The reaction was stopped by adding 10 µL of formic acid. The sample was centrifuged (3000 g, 15 min, 4 °C), and the supernatant was saved in an Eppendorf® tube and kept on ice until injection into the NanoUPLC‒MSE, which was performed according to Foletto-Felipe [37].

2.4. In vitro SDH activity

SDH activity was measured by monitoring NADPH production in the presence of shikimate at 340 nm (ε = 6.22 mM–1 cm–1). The reaction mixture consisted of 0.1 M Tris-HCl buffer (pH 8.8), 1 nM ∆88DHQ-SDH enzyme, 0.1 to 2 mM shikimate, and 0 or 250 µM NQD. The reaction was started by adding 2 mM NADP+, and the reduction of NADP+ was checked for 5 min at 23 °C. The maximal velocity (Vmax) values and Michaelis-Menten constants (KM) were obtained by fitting the Michaelis-Menten equation to the initial velocities (with or without NQD) using iterative nonlinear least-squares analysis (Prism®, Graph Pad Software Inc., USA).

2.5. Germination and seedling growth

Soybean (Glycine max L. Merr. cv. BRS 232) and maize (Zea mays L. cv. IPR-164) seeds were sanitized in a 2% sodium hypochlorite solution for 5 min and washed thoroughly with deionized water. Next, the seeds were deposited between moistened Germitest® papers, which were rolled up and placed in germination tubes. After germination in the dark at 25 °C for three days, seedlings were transferred to hydroponic systems with or without 500 μM NQD for 24 to 96 h (at 25 °C and a 12/12 h photoperiod). A nutrient solution (1/6 strength) [38] was added every 48 h. The length of the roots was measured in cm before and after the incubation period. The fresh weight of the roots was determined immediately after the incubation period. The dry weight was measured after drying the seedling tissues in an oven set at 70 °C for 72 h or until a consistent weight was achieved.

2.6. Nutrient solution consumption and NQD absorption by the seedlings

NQD depletion from the nutrient solution was monitored by high-performance liquid chromatography (HPLC). Samples (1.0 mL) were collected at 24, 48, 72, and 96 h after adding a nutrient solution containing 500 μM of NQD. Samples were filtered using a 0.45 μm disposable syringe filter and then analyzed (20 μL) with a Prominence HPLC system (Shimadzu®, Tokyo, Japan) equipped with a UV-VIS detector (SPD-M20A). NQD detection was performed at 310 nm using an isocratic run. The mobile phase was a 50:50 (v/v) mix of 4% acetic acid and 70% methanol applied with a flow rate of 0.8 mL min-1 on a C18 column (250 × 4.6 mm, 5 μm; Supelco Discovery®) maintained at 30 °C. Nutrient solution uptake was checked by measuring the volume of solution consumed every 24 h.
To determine the NQD absorption by the seedlings, 0.2 g of fresh roots was homogenized with 2.5 mL of 65% methanol and then centrifuged at 3200 g for 15 min at 4 °C. The supernatant was filtered through a 0.45 μm disposable syringe filter and analyzed (20 μL) on a Prominence HPLC (Shimadzu®, Tokyo, Japan) as described earlier. The yield of this extraction was estimated (Table S1).

2.7. Quantification of total proteins, amino acids, phenolic acids, and lignin

For protein quantification, 0.5 g of fresh roots was homogenized with liquid nitrogen, polyvinylpyrrolidone (PVP), and then with 100 mM phosphate buffer (pH 7.5) containing 1 mM ethylenediaminetetraacetic acid (EDTA) and 3 mM dithiothreitol (DTT) [39]. Subsequently, it was transferred to an Eppendorf® tube and centrifuged (13000 g, 30 min, 4 °C). The supernatant protein was determined by the method of Bradford [35], using bovine serum albumin as a standard.
With modifications, the determination of free amino acids was performed according to Astarita et al. [40] and Pieruzzi [41]. Fresh roots (0.2 g) were homogenized with 80% ethanol, and the ethanol was removed using a rotary evaporator. Two mL of ultrapure water (Milli-Q®) was added to the sample which was centrifuged at 10000 g for 10 min. Amino acids in the supernatant were derivatized with O-phthaldialdehyde (OPA) and analyzed by HPLC [42]. The amino acids were separated using a C18 column (4.6 × 250 mm, 5 µm; Shimadzu® Shim-pack GIST) equipped with a precolumn (C18, 4 × 3.0 mm; Phenomenex® SecurityGuard). The separation of amino acids was performed using two different mobile phases: (A) 50 mM phosphate buffer (pH 7.2) containing 2% methanol, 2% tetrahydrofuran, and 0.7% acetic acid, and (B) 65% methanol. A gradual increase in solvent B relative to solvent A was performed as follows: from 0 to 5 min with B(20%):A(80%); from 5 to 39 min with B(28%):A(72%), at 39 min with B(58%):A(42%), at 40 min with B(75%):A(25%); from 40 to 56 min with B(95%):A(5%); from 56 to 59 min with B(96%):A(4%); and from 59 to 61 min with B(100%):A(0%). The flow rate was 0.8 mL min-1 and the oven temperature was 30 ºC The fluorescence detector (RF-20A) was set for excitation at 265 nm and emission at 480 nm. Retention times and amino acid concentrations were determined by comparing them with a Sigma AAS-18 standard (containing aspartate, glutamate, serine, arginine, glycine, threonine, alanine, tyrosine, methionine, valine, phenylalanine, isoleucine, leucine, and lysine) plus asparagine and glutamine. Different standard solutions (0.5 to 31.25 µM) were prepared and used to construct a calibration curve.
The quantification of phenolic acids was determined by HPLC [24]. Dry roots (0.25 g) were boiled for 30 min in 5 mL of 2 M HCl. After cooling, the samples were filtered through filter paper. Samples were diluted, filtered through a 0.45 μm membrane, and analyzed (20 μL) on a Prominence HPLC (Shimadzu®, Tokyo, Japan) with a UV-VIS detector (SPD-M20A). The mobile phase was methanol:4% acetic acid (30:70, v:v), which was run isocratically at a consistent flow rate of 0.8 mL min-1 at 30 ºC. Separation was performed using a C18 column (250 × 4.6 mm, 5 µm; Supelco Discovery®). Phenolic acids were identified and quantified at 254 nm by comparing their retention times with standard values.
The lignin content was determined by the acetyl bromide method [43]. Protein-free cell walls (10 mg) of roots were incubated with a 25% acetyl bromide solution in 250 µL acetic acid at 70 °C for 30 min. Afterward, the reaction was placed in an ice bath, and 400 µL of 2 M NaOH, 50 µL of 7.5 M hydroxylamine, and 2 mL of glacial acetic acid were added. Following centrifugation at 10000 g for 5 min, the supernatant was spectrophotometrically measured at 280 nm.

2.8. Glyphosate effects on shikimate levels

The soybean and maize seeds were sanitized in a 2% sodium hypochlorite solution for 5 min and then thoroughly washed with deionized water. The seeds were deposited between sheets of Germitest® paper, previously moistened, rolled up, and placed in germination tubes. Germination took place in a dark chamber at 25 °C for 3 days. After this period, the seedlings were transferred to hydroponic systems with nutrient solutions (pH 6.0) [38] in the presence or absence of glyphosate and NQD, as follows. For soybean: control (no glyphosate or NQD), 100 µM glyphosate, and 100 µM glyphosate plus 500 µM NQD. For maize: control (no glyphosate or NQD), 25 µM glyphosate, and 25 µM glyphosate plus 500 µM NQD. Containers with soybean seedlings were incubated for 48 h, whereas maize seedlings underwent 96 h incubation, both under conditions of 25 °C and a 12/12 h photoperiod. After incubation, the fresh roots (0.5 g) were homogenized with 0.25 M HCl and centrifuged (1200 g, 10 min). The supernatant was used for shikimate determination. The samples were diluted, filtered through 0.45 μm membranes, and analyzed (20 μL) on a Prominence HPLC (Shimadzu®, Tokyo, Japan) equipped with a UV-VIS detector (SPD-M20A). The separation of shikimate was performed using a C18 column (250 × 4.6 mm, 5 µm; Shimpack CLC-ODS(M) Shimadzu®), and a mobile phase (3.5 mM phosphoric acid) was applied isocratically with a flow rate of 0.8 mL min-1 at 30 °C. Shikimate identification involved comparing its retention time with injected standards using identical conditions. Additionally, the samples were spiked with standard stock solutions for confirmation of shikimate identification. A calibration curve was established by chromatographically separating standard shikimate solutions to determine shikimate concentrations, yielding linear correlations between concentrations and elution curve areas. The calculated regression parameters were used to determine the shikimate concentrations present in the given samples [44].

2.9. Statistical analysis

The experimental design was completely randomized, and the data were expressed as the mean of at least three independent experiments ± standard error of means. All statistical analyses were performed using GraphPad Prism® software (GraphPad Software Inc., USA). Regression analyses (Figure 3, Figure 5A, B, and C) were performed on non-transformed data. Student’s t test (Figure 4, Figure 5D, Figure 6, and Figure 7), Tukey's (Figure 8), and Dunnett’s (Figure S1) multiple comparisons were used to analyze differences between parameters. Values with a cutoff threshold of p ≤ 0.05 were considered statistically significant.

3. Results

3.1. In silico and in vitro analyses reveal NQD as a potential inhibitor of SDH

Table 1 shows the average scores and rmsd obtained by redocking the DHQ and DHK ligands. Validated programs were used to simulate virtual screening and find ligands, with the DHQ and DHK reference ligands used as a cutoff point for mean scores.
We started the virtual screening with the Sigma library having 214000 molecules; from the first screening for the SDH domain, 1042 compounds were selected. After repeating the protocols, eight compounds were selected, of which the compound Zinc330539, called 6-nitroquinazoline-2,4-diol (NQD), showed the best score (Table 2). NQD was purchased from BLD Pharmatech Ltd. (Shanghai, China) and used in further in vitro and in vivo analyses.
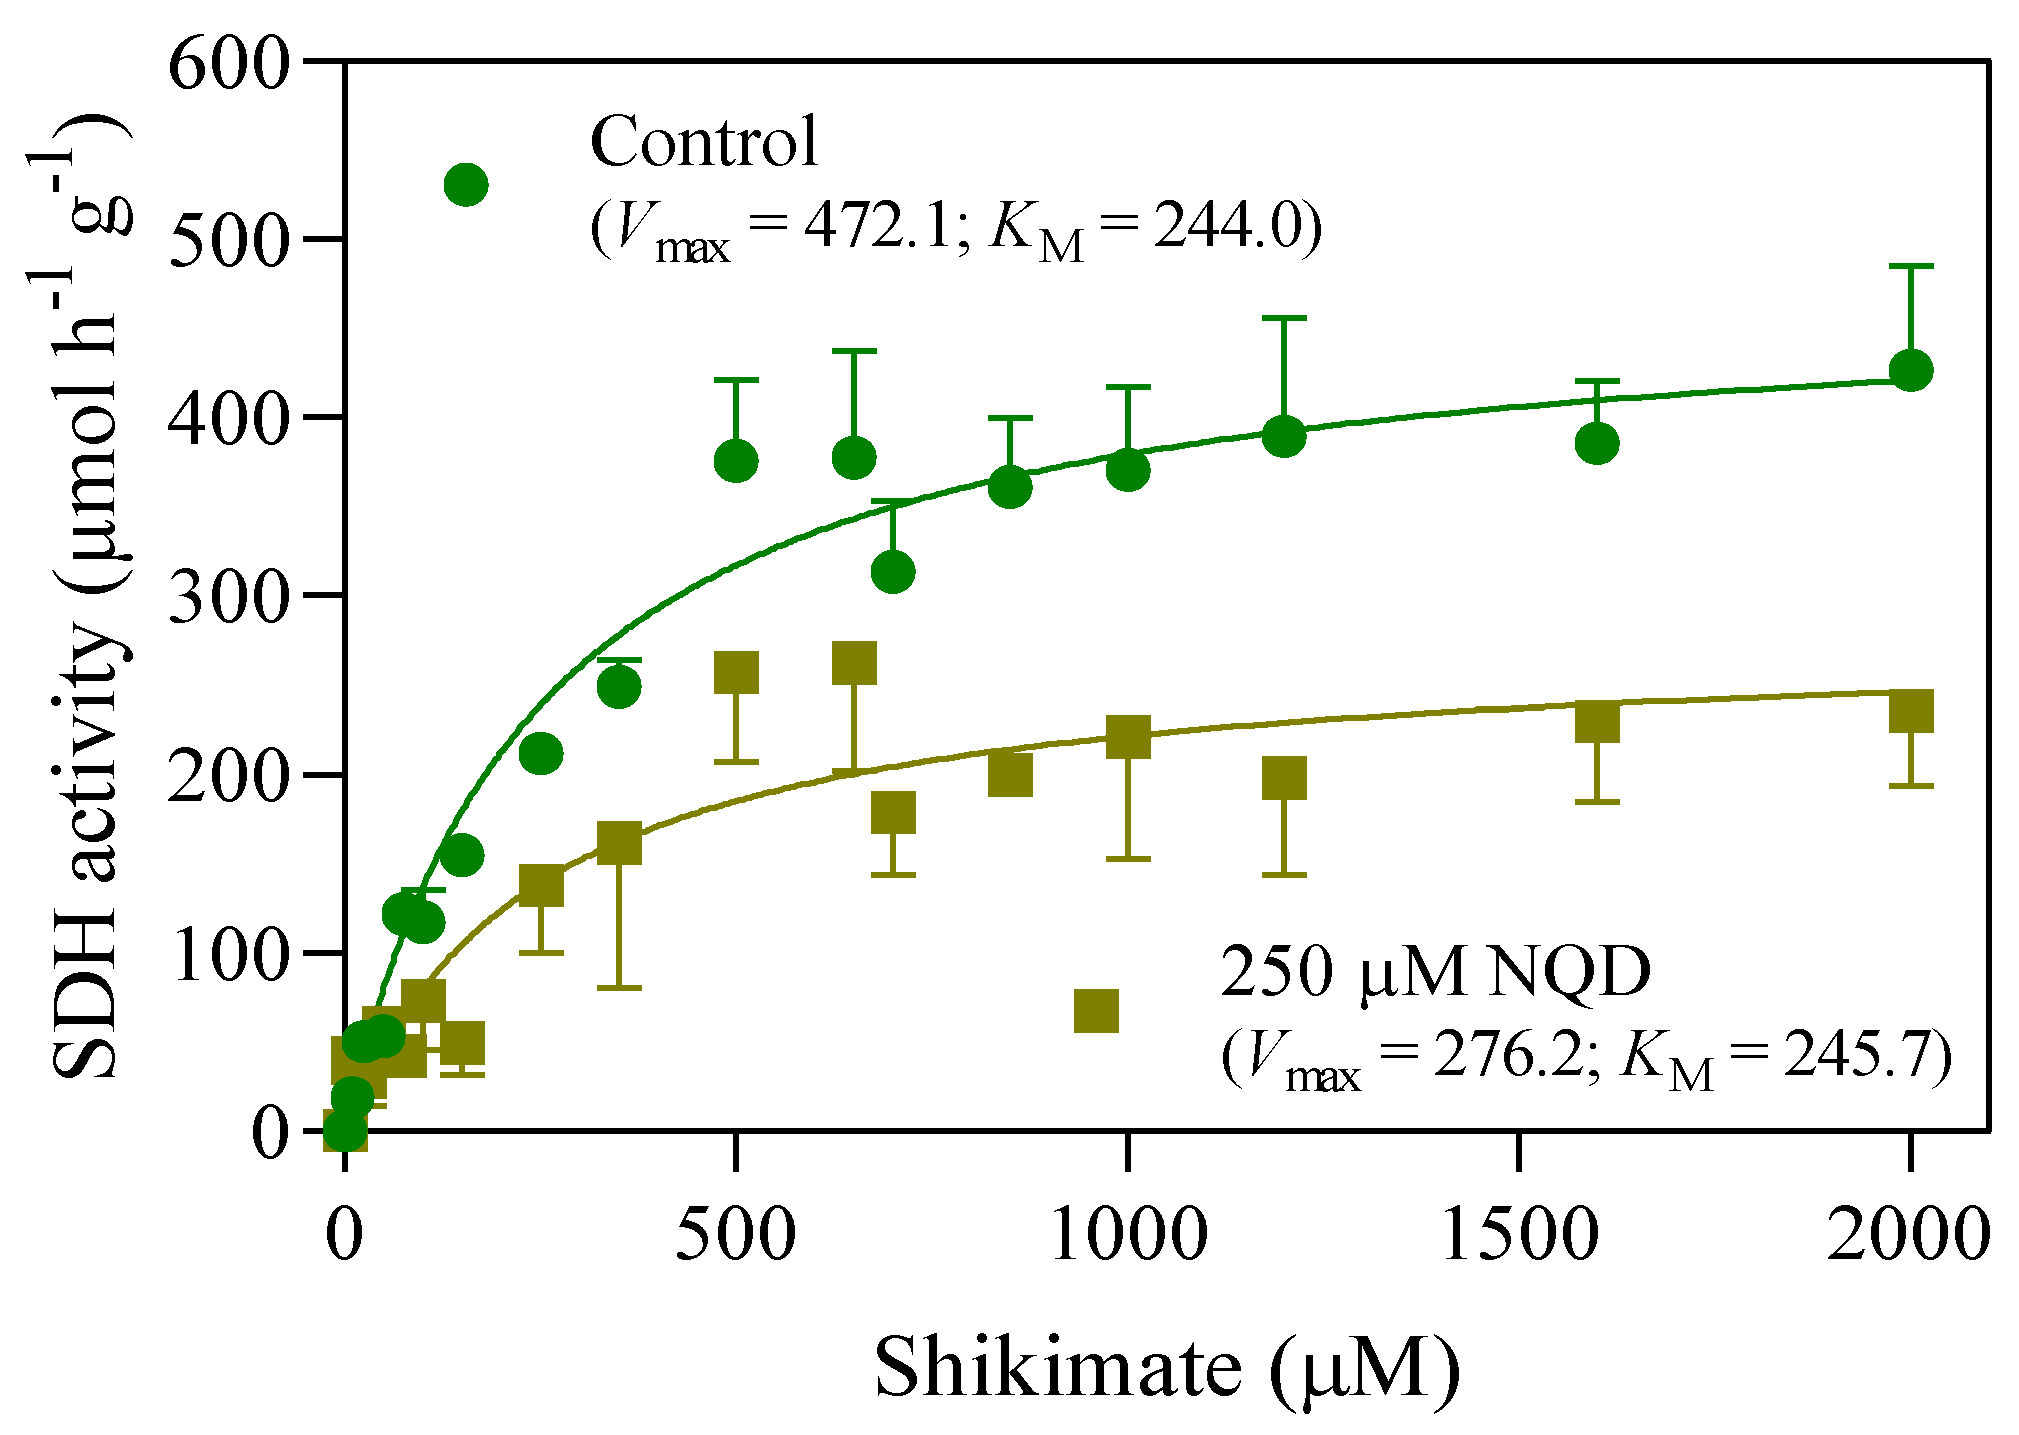
The inhibitory effect of NQD on AtDHQD/SDH activity was determined in the presence of 250 µM of NQD, a concentration range of 10 to 2000 µM of shikimate, and 2 mM NADP+ (Figure 3; Table S2). Through the application of nonlinear least squares analysis, it was revealed that NQD causes a 41% decrease in the Vmax of AtDHQD/SDH. This inhibitory effect occurred without any change in the apparent KM value. This outcome underscores a noncompetitive inhibition mechanism attributed to NQD (Table 3).

3.2. In vivo, NQD has an impact on the root growth of soybean and maize

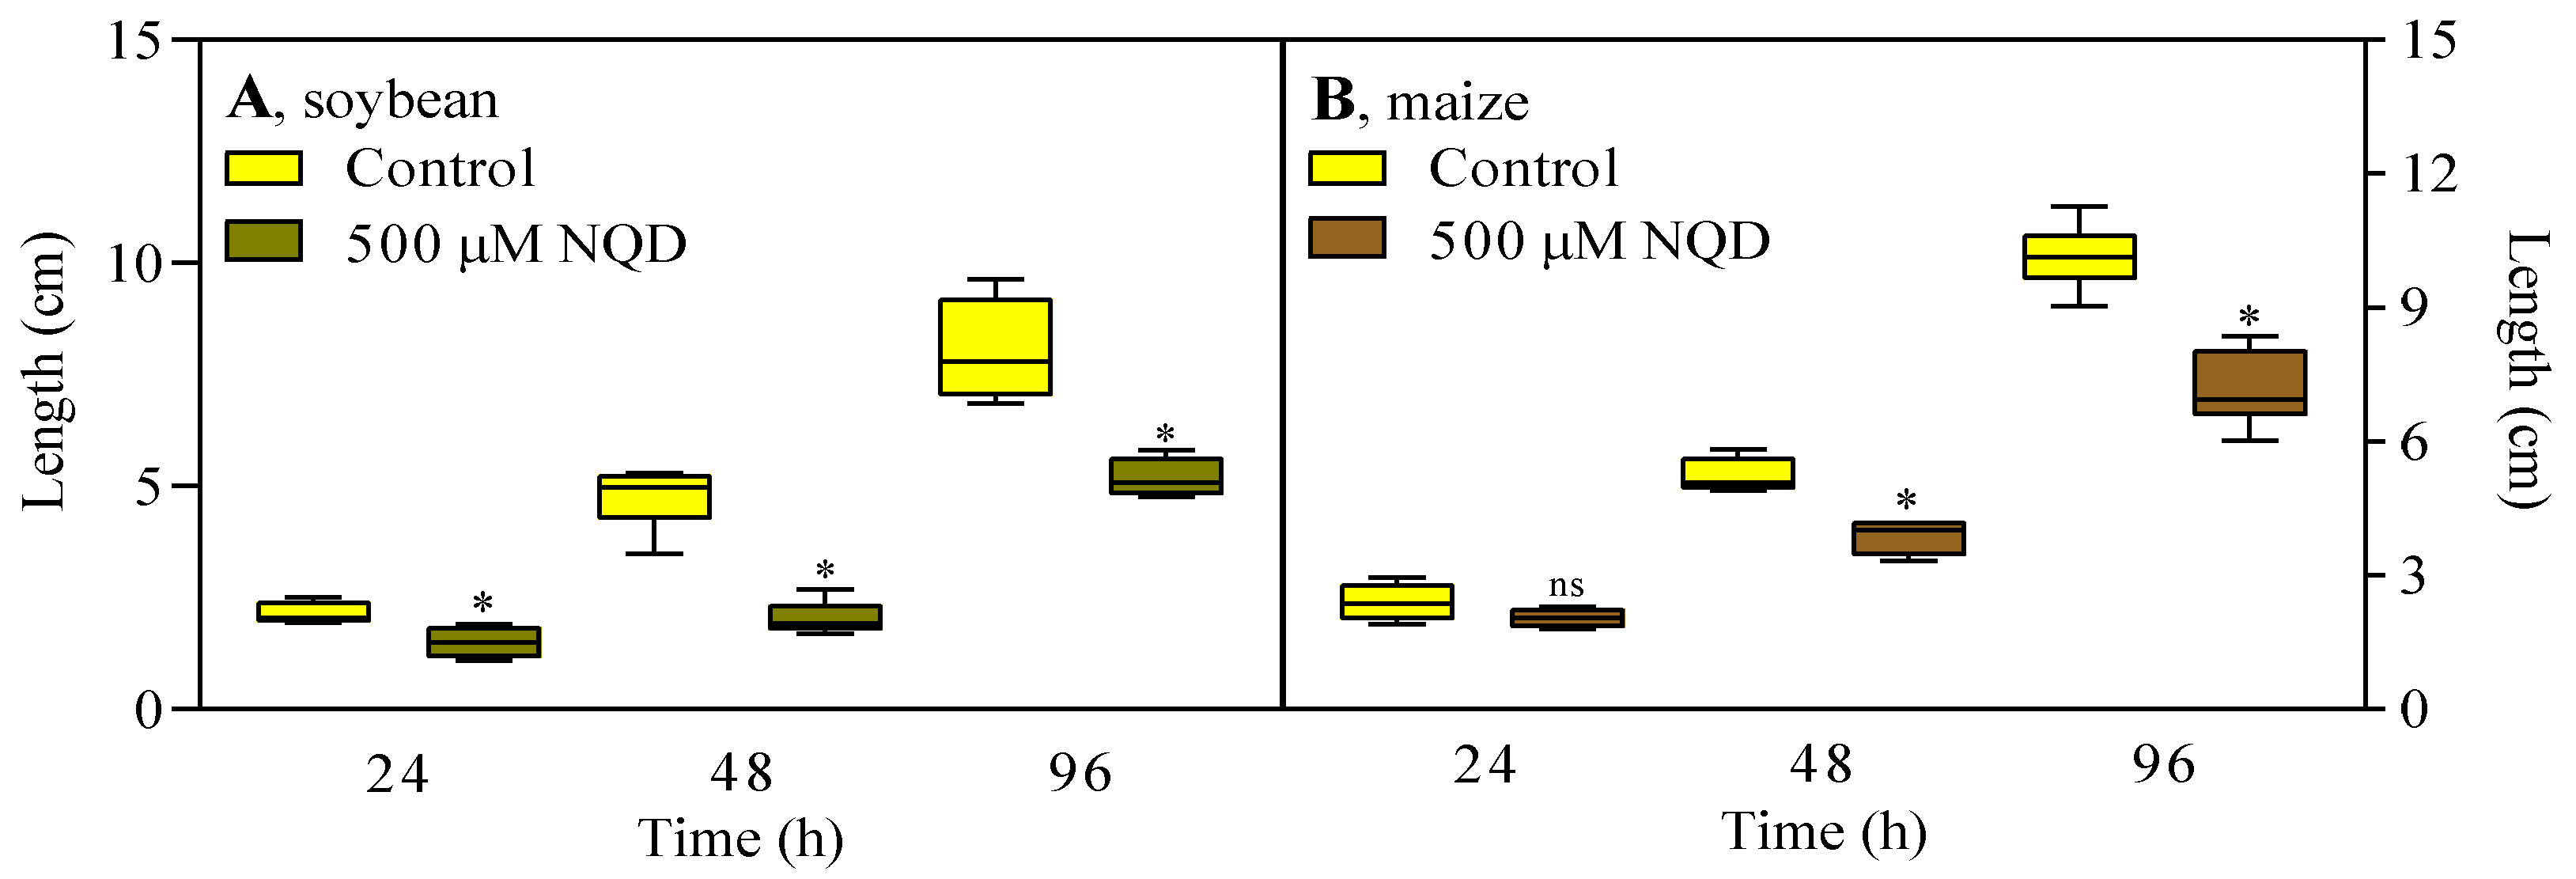
Following an incubation period of 24 to 96 h, the application of 500 μM NQD resulted, on average, in a 41% reduction in soybean root lengths compared to the control group (Figure 4A). For maize, the same treatment led to a decrease of 25% and 29% in root length at 48 and 96 h, respectively, when compared to controls (Figure 4B).
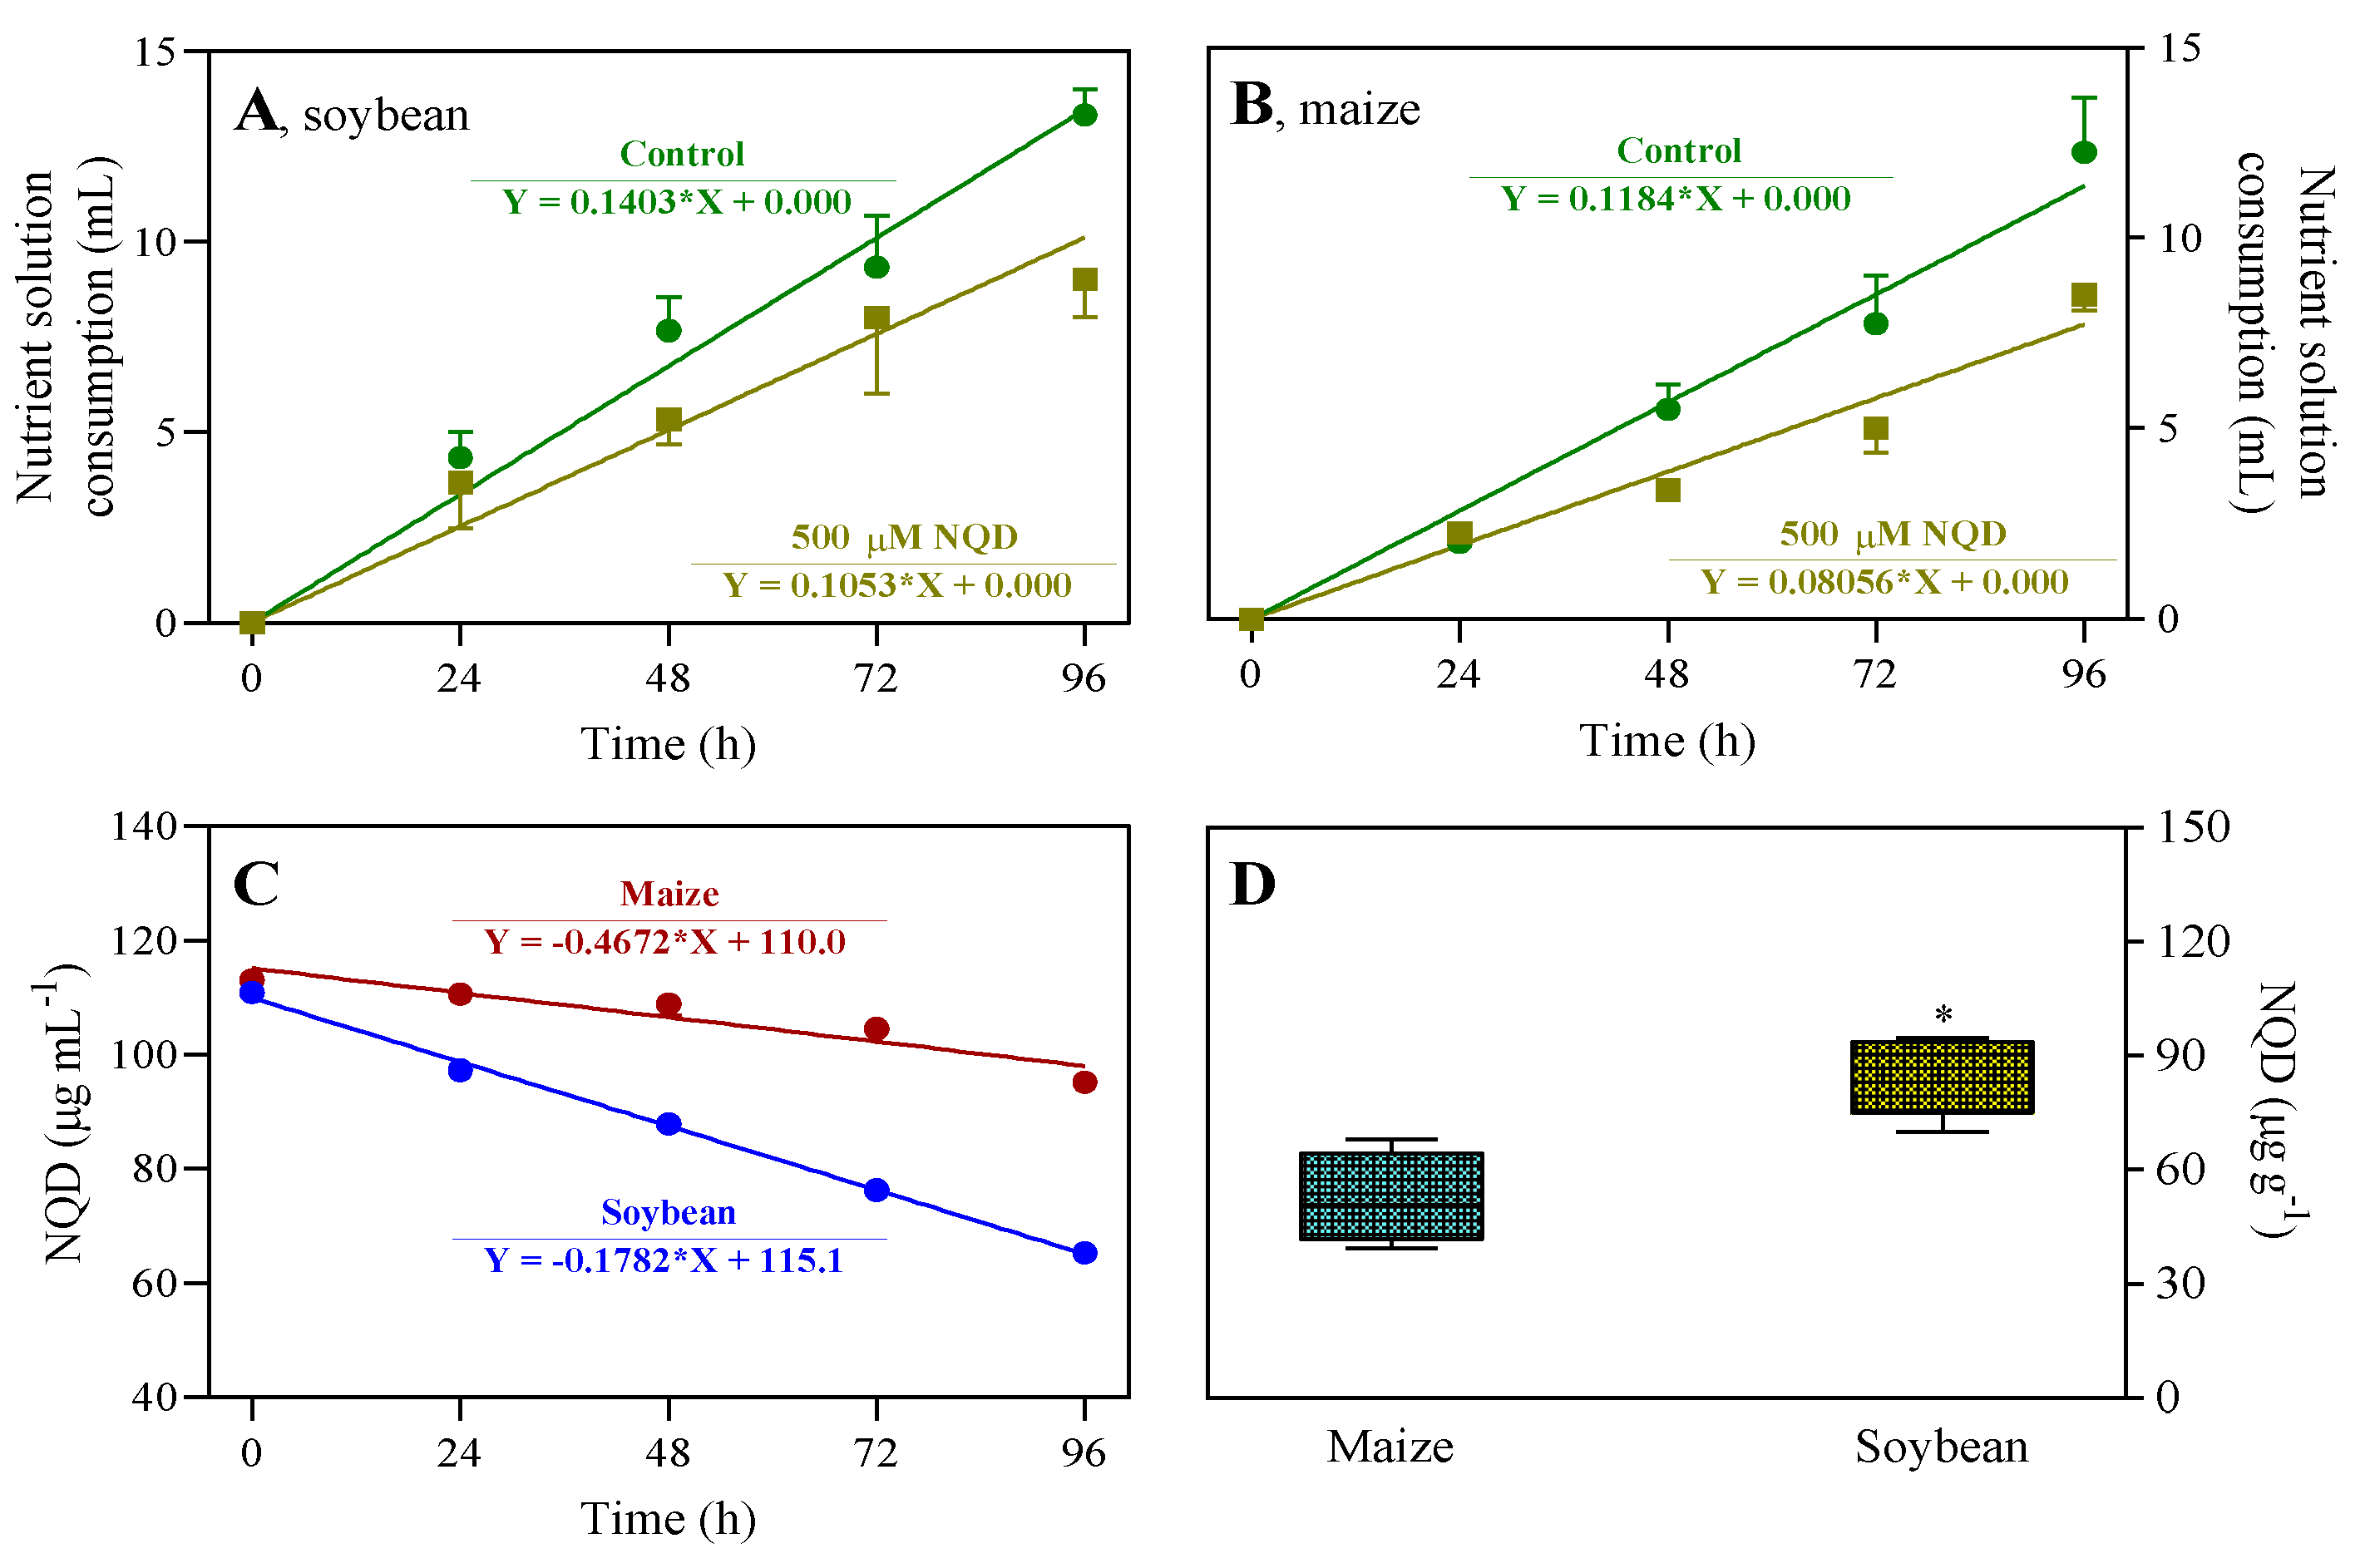
After 96 h of incubation, 500 μM NQD reduced nutrient solution uptake by 32% in soybean (Figure 5A) and 31% in maize (Figure 5B) compared to the controls. The depletion of NQD in the nutrient solution varied depending on the plant species. NQD depletion reached 41% in nutrient systems with soybean seedlings, while nutrient systems with maize seedlings only exhibited a 14% depletion over 96 h. Both depletion processes followed linear and time-dependent kinetics (Figure 5C). Experiments were conducted without the plant in the hydroponic system to evaluate the spontaneous degradation of NQD in the nutrient solution. The results indicated no degradation of NQD during the testing period (Figure S1). Soybean and maize seedlings showed different contents of NQD in their roots after 96 h of incubation. While 83.6 µg NQD g-1 was extracted from soybean roots, 52.2 µg NQD g-1 was extracted from maize roots (Figure 5D). The extraction yield was 87% for soybean roots and 77% for maize roots (Table S1).
At 500 μM, NQD increased the total protein content by 39% and 36% in soybean and maize roots, respectively (Table 4).
Significant changes were observed for free amino acids, which were represented as a percentage of the control (Figure 6). Of the 17 amino acids quantified in the soybean roots, four increased significantly, varying from 34 to 96% in comparison to the respective controls (Figure 6A). Based on the distribution of amino acids by R-group classification, significant increases occurred in nonpolar (valine, 96%; alanine, 34%), basic (lysine, 45%), and polar (asparagine, 48%) amino acids. Eight of the 17 amino acids quantified in maize roots increased significantly compared to the respective controls (Figure 6B). The increases varied from 48 to 300%. Based on the R-group classification, significant increases were observed in nonpolar (valine, 82%; alanine, 300%), aromatic (tyrosine, 48%; phenylalanine, 102%), basic (histidine, 145%; arginine, 150%), and polar (threonine, 55%; asparagine, 53%) amino acids. For both soybean and maize, the levels of other amino acids remained unchanged compared to their respective controls.
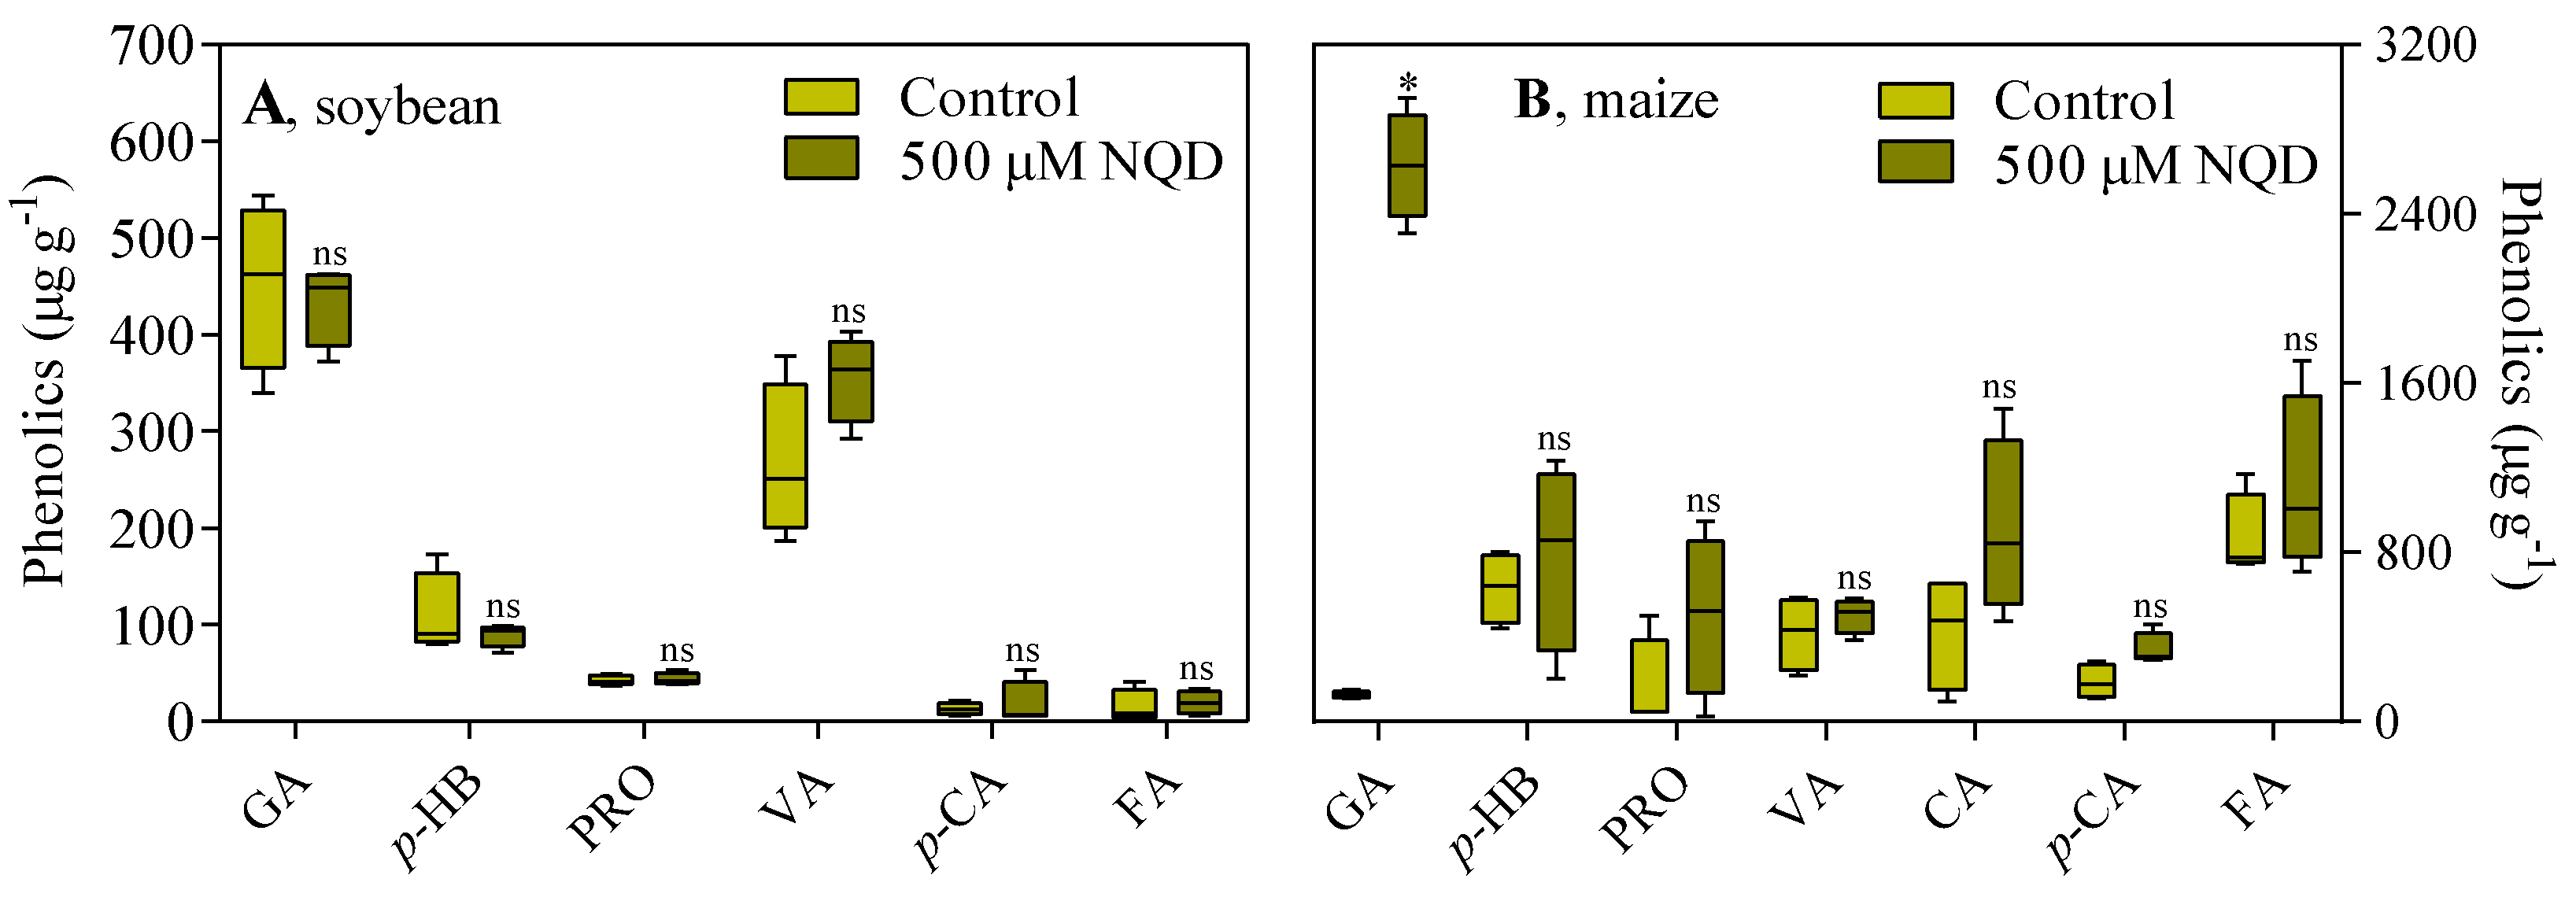
In soybean, the contents of gallic acid (GA), p-hydroxybenzaldehyde (p-HB), protocatechuic (PRO), vanillic (VA), p-coumaric (p-CA), and ferulic (FA) acids were not changed compared to the control (Figure 7A). However, in maize roots, a surprising increase (4000%) in gallic acid (GA) was observed, while no changes in other phenolic acids were detected (Figure 7B).
Lignin levels were not altered when seedlings were subjected to 500 µM NQD for 48 h (soybean) and 96 h (maize) (Table 5).

3.3. Glyphosate assays confirm that NQD inhibits SDH

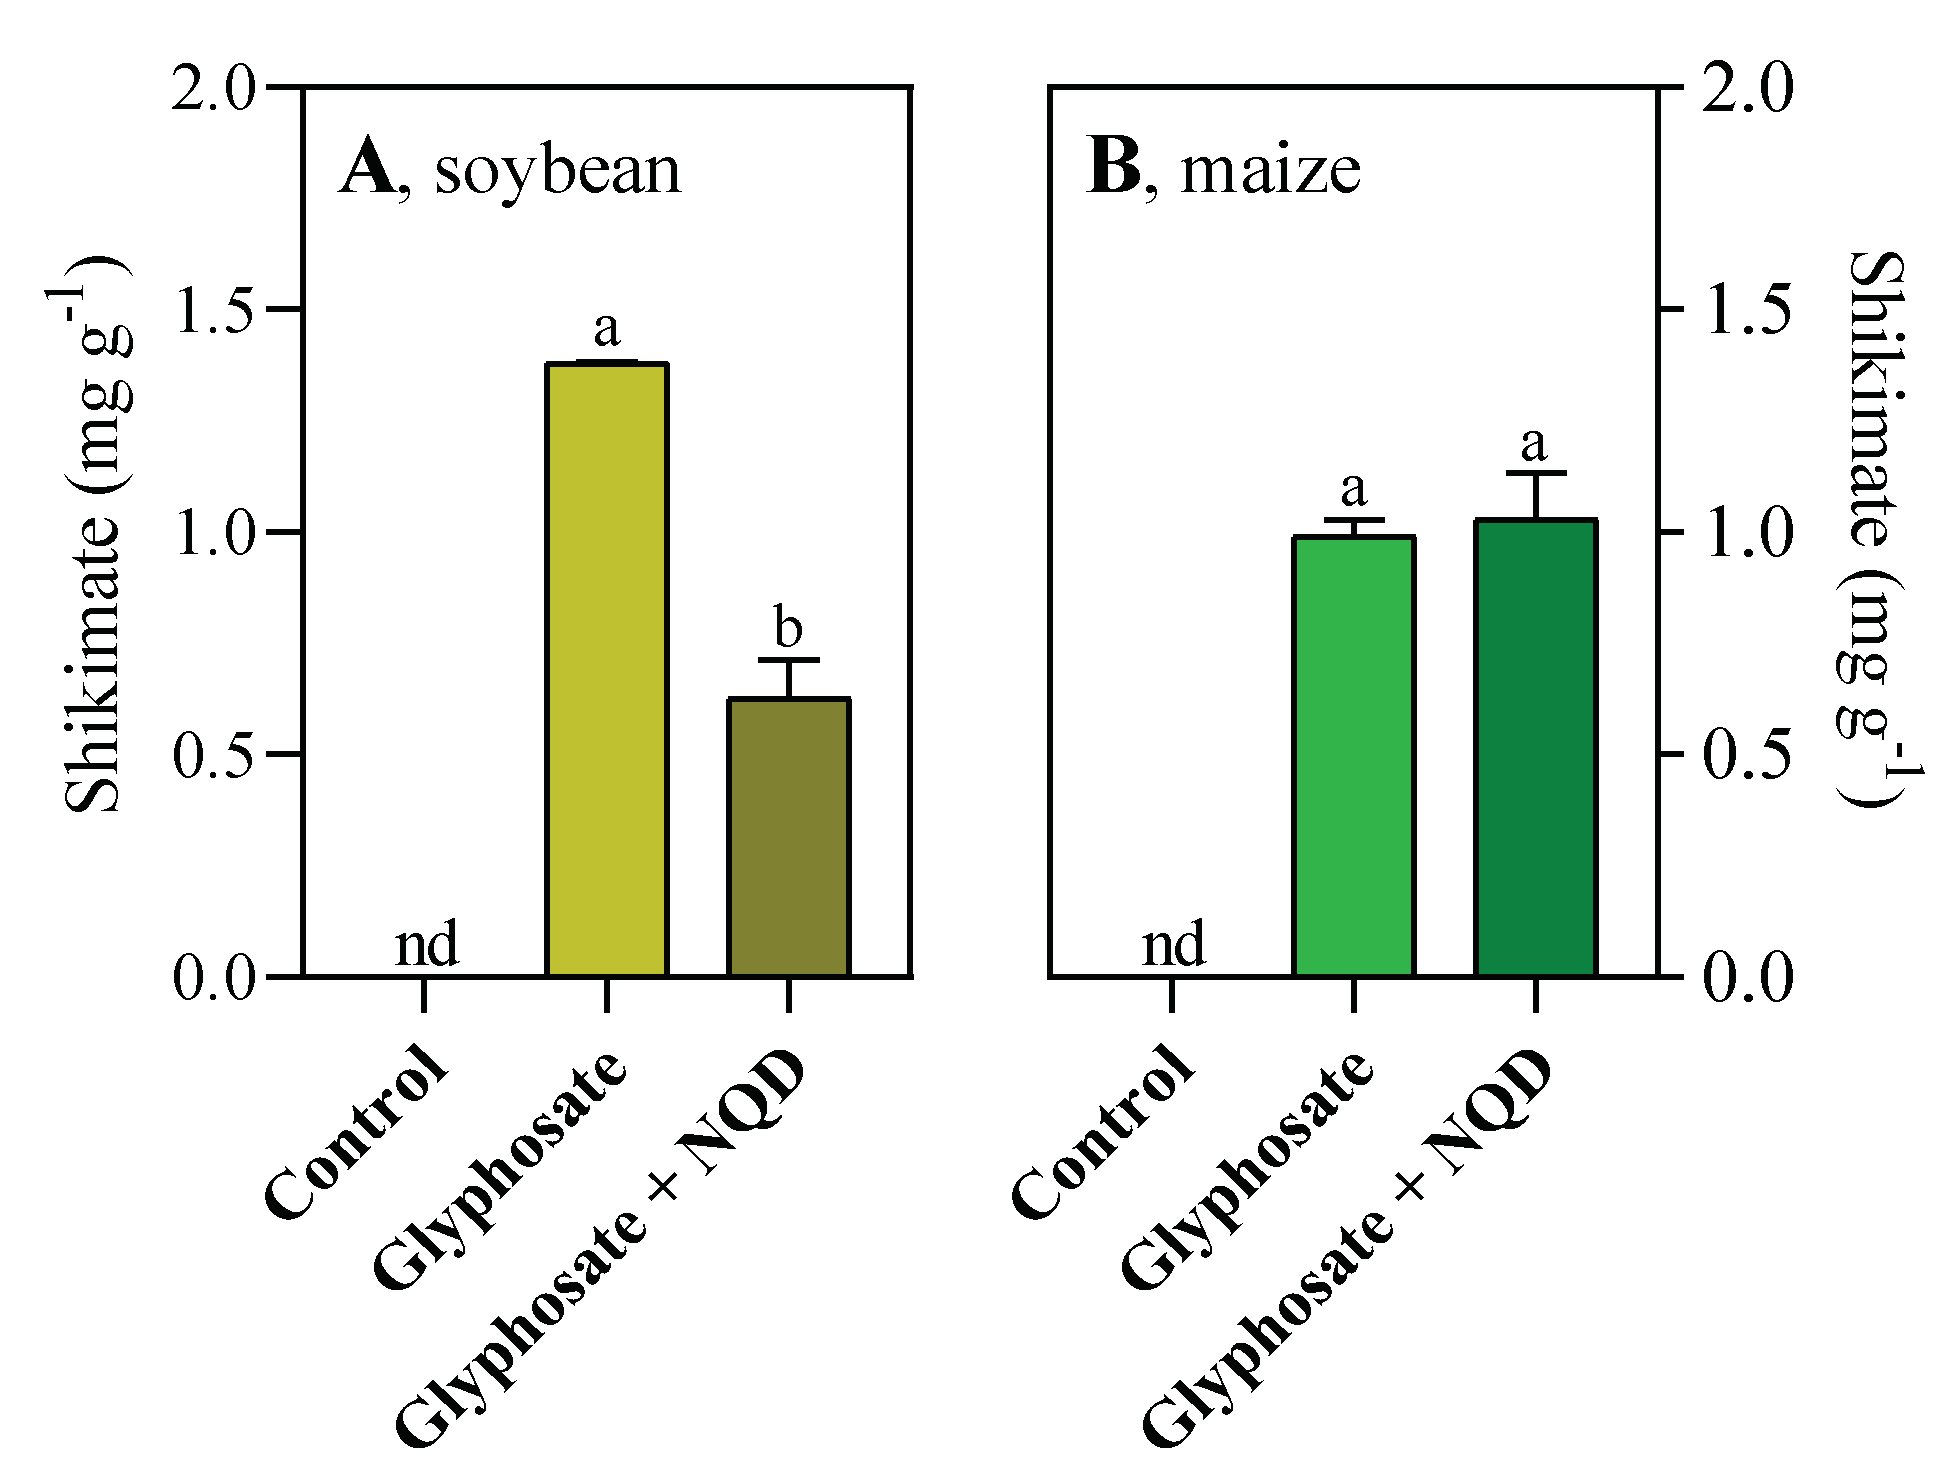
When soybean was treated only with 100 µM glyphosate, fresh roots had 1.3 mg of shikimate g-1. After treatment with glyphosate plus NQD, fresh roots had 0.6 mg of shikimate g-1, resulting in a 54% decrease (Figure 8A). In maize, treatment with 25 µM glyphosate resulted in the accumulation of 0.7 mg of shikimate g-1 of fresh weight, while no reduction in the accumulation of shikimate was observed after treatment with glyphosate plus NQD (Figure 8B).
In soybean seedlings treated with 100 µM glyphosate or 100 µM glyphosate plus 500 µM NQD, root lengths decreased by 45% and 57%, respectively, compared to the control (Table S3).

4. Discussion

Employing a step-by-step process that includes in silico, in vitro, and in vivo assays, our study reveals that SDH inhibition is a promising mechanism of action for herbicides. Molecular docking, virtual screening, and enzyme kinetics analyses were used to show that NQD is a noncompetitive SDH inhibitor. Our experiments have shown that soybean seedlings absorb NQD more than maize seedlings. As a result, soybean seedlings were affected more severely by NQD exposure, as evidenced by measurable changes in their growth parameters. Under in vivo conditions, NQD's inhibitory potential on SDH was highlighted by its ability to reduce shikimate accumulation caused by glyphosate in soybean seedlings. Although NQD did not alleviate the accumulation of shikimate in maize seedlings, it is essential to consider the potential inhibitory effect on SDH under in vivo conditions. This is supported by the observed accumulation of gallic acid, a benzoic acid synthesized from the SDH substrate, in these seedlings. Our findings align seamlessly with corroborating evidence from the pertinent literature, substantiating our conclusions.
The bifunctional DHQD/SDH enzyme occupies a pivotal position in the shikimate pathway, actively participating in the intricate biosynthesis of aromatic amino acids in plants and crucial to synthesizing proteins and many secondary metabolites. In Arabidopsis, the tridimensional structure of AtDHQD/SDH has two distinct functional domains. In the SDH domain, the C-terminal region has a dinucleotide-binding function, while the N-terminal region is responsible for substrate binding. Interestingly, the active sites of DHQD and SDH are face-to-face, thus ensuring the proper targeting of intermediaries to the shikimate pathway and minimizing loss to competing pathways [13,26]. DHQD/SDH is indispensable in facilitating optimal plant growth and developmental processes, as underscored by the observed growth inhibition and attenuation of aromatic amino acid content in tobacco plants, where their activities have been suppressed [45]. This empirical evidence substantiates the significance of DHQD/SDH enzymes in shaping essential physiological cascades and makes them a cornerstone in the intricate framework of plant biology. Based on its biological importance, we used molecular docking and virtual screening analyses to prospect inhibitors for the SDH domain of AtDHQD/SDH with possible herbicidal action. The AtDHQD/SDH structure was modeled with high stereochemical quality, enabling us to find the NQD (Figure 2A) with a better docking score and positioning in the active site of the SDH domain than its physiological substrate, DHK (Table 2). This finding indicated that NQD could be a potential inhibitor of SDH.
After selecting NQD, we assessed their inhibitory impact on SDH activity under in vitro conditions. We used ∆88DHQD-SDH from A. thaliana [26], which was expressed and purified. The decrease in Vmax and no change in KM indicated through kinetic adjustments that NQD is a noncompetitive inhibitor of SDH [46]; NQD binds with similar affinities to the free enzyme and the enzyme-substrate complex. While noncompetitive inhibition is typically not identified in virtual screening for active sites during prospecting, it is crucial to emphasize that, under certain circumstances, competitive inhibitors can exhibit noncompetitive kinetic behavior. In other words, identifying a noncompetitive mechanism for an inhibitor does not necessarily rule out the possibility of it binding to the active site [47]. Anyway, noncompetitive or uncompetitive inhibitors may be more effective in vivo than competitive inhibitors due to a significant reduction in metabolic flow [48]. In vitro, 250 µM NQD reduced SDH activity by approximately 40% under saturation and half saturation. Considering the possible noncompetitive inhibition mechanism and relatively low concentration of NQD required to inhibit SDH activity, i.e., in the micromolar range, it is plausible that NQD is an efficient inhibitor under in vivo conditions. The Brenda Enzyme Database lists 169 inhibitors of SDH, mostly from microorganisms. So far, SDH inhibitors have only been found in seven types of plants: Capsicum annuum, Phaseolus mungo, Camellia sinensis, Cucumis sativus, Euterpe oleracea, Solanum lycopersicum, and A. thaliana. We present NQD as an additional inhibitor of a plant-origin SDH and from the A. thaliana plant, based on in vitro kinetic studies.
Based on an herbicidal perspective, we conducted in vivo tests on soybean and maize to demonstrate the inhibition. This represents another potential application for quinazoline-2,4-dione derivatives, like NQD, which possess antifungal [49] and antitumor [50] properties. Clearly, NQD decreased the root lengths of soybean and maize. Furthermore, our results showed that exposure to NQD reduced the uptake of nutrient solution. This could have resulted in osmotic stress or nutrient deficiency, hindering plant growth to some extent. Specifically, we observed a higher root absorption of NQD in soybean than in maize seedlings, which could be attributed to the more significant impact on soybean root growth. Previous studies have reported a decrease in growth and biomass following DHQD/SDH suppression in Nicotiana tabacum and a decrease in aromatic amino acid content [51]. Unexpectedly, NQD increased the levels of aromatic amino acids (tyrosine and phenylalanine) in maize roots but not in soybean roots. Additionally, NQD increased the levels of other amino acids in the roots of both plant species. This includes nonpolar and aliphatic amino acids such as alanine and valine, positively charged amino acids such as lysine, histidine, and arginine, negatively charged amino acids such as aspartate, and uncharged polar amino acids such as asparagine and threonine. The accumulation of valine, a branched side-chain amino acid such as leucine and isoleucine, may be a response to low water and nutrient availability [52,53,54], probably induced by NQD. When 3-dehydroquinate synthase in a culture of Anabaena variabilis was inhibited, nonaromatic amino acids such as leucine, isoleucine, valine, and arginine increased. However, there was a decrease in aromatic amino acids [55]. An increase in certain amino acids and total protein levels could be linked to a stress response [2,4,56,57].
Phenolic acids are secondary metabolites that play essential roles in plants, some of which are produced from intermediates of the shikimate pathway [6]. The NQD treatment did not affect the phenolic acid content of soybean seedlings, but it significantly increased the gallic acid content of maize seedlings. This result provides compelling evidence that NQD inhibits maize SDH in vivo. This conclusion is supported by the fact that gallic acid is produced from DHK, the substrate of SDH [6]. Supporting this, previous studies have shown that some plants have more than one DHQD/SDH enzyme involved in synthesizing gallic and quinic acids. This was reported in Nicotiana tabacum [51], Betula pubescens [58], Populus trichocarpa [59], Vitis vinifera [60], Camellia sinensis [61], and more recently, in aluminum-tolerant Eucalyptus camaldulensis [62]. These findings suggest that maize seedlings might suffer from an overflow mechanism in the pathway, leading to gallic acid accumulation. This may redirect DHK toward gallic acid biosynthesis, such as in regulating sucrose and starch levels [63]. Additionally, gallic acid could be used in detoxification, as demonstrated in E. camaldulensis, where a specific SDH enzyme produces gallic acid to counteract aluminum toxicity [62].
Glyphosate is a nonselective, post-emergent herbicide. It acts on EPSP synthase, which catalyzes the condensation of shikimate 3-phosphate and phosphoenolpyruvate to produce EPSP (Figure 1). By inhibiting EPSP synthase, glyphosate causes an accumulation of shikimate, which is the product of the SDH reaction [64,65]. Because SDH catalyzes the reversible reduction of DHK to shikimate (Figure 1), we aimed to confirm the inhibition of NQD on the enzyme under in vivo conditions. For this, we assessed the effect of glyphosate on both plant species. Glyphosate treatment resulted in decreased root length and fresh weight of soybean seedlings, while increasing shikimate content as expected [24]. However, when glyphosate was combined with NQD, it reduced root length and mitigated the accumulation of shikimate. As reported in a previous study, the accumulation of shikimate and the activity of SDH are impacted by glyphosate [24]. Therefore, the decrease in shikimate levels observed after applying glyphosate and NDQ together, compared to only the glyphosate treatment, indicates in vivo inhibition of SDH in soybean seedlings. Notably, there was no absolute inhibition, which allowed for some metabolic flux through the shikimate pathway (Figure 1). In turn, the combined application of glyphosate and NQD did not reduce shikimate accumulation in maize seedlings compared to glyphosate alone. However, the inhibition of SDH by NQD in maize roots may be justified by accumulation of gallic acid synthetized from the SDH substrate, DHK.
In addition to its importance as a metabolite of the shikimate pathway, shikimate plays a crucial role in the production of lignin through the phenylpropanoid pathway. Hydroxycinnamoyl-CoA:shikimate/quinate hydroxycinnamoyltransferase catalyzes the transesterification of shikimate with p-coumaroyl-CoA, forming p-coumaroyl-shikimate. This compound is then used in later reactions to produce additional phenylpropanoids, monolignols and lignin [6]. Because lignin is essential for plant growth and development, providing rigidity, transporting water, and protecting against microbial attacks and environmental stresses [66], we measured its amount in soybean and maize seedlings submitted to NQD. Although it was expected that the inhibition of SDH by NQD would reduce lignin levels, no alterations were observed in either plant species (Table 5). The aromatic amino acid profile in the roots of soybean and maize seedlings, however, indicates that NQD did not completely inhibit SDH in vivo. This implies that there might still be a metabolic flow, sufficient to produce lignin under the specific conditions examined (NQD concentration and plant exposure time). Therefore, additional research is needed to determine the impact of NQD on lignification.

5. Conclusions

We used bioinformatics tools to find an inhibitor for a SDH of plant-origin, i.e, from A. thaliana; the NQD. In vitro, NQD inhibited SDH from A. thaliana in a noncompetitive manner. In both soybean and maize seedlings, NQD reduced the growth of roots; however, soybean absorbed it more efficiently. When glyphosate and NQD were applied together to soybean seedlings, a lower shikimate accumulation was observed compared to the treatment with glyphosate alone. This proves that NQD inhibits SDH in vivo. In maize seedlings, the massive accumulation of gallic acid supported the inhibition of SDH by NQD under in vivo conditions. Based on these findings, NQD appears to be a moderate inhibitor of plant SDH. The next challenge is to understand the differential modes of action in both plant species and related weeds.

Supplementary Materials

The following supporting information can be downloaded at the website of this paper posted on Preprints.org.

Author Contributions

Conceptualization, funding acquisition, writing – review and editing, O.F.F.; conceptualization, funding acquisition, supervision, writing – review and editing, R.M.; investigation, methodology, validation, visualization, A.M.A.; investigation, software, validation, J.A.; F.A.V.S.; P.S.A.B.; M.A.S.O. and L.F.T.; data curation, R.P.C. and W.D.S.

Funding

This research was funded by the Coordination of Higher Education Personnel Improvement – Brazil (CAPES, Finance Code 001), and Araucaria Foundation [grant numbers 013/2017 (PRONEX) and 002/ 2016].

Data Availability Statement

The data presented in this study are available on request from the corresponding author.

Acknowledgments

A.M.A. holds a scholarship from the CAPES (Finance Code 001). R.M., W.D.S. and O.F.F. are research fellows of the National Council for Scientific and Technological Development (CNPq). The authors thank Dr. Dinesh Christendat for supplying the AtDHQD/SDH plasmid and Aparecida M. D. Ramos and Antonio Nunis da Silva for technical assistance.

Conflict of Interest

The authors declare no conflict of interest.

References

  1. Tohge, T.; Watanabe, M.; Hoefgen, R.; Fernie, A.R. Shikimate and Phenylalanine Biosynthesis in the Green Lineage. Front. Plant Sci. 2013, 4, 1–13. [Google Scholar] [CrossRef]
  2. Tzin, V.; Galili, G. New Insights into the Shikimate and Aromatic Amino Acids Biosynthesis Pathways in Plants. Mol. Plant 2010, 3, 956–972. [Google Scholar] [CrossRef]
  3. Maeda, H.; Dudareva, N. The Shikimate Pathway and Aromatic Amino Acid Biosynthesis in Plants. Annu. Rev. Plant Biol. 2012, 63, 73–105. [Google Scholar] [CrossRef] [PubMed]
  4. Coruzzi, G.; Last, R.; Dudareva, N.; Amrhein, N. Amino Acids. In Biochemistry and Molecular Biology of Plants; Bob B. Buchanan, Wilhelm Gruissem, R.L.J., Ed.; Chichester, UK, 2015; pp. 289–336 ISBN 9780470714225.
  5. Francenia Santos-Sánchez, N.; Salas-Coronado, R.; Hernández-Carlos, B.; Villanueva-Cañongo, C. Shikimic Acid Pathway in Biosynthesis of Phenolic Compounds. In Plant Physiological Aspects of Phenolic Compounds; IntechOpen, 2019; Vol. 32, pp. 137–144.
  6. Marchiosi, R.; dos Santos, W.D.; Constantin, R.P.; de Lima, R.B.; Soares, A.R.; Finger-Teixeira, A.; Mota, T.R.; de Oliveira, D.M.; Foletto-Felipe, M. de P.; Abrahão, J.; et al. Biosynthesis and Metabolic Actions of Simple Phenolic Acids in Plants. Phytochem Rev. 2020. [CrossRef]
  7. Mousdale, D.M.; Coggins, J.R. Subcellular Localization of the Common Shikimate-Pathway Enzymes in Pisum Sativum L. Planta 1985, 163, 241–249. [Google Scholar] [CrossRef] [PubMed]
  8. Roberts, F.; Roberts, C.W.; Johnson, J.J.; Kyle, D.E.; Krell, T.; Coggins, J.R.; Coombs, G.H.; Milhous, W.K.; Tzipor, S.; Ferguson, D.J.P.; et al. Evidence for the Shikimate Pathway in Apicomplexan Parasites. Nature 1998, 393, 801–805. [Google Scholar] [CrossRef] [PubMed]
  9. Gientka, I.; Duszkiewicz-Reinhard, W. Shikimate Pathway in Yeast Cells: Enzymes, Functioning, Regulation – A Review. Polish J. food Nutr. Sci. 2009, 59, 113–118. [Google Scholar]
  10. Heap, I. International Herbicide-Resistant Weed Database Available online:. Available online: https://www.weedscience.org/Home.aspx (accessed on 1 January 2024).
  11. Ramella, J.R.P.; Barbosa, J. de A.; Ferreira, S.D.; Fey, E.; da Costa, N.V. Weed Interference on Nutrient Accumulation in the Leaves of Cassava under No-Tillage or Conventional Tillage. Pesqui. Agropecu. Bras. 2020, 55, 1–9. [Google Scholar] [CrossRef]
  12. Schönbrunn, E.; Eschenburg, S.; Shuttleworth, W.A.; Schloss, J. V; Amrhein, N.; Evans, J.N.; Kabsch, W. Interaction of the Herbicide Glyphosate with Its Target Enzyme 5-Enolpyruvylshikimate 3-Phosphate Synthase in Atomic Detail. Proc. Natl. Acad. Sci. U. S. A. 2001, 98, 1376–1380. [Google Scholar] [CrossRef] [PubMed]
  13. Singh, S.A.; Christendat, D. Structure of Arabidopsis Dehydroquinate Behydratase-Shikimate Dehydrogeoase and Implications for Metabolic Channeling in the Shikimate Pathway. Biochemistry 2006, 45, 7787–7796. [Google Scholar] [CrossRef]
  14. Deng, Q.; Meng, J.; Liu, Y.; Guan, Y.; Xiao, C. IMB-SD62, a Triazolothiadiazoles Derivative with Promising Action against Tuberculosis. Tuberculosis 2018, 112, 37–44. [Google Scholar] [CrossRef]
  15. Avitia-Domínguez, C.; Sierra-Campos, E.; Salas-Pacheco, J.; Nájera, H.; Rojo-Domínguez, A.; Cisneros-Martínez, J.; Téllez-Valencia, A. Inhibition and Biochemical Characterization of Methicillin-Resistant Staphylococcus Aureus Shikimate Dehydrogenase: An in Silico and Kinetic Study. Molecules 2014, 19, 4491–4509. [Google Scholar] [CrossRef] [PubMed]
  16. Enríquez-Mendiola, D.; Téllez-Valencia, A.; Sierra-Campos, E.; Campos-Almazán, M.; Valdez-Solana, M.; Palacio-Gastélum, M.G.; Avitia-Domínguez, C. Kinetic and Molecular Dynamic Studies of Inhibitors of Shikimate. Chem. Biol. Drug Des. 2019, 94, 1504–1517. [Google Scholar] [CrossRef]
  17. Peek, J.; Castiglione, G.; Shi, T.; Christendat, D. Isolation and Molecular Characterization of the Shikimate Dehydrogenase Domain from the Toxoplasma gondii AROM Complex. Mol. Biochem. Parasitol. 2014, 194, 16–19. [Google Scholar] [CrossRef] [PubMed]
  18. Baillie, A.C.; Corbett, J.R.; Dowsett, J.R.; McCloskey, P. Inhibitors of Shikimate Dehydrogenase as Potential Herbicides. Pestic. Sci. 1972, 3, 113–120. [Google Scholar] [CrossRef]
  19. Peek, J.; Shi, T.; Christendat, D. Identification of Novel Polyphenolic Inhibitors of Shikimate Dehydrogenase (AroE). J. Biomol. Screen. 2014, 19, 1090–1098. [Google Scholar] [CrossRef]
  20. Ma, S.; Yu, H.; Wang, M.; Cui, T.; Zhao, Y.; Zhang, X.; Wang, C.; Li, M.; Zhang, L.; Dong, J. Natural Product Drupacine Acting on a Novel Herbicidal Target Shikimate Dehydrogenase. Pestic. Biochem. Physiol. 2023, 194, 105480. [Google Scholar] [CrossRef]
  21. Yu, H. long; Tian, C.; Shen, R. yan; Zhao, H.; Yang, J.; Dong, J. gao; Zhang, L. hui; Ma, S. jie Herbicidal Activity and Biochemical Characteristics of the Botanical Drupacine against Amaranthus retroflexus L. J. Integr. Agric. 2023, 22, 1434–1444. [Google Scholar] [CrossRef]
  22. de Souza, M.C.; Constantin, R.P.; Abrahão, J.; de Paiva Foletto-Felipe, M.; Grizza, L.H.E.; Constantin, R.P.; dos Santos, W.D.; Ferrarese-Filho, O.; Marchiosi, R. Inhibitory Effect of 3-Cyanobenzoic Acid on Initial Growth of Maize Seedlings and Its Biochemical Impacts on Antioxidant and Energy Metabolisms. J. Plant Growth Regul. 2023. [CrossRef]
  23. Bortolo, T.S.C.; Marchiosi, R.; Viganó, J.; Siqueira-soares, R.D.C.; Ferro, A.P.; Barreto, G.E.; Bido, G.D.S.; Abrahão, J.; Dantas, W.; Ferrarese-filho, O. Plant Physiology and Biochemistry Trans-Aconitic Acid Inhibits the Growth and Photosynthesis of Glycine max. Plant Physiol. Biochem. 2018, 132, 490–496. [Google Scholar] [CrossRef]
  24. Marchiosi, R.; Lucio Ferrarese, M. de L.; Bonini, E.A.; Fernandes, N.G.; Ferro, A.P.; Ferrarese-Filho, O. Glyphosate-Induced Metabolic Changes in Susceptible and Glyphosate-Resistant Soybean (Glycine max L.) Roots. Pestic. Biochem. Physiol. 2009, 93, 28–33. [Google Scholar] [CrossRef]
  25. Marchiosi, R.; Graciene de Souza Bido, B.; Paulo Alfredo Feitoza Böhm, B.; Ricardo Soares, A.; Hingrid Ariane da Silva, B.; Ana Paula Ferro, B.; de Lourdes Lucio Ferrarese, M.; Osvaldo Ferrarese-Filho, B. Photosynthetic Response of Soybean to L-DOPA and Aqueous Extracts of Velvet Bean. 2016. [CrossRef]
  26. Singh, S.A.; Christendat, D. The DHQ-Dehydroshikimate-SDH-Shikimate-NADP(H) Complex: Insights into Metabolite Transfer in the Shikimate Pathway. Cryst. Growth Des. 2007, 7, 2153–2160. [Google Scholar] [CrossRef]
  27. Webb, B.; Sali, A. Comparative Protein Structure Modeling Using MODELLER. Curr. Protoc. Bioinforma. 2016, 2016, 5.6.1–5.6.37. [Google Scholar] [CrossRef]
  28. Collaborative Computational Project, N. 4 The CCP4 Suite: Programs for Protein Crystallography. Acta Crystallogr. Sect. D Biol. Crystallogr. 1994, 50, 760–763. [Google Scholar] [CrossRef] [PubMed]
  29. Phillips, J.C.; Braun, R.; Wang, W.; Gumbart, J.; Tajkhorshid, E.; Villa, E.; Chipot, C.; Skeel, R.D.; Kalé, L.; Schulten, K. Scalable Molecular Dynamics with NAMD. J. Comput. Chem. 2005, 26, 1781–1802. [Google Scholar] [CrossRef] [PubMed]
  30. Mackerell, A.D.; Feig, M.; Brooks, C.L. Extending the Treatment of Backbone Energetics in Protein Force Fields: Limitations of Gas-Phase Quantum Mechanics in Reproducing Protein Conformational Distributions in Molecular Dynamics Simulation. J. Comput. Chem. 2004, 25, 1400–1415. [Google Scholar] [CrossRef] [PubMed]
  31. Zoete, V.; Cuendet, M.A.; Grosdidier, A.; Michielin, O. SwissParam: A Fast Force Field Generation Tool for Small Organic Molecules. J. Comput. Chem. 2011, 32, 2359–2368. [Google Scholar] [CrossRef] [PubMed]
  32. M. , M.G.; Huey, R.; Lindstrom, W.; Sanner, M.F.; Belew, R.K.; Goodseel, D.S.; Olson, A.J. AutoDock4 and AutoDockTools4: Automated Docking with Selective Receptor Flexibility. J. Comput. Chem. 2012, 32, 174–182. [Google Scholar] [CrossRef]
  33. Thomsen, R.; Christensen, M.H. MolDock: A New Technique for High-Accuracy Molecular Docking. J. Med. Chem. 2006, 49, 3315–3321. [Google Scholar] [CrossRef]
  34. Lauren, K. Wolf New Software and Websites for the Chemical Enterprise. Chem. Eng. News 2009, 87, 32. [Google Scholar] [CrossRef]
  35. Bradford, M.M. A Rapid and Sensitive Method for the Quantitation of Microgram Quantities of Protein Utilizing the Principle of Protein-Dye Binding. Anal. Biochem. 1976, 72, 248–254. [Google Scholar] [CrossRef]
  36. Villén, J.; Gygi, S.P. The SCX/IMAC Enrichment Approach for Global Phosphorylation Analysis by Mass Spectrometry. Nat. Protoc. 2008, 3, 1630–1638. [Google Scholar] [CrossRef]
  37. Foletto-Felipe, M. de P. O-Acetilserina(Tiol) Liase: Estudos in Silico, in Vitro e in Vivo, Universidade Estadual de Maringá, 2021.
  38. Dong, J.; Wu, F.; Zhang, G. Influence of Cadmium on Antioxidant Capacity and Four Microelement Concentrations in Tomato Seedlings (Lycopersicon esculentum). Chemosphere 2006, 64, 1659–1666. [Google Scholar] [CrossRef]
  39. Azevedo, R.A.; Alas, R.M.; Smith, R.J.; Lea, P.J. Response of Antioxidant Enzymes to Transfer from Elevated Carbon Dioxide to Air and Ozone Fumigation, in the Leaves and Roots of Wild-Type and a Catalase-Deficient Mutant of Barley. Physiol. Plant. 1998, 104, 280–292. [Google Scholar] [CrossRef]
  40. Astarita, L. V.; Floh, E.I.S.; Handro, W. Free Amino Acid, Protein and Water Content Changes Associated with Seed Development in Araucaria angustifolia. Biol. Plant. 2003, 47, 53–59. [Google Scholar] [CrossRef]
  41. Pieruzzi, F.P. Quantificação de Aminoácidos, Poliaminas, AIA e ABA e Marcadores Protéicos Na Germinação de Sementes de Ocotea odorifera Vell. (Lauraceae), Universidade de São Paulo, 2009.
  42. Benson, J.R.; Hare, P.E. O Phthalaldehyde: Fluorogenic Detection of Primary Amines in the Picomole Range. Comparison with Fluorescamine and Ninhydrin. Proc. Natl. Acad. Sci. U. S. A. 1975, 72, 619–622. [Google Scholar] [CrossRef]
  43. Moreira-Vilar, F.C.; Siqueira-Soares, R.D.C.; Finger-Teixeira, A.; De Oliveira, D.M.; Ferro, A.P.; Da Rocha, G.J.; Ferrarese, M.D.L.L.; Dos Santos, W.D.; Ferrarese-Filho, O. The Acetyl Bromide Method Is Faster, Simpler and Presents Best Recovery of Lignin in Different Herbaceous Tissues than Klason and Thioglycolic Acid Methods. PLoS One 2014, 9. [Google Scholar] [CrossRef]
  44. Bonini, E.A.; Ferrarese, M.L.L.; Marchiosi, R.; Zonetti, P.C.; Ferrarese-Filho, O. A Simple Chromatographic Assay to Discriminate between Glyphosate-Resistant and Susceptible Soybean (Glycine max) Cultivars. Eur. J. Agron. 2009, 31, 173–176. [Google Scholar] [CrossRef]
  45. Ding, L.; Hofius, D.; Hajirezaei, M.R.; Fernie, A.R.; Börnke, F.; Sonnewald, U. Functional Analysis of the Essential Bifunctional Tobacco Enzyme 3-Dehydroquinate Dehydratase/Shikimate Dehydrogenase in Transgenic Tobacco Plants. J. Exp. Bot. 2007, 58, 2053–2067. [Google Scholar] [CrossRef]
  46. Copeland, R.A. Enzymes: A Practical Introduction to Structure, Mechanism, and Data Analysis; Third edit.; Wiley: New York, 2023. [Google Scholar]
  47. Blat, Y. Non-competitive Inhibition by Active Site Binders. Chem. Biol. Drug Des. 2010, 75, 535–540. [Google Scholar] [CrossRef] [PubMed]
  48. Cornish-Bowden, A. Fundamentals of Enzyme Kinetics; Fourth edi.; Wiley-Blackwell: Singapore, 2012; ISBN 978-3-527-33074-4. [Google Scholar]
  49. Noureldin, N.A.; Kothayer, H.; Lashine, E.S.M.; Baraka, M.M.; Huang, Y.; Li, B.; Ji, Q. Design, Synthesis and Biological Evaluation of Novel Quinazoline-2,4-Diones Conjugated with Different Amino Acids as Potential Chitin Synthase Inhibitors. Eur. J. Med. Chem. 2018, 152, 560–569. [Google Scholar] [CrossRef]
  50. Gangjee, A.; Vidwans, A.P.; Vasudevan, A.; Queener, S.F.; Kisliuk, R.L.; Cody, V.; Li, R.; Galitsky, N.; Luft, J.R.; Pangborn, W. Structure-Based Design and Synthesis of Lipophilic 2,4-Diamino-6- Substituted Quinazolines and Their Evaluation as Inhibitors of Dihydrofolate Reductases and Potential Antitumor Agents. J. Med. Chem. 1998, 41, 3426–3434. [Google Scholar] [CrossRef]
  51. Ding, L.; Hofius, D.; Hajirezaei, M.-R.; Fernie, A.R.; Börnke, F.; Sonnewald, U. Functional Analysis of the Essential Bifunctional Tobacco Enzyme 3-Dehydroquinate Dehydratase/Shikimate Dehydrogenase in Transgenic Tobacco Plants. J. Exp. Bot. 2007, 58, 2053–2067. [Google Scholar] [CrossRef] [PubMed]
  52. Amir, R. Current Understanding of the Factors Regulating Methionine Content in Vegetative Tissues of Higher Plants. Amino Acids 2010, 39, 917–931. [Google Scholar] [CrossRef]
  53. Huang, T.; Jander, G. Abscisic Acid-Regulated Protein Degradation Causes Osmotic Stress-Induced Accumulation of Branched-Chain Amino Acids in Arabidopsis thaliana. Planta 2017, 246, 737–747. [Google Scholar] [CrossRef] [PubMed]
  54. Batista-Silva, W.; Heinemann, B.; Rugen, N.; Nunes-Nesi, A.; Araújo, W.L.; Braun, H.P.; Hildebrandt, T.M. The Role of Amino Acid Metabolism during Abiotic Stress Release. Plant Cell Environ. 2019, 42, 1630–1644. [Google Scholar] [CrossRef] [PubMed]
  55. Brilisauer, K.; Rapp, J.; Rath, P.; Schöllhorn, A.; Bleul, L.; Weiß, E.; Stahl, M.; Grond, S.; Forchhammer, K. Cyanobacterial Antimetabolite 7-Deoxy-Sedoheptulose Blocks the Shikimate Pathway to Inhibit the Growth of Prototrophic Organisms. Nat. Commun. 2019, 10. [Google Scholar] [CrossRef]
  56. Hildebrandt, T.M. Synthesis versus Degradation: Directions of Amino Acid Metabolism during Arabidopsis Abiotic Stress Response. Plant Mol. Biol. 2018, 98, 121–135. [Google Scholar] [CrossRef]
  57. Batista-Silva, W.; Heinemann, B.; Rugen, N.; Nunes-Nesi, A.; Araújo, W.L.; Braun, H.P.; Hildebrandt, T.M. The Role of Amino Acid Metabolism during Abiotic Stress Release. Plant Cell Environ. 2019, 42, 1630–1644. [Google Scholar] [CrossRef] [PubMed]
  58. Ossipov, V.; Salminen, J.P.; Ossipova, S.; Haukioja, E.; Pihlaja, K. Gallic Acid and Hydrolysable Tannins Are Formed in Birch Leaves from an Intermediate Compound of the Shikimate Pathway. Biochem. Syst. Ecol. 2003, 31, 3–16. [Google Scholar] [CrossRef]
  59. Guo, J.; Carrington, Y.; Alber, A.; Ehlting, J. Molecular Characterization of Quinate and Shikimate Metabolism in Populus trichocarpa. J. Biol. Chem. 2014, 289, 23846–23858. [Google Scholar] [CrossRef] [PubMed]
  60. Bontpart, T.; Marlin, T.; Vialet, S.; Guiraud, J.L.; Pinasseau, L.; Meudec, E.; Sommerer, N.; Cheynier, V.; Terrier, N. Two Shikimate Dehydrogenases, VvSDH3 and VvSDH4, Are Involved in Gallic Acid Biosynthesis in Grapevine. J. Exp. Bot. 2016, 67, 3537–3550. [Google Scholar] [CrossRef] [PubMed]
  61. Huang, K.; Li, M.; Liu, Y.; Zhu, M.; Zhao, G.; Zhou, Y.; Zhang, L.; Wu, Y.; Dai, X.; Xia, T.; et al. Functional Analysis of 3-Dehydroquinate Dehydratase/Shikimate Dehydrogenases Involved in Shikimate Pathway in Camellia sinensis. Front. Plant Sci. 2019, 10, 1268. [Google Scholar] [CrossRef]
  62. Tahara, K.; Nishiguchi, M.; Funke, E.; Miyazawa, S.-I.; Miyama, T.; Milkowski, C. Dehydroquinate Dehydratase/Shikimate Dehydrogenases Involved in Gallate Biosynthesis of the Aluminum-Tolerant Tree Species Eucalyptus camaldulensis. Planta 2021, 253, 3. [Google Scholar] [CrossRef] [PubMed]
  63. Zeeman, S.C. Carbohydrate Metabolism. In Biochemistry and Molecular Biology of Plants; Buchanan, B.B., Gruissem, W., Jones, R.L., Eds.; Wiley Blackwell, 2015; pp. 567–609 ISBN 9780470714218.
  64. Steinrücken, H.C.; Amrhein, N. The Herbicide Glyphosate Is a Potent Inhibitor of 5-Enolpyruvyl-Shikimic Acid-3-Phosphate Synthase. Biochem. Biophys. Res. Commun. 1980, 4, 1207–1212. [Google Scholar] [CrossRef] [PubMed]
  65. Duke, S.O.; Powles, S.B. Glyphosate: A Once-in-a-century Herbicide. Pest Manag. Sci. 2008, 64, 319–325. [Google Scholar] [CrossRef] [PubMed]
  66. Liu, Q.; Luo, L.; Zheng, L. Lignins: Biosynthesis and Biological Functions in Plants. Int. J. Mol. Sci. 2018, 19. [Google Scholar] [CrossRef] [PubMed]
Figure 1. The shikimate pathway. The pathway begins with erythrose-4-phosphate and phosphoenolpyruvate, obtained from the pentose phosphate pathway and glycolysis, respectively. The pathway comprises seven enzymatic reactions that lead to the formation of chorismate, which serves as a precursor to aromatic amino acids. Pi, inorganic phosphate (Pi). PEP, phosphoenolpyruvate.
Preprints 101618 g001
Figure 2. (A) Chemical structure of 6-nitroquinazoline-2,4-diol (NQD) selected by virtual screening. NQD (-8.52 kcal mol-1) showed the best score compared to substrate 3-dehydroshikimate (-7.51 kcal mol-1). (B) Three-dimensional structure of AtDHQD/SDH used in molecular docking simulations. The DHQD domain (magenta) is dehydroquinate, and the SDH domain (green) contains dehydroshikimate and NADPH. (C) A 12% polyacrylamide gel (SDS-PAGE) with samples from Δ88DHQ-SDH protein purification from nickel affinity chromatography. kDa = kiloDalton; mm = standard molecular mass; crude extract = supernatant after bacterial lysis; flow through = flow eluted directly through the column; washing = buffer injection (10 mM Tris HCl, 500 mM NaCl, pH 7.5) to remove impurities that weakly interacted with the resin; 40 mM, 150 mM, or 250 mM = buffer injection containing imidazole. The blue arrow indicates the Δ88DHQ-SDH protein, which is approximately 58 kDa.
Preprints 101618 g002
Figure 3. Activity of shikimate dehydrogenase from Arabidopsis thaliana (AtDHQD/SDH) expressed in Escherichia coli strain BL21(DE3) and purified using a nickel affinity chromatography column. The enzyme activity was determined by monitoring NADPH production in the presence of shikimate in a reaction mixture without (●) or with (■) 250 µM 6-nitroquinazoline-2,4-diol (NQD). The reaction mixture contained 0.1 M Tris-HCl (pH 8.8), 1 nM of the ∆88DHQ-SDH enzyme, 100 to 2000 µM shikimic acid, and 2 mM NADP+. The maximal velocity (Vmax) values and Michaelis-Menten constants (KM) were calculated by fitting the Michaelis-Menten equation to the initial rates using iterative nonlinear least-squares analysis. Values are presented as the mean ± SEM (n = 3 to 9). The Michaelis-Menten plot indicates a kinetic profile of noncompetitive inhibition of AtDHQD/SDH by NQD.
Preprints 101618 g003
Figure 4. Effects of 500 µM NQD on the root growth of soybean (A) and maize (B) for 24 to 96 h. Mean values ± SEM (n = 3 to 8) marked with an asterisk (*) differ from the control group, as determined by the Student´s t test with a significance level of 5% (p ≤ 0.05).
Preprints 101618 g004
Figure 5. Nutrient solution consumption by soybean (A) and maize (B) seedlings for 24 to 96 h of incubation without (●) or with (■) 500 µM NQD. (C) Depletion of 500 µM NQD from the nutrient solution with soybean and maize seedlings for 24 to 96 h of incubation. (D) NQD absorption by soybean and maize seedlings after 96 h incubation with 500 µM NQD. In A, B, and C, the symbols show experimental values (mean ± SEM; n = 4), and the fitted curves in each graph correspond to the equations provided. In D, the mean values ± SEM (n = 4) for maize marked with an asterisk (*) differ from those of soybean, as determined by a Student´s t test with a significance level of 5% (p ≤ 0.05).
Preprints 101618 g005
Figure 6. Effects of 500 µM NQD on the levels of free amino acids in the roots of soybean (A) and maize (B) seedlings after 48 and 96 h of exposure, respectively. Amino acids are shown in different colors based on their R-group classification (nonpolar, aromatic, basic, acidic, and polar). Valine (Val), alanine (Ala), methionine (Met), leucine (Leu), glycine (Gly), isoleucine (Ile), tyrosine (Tyr), phenylalanine (Phe), histidine (His), arginine (Arg), lysine (Lys), glutamic acid (Glu), aspartic acid (Asp), threonine (Thr), glutamine (Gln), serine (Ser), and asparagine (Asn). The results are expressed as a percentage of the control and were analyzed using the Student's t test. The mean values ± SEM (n = 4) are provided, and any significant differences from the control are indicated by an asterisk (*).
Preprints 101618 g006
Figure 7. Effects of 500 µM NQD on the levels of phenolic acids in the roots of soybean (A) and maize (B) seedlings after 48 and 96 h of exposure, respectively. Gallic acid (GA), p-hydroxybenzaldehyde (p-HB), protocatechuic acid (PRO), vanillic acid (VA), caffeic acid (CA), p-coumaric acid (p-CA), and ferulic acid (FA). Mean values ± SEM (n = 4) marked with an asterisk (*) differ from the control group, as determined by the Student´s t test with a significance level of 5% (p ≤ 0.05). ns = not significant.
Preprints 101618 g007
Figure 8. (A) Shikimate content in soybean roots incubated for 48 h without (control) or with 100 µM glyphosate and 100 µM glyphosate plus 500 µM NQD. (B) Shikimate content in maize roots incubated for 96 h without (control) or 25 µM glyphosate and 25 µM glyphosate plus 500 µM NQD. Mean values ± SEM (n = 3) followed by different letters are significantly different, as determined by Tukey's multiple comparisons test (p ≤ 0.05). nd = not detected.
Preprints 101618 g008
Table 1. Mean scores obtained from redocking using Autodock and Molegro software for both the crystallographic binders and the binders from the Zinc15 database.
Crystallographic binder Zinc database binder
Autodock Molegro Autodock Molegro
mean score rmsd
(Å)
mean score rmsd
(Å)
mean score mean score
DHQ -7.98 ± 0.09 0.32 ± 0.02 -81.38 ± 0.02 0.27 ± 0.01 -7.88 ± 0.10 -79.69 ± 0.24
DHK -8.25 ± 0.02 0.22 ± 0.03 -67.35 ± 0.01 0.21 ± 0.01 -7.26 ± 0.21 -62.63 ± 0.00
Table 2. Compounds selected in silico through virtual screening with better classification concerning endogenous and exogenous 3-dehydroshikimate (DHK). The 6-nitroquinazoline-2,4-diol (NQD) was tested in vivo.
Name Structure xlogP Score
AutoDock Molegro
DHK endo Preprints 101618 i001 -1.97 -7.43 -
DHK exo -6.56 -79.83
6-Nitroquinazoline-2,4-diol (NQD) Preprints 101618 i002 0.56 -7.70 -94.92
4-Bromo-3-cyanobenzoic acid Preprints 101618 i003 2.34 -7.39 -90.80
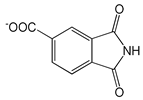
1,3-Dioxo-2,3-dihydro-1H-isoindole-5-carboxylic acid Preprints 101618 i004 1.34 -7.29 -104.27
2-Mercapto-5-benzimidazolecarboxylic acid Preprints 101618 i005 1.30 -7.18 -100.97
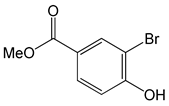
Methyl 3-bromo-4-hydroxybenzoate Preprints 101618 i006 2.63 -6.76 -81.74
2-Chloro-4-nitro-n-methylaniline Preprints 101618 i007 2.36 -6.74 -86.25
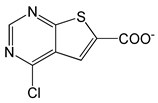
4-Chlorothieno[2,3-D]pyrimidine-6-carboxylic acid Preprints 101618 i008 1.91 -6.73 -85.02
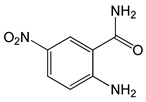
2-Amino-5-nitrobenzamide Preprints 101618 i009 0.13 -6.67 -88.97
Table 3. Kinetic parameters for shikimate dehydrogenase obtained by fitting the Michaelis‒Menten equation to the initial velocities with or without NQD.
NQD (µM) Vmax (µmol h-1 g-1) KM (µM)
0 472.1 244.0
250 276.2 245.7
Table 4. Total protein content (mg% protein) in soybean (48 h) and maize (96 h) seedlings incubated with 0 (control) or 500 µM NQD.
Control 500 µM NQD Difference
Soybean 334 ± 16.52 465.6 ± 19.51* 39%
Maize 222.9 ± 7.91 303.0 ± 27.20* 36%
Mean values ± standard error of the mean (n = 4), significantly different from the control, are marked with an asterisk (*) (Student´s t test, p ≤ 0.05).
Table 5. Lignin content in soybean seedlings after 48 h and maize seedlings after 96 h of incubation with 0 or 500 µM NQD.
NQD (µM) Soybean Maize
0 68.73 ± 2.436 144.3 ± 3.036
500 66.56 ± 1.401 149.9 ± 2.819
Mean values ± standard error of the mean (n = 5). (Student´s t test, p ≤ 0.05).
Disclaimer/Publisher’s Note: The statements, opinions and data contained in all publications are solely those of the individual author(s) and contributor(s) and not of MDPI and/or the editor(s). MDPI and/or the editor(s) disclaim responsibility for any injury to people or property resulting from any ideas, methods, instructions or products referred to in the content.
Copyright: This open access article is published under a Creative Commons CC BY 4.0 license, which permit the free download, distribution, and reuse, provided that the author and preprint are cited in any reuse.
Prerpints.org logo

Preprints.org is a free preprint server supported by MDPI in Basel, Switzerland.

Subscribe

© 2024 MDPI (Basel, Switzerland) unless otherwise stated