Introduction
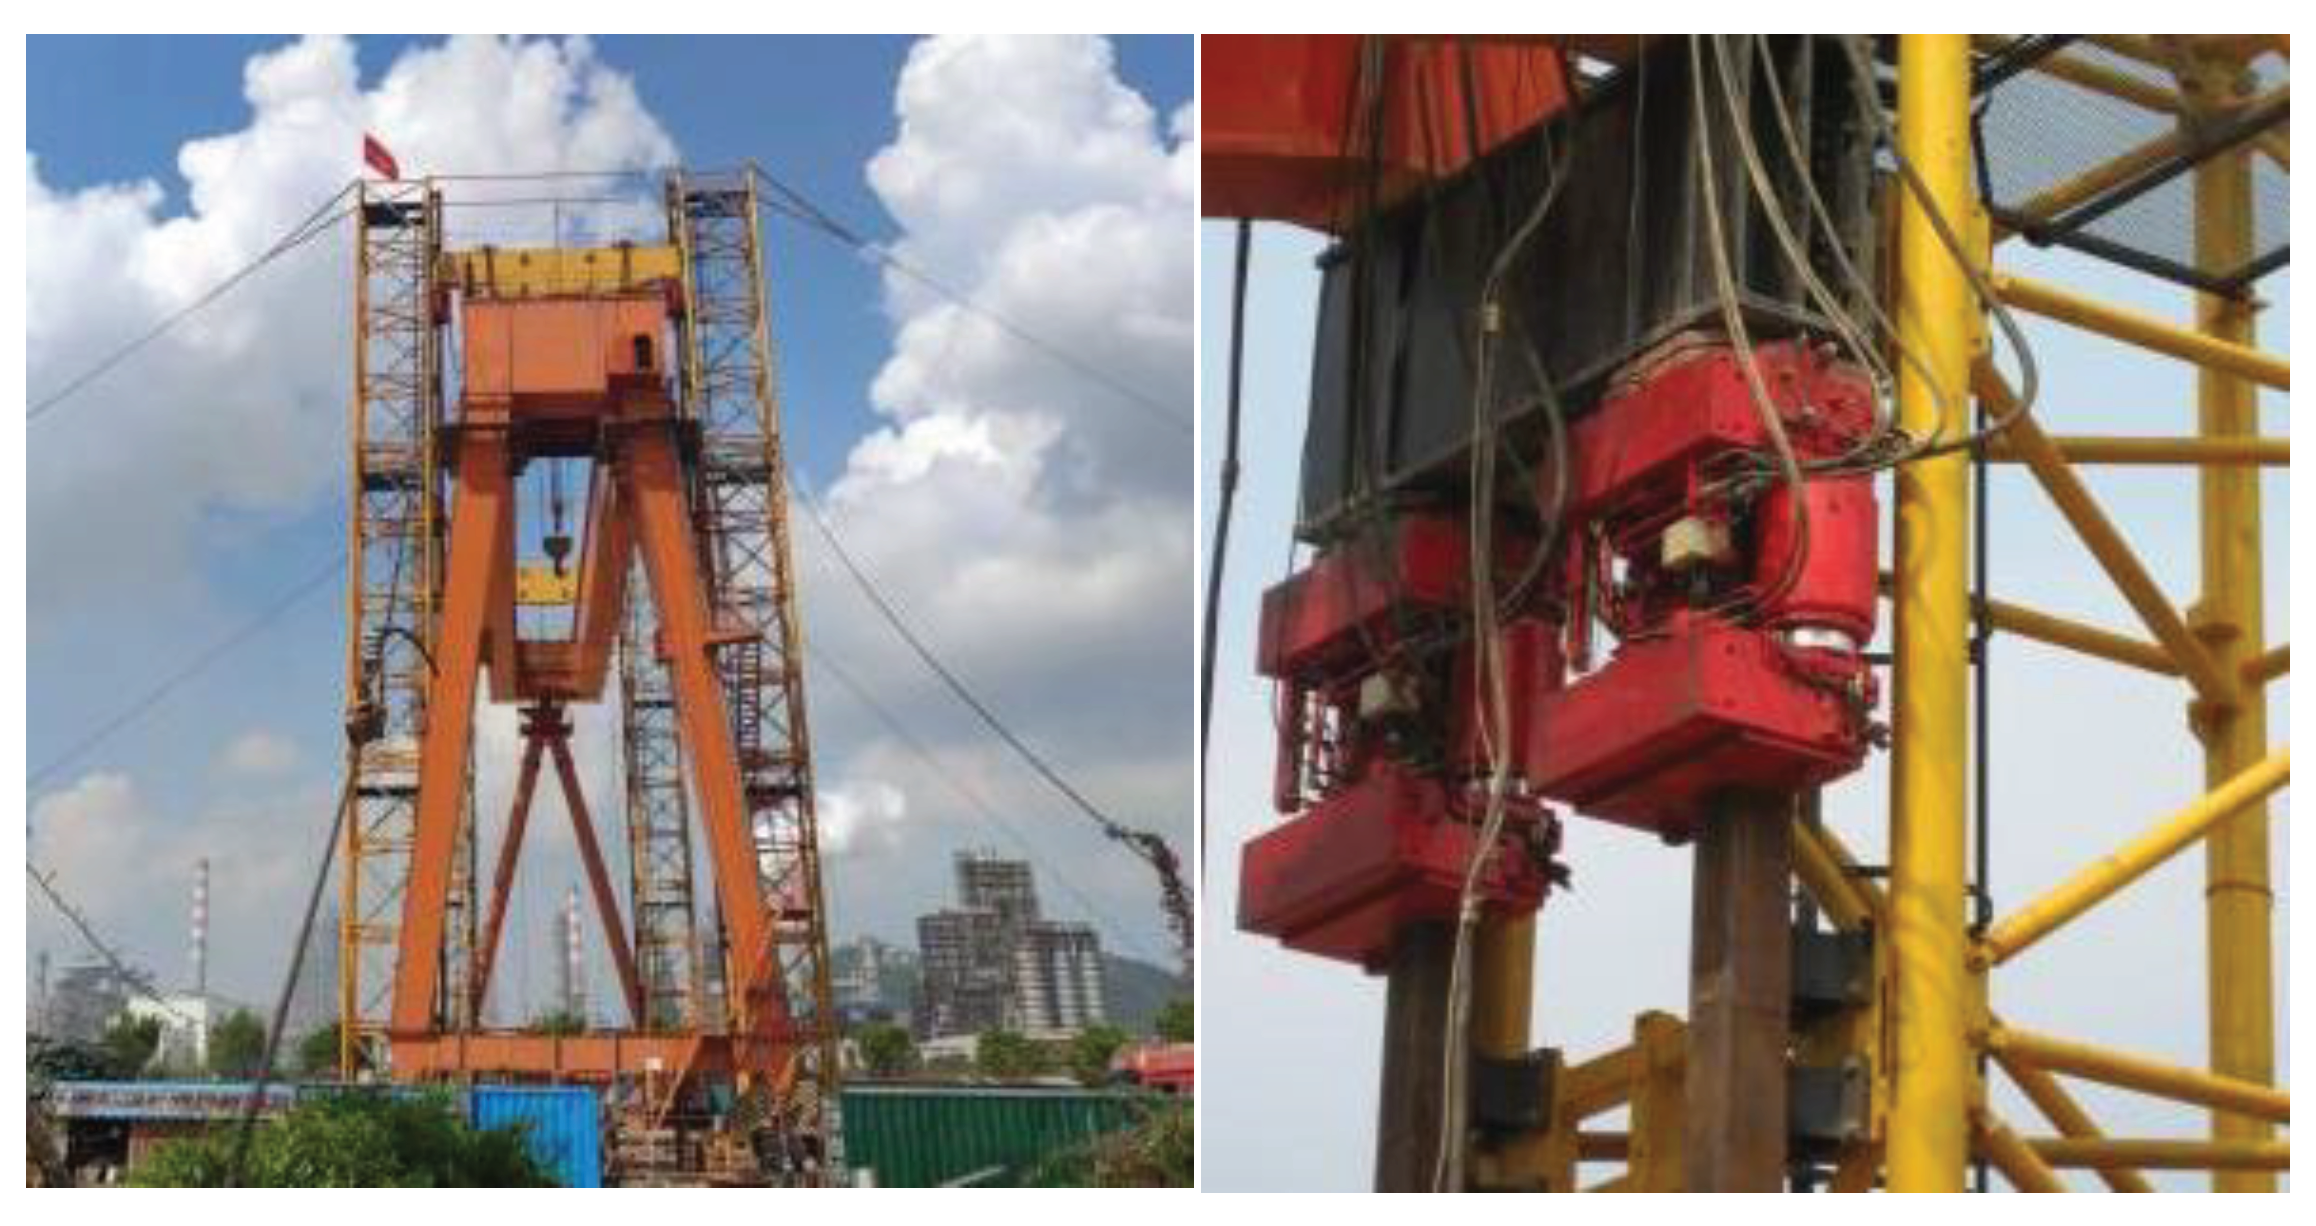
With the progress of science and technology, the related technology of hydraulic climbing hoisting system has been vigorously developed, and it has played an important role in modern industrial production such as petrochemical, construction, port and hoisting transportation industry [1-2]. At the same time, in the process of realizing intelligent manufacturing, it is urgent to further upgrade the lifting equipment, which requires the lifting capacity of the lifting equipment to be further improved. The 160M ultra-high gantry hydraulic climbing and hoisting system is currently the largest lifting equipment utilized in global petroleum and petrochemical systems. However , there is limited research conducted on this topic worldwide [
3]. as shown in
Figure 1. The mechanism is mainly composed of wedge block, anchor block, anchor plate, square steel, etc. It can be combined in different ways, such as single door type and double door type. The bearing capacity of each climbing rod is 410t, which can be used for a climbing jack. Through different combinations, it can achieve different lifting capacities (up to 4920t), and can realize the horizontal and vertical lifting of the maximum height of 162m. The core load-bearing component of the system is the hydraulic climbing mechanism, which mainly uses the friction between the climbing track and the wedge clamp block to realize the alternating lifting of the hydraulic jack, so the hydraulic climbing mechanism will be stressed and deformed.
The research on hydraulic climbing mechanism optimization is crucial for the development of the hoisting industry. The main challenges faced by the current research are the large stress, deformation, and geometric structure mass problems during the hoisting process, which can affect the stability of the hoisting system. To address these issues, researchers have proposed various optimization methods based on reliability design and multi-objective optimization algorithms.
One approach is to use advanced agent modeling technology to study the reliability design of the crane bridge system. This involves establishing a Kriging agent model of the crane system performance function and applying it for reliability-based design optimization. Additionally, a local search mutation ant colony optimization algorithm is used to calculate the reliability index of probability constraints at each design point. This method has been applied to actual crane structures to obtain global optimal solutions [
4]. Another strategy is to combine discrete imperialist competitive algorithms with inverse reliability strategies based on performance measurement approaches [
5]. This significantly improves the convergence speed of the reliability-based design optimization method at the optimization level. At the reliability analysis level, the inverse reliability strategy is used to determine the feasibility of each probabilistic constraint at each design point by calculating its a-percentage performance. This helps avoid convergence failure, calculation errors, and disproportionate computational effort incurred using conventional motion and simulation methods [
6].
Genetic algorithm (GA) and particle swarm optimization (PSO) combined with ACAM algorithm have also been used to optimize the crane metal structure and achieve optimal girder design [
7]. Light cranes have been optimized using the Taguchi method under variable dynamic load conditions to meet stiffness and strength requirements [
8].
Fault tree analysis (FTA) has been transformed into a Bayesian network topology model to evaluate the reliability of the entire crane [
9]. A hierarchical fuzzy tuning multi-objective optimization control scheme has been proposed, designed a multi-objective optimization controller, and transformed the control problem of the gantry crane into a state tracking optimization problem. This allows for simultaneous optimization of multiple performance indicators through weight matrix configuration [
10].
Parametric design using ANSYS software has also been employed to analyze the structure of gantry cranes and realize reliability optimization design [11-14]. Stress spectrum and fatigue damage have been calculated by analyzing the mechanical model of lifting processes, and a reasonable maintenance strategy has been proposed for the steel structure of gantry cranes [
15]. The analytical solution of mid-span deflection of portal structure beams has been deduced and verified through experimental models designed according to dimensional analysis methods [
16]. Weight optimization of main beams with asymmetric box sections has also been proposed using water evaporation optimization (WEO) algorithm and lightweight design concept [
17].
In conclusion, while there is significant research on structural design optimization of cranes, there is less focus on optimizing the parameters of hydraulic climbing mechanisms. Therefore, further research in this area is essential for the development of the hoisting industry.
Multi-Objective Optimization
In this study, the hydraulic climbing mechanism is chosen as the in this study, the hydraulic climbing mechanism is chosen as the research subject, and the focus is on how anchor plate and anchor block parameters affect the mass, maximum stress, and deformation of the hydraulic climbing mechanism. The optimization objective is to propose a multi-objective structural optimization scheme based on the force of the original model.
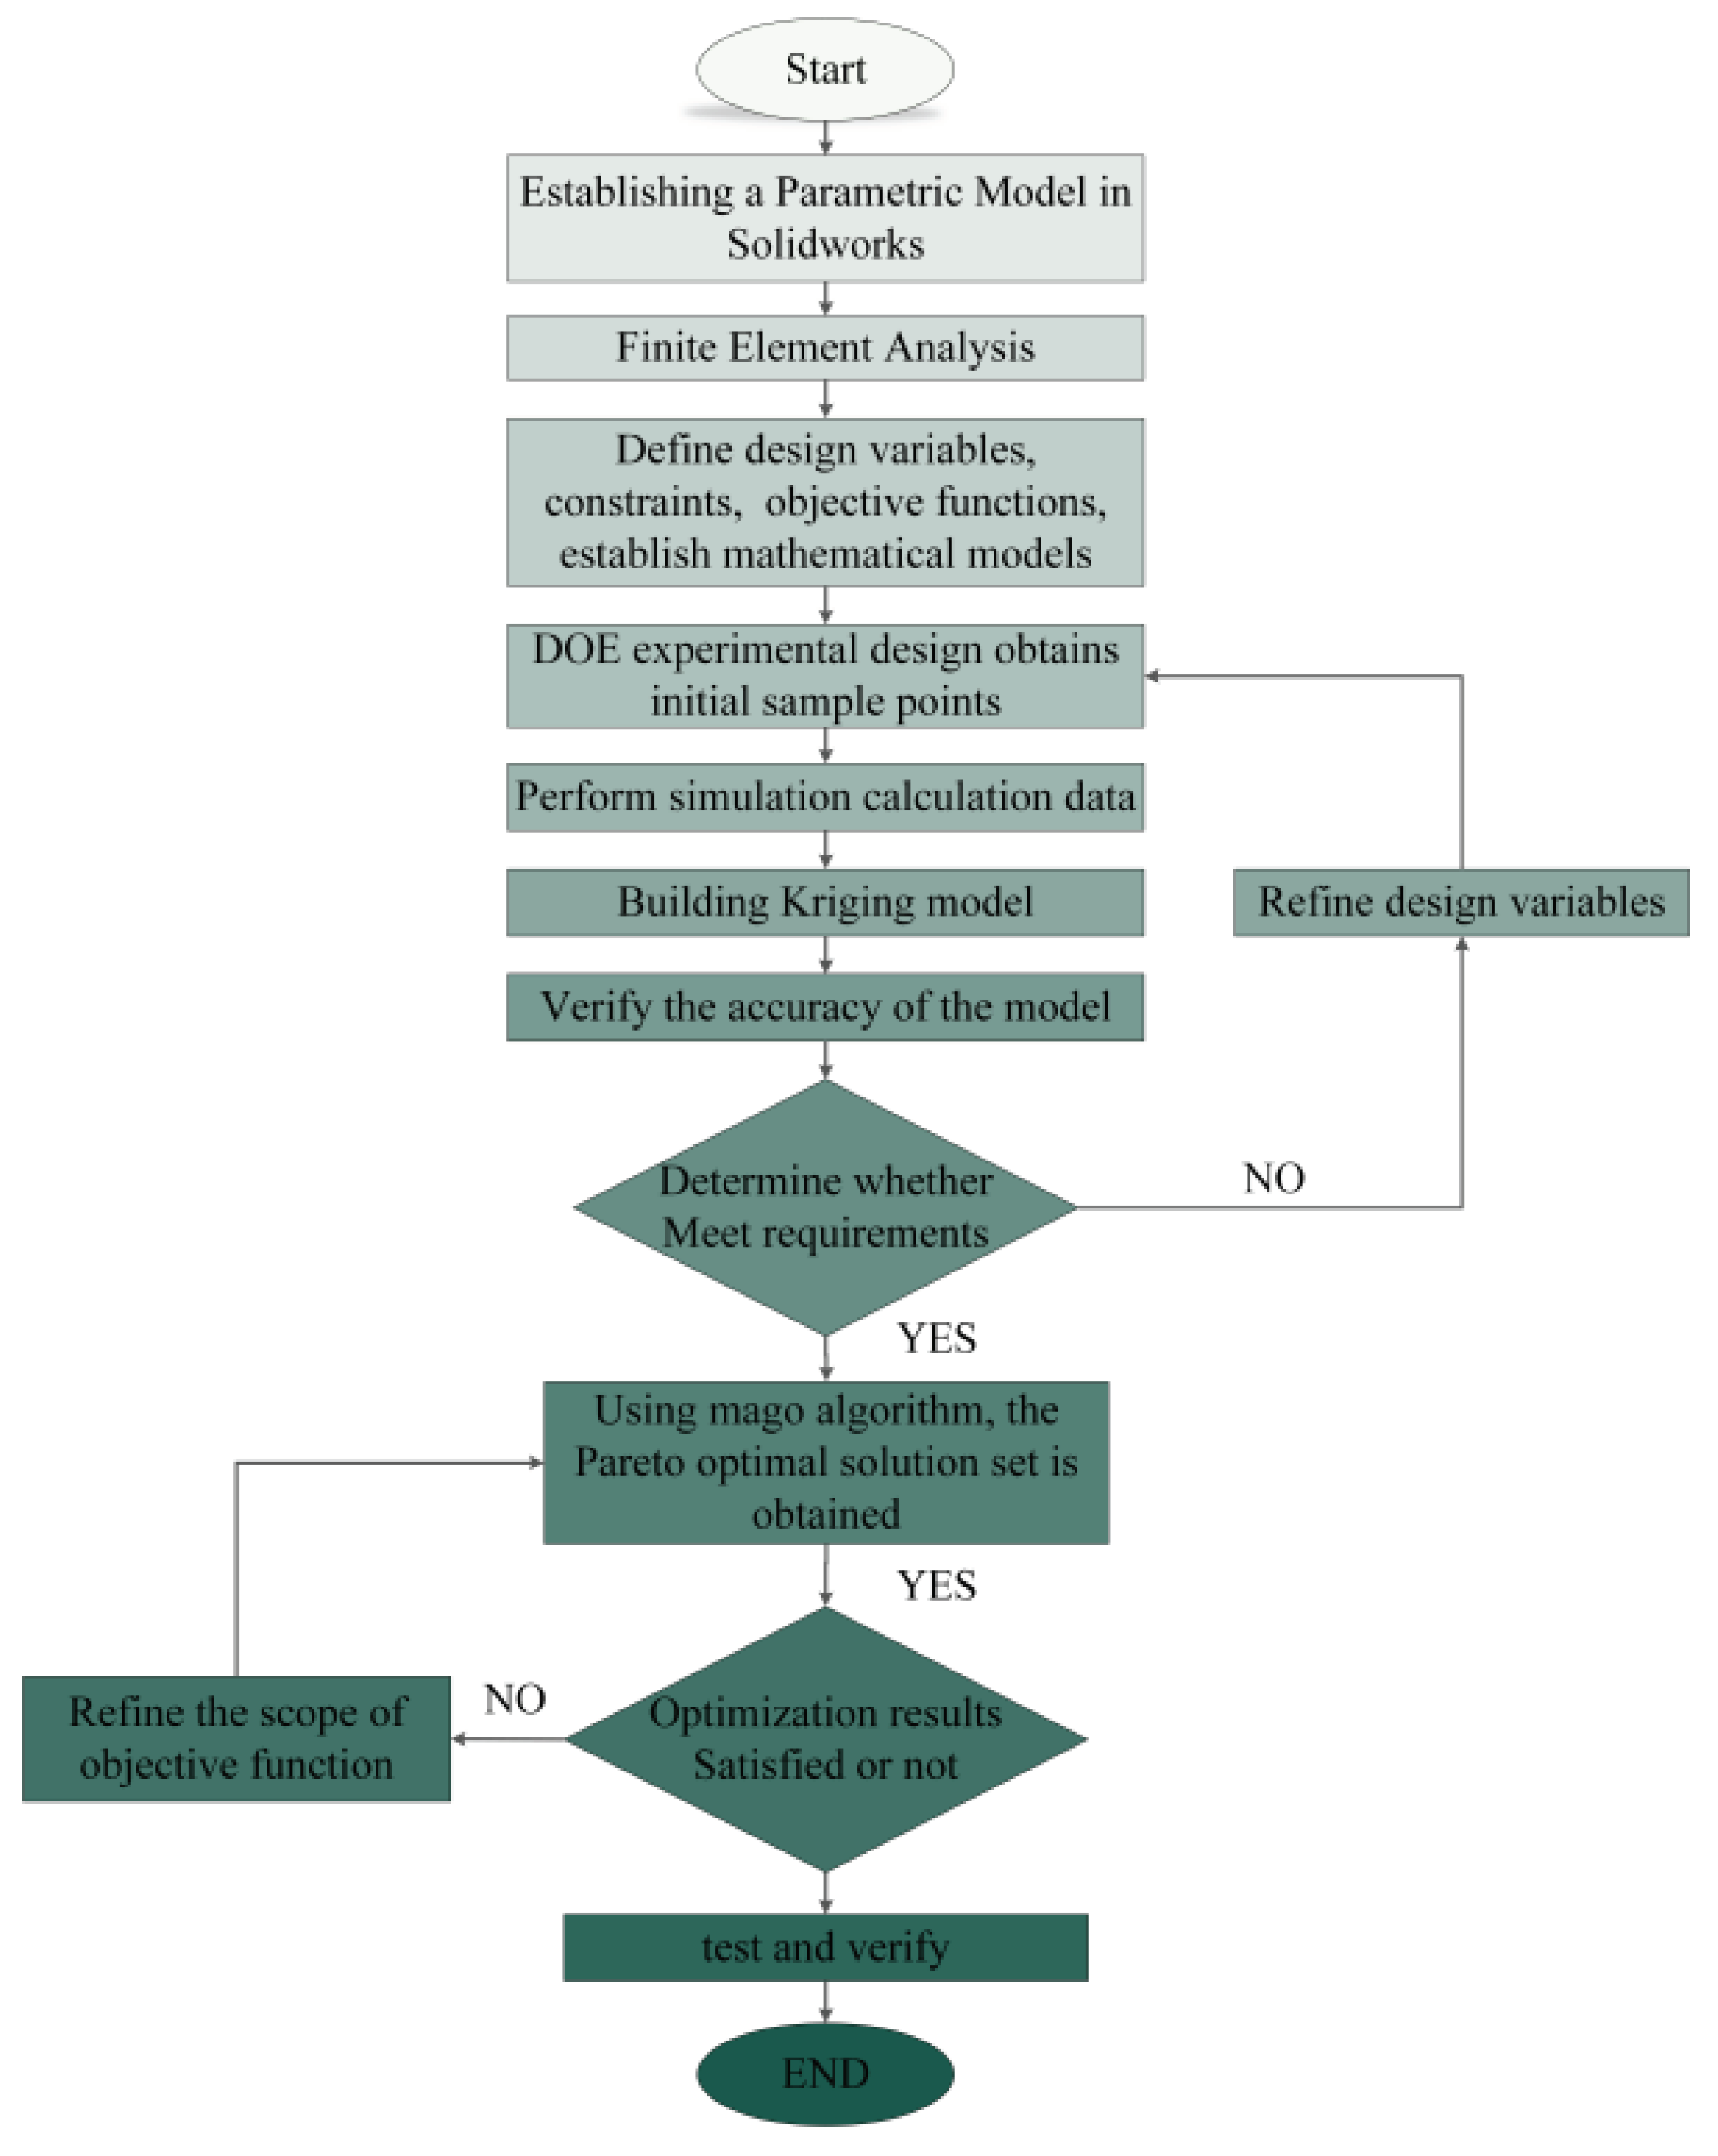
Response surface optimization method is employed due to its fast calculation speed and high accuracy. The algorithm mainly consists of CAE and mathematical modeling, Kriging model, and multi-objective optimization. The specific steps are as follows:
1.Parametric modeling of the hydraulic climbing mechanism in SOLIDWORKS, a three-dimensional modeling software.
2.Establishment of the finite element model of the hydraulic climbing mechanism in ANSYS Workbench, a finite element analysis software, followed by static analysis.
3.Design of DOE experiments in AYSYS response surface optimization module to obtain initial sample points. Simulated data are calculated, and a Kriging model is established and verified for accuracy.
4.Construction of an optimization system to refine design variables. MOGA algorithm is used to obtain the optimal solution set, and the selected optimization parameters are verified to determine their rationality.
Figure 2.
Optimization design flowchart.
Figure 2.
Optimization design flowchart.
The design exploration module in ANSYS Workbench allows for the investigation of parameter changes and the analysis and storage of data, providing a fast way to optimize designs. This is widely used in engineering analysis. The module contains various parameters to be analyzed and designed during the analysis process, which is beneficial for optimization analysis and other designs. Kriging requires experimental design, where each random sampling point in the sample interval is selected reasonably, and the response value of the sample point is obtained through experimentation. This provides the original data for establishing the response surface. There are many methods for experimental design, with central composite design being the most commonly used second-order design in response surface. The response surface is then established using input parameters to represent a complex function of output parameters. By solving a certain amount of known experimental data, an approximate solution is obtained, and then the approximate relationship of all experimental parameters is obtained. This reduces workload and obtains a high-accuracy parameter relationship. The energy efficiency of the Kriging method is based on its internal error estimator's ability to improve the mass of the response surface by generating refinement points and adding them to the area that needs improvement most. Additionally, it evaluates the relative error of prediction in the entire parameter space while updating the response surface. Design Explorer uses predicted relative error instead of predicted error because it allows the same value to be used for all output parameters, even if they have different variation ranges. While providing improved response mass and fitting high-order changes of output parameters, Kriging also provides a refinement function for continuous input parameters.Kriging [
18] response surface model is defined as follows:
Where
is the unknown function of the optimization objective;
is a polynomial function of
,and
is the number of design variables, and
is the undetermined coefficient of each formula.
is a random function obeying Gaussian normal distribution, when its mean is zero and has non-zero covariance, that is
is a polynomial model in response surface,
provides a "global" model of design space. When
"global" approximates the design space, the "local" deviation is created, which satisfies equation (3) and has the smallest variance, and the best estimation of the response surface can be obtained, so that the Kriging model can interpolate n sample data points. The covariance matrix of 4 is derived from the following formula:
Where
is a symmetric positive definite correlation matrix of
; Is a Gaussian correlation function, which can represent the spatial correlation of any two sample points
and
. The expression is as follows:
Whereis the unknown parameter for fitting; is the number of design variables.
Based on the unbiased property of
and the minimum variance of the estimation, it is obtained that the relevant parameters are given by the maximum possible estimation, that is, when
>0, the following equation (7) is maximum.
Where,
is the number of response values;
is the variance estimate;
is the correlation value between the point to be tested and the sample point. That is, the minimum value is obtained instead
Main Structure and Parameterization
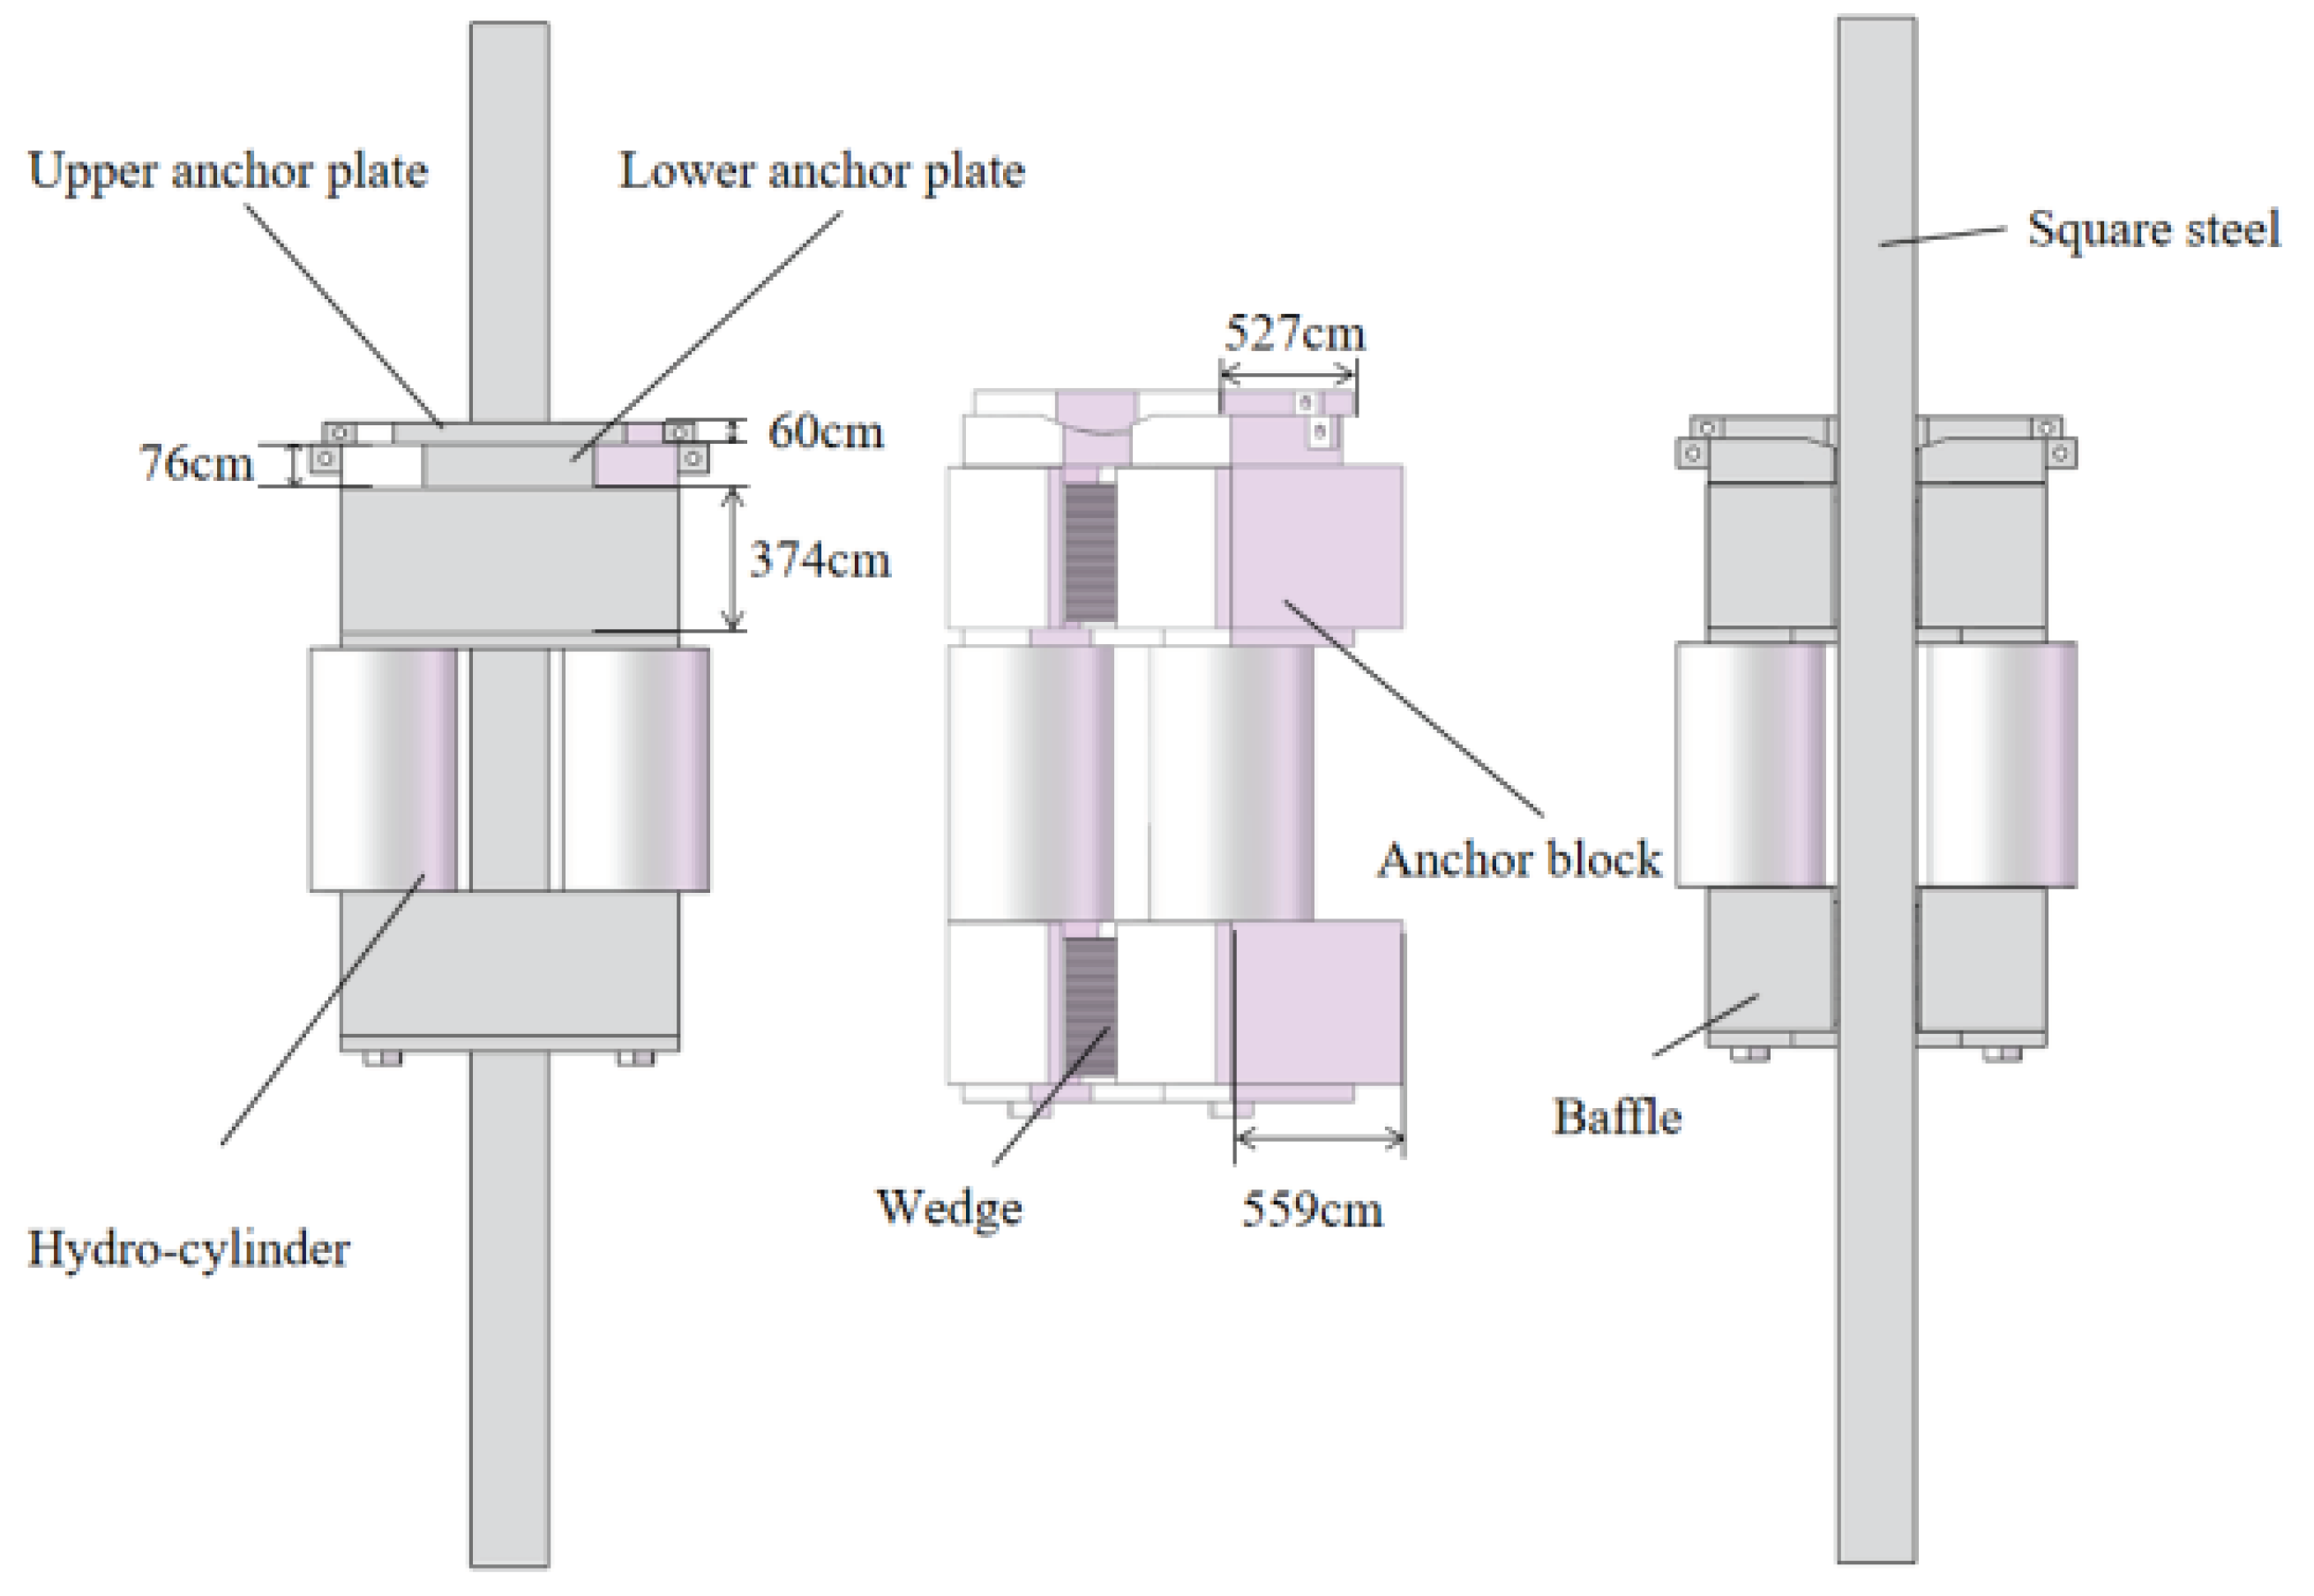
In accordance with the design specifications, a three-dimensional model of the hydraulic climbing mechanism has been created in SolidWorks. The hydraulic climbing mechanism is comprised of a wedge block, anchor block, square steel, anchor plate, oil cylinder, and other components. The structural design of this mechanism is depicted in
Figure 3.
As an essential component, the hydraulic climbing mechanism bears all the loads of the hoisting system. Therefore, this paper primarily concentrates on the modeling and analysis of its mechanical structure. Simultaneously, in order to enhance the efficiency of analysis and the mass of mesh generation, it is necessary to simplify or eliminate parts or details (such as process holes, chamfers, etc.) that have minimal impact on the analysis results in the model.
In this study,anchor block width (P1), anchor block thickness (P2), baffle thickness (P3), upper anchor plate thickness (P4), upper anchor plate width (P5), lower anchor plate thickness (P6), and lower anchor plate width (P7) have been selected for parametric definition.Following completion, the key dimension parameter names within the model (preceded by "Ds_") were modified and imported into the DM module of ANSYS Workbench to seamlessly connect the model with design variables. The parameter settings and optimized design scope are presented in
Table 1.
Model of Hydraulic Climbing Mechanism
The hydraulic climbing mechanism's square steel material is Q345, while the wedge material is W18Cr4V, and the remaining components are made of 42CrMo. The mechanical properties of these materials are detailed in
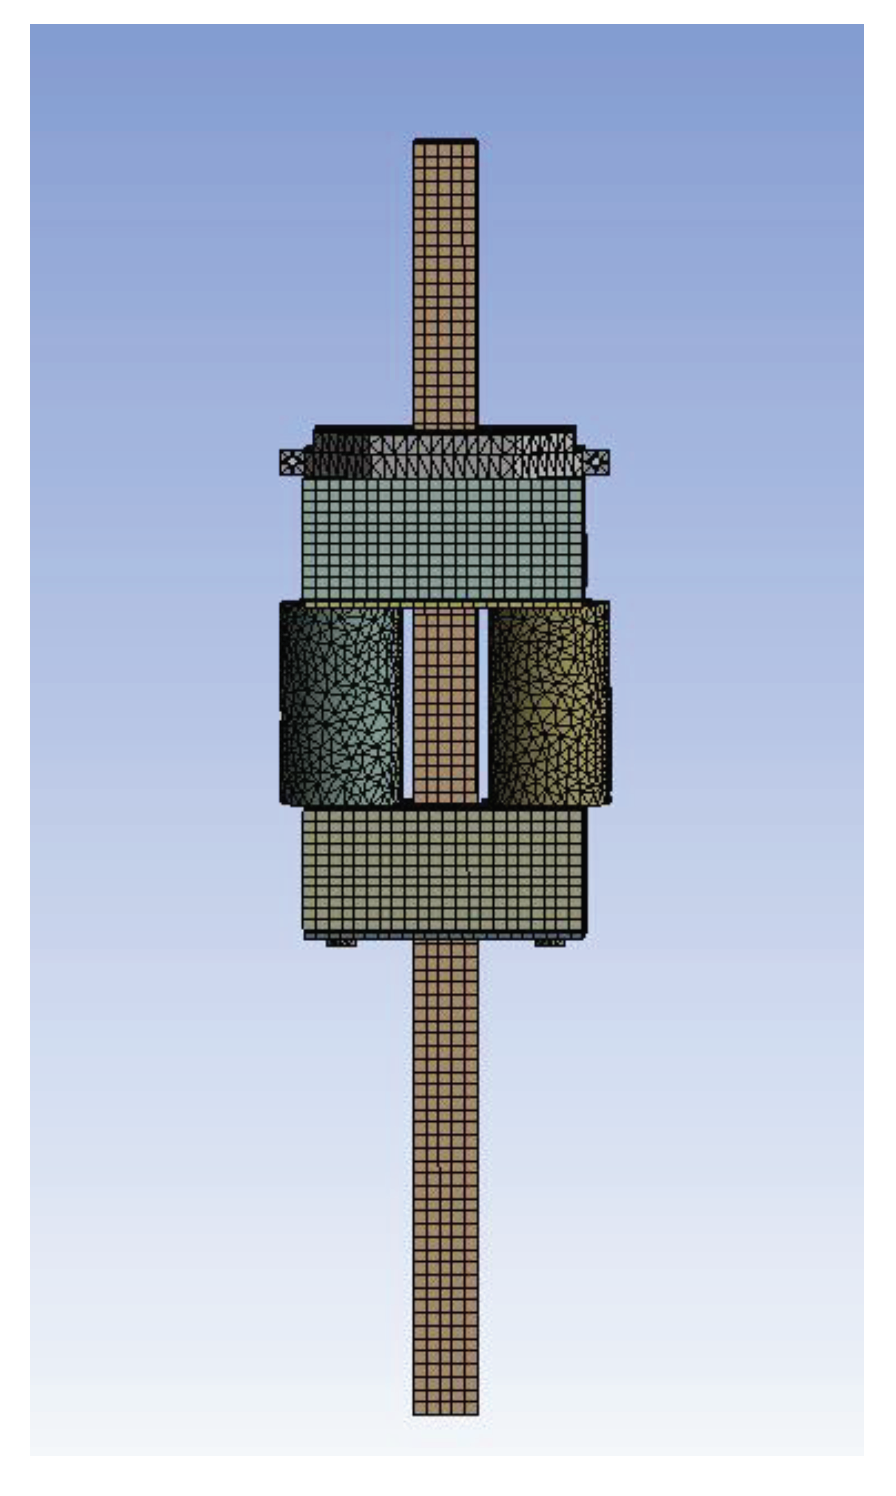
Table 2. Tetrahedron meshing is primarily used for the wedge, while hexahedron meshing is employed for the other structures. An element size of 20mm is set, with a high mesh mass definition. To refine the mesh, a 10mm mesh size is applied at the wedge area. The overall finite element model of the hydraulic climbing mechanism is depicted in
Figure 4, comprising 139,508 units and 713,806 nodes.
Analysis of Simulation Results
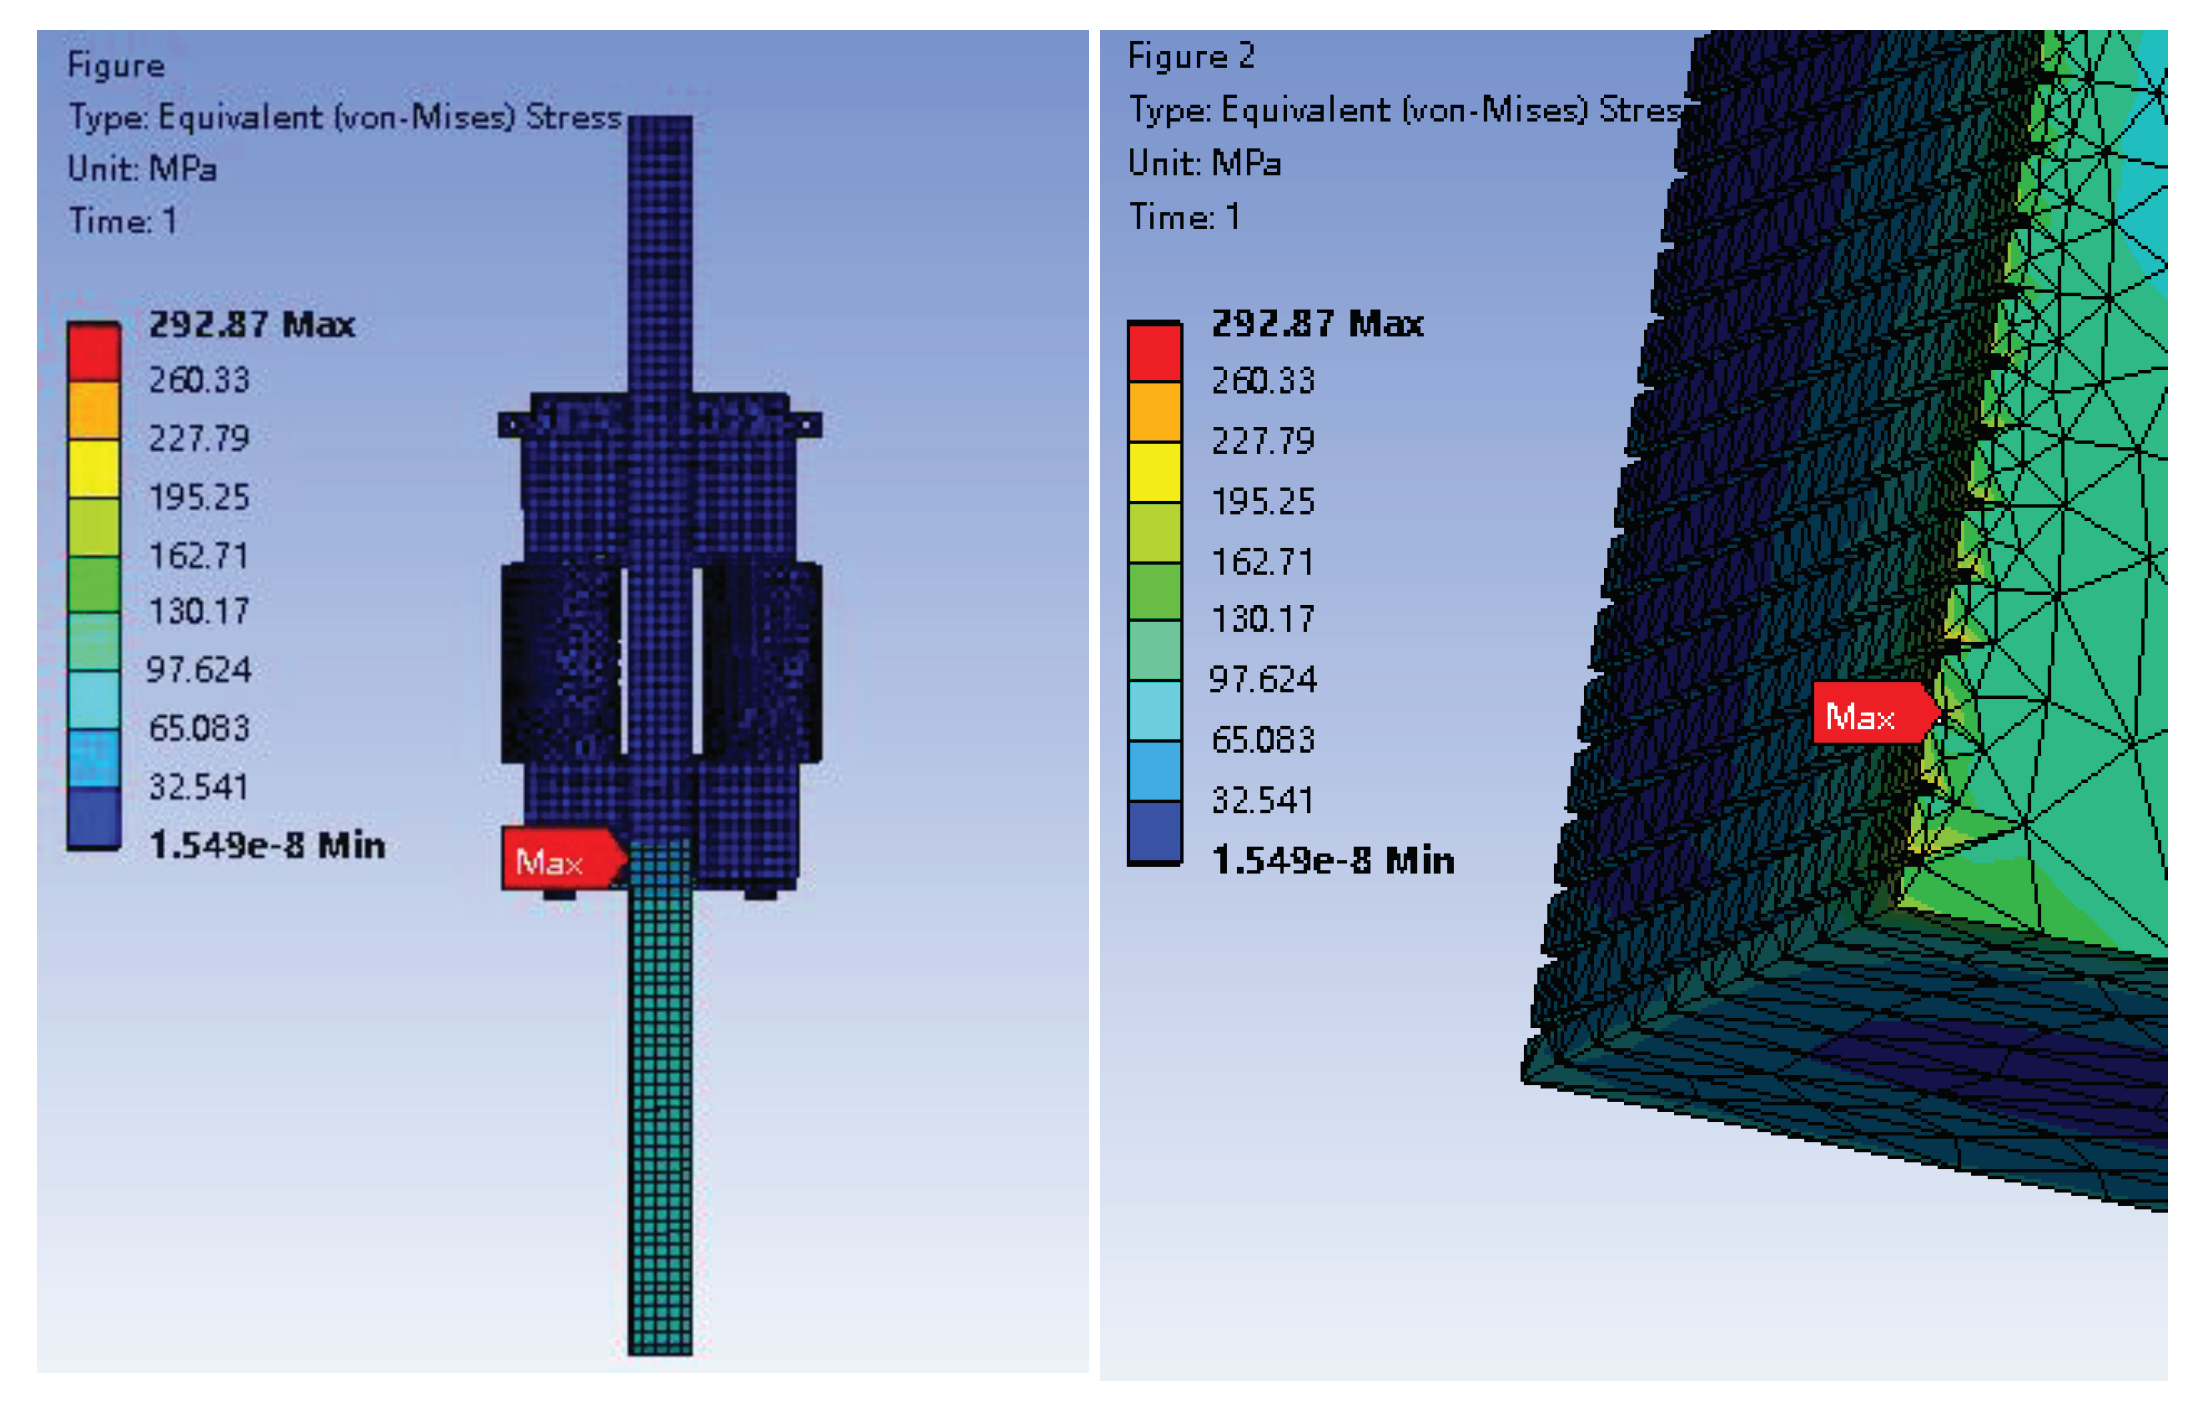
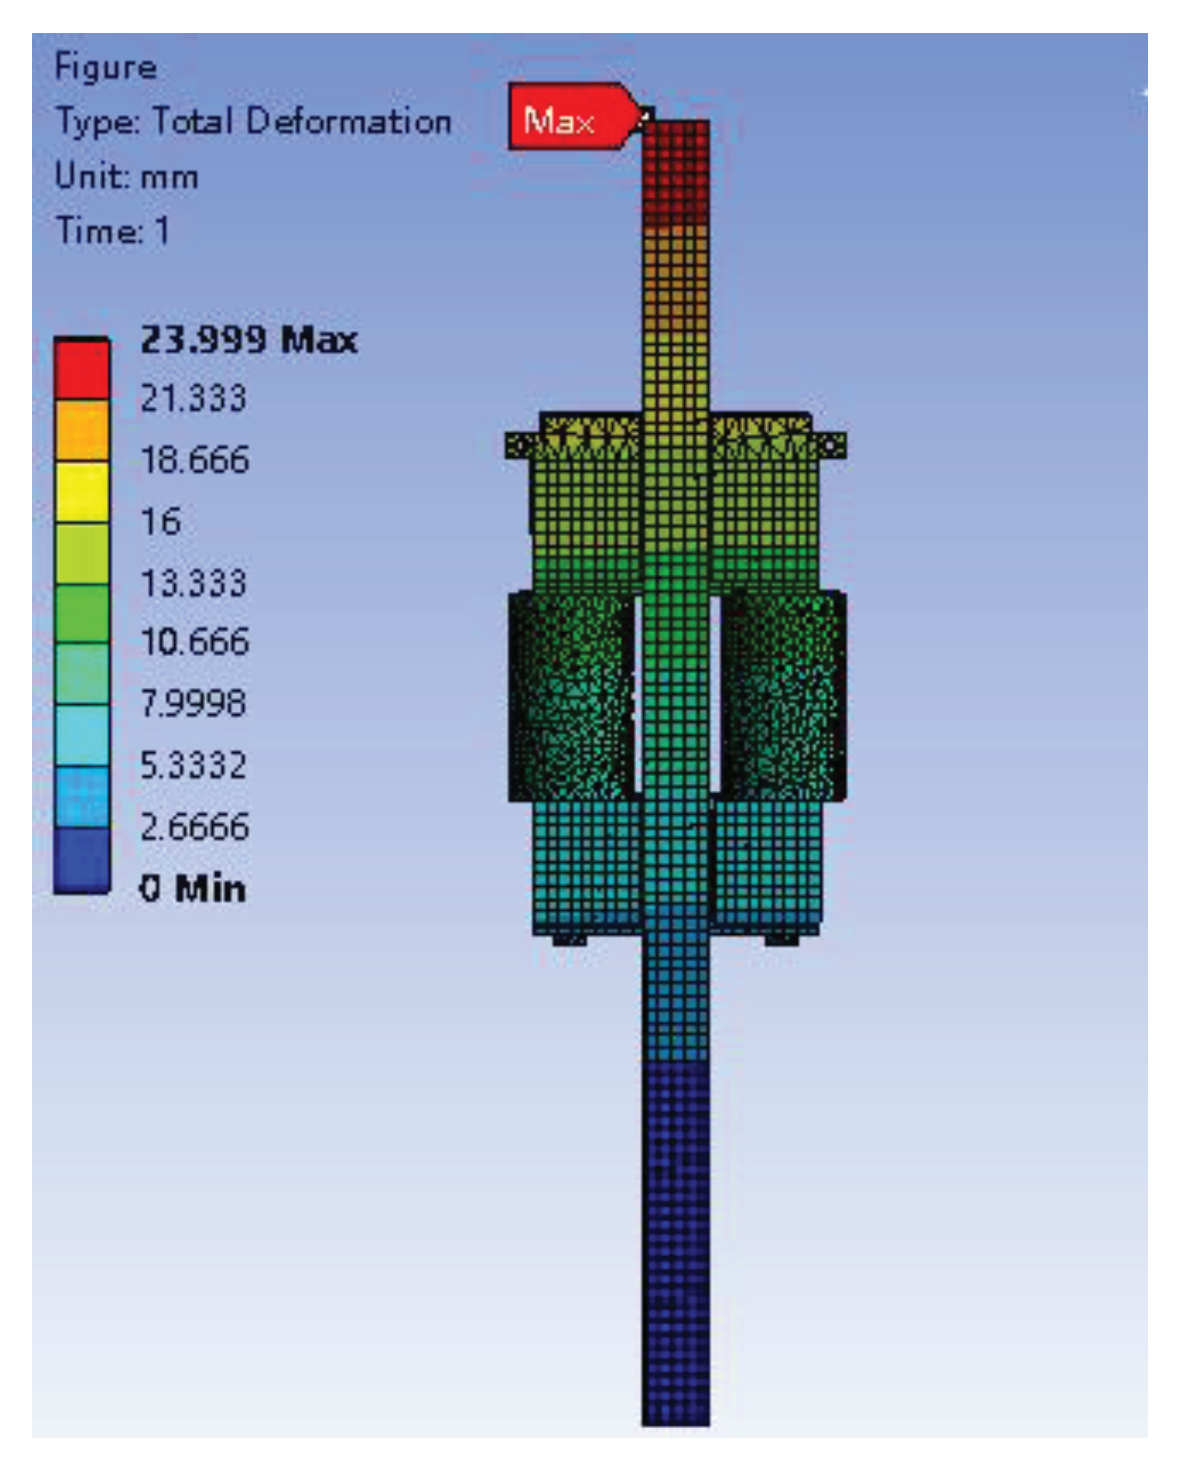
The hydraulic climbing mechanism's original model underwent static analysis and calculation, resulting in the deformation Cloud Diagram and stress Cloud Diagram depicted in
Figure 5 (original model stress Cloud Diagram) and
Figure 6 (original model deformation Cloud Diagram).
As shown in
Figure 5 and
Figure 6, the maximum deformation of the hydraulic climbing mechanism is 23.999mm, which is located on the top of the square steel; The maximum stress is 292.97MPa, located at the bottom edge of the wedge, which is less than the allowable stress of 392MPa for W18Cr4V; The maximum stress on the square steel is less than 162.71MPa, which is less than the allowable stress of Q345B 235MPa. The maximum stress of other parts is less than 205.96MPa, which is less than the allowable stress of 42CrMo 805MPa. The results show that the strength of the hydraulic climbing mechanism meets the design requirements.
Design Variables and Objective Functions
In ANSYS Workbench, the optimization target is set as the output parameter. When the hydraulic climbing mechanism is subjected to a load of 410 tons, the maximum stress plays a crucial role in the optimization design. Considering the load characteristics of the hydraulic climbing mechanism, the maximum deformation, maximum equivalent stress, and mass of the mechanism are chosen as the optimization objectives. The anchor block width (P1), anchor block thickness (P2), baffle thickness (P3), upper anchor plate thickness (P4), upper anchor plate width (P5), lower anchor plate thickness (P6), and lower anchor plate width (P7) are taken as the objective functions to constrain the structure. To reduce computational effort, these parameters are customized within the workbench's parameter set. Additionally, multiple design variables are simplified to five. The optimal design scheme is obtained by minimizing the mass of the optimized hydraulic climbing mechanism while ensuring its strength and stiffness. The theoretical model for optimal design of the hydraulic climbing mechanism can be summarized as follows:
Where:,;—yield strength;—safety factor;—strain;—mass;—Equivalent stress。
After defining the parameters the central composite design is chosen as the data analysis method [
19]. This results in the generation of nine groups of design points, and a mathematical model is constructed to impose the constraint conditions for the calculation. Following the computation, the data is presented in
Table 3.
Sensitivity Analysis of Design Variables
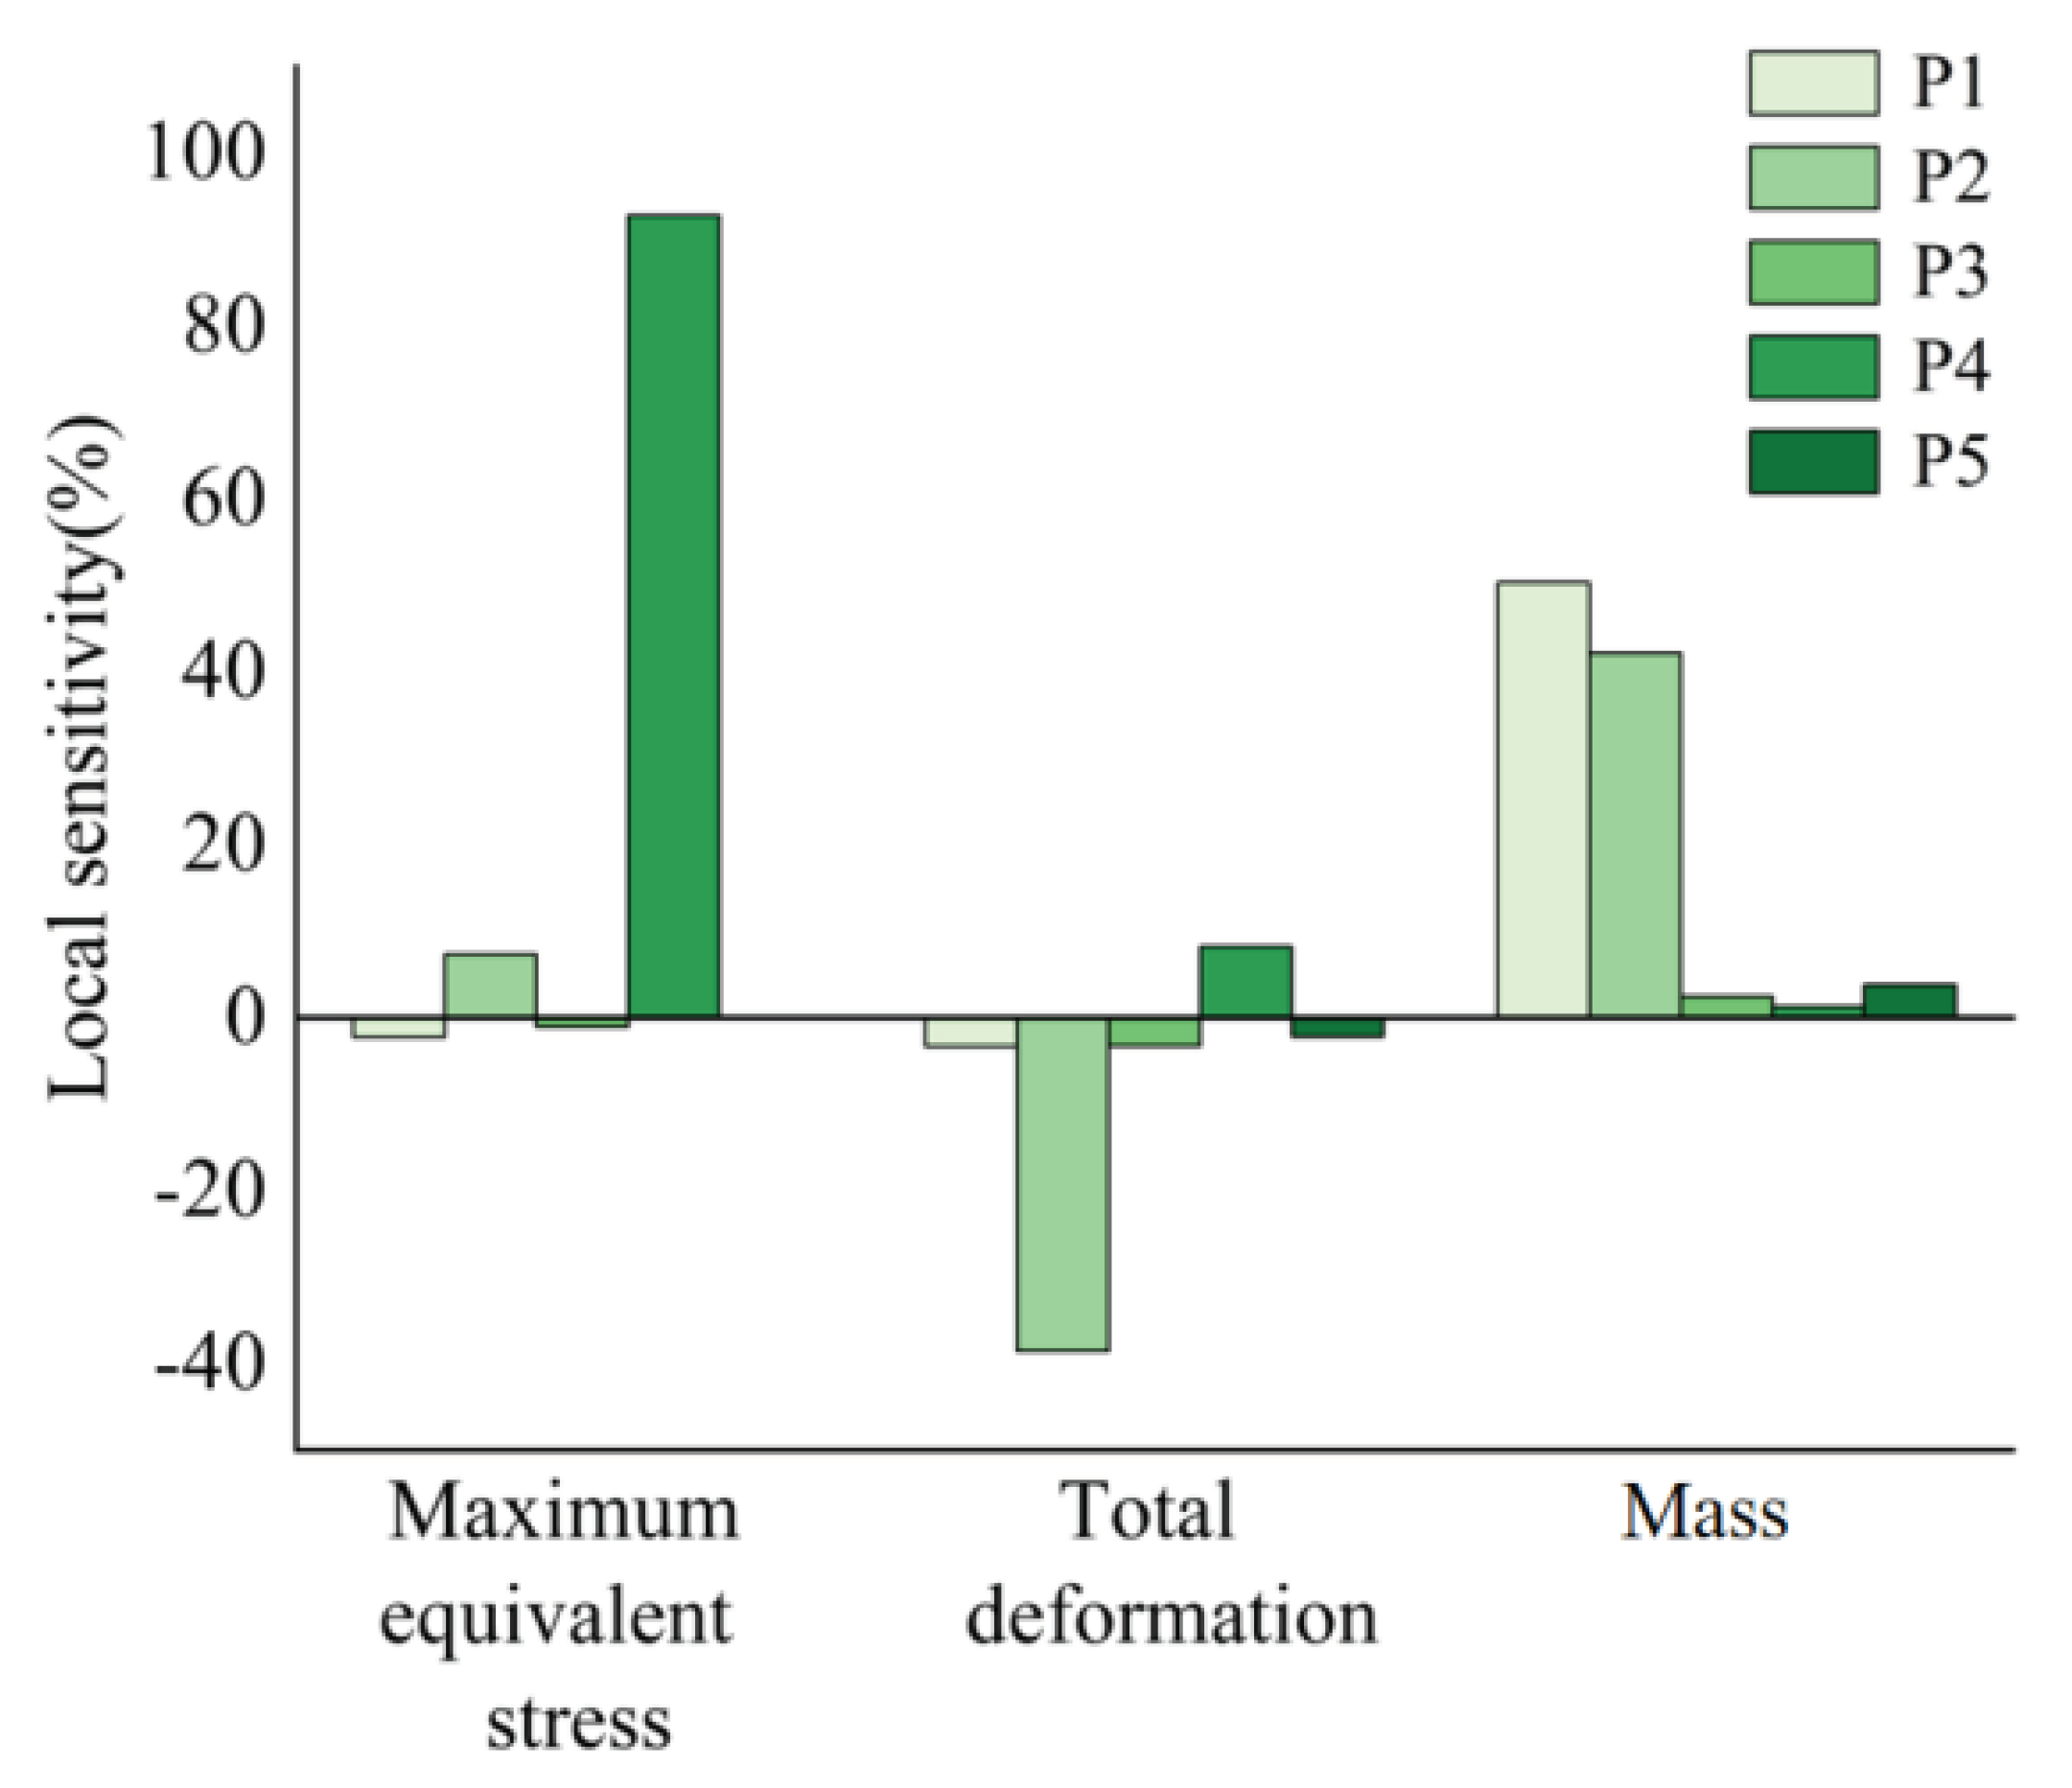
Figure 7 illustrates the local sensitivity of each output parameter, indicating the influence degree of design variables P1, P2, P4, P5, and P6 on the three output parameters. The analysis reveals that the thickness of the upper anchor plate and the thickness of the anchor block have a more significant impact on the maximum equivalent stress and total deformation. Additionally, the width and thickness of the anchor block significantly affect the mass.
Response Surface Analysis
The optimization algorithm employed in this study employs the Kriging [
20] method within the response surface system. This method combines accurate multidimensional interpolation with a polynomial model, similar to a standard response surface. The resulting model offers a "global" representation of the design space with local biases, enabling the Kriging model to interpolate Design of Experiment (DOE) points. A simulation model is established for Equation 1:
In the equation,
is the balance coefficient vector to be solved;
is to optimize the design point data. To achieve high-precision simulation of
vs
, the following equation needs to be established:
It can be concluded that the variance formed by the surrogate model with
as
is:
Where
is the correlation function of Gaussian kernel function,
In equation, the distance between the test point and the sample point;is the constant parameter of the kernel function in the direction of the sample point.
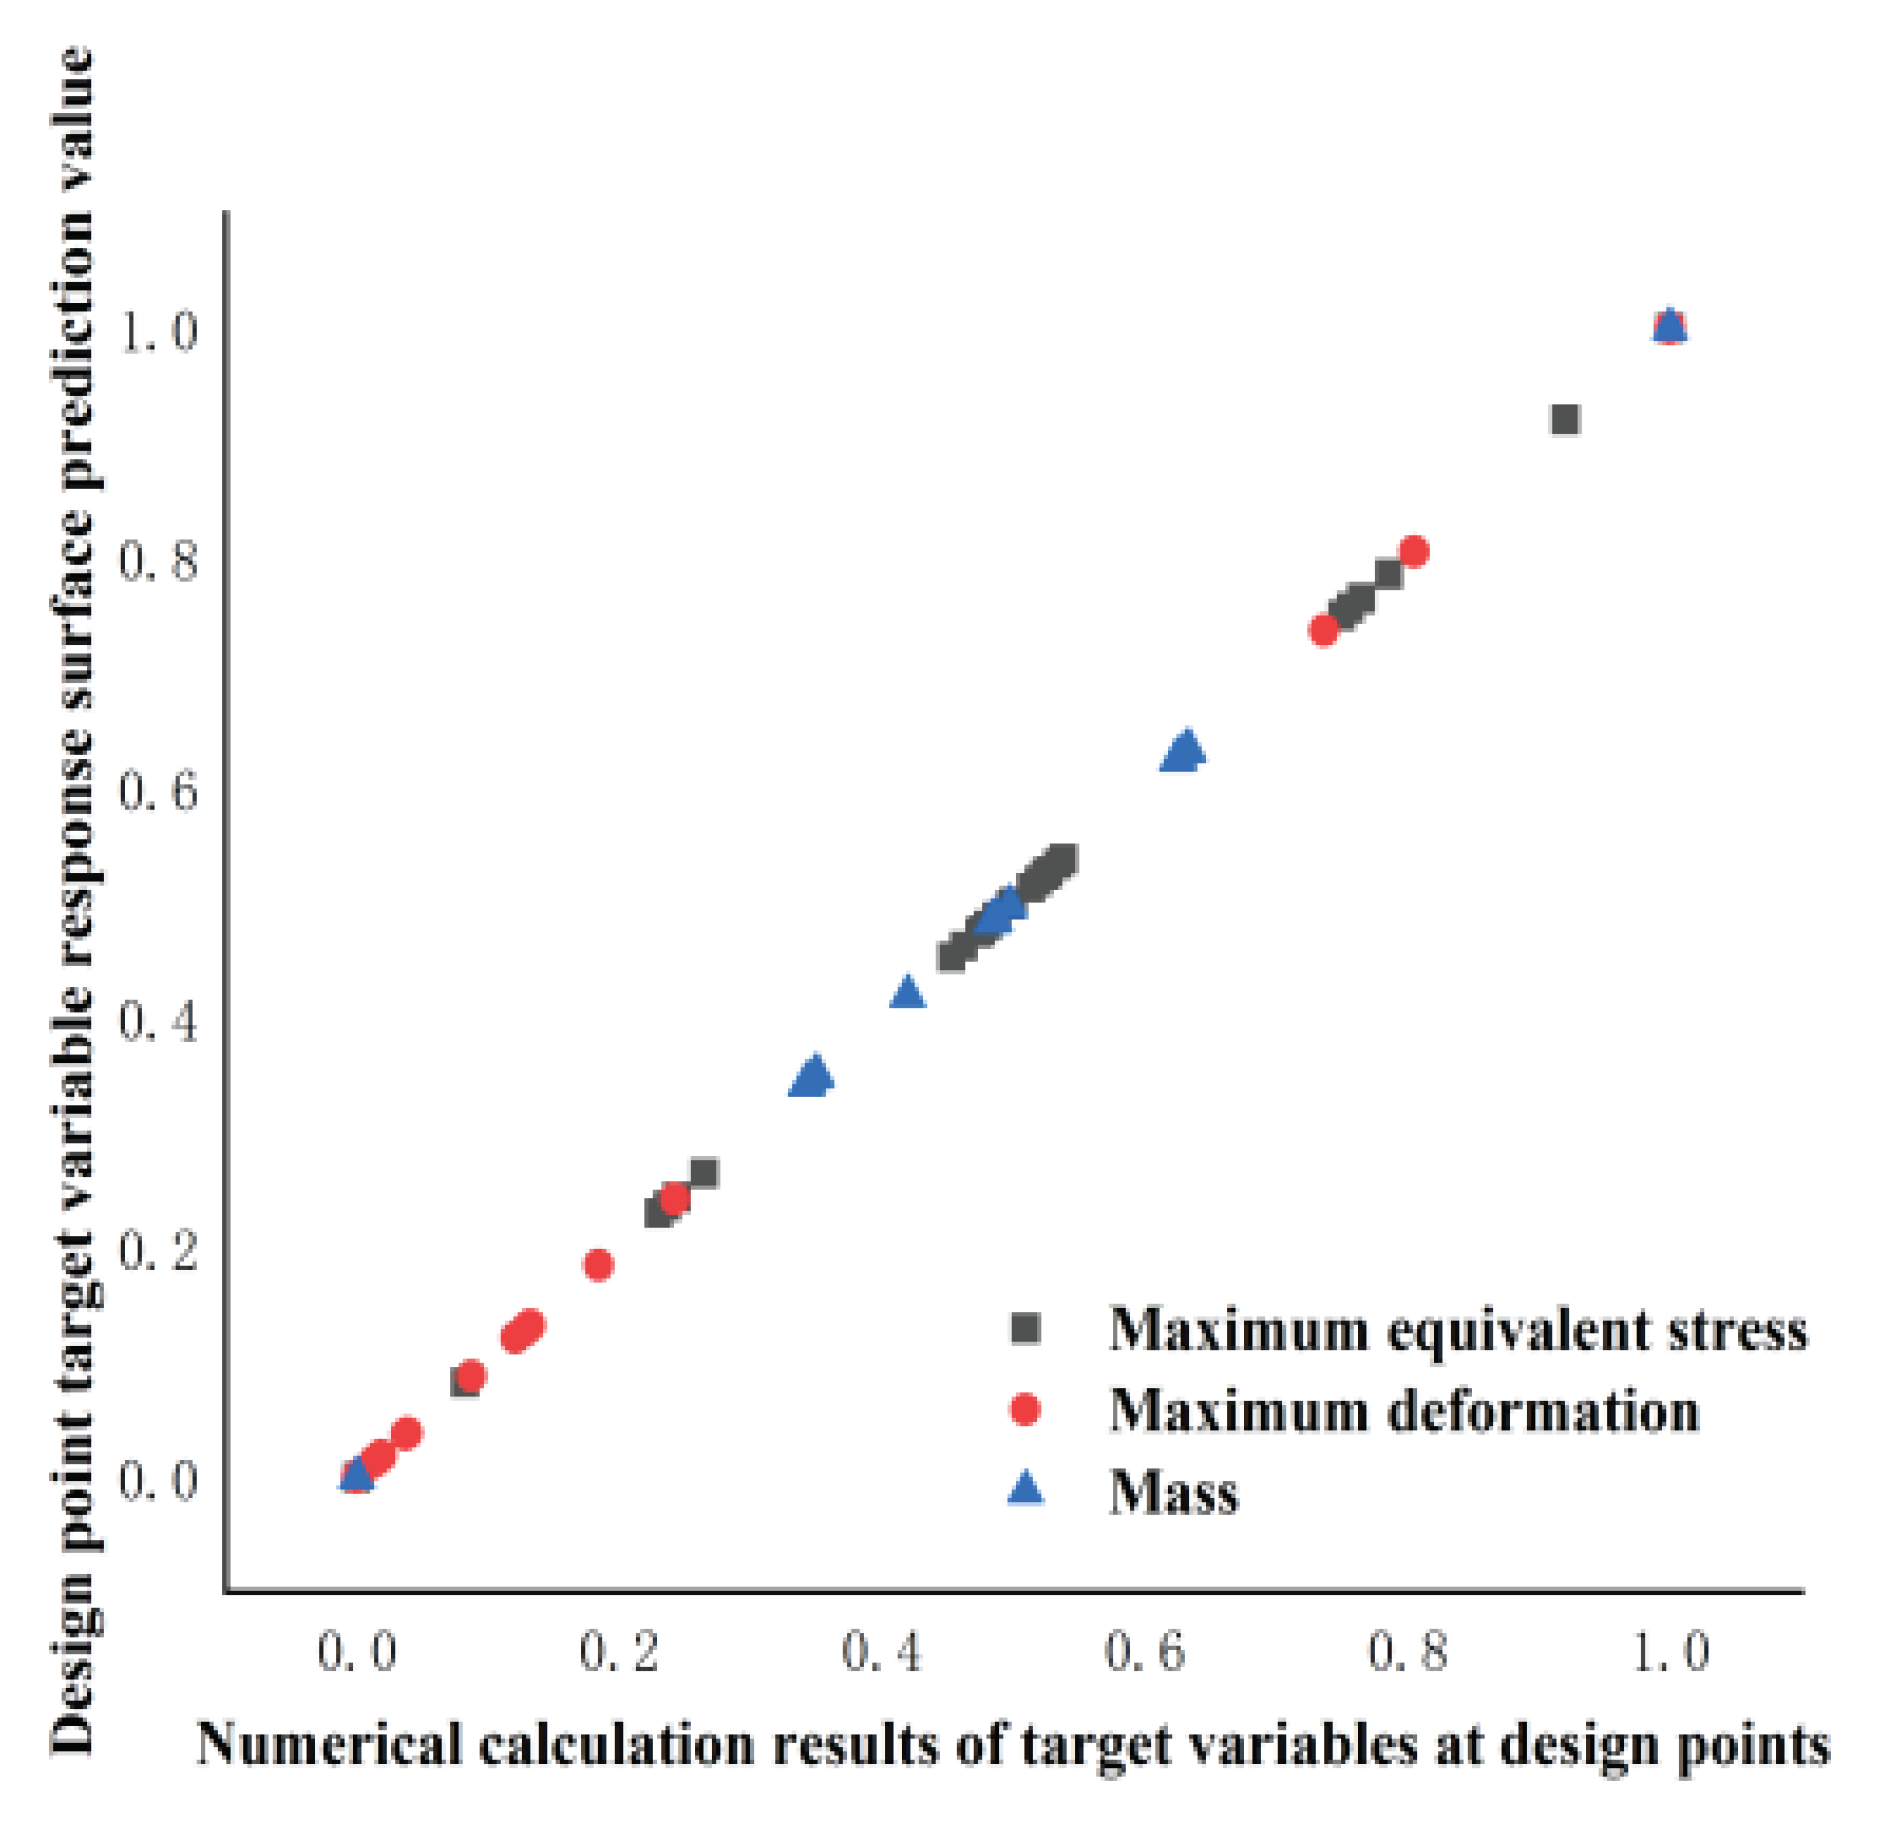
The aforementioned analysis highlights that the response surface model serves as an approximate alternative, necessitating the evaluation of its fit.
Figure 8 illustrates the fitting analysis of the established response surface, with the abscissa representing the actual observed values of the design points and the ordinate representing the predicted values of the response surface. As depicted in the figure, the maximum equivalent stress, maximum equivalent strain, and mass of the optimization objective are all closely aligned along the diagonal, indicating a correlation coefficient R2 approaching 1. This suggests that the mass of the established response surface meets the required standards.
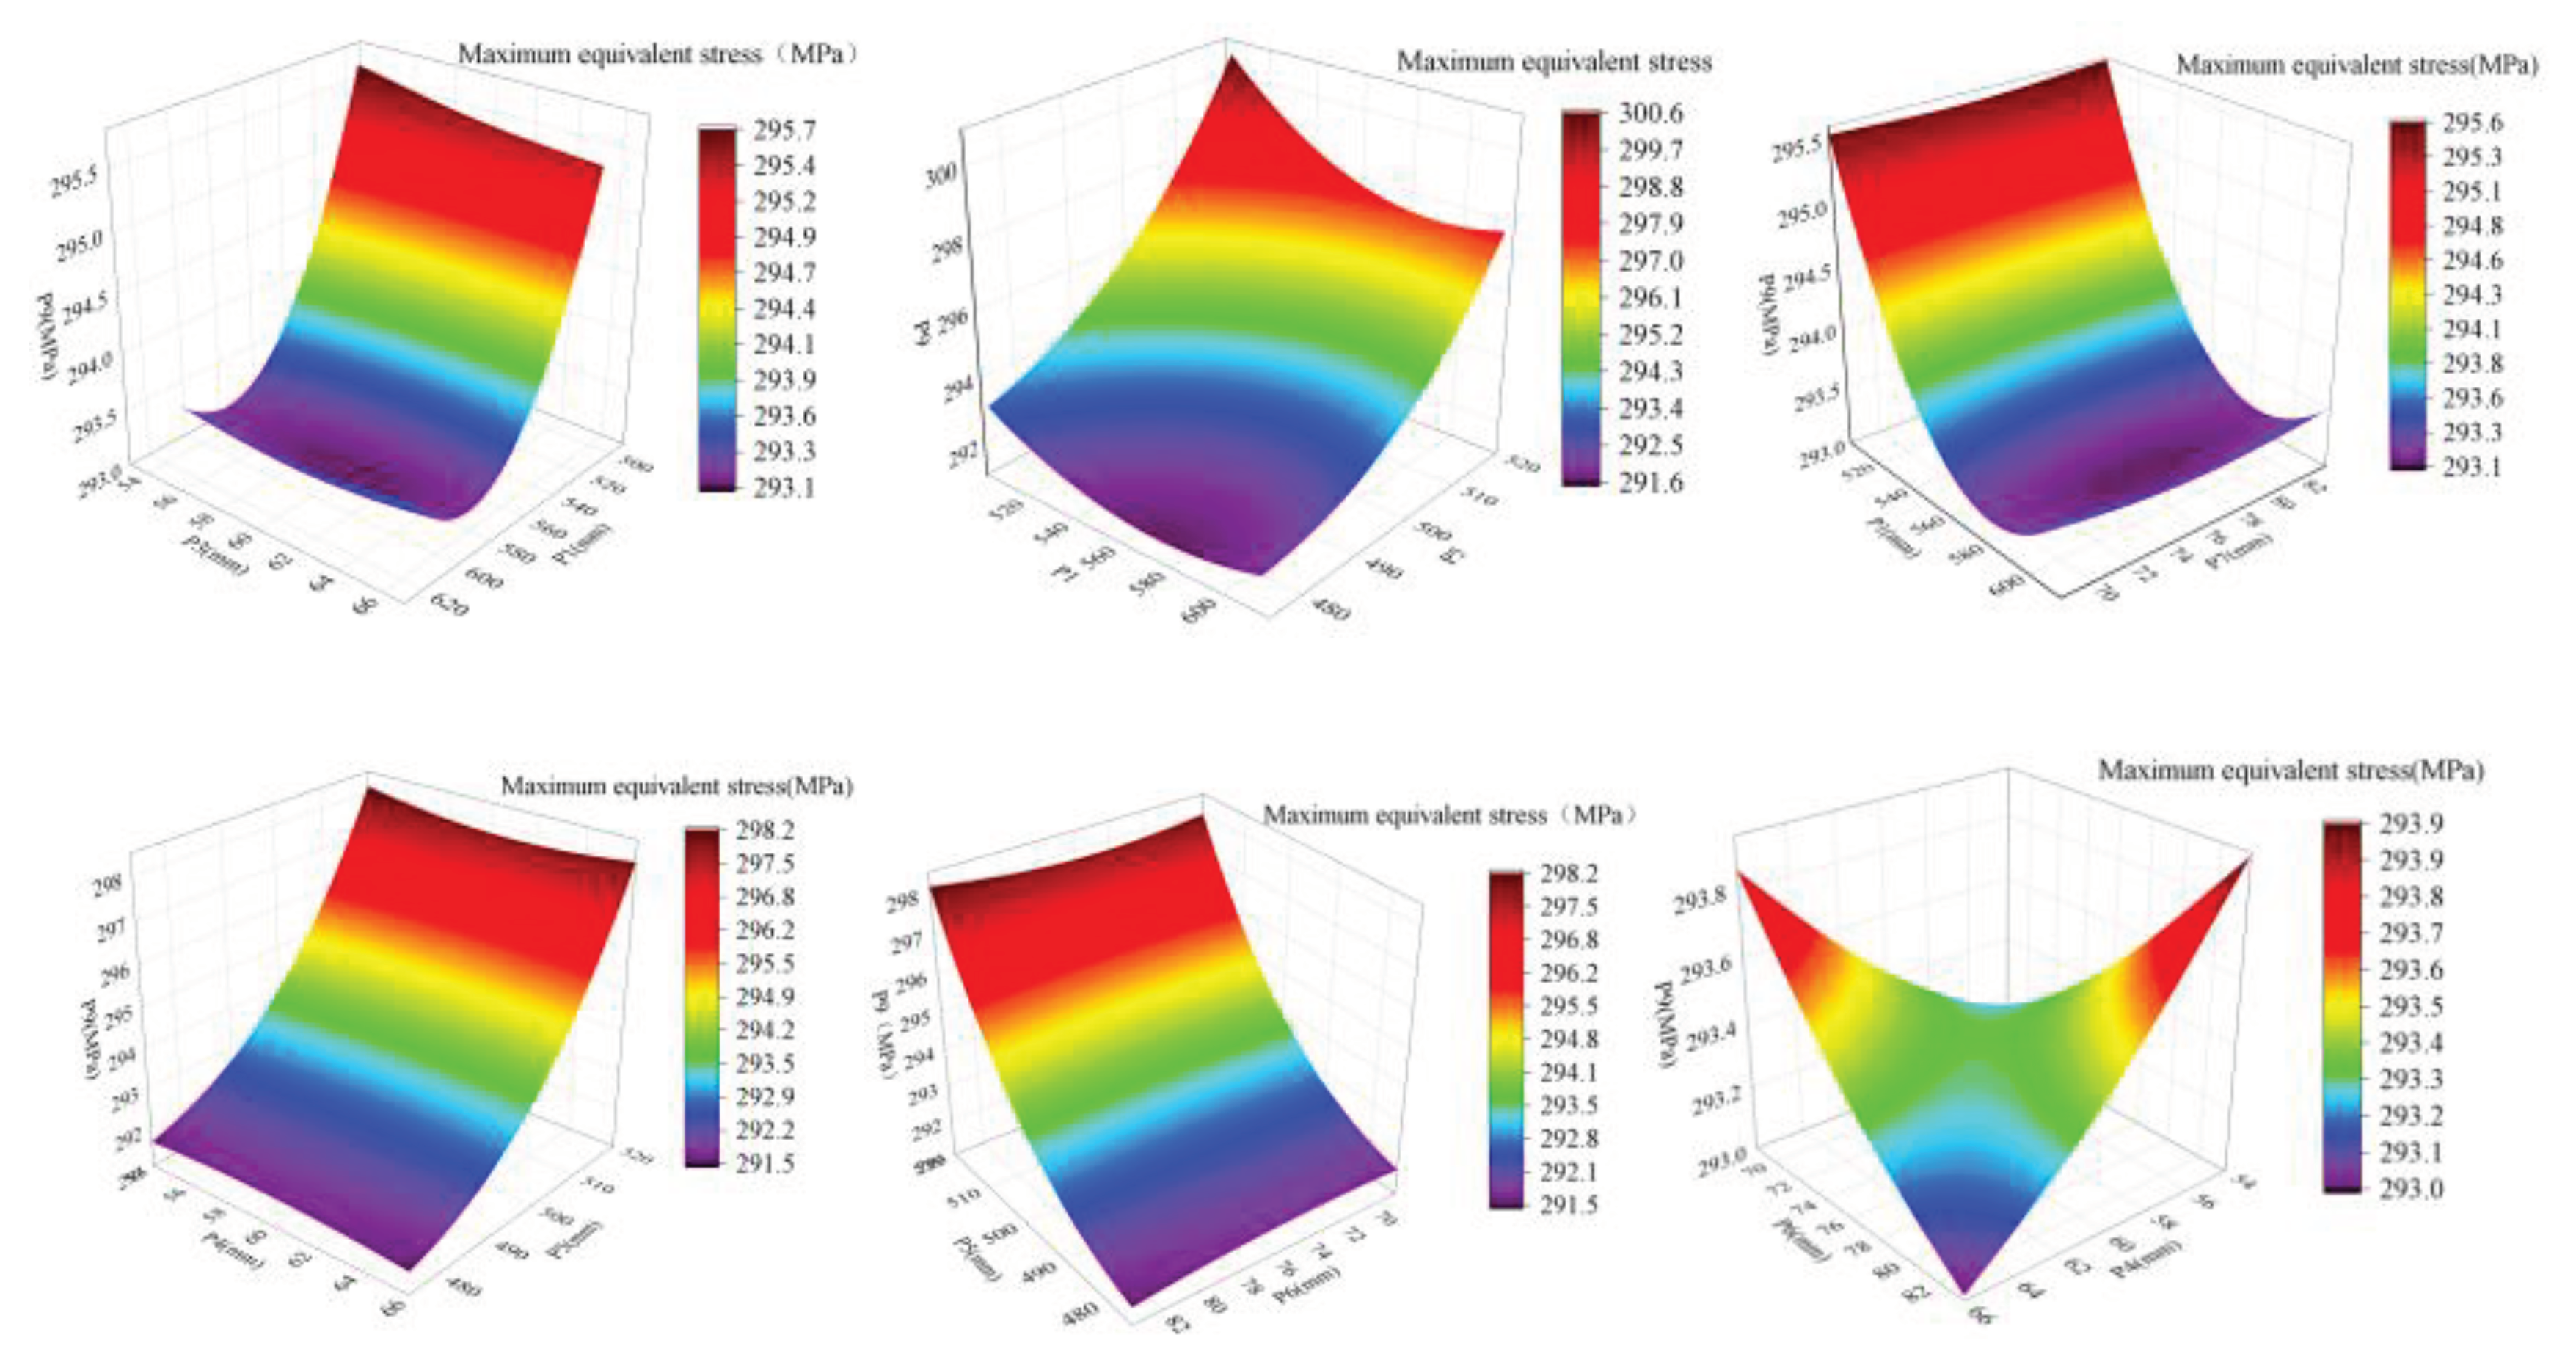
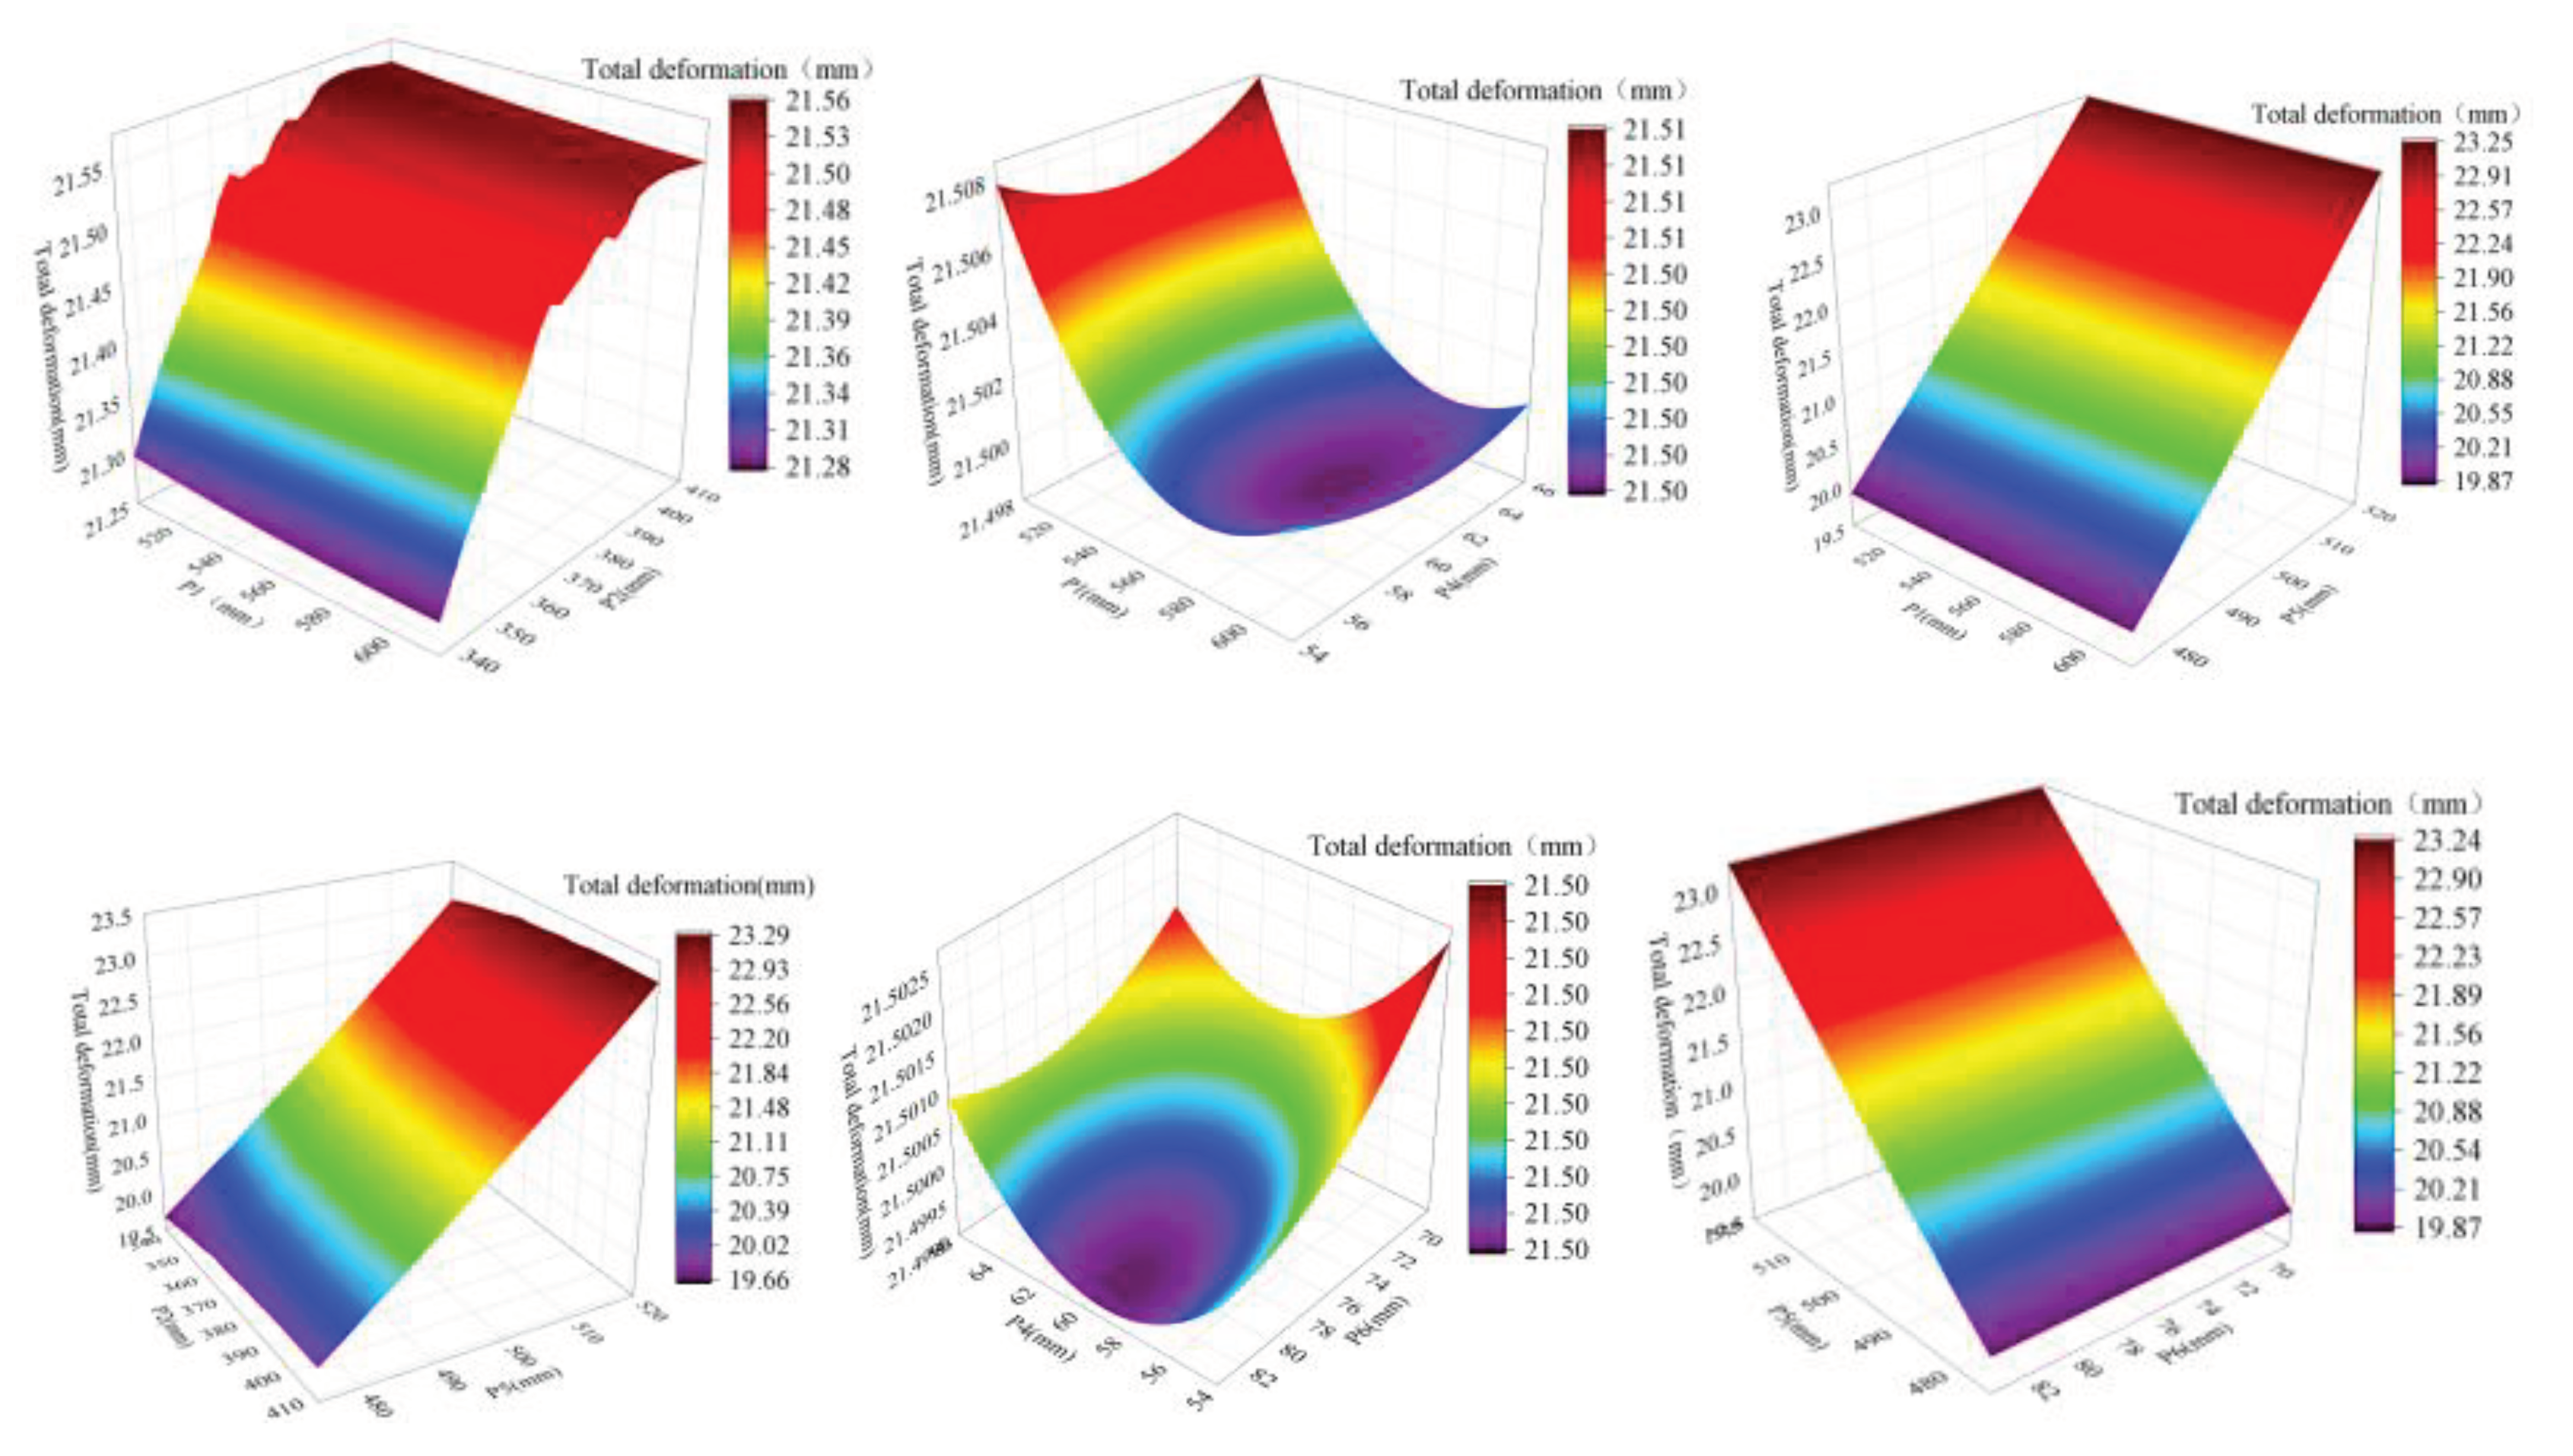
The response surface model is presented in a 3D graphical format. Two design variables are chosen as the x-axis and y-axis of the input parameters, while an optimization objective function is selected as the z-axis of the output parameters. The resulting response surface model is depicted in
Figure 9,
Figure 10 and
Figure 11, which illustrates the relationship between anchor block width (P1), anchor block thickness (P2), upper anchor plate thickness (P4), upper anchor plate width (P5), lower anchor plate thickness (P6), maximum equivalent stress, total deformation, and mass. As observed, maximum equivalent stress increases with an increase in anchor block width and upper anchor plate width. Total deformation rises with an increase in anchor block width, anchor block thickness, and upper anchor plate width. mass increases with an increase in anchor block width, anchor block thickness, upper anchor plate width, and lower anchor plate thickness. Notably, the width of the anchor block and upper anchor plate have the most significant impact on the overall
.system.
Validation of Optimization Results
After Kriging model is established and regarded as objective function, MOGA can be applied to find Pareto optimal solution. MOGA algorithm is a hybrid variant algorithm, which supports various types of input parameters and is a fast non dominated sorting method. Set the parameters of MOGA algorithm, as shown in
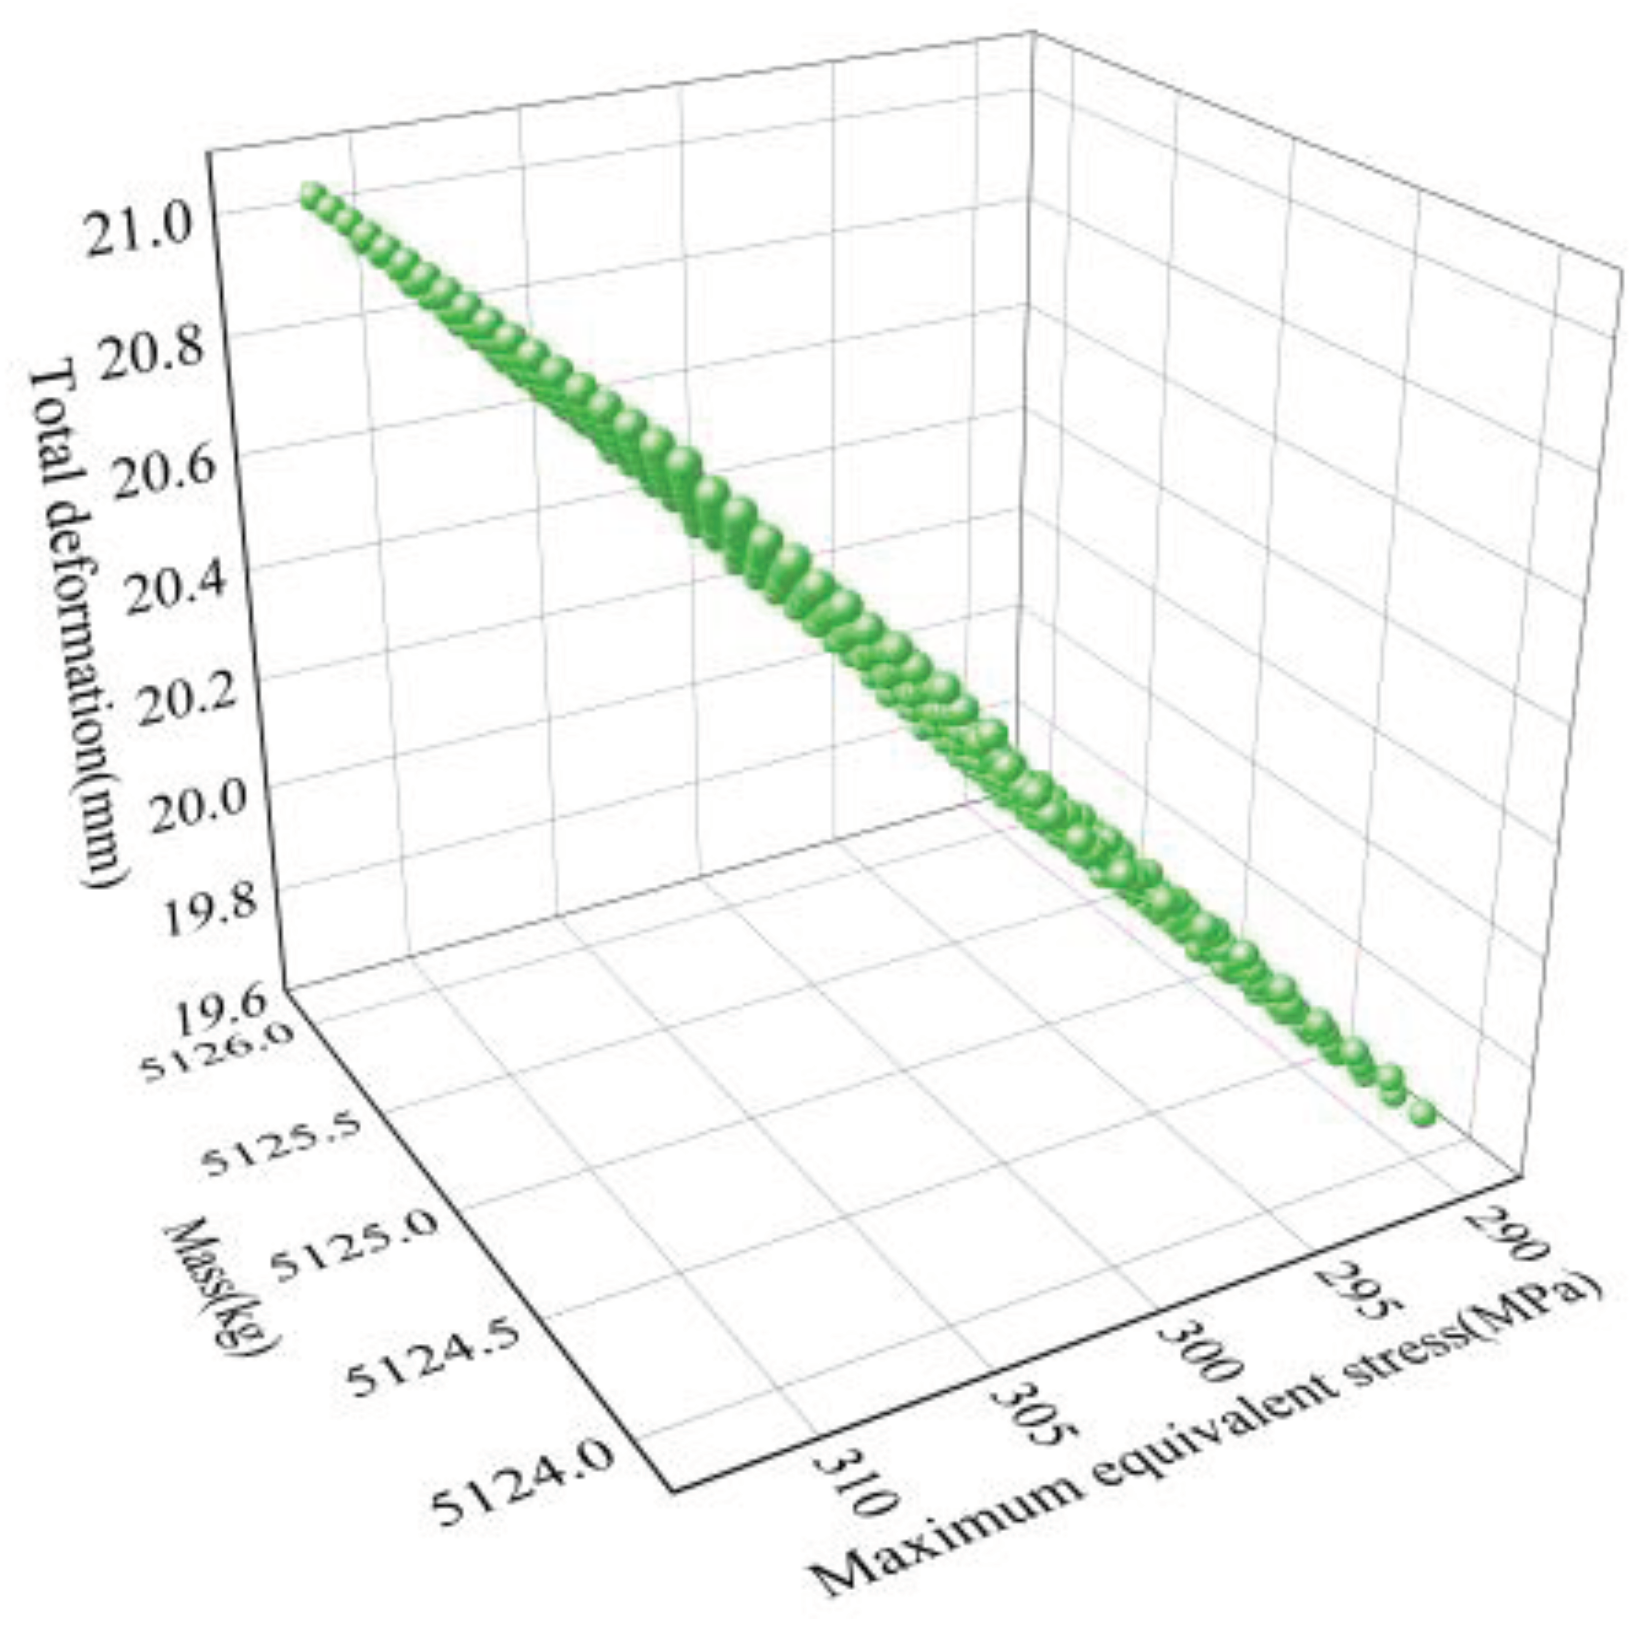
Table 4. In order to obtain the desired Pareto optimal solution, the response surface boundary conditions are set during the optimization process according to equation (5). The Pareto optimal solution as shown in
Figure 12 is obtained through multiple iterations, indicating that the optimization results are feasible [
21].
The optimization objective of the hydraulic climbing mechanism is set as the three state variables. With the constraint that the strength and stiffness of the hydraulic climbing mechanism meet the design requirements, optimal solutions for groups A, B, and C are obtained through calculation, as shown in
Table 5.
As shown in
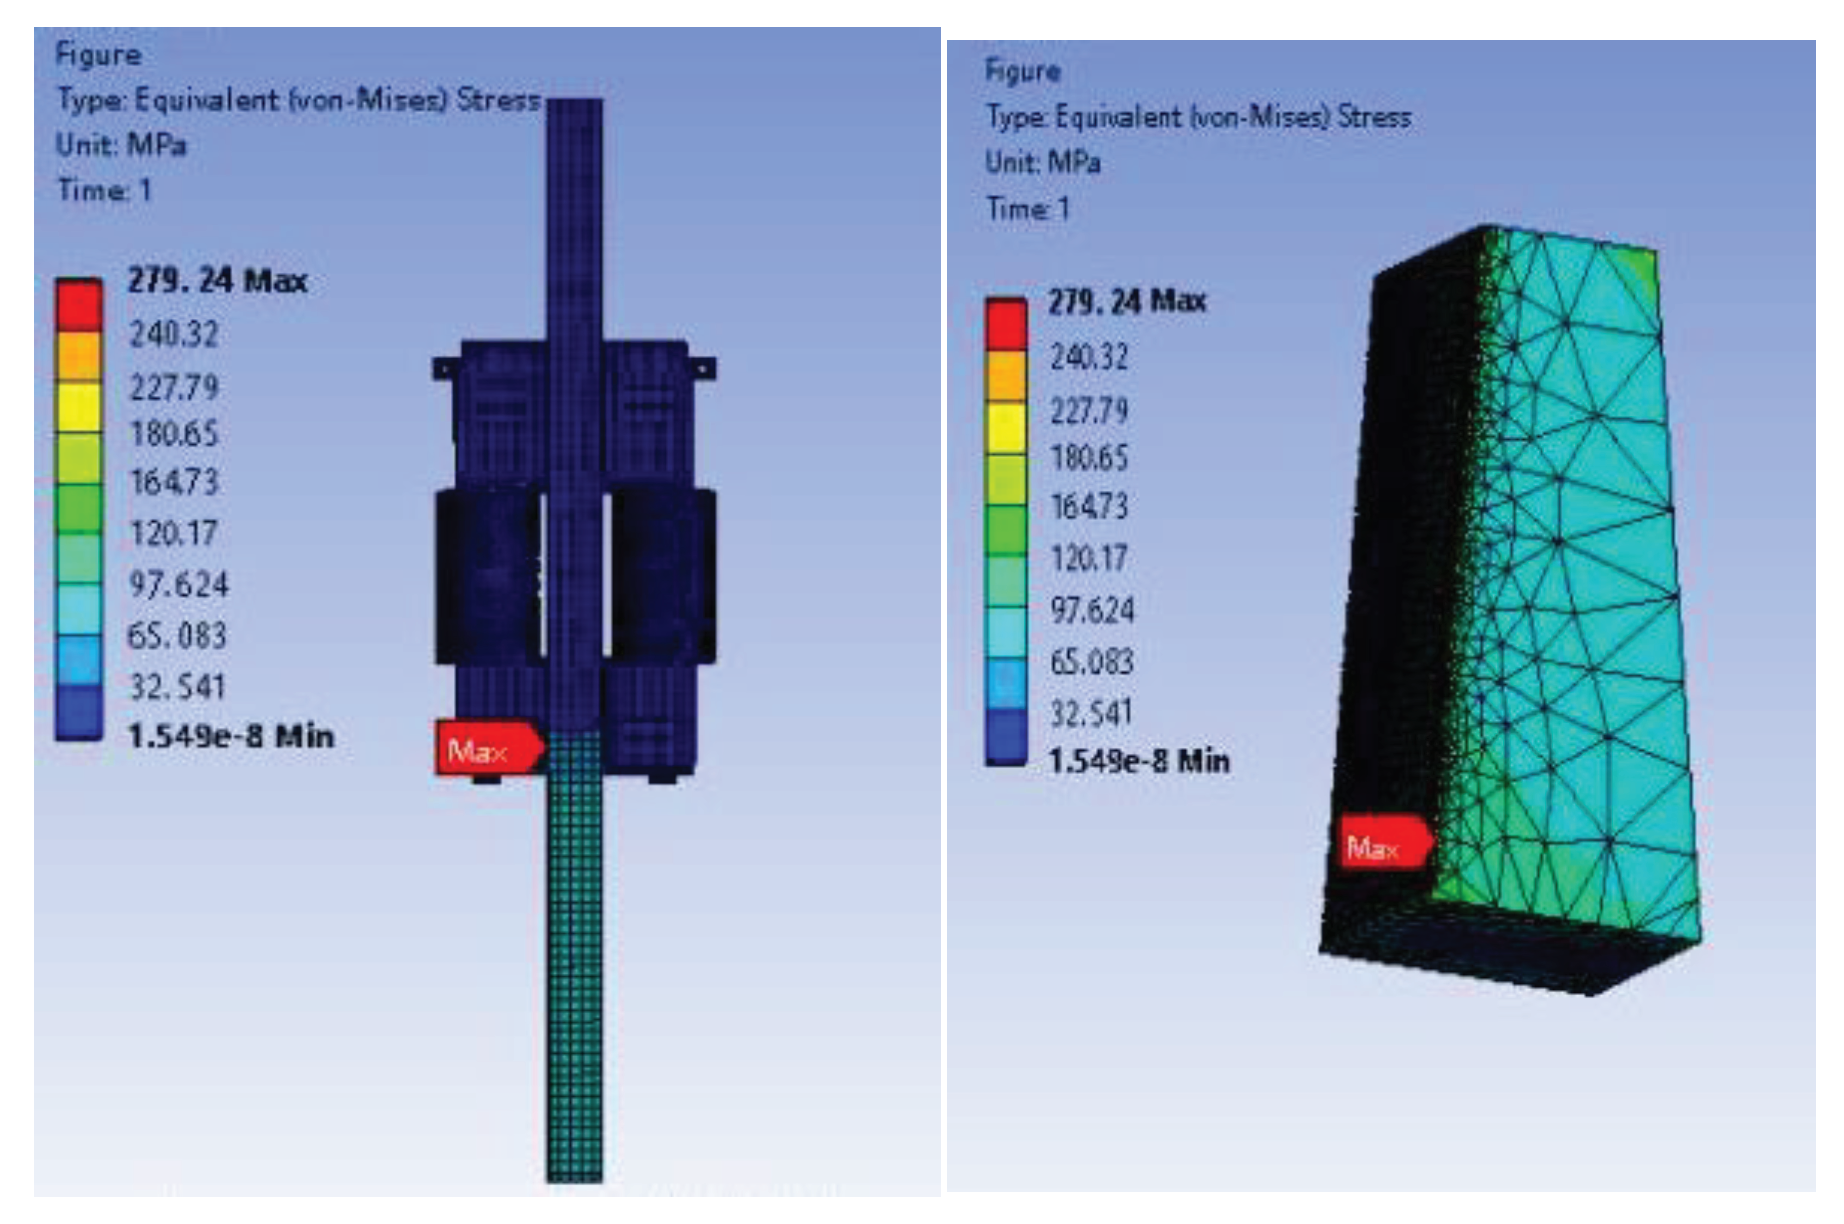
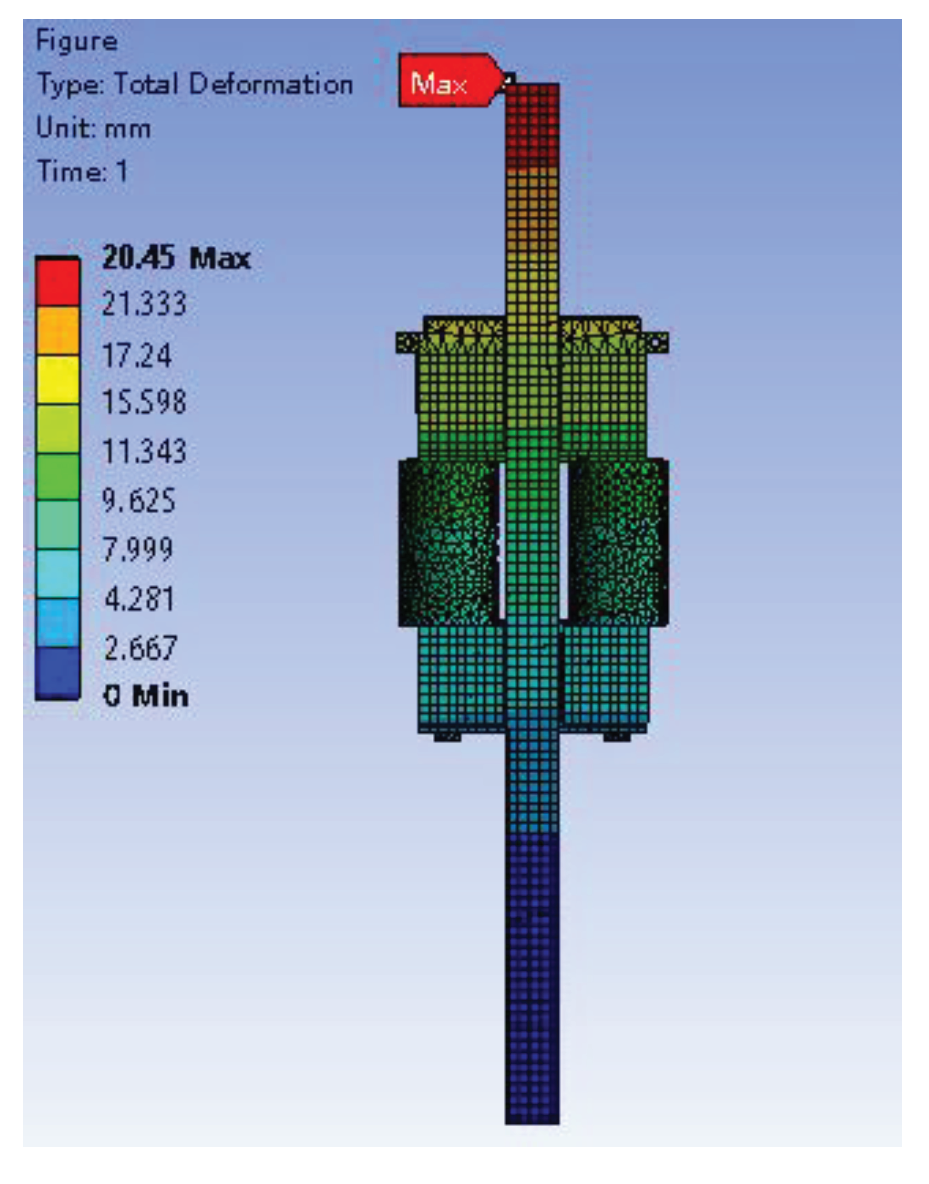
Table 5, the maximum equivalent stress of the hydraulic climbing mechanism after optimization and rounding is 279.24MPa, which is a 4.7% decrease compared to the initial value. The total deformation has reduced to 20.45mm, representing a 14.79% decrease from before optimization. Additionally, the geometric structure mass has decreased to 5125 tons, indicating a 10.28% reduction. These improvements have significantly enhanced the performance of the hydraulic climbing mechanism, fulfilling the multi-objective optimization design requirements for the product. The optimized results are presented in
Figure 13 and
Figure 14.
Conclusions
In this study, the hydraulic climbing mechanism as a whole was chosen as the research subject, and static analysis was conducted using ANSYS Workbench. The response surface analysis method was employed to optimize the dimensions of unreasonable parts. With mass, total deformation, and maximum equivalent stress as objective functions, central composite design was utilized for experimental design, leading to the establishment of a response surface optimization model based on the Kriging model. MOGA was applied to perform multi-objective optimization on the optimization model, and the best optimization result was selected.
The maximum equivalent stress of the optimized and rounded hydraulic climbing mechanism was found to be 279.24MPa, which was 4.7% lower than that before optimization. The total deformation had decreased to 20.45mm, representing a 14.79% reduction from before optimization. Additionally, the geometric structure mass had decreased to 5125 tons, indicating an 10.28% reduction. After optimization, the maximum equivalent stress appeared at the lower left edge of the wedge and decreased significantly, falling below the allowable yield strength. Furthermore, both the total deformation and mass had been considerably reduced. Finally, the hydraulic climbing mechanism was designed to be lightweight, reduce fabrication cost and improve material utilization while maintaining strength.
The influence of design variables on the objective function was fitted using response surface model, and the local sensitivity of the objective function to the design variables was investigated to verify the reliability of the optimization results. Compared with the traditional method, the optimized the hydraulic climbing mechanism comes with excellent performance, and the effectiveness of the optimization strategy is verified through practical production.
Declaration of conflicting interests
The author declared no potential conflicts of interest with respect to the research, authorship, and/or publication of this article.
Acknowledgments
This work was supported by the Guangxi key research program [2021AB03043].
References
- Abdel-Rahman E M, Nayfeh A H, Masoud Z N. Dynamics and control of cranes: A review[J]. Journal of Vibration and control 2003, 9, 863–908. [Google Scholar] [CrossRef]
- Kizilay D, Eliiyi D T. A comprehensive review of quay crane scheduling, yard operations and integrations thereof in container terminals[J]. Flexible Services and Manufacturing Journal 2021, 33, 1–42. [Google Scholar] [CrossRef]
- Ko S H, Lee K H, Lee C H. Safety Verification of Gantry Cranes using Hydraulic Cylinders[J]. Journal of Drive and Control 2019, 16, 8–14. [Google Scholar]
- Fan X, Wang P, Hao F F. Reliability-based design optimization of crane bridges using Kriging-based surrogate models[J]. Structural and Multidisciplinary Optimization 2019, 59, 993–1005. [Google Scholar] [CrossRef]
- Fan X, Bi X. Reliability-based design optimization for crane metallic structure using ACO and AFOSM based on China standards[J]. Mathematical Problems in Engineering 2015, 2015. [Google Scholar]
- Fan X N, Zhi B. Design for a crane metallic structure based on imperialist competitive algorithm and inverse reliability strategy[J]. Chinese Journal of Mechanical Engineering 2017, 30, 900–912. [Google Scholar] [CrossRef]
- Qu X, Xu G, Fan X, et al. Intelligent optimization methods for the design of an overhead travelling crane[J]. Chinese Journal of Mechanical Engineering 2015, 28, 187–196. [Google Scholar] [CrossRef]
- Kim, Jin Gon; Yoon, Hyun Joong; Park, Yong Kuk. Lightweight Optimal Design of Gantry Crane Using Taguchi Method[J]. Transactions of the KSME,A 2022, 46, 93–100. [Google Scholar] [CrossRef]
- Feng X, Jiang J, Feng Y. Reliability evaluation of gantry cranes based on fault tree analysis and Bayesian network[J]. Journal of Intelligent & Fuzzy Systems 2020, 38, 3129–3139. [Google Scholar]
- Zhang H, Wang J, Lu G. Hierarchical fuzzy-tuned multiobjective optimization control for gantry cranes[J]. Proceedings of the Institution of Mechanical Engineers, Part C: Journal of Mechanical Engineering Science 2014, 228, 1119–1131. [Google Scholar]
- Kim H J, Kim G N, Jeong C K, et al. Hydraulic system design and structural analysis of a BOP gantry crane[J]. Journal of Marine Science and Technology 2016, 24, 1. [Google Scholar]
- Jia J, Sun X, Liu T, et al. Structural Optimization Design of Dual Robot Gripper Unloading Device Based on Intelligent Optimization Algorithms and Generative Design[J]. Sensors 2023, 23, 8298. [Google Scholar] [CrossRef] [PubMed]
- Sun X, Liu T, Jia J, et al. Multi-objective optimization design of the Hinge Sleeve of Cubic based on Kriging[J]. Science Progress 2023, 106, 003685042312031 08. [Google Scholar] [CrossRef]
- Zrnić N Đ, Gašić V M, Bošnjak S M. Dynamic responses of a gantry crane system due to a moving body considered as moving oscillator[J]. Archives of Civil and Mechanical Engineering 2015, 15, 243–250. [Google Scholar] [CrossRef]
- Xiong L, Fan W. Maintenance Strategy for Steel Structures of Large Gantry Crane Based on Fatigue Reliability[J]. Journal of Performance of Constructed Facilities 2015, 29, 04014046. [Google Scholar] [CrossRef]
- Zhang D, Cheng W, Wang B. Variational analysis of mid-span deflection of gantry cranes[J]. Journal of Central South University 2017, 24, 2705–2716. [Google Scholar] [CrossRef]
- Kizilay D, Eliiyi D T. A comprehensive review of quay crane scheduling, yard operations and integrations thereof in container terminals[J]. Flexible Services and Manufacturing Journal 2021, 33, 1–42. [Google Scholar] [CrossRef]
- Jilu F, Zhili S, Hongzhe S. Optimization of structure parameters for angular contact ball bearings based on Kriging model and particle swarm optimization algorithm[J]. Proceedings of the Institution of Mechanical Engineers, Part C: Journal of Mechanical Engineering Science 2017, 231, 4298–4308. [Google Scholar]
- Choudhary S, Duvedi R K, Saini J S. Response surface methodology based parametric study for AISI H13 die steel using customized designed 3D printed Ti64 multi-nozzle polishing tool[J]. Proceedings of the Institution of Mechanical Engineers, Part C: Journal of Mechanical Engineering Science 2022, 236, 11479–11492. [Google Scholar]
- Ma X, Sun Z, Cui P, et al. Optimization of the welding process parameters of Mg–5Gd–3Y magnesium alloy plates with a hybrid Kriging and particle swarm optimization algorithm[J]. Proceedings of the Institution of Mechanical Engineers, Part C: Journal of Mechanical Engineering Science 2018, 232, 4038–4048. [Google Scholar]
- Farhang-Mehr A, Azarm S. Entropy-based multi-objective genetic algorithm for design optimization[J]. Structural and Multidisciplinary Optimization 2022, 24, 351–361. [Google Scholar]
|
Disclaimer/Publisher’s Note: The statements, opinions and data contained in all publications are solely those of the individual author(s) and contributor(s) and not of MDPI and/or the editor(s). MDPI and/or the editor(s) disclaim responsibility for any injury to people or property resulting from any ideas, methods, instructions or products referred to in the content. |
© 2024 by the authors. Licensee MDPI, Basel, Switzerland. This article is an open access article distributed under the terms and conditions of the Creative Commons Attribution (CC BY) license (http://creativecommons.org/licenses/by/4.0/).
