Submitted:
18 March 2024
Posted:
20 March 2024
You are already at the latest version
Abstract
Keywords:
Introduction
Topics and Results
1. Enhanced PLT Reactivity in Diabetic Patients Has Been Soon Considered as a “Pro-Thrombotic State”
2. Platelets Signaling /Abnormalities, Hyperaggregation and Signaling Abnormalities in Patients with DM2 Play Crucial Role in Thrombotic (Clots Formation) Complications and Thromboembolism during DM2 Micro- and Macroangiopathies
3. Hyperglycemia Contributes to the Elevated PLTs Reactivity (Hyperactivation)
4. Platelet to Lymphocyte Ratio (P/L)
| PLTs – platelets count | 140 - 440 x 109 /L |
| MPV - mean platelet volume (MPV) | 7.80 – 11.0 fL |
| PDW - platelet distribution width | 15,5% - 30,5% |
5. Hematological/Hematometrical Investigations, Related to Metabolic/Glycemic Control of DM2
6. Computational Platelets Modeling in DM2
7. Combined Properties of Diabetic RBCs and PLTs Indices
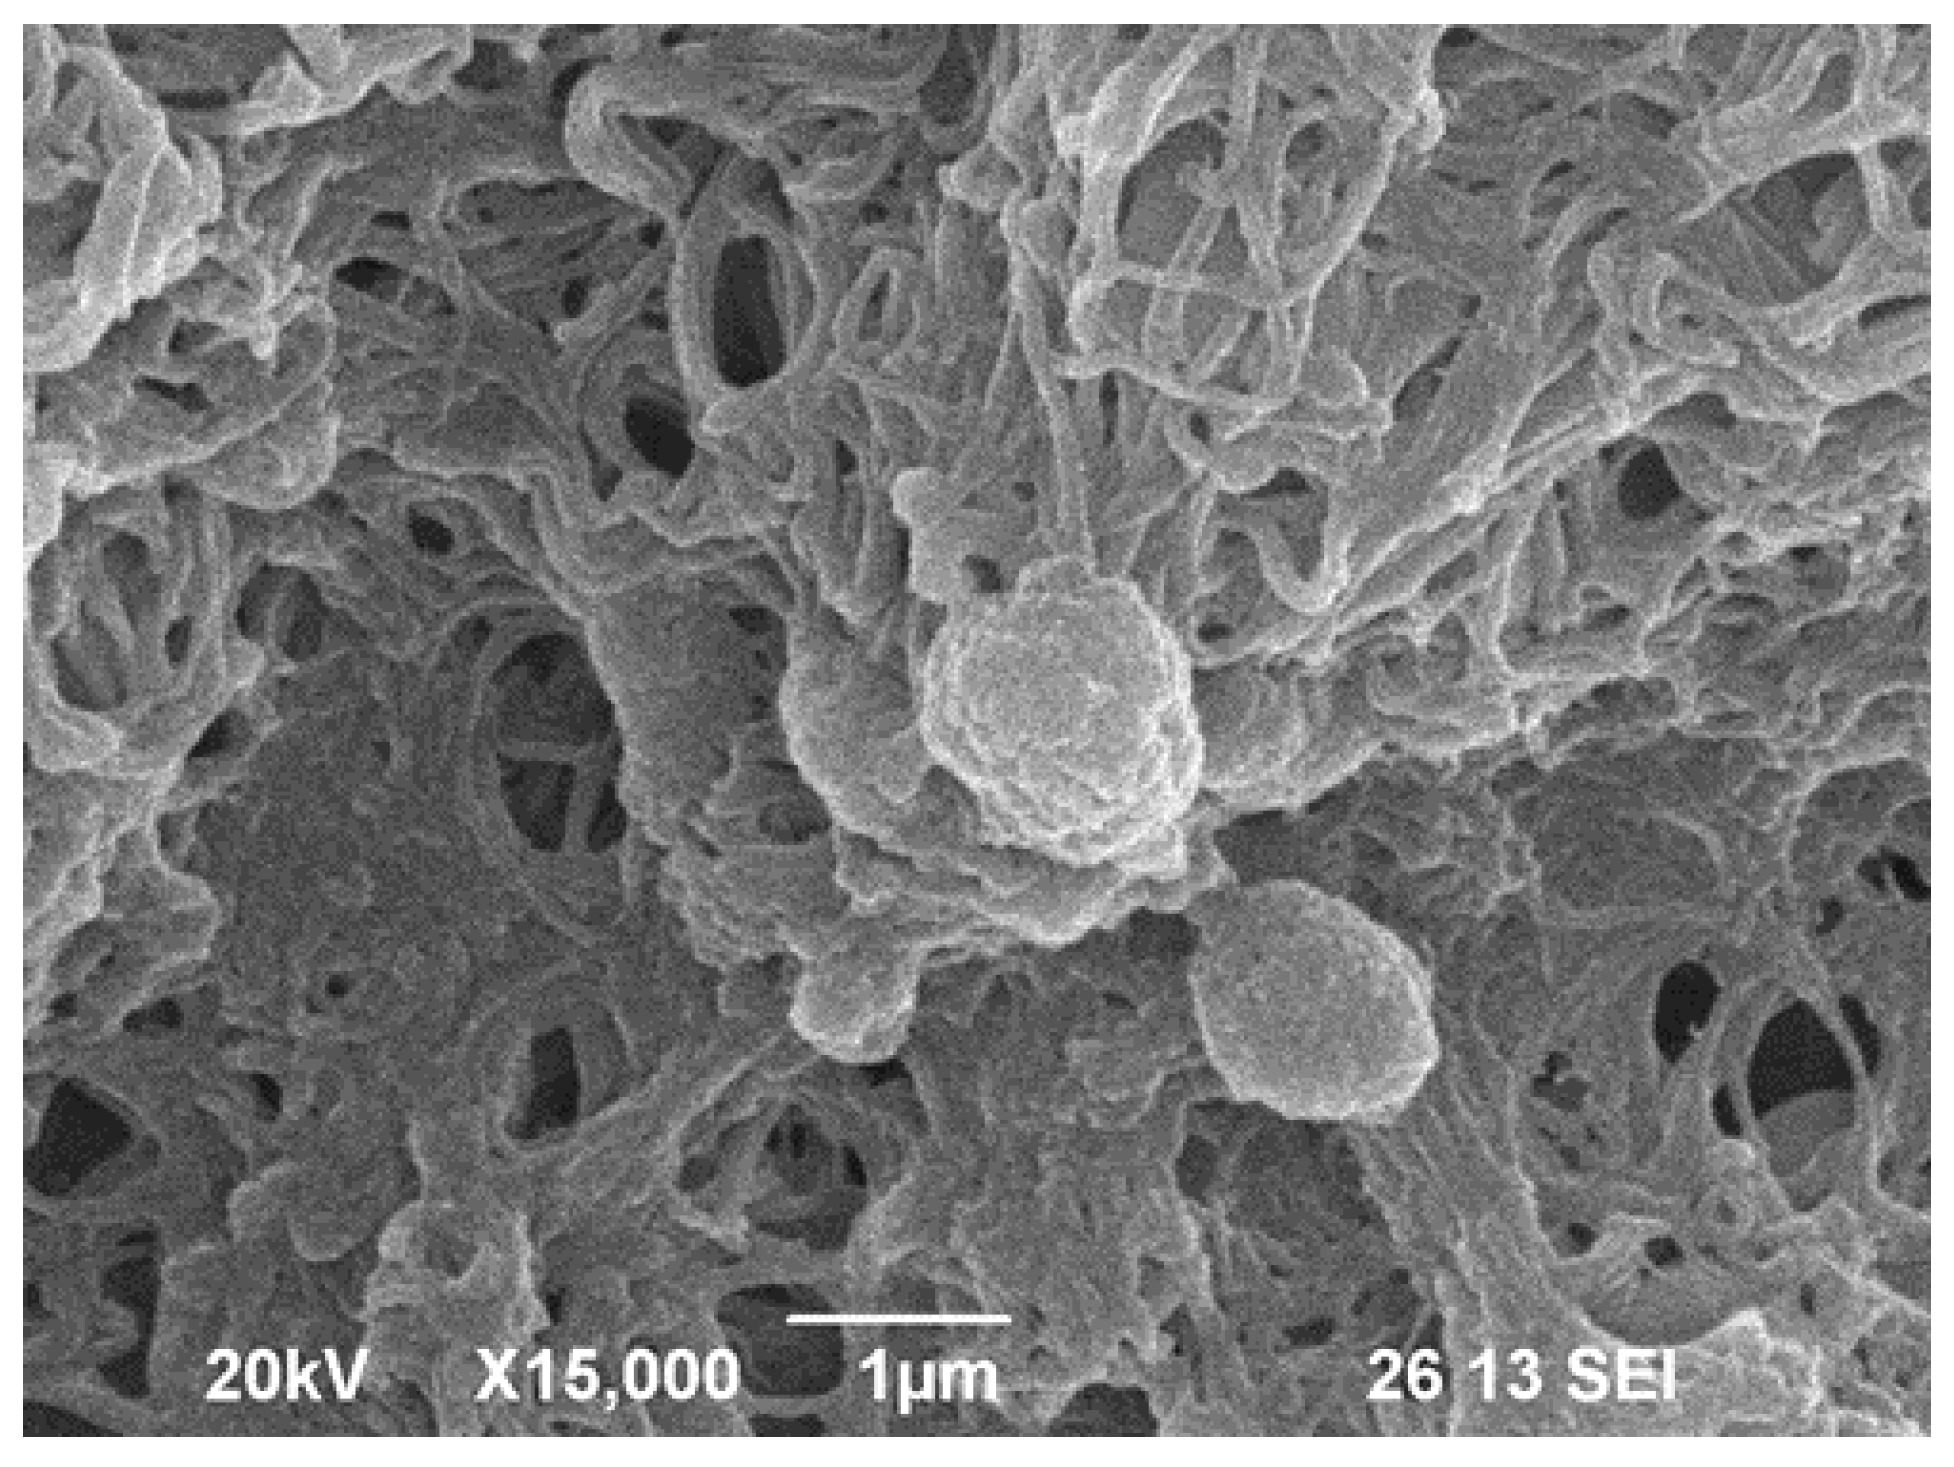
8. PLT-Derived microRNAs Are Novel Biomarkers for Early Diagnosis and Prognosis of Type 2 Diabetes Mellitus
9. Limitations
10. Conclusions
Acknowledgment
References
- Windberger, U.; Dibiasi, C.; Lotz, E.; Scharbert, G.; Reinbacher-Koestinger, A.; Ivanov, I.; Ploszczanski, L.; Antonova, N.; Lichtenegger, H. The effect of hematocrit, fibrinogen concentration and temperature on the kinetics of clot formation of whole blood. Clinical Hemorheology and Microcirculation 2020, 75, 431–445. [Google Scholar] [CrossRef] [PubMed]
- Reinhart, W.H. Platelets in vascular disease. Clinical Hemorheology and Microcirculation 2013, 53, 71–79. [Google Scholar] [CrossRef] [PubMed]
- Battinelli, E.M.; Markens, B.A.; Italiano, J.E., Jr. Release of angiogenesis regulatory proteins from platelet alpha granules: modulation of physiologic and pathologic angiogenesis. Blood, The Journal of the American Society of Hematology 2011, 118, 1359–1369. [Google Scholar] [CrossRef]
- Zvetkova, E.; Antonova, N.; Ivanov, I.; Savov, Y.; Gluhcheva, Y. Platelet morphological, functional and rheological properties attributable to addictions. Clinical hemorheology and microcirculation 2010, 45, 245–251. [Google Scholar] [CrossRef] [PubMed]
- Munnix, I.C.; Cosemans, J.M.; Auger, J.M.; Heemskerk, J.W. Platelet response heterogeneity in thrombus formation. Thromb. Haemost. 2009, 102, 1149–1156. [Google Scholar] [PubMed]
- Petrochenko, E.P.; Tikhomirova, I.A.; Ryabov, M.M.; Kislov, N.V.; Petrochenko, A.S. Platelet hemostasis in patients with non-myeloid cancer. Series on Biomechanics 2015, 29. [Google Scholar]
- Nomura, S. Function and clinical significance of platelet-derived microparticles. Int. J. Hematol. 2001, 74, 397–404. [Google Scholar] [CrossRef] [PubMed]
- George, J.N.; Thoi, L.L.; McManus, L.M.; et al. , Isolation of human platelet membrane microparticles from plasma and serum. Blood 1982, 60, 834–840. [Google Scholar] [CrossRef]
- Alexandrova, A.; Antonova, N.; Kyulavska, M.; Velcheva, I.; Ivanov, I.; Zvetkova, E. Hemorheological and atomic force microscopy studies on the experimental clot formation in patients with type 2 diabetes mellitus. Series on Biomechanics 2018, 32, 63–73. [Google Scholar]
- Pretorius, E.; Bester, J.; Vermeulen, N.; Alummoottil, S.; Soma, P.; Buys, A.V.; Kell, D.B. Poorly controlled type 2 diabetes is accompanied by significant morphological and ultrastructural changes in both erythrocytes and in thrombin-generated fibrin: implications for diagnostics. Cardiovascular diabetology 2015, 14, 1–20. [Google Scholar] [CrossRef]
- Andreeva, T.; Komsa-Penkova, R.; Langari, A. Morphometric and nanomechanical features of platelets from women with early pregnancy loss provide new evidence of the impact of inherited thrombophilia. Int. J. Mol. Sci. 2021, 22, 7778. [Google Scholar] [CrossRef]
- Yuan, H.; Liu, Y.; Zhang, J.; Dong, J.F.; Zhao, Z. Transcription factors in megakaryocytes and platelets. Frontiers in Immunology 2023, 14, 1140501. [Google Scholar] [CrossRef] [PubMed]
- El Haouari, M.; Rosado, J.A. Platelet signalling abnormalities in patients with type 2 diabetes mellitus: A review. Blood Cells, Molecules, and Diseases 2008, 41, 119–123. [Google Scholar] [CrossRef] [PubMed]
- Kubisz, P.; Stančiaková; L; Staško, J. ; Galajda, P.; Mokáň; M Endothelial and platelet markers in diabetes mellitus type 2. World Journal of Diabetes 2015, 6, 423. [Google Scholar] [CrossRef] [PubMed]
- Swathi, M.; Ramya, T.; Gangaram, U.; Kumar, K.K.; Sandeep, B. A study of neutrophil to lymphocyte ratio (NLR) and platelet to lymphocyte ratio (PLR) with glycosylated hemoglobin (HBA1C) among type 2 diabetic patients. Int.J. Acad. Med. Pharm. 2023, 5, 1533–1537. [Google Scholar]
- Xu, F.; et al. Mean platelet volume (MPV) new diagnostic indices for co-morbidity of tuberculosis and diabetis mellitus. BMC Infectious Diseases, 2021, 21, article number :461 https// doi.org/10.1186/s12879–021. [Google Scholar] [CrossRef]
- Pujani, M.; Gahlawat, H.; Agarwal, C.; Chauhan, V.; Singh, K.; Lukhmana, S. Platelet parameters: Can they serve as biomarkers of glycemic control or development of complications in evaluation of type 2 diabetes mellitus. Iraqi J Hematol 2018, 7, 72–78. [Google Scholar]
- Alhadas, K.R.; Santos, S.N.; Freitas, M.M.S. Are platelet indices useful in the evaluation of type2 diabetic patients? J.Bras.Pathol.Med.Lab. 52/2, 2016. [CrossRef]
- Joshi, A.A.; Jaison, J. The study of platelet parameters - mean platelet volume (MPV) and platelet distribution width (PDW) in type 2 Diabetes mellitus. Lab Med 8/6, 2019. [CrossRef]
- Olana; Seifu; Menon; M. K. C.; Natesan Abnormal hematological indices and anthropometric parameters associated with type 2 Diabetes. Int J Biomed Adv Res 2019, 10, 1–8.
- Shilpi, K.; Potekar, R.M. A study of platelet indices in Type 2 diabetes mellitus patients. Indian J Hematol Blood Transfus 2018, 34, 115–120. [Google Scholar] [CrossRef]
- Orum, M.H.; Kara, M.Z.; Egilmez, O.B.; Kalenderoglu, A. Complete bood count alterations due to the opioid use: what about the lymphocyte-related ratios, especially in monocytе to lymphocyte ratio аnd platelet to lymphocyte ratio? Journsl of Immunoassay, and Immunochemistry, 2018. [CrossRef]
- Zvetkova, E.; Kostov, G. Extracellular RNA Biomarkers: New Development of Old Conception. Clinical Immunology 2010, S81. [Google Scholar] [CrossRef]
- Zhou, X.; Zhou, X.; Zhu, R.; Ming, Z.; Cheng, Z.; Hu, Y. The mechanism of oleic acid inhibiting platelet activation stimulated by collagen. Cell Communication and Signaling 2023, 21, 278. [Google Scholar] [CrossRef]
- Ji, S. , Zhang, J., Fan, X., Wang, X., Ning, X., Zhang, B.,... & Yan, H. The relationship between mean platelet volume and diabetic retinopathy: a systematic review and meta-analysis. Diabetology & metabolic syndrome 2019, 11, 1–8. [Google Scholar]
- Milosevic, D.; Panin, V.L. Relationship between hematological parameters and glycemic control in type 2 Diabetes mellitus patients. J. Med.Biochem. 2019, 38. [Google Scholar] [CrossRef] [PubMed]
- Swaminathan, A.; Amitkumar, K.; Ganapathy, S.; Ayyavoo, S. Evaluation of mean platelet volume and other platelet parameters in subjects with Type-2 diabetes mellitus. National Journal of Physiology Pharmacy and Pharmacology 2017, 7, 51. [Google Scholar] [CrossRef]
- Zvetkova, E.; Fuchs, D. Medical significance of simultaneous application of red blood cell distribution width (RDW) and neopterin as diagnostic/prognostic biomarkers in clinical practice. Pteridines 2017, 28, 133–140. [Google Scholar] [CrossRef]
- E. Zvetkova, Y. Savov, Y. Gluhcheva, I. Ilieva, E. Bichkidjieva, Simultaneous anisocytosis of red blood cells and platelets in chronic heroin addicts, Bloodmed – Slide Atlas, Red cells – Acquired disorders (2006), Blackwell publishing, Oxford, UK (https://www.bloodmed.com/home/slide-atlas).
- Nada, A. M. Red cell distribution width in type 2 diabetic patients. Diabetes, metabolic syndrome and obesity: targets and therapy, Vol. 8 2015, 525-533. [CrossRef]
- Antonova, N.; Veltcheva, L.; Paskova, V. Hemorheological and microvascular disturbances in patients with type 2 diabetes mellitus. Clinical Hemorheology and Microcirculation 2022, 81, 325–341. [Google Scholar] [CrossRef]
- Deng, Y.X.; Chang, H.-Y.; Li, H. Recent Advances in Computational Modeling of Biomechanics and Biorheology of Red Blood Cells in Diabetes. Biomimetics 2022, 7, 15. [Google Scholar] [CrossRef] [PubMed]
- Bouchnita, A.; Volpert, V. A multiscale model of platelet-fibrin thrombus growth in the flow. Comput. Fluids 2019, 184, 10–20. [Google Scholar] [CrossRef]
- Zhang, P.; Zhang, N.; Deng, Y.; Bluestein, D. A multiple time stepping algorithm for efficient multiscale modeling of platelets flowing in blood plasma. J. Comput. Phys. 2015, 284, 668–686. [Google Scholar] [CrossRef]
- Li, H.; Sampani, K.; Zheng, X.; Papageorgiou, D.P.; Yazdani, A.; Bernabeu, M.O.; Karniadakis, G.E.; Sun, J.K. Predictive modeling of thrombus formation in diabetic retinal microaneurysms. R. Soc. Open Sci. 2020, 7, 201102. [Google Scholar] [CrossRef]
- Chang, H.Y.; Yazdani, A.; Li, X.; Douglas, K.A.; Mantzoros, C.S.; Karniadakis, G.E. Quantifying platelet margination in diabetic blood flow. Biophys. J. 2018, 115, 1371–1382. [Google Scholar] [CrossRef]
- Lu, Y.; Lee, M.Y.; Zhu, S.; Sinno, T.; Diamond, S.L. Multiscale simulation of thrombus growth and vessel occlusion triggered by collagen/tissue factor using a data-driven model of combinatorial platelet signalling. Math. Med. Biol. A J. IMA 2017, 34, 523–546. [Google Scholar] [CrossRef]
- Yazdani, A.; Karniadakis, G.E. Sub-cellular modeling of platelet transport in blood flow through microchannels with constriction. Soft Matter 2016, 12, 4339–4351. [Google Scholar] [CrossRef] [PubMed]
- Anand, M.; Rajagopal, K.; Rajagopal, K. A model for the formation, growth, and lysis of clots in quiescent plasma. A comparison between the effects of antithrombin III deficiency and protein C deficiency. J. Theor. Biol. 2008, 253, 725–738. [Google Scholar] [CrossRef]
- Cai, S.; Li, H.; Zheng, F.; Kong, F.; Dao, M.; Karniadakis, G.E.; Suresh, S. Artificial intelligence velocimetry and microaneurysmona- chip for three-dimensional analysis of blood flow in physiology and disease. Proc. Natl. Acad. Sci. USA 2021, 118, e2100697118. [Google Scholar] [CrossRef]
- Tosenberger, A.; Ataullakhanov, F.; Bessonov, N.; Panteleev, M.; Tokarev, A.; Volpert, V. Modelling of platelet–fibrin clot formation in flow with a DPD–PDE method. Leiderman, K.; Fogelson, A. An overview of mathematical modeling of thrombus formation under flow. Thromb. Res. 2014, 133, S12–S14. [Google Scholar]
- WM Heemskerk, Pia RM Siljander, Edouard M. Bevers, Richard W. Farndale, Theo Lindhout, J. Receptors and signalling mechanisms in the procoagulant response of platelets. Platelets 2000, 11, 301–306. [Google Scholar] [CrossRef]
- Cakir, E.; Özkoçak Turan, I. PREDICTIVE EFFECTS OF FIRST ERYTHROCYTE AND THROMBOCYTE VOLUME INDICES ON MORTALITY OF GERIATRIC PATIENTS WITH SEPSIS HOSPITALIZED IN INTENSIVE CARE UNITS. Turkish Journal of Geriatrics/Türk Geriatri Dergisi 2021, 24. [Google Scholar]
- Ulutas, K.T.; Dokuilku, R.F. Sefil, Evaluation of mean platelet volume in patients with type-2 diabetes mellitus and blood glucose regulation: а marker for atherosclerosis? Int J Clin Exp Med 2014, 7, 955–961. [Google Scholar] [PubMed]
- Aktas, F.; Aktuglu, M.B. Evaluation of the relation between HbA1c and MPV and PDW levels of patients with Type 2 Diabetes admitted in Internal Medicine Polyclinics. North Clin.Istanb. 2023, 10, 681–686. [Google Scholar] [CrossRef]
- Elsayed, A.M.; Araby, E. Neutrophil-Lymphocyte and Platelet-Lymphocyte ratious as a marker for diabetes control and complications. Benha Medical Journsl 2021, 38, 984–995. [Google Scholar]
- Hajek, A.S.; Joist, J.H.; Baker, R.K.; Jarett, L.E.O.N.A.R.D.; Daughaday, W.H. Demonstration and partial characterization of insulin receptors in human platelets. The Journal of Clinical Investigation 1979, 63, 1060–1065. [Google Scholar] [CrossRef]
- Kelem, S.; Adane, T.; Shiferaw, E. Insulin resistance-induced platelet hyperactivity and a potential biomarker role of platelet parameters, A narrave Review. Diabetes, Metabolic Sydrome and Obesity 2023, 16, 2843–3853. [Google Scholar] [CrossRef]
- Ahmed, S.; Khalid, M.A.; Munir, M.; et al. Association of Neutrophil to Lymphocyte and Platelet to Lymphocyte ratio with glucose regulation in type 2 diabetes patients. Journal of Rawalpindi (JRMC - internet) 2021. [Google Scholar] [CrossRef]
- Sobczak A.I.S., and S.J. Stewart. Coagulatory defects in type-1 and type-2 Diabetes. Int. J. Mol. Sci., 20, 2019, 6345. [CrossRef]
- Benjamin, E.J.; Virani, S.S.; Callaway, C.W.; Chamberlain, A.M.; Chang, A.R.; Cheng, S.; et al. Heart disease and stroke statistics 2018. Update: a report from the American Heart Association. Circulation 2018, 137, e67–e492. [Google Scholar]
- Rodriguez B.A. T., and A.D. Johnson. Platelet measurements and type 2 Diabetes: Investigations in two population-based Cohorts. Front. Cardiovasc. Med., 7, 2020, Article 118. [CrossRef]
- Dolasik I., et al., The effect of metformin on mean platelet volume in diabetic patients. Platelets, 24, 2013, 118 – 121. [CrossRef]
- Magri, C.J.; Xuereb, S.; Huereb, R.A. Sleep measures and cardiovascular disease in type 2 diabetes mellitus. Clinical Medicine 2023, 23, 1–7. [Google Scholar] [CrossRef] [PubMed]
- Chkhitauri L., Sanikidze T., Giorgadze, M. Mantskava ..et al., Comprehensive study of the rheological status and intensity of oxidative stress during the progression of type 2 Diabetes mellitus to prevent its complications. Clinical Hemorheology and Microcirculaton 83/1, 20, pp 69 – 79. [CrossRef]
- Alexandrova-Watanabe, A., 2021. Study of rheological, mechanical and morphological properties of blood, its formal elements and parameters of hemocoagulation in type 2 diabetes mellitus. PhD thesis, Institute of Mechanics, Bulgarian Academy of Sciences, Sofia, Bulgaria.
- Liu, Y.; Gao, G.; Yang, C.; Zhou, K.; Shen, B.; Liang, H.; Jiang, X. The role of circulating microRNA-126 (miR-126): a novel biomarker for screening prediabetes and newly diagnosed type 2 diabetes mellitus. International journal of molecular sciences 2014, 15, 10567–10577. [Google Scholar] [CrossRef] [PubMed]
- Afsharmanesh, M.R.; Mohammadi, Z.; Mansourian, A.R.; Jafari, S.M. A Review of micro RNAs changes in T2DM in animals and humans. Journal of Diabetes 2023. [CrossRef] [PubMed]
- de Boer, H.C.; van Solingen, C.; Prins, J.; Duijs, J.M.; Huisman, M.V.; Rabelink, T.J.; van Zonneveld, A.J. Aspirin treatment hampers the use of plasma microRNA-126 as a biomarker for the progression of vascular disease. European heart journal 2013, 34, 3451–3457. [Google Scholar] [CrossRef] [PubMed]
- Zhu, H.; Leung, S.W. MicroRNA biomarkers of type 2 diabetes: Evidence synthesis from meta-analyses and pathway modelling. Diabetologia 2023, 66, 288–299. [Google Scholar] [CrossRef] [PubMed]
- Shantikumar, S.; Caporali, A.; Emanueli, C. Role of microRNAs in diabetes and its cardiovascular complications. Cardiovascular research 2012, 93, 583–593. [Google Scholar] [CrossRef]
- Zvetkova, E.B.; Zvetkov, I.B. A cytological method for the simultaneous staining of nucleoproteids and some cathionic proteins. Acta Histochemica 1976, 57, 1–13. [Google Scholar] [CrossRef] [PubMed]
- Zvetkova, E.; Kostov, G. Microdensitometrical studies on tumour-induced programmed cell death of peripheral blood tumour-infiltrating lymphocytes (TIL) in cancer patients: possible applications for early tumour diagnosis. Асta Morphologica et Anthropologica 2000, 5, 3–10. [Google Scholar]
- Zvetkova, E.B.; Kostov, G.S.; Gluhcheva, Y.G. 30 Years from Creation of the First Cytochemical Method Analysing RNP, DNP and Cationic Proteins in Circulating Leukocytes of Cancer Patients as a Tool for Early Diagnostics of Malignancies. Clinical Immunology 2007, S111. [Google Scholar] [CrossRef]
- Zhang, Q.; Han, Y. Opioid peptides and P2Y12 receptor signling pathway. Progress in Modern Biomedicine 2011, 11, 3787–3790. [Google Scholar]
- Sobol, A.B.; Watala, C. The role of platelets in diabetes-related vascular complications. Diabetes Res. Clin. Ptact. 2000, 50, 1–16. [Google Scholar] [CrossRef]
- Ashby, B.; et al. Mechanisms of platelet activation and inhibition. Hematology/Oncology. Clinica of North America 1990, 4, 1–26. [Google Scholar] [CrossRef]
- Vinik, A.I.; Erbas, T.; Park, T.S. Nolan R., Piterenger G.L. Platelet dysfunction in type-2-Diabetes. Diabetes Care 2001, 24, 1476–1485. [Google Scholar] [CrossRef]
- Carr, M.E. Diabetes mellitus: A hypercoagulable state. Journal of Diabetes and its complications. 2001, 15, 44–54. [Google Scholar] [CrossRef]
- Vinik, A.; Flemmer, M. Diabetes and macrovascular disease. Journal of Diabetes and its complications 2002, 16, 235–246. [Google Scholar] [CrossRef]
- Vinik, A.; Vinik, E. Prevention of the complications of Diabetes. Am. J. Managed Care 2003, 9, S–63. [Google Scholar]
- Hirsch, G.E.; et al. Natural products with antiplatelet action. Curr Pharm Des., 23/8, 2017, 1228 – 1246. [CrossRef]
- K.J. Mhatre, J.R. Patil, G.C. Nikalje. Role of Flavonoids in vasodilation. In the Book: The flavonoids. First edition, 2024, Apple Academic Press, pp. 17, Taylor Frances Group.
- J.E. Freedman, C.Parker lll, L.Li, J.A.Perlman, B. Frei, et al. Select flavonoids and whole juice from purple grapes inhibit platelet function and enhance nitric oxide release. Circulation ( Am. Heart Assoc.), 103, 2001 (12 June), 2792 – 2798. [CrossRef]
Disclaimer/Publisher’s Note: The statements, opinions and data contained in all publications are solely those of the individual author(s) and contributor(s) and not of MDPI and/or the editor(s). MDPI and/or the editor(s) disclaim responsibility for any injury to people or property resulting from any ideas, methods, instructions or products referred to in the content. |
© 2024 by the authors. Licensee MDPI, Basel, Switzerland. This article is an open access article distributed under the terms and conditions of the Creative Commons Attribution (CC BY) license (http://creativecommons.org/licenses/by/4.0/).


