Preprint
Article

A Peel Test Method to Characterise the Decay Law of Prepreg Tape Tack at Different Temperatures

Altmetrics

Downloads

93

Views

31

Comments

0

A peer-reviewed article of this preprint also exists.

This version is not peer-reviewed

Submitted:

20 March 2024

Posted:

20 March 2024

You are already at the latest version

Alerts
Abstract
Tack is one of the most important factors affecting the operability of prepregs, but it is still very difficult to obtain the change of prepreg tack with time at different temperatures. In this paper, a newly designed T-peel device is used to test the tack decay rate of prepregs at different temperatures. The obtained decay rate deviates less than 8.9% from the manufacturer's data. The maximum deviation of the ratio of tack decay speeds calculated by the Arrhenius equation from the experiments is not higher than -9.7%. It is proved that the present method can obtain the decay rate of tack of prepregs at different temperatures. This method is also applicable to the other two types of prepregs. The article proposes the handling life unit, an operational life measurement unit for prepregs, and establishes that the relationship between tack and remaining shelf life reduces prepreg management costs.
Keywords: 
Subject: Chemistry and Materials Science  -   Materials Science and Technology

1. Introduction

Composite materials are widely adopted in the aerospace industry for their superior specific strength and specific modulus when compared to conventional structural materials. Among the various composite manufacturing processes, automated material placement (AMP) technology has received a lot of attention due to its high efficiency in producing consistent quality composite products for large structures such as aircraft wings and rockets. With the aid of multi-degree-of-freedom machines and end effectors, AMP technology is capable of handling products with various complex structures. However, despite its numerous benefits, the quality of the product is susceptible to various factors, especially the tack of the prepreg.
Prepreg is the main precursor for the manufacture of high-performance composites because it is easy to handle and easy to control the resin content of the final part [1]. It is also the main material that can be used for AMP. Compared to other composite precursors, the precise combination of prepreg reinforcements and resin systems is critical to achieving the most efficient properties, layer thickness, and fiber-to-resin content ratio. The fiber content of prepreg is generally 60%-70%. When the fiber exceeds 70%, the contact between fibers may have a negative impact on the mechanical properties, while 60-65% is a more compromised value [2,3]. In the automated material placement of thermosetting resin prepregs, pressure is applied to the prepreg to bond it to the mould surface. Therefore, the ability of the prepreg to be firmly bonded to the surface of the mould without peeling or slipping depends on whether the tack is sufficient. The tack of prepregs is not simply the viscosity or viscoelasticity but also involves the diffusion behavior of the resin molecules. To prevent tack decay, thermosetting resin prepregs must be stored at -18°C after leaving the production line. However, when manufacturing large-sized parts, the prepreg is ultimately exposed to room temperature conditions for an extended period of time, resulting in the steady loss of tack as the exposure time increases during the handling life [4,5]. Andreas Endruweit's research found that as downtime increases, the maximum tack force of prepregs decreases, and a lower processing speed is required to obtain the maximum tack force [6,7]. It has also been found that as the ageing time increases, the prepreg must be processed at higher temperatures to achieve maximum tack values [8]. Although the tack of the prepreg can be adjusted by modifying the process parameters to meet production requirements [9,10], exposing the prepreg to ambient temperature for an extended period can cause its tack to become so low that it is unusable [11]. In this state, the prepreg can no longer satisfy the requirements of AMP and must be scrapped [12,13,14], despite its unchanged mechanical properties. This creates a huge waste, although the end-of-life prepreg can be reused as SMC [15,16]. Some prepregs with missing thermal history records are also discarded, even if they still meet the process criteria, due to the lack of a reliable method to determine when the prepreg has reached the end of its handling life.
Currently, researchers have developed resins that can be stored at room temperature for an extended period of time [17,18]. However, for most prepreg products, it is still challenging to maintain their processability for the automated material process at room temperature for an extended time. Consequently, researchers have investigated the changes in prepreg during storage to determine whether their processability remains sufficient for production. Presently, the primary test methods include dielectric analysis [19,20], differential scanning calorimetry (DSC) [21,22], dynamic mechanical analysis (DMA) [23], spectroscopic analysis [24], and rheometry [8,25]. However, the physical and chemical studies' findings may not be perfectly predictable due to the prepreg's mixture nature and imperfect resin dispersion at the microscopic scale.
Determining whether a prepreg is still within its service life depends primarily on whether its tack meets the requirements of the process. In contrast to the physical and chemical test measurements carried out in laboratories, composite manufacturers use a simple tack test for prepregs. For example, the prepregs are placed upside down and are considered to have passed the tack test when the prepregs can be held together without peeling off. Alternatively, the adhesion of prepregs can be tested by the rolling ball method using ASTM D3121, the test standard for pressure-sensitive adhesives.
Tack is an interfacial behaviour of the resin and the decay is caused by changes in surface properties rather than overall ageing [26]. For prepreg-prepreg bonding, the polymer chains diffuse between the resin layers on the prepreg surface. Intermolecular forces such as dispersion forces and hydrogen bonding develop as the molecular chains come closer together [27]. The quality of surface interactions is determined by the mobility of the polymer chains in the resin [28]. Ageing increases the degree of curing of the resin and decreases molecular activity [6]. Although tack is affected by a variety of factors such as resin content, fibre distribution and surface pattern [29], the tack decay due to ageing is caused by changes in resin properties.
Wool [30] believes that the bond strength between the resins consists of a division into interfacial strength and the force between the resin chains, the latter being determined by the distance the resin chains move at the vertical interfacial distance. The law of force between resin chains is as follows:
σd = qn0χ [30]    (1-1)
Where σd indicates the force between resin chains, q is a constant, n0 means the total number of constraints per unit volume of the virgin bulk material, and χ means chains self-diffusing across the interface to an interpenetration depth.
The diffusion motion of the molecular chain can be equivalent to the model of a random walk chain diffusing in a tube [31,32]. As shown in Figure 1.
The relationship of random penetration depth can be obtained as:
χ 2 1 / 2 = α 2 D c t 1 / 4
Where α is the coefficient, D c is the diffusion coefficient, and t is the diffusion time.
Since D c depends on the molar mass M of the resin, so:
D c 1 / M
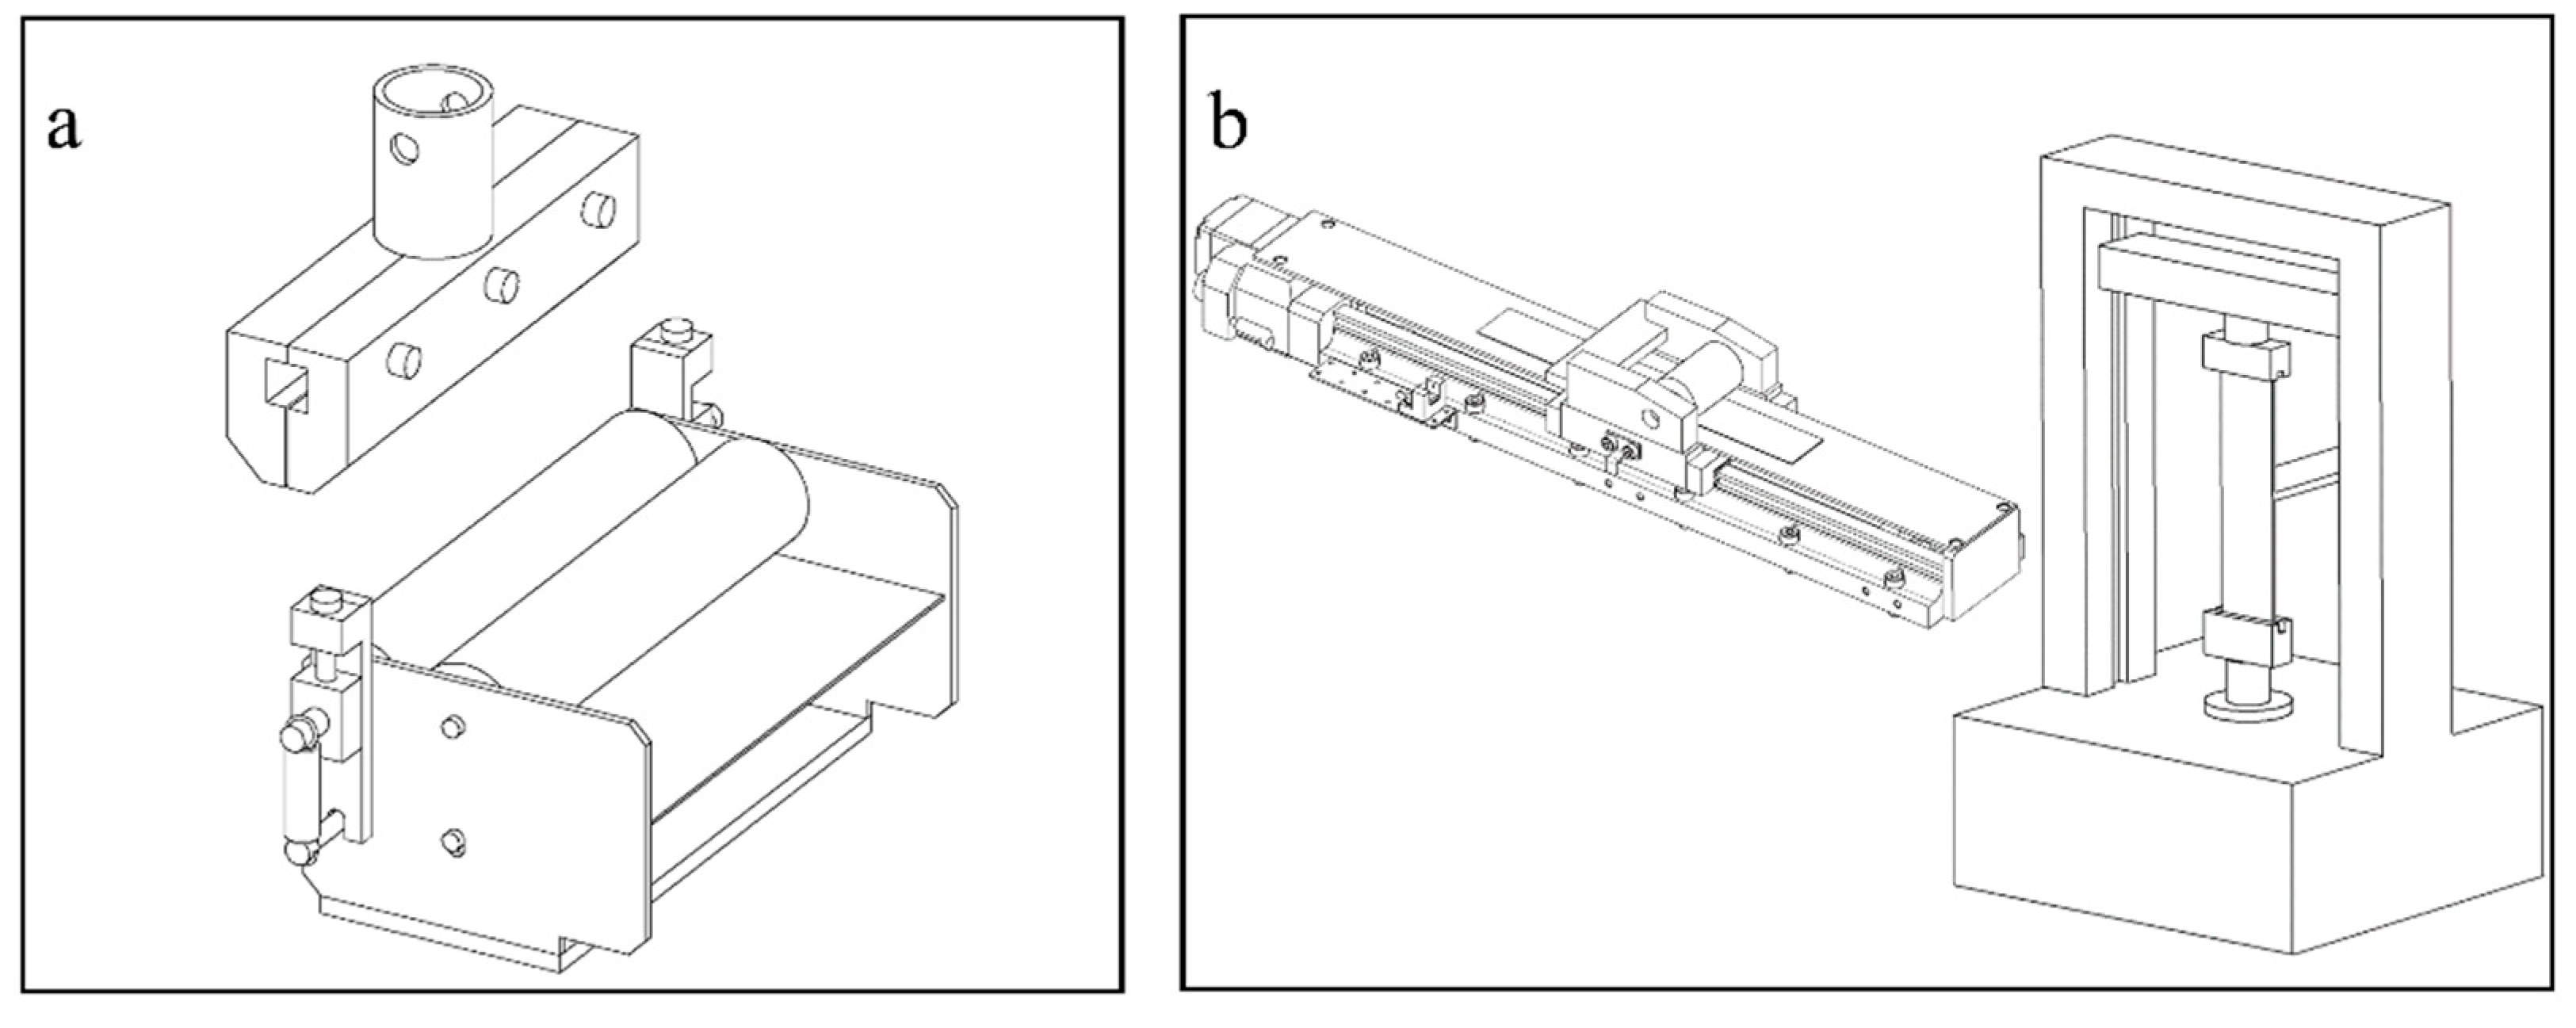
Since the tack of prepregs is difficult to measure through simple chemical testing methods, researchers have changed their minds and begun to measure tack values directly through mechanical property testing. For example, some researchers have explored a compression-pull test method where multiple layers of prepreg are bonded together by pressure and then the force required to separate the layers is measured [33]. Other researchers have measured the force required to remove a probe from the prepreg surface to define the tackiness of the prepreg [34,35]. Both of these methods measure the maximum normal stress during the separation process, which is important for preventing defects such as bubbles and wrinkles in the prepreg [36]. The peeling experiment, however, characterizes the average peeling force, which is more representative of the lay-up process. To simulate lay-up conditions, researchers have designed different experimental devices, such as those by Crossley RJ [37] and Brooks JR [38] shown in Figure 2. However, the device in Figure 2a requires a metal plate as the substrate, limiting its test range, while the device in Figure 2b has significant noise in test results due to sample vibration during peeling.
There are fewer studies on the tack decay law of prepregs at different temperatures. And the tack decay of prepregs increases the management cost of composite manufacturers. Therefore, in this paper, we will investigate the decay law of prepreg tack at different temperatures and propose a unit to establish the relationship between tack and remaining shelf life to reduce the manufacturer's management cost.
In this paper, the term "handling life" specifically refers to the handling life of automated material placement. The paper is divided into four parts: the first part provides the research background, the second part describes the experimental device design and experimental methodology, the third part presents and discusses the results, and the fourth part is the conclusion.

2. Experimental Equipment and Method

2.1. Experimental Equipment

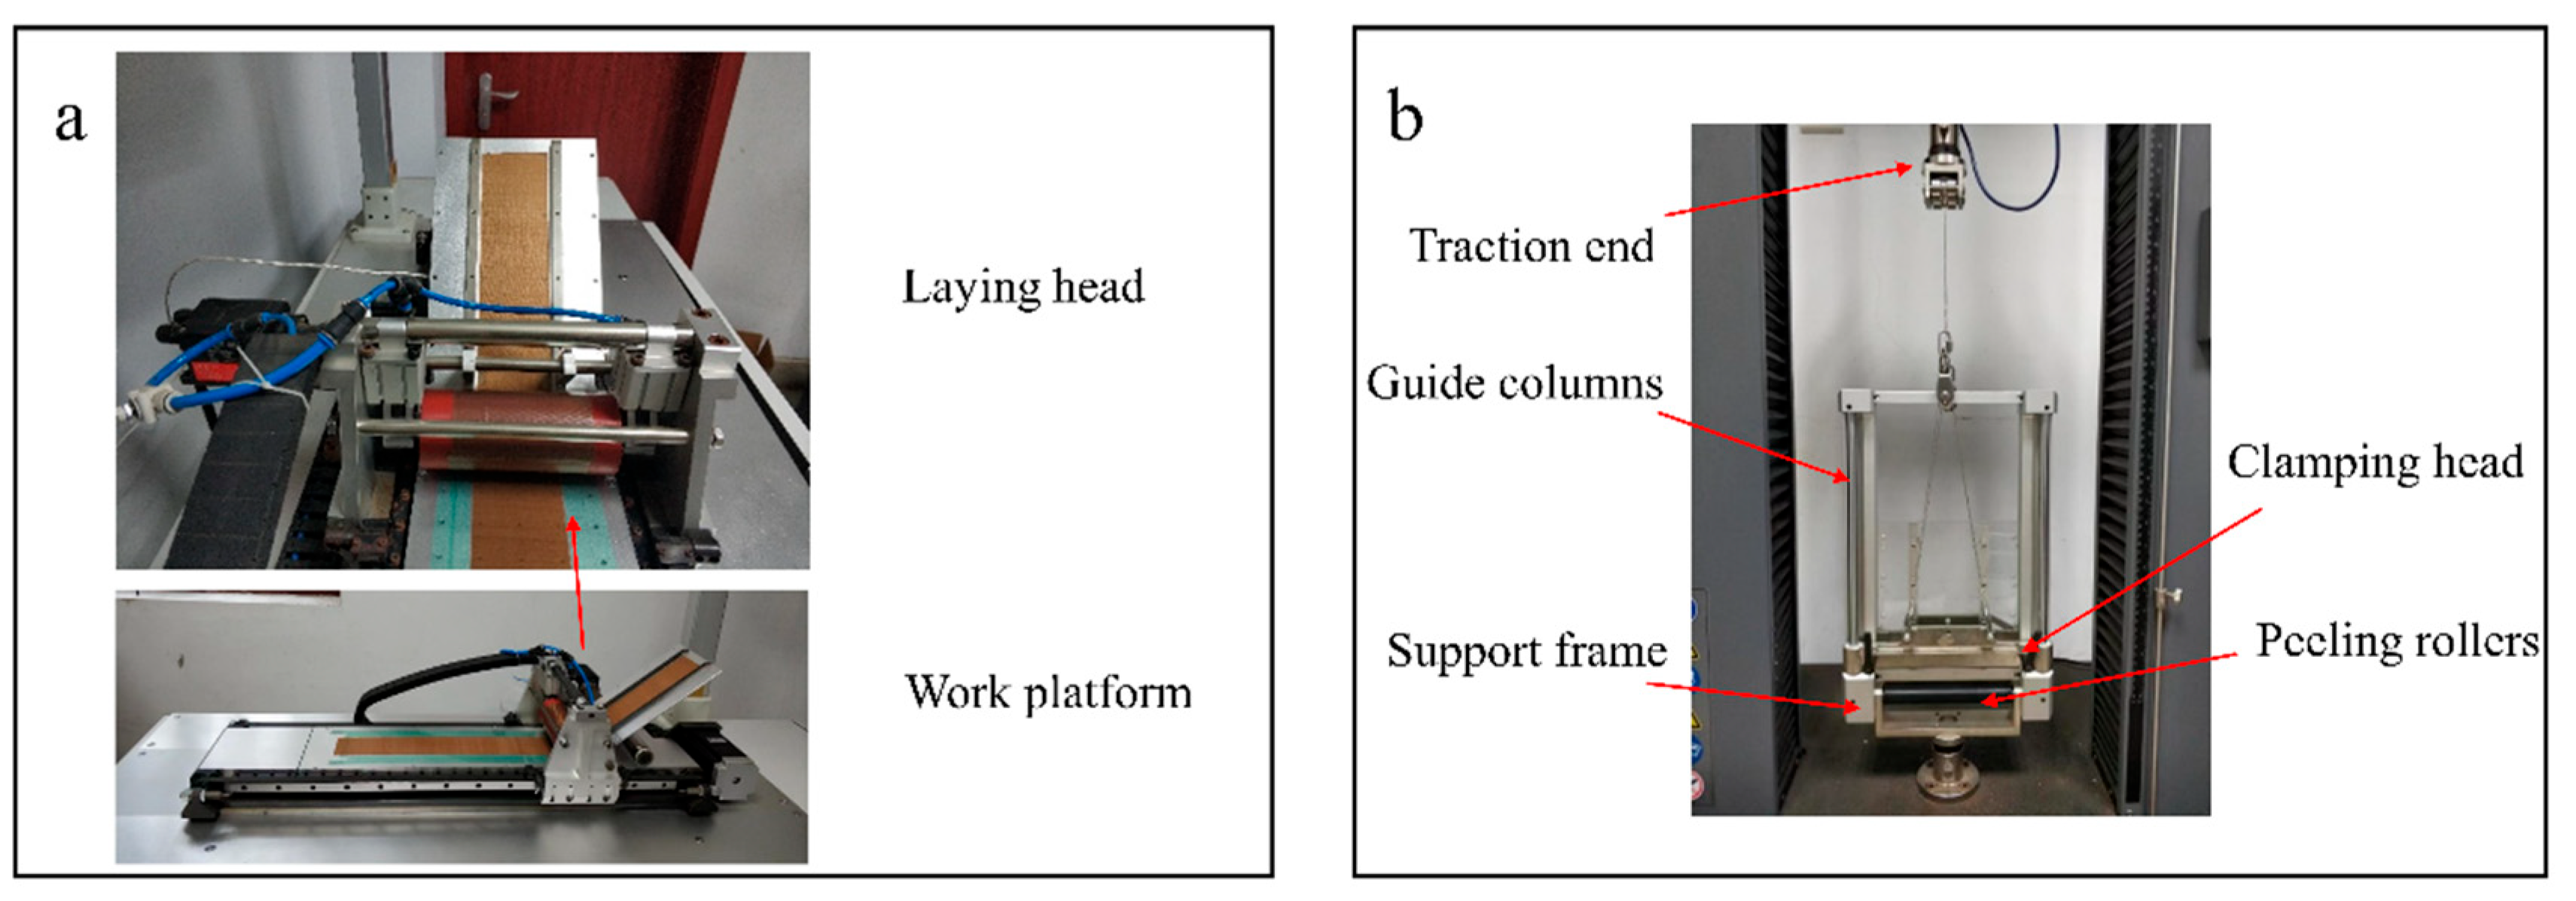
Crossley RJ's device controls the angle of peeling [37] and Brooks JR's device simulates the automatic tape laying process [38]. This paper summarises the advantages of both solutions to design a test device. The test device is shown in Figure 3, which contains two parts: the automatic laying platform and the peeling fixture. The automatic laying platform was designed based on the basic functional requirements of a tape lay-up machine and consists of a work platform and a laying head. The work platform surface can fix the prepreg by negative pressure, and a weighing sensor is placed at the bottom of the work platform to provide feedback on the laying pressure. The laying head consists of a 60mm diameter rubber pressure roller, cylinder, and support frame. The hardness value of the pressure roller is 30A-35A. The cylinder provides uniform and controllable pressure to the prepreg tape being laid through the pressure roller. The laying head is installed on the guide rail of the work platform and is driven by a motor, allowing the platform to lay prepreg up to a maximum width of 150mm. The entire system is controlled by a PLC (Programmable Logic Controller). During the sample preparation process, the prepreg to be bonded is placed on the platform and in the guide groove, and the laying pressure and speed are set. The laying machine is started to complete the bonding. In this study, the laying speed was set to 50mm/s and the laying pressure was set to 500N.
To solve the problem of high noise from the force sensor caused by sample oscillation during peeling, this work designed a special peeling fixture, as shown in Figure 3b. The fixture consists of a support frame, clamping head, traction end, guide columns, and peeling rollers. The clamping head is connected to the traction end via a wire rope pulley system. After clamping the prepreg, the universal testing machine pulls the traction end to peel it. During the peeling process, the guide column on the frame can constrain the prepreg to only move vertically, the peeling roller constrains the peeling angle of the prepreg, and the transparent limiting plate constrains the swinging direction of the prepreg.
The ageing experiment was conducted using the CH225R-type environmental test chamber from Tuode Environmental Testing Equipment Co., Ltd. This chamber has a temperature control accuracy of ±1°C within the range of -10°C to 100°C, and a humidity control accuracy of ±5%RH.

2.2. Experimental Materials

This paper tests three types of carbon fiber epoxy uni-directional prepregs that are widely used in the aerospace industry, namely T, C, and H. The T-type prepreg has a resin content of 35% by weight, while the C-type and H-type prepregs have a resin content of 34% by weight. The manufacturer of T-type prepregs has provided a handling life table, which shows the decay rate of the handling life of the AMP process at different ageing temperatures, as presented in Table 1. This paper aims to study the tack decay rate of the sample. If the theory proposed in this paper is correct, then the decay rate should be consistent with the handling life decay rate provided by the manufacturer.

2.3. Experiment Procedure

To evaluate the tack decay rate of T-type prepreg at different ageing temperatures, an experimental matrix was established as presented in Table 2. Since the humidity in the production workshop was constant and the manufacturer's data did not include changes in humidity, it was not considered a variable in this study. To ensure significant differences among the test values, the most severe value in Table 1 was chosen as the experimental condition, and the humidity was set at 65%RH. To guarantee uniform changes in the life value between adjacent test points, ageing times at various temperatures were calculated based on the life decay rate ratio.
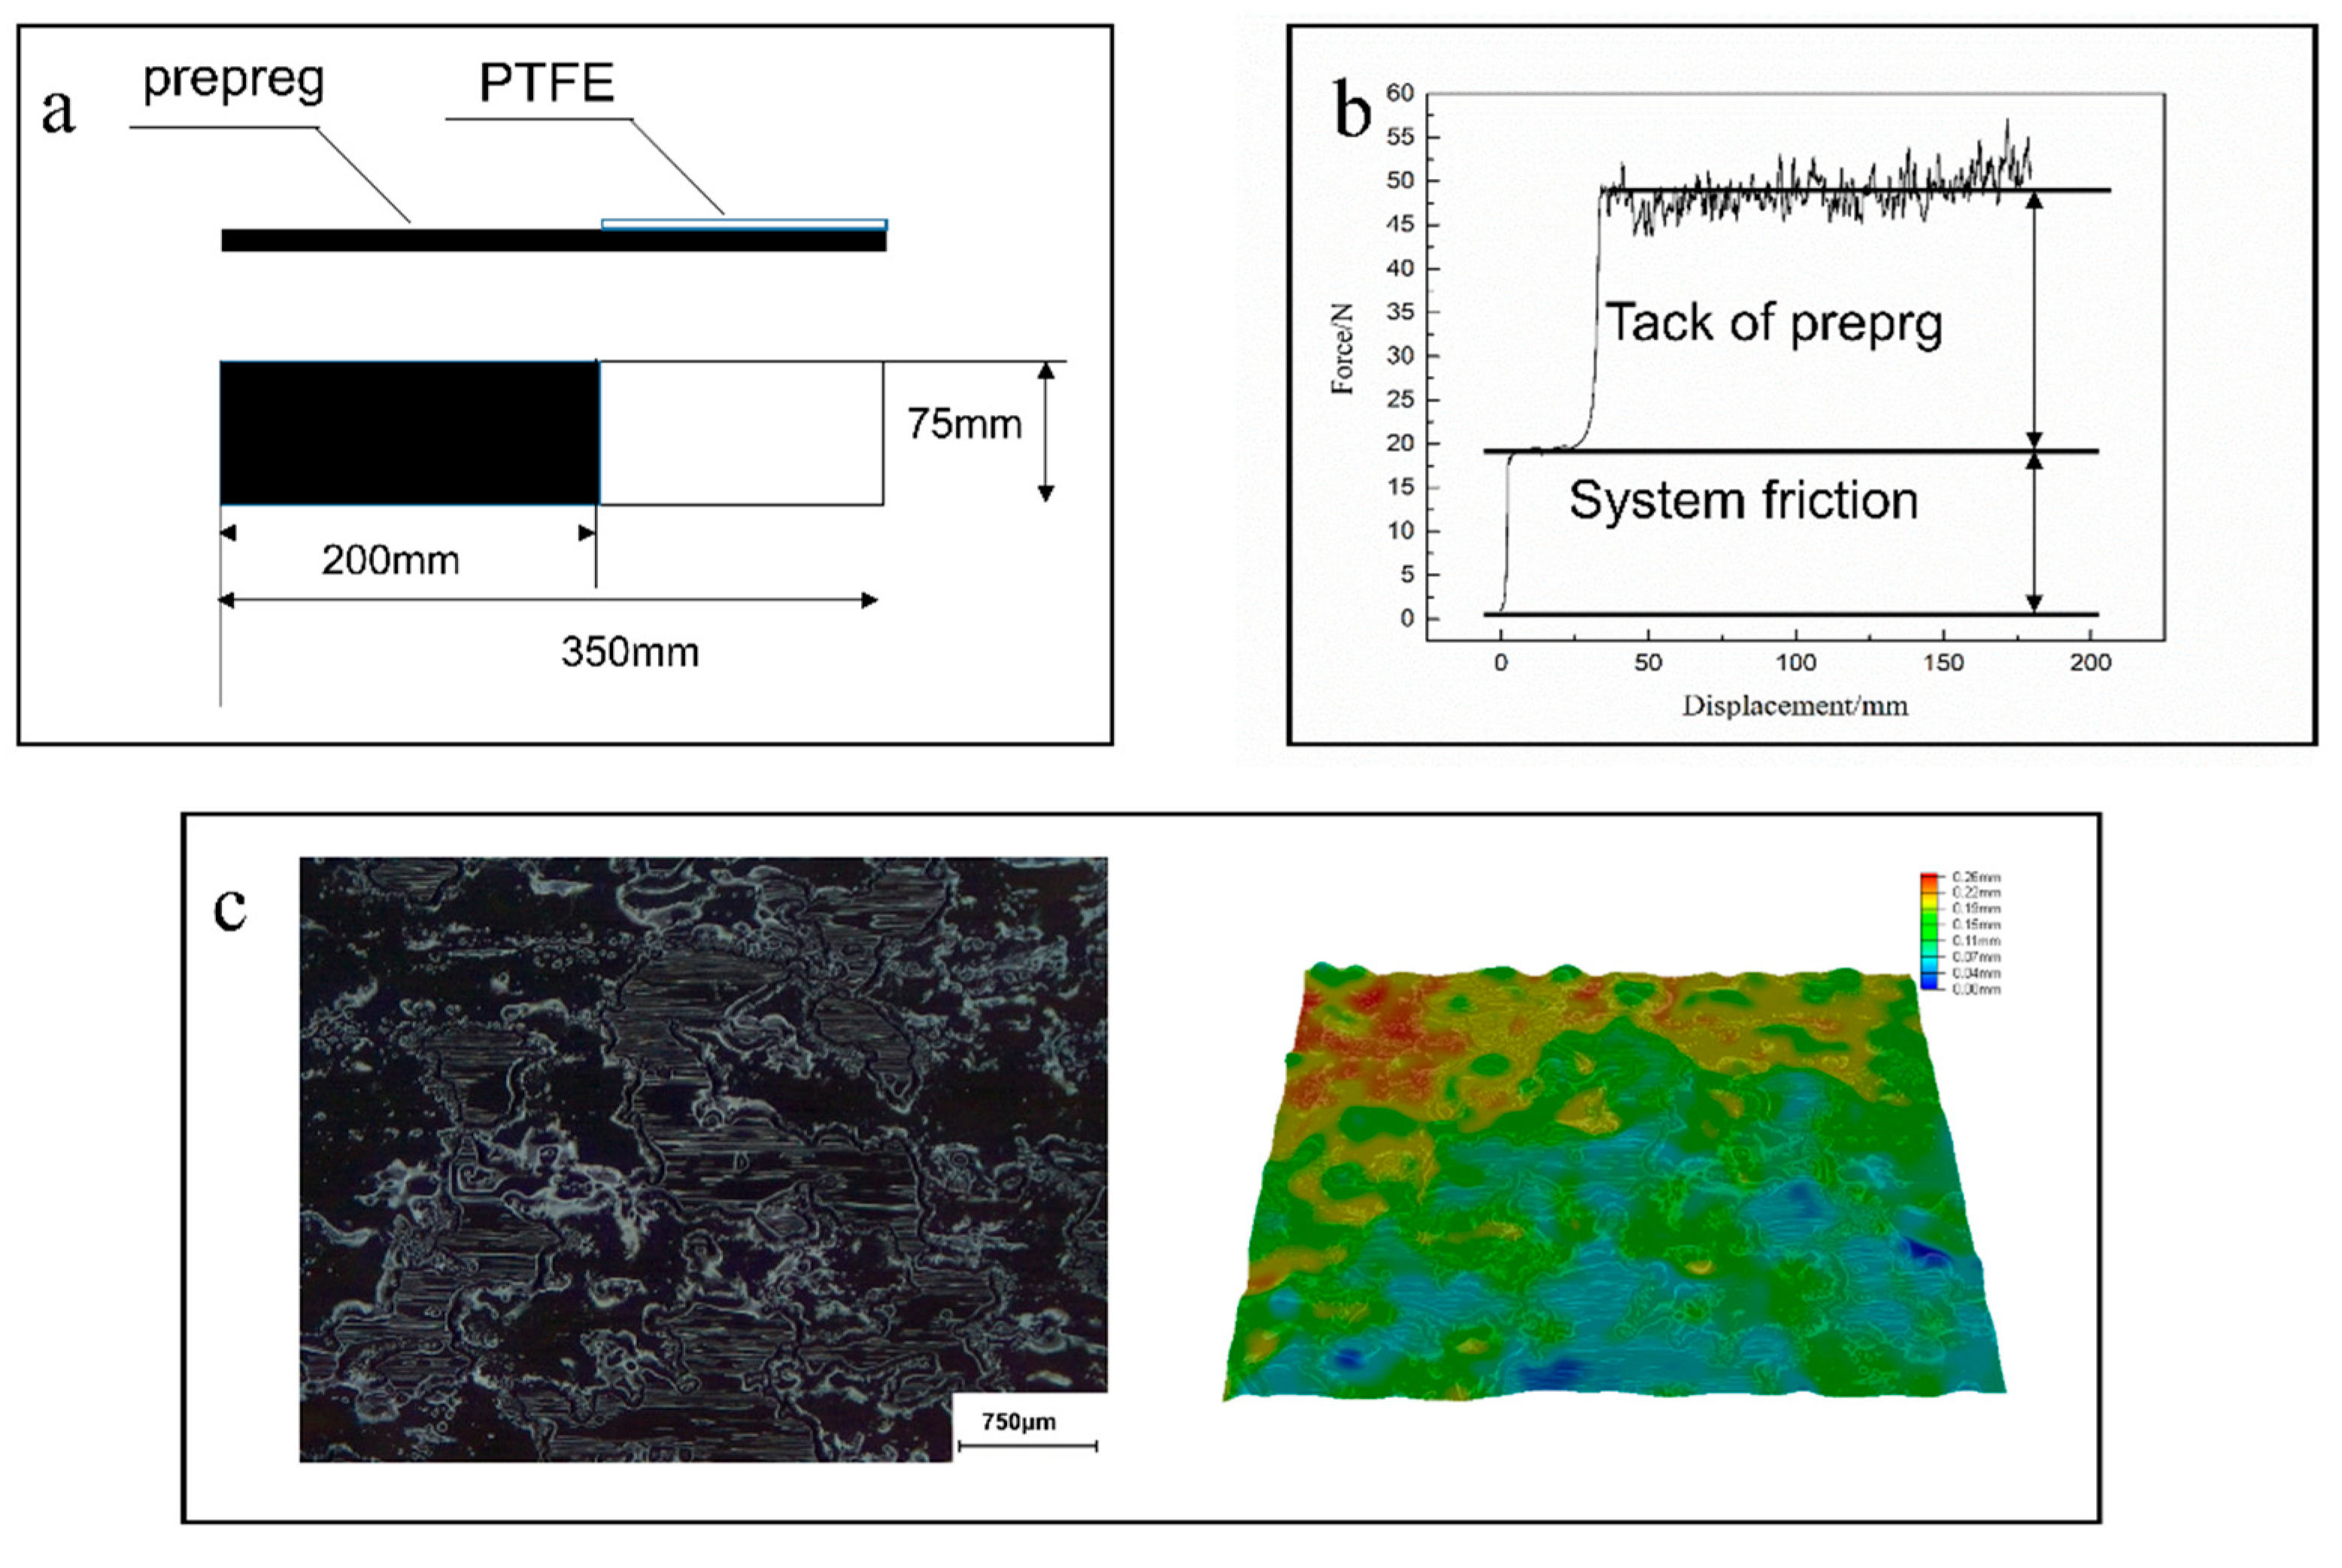
The prepregs were cut to the size shown in Figure 4a and then placed into the CH225R-type environmental test chamber. After ageing, the prepregs were transferred to a constant temperature room at 23°C for testing following sample preparation on the automatic lay-up platform. The samples were clamped on the designed peeling fixture and tested. The load-displacement curve obtained from the experiment includes a low plateau region and a high plateau region, as shown in Figure 4b. The former is due to the frictional force generated by the entire system, and the latter is the result of the former plus the tack of the prepreg. Figure 4c shows that the resin distribution is inhomogeneous and therefore the loads do not present a straight line. Contamination of the bonding surface was prevented during the ageing process and sample preparation. To minimize sample ageing during the waiting period, the 9 samples were divided into 3 groups for testing, and each point on the graph was obtained from the average of 9 experiments.

3. Results Analysis and Discussion

Analysis of Ageing Results

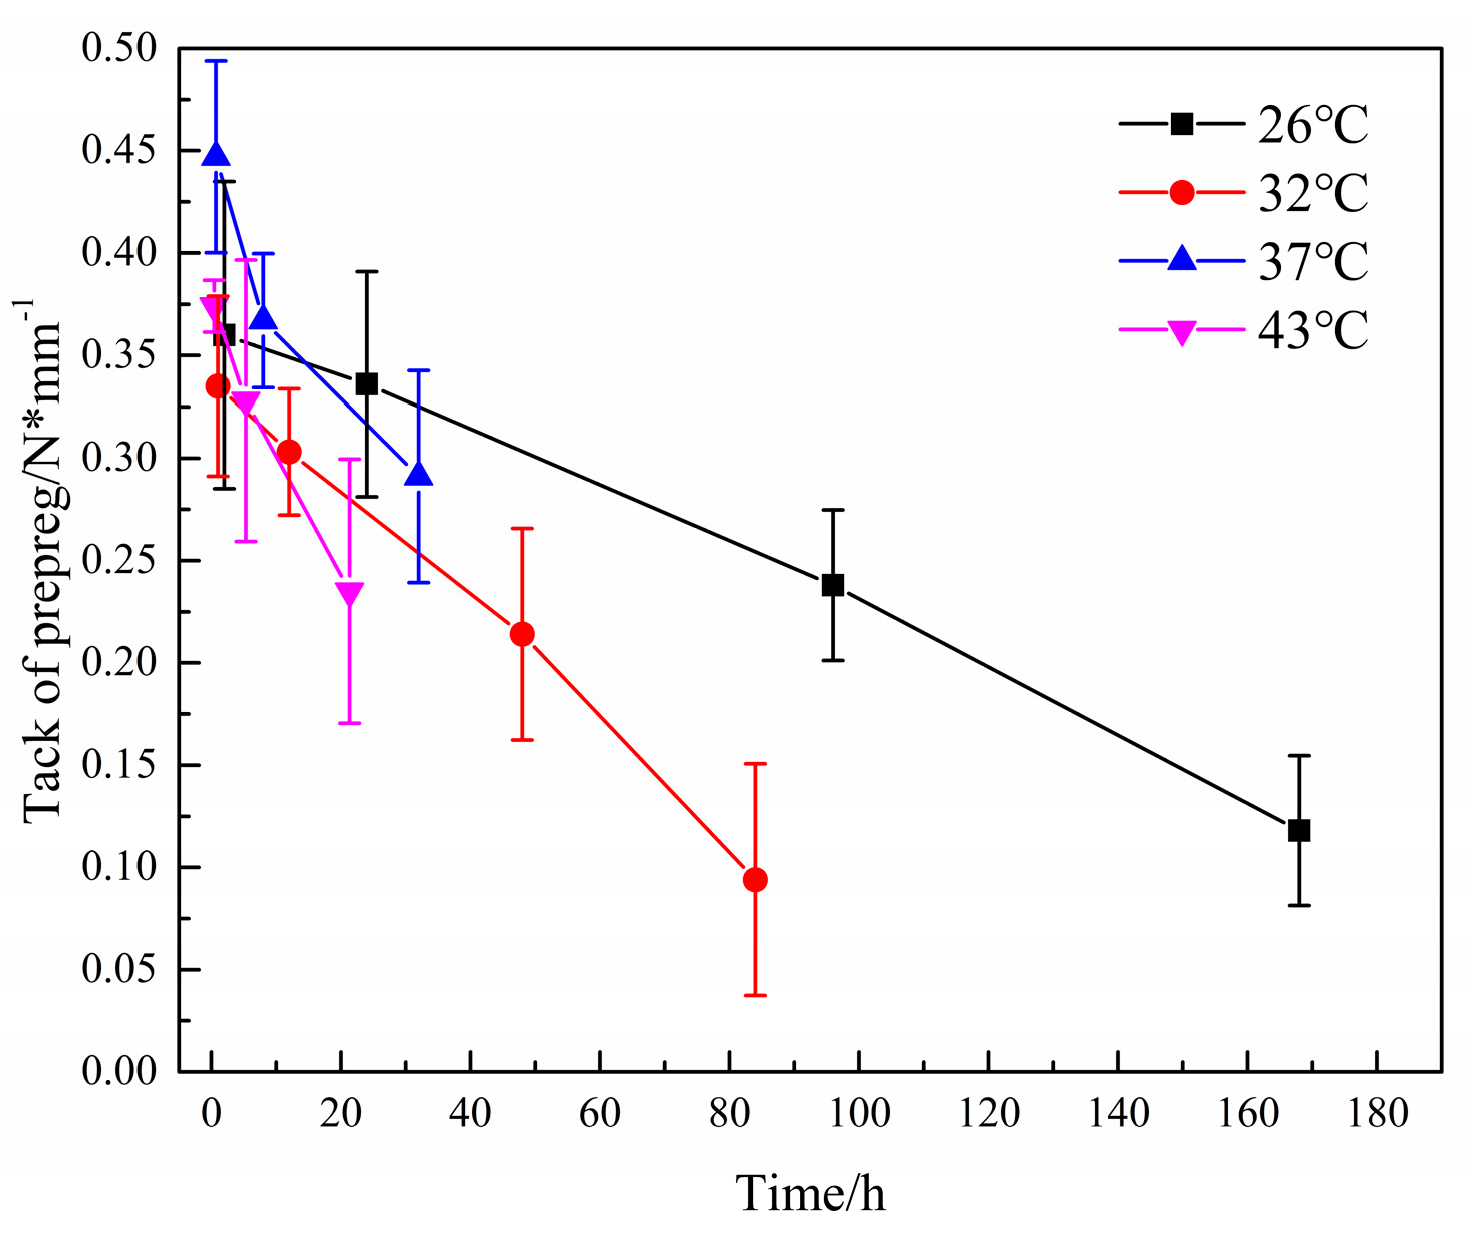
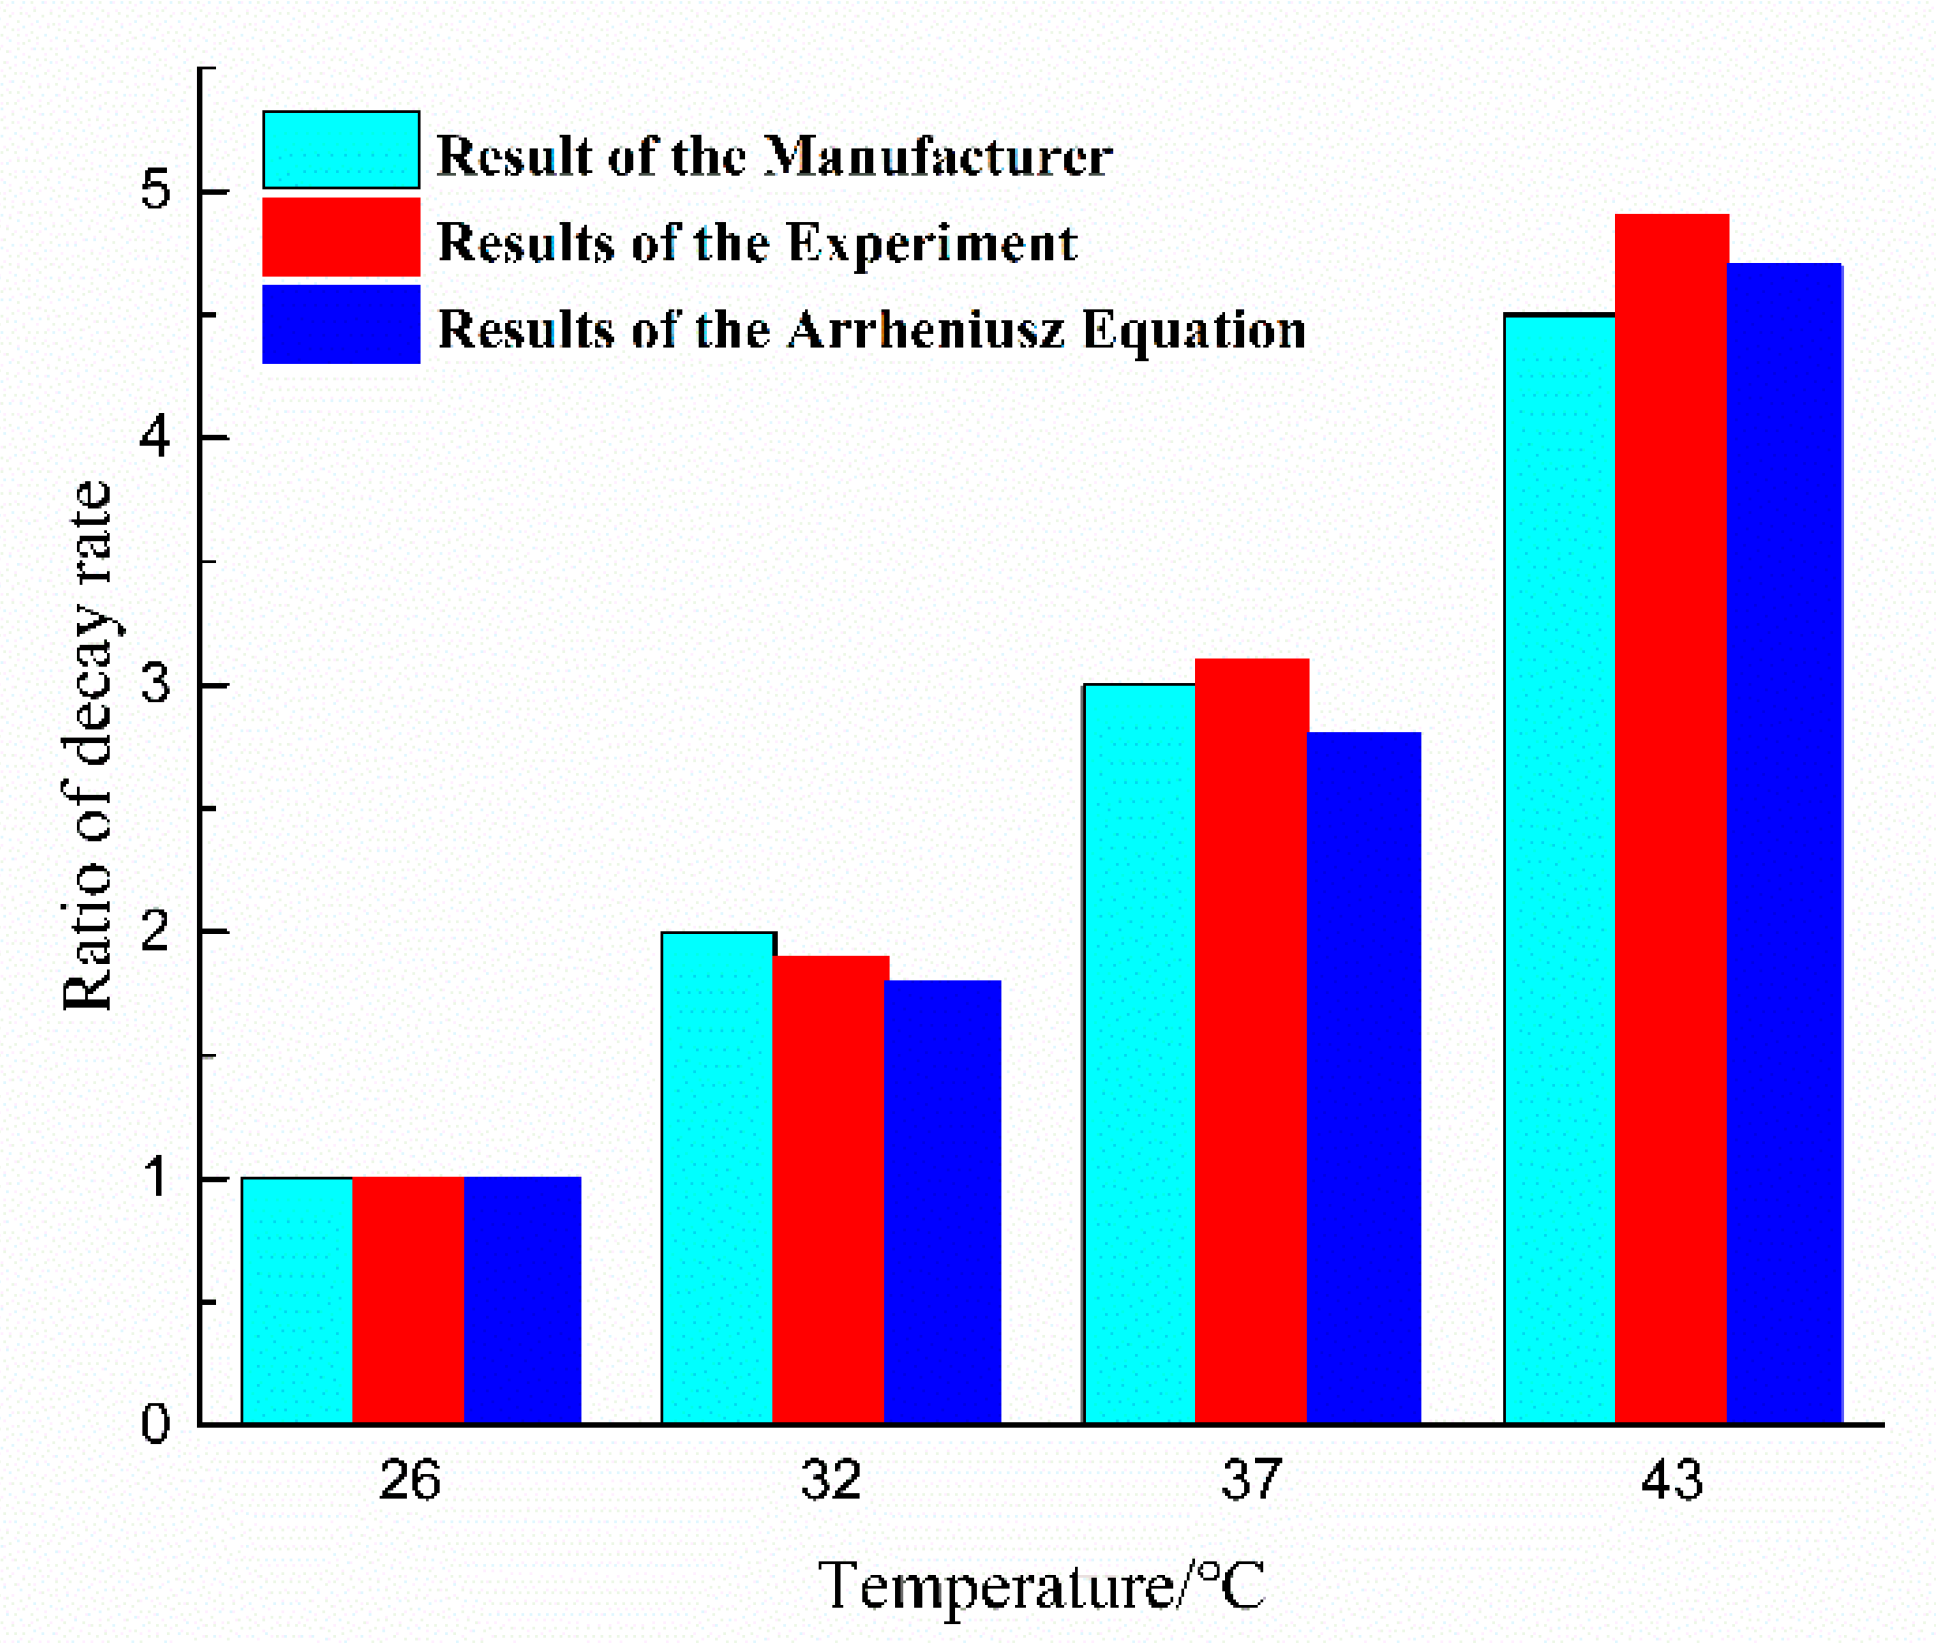
The tack decay curve of T-type prepreg after ageing is shown in Figure 5. Due to the long experimental period, it was not possible to ensure that the same batch of prepreg was used for each experiment. As a result, the curves have different intercepts. The focus of this study was on the tack decay rate, so using different batches of prepreg would not affect the results. The slope of the tack decay rate after ageing at different temperatures was fitted, and it was found that the decay rate increased with increasing temperature. Calculate the ratio of decay rates at different temperatures relative to 26 °C. The ratio of decay speed at different temperatures is 1.0 (26°C) : 1.9 (32°C) : 3.1 (37°C) : 4.9 (43°C). The results of R2 are shown in Table 3, which shows a good fit for the decay results. The deviations between the ratio of the fitted results and the manufacturer's results were -5% (32°C), 3.3% (37°C) and 8.9% (43°C), respectively. While it is not possible to know the manner in which the manufacturer evaluates the prepreg decay rate, the methodology used herein yields similar results.
Several studies have demonstrated that ageing causes an increase in the Tg (glass transition temperature) of the resin [8,39,40], which proves that the resin reacts during the ageing process. Prepreg tack depends on the properties of the resin. Therefore, the rate of decay of prepreg tack at different temperatures should be positively correlated with the rate of reaction of the resin. The reaction rate of the resin at different temperatures follows the Arrhenius equation.
k = A e E a / R T
Where k is the reaction rate constant, A is the Arrhenius constant, Ea is the activation energy of the reaction, R is the gas constant, and T is the thermodynamic temperature.
Janković [41] used the invariant kinetic parameters method to obtain a reaction activation energy of 71.4 kJ/mol for the T-type prepreg's resin. The ratios of the reaction rates calculated using the Arrhenius equation (3-1) were 1.0 (26°C), 1.8 (32°C), 2.8 (37°C), 4.7 (43°C), respectively. This result deviated from the data provided by the manufacturer of the T-prepreg by -10.0% (32°C), -6.7% (37°C), and 4.4% (43°C), and from the experimental results by -5.3% (32°C), -9.7% (37°C), and -4.1% (43°C). This result indicates that the results of tack decay are consistent with the rate of chemical reaction and indirectly demonstrates that the curing reaction of the resin is a factor in the tack decay of the prepreg. The ratios of decay rates are shown in Figure 6.
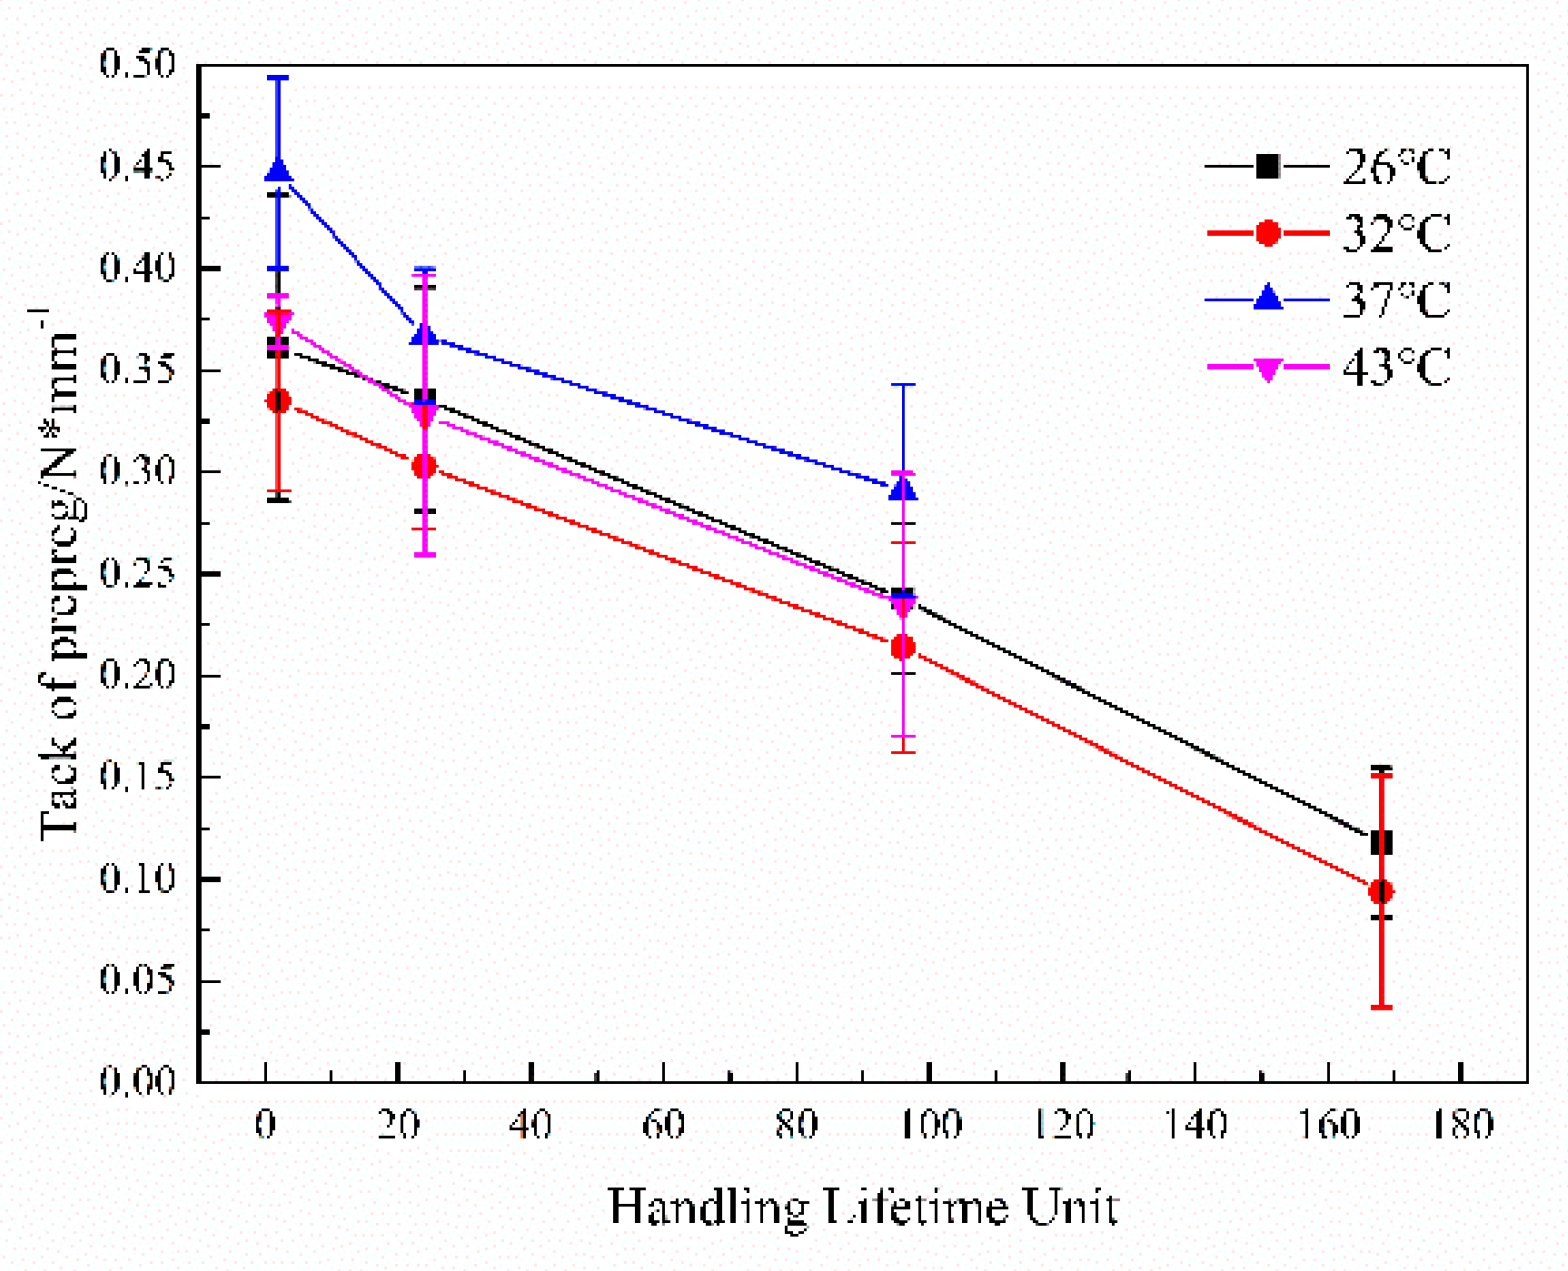
In order to establish a relationship between the change in tack value of the prepregs and time, the magnitude of the decrease in tack for one hour of ageing at 26°C/65% RH was recorded as a unit of handling life. 26℃/65%RH meets the environmental conditions of most composite material workshops. Using the unit of handling life as the horizontal coordinate, the curve of tack change with the unit of handling life is plotted. Figure 7 shows the change in tack of T-type prepregs with handling life unit. The four curves in the figure show the same slope, which indicates that when the handling life unit is the horizontal coordinate, the tack decay at different temperatures shows the same law. The unit of handling life allows the composite manufacturer to translate the available tack range of the prepreg into the maximum operating downtime at 26°C/65%RH. Even if the prepreg is subjected to complex temperature ageing during downtime or transport, the remaining handling life can be determined by measuring the difference between the tack of the prepreg and the minimum tack permitted for production. The handling life unit establishes a relationship between tack and remaining shelf life and reduces the cost of managing prepregs for manufacturers.
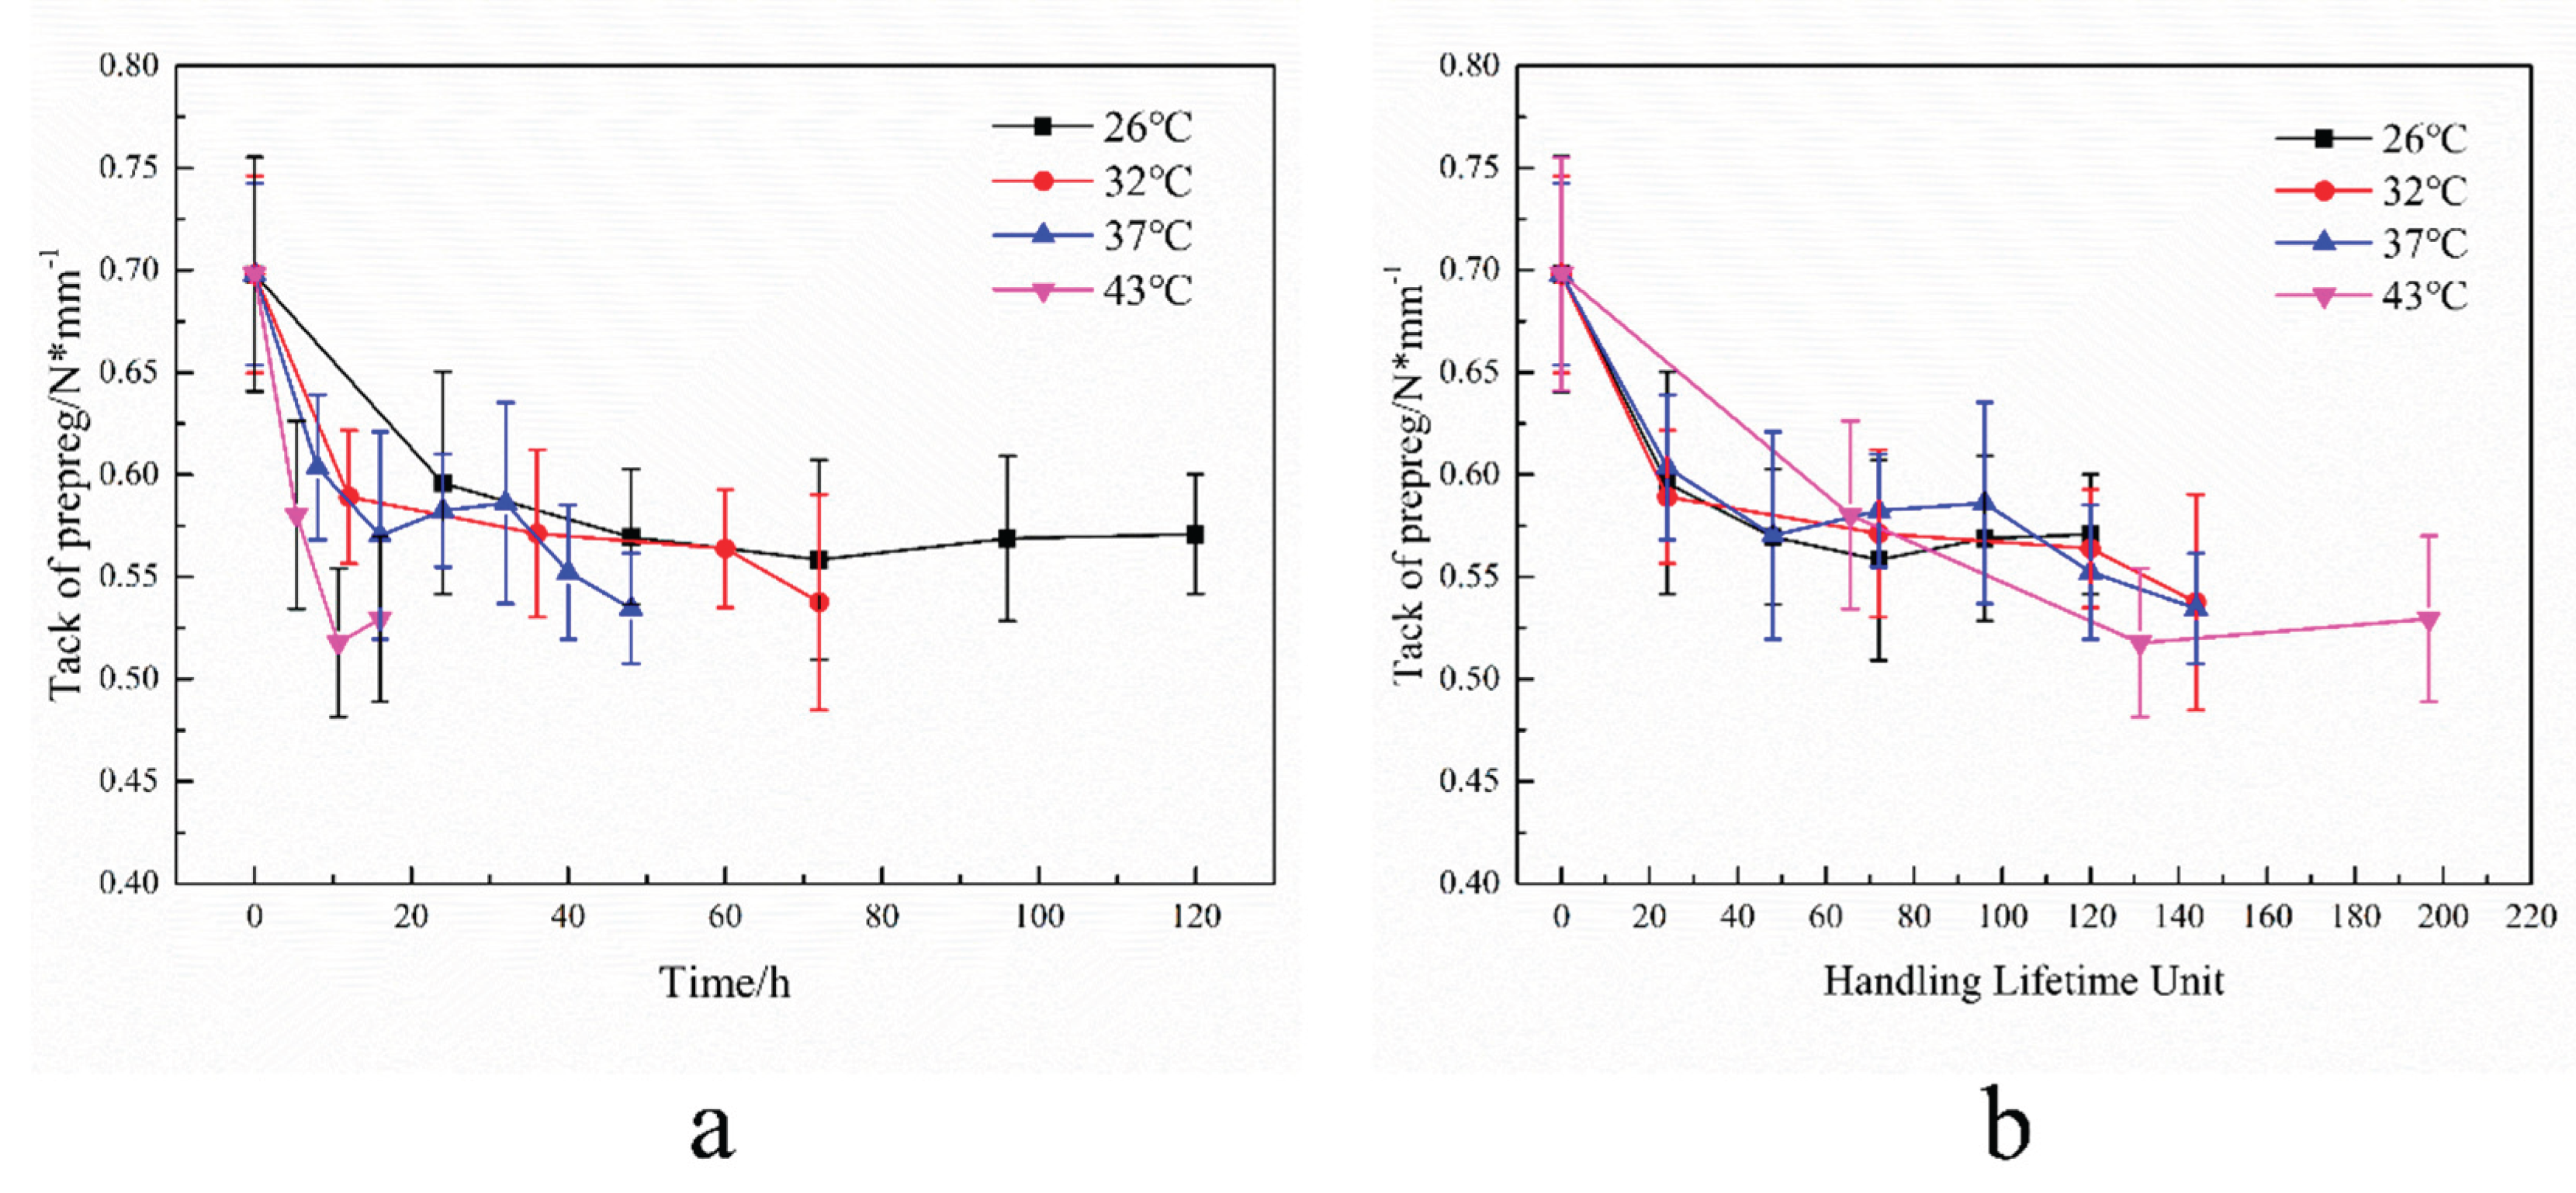
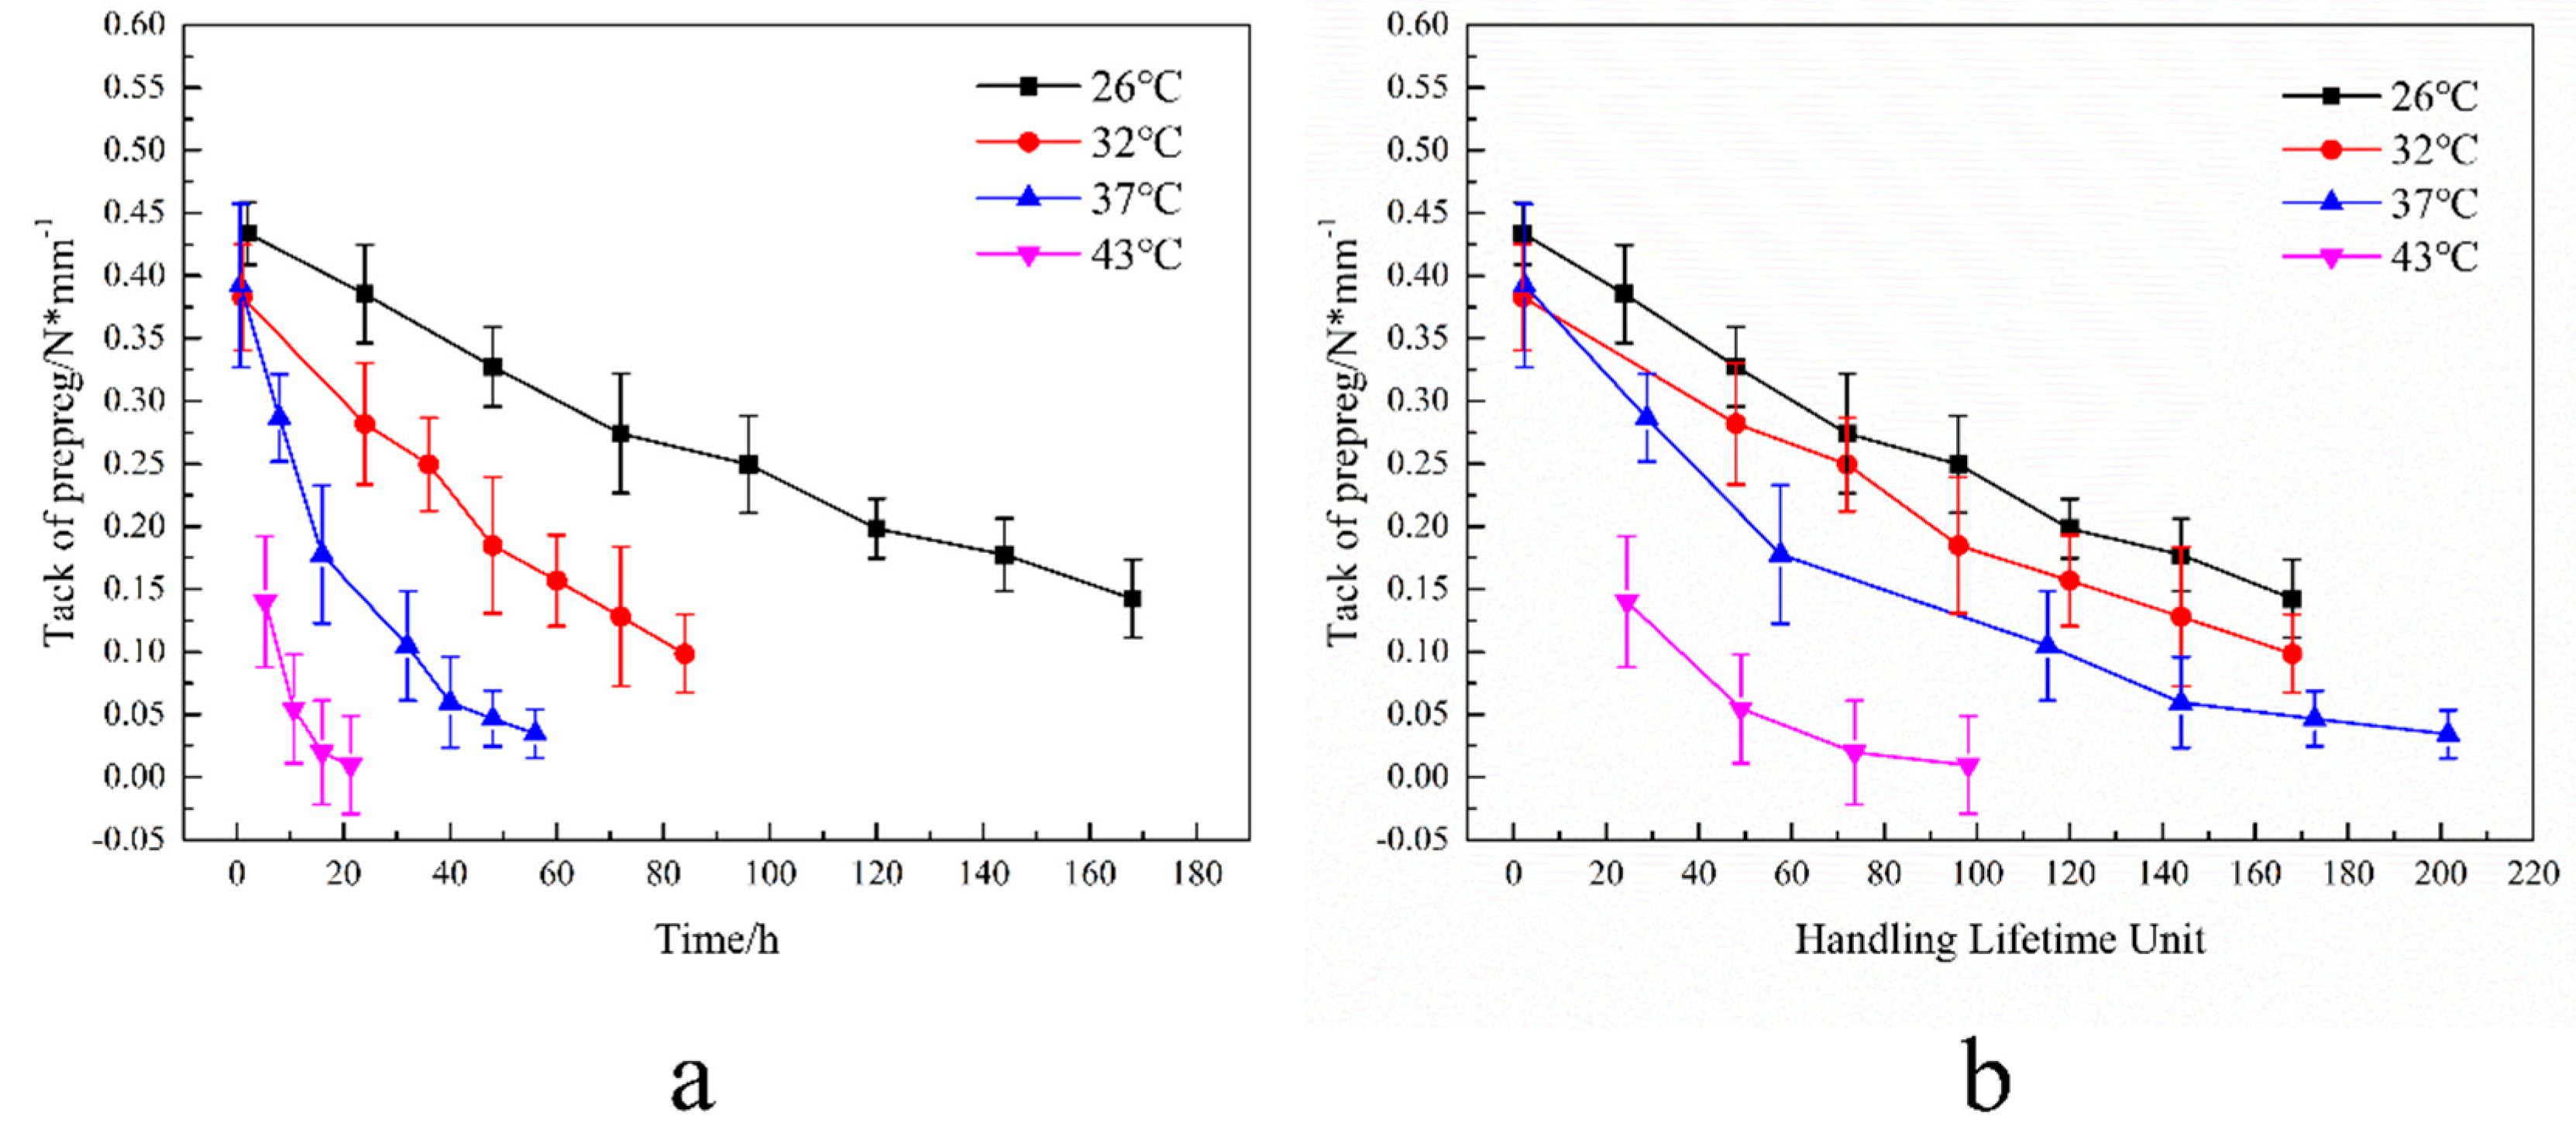
To evaluate the method's applicability to other products, C-type and H-type epoxy prepregs were also tested using the method, and the results are presented in Figure 8a and Figure 9a. The decay rates of C-type prepreg at different ageing temperatures are 1 (26°C):2 (32°C):3 (37°C):12.3 (43°C), while those of H-type is 1 (26°C):2 (32°C):3.6 (37°C):4.6 (43°C). The decay curves for each prepreg are parallel when using the handling life unit as the horizontal coordinate, as shown in Figure 8b and Figure 9b. It is observed in Figure 8 that in the final stage of ageing, the slope of the tack decay curve slows down, which is due to the slower reaction rate as the degree of cure increases.
The test method in this paper can also obtain the results of its tack decay rate at different temperatures on H-type & C-type prepregs. It proves that this method has good adaptability between different types of prepregs. The R2-test results of the above two prepregs are shown in Table 4.

4. Conclusion

In this paper, a new prepreg tack test device is designed by combining the advantages of existing studies, which is based on the T-peeling method to obtain the tack results. The results are well migrated for the automatic tape laying process. We have investigated the law of decay of prepreg tack with time at different temperatures, and the experimental measurements do not deviate more than 8.9% from the reference values given by the manufacturer. The decay of prepreg tack is due to the curing reaction of the resin, and the reaction rate at different temperatures was calculated by the Arrhenius equation, which is similar to the decay law obtained from the tack experiments.
The article proposes the concept of a handling life unit, which is used as a life unit by measuring the value of tack lost by ageing a prepreg for one hour at the operational ambient temperature. This concept allows for the establishment of a relationship between prepreg tack and remaining shelf life, reducing the administrative costs for manufacturers.

References

  1. Ahn KJ, Seferis JC. Prepreg processing science and engineering. Polym Eng Sci 1993; 33: 1177–1188.
  2. Molyneux M, Murray P, P. Murray B. Prepreg, tape and fabric technology for advanced composites. Composites 1983; 14: 87–91.
  3. Pollock L, O’Byrne S, Wild G. Quality assurance of uncured polymer matrix prepregs through the application of non-destructive methods. NDT E Int 2023; 133: 102761.
  4. Anis Baz Radwan. Experimental Analysis of the Automated Fiber Placement Manufacturing Parameters for High and Low Tack Prepreg Material. University of South Carolina, 2019.
  5. Rui X, Wang W, Jiaqi S, et al. Two-stage model of prepreg bonding interface formation in automated fiber placement process. J Reinf Plast Compos 2022; 07316844211060247.
  6. Endruweit A, Choong GYH, Ghose S, et al. Characterisation of tack for uni-directional prepreg tape employing a continuous application-and-peel test method. Compos Part A Appl Sci Manuf 2018; 114: 295–306.
  7. Endruweit A, Ghose S, Johnson BA, et al. Tack testing to aid optimisation of process parameters for automated material placement in an industrial environment. ICCM Int Conf Compos Mater 2017; 2017-Augus: 20–25.
  8. Budelmann D, Detampel H, Schmidt C, et al. Interaction of process parameters and material properties with regard to prepreg tack in automated lay-up and draping processes. Compos Part A Appl Sci Manuf 2019; 117: 308–316.
  9. Lei Z, Xianzhao X, Qian Z, et al. Influence and optimization of parameters of prepreg viscosity during placement. Chinese J Aeronaut 2022; 35: 438–449.
  10. Endruweit A, Choong GYH, Ghose S, et al. Characterisation of tack for uni-directional prepreg tape employing a continuous application-and-peel test method. Compos Part A Appl Sci Manuf 2018; 114: 295–306.
  11. Heller K, Böckl B, Ebel C, et al. Influence of prepreg aging and tack on lay-up effects/defects in thermoset automated fiber placement. ECCM18 - 18th Eur Conf Compos Mater 2018; 24–28.
  12. Amare C, Mantaux O, Gillet A, et al. Innovative test methodology for shelf life extension of carbon fibre prepregs. IOP Conf Ser Mater Sci Eng 2022; 1226: 012101.
  13. Schmidt C, Weber P, Hocke T, et al. Influence of prepreg material quality on carbon fiber reinforced plastic laminates processed by automated fiber placement. Procedia CIRP 2018; 67: 422–427.
  14. Olivia de Andrade Raponi, Barbosa LCM, Junior JEB, et al. Effects of the exposition of an autoclave prepreg to the processing environment on its properties, curing cycle and final composite behavior. Int J Adv Manuf Technol 2020; 106: 5129–5136.
  15. Chadwick CJ, Yang Y, Kalaitzidou K, et al. Processing of post-industrial unidirectional prepreg tapes using SMC equipment. Proc Am Soc Compos - 34th Tech Conf ASC 2019. Epub ahead of print 2019. [CrossRef]
  16. Sultana S, Asadi A, Colton J, et al. Composites made from CF prepreg trim waste tapes using sheet molding compounds (SMC) technology: Challenges and potential. Compos Part A Appl Sci Manuf 2020; 134: 105906.
  17. Pati S, Manomaisantiphap S, Goto T, et al. Development of CFRP with polyaniline-based resin using curable dopants employing storage stable prepregs. Appl Compos Mater 2021; 28: 381–394.
  18. Tao L, Min W, Qi L, et al. The hygrothermal aging process and mechanism of CFRP papered by prepreg that may be stored at room temperature. Polym Degrad Stab; 182. Epub ahead of print 2020. [CrossRef]
  19. Nandini A, Shute N, Elenchezhian MRP, et al. Dielectric property investigation of degraded pre-preg and performance prediction of the final composite part. Int SAMPE Tech Conf; 2018-May.
  20. Olivia de Andrade Raponi, Bárbara Righetti de Souza, Junior JEB, et al. Dielectric analysis as a low-complexity methodology for tracking prepreg out-time and its effects on the curing cycle. J Compos Mater 2019; 53: 4035–4042.
  21. Grunenfelder LK, Nutt SR. Prepreg age monitoring via differential scanning calorimetry. J Reinf Plast Compos 2012; 31: 295–302.
  22. Rabby MM, Rahman M, Das PP, et al. The effect of room-temperature aging on enthalpy and dielectric property of carbon-fiber/epoxy composite prepreg and the mechanical property of manufactured composite. Int SAMPE Tech Conf 2021; 2021-June: 592–605.
  23. Raponi O de A, Baldo Junior JE, Leite P de S, et al. Prepreg aging effects on its properties, curing process and final composite behavior characterized by dynamic mechanical analysis. J Reinf Plast Compos 2019; 38: 749–759.
  24. Jones RW, Ng Y, McClelland JF. Monitoring ambient-temperature aging of a carbon-fiber/epoxy composite prepreg with photoacoustic spectroscopy. Compos Part A Appl Sci Manuf 2008; 39: 965–971.
  25. Heller K, Hallmannseder M, Colin D, et al. Comparing test methods for the intra-ply shear properties of uncured prepreg tapes. Sci Eng Compos Mater 2020; 27: 89–96.
  26. Ahn, K J and Seferis, J C and Pelton, T and Wilhelm M. Deformation parameters influencing prepreg tack. SAMPE Q (Society Aerosp Mater Process Eng States); 23:2.
  27. Voyutskii SS, Vakula VL. The role of diffusion phenomena in polymer-to-polymer adhesion. J Appl Polym Sci 1963; 7: 475–491.
  28. Crossley RJ, Schubel PJ, De Focatiis DSA. Time-temperature equivalence in the tack and dynamic stiffness of polymer prepreg and its application to automated composites manufacturing. Compos Part A Appl Sci Manuf 2013; 52: 126–133.
  29. Crossley RJ, Schubel PJ, Warrior NA. The experimental determination of prepreg tack and dynamic stiffness. Compos Part A Appl Sci Manuf 2012; 43: 423–434.
  30. Wool RP, O’Connor KM. A theory of crack healing in polymers. J Appl Phys 1981; 52: 5953–5963.
  31. Reference class: other 31. De Gennes P-G. Reptation of a polymer chain in the presence of fixed obstacles. J Chem Phys 2009; 2: 35–42. Show / Hide Editor Save.
  32. Edwards SF. The statistical mechanics of polymerized material. Proc Phys Soc 1967; 92: 9–16.
  33. Ahn KJ, Seferis JC, Pelton T, et al. Analysis and characterization of prepreg tack. Polym Compos 1992; 13: 197–206.
  34. Dubois O, Le Cam JB, Béakou A. Experimental analysis of prepreg tack. Exp Mech 2010; 50: 599–606.
  35. Wang Y, Mahapatra S, Belnoue JPH, et al. Understanding tack behaviour during prepreg-based composites’ processing. Compos Part A Appl Sci Manuf 2023; 164: 107284.
  36. Bakhshi N, Hojjati M. An experimental and simulative study on the defects appeared during tow steering in automated fiber placement. Compos Part A Appl Sci Manuf 2018; 113: 122–131.
  37. Crossley RJ, Schubel PJ, Warrior NA. Experimental determination and control of prepreg tack for automated manufacture. Plast Rubber Compos 2011; 40: 363–368.
  38. Brooks, John R and Platt PR. 5513537 Method and apparatus to determine composite prepreg tack. 1996.
  39. Ahn KJ, Peterson L, Seferis JC, et al. Prepreg aging in relation to tack. J Appl Polym Sci 1992; 45: 399–406.
  40. Krapez J. Room-Temperature Aging of Narmco 5208 Carbon-Epoxy Prepreg. Part. Polymer (Guildf); 72.
  41. Janković B. Kinetic and reactivity distribution behaviors during curing process of carbon/epoxy composite with thermoplastic interface coatings (T800/3900-2 prepreg) under the nonisothermal conditions. Polym Compos 2018; 39: 201–220.
Figure 1. a Processes of resin movement. b The model of a random walk chain diffusing in a tube.
Preprints 101795 g001
Figure 2. a Crossley RJ 's experimental equipment , b Brooks JR 's experimental equipment.
Preprints 101795 g002
Figure 3. a Automatic lay-up platform, b Peeling test fixture.
Preprints 101795 g003
Figure 4. a Dimensions of the specimen. b Load-displacement curve for T stripping. c Inhomogeneous distribution of the resin.
Preprints 101795 g004
Figure 5. Decay of tack of T- type prepreg at different ageing temperatures.
Preprints 101795 g005
Figure 6. Ratios of tack decay rates obtained by different methods.
Preprints 101795 g006
Figure 7. The tack of T-prepregs at different ageing temperatures decays with handling life unit.
Preprints 101795 g007
Figure 8. Decay of tack of C-type prepreg at different ageing temperatures. a Change in tack over time. b Change in tack with handling life unit.
Preprints 101795 g008
Figure 9. Decay of tack of H-type prepreg at different ageing temperatures. a Change in tack over time. b Change in tack with handling life unit.
Preprints 101795 g009
Table 1. Manufacturer's recommended handling life table for T-type prepregs.
Temperature Handling life decay rate ratio
<26°C 1
26~32°C 2
32~37°C 3
37~43°C 4.5
Table 2. Ageing test table.
Ageing temperature /°C 43 37 32 26
Ageing time /Hour 5.3 8 12 24
21.3 32 48 96
37.3 56 84 168
53.3 80 120 240
69.3 104 156 312
Table 3. R2 test for T-type prepreg.
Temperature T- type prepreg of R2
26℃ 0.996
32℃ 0.995
37℃ 0.905
43℃ 0.989
Table 4. R2 test for T-type prepreg.
Temperature H- type prepreg of R2 C- type prepreg of R2
26℃ 0.981 0.547
32℃ 0.983 0.705
37℃ 0.900 0.707
43℃ 0.862 0.793
Disclaimer/Publisher’s Note: The statements, opinions and data contained in all publications are solely those of the individual author(s) and contributor(s) and not of MDPI and/or the editor(s). MDPI and/or the editor(s) disclaim responsibility for any injury to people or property resulting from any ideas, methods, instructions or products referred to in the content.
Copyright: This open access article is published under a Creative Commons CC BY 4.0 license, which permit the free download, distribution, and reuse, provided that the author and preprint are cited in any reuse.
Prerpints.org logo

Preprints.org is a free preprint server supported by MDPI in Basel, Switzerland.

Subscribe

© 2024 MDPI (Basel, Switzerland) unless otherwise stated