1. Introduction
Blasting is the most important method of breaking up mineral rock in underground mines. The advantages of this method consist of inexpensive blasting energy, simple equipment, and adapt ability to different geological conditions [
1]. The ore rock fragmentation process is dominated by the shockwave effect generated by the explosion of explosive column, which can trigger radial crack expansion. Then, along with the explosion produced high-pressure gas expansion effect makes the fissure through. Stress waves and gas pressure both play a vital role in the fragmentation and breaking of rock [
2]. Only a small amount of the energy used in the blasting process is used for rock fragmentation, with some studies suggesting that only 20-30% of the energy generated by blasting is used for fragmentation. The rest of the energy is spent on adverse effects such as fly rock, vibration, and back break [
3,
4,
5,
6]. The degree of ore rock fragmentation is the main index for evaluating the effect of blasting. However, the blasting process of rock fragmentation is dynamic and instantaneous, and it is more difficult to obtain the fragmentation characteristics inside the rock. In order to obtain damage fragmentation characteristics within the ore rock, numerical simulation is widely recognized as a highly practical method for assessing damage [
7]. Xing-sheng [
8] used numerical methods to study the effect of charge structure on the damage of surrounding rock caused by blasting. Guo [
9] used finite element software ANASYS and LS-DYNA to analyze the effect of energy in coal on cracking under blasting conditions and investigated the expansion mechanism by this numerical model. Gao and Deng [
10] used finite element software to simulate the cutting and excavation process and to analyze the domino effect and stress field of the millisecond delayed blasting process in rock. In recent years, the use of digital electronic detonators has led to a wider range of applications for precision time-delay controlled blasting technology.
Xinjiang Karatongk Mining Co., Ltd. is a copper-nickel mining enterprise. The underground ore body of this mine is disseminated copper-nickel ore. The lithology of the ore deposit is mainly basic complex, mostly in blocky structure. Apart from the fractured rock group, the stability of other ore-bearing rock groups is good, with the main body of the ore-bearing rock being dense and hard, with a P-wave velocity coefficient (f) ranging from 8 to 10. The lithology is complex, consisting of blocky structures such as diorite, gabbro, dioritic gabbro, and dioritic gabbro. In addition to the basic complex, there are also formations dominated by sedimentary breccia and intermediate to acidic veins. The geological structure is well-developed, with frequent occurrences of fracture and crushing zones within the rock mass, and it is also located in an area of recent tectonic activity. For the safe mining of the mine, the design adopts the filling mining method. Now due to the full use of digital electronic detonator, in the shaft digging and into the road quarry blasting appeared in the footage drop, the rate of large pieces of ore rose and other problems. After on-site demonstration, it is believed that the main reason for this phenomenon is that the precise delay time of digital detonator is unreasonable. Therefore, to determine the reasonable delay time of blasting has become the main technical difficulties of the mine production. This paper intends to use the finite element software ANSYS/LS-DYNA and field experiments to study the effect of precise delay on blasting damage fragmentation, and determine a reasonable delay time.
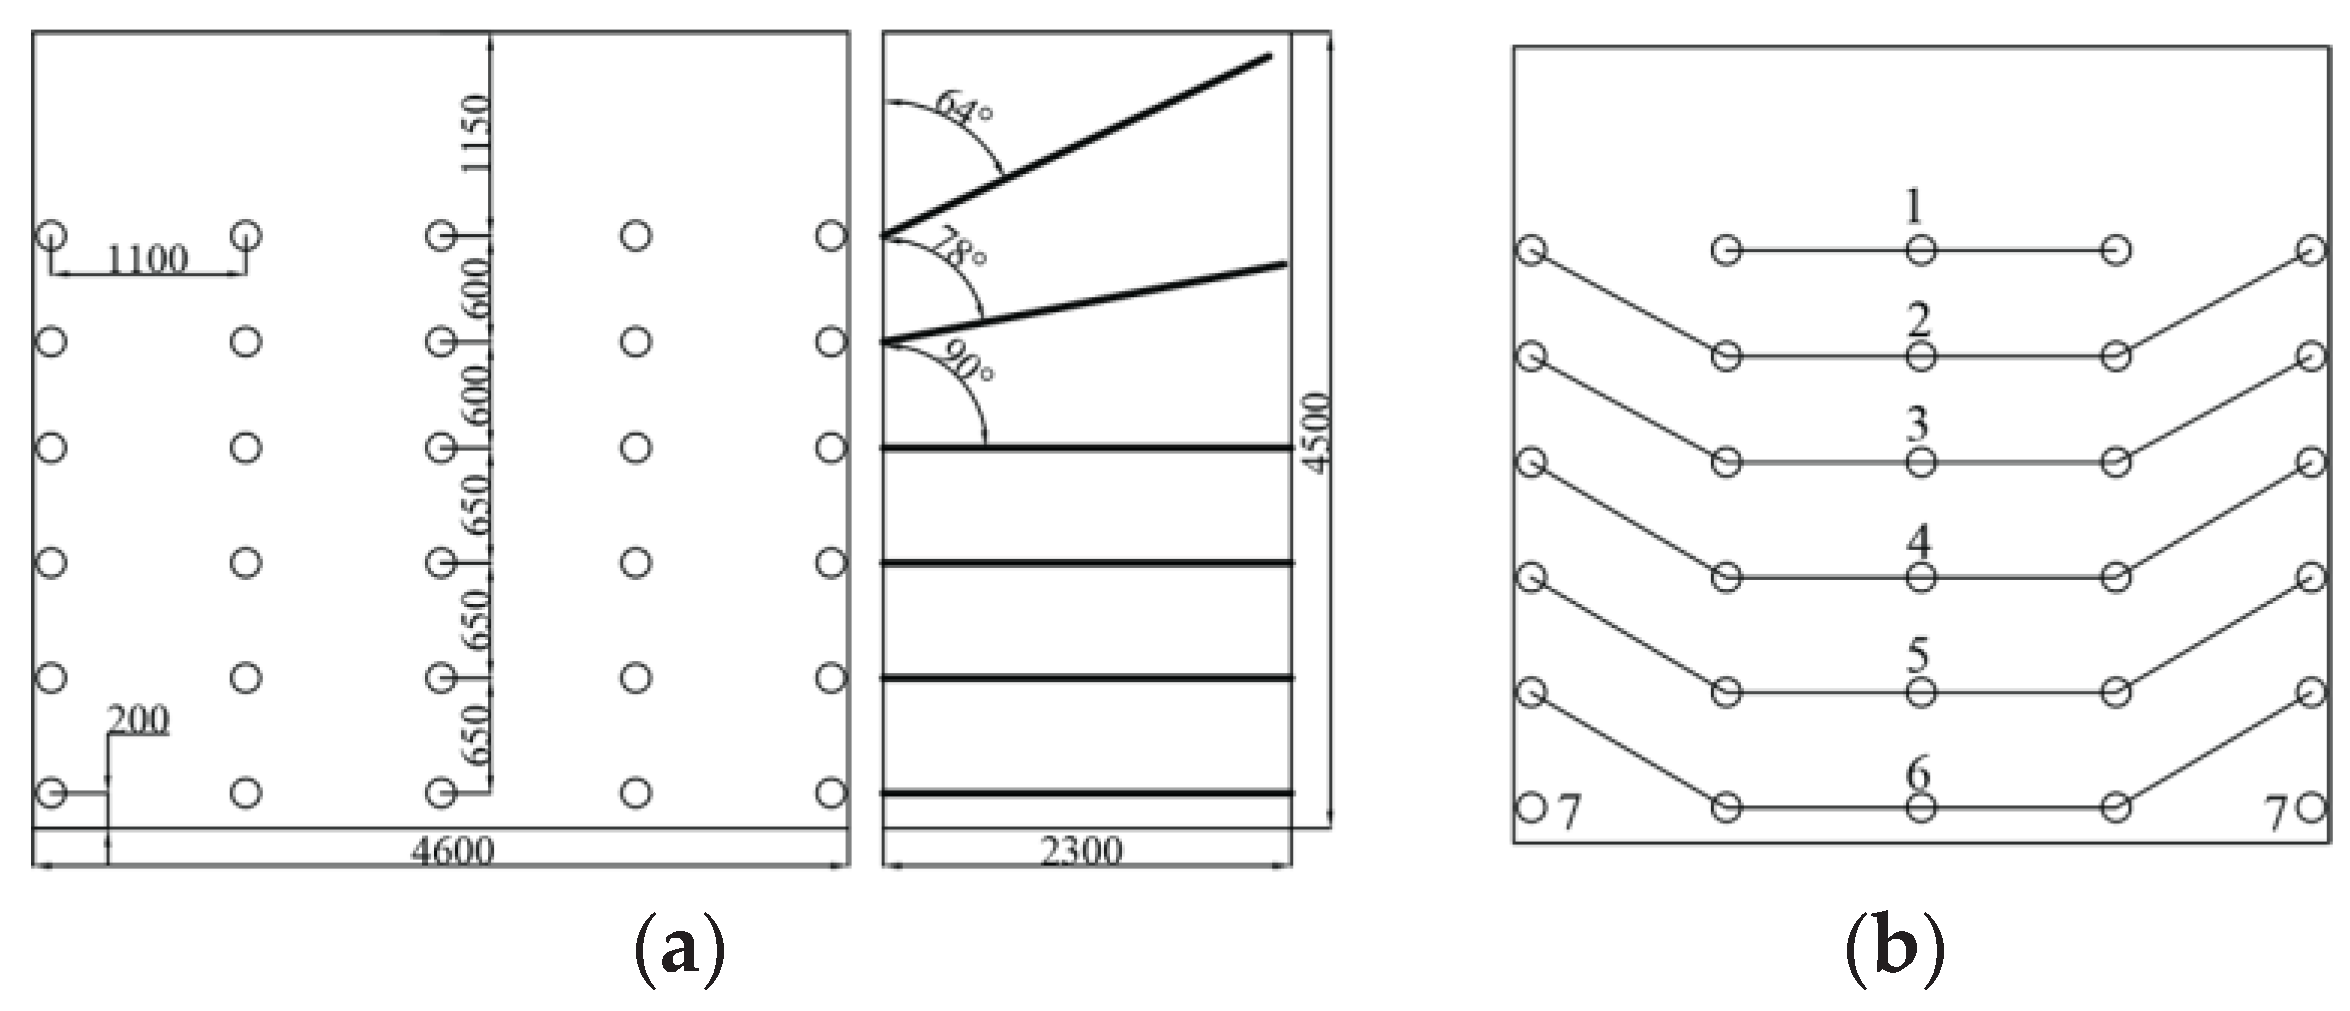
The size of mining excavation section is 4.6m×4.5m. Blast-hole arrangement, initiation network and parameters are shown in
Figure 1a,b and
Table 1. Combined with the actual project, the model is established by LS-DYNA software, as shown in
Figure 2a, brown is the filling, green is the ore, and the model length, and the size of the model is 3.0m×3.7m×6.5m. The thickness of the stope roof is 1.5m, the thickness of the ore rock left at the bottom is 0.5m, the mining height is 4.5m. 6 rows of holes are arranged, the first row of holes is 1.15m away from the stope roof, the spacing of the 1-2-3 rows is 0.6m, the spacing of the 3-4-5-6 rows is 0.65m, and the spacing of the holes is 1.1m, the angle of the first row of holes with the driving face is 65°, the angle of the second row of holes with the driving face is 79°. In the middle of the 1-2 rows of holes, set up a monitoring line (here the burden is the largest and the blasting effect is the worst).
2. Materials and Methods
2.1. Mechanical of the RHT Model
LS-DYNA is a dynamic finite element method program, that provides many models for simulating rock or rock-like materials. including commonly used is the Holomquis-Johnson-Cook (HJC) model, which is one of two models proposed by Timothy Johnson and Gordon Holmquist model [
11]. The second is the JH-2 constitutive model [
12,
13,
14]. material models also very well-known in literature are the Riedel–Hiermaier–Thoma (RHT) model [
15]. The RHT model is widely used to reveal the damage of concrete or rock materials which considers three stress limit surfaces being used to account for strength reduction and strain rate effects. This is described in detail by Borrvall and Riedel [
16]. It describes the continuous accumulation of strain in the material from elastic to plastic, the accumulation of plastic strain causes damage due to which the model starts to soften. Michał Kucewicz et al [
17]found that the JHC model could not initiate tensile cracking and only fully damaged materials with high compressive residual strength. Kong et al [
18] analyzed the advantages and disadvantages of the JHC and RHT models. The JHC model uses two stress invariants to represent the current damage surface, and is unable to capture the shear dilatancy behavior of the section during the transition from low to high pressure. Therefore, the RHT model is used to simulate the blasting damage to the mine rock in this paper.
2.2. Calibration of RHT Model Parameters
There are 38 parameters in the RHT model, of which 4 are defaulted by the software and 34 need to be calibrated.
2.2.1. Material Mechanical Parameter
Through the mechanical test and combined with the 1985 China Nonferrous Engineering Design and Research Institute completed the "Xinjiang Karatongk copper-nickel mine rock mechanics test research" data to determine the mechanical parameters
Table 2.
2.2.2. p−α Compaction Equation of State
In the
equation of state, the shear and pressure components are Coupled. pressure is expressed using the Mie-Gruneisen form with a polynomial Hugoniot curve and a
compaction relationship [
19].
where P
R is the EOS pressure in the RHT model, α is the porosity of rock and α
0 is the initial porosity. A
1, A
2 and A
3 are the polynomial coefficients. B
0 and B
1 are material constants and μ is volumetric strain. ρ
0 and
are the initial density and the internal energy per unit mass of the rock, respectively. When T
2=0, B
0, B
1, A
1, A
2 and A
3 is derived From the Rankine-Hugoniot and Mie-Gruneisen equation of state [
20].
where s is an empirical constant of rock. Meyers in his monograph [
21] gives values for the material parameter s. check the data combined with magmatic intrusion mine s=1.14.
2.2.3. Strain Rate Parameter Calibration
In the RHT model, the hydrostatic pressure is represented by a polynomial Hugonet curve and a
compression relation. Under quasi-static conditions, the failure strength of the rock can be obtained by triaxial compression tests. The dynamic failure strength is obtained from the static breaking strength, and the failure surface stress is described as the yield surface through the compressive strength, regularized yield function Willam-Warnke function [
22]:
where
is the unconfined uniaxial compressive strength.
is the normalized yield function R
3 is the Lode angle function, which accounts for the reduced strength of shear and tensile meridians [
23],
is the Lode angle. Fr is the dynamic strain rate increase factor,
is the normalized pressure (the parameters with a superscript * in the paper is the result of the normalization process),
is the strain rate,
is the effective plastic strain.
,
is the hydrostatic pressure.
where
is the reference strain rate under compression,
is the reference strain rate under tension, , f
t is the tensile strength,
and
are the material constants for compression and tension,
, respectively[
24,
25].
2.2.4. Material Damage Model Parameters
The model damage curve is defined as:
When the material is under quasi-static loading conditions,
takes the value of 1. Parameters A and N can be obtained from the expression for the damage surface at
. Thus, the failure surface expression when
is as follows:
where
is the normalized strength,
, A
1 and N
1 are the failure surface parameters. The results of normalized p and Y are obtained from the experimental data of triaxial rock mechanics in
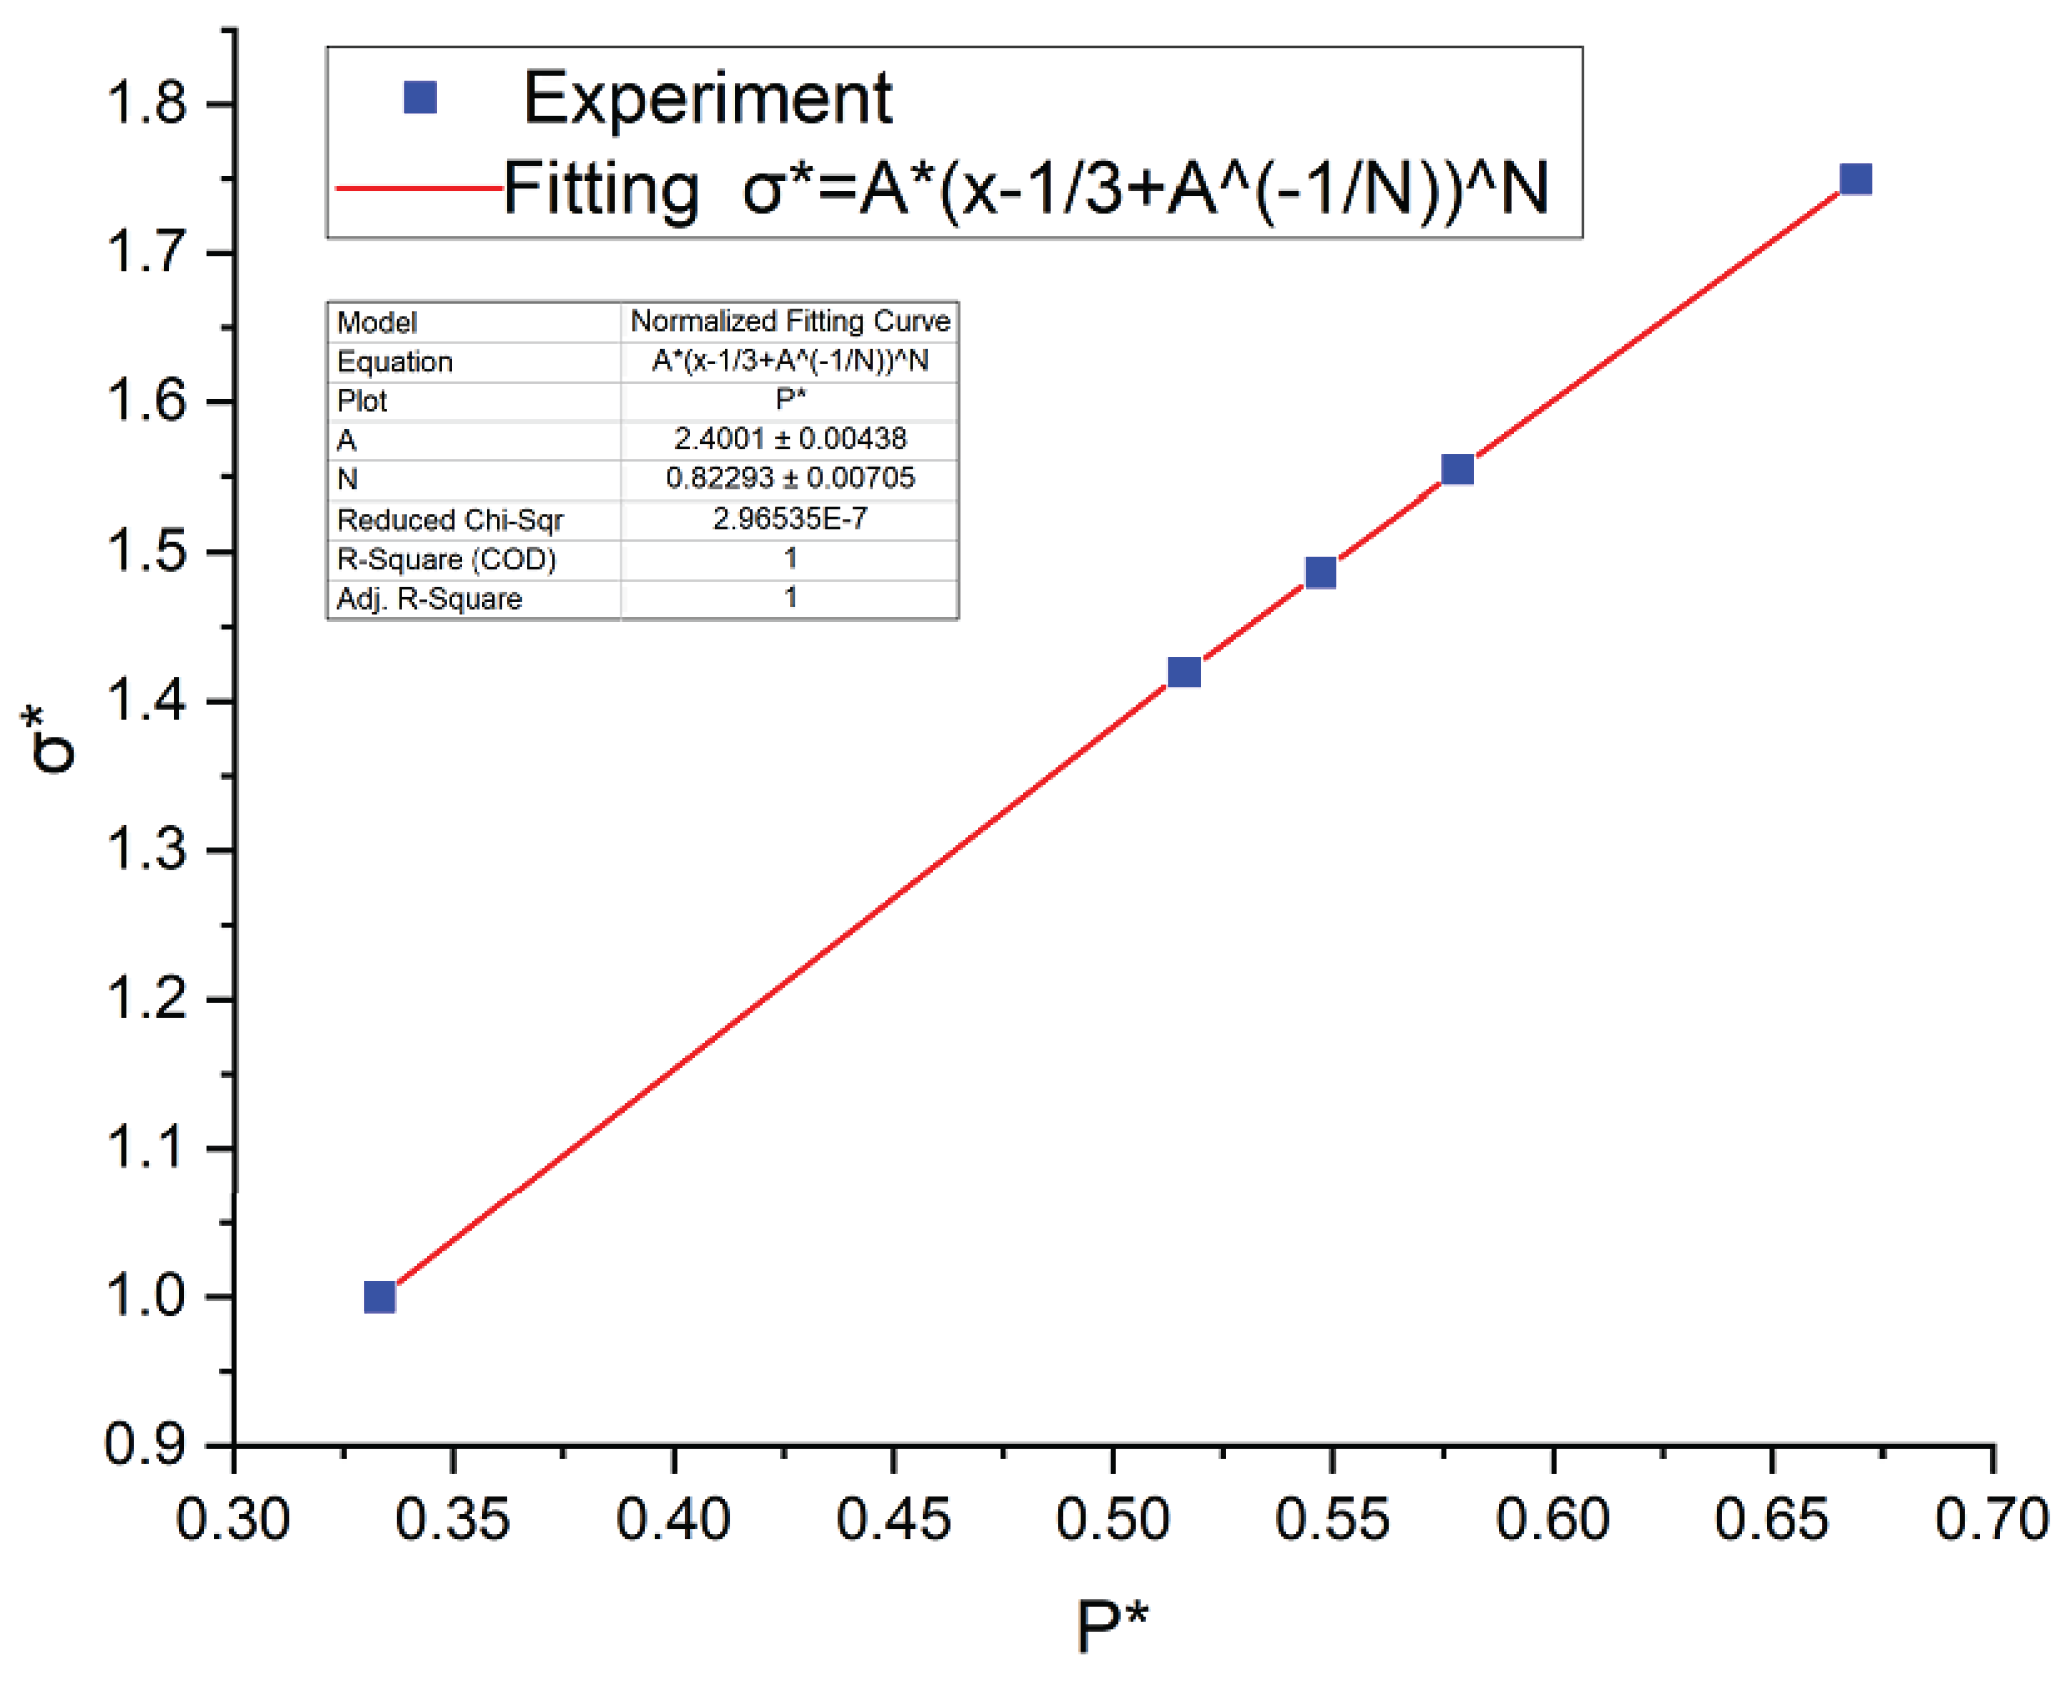
Table 2, with P as x-axis and Y as y-axis, and the curve of mode 3 is obtained by linear fitting to obtain A
1=2.4, N
1=0.82, as shown in
Figure 3.
The p and y in
Table 3 are obtained from the following equations (11) and (12) [
26]:
In the RHT model, Damage variable is defined as the accumulation with plastic strain
:
where
is the plastic strain at failure.
When the stress state reaches the ultimate strength of the material on the damage surface, damage accumulates gradually during inelastic deformation or plastic strain. The plastic strain
at damage for this model is defined as [
27]:
where
is the minimum damaged residual strain, D
1 and D
2 are the damage constants for the RHT model. The variables are based on the findings in the literature [
28], D
1 = 0.04, D
2=1.0.
In the RHT model, the maximum reduction in strength at the stretching meridian is described by the factor of the following equation:
where Q
0 and B
Q are introduced as lode angle-dependence factors to describe the maximum reduction in strength on the tensile meridian. Thus, the tensile strength can be obtained by multiplying Eqs. (1) and (2). Q
0 and B
Q values can be obtained from the results of biaxial compression or triaxial tension. In this study, Q
0 = 0.68 and B
Q = 0.0105 were determined using the method of Li [
29].
In summary, the mineral rock RHT parameters are calibrated as shown in
Table 4.
2.3. The Air Model
In this study, the air was modeled as [*MAT_ Null_(TITLE) (009)]. which is modeled as an empty material model, and its physical and material behaviors can be described using a linear polynomial EOS [
30], and the pressure was calculated using the following equation:
where C
0, C
1, C
2, C
3, C
4, C
5 and C
6 are constants,
is the ratio of the relative density, E
0 is the initial internal energy and
is the relative volume. The linear polynomial equation generally represents an ideal gas with the gamma law EOS, where C
0 = C
1 = C
2 = C
3 = C
6 = 0 and C
4 = C
5 =γ−1 . Therefore, the pressure can be written as:
Whe where γ is the adiabatic index for air behaving as an ideal gas and equal to (19) [
31].
Table 5 gives the air parameters that are used in the present study from Mohamed H. Mussa [
32].
2.3. The Air Model
In the simulation, *MAT_HIGH_EXPLOSIVE_BURN was applied to model the explosives. The (JWL) EOS was used to characterize the relationship between the change in pressure and the relative volume of rock during blasting. The JWL-EOS equation of state is expressed as [
33]:
where P is the burst pressure, E is the internal energy per unit volume, V is the relative volume, A, B, R
1, R
2 and ω are material constants.
Table 6 shows the parameters used in the simulations, which were taken from the literature [
34].
3. Results
In the blasting model, the main focus is on the blasting area mineral rock, and the blasting mineral rock study area is obtained by the box cut method.
3.1. Characteristics of Fracture Propagation and Connecting Crack of Inter-Row and Inter-Hole Fissures under Different Delay Time Conditions
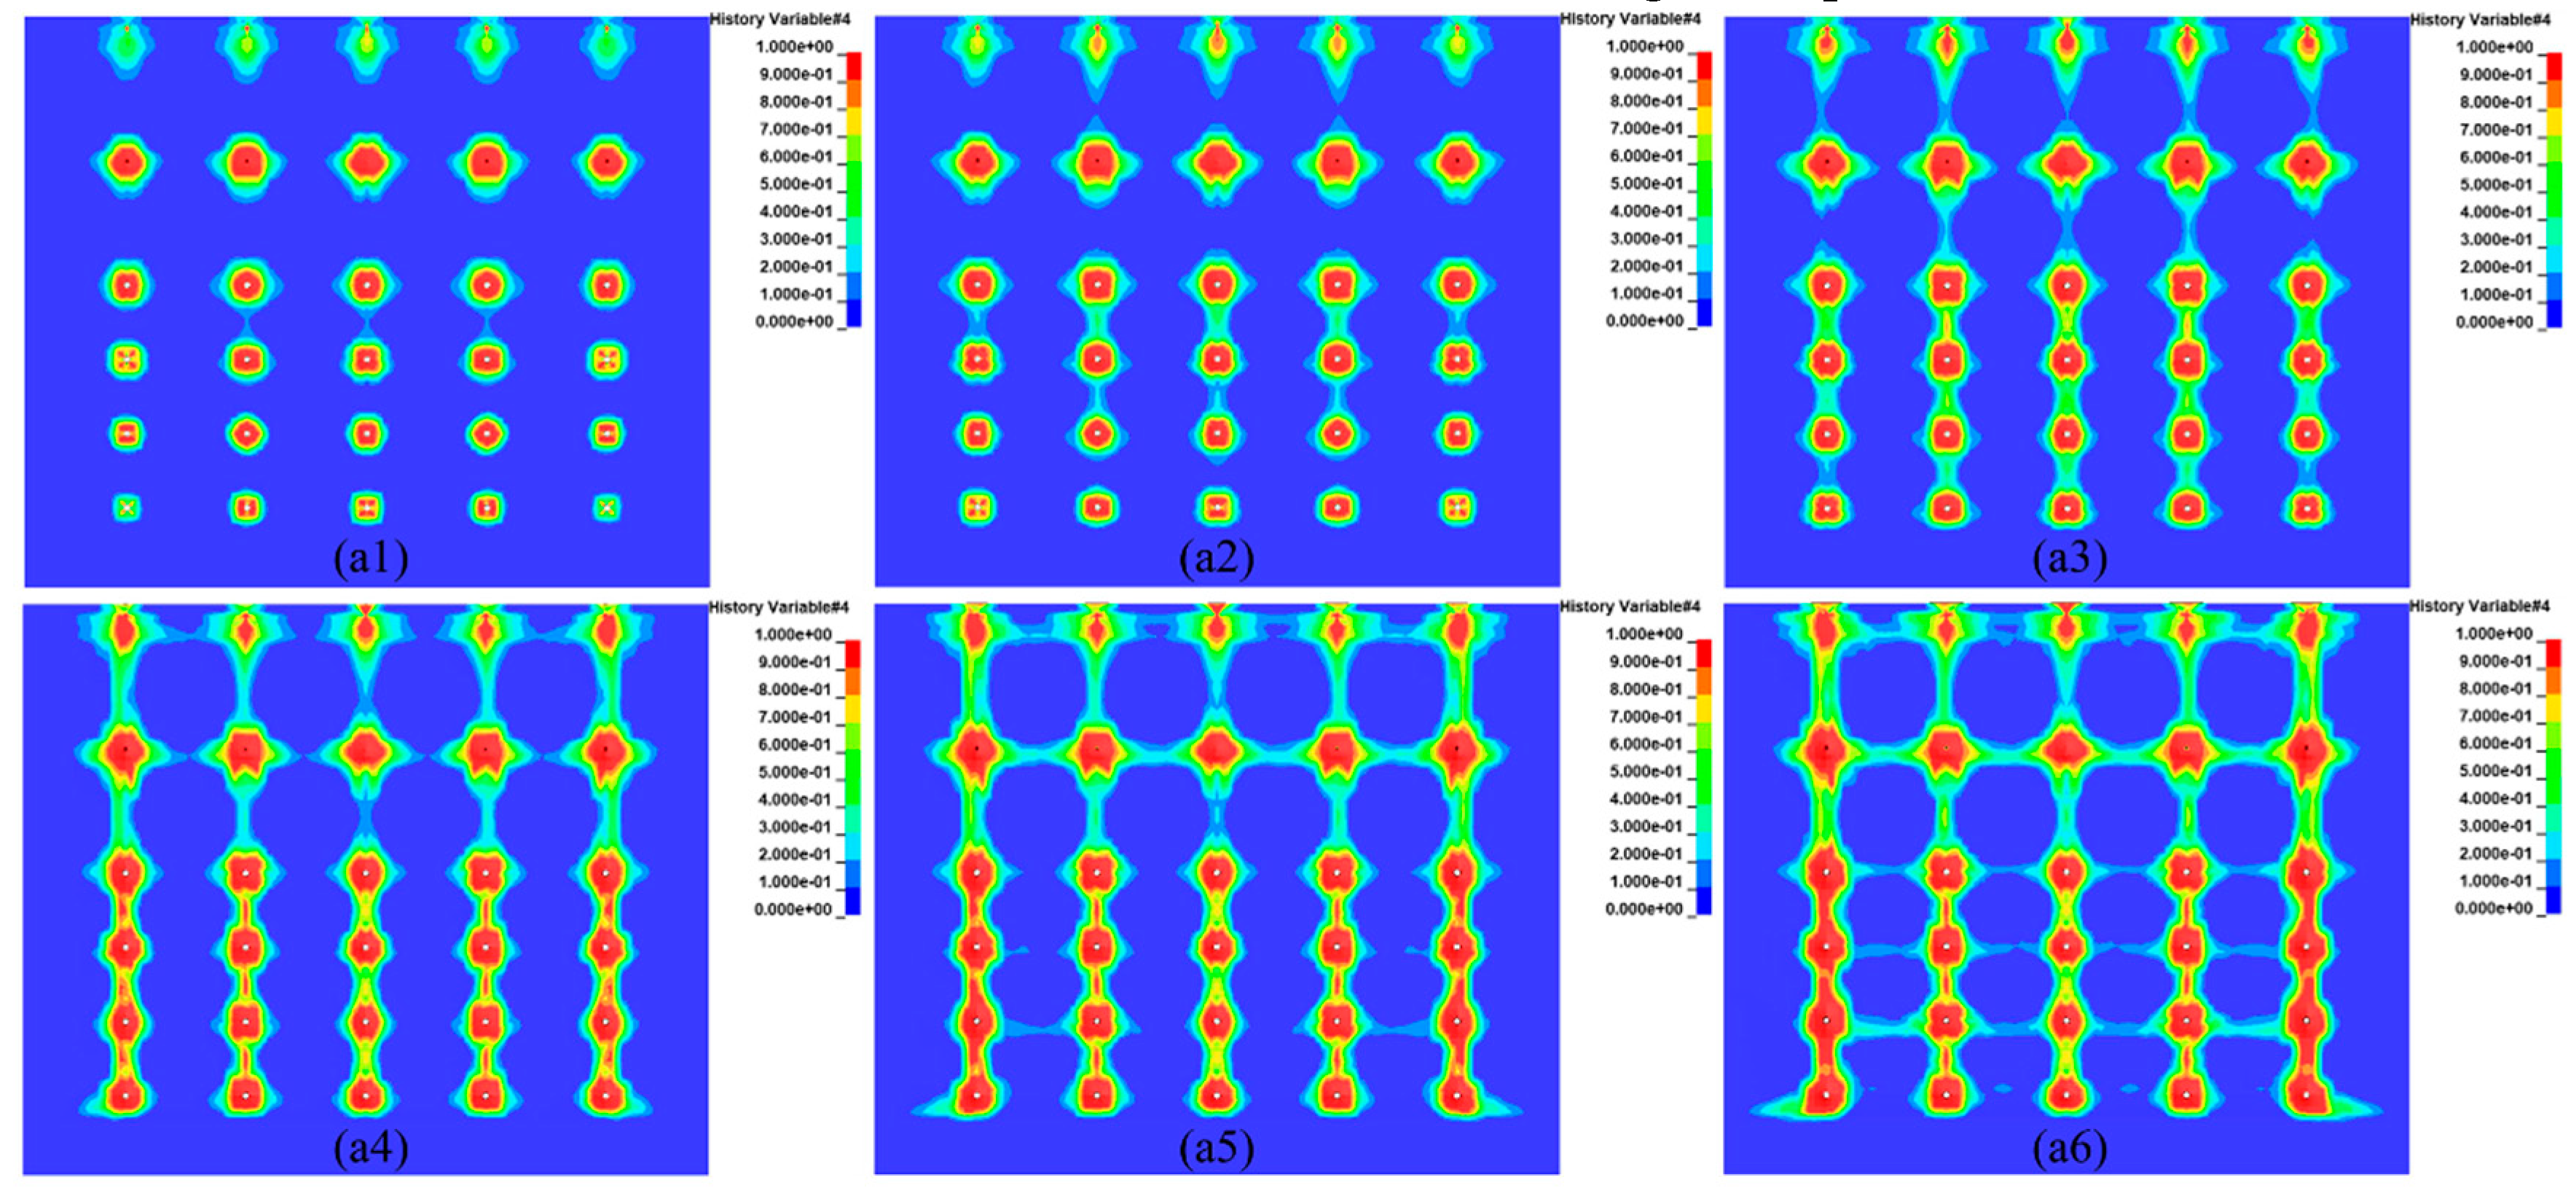
In the numerical simulation of cloud diagrams can be seen after the detonation of the obvious crushed area and fissure area, and then the formation of fissure expansion between the holes until the penetration. However, different delay time (25ms, 50ms, 75ms) under the conditions of blasting fracture characteristics there are more obvious differences, the overall presentation of the first vertical fracture penetration between the rows, after the transverse fracture penetration between the holes. In this paper, inter-row refers to the vertical between rows, and inter-hole refers to the transverse between holes.
Under the 25ms delay time condition, the inter-row fissure extension penetration characteristics show that the fracture penetration occurs firstly in the ore rock between rows 3-4 (
Figure 4a1), followed by the fracture penetration between rows 4-5 (
Figure 4a2), and then after the fracture penetration between rows 5-6, the fracture penetration occurs in the last rows 2-3 (
Figure 4a3). Inter-hole ore fissure extension penetration shows that the first row and the second row of holes almost simultaneous fracture penetration (
Figure 4a4); followed by the fifth row of holes between the fracture penetration (
Figure 4a5); and finally the third, fourth and fifth rows of holes almost simultaneous fracture penetration (
Figure 4a6). Does not show the sequence of time with the detonation of inter-row and inter-hole fracture extension through the phenomenon.
Under the 50ms delay time condition, the ore rock fissure extension penetration between the rows showed different phenomena from that under the 25ms delay time condition. Firstly, with the order of the blast time of the holes, the ore rock fissure penetration occurred firstly between rows 1-2 (
Figure 5b1), followed by fissure penetration between rows 3-4 and rows 4-5 (
Figure 5b2), followed by fissure penetration between rows 2-3 (
Figure 5b3), and finally fissure penetration between rows 5-6. Inter-hole mineral rock fissure extension penetration shows that the first row and the second row of holes between the almost simultaneous occurrence of penetration (
Figure 5b4), followed by the third, fourth and fifth rows of simultaneous fracture expansion (
Figure 5b5), and finally between the rows of almost simultaneous occurrence of penetration (
Figure 5b6). At this time, with the sequence of the blast time of the holes lead to inter-row and inter-hole crack expansion through the phenomenon than the 25ms delay time conditions are obvious.
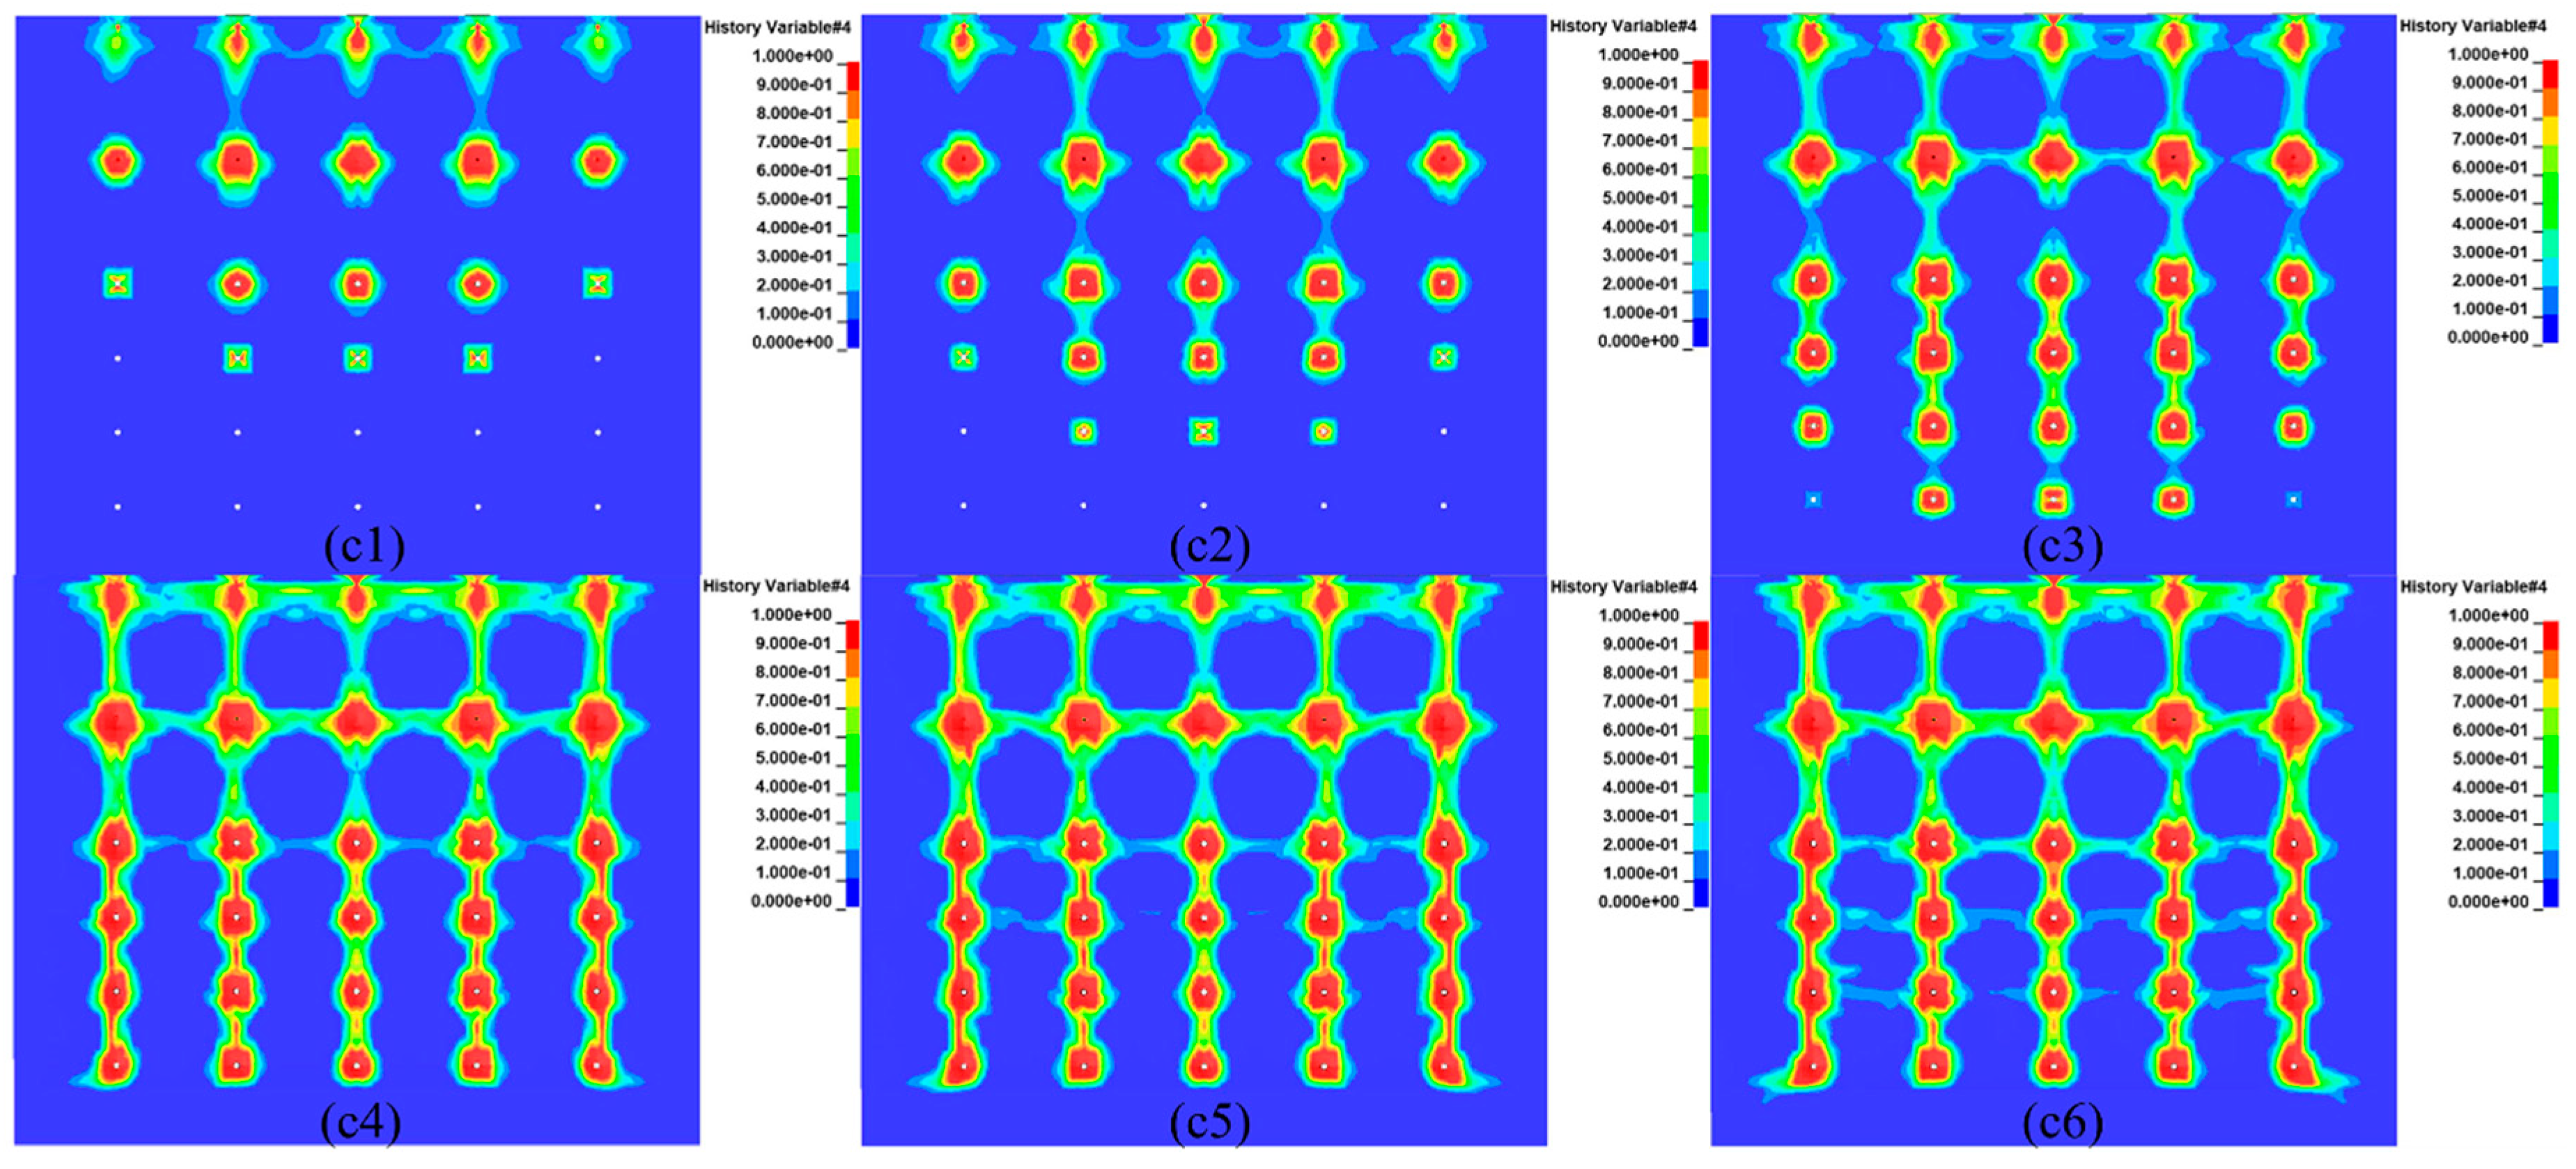
Under the 75-ms delay time condition, the fracture extension penetration of the mineral rock between rows shows a different phenomenon from the 25-ms and 50-ms delay time conditions. When fracture penetration occurred between rows 1-2, fracture extension also occurred between the holes in row 1, showing the synchronization of fracture extension penetration between rows and holes (
Figure 6c1). After the fracture penetration between rows 3-4, the fracture extension penetration of the ore rock between rows 2-3 occurred in a very short time, which was much earlier than that in the 25ms and 50ms delay time cases (
Figure 6c2), and finally the fracture penetration of the ore rock between rows 4-5 and rows 5-6 occurred one after another in accordance with the time trajectory (
Figure 6c3). In the inter-hole ore rock fracture extension penetration, showing alternating characteristics with the inter-row ore rock fracture extension penetration. Fracture penetration occurred between rows 1-2 before the inter-row ore rock fracture extension penetrated all the way through (
Figure 6c4). After the inter-row fracture extensions penetrated, the fracture extensions in the ore rock between the holes in rows 3, 4, and 5 penetrated consecutively over time (
Figure 6c5,c6).
In summary, the reason for the above fracture extension through the difference may be due to the 25ms delay time is shorter, resulting in the upper part of the 1st row and 2nd row between the rock fissure has not yet completely through, the lower 3-4 rows of fissure has been extended through. Resulting in 1, 2 rows of holes in the area of the rock has not yet collapsed, which not form enough compensation space, the lower 3-4-5 rows have been fractured through, the fissure makes a large loss of explosive energy, not conducive to blasting broken and thrown. In the 75ms delay time conditions, the lower 3-4 rows of fissures have not yet penetrated before the upper row 1 and 2 rows of holes between the fissures have occurred through. It shows the continuous inter-row and inter-hole mineral rock fissure expansion and penetration characteristics from top to bottom with time change. Formation of the upper row 1 and row 2 region of the ore rock in the row and hole first through the inter-row and inter-hole broken and thrown, for the lower 3-4-5-6 rows of holes in the region of the ore rock blasting to provide good compensation space. Therefore, 75ms delay time is more conducive to blasting broken and thrown. In the 50ms delay time conditions, between the rows and holes between the mineral rock fracture expansion and penetration characteristics between 25ms and 75ms, showing a local area with the successive time of the blast holes between the holes and between the rows of fracture expansion and penetration characteristics, but not as obvious as 75ms delay fracture expansion and penetration characteristics of the law.
3.2. Stress and Damage Characteristics of Ore Rocks under Different Delay Time Conditions
In the numerical simulation results, the effective stress (Mises equivalent stress) is generally used to characterize the stress properties of the ore rock [
35]. To further analyze the fragmentation characteristics under different delay times. In the numerical simulation model, the burden between 1-2 rows of holes is the largest. Therefore, the 1-2 rows of holes are in the most unfavorable state during fragmentation, so the centerline position of the 1-2 rows of holes (red line in
Figure 2) is selected to be about 3.6 m long, and a monitoring point (A1, A2, A3, A4, A5, A6, A7) is taken at an equal spacing every about 0.6 m to assess the mechanical properties of the ore rock and the damage characteristics.
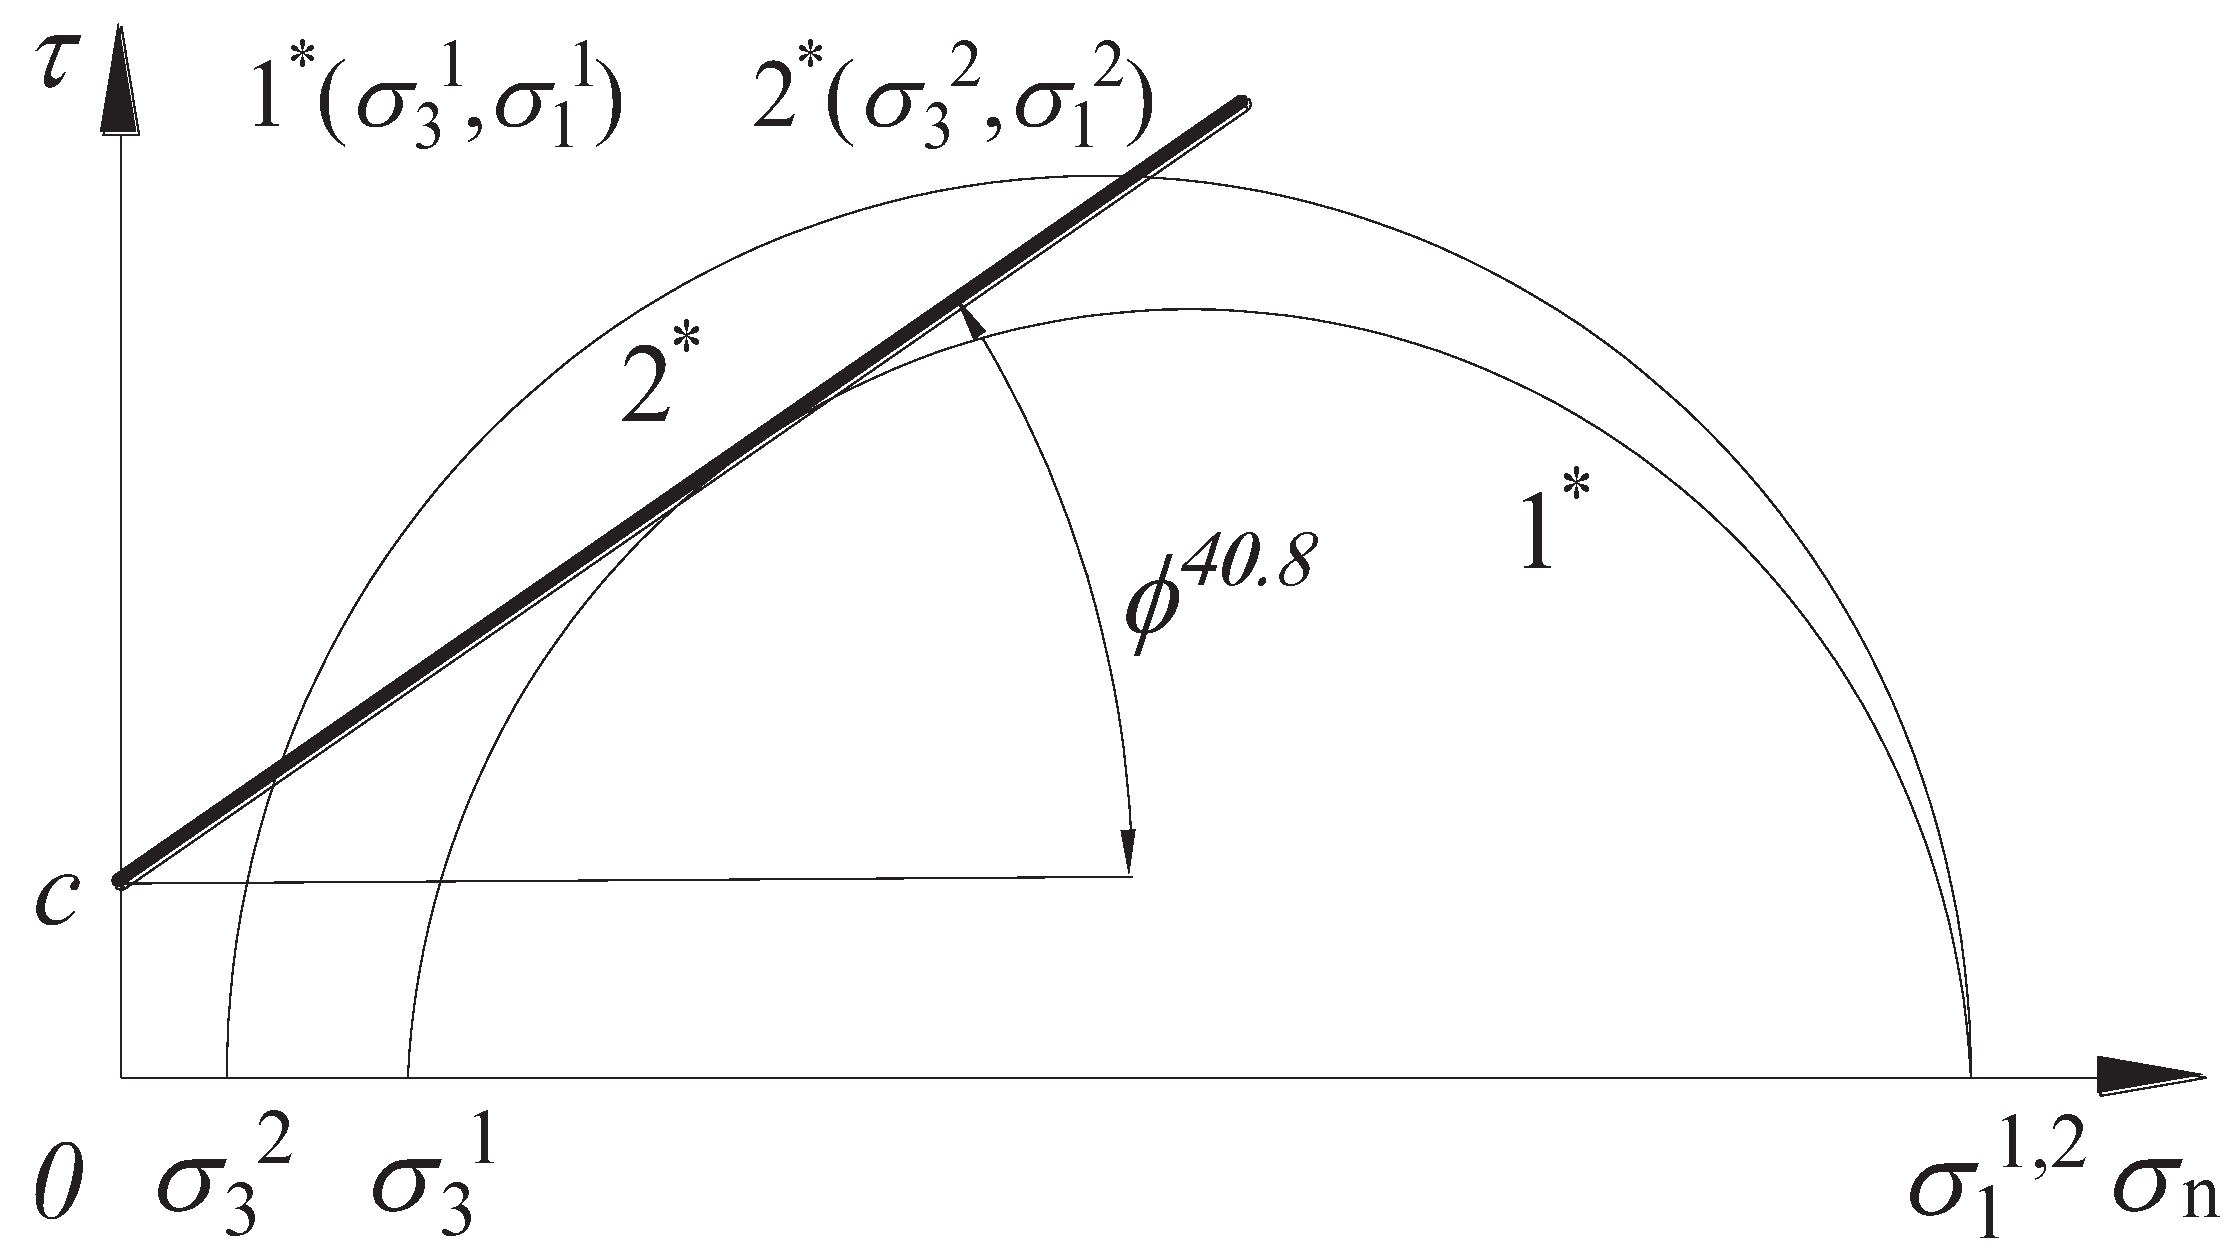
The Moore-Coulomb damage theory is widely used in the field of geotechnical engineering. This paper is based on the Moore-Cullen damage criterion, whose shear strength
is equal to the sum of the friction generated by the rock cohesion c and the corresponding normal stress
on the shear plane, as shown in expression (21). At the limit equilibrium state
Figure 7-1* of the maximum principal stress, the minimum principal stress is back-calculated using the maximum principal stress, when the calculated minimum principal stress is less than the minimum principal stress at the limit equilibrium state (as shown in
Figure 7-2* of the stress state). At this time, the molar stress circle must exceed the Coulomb shear stress envelope, at this time must occur damage (shown in
Figure 7), this paper cohesion c is 21.3 MPa, the internal friction angle of 40.8 °, the calculation formula is shown in (22):
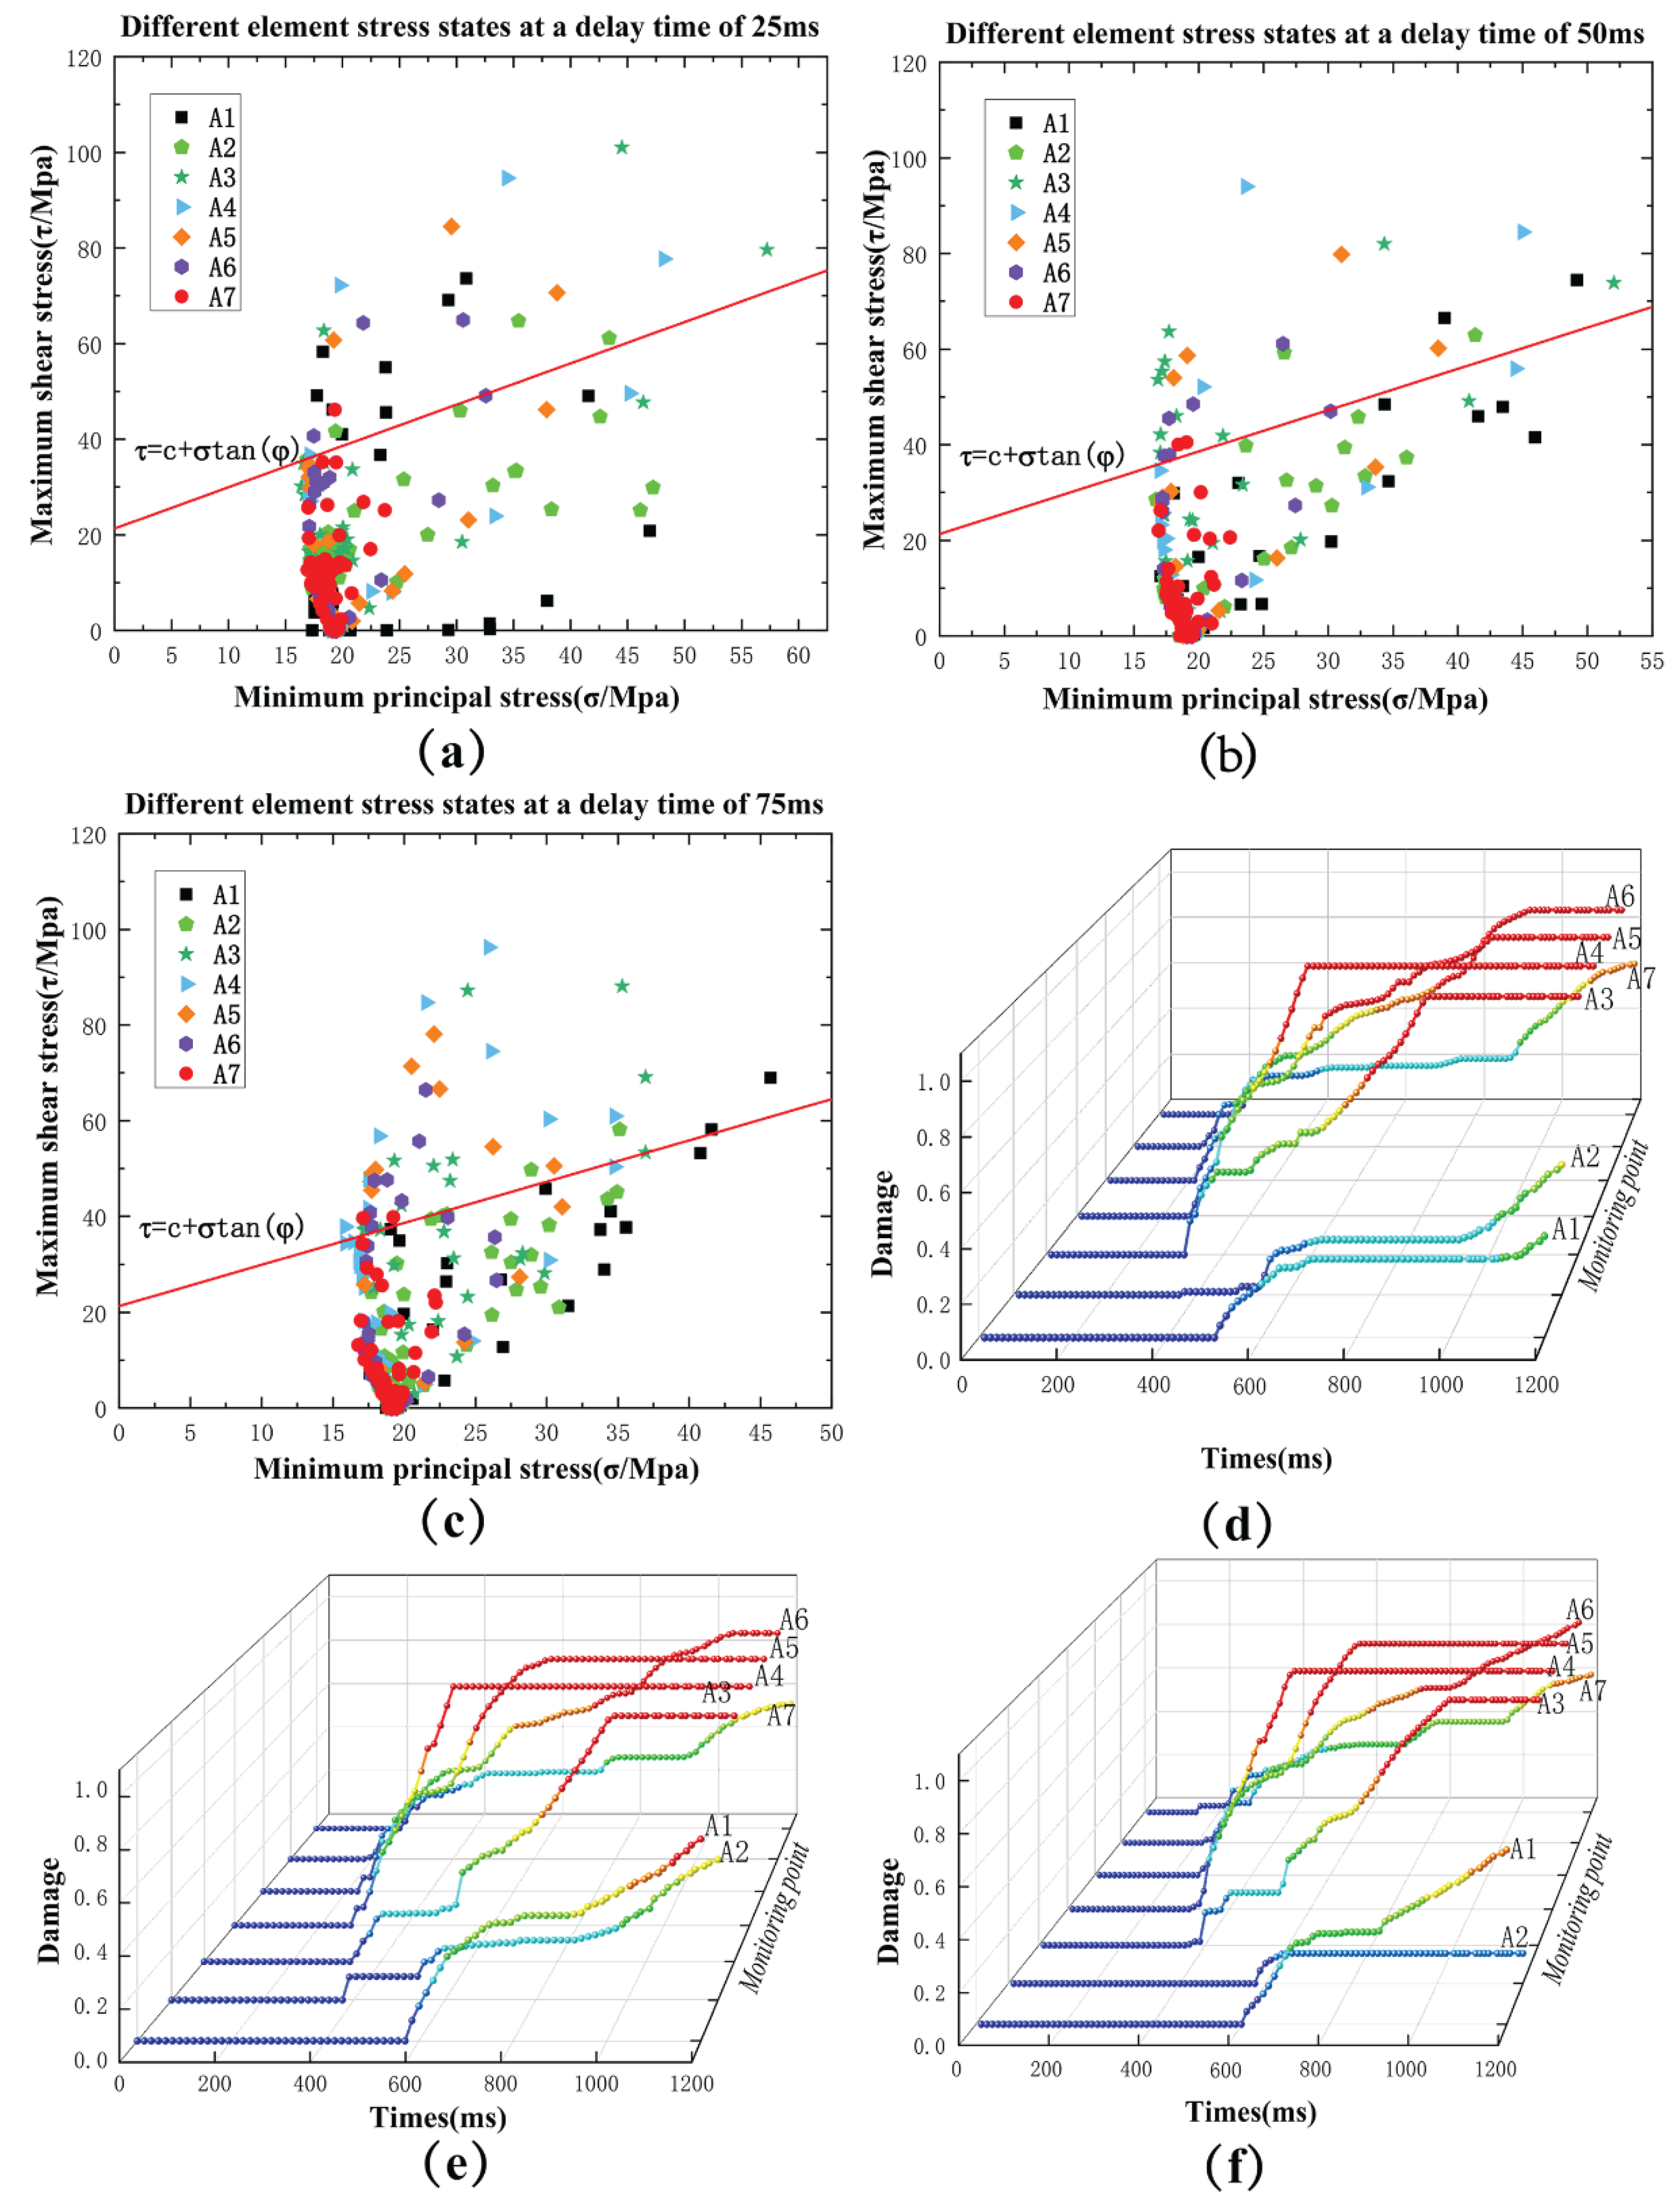
In summary, the stress state and damage curves of monitoring points (A1, A2, A3, A4, A5, A6, A7) at different delay times (25ms, 50ms, 75ms) were obtained respectively, as shown in
Figure 8. Comparing the stress state of each monitoring point outside the Moore-Coulomb damage envelope in
Figure 8a–c, it can be seen that the monitoring point A1 (at the driving face) has the most damage points outside the envelope at the delay time of 25ms, while it only reaches the limit equilibrium stress state at 75ms. Monitoring point A3 (1.2m from the palm face) has the most damage points outside the envelope at a delay time of 50ms. Monitoring points A4 and A5 (in the middle of the explosives) have the most damage points outside the damage envelope when the delay time is 75ms. The stress state of monitoring points A6 and A7 is similar, especially the stress state of the farthest end of A7 is not much affected by the delay time, which is mainly due to the fact that the ore rock at the bottom of the hole is not affected by the reflection of the tensile stress wave. It can be seen that along the direction of the blasthole, the destructive stress state in the ore rock from the driving face is gradually strengthened with the increase of the delay time. Through the damage curves in
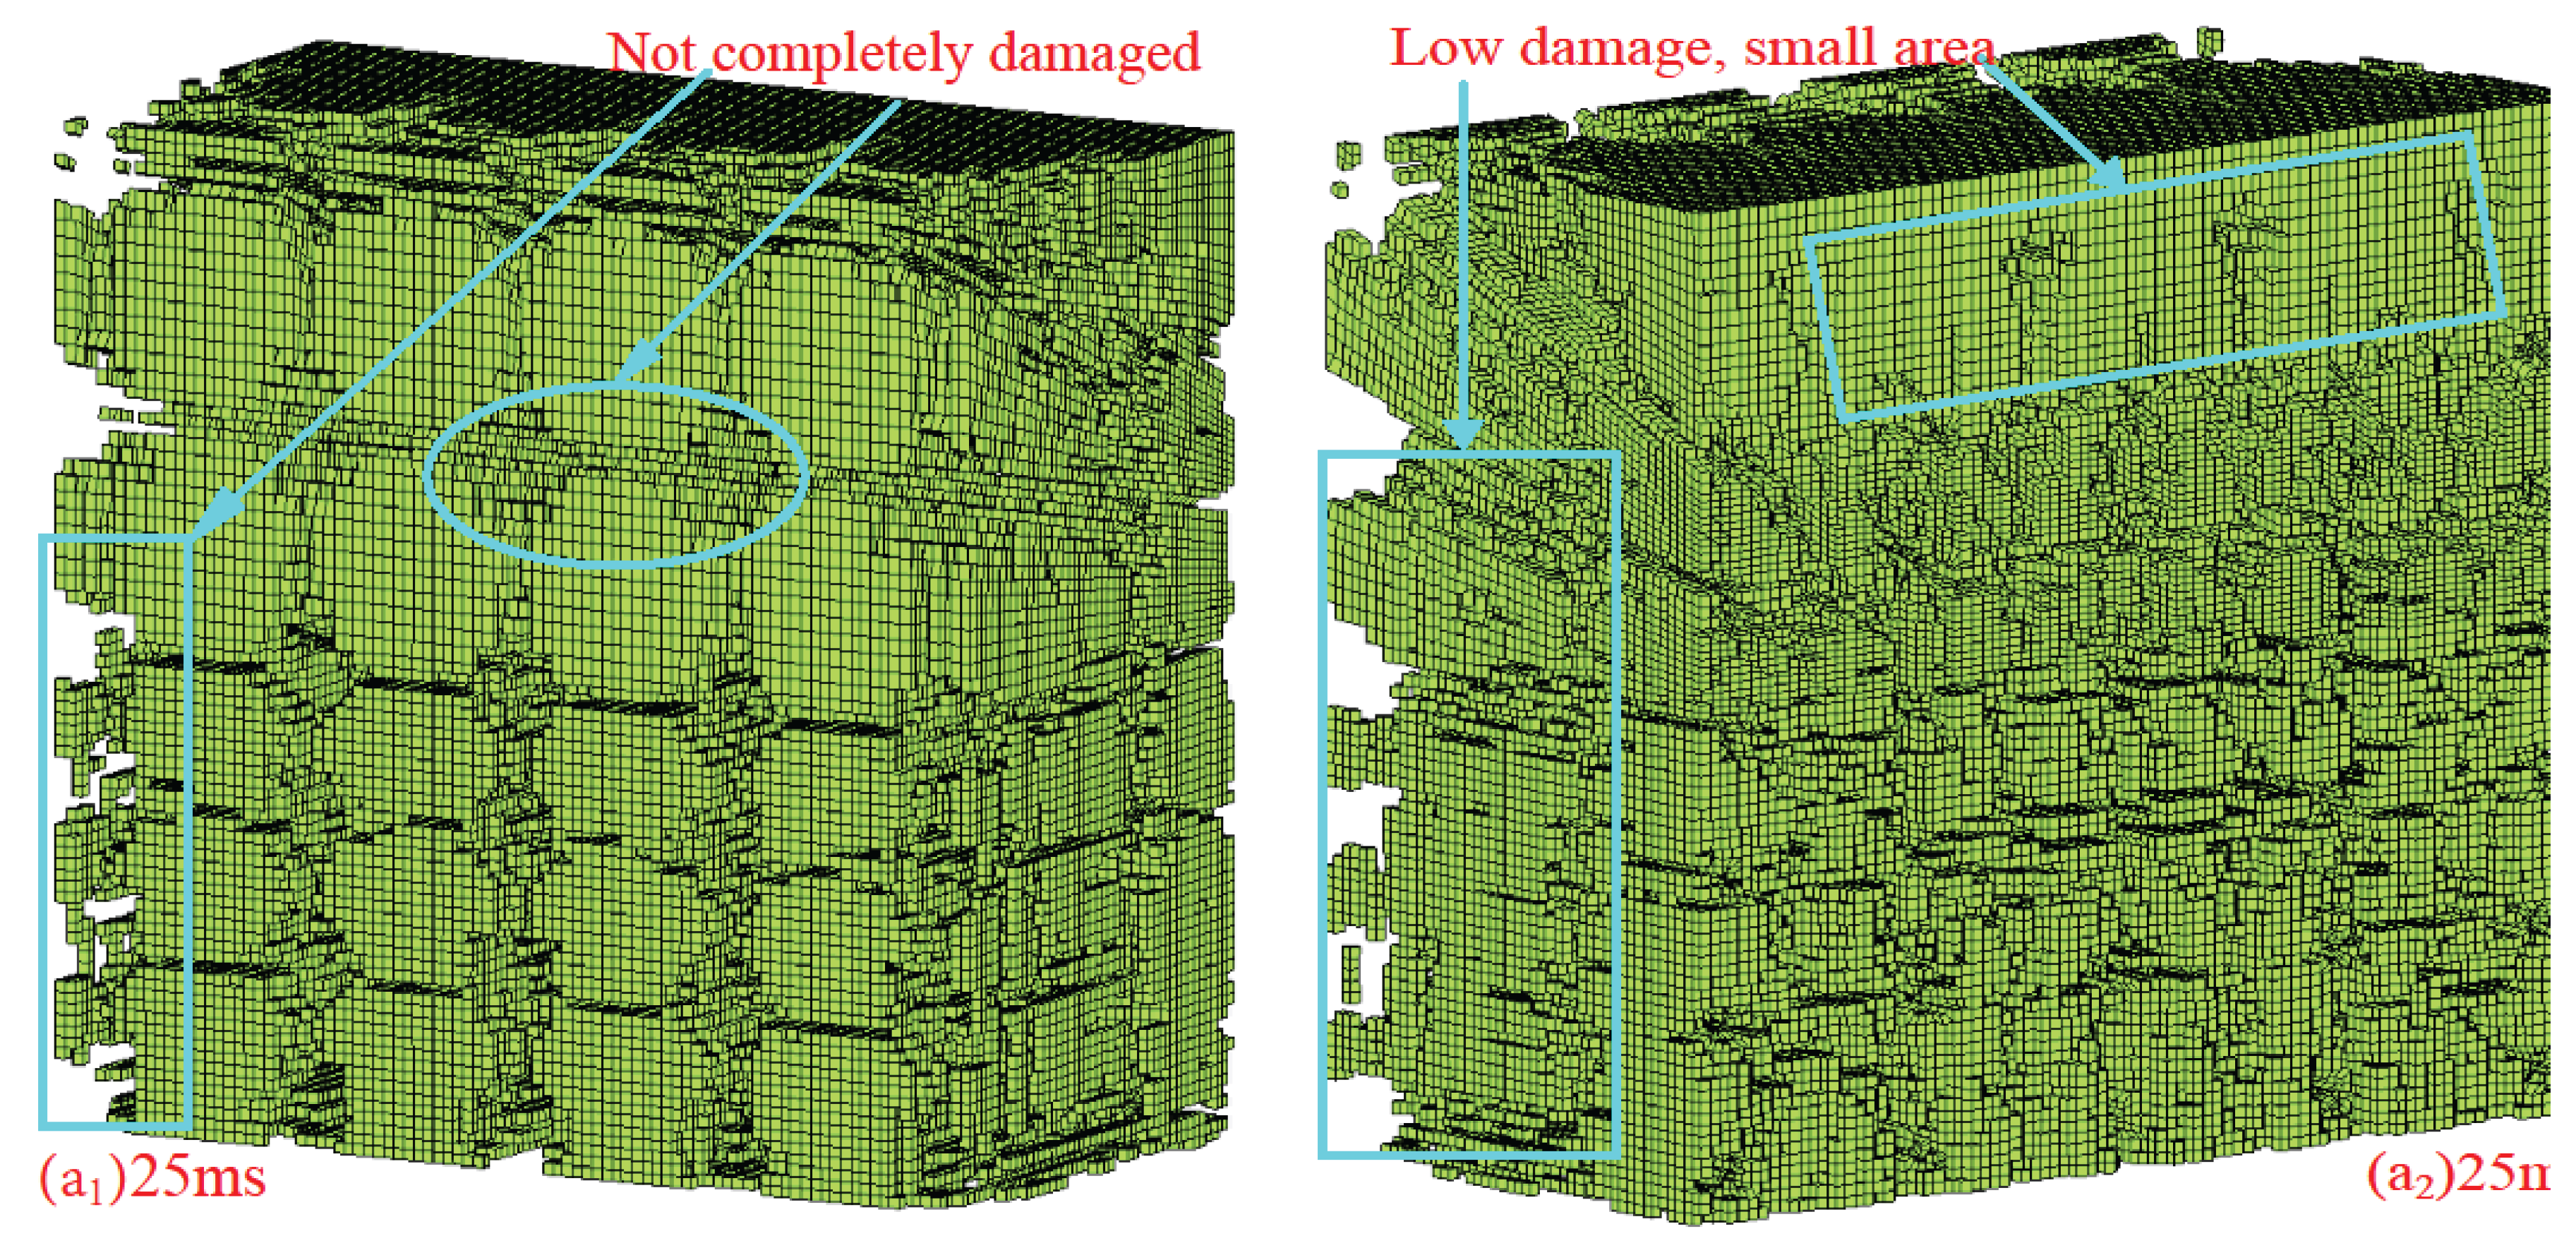
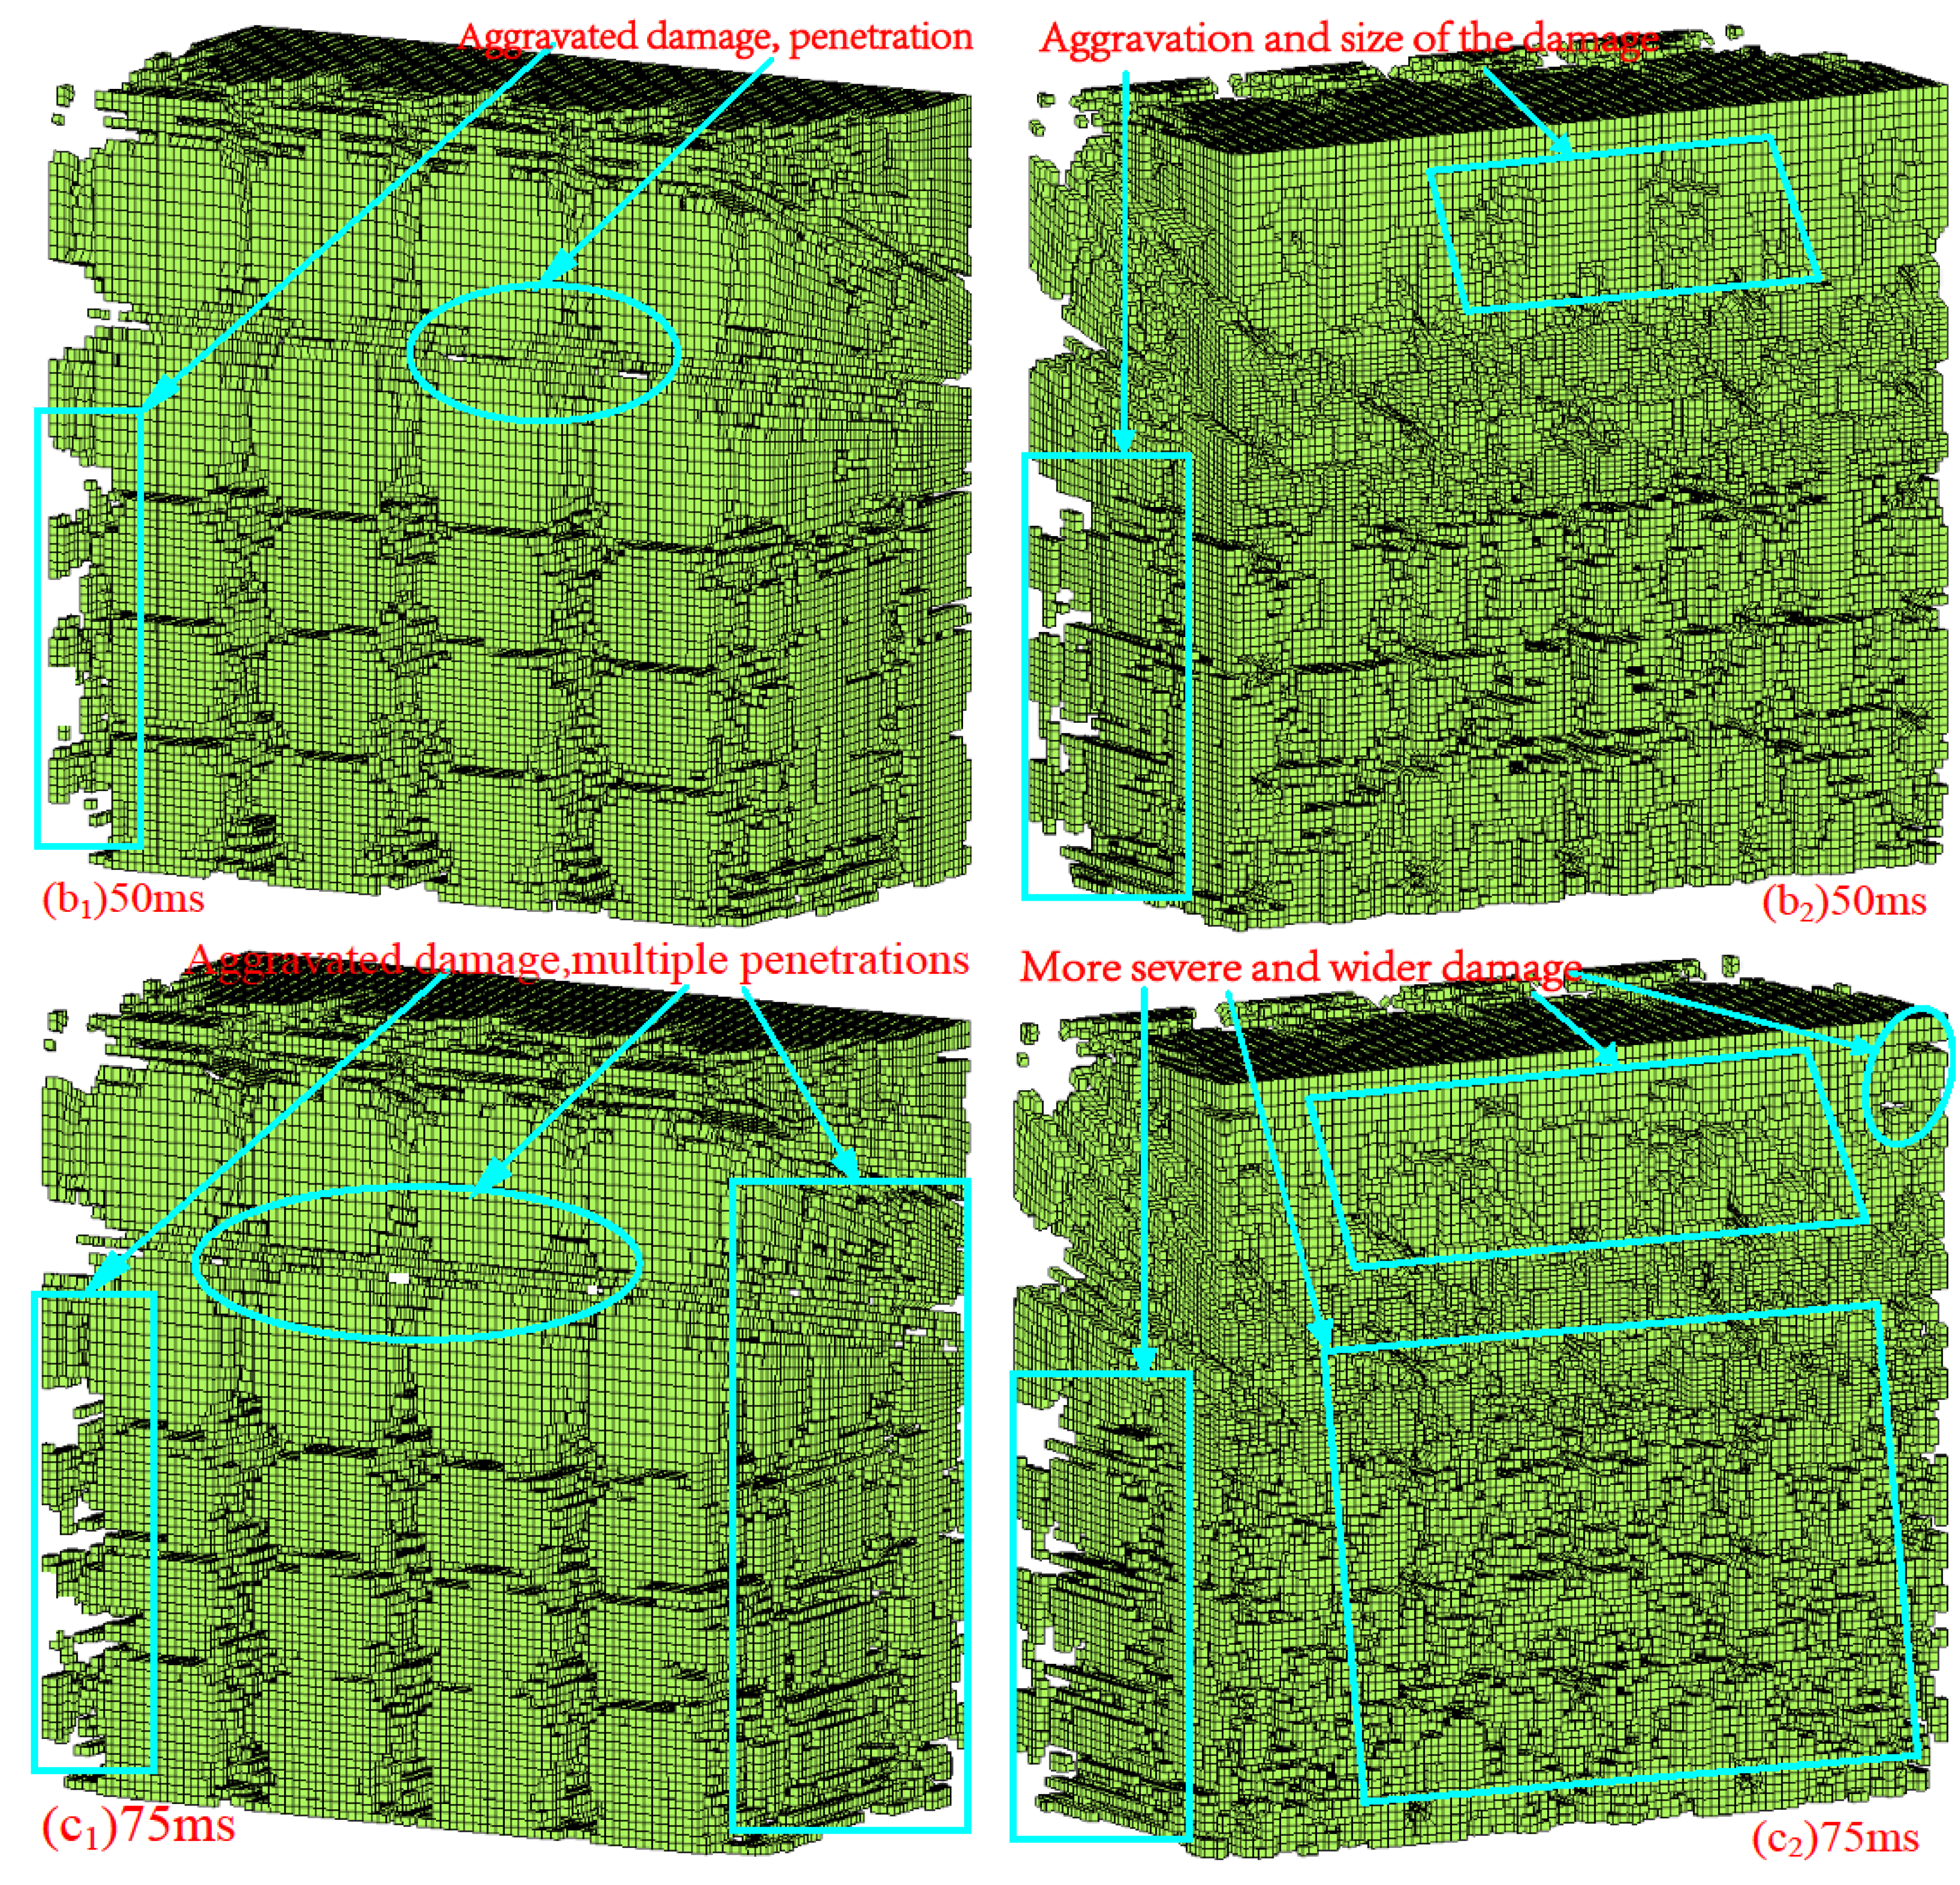
Figure 8d–f, combined with the damage cloud map of the driving face in
Figure 9 (the damage development is obvious at 75ms), it can be seen that in the degree of damage, 25ms damage degree <50ms damage degree <75ms damage degree. However, under the condition of 75ms delay time, the damage of monitoring point A2 (about 0.6m away from the driving face) is smaller. Through the analysis can be inferred that in 25ms blasting rock internal fragmentation is the worst; and 75ms blasting rock internal fragmentation is the best, but in the 0.6m from the face of the poor fragmentation. In the middle position of the plug hole may produce large pieces of ore rock.
Damage occurs after the mineral rock reaches yield strength, at which point the damage D is the damage threshold. Due to the different ways of definition and application conditions, the damage threshold is determined differently. Huang et al [
36] used the HJC model to study the rock damage distribution of columnar packet blasting that the damage should be taken as less than 0.05. Hu et al [
37] study that the wave velocity is reduced by 10% when the rock begins to produce damage, this time corresponding to the damage threshold of 0.19. Liu et al [
38] used the RHT model to compare the numerical simulation with the field test, to determine the damage threshold of 0.22. Therefore, this paper extracts the damage state under each delay time condition when the damage factor D ≥ 0.3. From the extracted damage
Figure 11 shows that the area of the damage region expands with the increase of delay time, and the degree of damage is aggravated with the increase of delay time. In the driving face, the phenomenon of damage sheet fall is obvious, showing that the stress wave reflection-tension damage is also strengthened with the increase of delay time.
4. Experimental Verification of On-Site Blasting
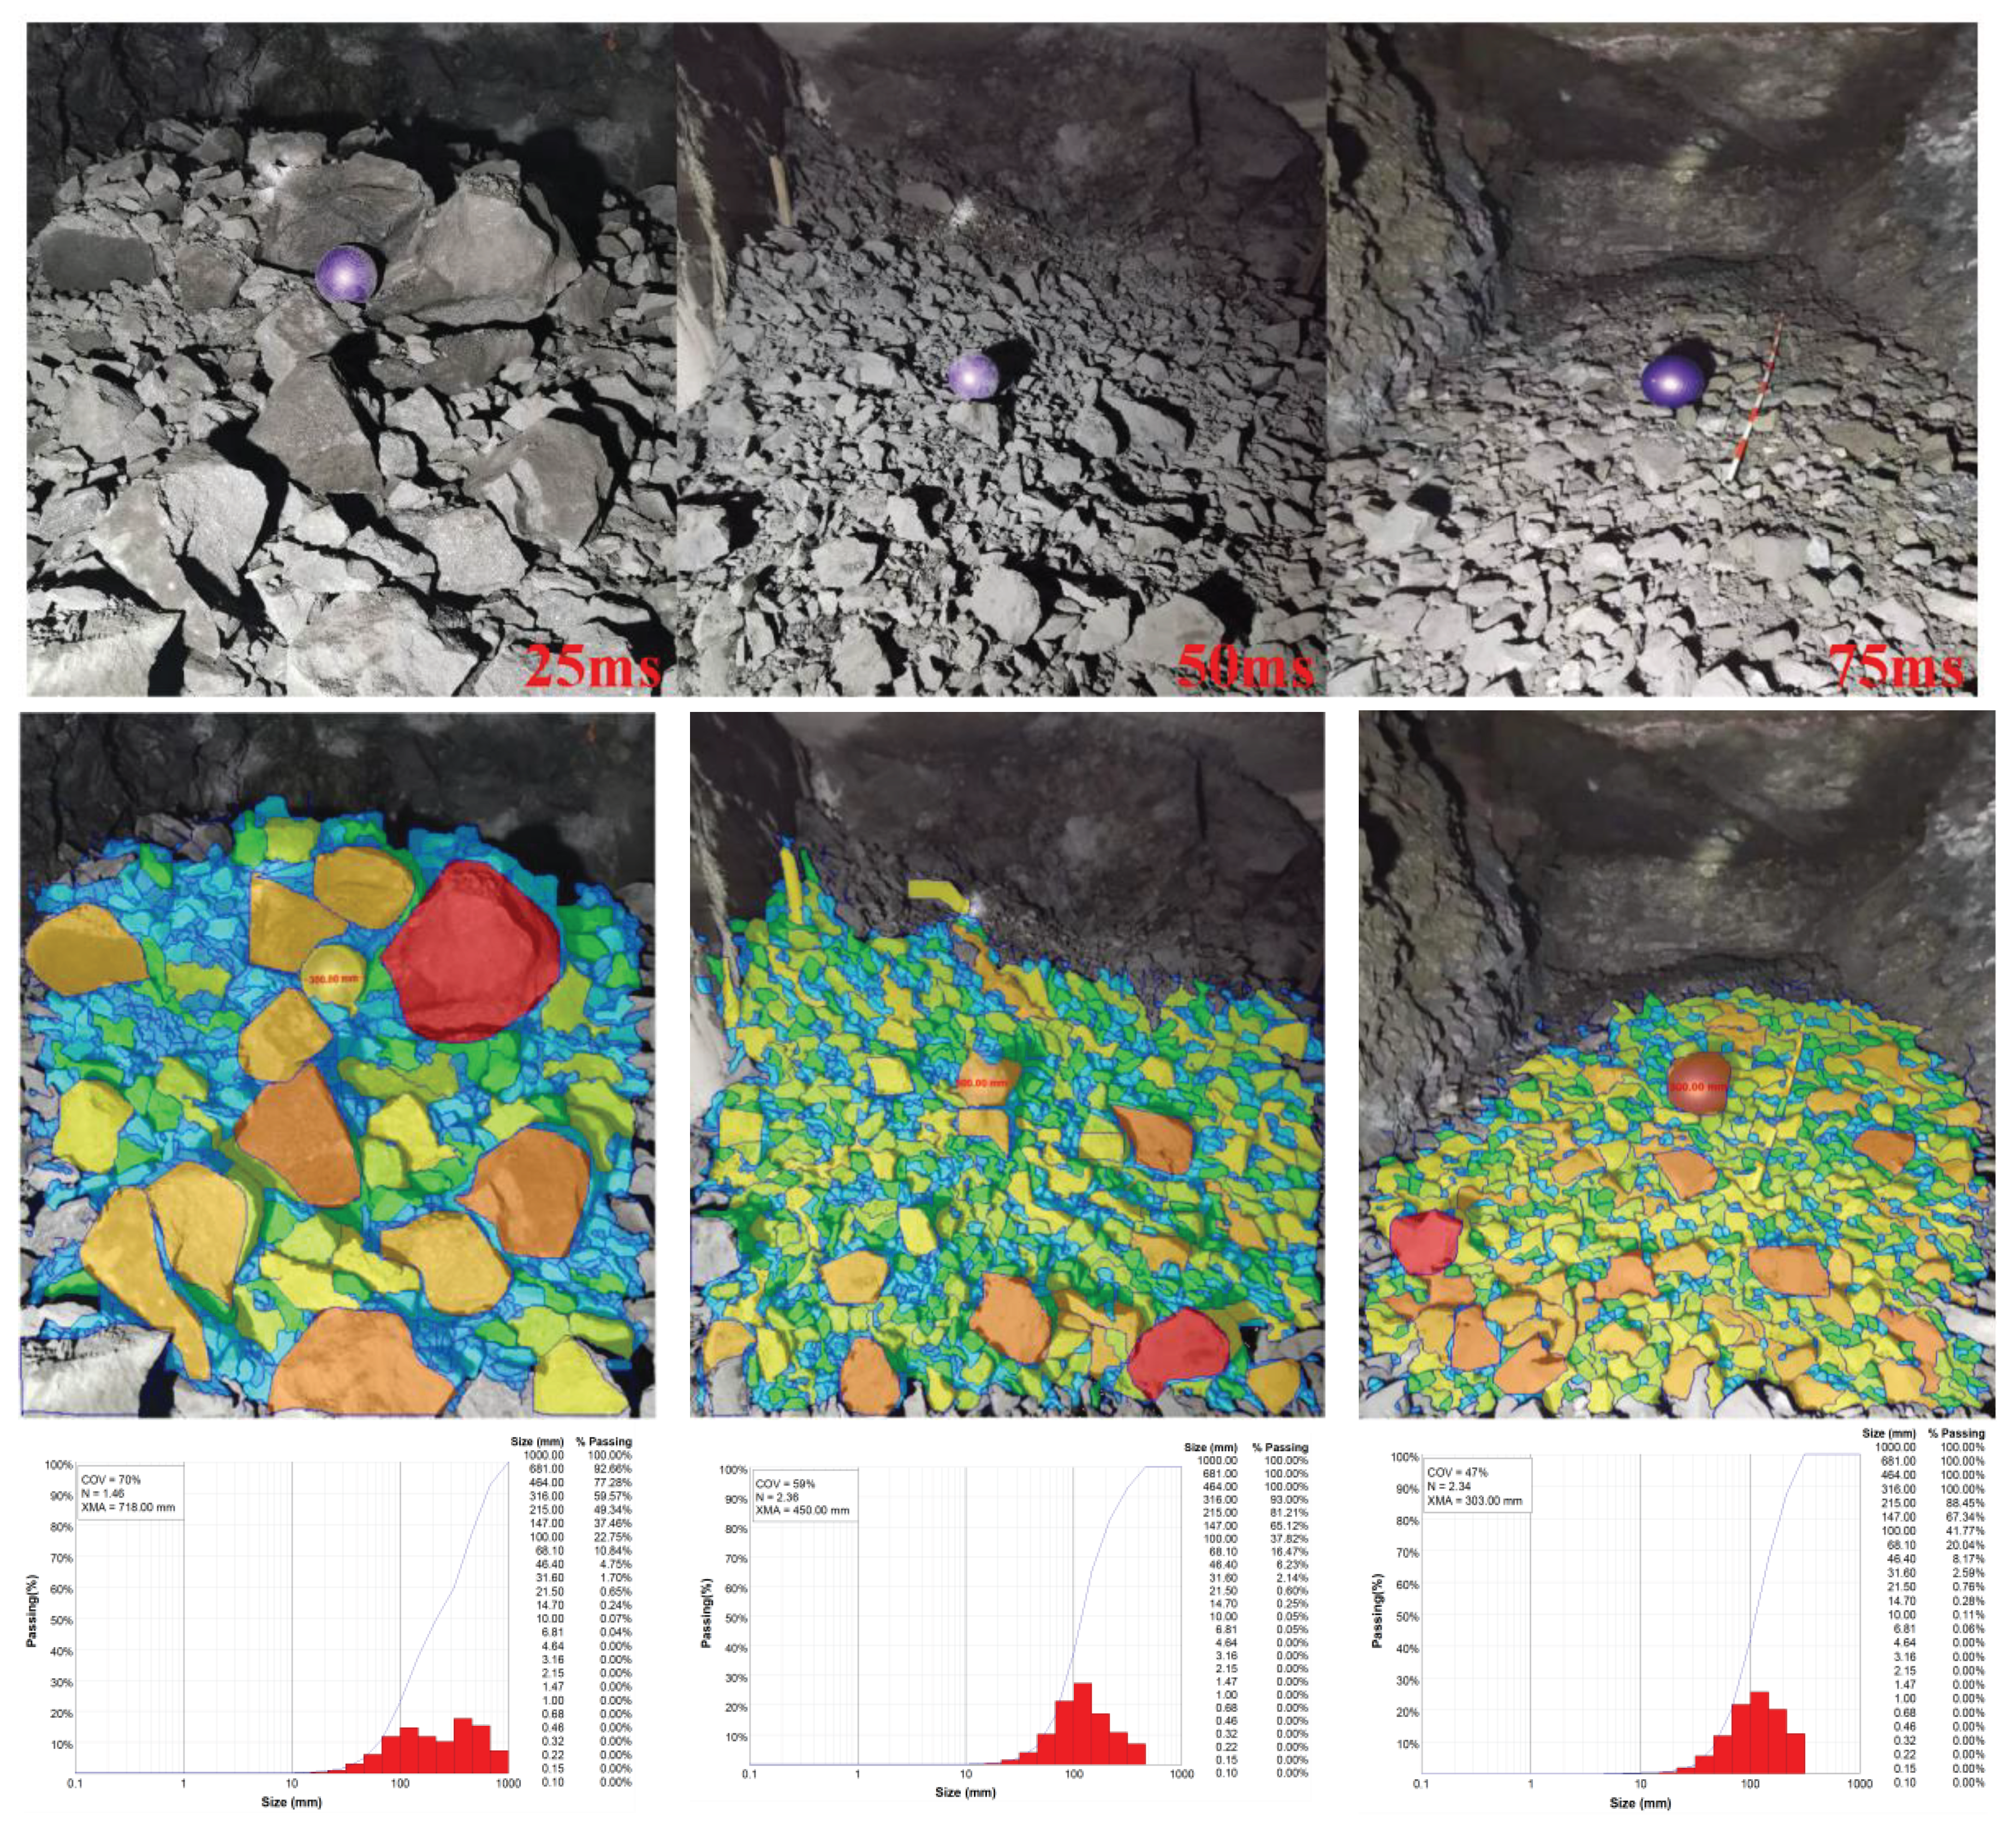
Blasting tests with 25ms, 50ms and 75ms delay times were carried out through the field. The results show that there is a significant difference in the effect of choosing different delay times on the blasting block size of the quarry. As shown in
Figure 11 in the 25ms delay time conditions, less than 215mm block size accounted for 49.34%, less than 316mm block size accounted for 59.57%. In 50ms delay time conditions, less than 215mm blocks accounted for 81.21%, less than 316mm blocks accounted for 93%. Under the 75ms delay time condition, 88.45% of the blocks are smaller than 215mm and 100% of the blocks are smaller than 316mm. After the field test, it is concluded that the 25ms delay time condition produces more large blocks. Under the condition of 50ms delay time, the rate of chunks decreased significantly. Under the condition of 75ms delay time, the best crushing effect of blasting ore rock. The field test results are consistent with the conclusions of the numerical simulation study.
5. Conclusions
(1) through the study found that the degree of fragmentation of blasting rock with the increase in delay time and strengthened. In order of 25ms blasting effect <50ms blasting effect <75ms blasting effect. The main reason is due to the delay time is different, resulting in the upper part of the blast zone (1-2 rows of holes area) rock and the lower part of the blast zone (3-4-5 rows of holes area) rock between the rows and holes in the fracture expansion through the time successive differences caused.
(2) Combined with the Mohr-Coulomb criterion to analyze the internal stress state of the ore rock. The results show that along the direction of the blast hole, the internal stress state of the ore rock is distributed differently with different delay times. It shows that the ultimate stress equilibrium state is easier to be reached near the driving face with short delay time blasting. With the increase of delay time is easy to reach the ultimate stress equilibrium state of the unit from the driving face to the middle of the hole.
(3) Under the condition of 25ms delay time, the main factor for the blasting to produce more chunks is that the fracture extension of the ore rock in the central area (the area of 3-4 rows of holes) penetrated earlier than that in the upper part (the area of 1-2 rows of holes). The internal energy release effect occurred in the ore rock, resulting in insufficient crushing. The small amount of chunks produced under the 75ms delay time condition may be mainly caused by the insufficient damage to the ore rock at the middle position of the stemming.
Author Contributions
Conceptualization, H.C. and JK.Z. ; methodology, H.C. and JK.Z.; software, H.C. and JK.Z.; validation, H.C. and JK.Z.; formal analysis, JK.Z. and H.C.; investigation, JK.Z. and H.C.; resources, JK.Z. and H.C.; data curation, JK.Z. and H.C.; writing—original draft preparation, JK.Z. and H.C.; writing—review and editing, JK.Z. and H.C.; visualization, JK.Z. and H.C.; supervision, JK.Z. and H.C.; project administration, JK.Z. and H.C.;. All authors have read and agreed to the published version of the manuscript.
Institutional Review Board Statement
Not applicable.
Data Availability Statement
Not applicable.
Acknowledgments
We are grateful to the anonymous reviewers for their insightful and constructive comments for improving the manuscript.
Conflicts of Interest
The authors declare no conflict of interest.
References
- Verma, H.K.; Samadhiya, N.K.; Singh, M.; Goel, R.K.; Singh, P.K. Blast Induced Rock Mass Damage around Tunnels. Tunnelling and Underground Space Technology 2018, 71, 149–158. [CrossRef]
- Kutter HK, Fairhurst C (1971) On the fracture process in blasting. Int J Rock Mech Min Sci Geomech Abstr 8(3): 181–202. https://.
- doi.org/10.1016/0148-9062(71)90018-0.
- Bahadori M, Bakhshandeh H (2017) Numerical analysis of the primer location effect on ground vibration caused by blasting 1:53–62. [CrossRef]
- Yu, C.; Yue, H.; Li, H.; Zuo, H.; Deng, S.; Liu, B. Study on the Attenuation Parameters of Blasting Vibration Velocity in Jointed Rock Masses. Bull Eng Geol Environ 2019, 78, 5357–5368. [CrossRef]
- Afrasiabian, B.; Ahangari, K.; Noorzad, A. Study on the Effects of Blast Damage Factor and Blast Design Parameters on the Ground Vibration Using 3D Discrete Element Method. Innov. Infrastruct. Solut. 2020, 5, 37. [CrossRef]
- Wang, J.; Yin, Y.; Esmaieli, K. Numerical Simulations of Rock Blasting Damage Based on Laboratory-Scale Experiments. J. Geophys. Eng. 2018, 15, 2399–2417. [CrossRef]
- Onederra, I.A.; Furtney, J.K.; Sellers, E.; Iverson, S. Modelling Blast Induced Damage from a Fully Coupled Explosive Charge. International Journal of Rock Mechanics and Mining Sciences 2013, 58, 73–84. [CrossRef]
- Xin-sheng W.; Feng-dan C. Research on Surrounding Rock Damage Control Blasting by Numerical Simulation Method. bjlgdxxbzkb 2014, 34, 991–996.
- Guo, D.-Y.; Lü, P.-F.; Pei, H.-B.; Shan, Z.-Y. Numerical Simulation on Crack Propagation of Coal Bed Deep-Hole Cumulative Blasting. Meitan Xuebao/Journal of the China Coal Society 2012, 37, 274–278.
- Gao W.; Deng L. Numerical Simulation of Deep-Hole Controlled Cutting Blasting and Its Practice. In Proceedings of the 2010 International Conference on E-Product E-Service and E-Entertainment; IEEE: Henan, China, November 2010; pp. 1–4.
- Holmquist, T. J.; Johnson, G. R.; Cook, W. H. A Computational Constitutive Model for Concrete Subjected to Large Strains, High Strain Rates and High Pressures In: 14th international symposium2; 1993. 591–600. Warhead mechanisms, terminal ballistics.
- Holmquist, T.J.; Johnson, G.R.; Grady, D.E.; Lopatin, C.M.; Hertel, E.S. High Strain Rate Properties and Constitutive Modelling of Glass. Glass 1995, 1. [CrossRef]
- Johnson, G.R.; Holmquist, T.J. An Improved Computational Constitutive Model for Brittle Materials. AIP Conf. Proc. 1994, 309, 981–984. [CrossRef]
- Holmquist, T.J.; Templeton, D.W.; Bishnoi, K.D. Constitutive Modeling of Aluminum Nitride for Large Strain, High-Strain Rate, and High-Pressure Applications. Int.j.impact Eng 2001, 25, 211–231. [CrossRef]
- Riedel, W.; Thoma, K.; Hiermaier, S.; Schmolinske, E. Penetration of Reinforced Concrete by BETA-B-500 Numerical Analysis Using a New Macroscopic Concrete Model for Hydrocodes. 1999.
- Borrvall, D.T. THE RHT CONCRETE MODEL IN LS-DYNA. 2011. In: Proceedings of the 8th European LS-DYNA Users Conference, Strasbourg.
- Kucewicz, M.; Baranowski, P.; Mazurkiewicz, Ł.; Małachowski, J. Comparison of Selected Blasting Constitutive Models for Reproducing the Dynamic Fragmentation of Rock. International Journal of Impact Engineering 2023, 173, 104484. [CrossRef]
- Kong, X.; Fang, Q.; Chen, L.; Wu, H. A New Material Model for Concrete Subjected to Intense Dynamic Loadings. International Journal of Impact Engineering 2018, 120, 60–78. [CrossRef]
- Kury, J.W.; Honig, H.C.; Lee, E.L.; Mcdonnel, J.L.; Wilkins, M.L. Metal Acceleration by Chemical Explosive. 1965. Metal acceleration by chemical explosives. In: Fourth (International) Symposium on Detonation, ACR-126.
- Ding, Y.Q.; Tang, W.H.; Zhang, R.Q.; Ran, X.W. Determination and Validation of Parameters for Riedel-Hiermaier-Thoma Concrete Model. Defence Science Journal 2013, 63, 524–530. [CrossRef]
- Meyers M A. Dynamic behavior of materials [M]. New York: Wiley & Sons, 1994.
- Wang, Z.; Wang, H.; Wang, J.; Tian, N. Finite Element Analyses of Constitutive Models Performance in the Simulation of Blast-Induced Rock Cracks. Computers and Geotechnics 2021, 135, 104172. [CrossRef]
- Jayasinghe, L.B.; Shang, J.; Zhao, Z.; Goh, A.T.C. Numerical Investigation into the Blasting-Induced Damage Characteristics of Rocks Considering the Role of in-Situ Stresses and Discontinuity Persistence. Computers and Geotechnics 2019, 116, 103207. [CrossRef]
- LI Hong-chao, LIU Dian-Shu, ZHAO Lei, LI Chen, ZHANG Zhen-yuan. Study on Parameters Determination of Marble RHT Model[J]. Transactions of Beijing institute of Technology, 2017, 37(8): 801-806. [CrossRef]
- Zhang, Q.B.; Zhao, J. A Review of Dynamic Experimental Techniques and Mechanical Behaviour of Rock Materials. Rock Mech Rock Eng 2014, 47, 1411–1478. [CrossRef]
- Rao J.Y, XUE Y.H, Shen Y, et al. Analysis of correlation coupling between bedding distribution and blasting damage based on RHT model[J]. Journal of Central South University (Science and Technology),2023,54(3):1204-1218. [CrossRef]
- Li, X.; Zhu, Z.; Wang, M.; Xiao, D.; Shu, Y.; Deng, S. Fracture Mechanism of Rock around a Tunnel-Shaped Cavity with Interconnected Cracks under Blasting Stress Waves. International Journal of Impact Engineering 2021, 157, 103999. [CrossRef]
- Wang, H.; Wang, Z.; Wang, J.; Wang, S.; Wang, H.; Yin, Y.; Li, F. Effect of Confining Pressure on Damage Accumulation of Rock under Repeated Blast Loading. International Journal of Impact Engineering 2021, 156, 103961. [CrossRef]
- Li, S.; Ling, T.; Liu, D.; Liang, S.; Zhang, R.; Huang, B.; Liu, K. Determination of Rock Mass Parameters for the RHT Model Based on the Hoek–Brown Criterion. Rock Mech Rock Eng 2023, 56, 2861–2877. [CrossRef]
- LS-DYNA, L., 2023. Keyword User’s Manual. Livermore Software Technology Corporation (LST), An Ansys Company.
- Ouellet, F.; Park, C.; Rollin, B.; Haftka, R.T.; Balachandar, S. A Kriging Surrogate Model for Computing Gas Mixture Equations of State. J. Fluids Eng 2019, 141. [CrossRef]
- Mussa, M.H.; Mutalib, A.A.; Hamid, R.; Naidu, S.R.; Radzi, N.A.M.; Abedini, M. Assessment of Damage to an Underground Box Tunnel by a Surface Explosion. Tunnelling and Underground Space Technology 2017, 66, 64–76. [CrossRef]
- Yi, C.; Johansson, D.; Greberg, J. Effects of In-Situ Stresses on the Fracturing of Rock by Blasting. Computers and Geotechnics 2018, 104, 321–330. [CrossRef]
- Banadaki, M.M.D. Stress-Wave Induced Fracture in Rock Due to Explosive Action. PhD Thesis. University of Toronto, Toronto, ON, Canada.
- Liang, R.; Wang, S.; Zhou, W. Crack Propagation Caused by Slope Excavation Blasting Based on Stress and Velocity Time History Analysis[J]. Journal of Yangtze River Scientific Research Institute,2019,36(12):71-77. [CrossRef]
- Hang, Y.P.; Wang, Z.L.; Bi, C.C. Simulation analysis of blast-induced damage scope and its distribution characteristics of rocks[J]. Hydro-Science and Engineering,2018(5):95-102.
- Hu, Y.; Lu, W.B.; Chen, M. Comparison and improvement of blasting damage models for rock[J]. Rock and Soil Mechanics,2012,33(11):3278-3284.
- Liu, L.; Lu, W.B.; Chen, M. Statistic damage threshold of critical broken rock mass under blasting load[J]. Chinese Journal of Rock Mechanics and Engineering,2016,35(6):1133-1140. [CrossRef]
|
Disclaimer/Publisher’s Note: The statements, opinions and data contained in all publications are solely those of the individual author(s) and contributor(s) and not of MDPI and/or the editor(s). MDPI and/or the editor(s) disclaim responsibility for any injury to people or property resulting from any ideas, methods, instructions or products referred to in the content. |
© 2024 by the authors. Licensee MDPI, Basel, Switzerland. This article is an open access article distributed under the terms and conditions of the Creative Commons Attribution (CC BY) license (http://creativecommons.org/licenses/by/4.0/).
