Submitted:
20 March 2024
Posted:
20 March 2024
You are already at the latest version
Abstract
Keywords:
1. Introduction
2. Methodology
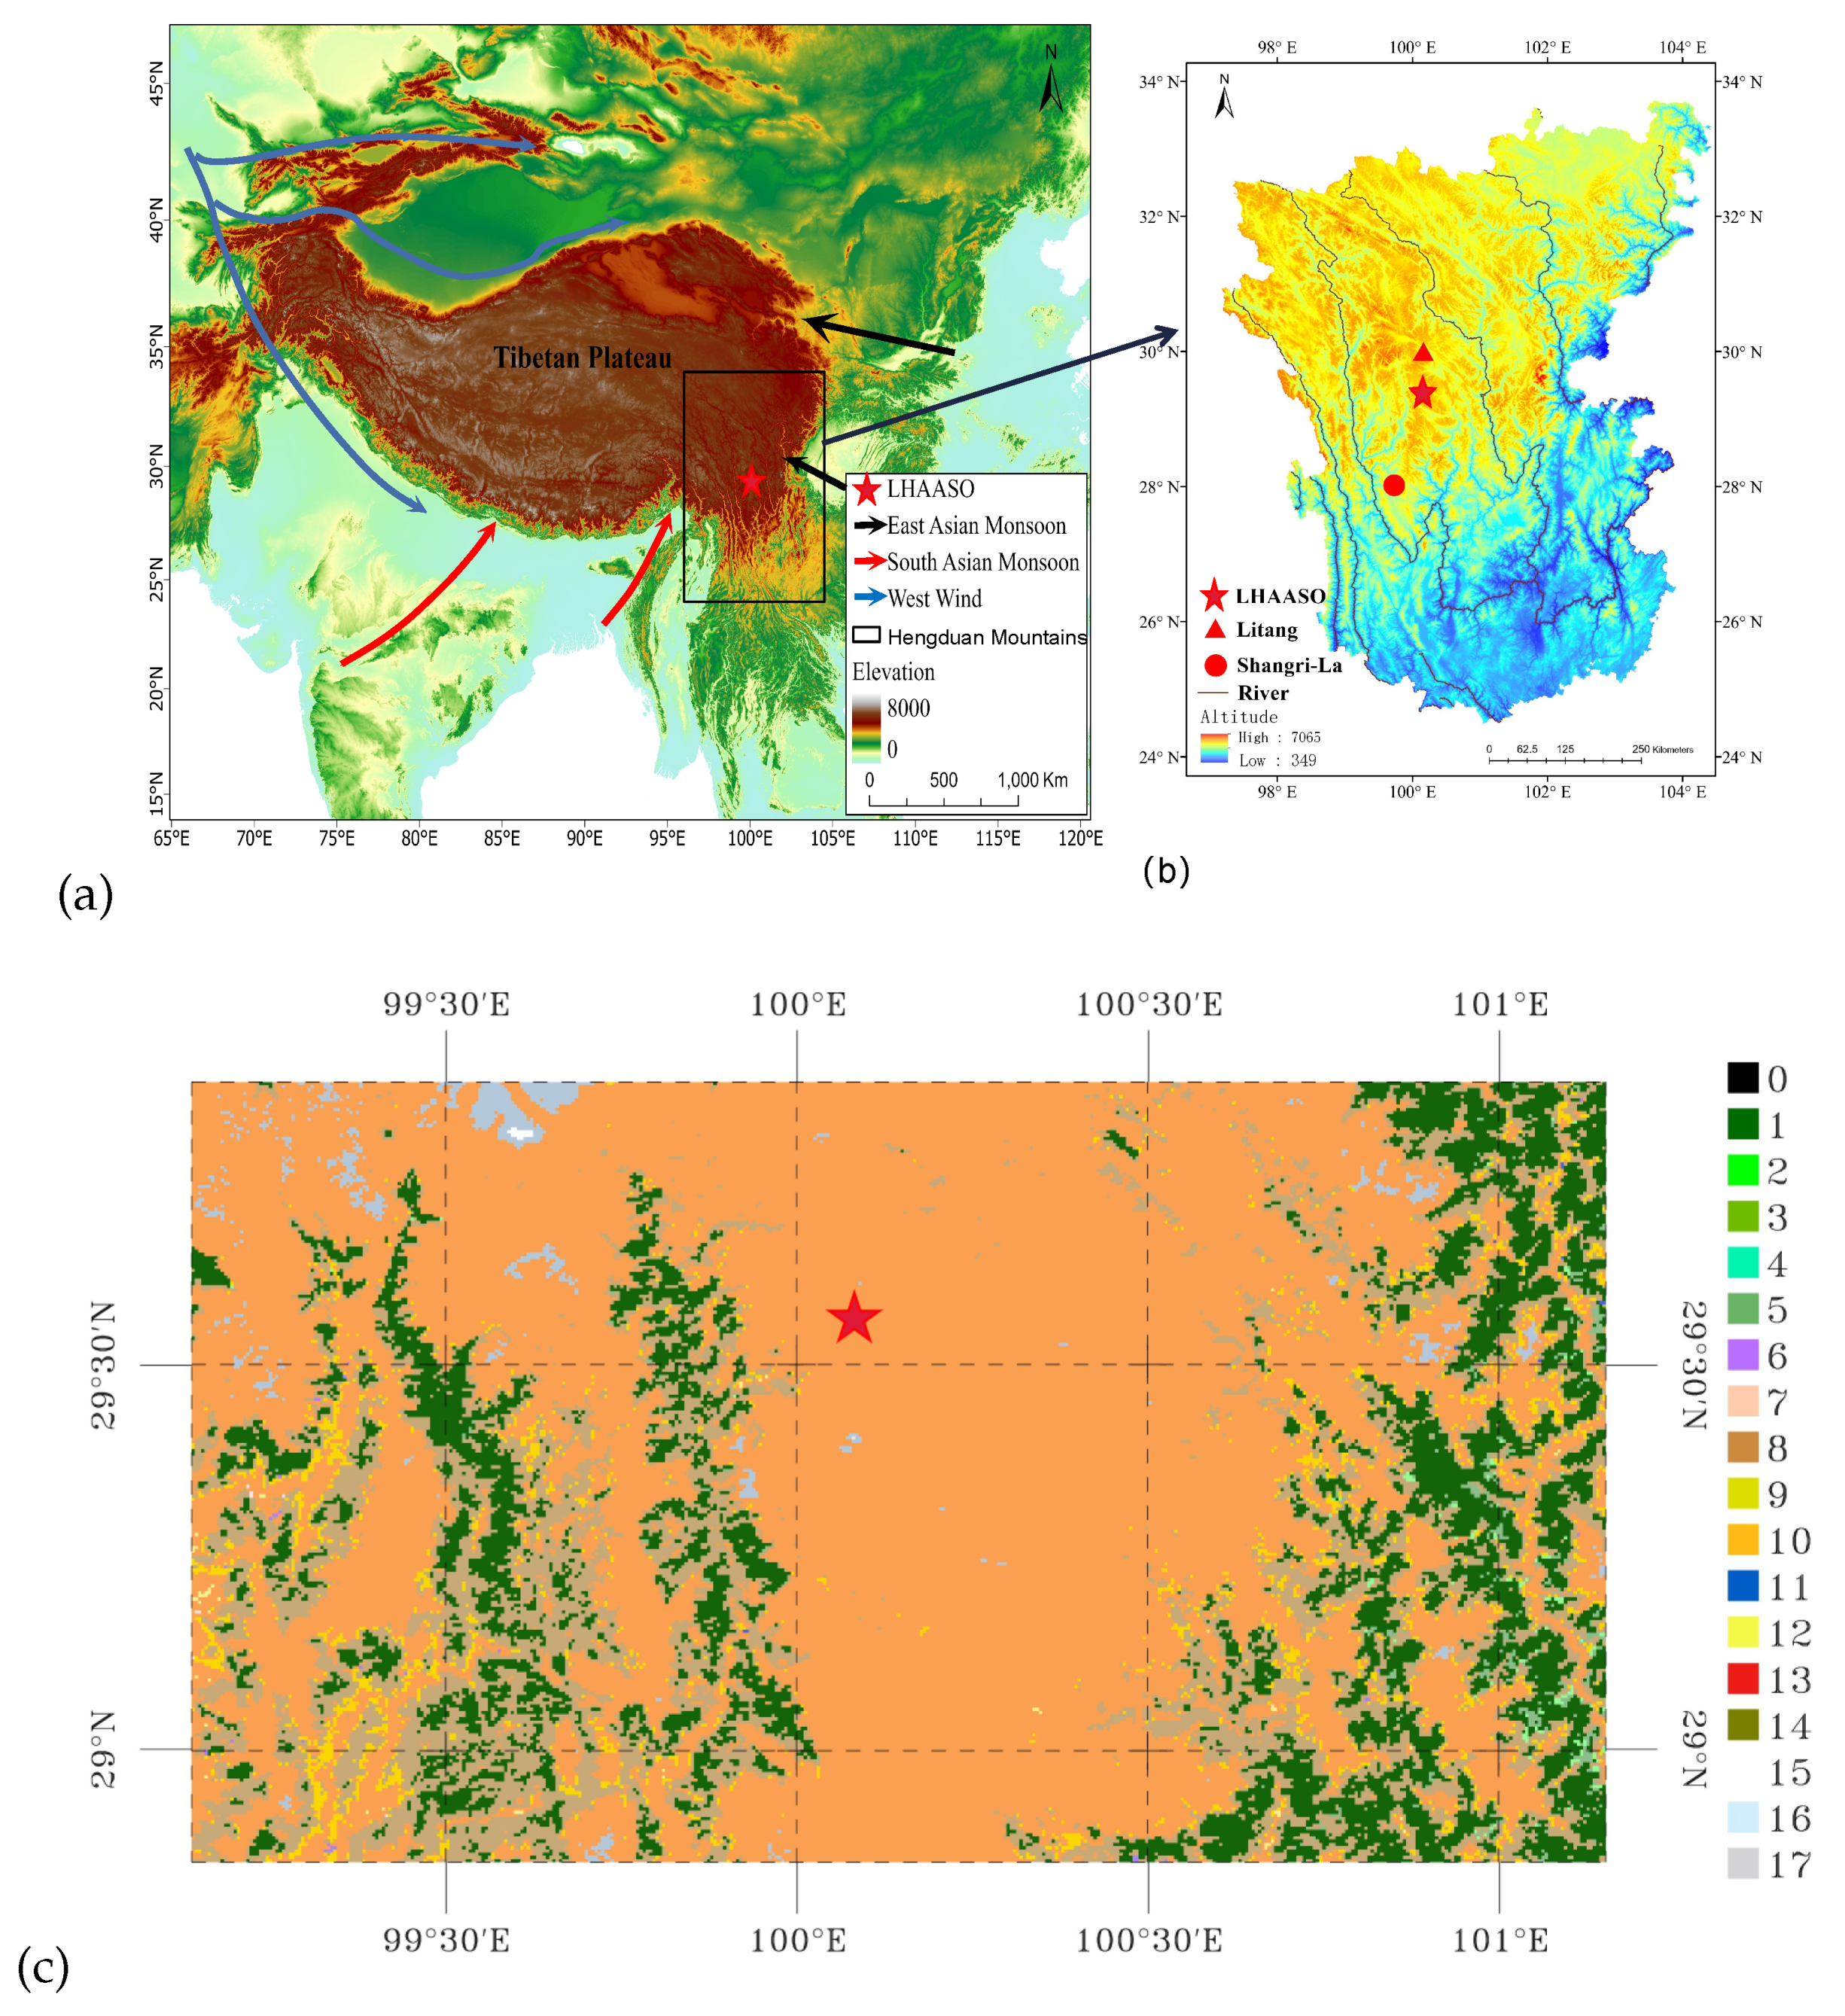
2.1. Observation Site
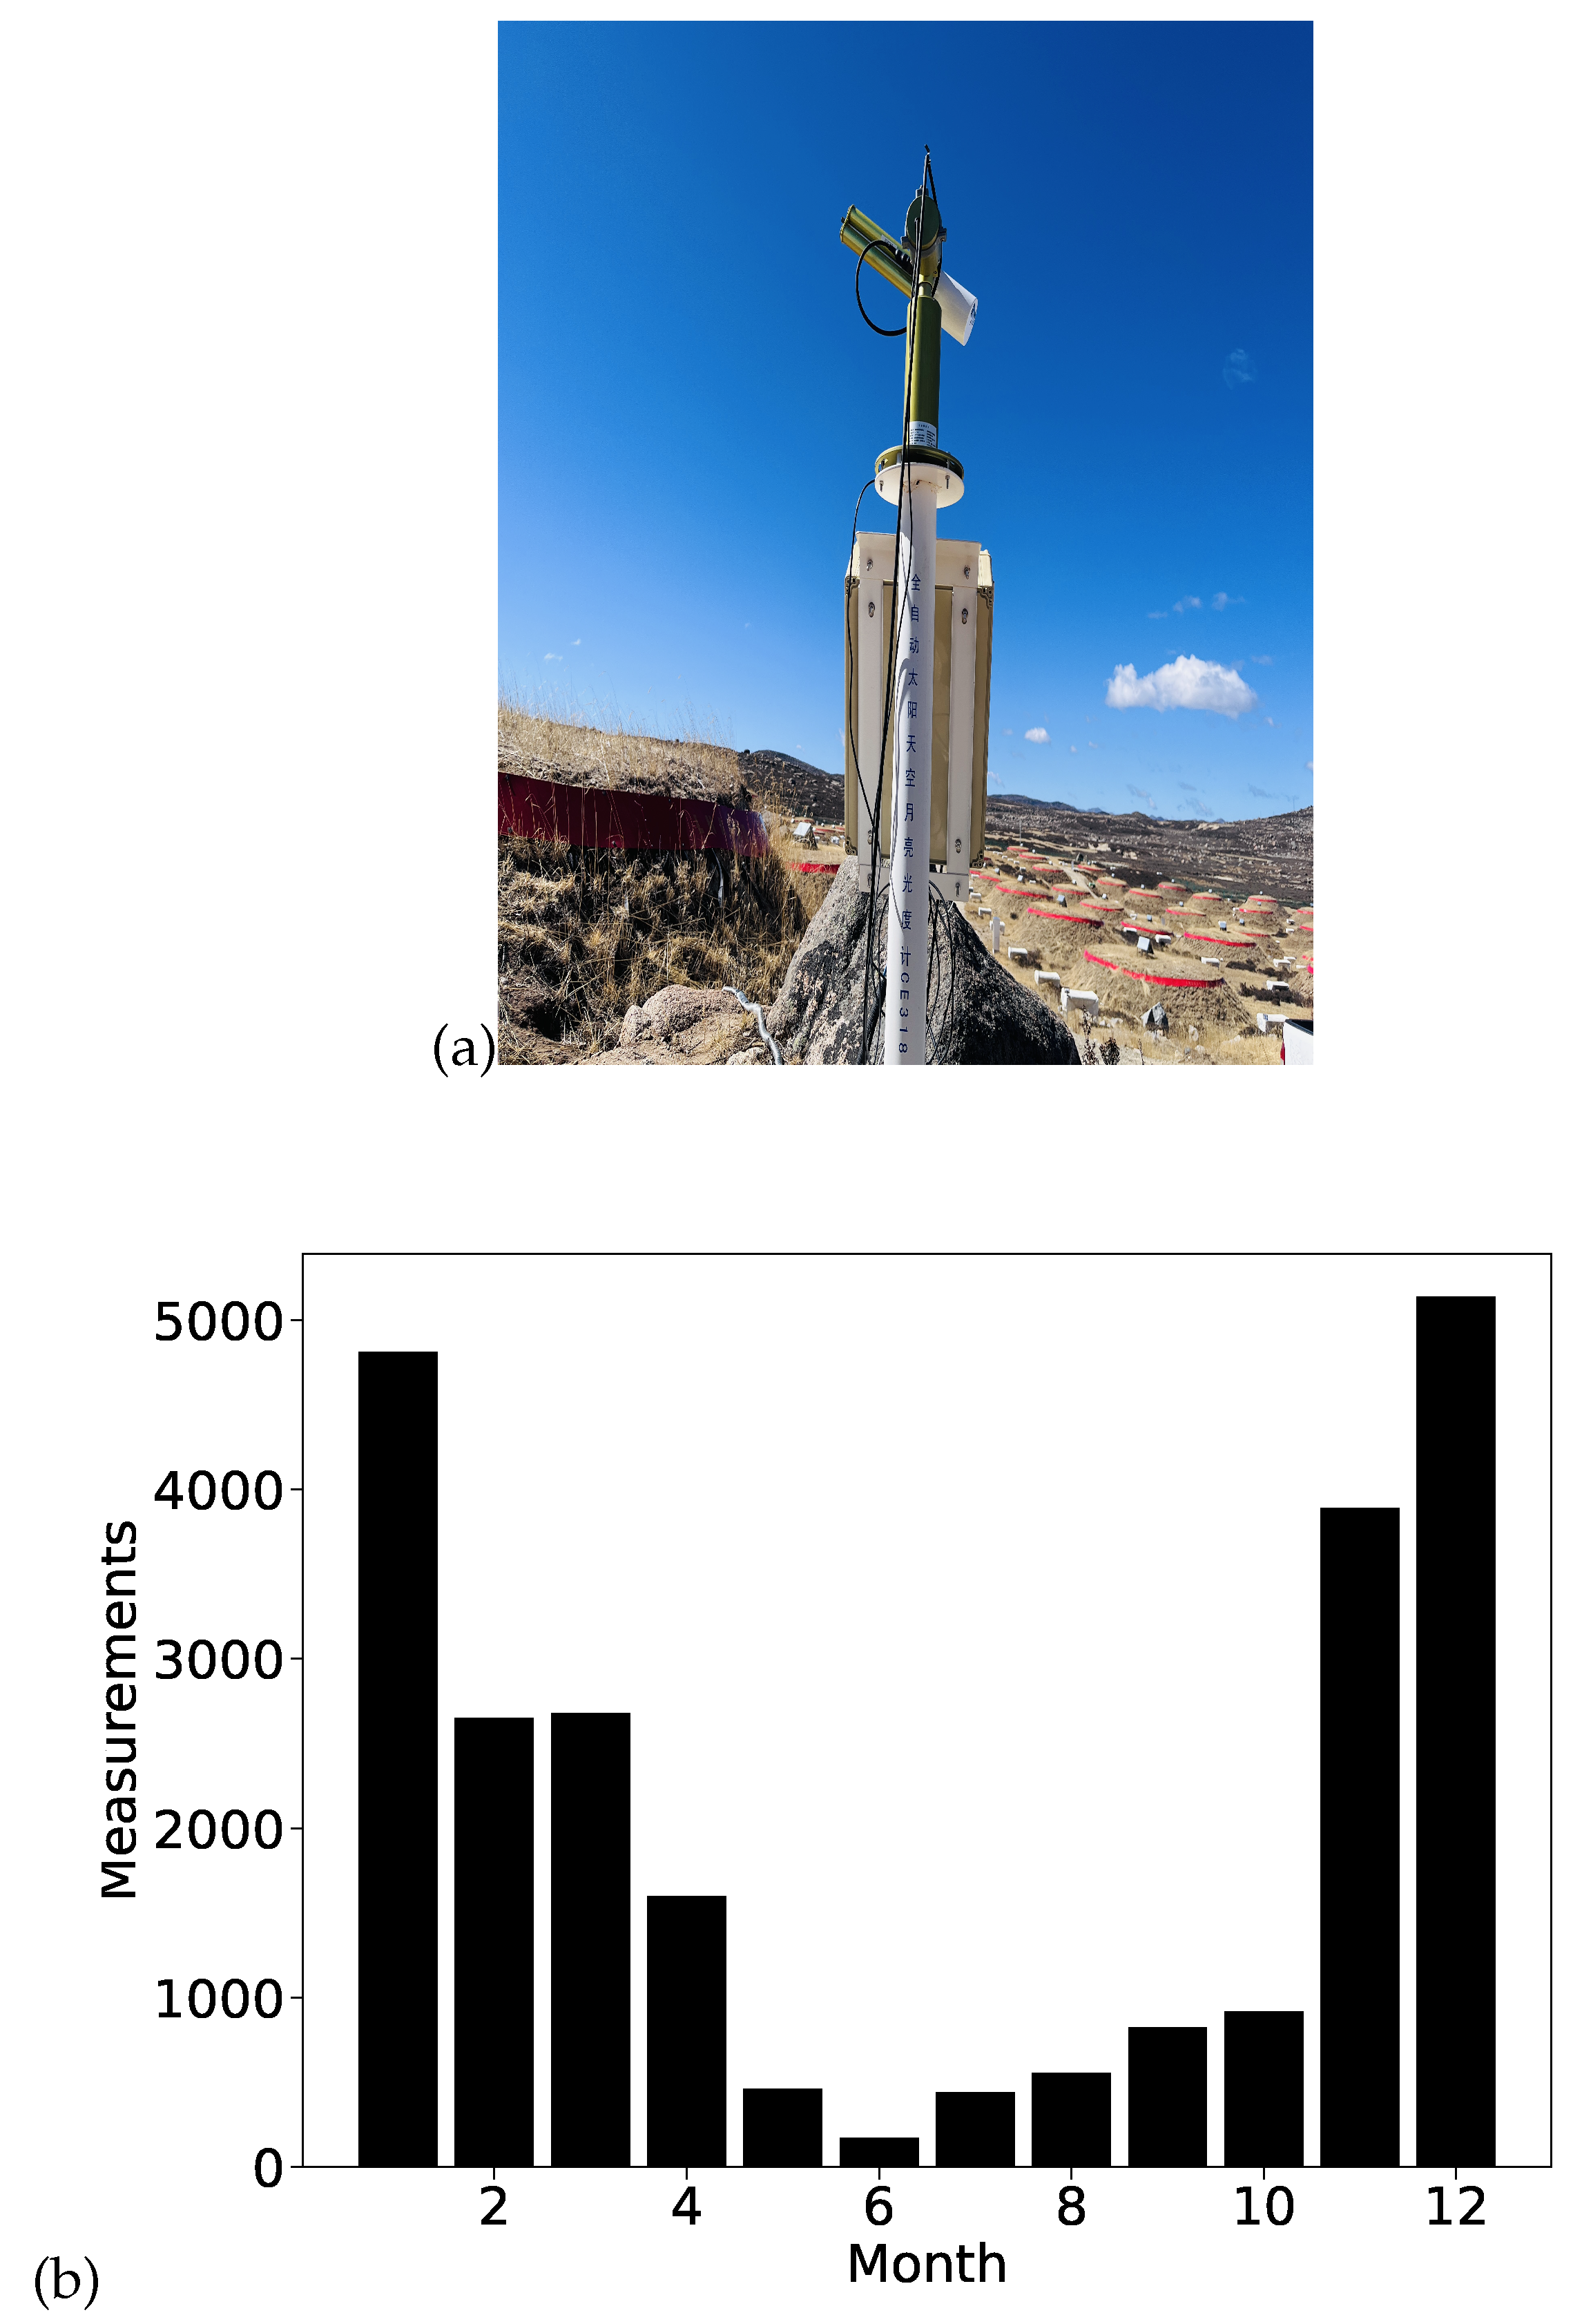
2.2. Ground-Based Observation at LHAASO
3. Results and Discussion
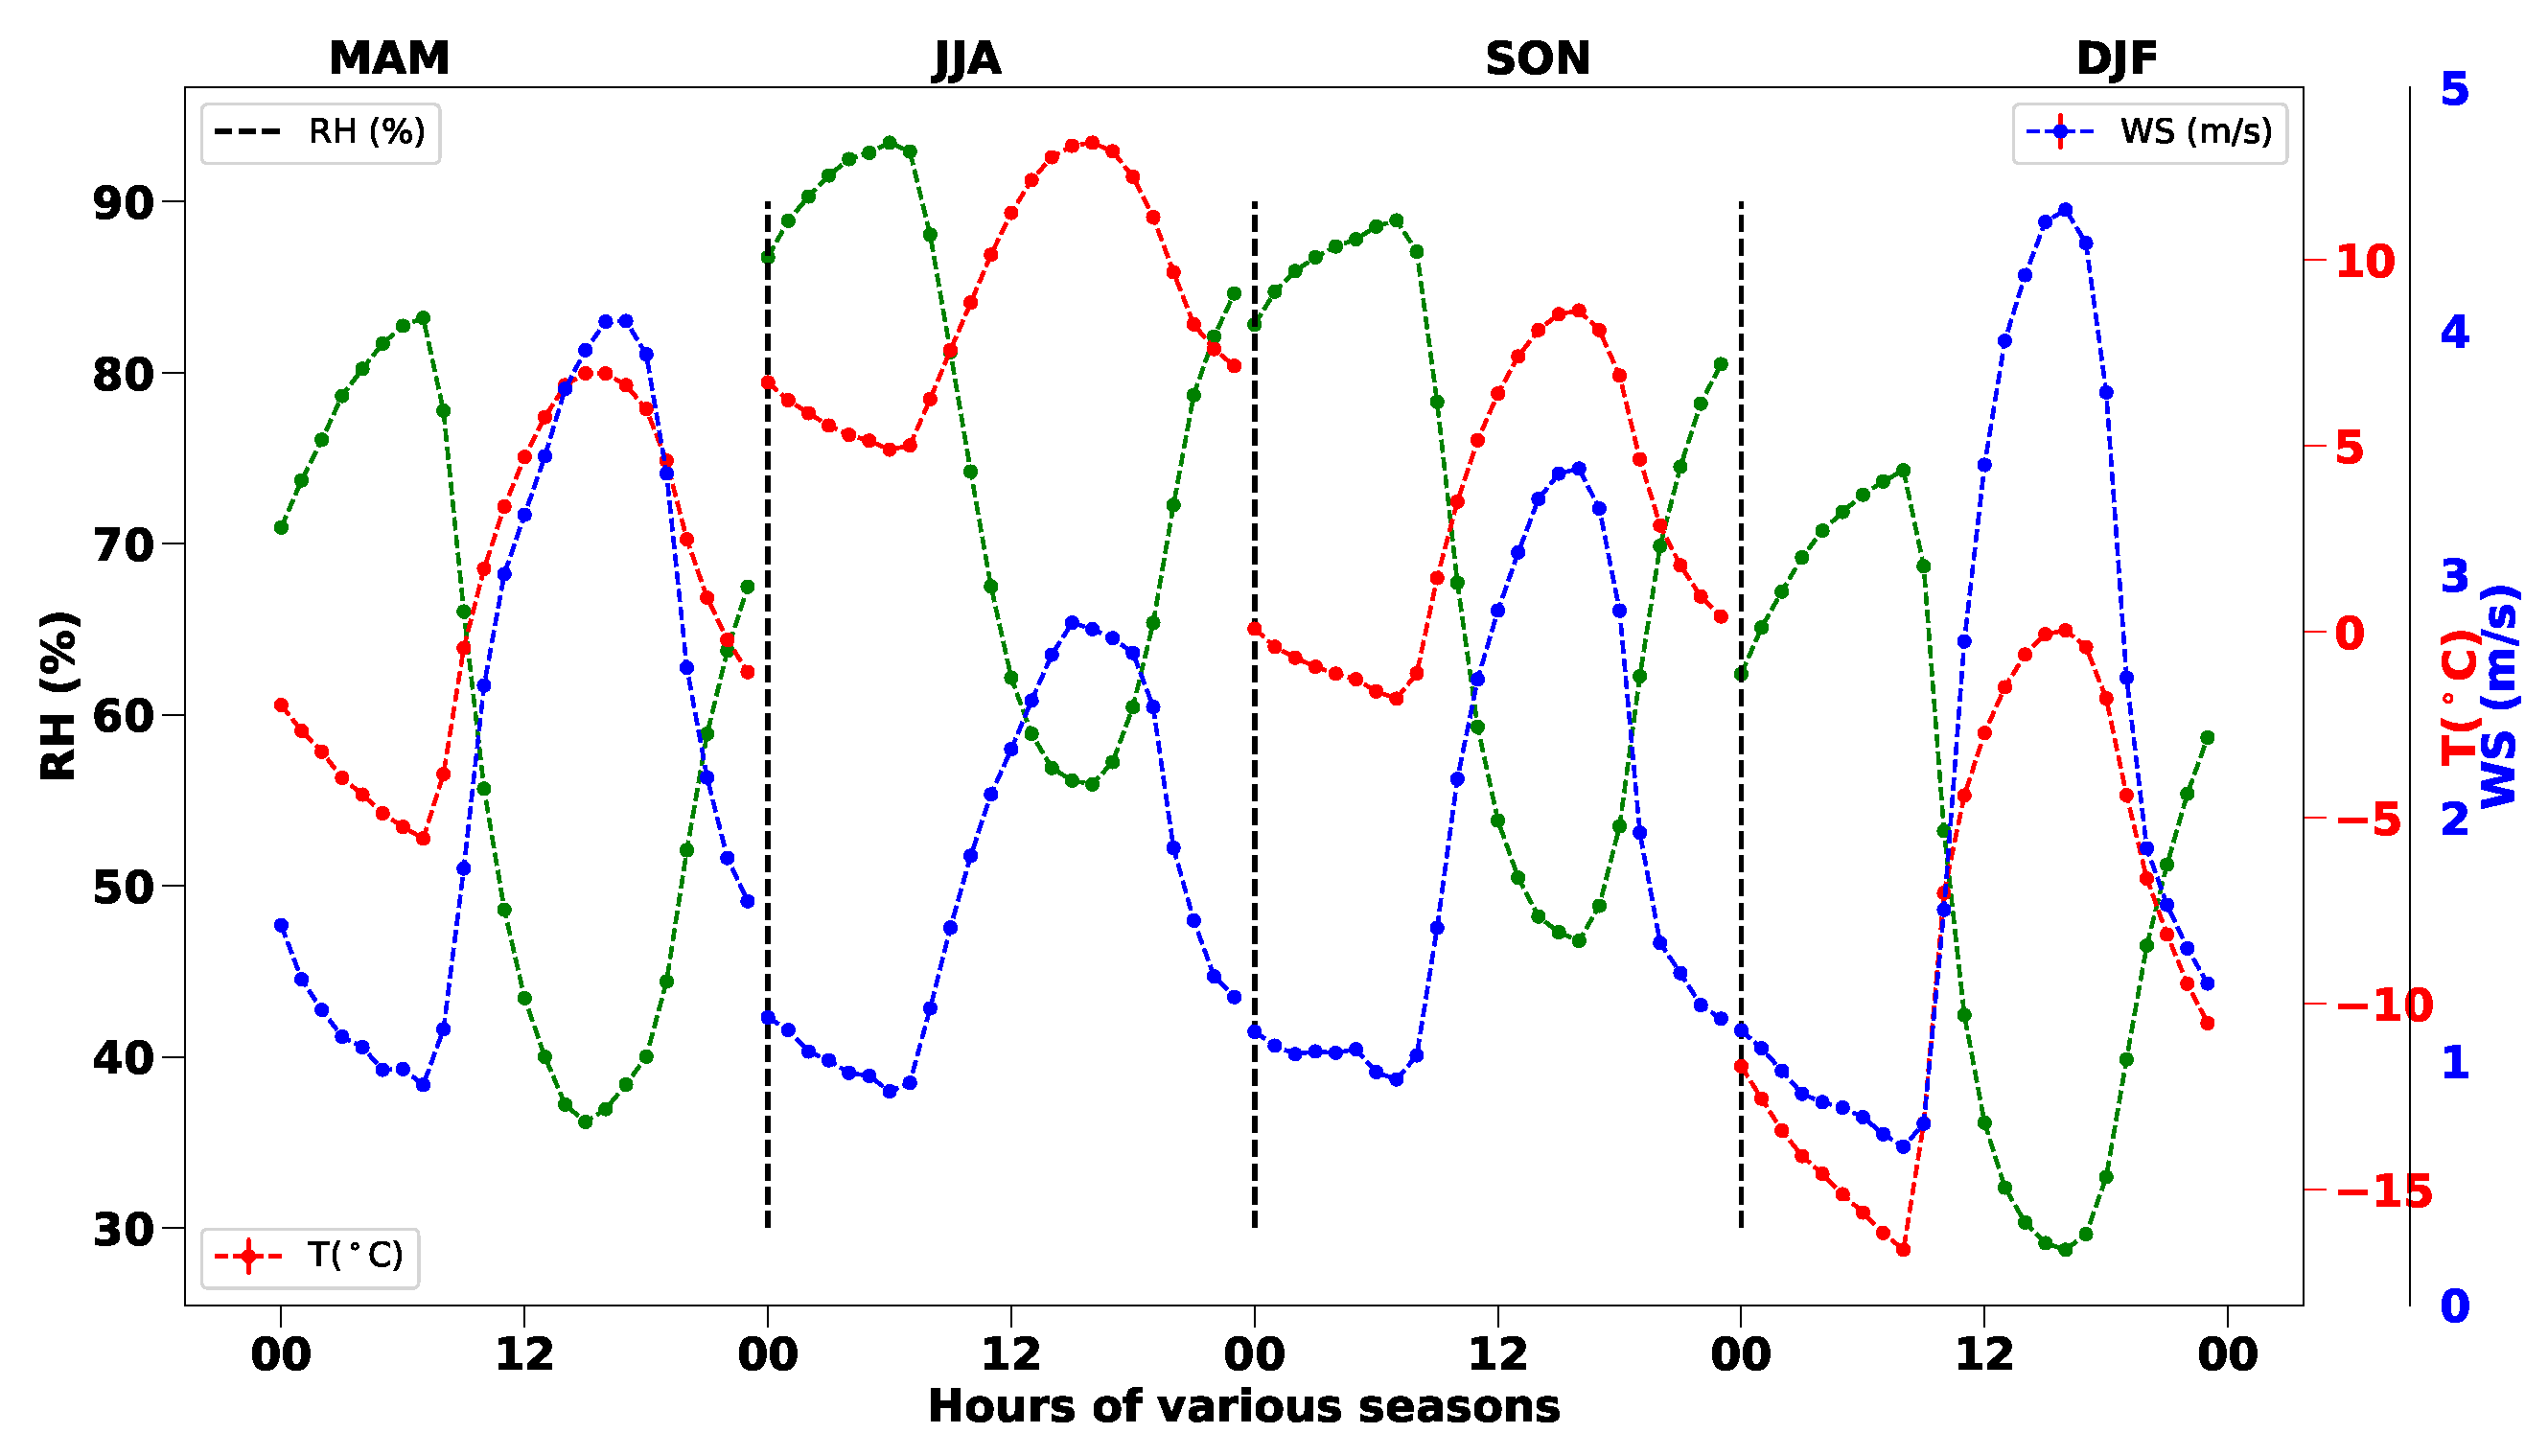
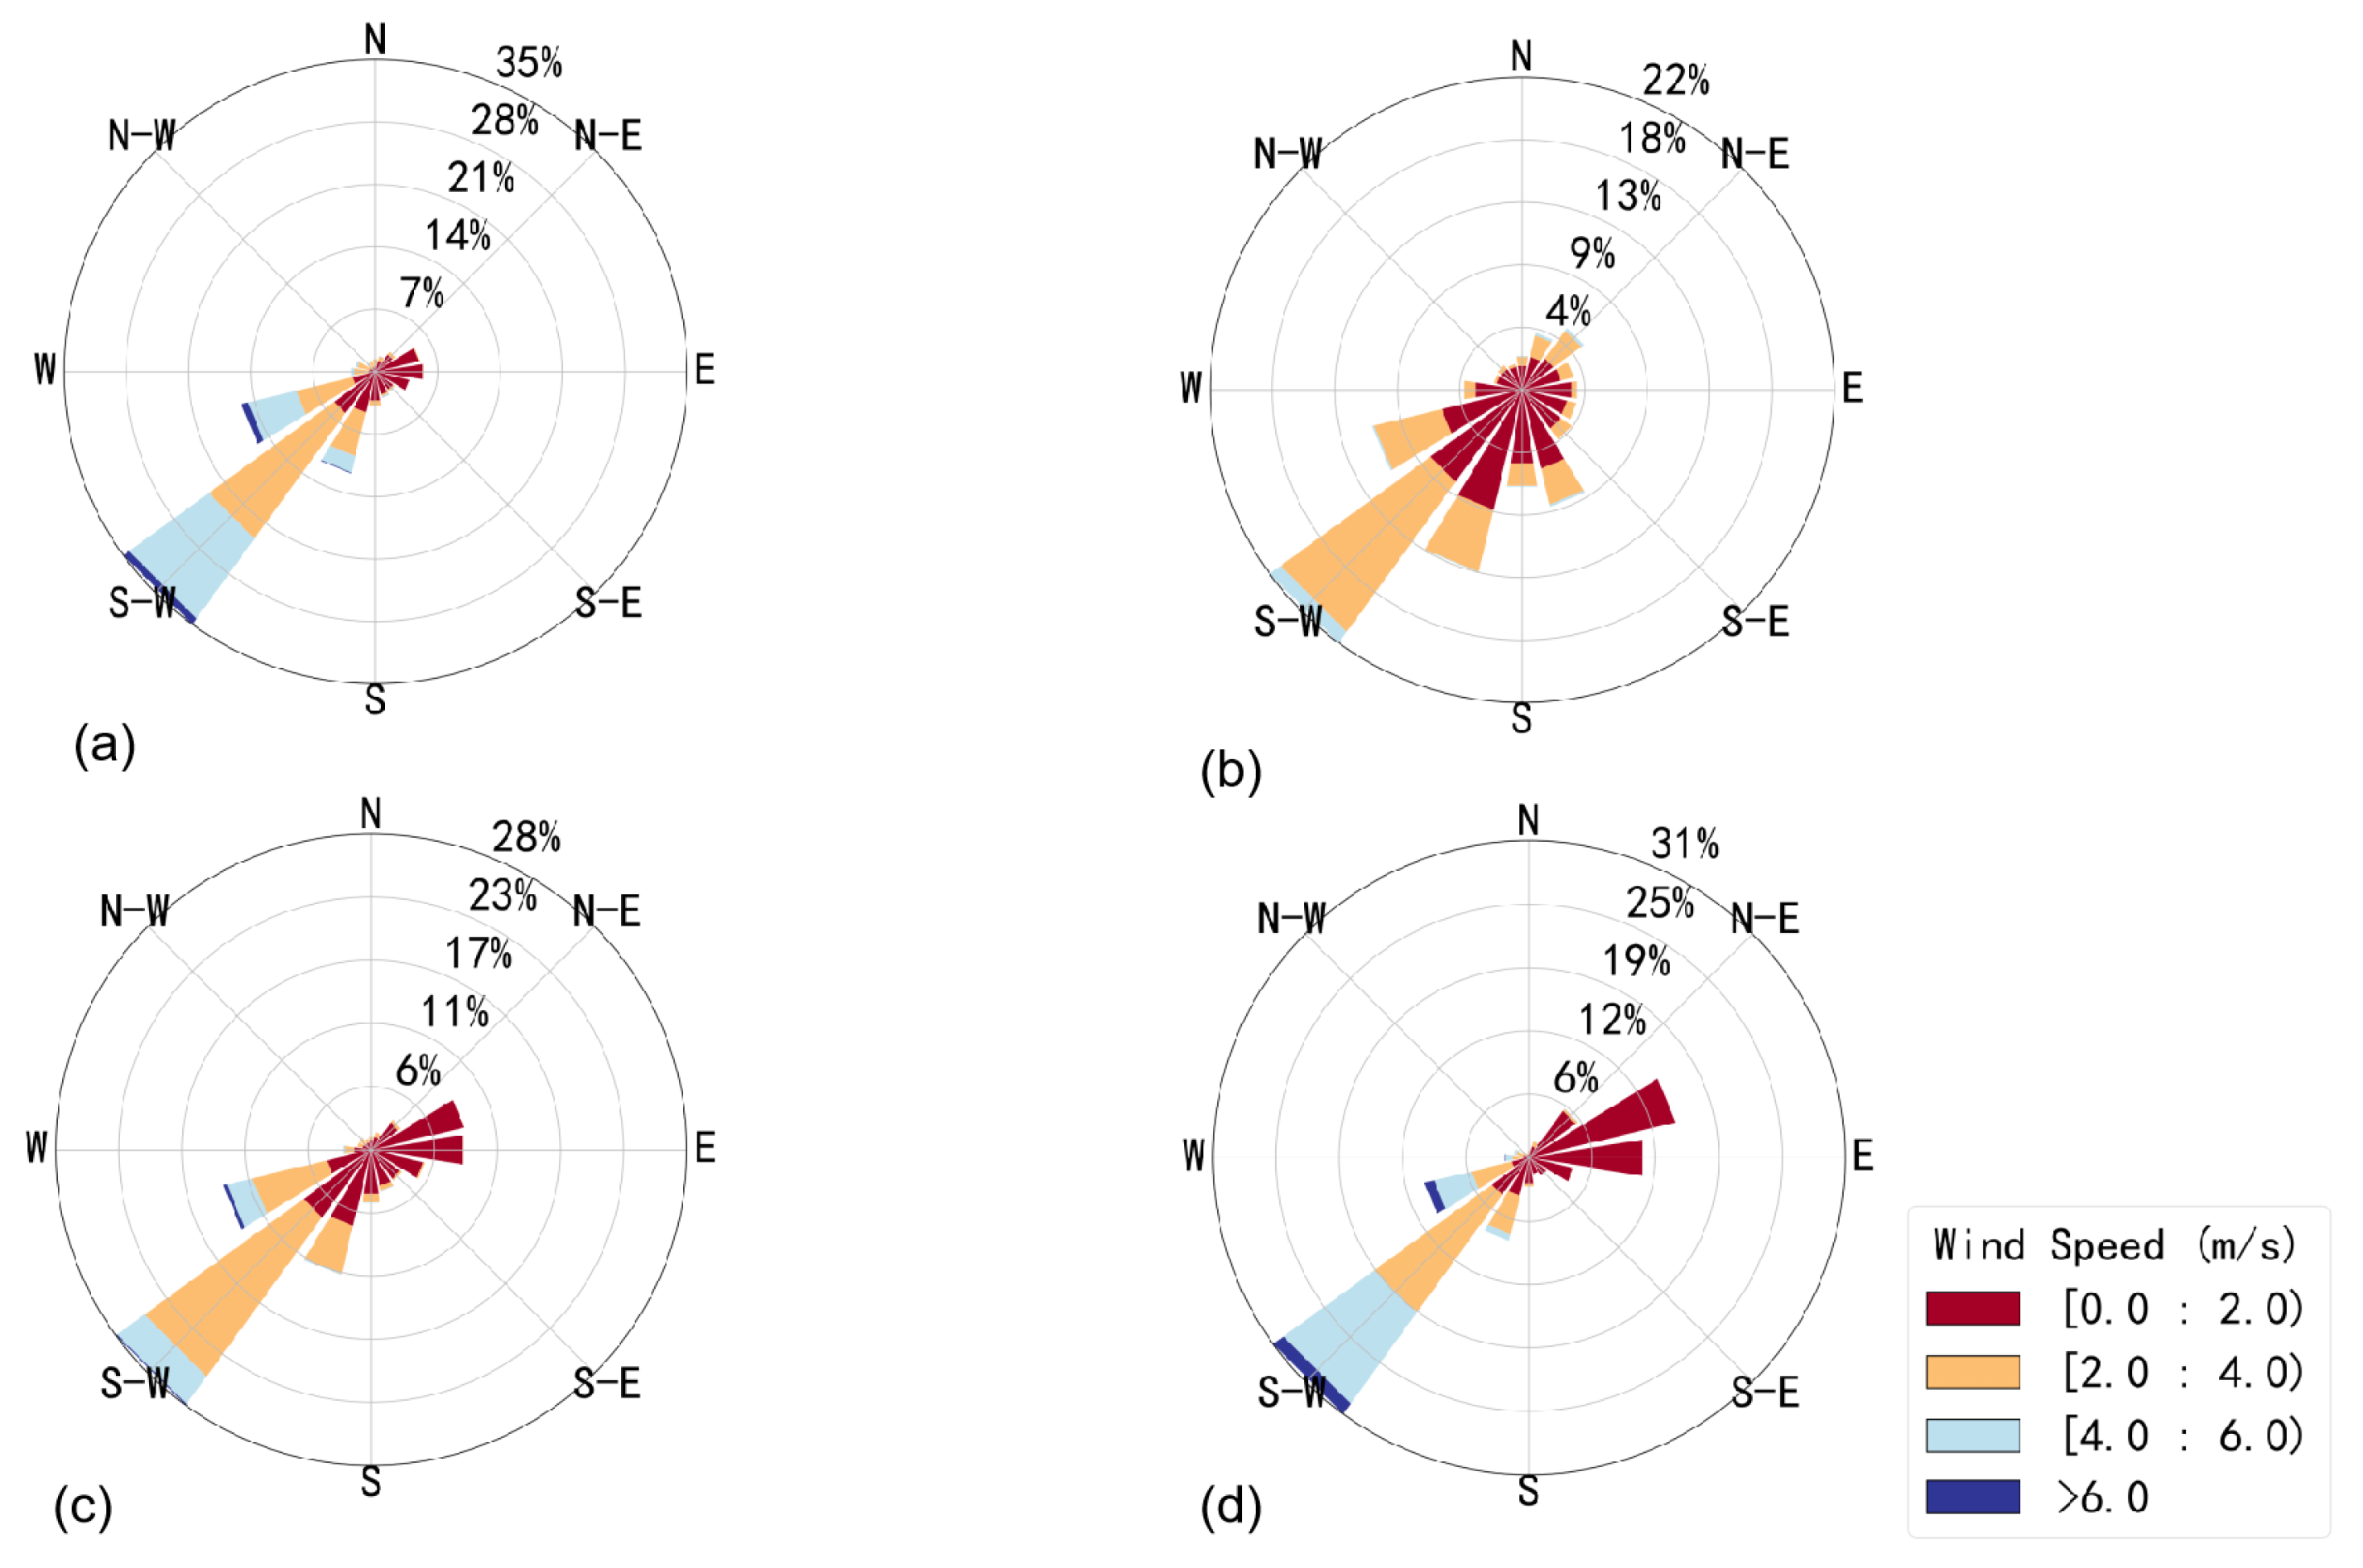
3.1. Meteorological Feature
3.2. Baseline Continental Aerosol at LHAASO
3.3. Seasonal Variations of the AOD and AE
3.4. Diurnal Daytime Variation of AOD and AE
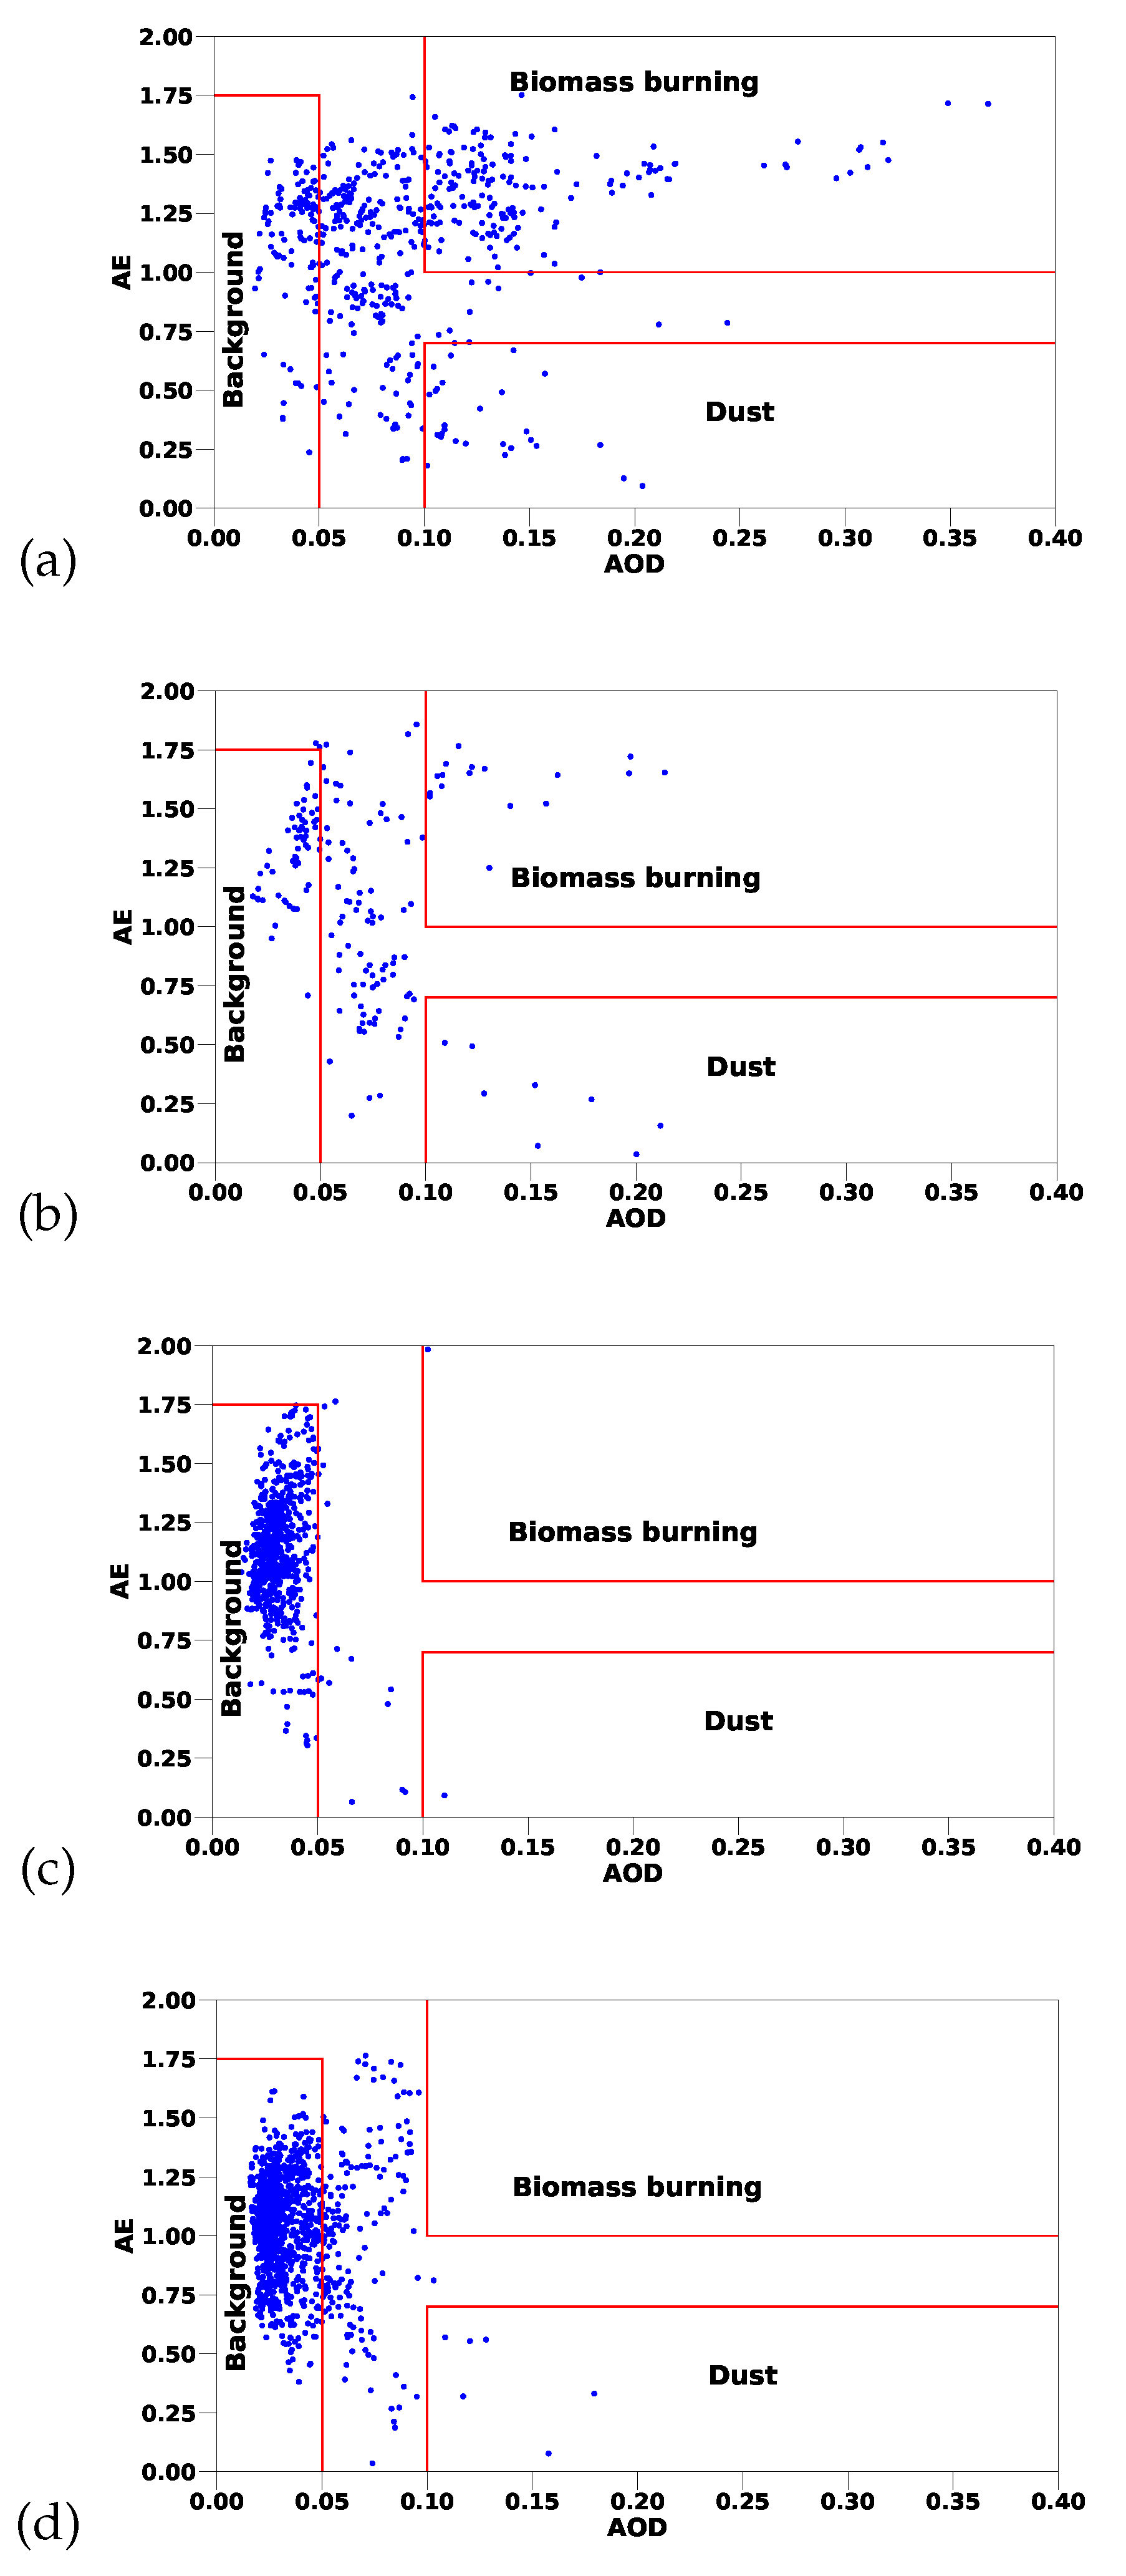
3.5. Characterization of Aerosol Types
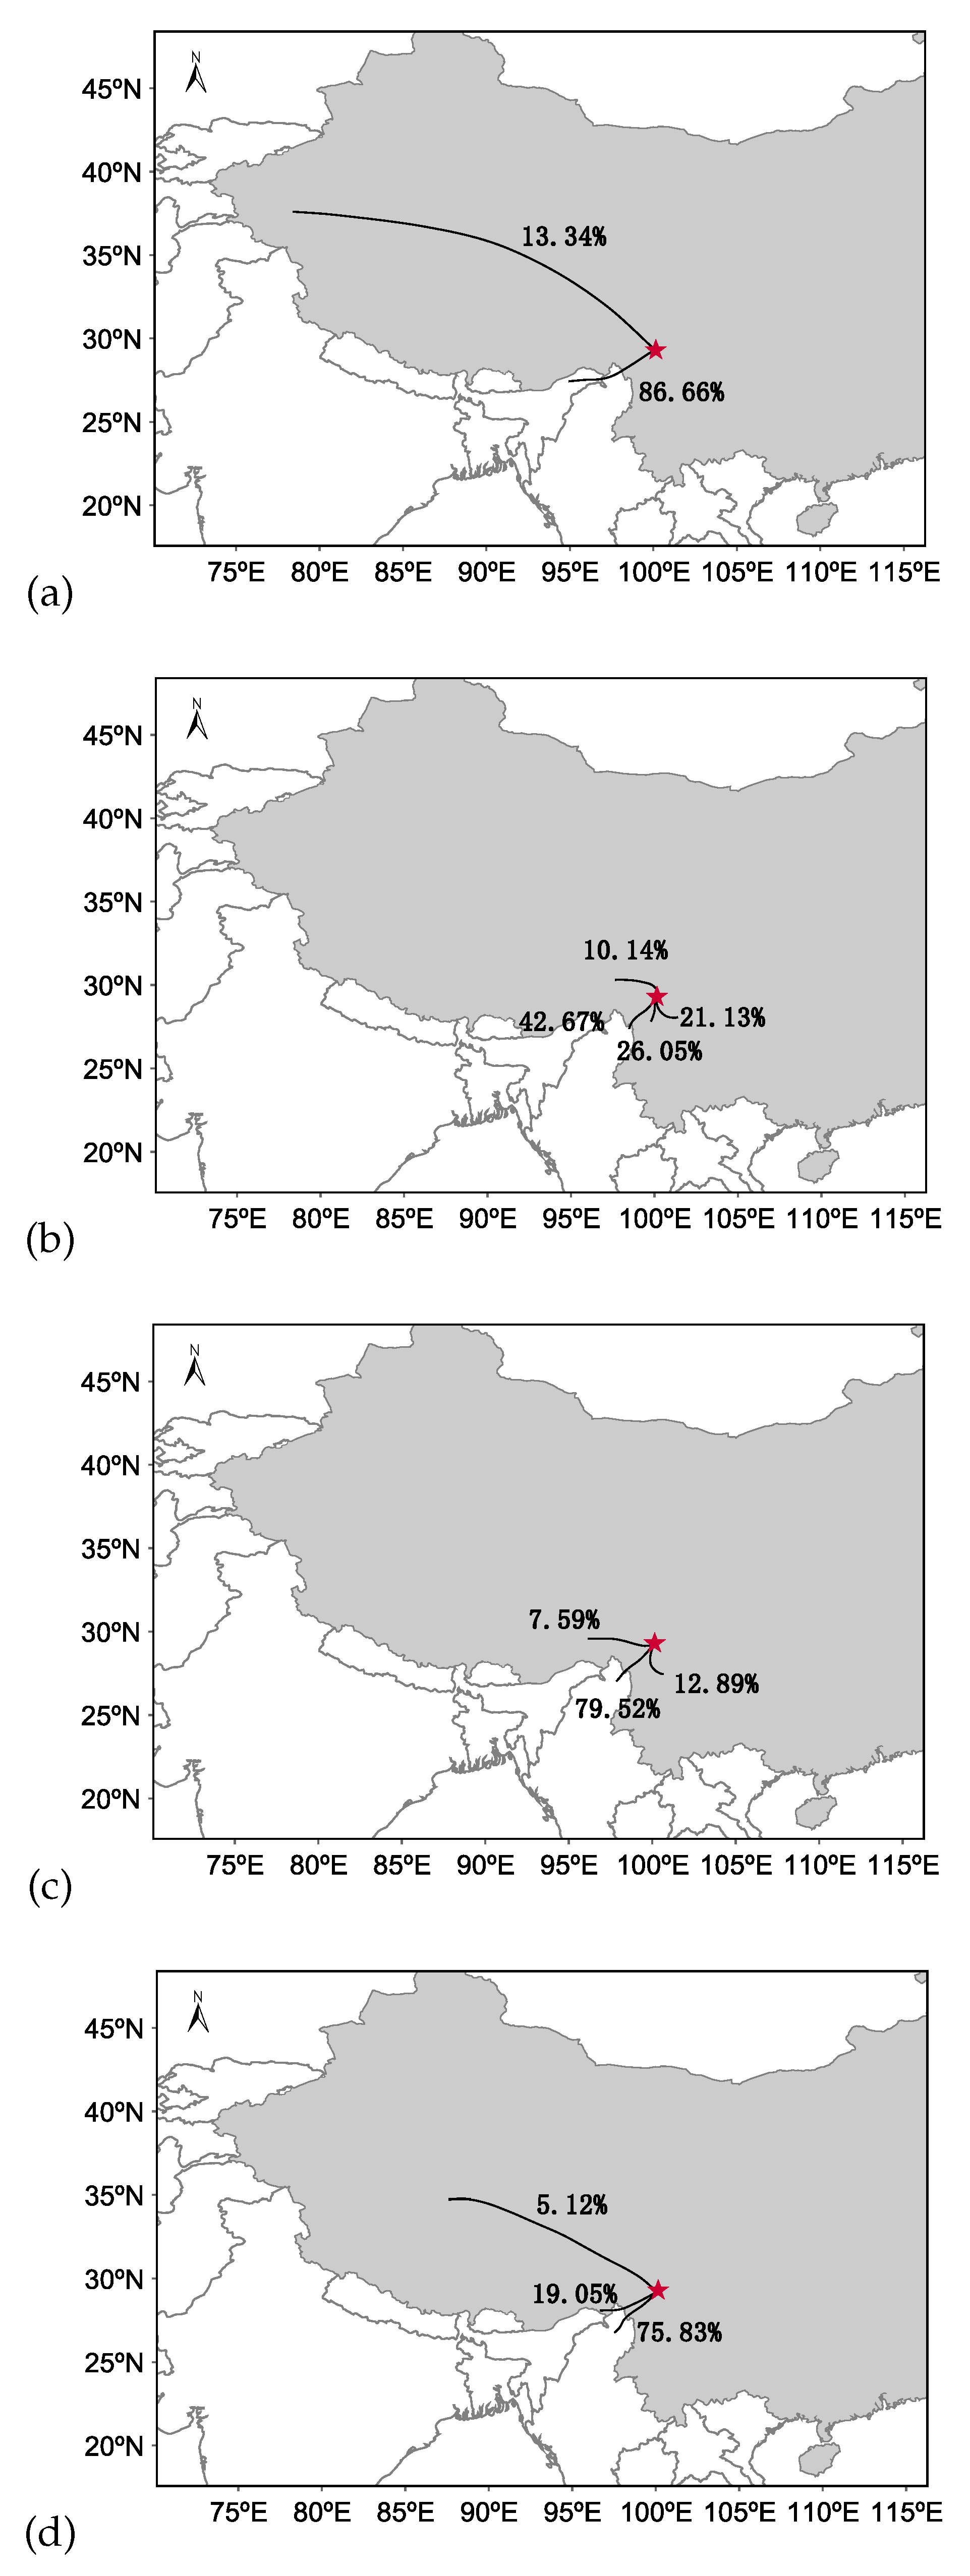
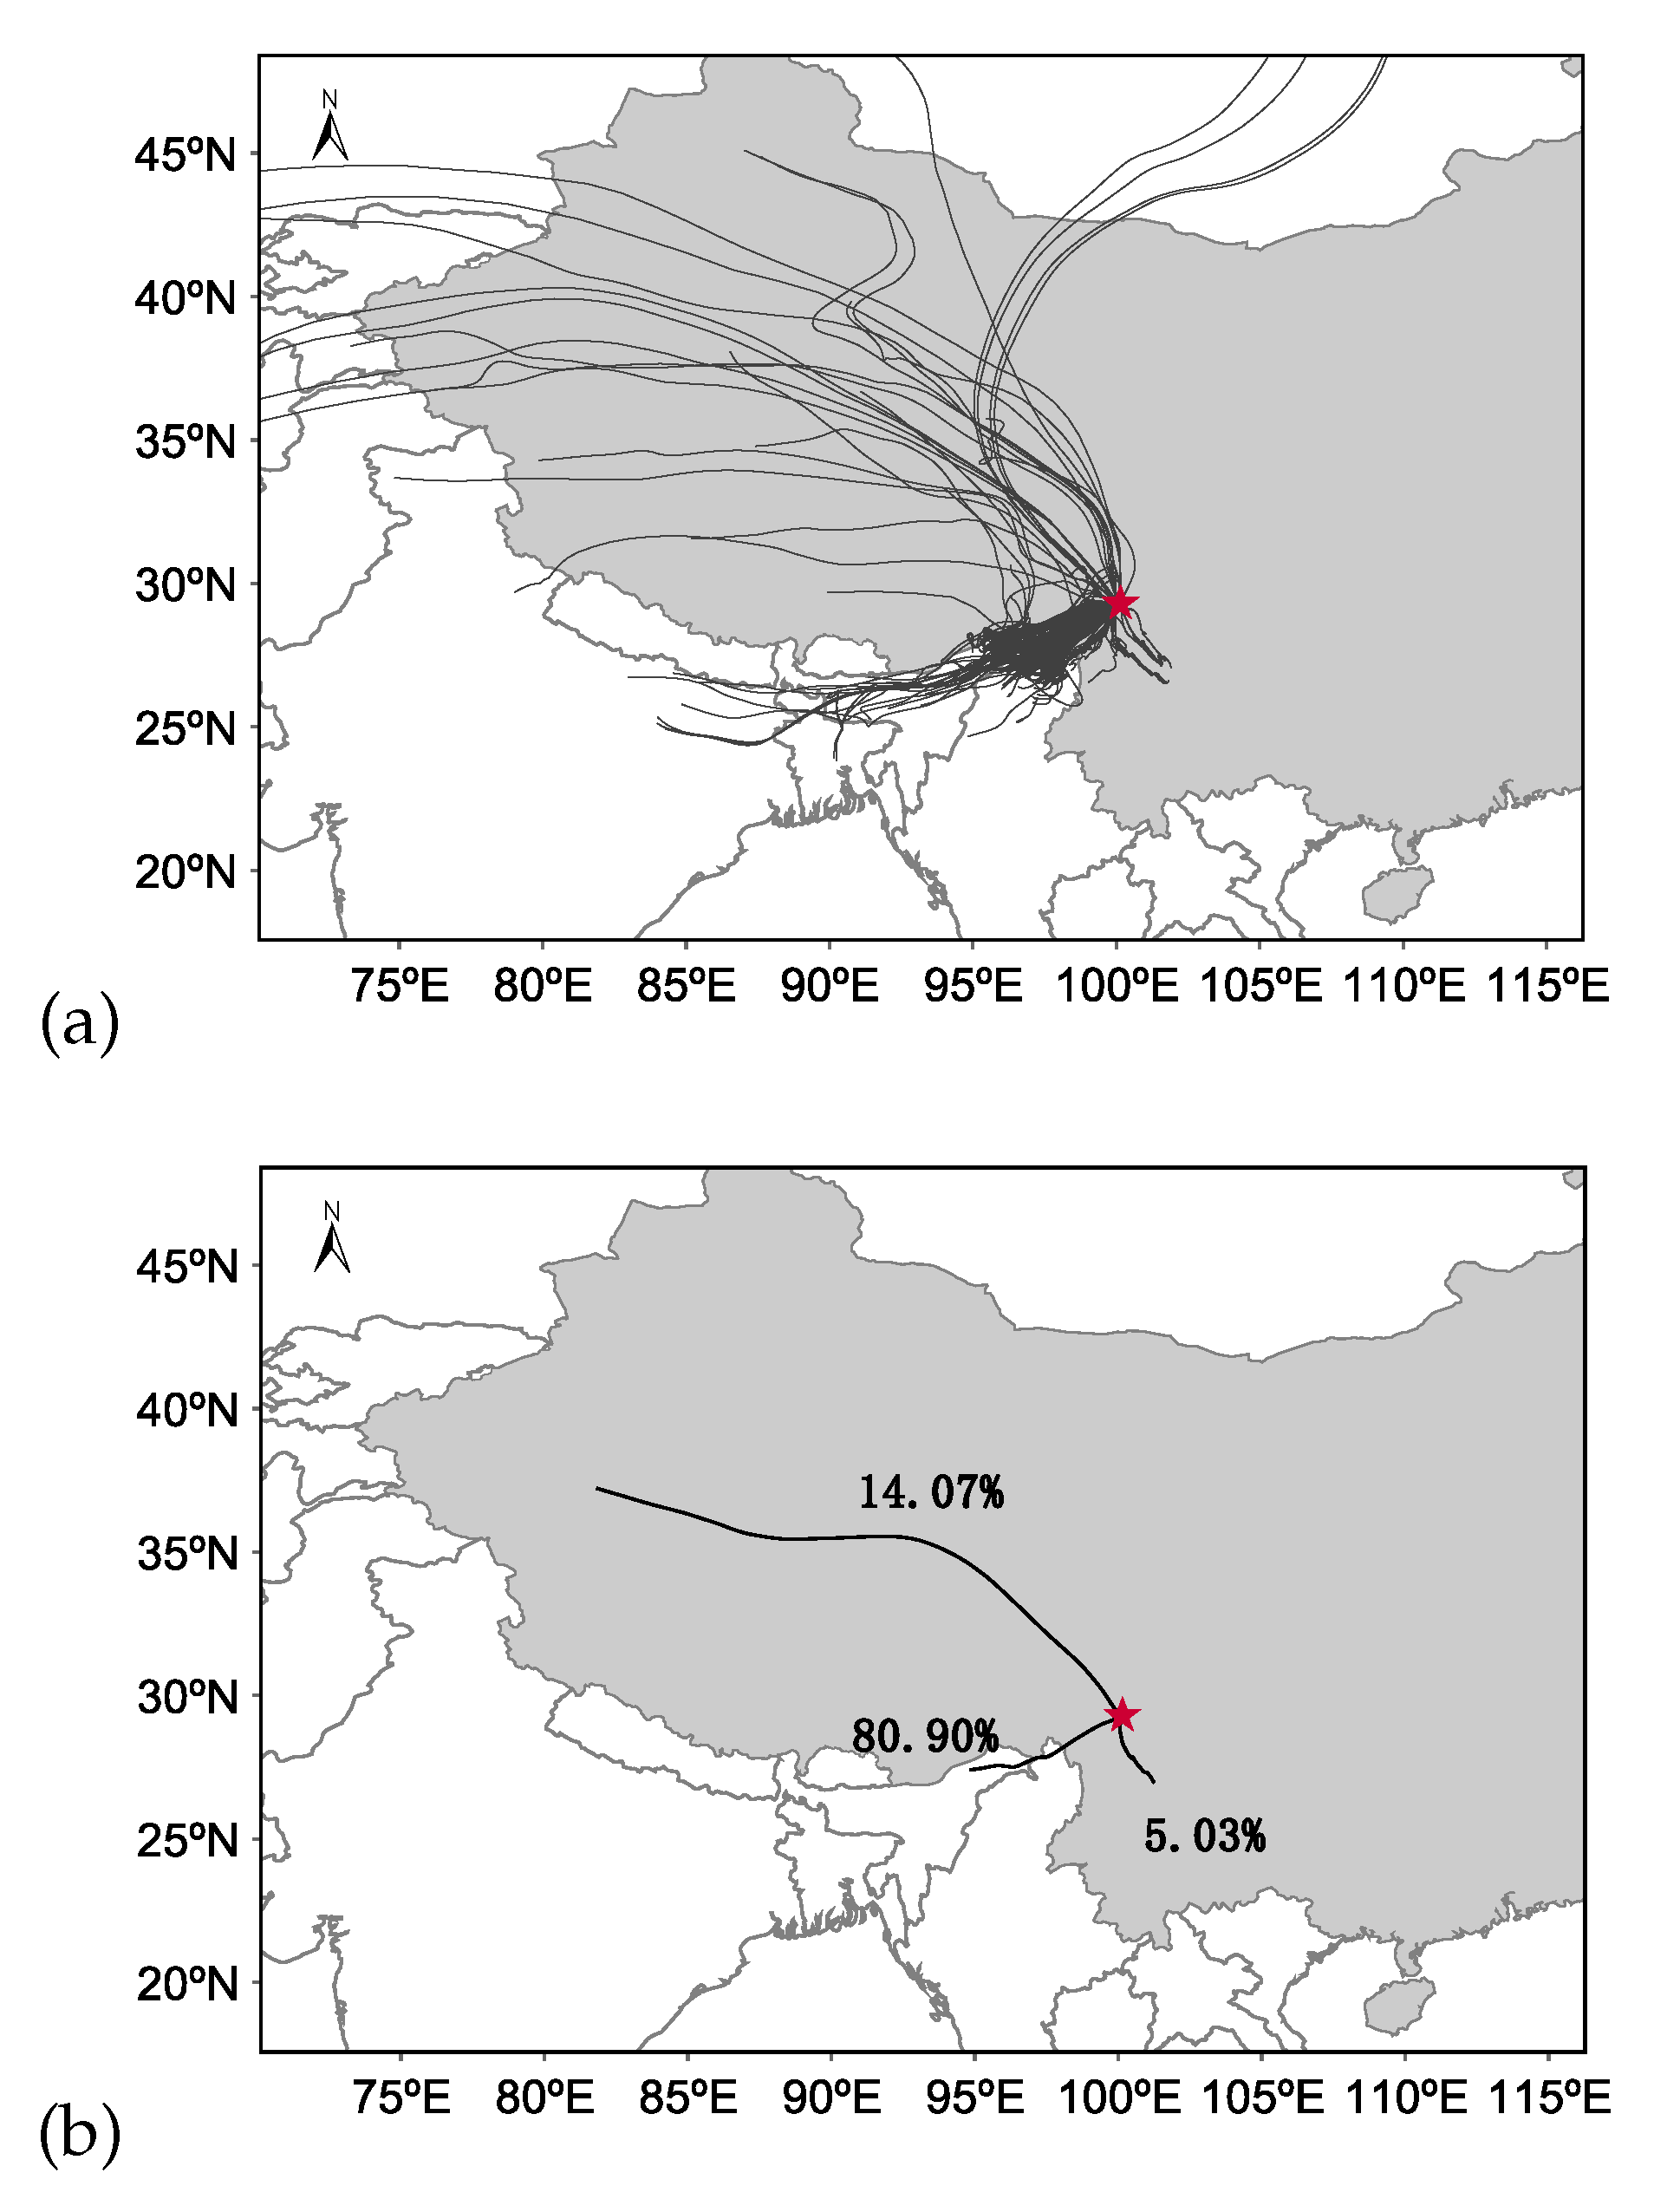
4. Analysis of Possible Origins of Aerosols
5. Summary
6. Acknowledge
References
- Ramanathan, V.; Crutzen, P.J.; Kiehl, J.; Rosenfeld, D. Aerosols, climate, and the hydrological cycle. science 2001, 294, 2119–2124. [CrossRef]
- Cao, Z.; Aharonian, F.; An, Q.; Axikegu.; Bai, L.; Bai, Y.; Bao, Y.; Bastieri, D.; Bi, X.; Bi, Y.; others. Ultrahigh-energy photons up to 1.4 petaelectronvolts from 12 γ-ray Galactic sources. Nature 2021, 594, 33. [CrossRef]
- Cao, Z.; Chen, M.J.; Song-zhan, C.; Hong-bo, H.; Cheng, L.; Ye, L.; Ling-ling, M.; Xin-hua, M.; Xiang-dong, S.; Han-rong, W.; Gang, X.; Zhi-guo, Y.; Li-qiao, Y.; Min, Z.; Shou-shan, Z. Introduction to Large High Altitude Air Shower Observatory (LHAASO). Chinese Astronomy and Astrophysics 2019, 43, 457. [CrossRef]
- Zhu, F.R.; Zhang, Y.; Xie, N.; Jia, H.Y.; Li, X.M. Study on the calibration optimization of the laser lidar for WFCTA of LHAASO. 35th International Cosmic Ray Conference 2018, 301, 366. [CrossRef]
- Xie, N.; Liu, H.; Hu, Y.; Long, W.; Jia, H.; Zhu, F.; Chen, Q. The Performance of the Laser Systems in the Calibration System of LHAASO-WFCTA. 36th International Cosmic Ray Conference (ICRC2019) 2021, 358, 498. [CrossRef]
- Chen, L.; Li, X.; Ge, L.; Liu, H.; Sun, Q.; Wang, Y.; Xia, J.; Zhu, F.; Zhang, Y. Application of the nitrogen laser calibration system in LHAASO-WFCTA. 37th International Cosmic Ray Conference 2022, 395, 269. [CrossRef]
- Q. N. Sun.; L. S. Geng.; Li, X.; Chen, L.; Liu, H.; Wang, Y.; Zhu, F.; Zhang, Y.; Ji, X.; Collaboration, L.; others. The YAG Lidar System Applied in LHAASO. 37th International Cosmic Ray Conference 2022, 395, 272. [CrossRef]
- Sun, Q.N.; Zhu, F.R.; Zhang, Y.; Chen, L.; Zhang, S.; Geng, L.; Liu, H.; Min, Z.; Wang, Y.; Wang, Y.; Yang, M.; Xie, L.; Xia, J. Properties and performance of nitrogen laser systems for calibration of LHAASO-WFCTA. Nuclear Instruments and Methods in Physics Research Section A: Accelerators, Spectrometers, Detectors and Associated Equipment 2023, 1057, 168759. [CrossRef]
- Sun, Q.N.; Xie, L.; Yuan, G.; Chen, L.; Wang, Y.; Zhu, F.; Zhang, Y.; Zhang, S. Design and development of laser temperature control system of LHAASO. Journal of Instrumentation 2023, 18, T06008. [CrossRef]
- Eck, T.F.; Holben, B.; Reid, J.; Dubovik, O.; Smirnov, A.; O’neill, N.; Slutsker, I.; Kinne, S. Wavelength dependence of the optical depth of biomass burning, urban, and desert dust aerosols. Journal of Geophysical Research: Atmospheres 1999, 104, 31333. [CrossRef]
- Schuster, G.L.; Dubovik, O.; Holben, B.N. Angstrom exponent and bimodal aerosol size distributions. Journal of Geophysical Research: Atmospheres 2006, 111. [CrossRef]
- Bibi, H.; Alam, K.; Chishtie, F.; Bibi, S.; Shahid, I.; Blaschke, T. Intercomparison of MODIS, MISR, OMI, and CALIPSO aerosol optical depth retrievals for four locations on the Indo-Gangetic plains and validation against AERONET data. Atmospheric Environment 2015, 111, 113. [CrossRef]
- Mehta, M.; Singh, R.; Singh, A.; Singh, N.; others. Recent global aerosol optical depth variations and trends—A comparative study using MODIS and MISR level 3 datasets. Remote sensing of Environment 2016, 181, 137. [CrossRef]
- You, Y.C.; Zhao, T.L.; Xie, Y.; Zheng, Y.; Zhu, J.; Xia, J.; Cao, L.; Wang, C.; Che, H.; Liao, Y.; others. Variation of the aerosol optical properties and validation of MODIS AOD products over the eastern edge of the Tibetan Plateau based on ground-based remote sensing in 2017. Atmospheric Environment 2020, 223, 117257. [CrossRef]
- Wu, L.; Lv, X.; Qin, K.; Bai, Y.; Li, J.; Ren, C.; Zhang, Y. Analysis to Xuzhou aerosol optical characteristics with ground–based measurements by sun photometer. Chin. Sci. Bull 2016, 61, 2287. [CrossRef]
- Barreto, Á.; Cuevas, E.; Granados-Muñoz, M.J.; Alados-Arboledas, L.; Romero, P.M.; Gröbner, J.; Kouremeti, N.; Almansa, A.F.; Stone, T.; Toledano, C.; others. The new sun-sky-lunar Cimel CE318-T multiband photometer–a comprehensive performance evaluation. Atmospheric Measurement Techniques 2016, 9, 631. [CrossRef]
- Li, Z.X.; He, Y.Q.; Wang, C.; Wang, X.; Xin, H.; Zhang, W.; Cao, W. Spatial and temporal trends of temperature and precipitation during 1960–2008 at the Hengduan Mountains, China. Quaternary International 2011, 236, 127. [CrossRef]
- Fan, J.S.; Shao, L.Y.; Hu, Y.; Wang, J.; Wang, J.; Ma, J. Classification and chemical compositions of individual particles at an eastern marginal site of Tibetan Plateau. Atmospheric Pollution Research 2016, 7, 833. [CrossRef]
- Liu, B.; Cong, Z.Y.; Wang, Y.; Xin, J.; Wan, X.; Pan, Y.; Liu, Z.; Wang, Y.; Zhang, G.; Wang, Z.; others. Background aerosol over the Himalayas and Tibetan Plateau: Observed characteristics of aerosol mass loading. Atmospheric Chemistry and Physics 2017, 17, 449. [CrossRef]
- Pi, W.X.; Huang, M.; Zhu, F.R.; He, Y.; Xie, N.; Zhang, Y.; Chen, Q.H.; Jia, H.Y. Extinction coefficients of surface atmospheric aerosol above LHAASO. Chinese Physics C 2019, 43, 085001. [CrossRef]
- Liu, J.; Tang, X.F.; Xia, J.J.; Zhu, F.R. Variation of the Atmospheric Boundary Layer Height at the Eastern Edge of the Tibetan Plateau. arXiv:2306.01358 2023. [CrossRef]
- Tao, W.C.; Huang, G.; Dong, D.; Wang, P.; Yu, T.; Gong, H. Dominant modes of interannual variability in precipitation over the Hengduan Mountains during rainy seasons. International Journal of Climatology 2021, 41, 2795. [CrossRef]
- Liu, Y.; Zhao, L. The preliminary analysis of sunshine durations with meteorological data for the Chinese Giant Solar Telescope site survey. Monthly Notices of the Royal Astronomical Society 2013, 434, 1674. [CrossRef]
- Li, Z.X.; He, Y.Q.; Wang, C.; Wang, X.W.; Xin, H.; Zhang, W.; Cao, W. Spatial and temporal trends of temperature and precipitation during 1960-2008 at the Hengduan Mountains, China. Quaternary International 2011, 236, 127. [CrossRef]
- Fan, W.W.; Hu, Z.Y.; Xun, X.; others. Review of Qinghai-Xizang Plateau monsoon’s evolution and climatic effects. Plateau Meteorology 2021, 40, 1294. [CrossRef]
- Tanré, D.; Kaufman, Y.; Holben, B.e.a.; Chatenet, B.; Karnieli, A.; Lavenu, F.; Blarel, L.; Dubovik, O.; Remer, L.; Smirnov, A. Climatology of dust aerosol size distribution and optical properties derived from remotely sensed data in the solar spectrum. Journal of Geophysical Research: Atmospheres 2001, 106, 18205. [CrossRef]
- Smith, S.; Toumi, R. Measuring cloud cover and brightness temperature with a ground-based thermal infrared camera. Journal of Applied Meteorology and Climatology 2008, 47, 683. [CrossRef]
- Xu, C.; Ma, Y.; You, C.; Zhu, Z. The regional distribution characteristics of aerosol optical depth over the Tibetan Plateau. Atmospheric Chemistry and Physics 2015, 15, 12065. [CrossRef]
- Kaufman, Y.J.; Smirnov, A.; Holben, B.N.; Dubovik, O. Baseline maritime aerosol: Methodology to derive the optical thickness and scattering properties. Geophysical Research Letters 2001, 28, 3251. [CrossRef]
- Xia, X.; Zong, X.; Cong, Z.; Chen, H.; Kang, S.; Wang, P. Baseline continental aerosol over the central Tibetan plateau and a case study of aerosol transport from South Asia. Atmospheric Environment 2011, 45, 7370. [CrossRef]
- Andreae, M.O. Aerosols before pollution. Science 2007, 315, 50. [CrossRef]
- Hamilton, D.S.; Lee, L.A.; Pringle, K.J.; Reddington, C.L.; Spracklen, D.V.; Carslaw, K.S. Occurrence of pristine aerosol environments on a polluted planet. Proceedings of the National Academy of Sciences 2014, 111, 18466. [CrossRef]
- Xia, X.; Che, H.; Zhu, J.; Chen, H.; Cong, Z.; Deng, X.; Fan, X.; Fu, Y.; Goloub, P.; Jiang, H.; Liu, Q.; Mai, B.; Wang, P.; Wu, Y.; Zhang, J.; Zhang, R.; Zhang, X. Ground-based remote sensing of aerosol climatology in China: Aerosol optical properties, direct radiative effect and its parameterization. Atmospheric Environment 2016, 124, 243. [CrossRef]
- Che, H.; Wang, Y.; Sun, J. Aerosol optical properties at Mt. Waliguan Observatory, China. Atmospheric Environment 2011, 45, 6004. [CrossRef]
- Holben, B.N.; Tanre, D.; Smirnov, A.; Eck, T.; Slutsker, I.; Abuhassan, N.; Newcomb, W.; Schafer, J.; Chatenet, B.; Lavenu, F.; others. An emerging ground-based aerosol climatology: Aerosol optical depth from AERONET. Journal of Geophysical Research: Atmospheres 2001, 106, 12067. [CrossRef]
- Zhang, Y.; Yu, H.; Eck, T.F.; Smirnov, A.; Chin, M.; Remer, L.A.; Bian, H.; Tan, Q.; Levy, R.; Holben, B.N.; others. Aerosol daytime variations over North and South America derived from multiyear AERONET measurements. Journal of Geophysical Research: Atmospheres 2012, 117. [CrossRef]
- Xia, X.; Chen, Hong Bin, C.; Pucai, W. Aerosol properties in a Chinese semiarid region. Atmospheric Environment 2004, 38, 4571. [CrossRef]
- Smirnov, A.; Holben, B.N.; Dubovik, O.; O’Neill, N.T.; Eck, T.F.; Westphal, D.L.; Goroch, A.K.; Pietras, C.; Slutsker, I. Atmospheric aerosol optical properties in the Persian Gulf. Journal of the Atmospheric Sciences 2002, 59, 620. [CrossRef]
- Pokharel, M.; Guang, J.; Liu, B.; Kang, S.; Ma, Y.; Holben, B.N.; Xia, X.; Xin, J.; Ram, K.; Rupakheti, D.; others. Aerosol properties over Tibetan Plateau from a decade of AERONET measurements: Baseline, types, and influencing factors. Journal of Geophysical Research: Atmospheres 2019, 124, 13357. [CrossRef]
- Kleist, D.T.; Parrish, D.F.; Derber, J.C.; Treadon, R.; Wu, W.S.; Lord, S. Introduction of the GSI into the NCEP global data assimilation system. Weather and Forecasting 2009, 24, 1691. [CrossRef]
- Wang, J.Y.; Cao, X.J.; Li, M.; Tang, C.; Zhang, Z.; Zhang, H.; Tian, P.; Liang, J.; Zhang, L.; Shi, J. Optical characteristics of aerosol and its potential sources over Nam Co in the Tibetan Plateau during Asian summer monsoon period. Atmospheric Environment 2023, 298, 119611. [CrossRef]
- Fan, J.S.; Shao, L.Y.; Hu, Y.; Wang, J.; Wang, J.; Ma, J. Classification and chemical compositions of individual particles at an eastern marginal site of Tibetan Plateau. Atmospheric Pollution Research 2016, 7, 833. [CrossRef]
- Wang, Y.Q. MeteoInfo: GIS software for meteorological data visualization and analysis. Meteorological Applications 2014, 21, 360. [CrossRef]
- Aab, A.; Abreu, P.; Aglietta, M.; Ahlers, M.; Ahn, E.; Albuquerque, I.; Allekotte, I.; Allen, J.; Allison, P.; Almela, A.; others. Origin of atmospheric aerosols at the Pierre Auger Observatory using studies of air mass trajectories in South America. Atmospheric Research 2014, 149, 120. [CrossRef]
- Badarinath, K.; Madhavi Latha, K.; Kiran Chand, T.; Gupta, P.K.; Ghosh, A.; Jain, S.; Gera, B.; Singh, R.; Sarkar, A.; Singh, N.; Parmar, R.; Koul, S.; Kohli, R.; Nath, S.; Ojha, V.; Singh, G. Characterization of aerosols from biomass burning–a case study from Mizoram (Northeast), India. Chemosphere 2004, 54, 167. [CrossRef]
- Shi, Y.S.; Sa Sai, T.; Yamaguchi, Y. Spatio-temporal evaluation of carbon emissions from biomass burning in Southeast Asia during the period 2001–2010. Ecological Modelling 2014, 272, 98. [CrossRef]
- Zhu, J.; Xia, X.; Che, H.; Wang, J.; Zhang, J.; Duan, Y. Study of aerosol optical properties at Kunming in southwest China and long-range transport of biomass burning aerosols from North Burma. Atmospheric Research 2016, 169, 237. [CrossRef]
| Station | Time period | |||
|---|---|---|---|---|
| LHAASO | 2020.10-2022.10 | 0.05 ± 0.03 | 1.17 ± 0.30 | Mountain background station in TP |
| Litang | 2017.01-2017.12 | 0.08 ± 0.03 | 0.72 ± 0.23 | Urban station in TP |
| WLG | 2009.09-2012.12 | 0.14 ± 0.07 | 0.59 ± 0.24 | Background station in TP |
| Lhasa | 2011.12-2013.12 | 0.10 ± 0.08 | 0.67 ± 0.30 | Urban station in TP |
| NAM−CO | 2006.08-2011.01 | 0.04 ± 0.02 | 0.94 ± 0.44 | Background station in TP |
| QOMS−CAS | 2010.09-2012.12 | 0.05 ± 0.29 | 0.79 ± 0.44 | Mountain background station in TP |
Disclaimer/Publisher’s Note: The statements, opinions and data contained in all publications are solely those of the individual author(s) and contributor(s) and not of MDPI and/or the editor(s). MDPI and/or the editor(s) disclaim responsibility for any injury to people or property resulting from any ideas, methods, instructions or products referred to in the content. |
© 2024 by the authors. Licensee MDPI, Basel, Switzerland. This article is an open access article distributed under the terms and conditions of the Creative Commons Attribution (CC BY) license (http://creativecommons.org/licenses/by/4.0/).


