Preprint
Review

A Comparative Review of Models for All-Solid-State Li-Ion Batteries

Altmetrics

Downloads

162

Views

71

Comments

0

A peer-reviewed article of this preprint also exists.

Submitted:

20 March 2024

Posted:

20 March 2024

You are already at the latest version

Alerts
Abstract
In recent times, there has been significant enthusiasm for the development of all solid state batteries. This interest stems from a dual focus on safety—addressing concerns related to toxic and flammable organic liquid electrolytes—and the pursuit of high energy density. \cite{SCHNELL2018160,Zheng2018}. While liquid electrolyte batteries constitute for now the vast majority of commercial cells, solid electrolyte batteries show great promise. In parallel with experimental research, computational models \cite{GrazioliEtAlCM2016} clarify the several fundamental physics \cite{LiMonroeARCBM2020} that take place throughout battery operations. We review some classical models, emphasizing the conceptual advancements documented in the most recent works.
Keywords: 
Subject: Engineering  -   Mechanical Engineering

1. Introduction

Numerous instances demonstrate that traditional Li-ion batteries, which rely on liquid electrolytes and porous electrodes, are susceptible to chemo-mechanical degradation and face challenges related to environmental and safety concerns due to the flammability of toxic organic liquid electrolytes. Solid electrolytes are used in all-solid-state batteries (ASSB). They improve thermo-electro-chemical stability and remove the possibility of hazardous liquid electrolyte leaks.
Largely funded international projects [5] and strategic action plans ( as for the European battery 2030+ initiative ) assess how the scientific community trusts and supports the development of storage systems to meet the social quest for decarbonization. ASSBs are among the best next-generation candidates, provided that they achieve ultra-high-performances while meeting sustainability and safety. Among the shortcomings of solid electrolytes cells, the technical ones that currently limit the industrialization of ASSBs appear to be: (i) achieving a substantial ionic conductivity at ambient temperature; (ii) reducing the resistance at the interface between the active material and electrolyte [6,7]; (iii) eliminate the mechanical damage [8,9] and the dendritic growth from anodic lithium foils [10,11,12]. Experimental investigations are presently mainly focused on key materials and structures [13,14,15], such as composite electrolyte/electrode morphologies [16] or thin film glass layers [17].
Computational modeling and simulations, which operate at different scales and complement experimental research, allow a profound understanding of the interconnected physics that rule the response of ASSBs. Digital twins enable the comprehension of processes and the identification of limiting factors. Several advanced mathematical models have been documented in the literature. It is always hard, if not even impossible, to categorize the whole bibliography on a subject and undoubtedly identify those cornerstone papers that changed the flow of the subject itself. Perhaps Newman’s theory might be assigned without presumptions for the electrochemistry of batteries. As in several aspects of human beings, history is a succession of little advancements, in a collective way. In this spirit, we detail and compare here four different approaches [18,19,20,21] because of their significant ideas. Unlike previous studies [1,2,3,4], therefore, a broad screening of the existing literature is not the goal of this review.
Fabre et al. [18] developed a one-dimensional model of a Li/LiPON thin-film micro battery, described in Section 2.1. The ionic transfer is modeled via a single-ion conduction within the solid electrolyte. This results in a uniform distribution of lithium ions ( Li + ) throughout the solid electrolyte, with concentrations determined by the initial conditions and established by the overall electroneutrality in the electrolyte1. In single-ion conduction, the negative vacant positions in the lattice are tightly bound and do not flow. Since ionic mobility isn’t governed by a concentration gradient, the model’s main goal is to identify the potential drop, which is primarily determined by Ohm’s law.
An advanced model framework for ASSB was further proposed by Landstorfer and coworkers in [19] and will be analyzed in Section 2.2. While using a single-ion conduction ionic transport model as in [18], the authors enriched the formulation of the interface mechanisms. Standing from a rigorous thermodynamic setting, the interface conditions ultimately lead to non-Butler-Volmer type equations. Capacitance within interfaces was captured also in the third paper accounted for in this review, authored by Raijmakers and co-workers in [20]. Their key contribution lies in an innovative two-mechanisms conduction model, wherein both interstitial lithium and negative vacancies move autonomously. This results in establishing a concentration gradient at a steady state, resembling the distribution seen in liquid electrolytes [24,25].
The double mechanism in ionic transport has been further developed in the last contribution discussed here, authored by Cabras et al. [21]. Since the unbalanced negative charges associated with a vacancy in the LIPON lattice cannot flow, the model proposed in [20] appears to be unphysical. Rather Cabras et al. [21] assume that some positive ions hop to occupy neighboring empty vacancies, while the rest of the Li+ ions transition into a meta-stable interstitial phase of the same kind as described in [20]. The complex explanation of interfaces has also been incorporated from [20].
This review paper is organized as follows. A brief theoretical summary of models and their governing equations for ASSBs is proposed in Section 2. An experimental benchmark, taken from [26], is devised in Section 3. The finite element solution scheme provides numerical approximations for the electric potential profiles, interface currents, fluxes, and concentration profiles. These quantities of interest were used to compare the more recent model in [21] against the antecedent published in [20]. In the Section 4, the article provides an overview of the objectives pursued. It also outlines the future plans that are intended to be implemented. Final remarks that summarize the key points discussed conclude the paper.

2. Models and Their Governing Equations

Different mathematical models, some of which reviewed in [3,4], have been proposed and tailored to the battery microstructure, which simplistically can be categorized into two types, i.e., thin films and porous electrodes. A broad set of models that include pseudo-2-D [27,28], multiscale [29,30] and fine-grained models [31] have been designed for electrodes made of porous materials, accounting for the different phases and attempting at capturing realism either in liquid [32] or solid electrolytes [16]. We will restrict our focus on thin films batteries, equipped with Lithium phosphorous oxy-nitride “LiPON” electrolytes.
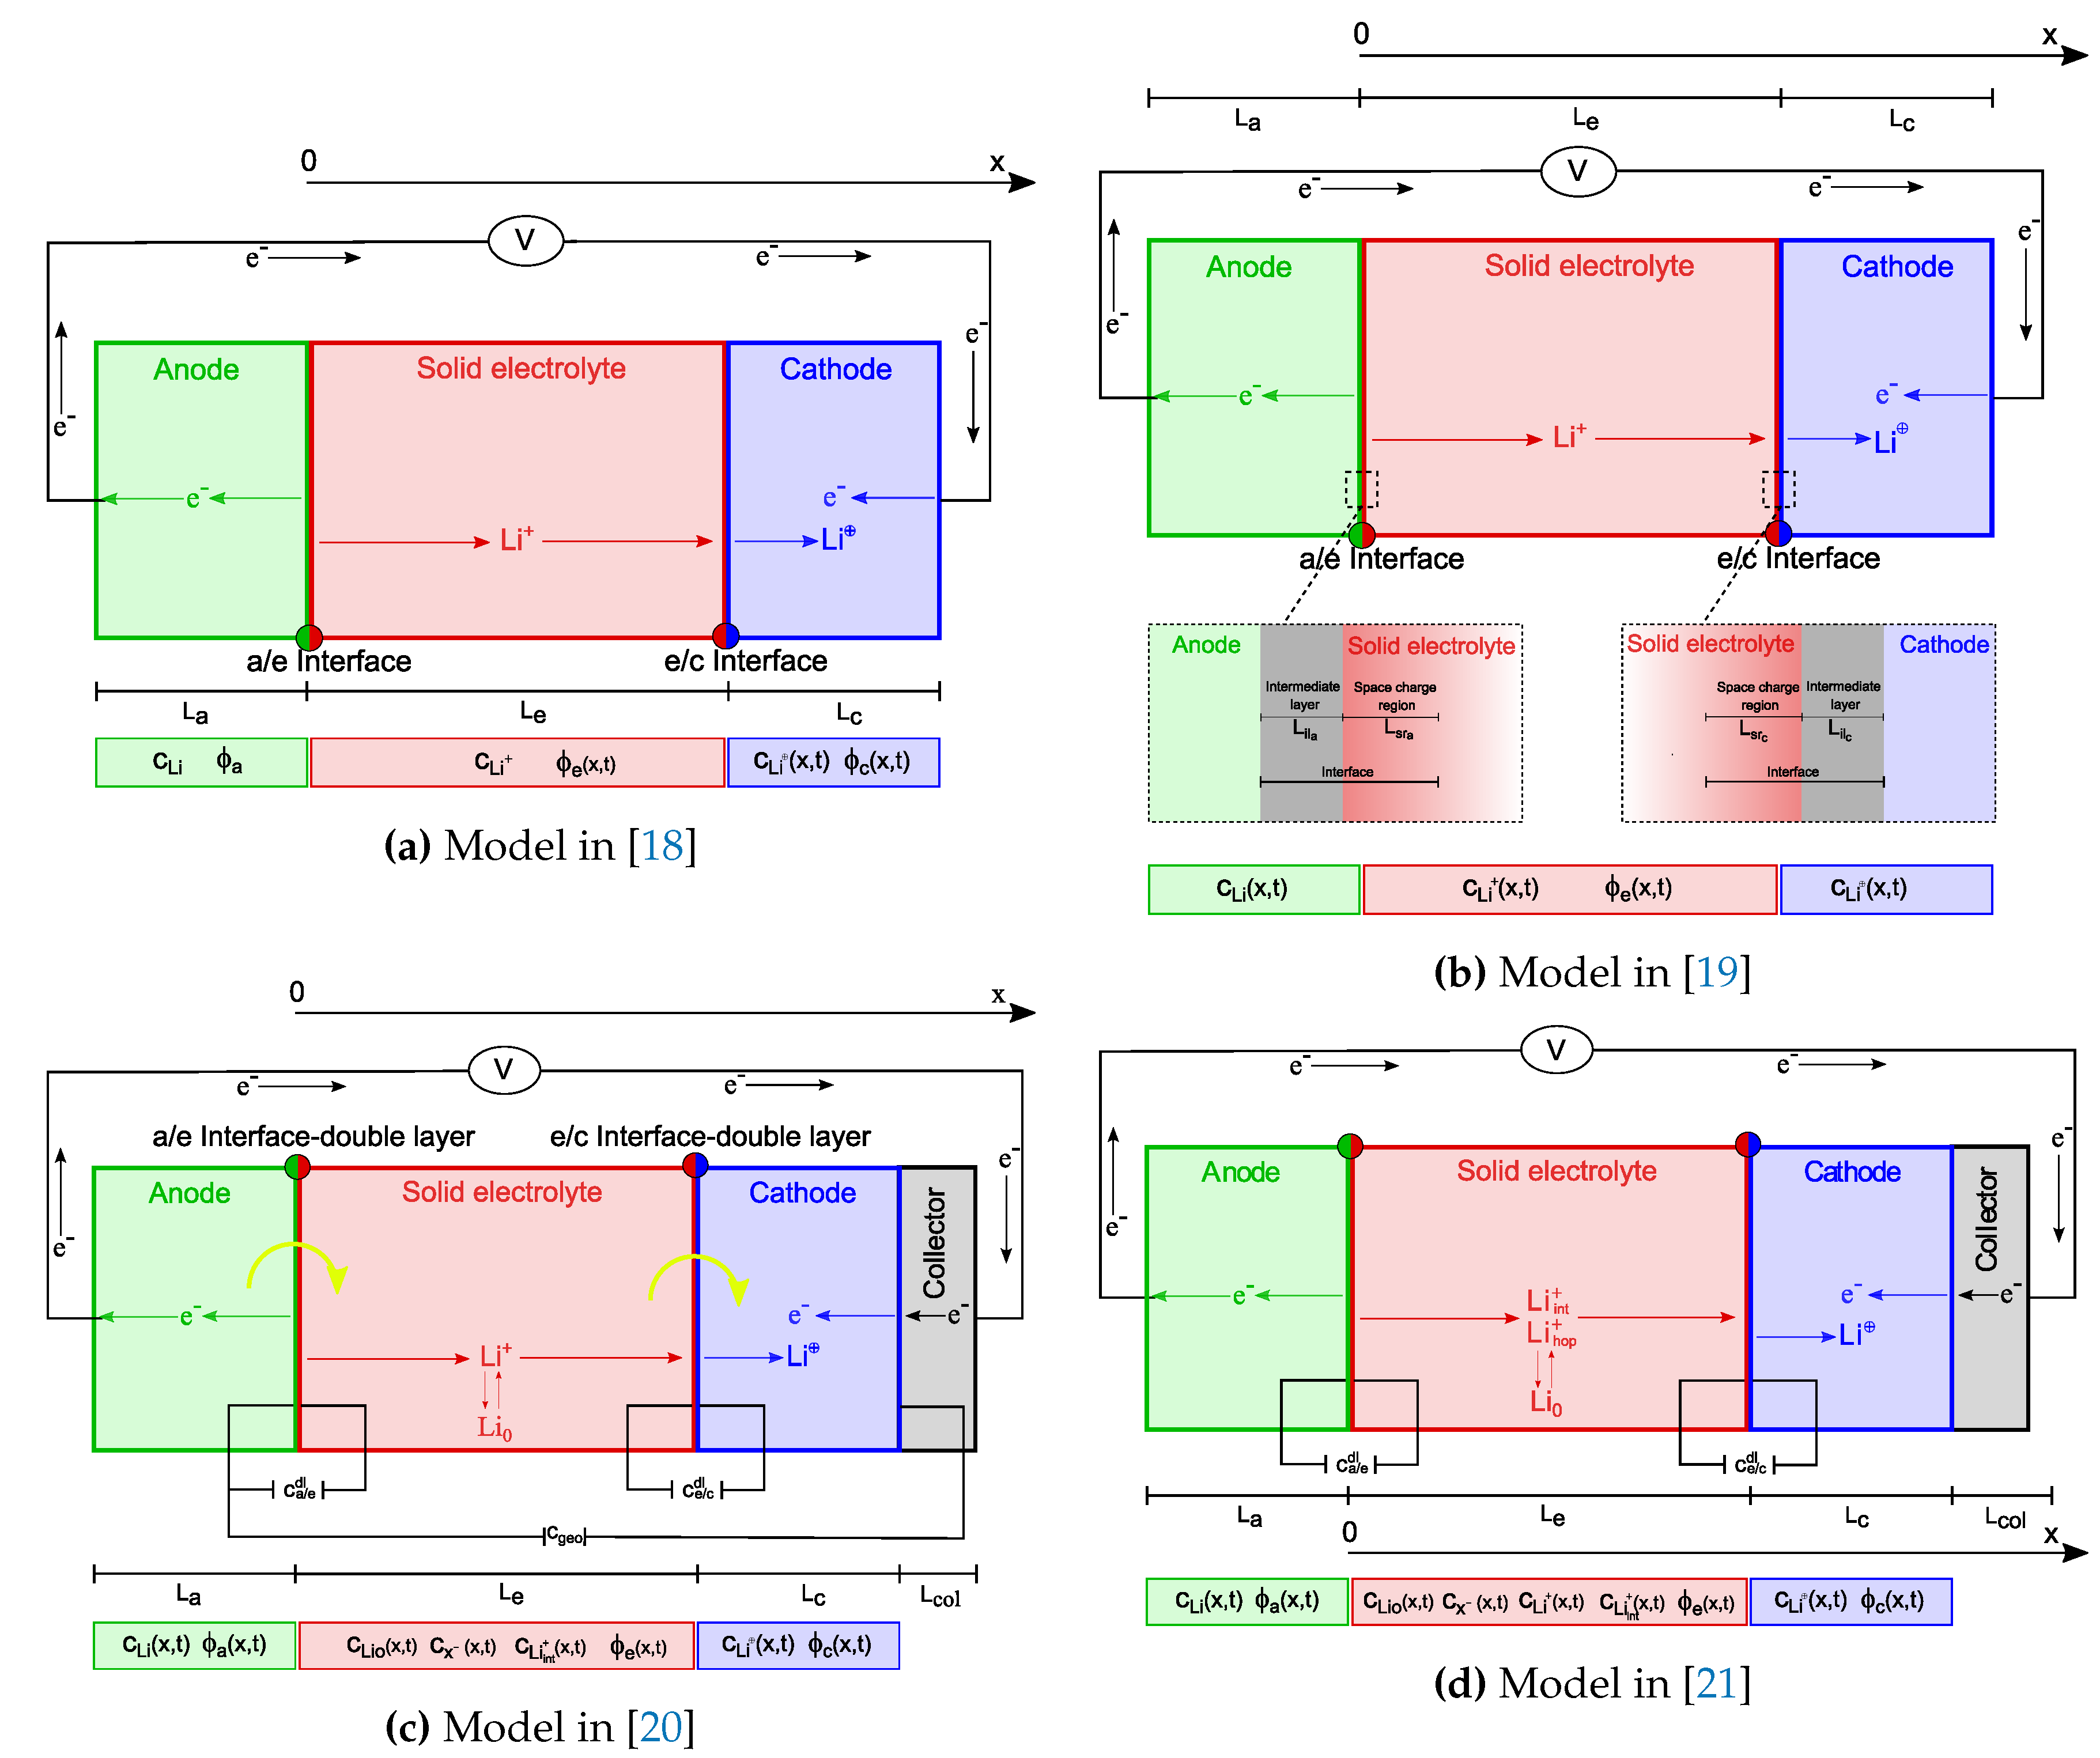
A planar geometry is generally accepted in thin films batteries, since the ratio between the lateral dimension and the thickness is large enough for the lateral dimension to be considered as infinite, see Figure 1. Since furthermore electrodes and electrolyte can be well approximated by homogeneous planar materials, one-dimensional mathematical models are customary formulations for thin films batteries.
An all-solid-state electrochemical cell incorporates two electrodes and a solid electrolyte, as depicted schematically in Figure 1. Li-ions are extracted from the cathode (positive electrode) during charge and inserted back during discharge. The opposite holds for the anode (negative electrode). Assuming LiCoO 2 (shortened in LCO) to be the positive electrode material, the basic electrochemical charge-transfer reaction writes
LiCoO 2 k 1 k 1 Li 1 x CoO 2 + x Li + + x e 0 x 1 2 .
If lithium foil serves as the negative electrode material, deposition and extraction at the negative surface is described by the reaction
Li k 2 k 2 Li + + e .
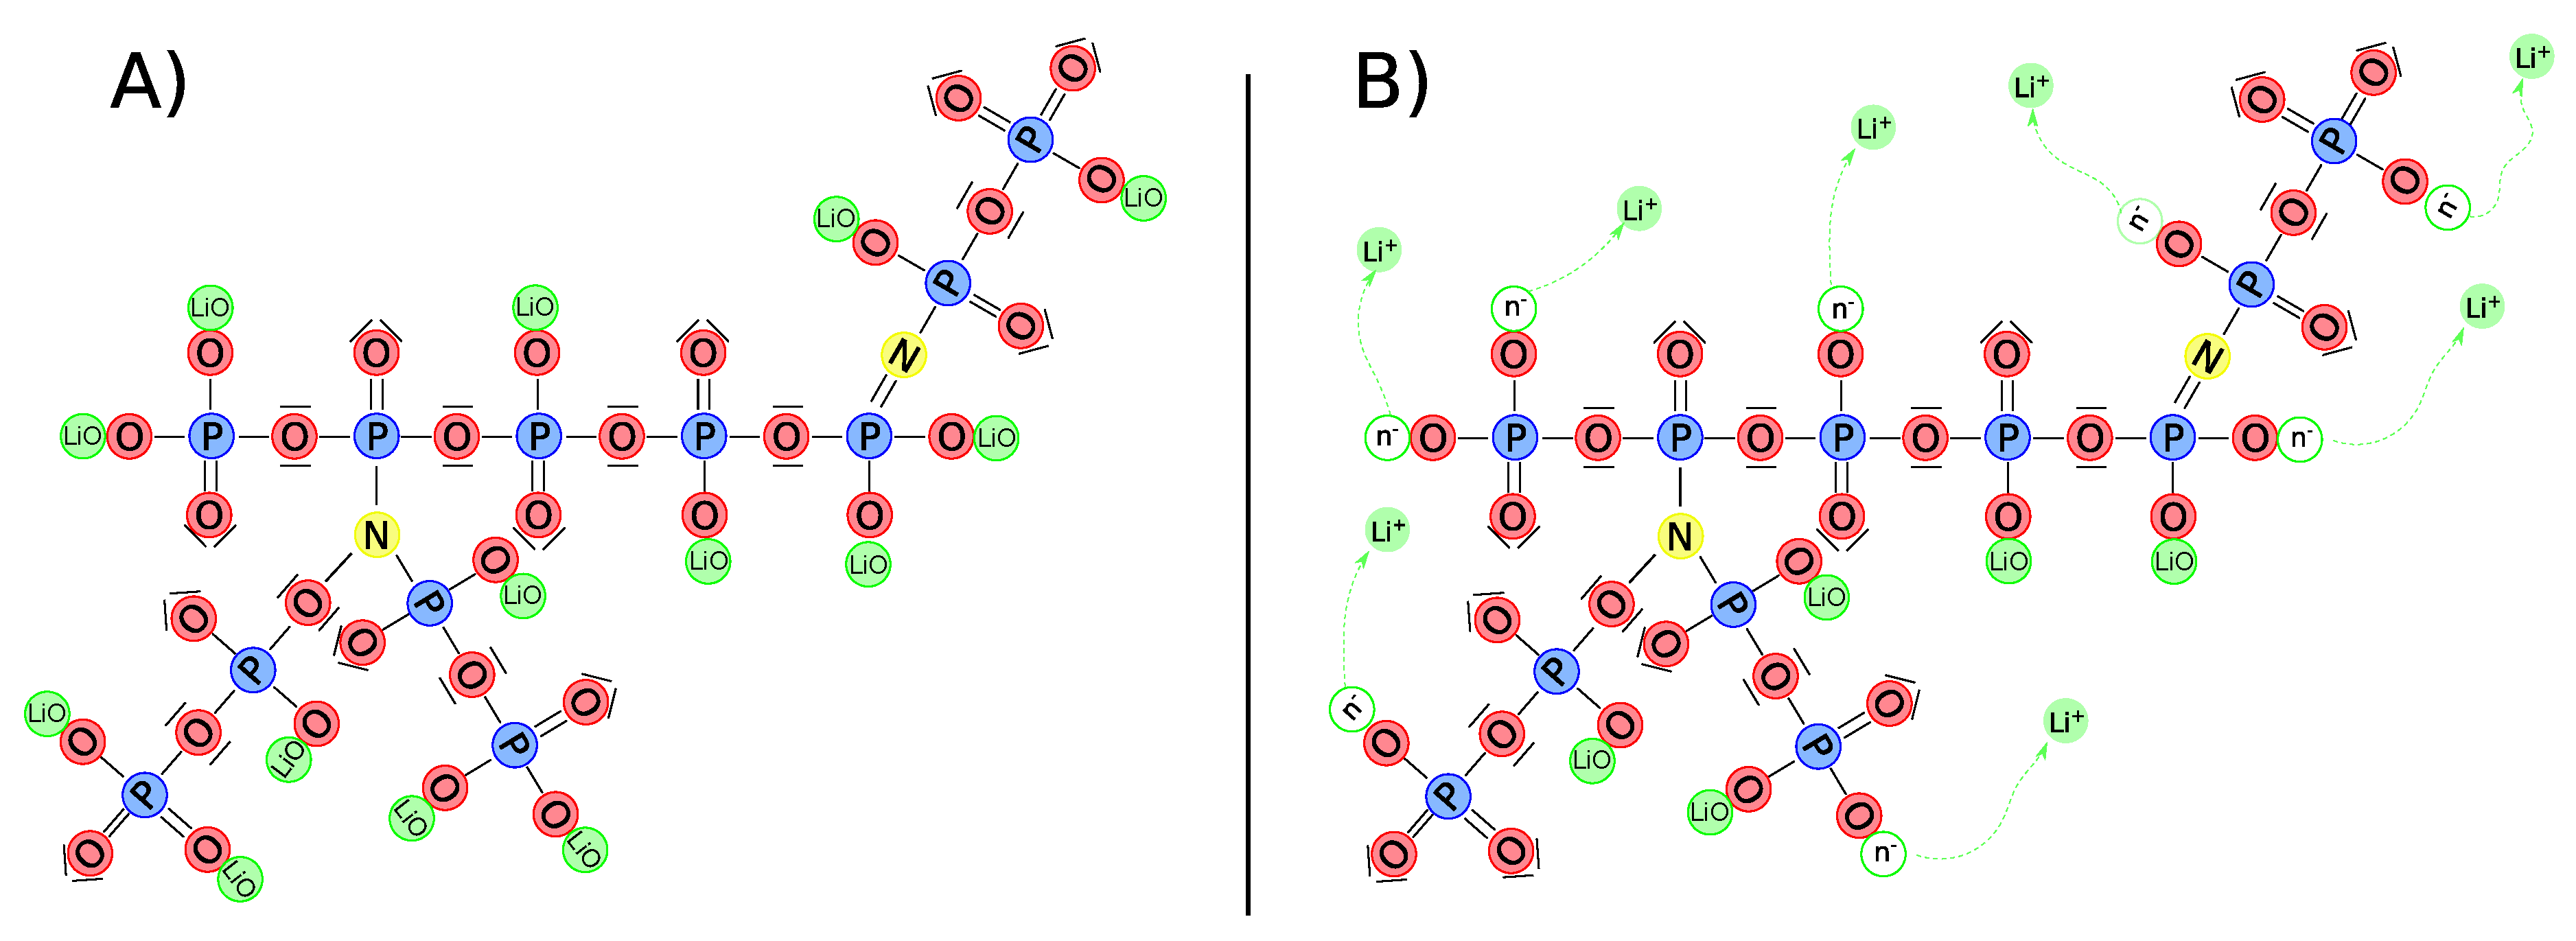
Figure 2 depicts the solid electrolyte’s structure. In it, LiO denotes the lithium bound to the non-bridging oxygen atoms, Li + has motion capabilities (either as transferred to the meta-stable interstitial state or hopping), and n is the uncompensated negative charge associated with a vacancy formed in the LiPON matrix at the place where lithium was originally located. The maximal concentration of host-sites, denoted with c 0 , is determined by the stoichiometric composition of the electrolyte material. It is reached in the ideal case of absolute zero temperature, when all available host sites are fully filled with lithium ions and the ionic conductivity vanishes because all ions are immobile. In standard conditions, some of the Li ions are thermally excited and the chemical ionization reaction
LiO k f ion k b ion Li + + n
occurs, k f ion and k b ion being the forward and backward rate constants for the ionization and recombination reaction, respectively.
During charge the lithium ions cross the electrolyte and are reduced into metallic Li at the lithium foil surface; vice-versa during discharge. Mobile species in the electrolyte are therefore ions and predicting the behavior of electrochemical cells requires quantitative modeling of the kinetics of mobile ionic species. LiCoO 2 electrode contains lithium oxide and the lithium exists as ions as part of a lithium salt. We can thus state that Li intercalates in the cathode as ions as well, which will be denoted with Li to stress its ionic nature “shielded” by its own electron, while distinguishing it from mobile charges Li + in the electrolyte.
In the following, we will overview four electrochemical models proposed in the literature, showcasing numerical results covering electric potential profiles, interfacial currents, fluxes and concentration profiles. In terms of notation, T will stand for the absolute temperature, F for Faraday’s constant, D | α for the diffusivity of species α ; symbol 1 denotes the identity matrix.

2.1. One-Dimensional Single-Ion Conduction Models [18]

A one-dimensional model of a Li/LiPON thin-film micro battery was developed by Fabre et al. [18] and is depicted schematically in Figure 1a. The x-axis, which points out the characteristic lengths of the model is directed from the negative towards the positive electrode; the interface between the negative electrode and the solid electrolyte hosts its origin.
Authors aimed at keeping their model as simple as possible, by introducing proper assumptions in order to come up with a reduced set of input parameters that can be measured from purposely designed experiments. The model is isothermal with no self-heating, neglects volume alterations during charge/discharge, and assumes that redox activities occur solely on the surface area, which remains unchanged throughout cycling. The negative electrode is a metallic film of lithium with negligible Ohmic losses. The ionic transfer in the solid electrolyte is described by a single ion conduction model: as such, the concentration of lithium ions across the solid electrolyte Li + is uniform. This property straightforwardly comes out as long as electro-neutrality approximation holds, a property of the governing equations largely discussed in [22,24,25].
Accordingly, the model traces lithium Li diffusion and electron e migration in the positive electrode, single ions Li + migration in the solid electrolyte, and charge-transfer kinetics at the electrode/electrolyte interfaces. Three unknown fields are required, the concentration of lithium in the positive electrode c Li ( x , t ) , the electric potentials ϕ e ( x , t ) and ϕ c ( x , t ) in the solid electrolyte and in cathode, respectively.
The electric potentials in the positive electrode ϕ c and in the solid electrolyte ϕ e are related to the current densities i c ( x , t ) and i e ( x , t ) by means of Ohm’s law, through the electrical k c and ionic k e conductivities, respectively:
i e ( x , t ) = k e ϕ e ( x , t ) 0 x L e ,
i c ( x , t ) = k c ϕ c ( x , t ) L e x L e + L c .
The third governing equation in the positive electrode is a planar solid-state diffusion equation, which describes the (neutral, in the sense detailed beforehand of shielded positive ion) transport of lithium Li in the electrode:
c Li ( x , t ) t = div D | Li c Li ( x , t ) L e x L e + L c ,
with diffusion coefficient D | Li . A concentration-dependent ionic diffusion coefficient was studied in [18], which resulted in more accurate outcomes.
Denoting with n the outward normal to the surface at boundary, the two boundary conditions required for Equation (4c) are the lithium flux density at the reaction surface and the zero-flux condition for lithium Li at the electrode/collector interface:
D | Li c Li ( x , t ) · n = i e / c ( t ) F x = L e ,
D | Li c Li ( x , t ) · n = 0 x = L e + L c .
Conditions for ϕ e and ϕ c , either at the anode-electrolyte ( a / e ) or at the electrolyte-cathode ( e / c ) interfaces
i e ( 0 , t ) · n = i a / e ( t ) , i e ( L e , t ) · n = i e / c ( t ) , i c ( L c , t ) · n = i e / c ( t )
are modeled via Butler-Volmer equations in Fabre et al. [18], in the form
i s ( t ) = i s 0 ( t ) e α F R T η ( t ) e ( 1 α ) F R T η ( t )
with s either a / e or e / c and α the so-called anodic (cathodic) charge transfer coefficient, usually both taken to be equal to 0.5 . The overpotential
η ( t ) = ϕ O C P
is the difference between the jump ϕ of the electric potential at the electrolyte/electrode interface (always defined as the electrode potential minus the electrolyte potential) and the open circuit potential (OCP) measured experimentally or calculated theoretically as in [33]. The exchange current i a / e 0 is given by:
i a / e 0 ( t ) = F k 2 k 2 c Li + s a t c Li + ( 0 , t ) α c Li + ( 0 , t ) 1 α ,
where k 2 and k 2 are the forward and backward reaction rate constants for the reaction (2), c Li + s a t is the saturation concentration of lithium in the electrolyte. The exchange current i e / c 0 is given by:
i e / c 0 ( t ) = F k 1 k 1 c Li + s a t c Li + ( 0 , t ) α c Li + ( 0 , t ) 1 α c Li s a t c Li ( 0 , t ) α c Li ( 0 , t ) 1 α ,
where k 1 and k 1 are the forward and backward reaction rate constants for the reaction (1) and c Li s a t represents the saturation lithium concentration within the cathode. Replacing c Li + ( 0 , t ) with the initial, uniform concentration of lithium in the electrolyte, the exchange current densities i a / e 0 ( t ) and i e / c 0 ( t ) simplify as
i a / e 0 ( t ) = F k a p p , i e / c 0 ( t ) = F k + a p p c Li s a t c Li ( 0 , t ) α c Li ( 0 , t ) 1 α .
where k a p p and k + a p p are apparent rate constant for negative electrode and defined as the multiplication of the terms in Eqs. (9) and (10).
Galvanostatic boundary conditions are eventually imposed,
i c ( L e + L c , t ) · n = i b a t ( t ) ,
where i b a t is the given galvanostatic current flowing across the 1D battery. The potential is set arbitrarily to ϕ e ( 0 , t ) = 0 .

2.2. An Advanced Framework for Solid Electrolyte Intercalation Batteries [19]

Landstorfer and coworkers studied in [19] a non-porous electrode and a crystalline solid electrolyte. As in [18], they assumed a solid electrolyte with one mobile species ( Li + ) and a uniform concentration of vacancies c n that remains unaltered in time. The model entails a novel view of the electrode/solid electrolyte interface, which consists of an intermediate layer and a space charge region within the electrolyte. A visual representation of the model is given in Figure 1b.
Once ions randomly intercalate in the lattice structure of graphite or LiCoO 2 , a simple Fickian law diffusion analogous to Eq. (4c) accounts for ionic transport. The electric potential ϕ c is considered to be uniform within the electrodes, neglecting the ohmic loss (depicted in [18] via Eq. (4b)), while ϕ e influences the ionic transport in the electrolyte, ruled by non-equilibrium thermodynamics. The mass balance law relates the concentration of lithium c Li + ( x , t ) to the actual flux of cations h Li + ( x , t )
c Li + ( x , t ) t = div h Li + ( x , t ) 0 x L e .
Using the standard linear relationship of Onsager type2
h Li + ( x , t ) = M ( x , t ) μ ¯ Li + ( x , t ) 0 x L e ,
between the flux h Li + and the gradient of the electrochemical potential μ ¯ Li + , the Clausis-Duhem inequality is satisfied a priori and thermodynamics consistency is granted, as largely discussed in [24,25]. The chemical potential is the functional derivative of the Gibbs free energy (or Helmholtz free energy according to [24,25]) with respect to the ionic concentration c Li + ( x , t ) . The splitting of chemical and electrical potentials used in [19] is classical, as it is the free energy of mobile guest atoms interacting with a host medium, described by a regular solution model [36,37]. The electrochemical potential was eventually derived as the sum of the chemical and electrostatic potential as follows,
μ ¯ Li + ( x , t ) = μ Li + ( x , t ) + F ϕ e ( x , t ) 0 x L e ,
μ Li + ( x , t ) = μ Li + 0 + R T ln θ Li + ( x , t ) 1 θ Li + ( x , t ) + R T χ | 1 2 θ Li + ( x , t ) 0 x L e ,
with3  θ Li + = c Li + / c Li + s a t . The mass flux to be inserted into the mass balance law (13) eventually holds:
h Li + ( x , t ) = 2 χ | θ Li + 1 1 θ Li + D | Li + c Li + D | Li + F R T c Li + ϕ e 0 x L e .
The classical Nernst-Planck flux4
h α ( x , t ) = D | α c α ( x , t ) z α F R T D | α c α ( x , t ) ϕ e ( x , t ) ,
is attained if the dilute limit is assumed 1 θ Li + 1 and the energy of interaction vanishes χ | = 0 .
The whole electrolyte is thought as consisting of a space charge region and a bulk region, as shown in Figure 1b. In the bulk region electroneutrality is imposed a priori, c Li + is defined by the (given and uniform) concentration of vacancies, and Ohm’s law (4a) allows recovering the electric potential. On the contrary, in proximity of the interfaces, where the concentrations of cations and anions differ, the electric potential is obtained by Gauss law, which provides, after constitutive prescriptions, the following Poisson equations:
2 ϕ e ( x , t ) = F ε r ε 0 ( c Li + ( x , t ) c Li ) 0 x L s r a ,
2 ϕ e ( x , t ) = F ε r ε 0 ( c Li + ( x , t ) c Li ) L e L s r c x L e ,
where ε r denotes the relative permittivity of the electrolyte and ε 0 the vacuum permittivity. Local electroneutrality is not enforced in the space charge region [19], rather a weak (i.e. global) electroneutrality is prescribed in the whole electrolyte
F V ( c Li + ( x , t ) c n ) d V = 0 , F V ( c Li + ( x , t ) c n ) d V = 0 ,
thus allowing local deviations between cation and anion concentrations while keeping the overall amount of cations and anions equal.
The interface between the electrodes and the solid electrolyte has been modelled as consisting of two intermediate layers, treated as plate capacitors in terms of potential jumps and flux continuity. Authors borrowed from [42] the constitutive equation for potential jumps (defined as the potential at an electrode minus the one at the electrolyte) as
ϕ a n o d e = ε a C a ϕ e ( 0 , t ) · n , ϕ c a t h o d e = ε c C c ϕ e ( L e , t ) · n ,
with given surface capacitances C a , C c and permittivities ε a , ε c .
Boundary conditions on fluxes at electrode - solid electrolyte interfaces resemble Butler-Volmer equations (7) in a form originally presented in [43] and named generalized Frumkin-Butler-Volmer equations. They read:
h Li + ( 0 , t ) · n = k ˜ 2 e G 1 β F ( ϕ a ϕ e ( 0 , t ) ) R T c Li ( 0 , t ) + k ˜ 2 e G 1 ( 1 β ) F ( ϕ a ϕ e ( 0 , t ) R T c Li + ( 0 , t ) ,
h Li + ( L e , t ) · n = k ˜ 1 e G 2 β F ( ϕ c ϕ e ( L e , t ) ) R T c Li ( L e , t ) + k ˜ 1 e G 2 ( 1 β ) F ( ϕ c ϕ e ( L e , t ) R T c Li + ( L e , t ) ,
where the reaction rate constants defined in reactions (1) and (2) are taken of Arrhenius type, i.e., k n = k ˜ n e E n / R T , n = 1 , 2 . The Gibbs energies of activation G n are further parameters of the model and relate to the OCP in Butler-Volmer equations.

2.3. An Advanced All-Solid-State Li-Ion Battery Model [20]

More complex one-dimensional mathematical models have been proposed in a series of publications from Notten’s group [26,44,45] for a micro-battery L i / L i P O N / L i C o O 2 . In these studies, ionic transport in the solid electrolyte involves the ionization reaction (3) of immobile, oxygen-bound lithium LiO to mobile Li + ions and negatively charged vacancies. Charge-transfer kinetics at both electrode/electrolyte interfaces, diffusion and migration of mobile lithium ions in the electrolyte ( Li + ) and positive electrode ( Li ) were accounted for. In their most recent work, [20], additional features have been introduced, such as mixed ionic/electronic conductivity in the positive electrode, electrical double layers occurring at both electrode/electrolyte interfaces representing the space-charge separation phenomena that differ from [19], variable ionic and electronic diffusion coefficients that depend on the lithium concentration inside the positive electrode.
Figure 1c displays a discharge process. The anode consists of a lithium Li foil, the cathode of a LiCoO 2 film, while LiPON is used as the electrolyte material. The current collector is tied from the top of the LiCoO 2 . As for [18] and [19], also this model is isothermal (no self-heating) and redox processes only occur at the interfaces between the electrolyte and the electrode layers; volume changes of the electrolyte during cycling are neglected and the active surface area does not change over cycling.
As a distinctive feature of this class of models, the ionic transfer in the solid electrolyte is not described by a single ion conduction model and the concentration of lithium ions through the solid electrolyte is generally not uniform even though electro-neutrality approximation holds. Denoting with c Li + the concentration of mobile Li + ions, with c LiO the concentration of immobile lithium, with c n the concentration of uncompensated negative charges, and with δ the fraction of Li at equilibrium, the equilibrium concentration of the charge carriers is c Li + e q = c n e q = δ c 0 and the concentration of the remaining immobile lithium is c LiO e q = ( 1 δ ) c 0 . The overall rate of the charge carrier generation according to reaction (3) is
w ( 3 ) = k f ion c LiO k b ion c Li + c n .
The ratio
K eq ion = k f ion / k b ion
is the equilibrium constant of reaction (3) and is related to the the fraction of Li at equilibrium δ , see [20]. In addition to earlier models, two electrical double layer capacitances C a / e d l and C e / c d l and a geometric capacitance C g e o were introduced in [20]. As in [19], double layer capacitances attempt at capturing the response of the space-charge very narrow layers as for electric capacitors. Whereas the concept resembles [19], the implementation is different. Capacitors in [19] are described “in series”, whereas in [20] “in parallel” (compare Figures 1b and 1c). In view of this assumption, the current at electrode/electrolyte interfaces splits into two terms, the faradaic contribution that drives the reduction/oxidation charge-transfer reactions (1)-(2) ( i s c t ) and the non-faradaic contribution that feeds the double layer ( i s d l ), with s either a / e or e / c .
During charging, the Li + ions released from the positive surface must cross the solid electrolyte and are reduced into metallic Li at anode. Electrons, generated by the charge-transfer reactions (1) and (2), flow across the Li foils and the electronic collector, with potential drops that follow Ohm’s law similar to Eq. (4a). Transport of ionic concentrations5  c Li + and c n  in the solid electrolyte is ruled by the mass continuity equation (13), properly extended as
c Li + ( x , t ) t = div h Li + ( x , t ) + w ( 3 ) ( x , t ) 0 x L e ,
c n ( x , t ) t = div h n ( x , t ) + w ( 3 ) ( x , t ) 0 x L e ,
in order to account for the reaction rate w ( 3 ) (see Eq. (23)). The generic mass flux h α , with α = Li + , n , is constitutively described by the Nernst-Planck law (18), which carries the electric potential as a further unknown field. Coupling with an additional relation is thus mandatory, to model the migration process. The most common selection for such an additional relation in battery modeling is the electro-neutrality condition
c Li + ( x , t ) = c n ( x , t ) .
By substituting eq. (18) into eq. (25) and subtracting eq.(25a) from eq.(25b), two independent partial differential equations eventually arise:
c Li + ( x , t ) t = div D | Li + c Li + ( x , t ) + F D | Li + R T c Li + ( x , t ) ϕ e ( x , t ) + w ( 3 ) ( x , t )
div ( D | n D | Li + ) c Li + ( x , t ) div ( D | n + D | Li + ) F R T c Li + ( x , t ) ϕ e ( x , t ) = 0 .
To be solved they require the initial concentrations for c Li +
c Li + ( x , 0 ) = c Li + e q = δ c 0
and the Neumann conditions on fluxes at the left and right boundaries of the electrolyte
h Li + ( 0 , t ) · n = i a / e c t ( t ) + i a / e d l ( t ) F , h Li + ( L e , t ) · n = i e / c c t ( t ) + i e / c d l ( t ) F .
In the positive electrode a mixed ionic/electronic conductivity is considered. The mass balance equations that characterize the transport of Li ions and electrons e are similar to Eqs. (25) for the solid electrolyte and write
c Li ( x , t ) t = div h Li ( x , t ) L e x L e + L c ,
c e ( x , t ) t = div h e ( x , t ) L e x L e + L c .
The generic mass flux h α , α = { Li , e } is constitutively described by the Nernst-Planck law (18). This choice of independent motion of electrons and ionic intercalated lithium makes the governing equations different from Fabre’s [18] equations ((4c) to be compared with (30a)).
Additionally, the model from [20] makes the positive electrode’s diffusion coefficients dependent on the concentration of ions. Experimental results show that the local electrochemical environment has a major impact on solid-state diffusion. The model further exploits the electro-neutrality approximation inside the cathode, implying c Li ( x , t ) = c e ( x , t ) , and a space-time proportionality of the diffusion coefficients for Li and e . Classical mathematical passages allow to retrieve Eq. (4c) as the single PDE required to model the mass transport in the electrode, provided that the diffusivity D | Li is replaced by a suitable combination of electron and ionic diffusivities.
The initial concentration of the charge carrier at t = 0 , when no concentration profile developed yet, is equal to its equilibrium concentration
c Li ( x , 0 ) = c Li e q
Neglecting the impact of geometric capacitance, the Neumann boundary conditions related to fluxes at both the left and right boundaries of the electrolyte result in:
h Li ( L e , t ) · n = i e / c c t ( t ) + i e / c d l ( t ) F
h Li ( L e + L c , t ) · n = 0
h e ( L e , t ) · n = 0
h e ( L e + L c , t ) · n = i b a t ( t ) F
with i b a t ( t ) the given galvanostatic current flowing across the 1D battery, defined in Equation (12).
The non-faradaic current (dis)charging the electrical double layers i α d l ( t ) , can be defined in derivative form as
i α d l ( t ) = C α d l ϕ t ,
where the jump ϕ of the electric potential at the electrolyte/electrode interface is always defined as the electrode potential minus the electrolyte potential and α = a / e , e / c . Equation (33) shall be compared with (21) in [19].
The faradaic current proposed in [20] emanates from charge transfer kinetics, in a form that extends Butler-Volmer equation (7) to the mass transfer-influenced conditions [46]. The expression of i a / e c t at the metallic lithium electrode interface reads
i a / e c t = i a / e 0 c Li ( 0 , t ) c ¯ Li exp α a F R T η a ( t ) c Li + ( 0 , t ) c ¯ Li + exp ( 1 α a ) F R T η a ( t ) ,
where c ¯ Li + is the average bulk concentration of species Li + , c ¯ L i is the bulk activity of the metallic Li, α a is the charge transfer coefficient for reaction eq. (2), η a is the overpotential (8) of the charge transfer reaction at the negative electrode, and the exchange current i a / e 0 is given by:
i a / e 0 = F k 2 ( c ¯ Li + ) α a ( c ¯ Li ) 1 α a ,
with k 2 the standard rate constant for reaction eq. (2) . The expression of i e / c at the positive electrode interface is given by the Butler-Volmer equation (7), with the exchange current density
i e / c 0 = F k 1 c Li s a t 1 c ¯ Li c L i s a t α c c ¯ Li c L i s a t 1 α c c ¯ Li + α c ,
with k 1 the standard rate constant for reaction eq.(1). The reader may refer to [20] for further details on these equations and on the geometric capacitance.

2.4. Two-Mechanisms Model for All-Solid-State Lithium-Ion Batteries

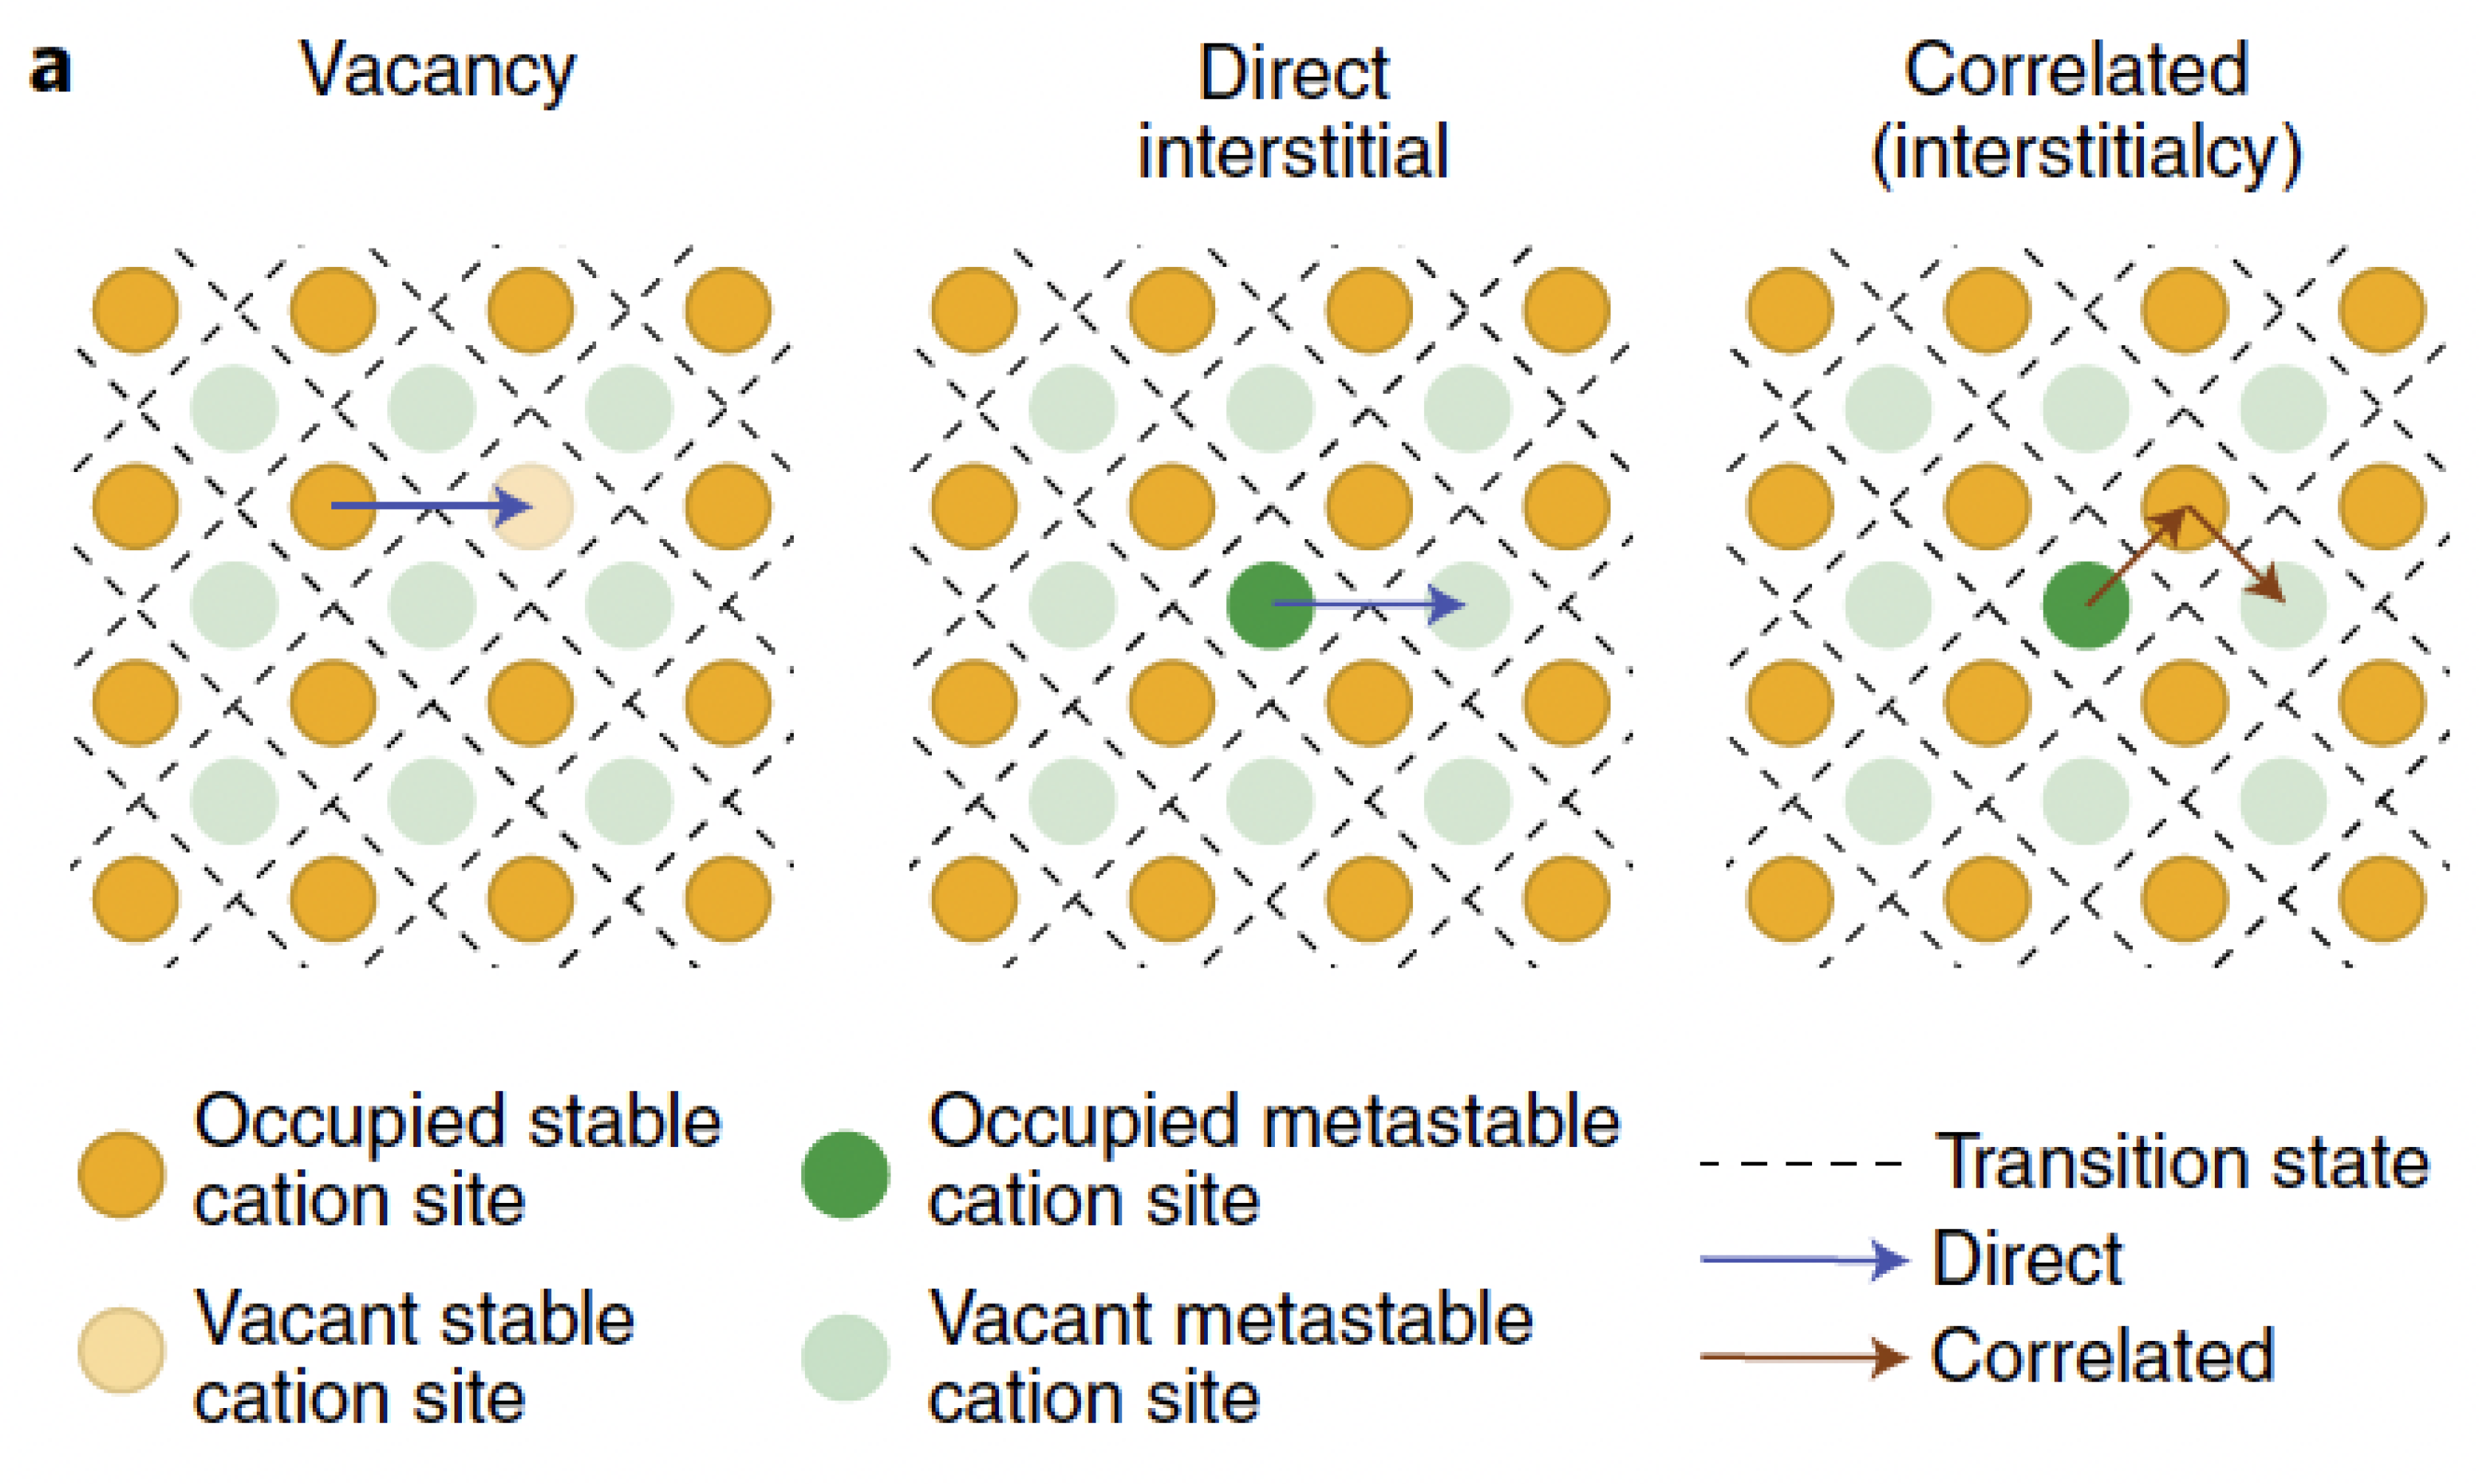
A model that accounts for two mechanisms of ionic conduction was recently published in [21]. Rooted in the thermo-mechanics of continua, the model builds upon the work of Raijmakers et al. [20] to enhance the description of vacancy replenishment in a LIPON solid electrolyte and applies to LLZO as well [47] according to Figure 3. The equations that depict ionic transfer in [21] are multi-scale compatible, too. This feature seems to be particularly pertinent for composite cathodes, as indicated in [16].
As eloquently detailed in [20], some of the Li ions in a solid electrolyte are thermally excited at standard conditions. The chemical ionization reaction (3) occurs, leaving behind uncompensated negative charges associated to a vacancy in the LIPON matrix at the place formerly occupied by lithium. Raijmakers et al. have depicted vacancies motion with the same conceptual formalism used for negative ions in liquid electrolytes, i.e., as able to move in the solid matter driven by an entropic Brownian motion together with migration within an electric field (see eq. (25b)). This picture is thermodynamically encapsulated in the constitutive law (18).
In [21,48] the dynamic filling of vacancies by neighboring positions has been explicitly modeled. To capture this process some ions, denoted henceforth with Li int + , move in a meta-stable interstitial state after the chemical ionization reaction (3) occurs, whereas the remaining Li + ions hop and fill neighboring vacancies. This dynamic behavior is described by a further reaction
Li + k f int k b int Li int + ,
where k f int and k b int are the rate constants for reaction (35). When k f int = 0 , no interstitial mechanism is accounted for and the model restricts to a classical single ion conducting solid electrolyte [18].
In a nutshell, reaction (3) makes lithium ions capable to leave the host-sites and move within the complex amorphous LIPON structure, either by filling neighboring vacancies or to flow interstitially. The proportion of ions in these two mechanisms is governed by reaction (35). In this formalism, positive ions are the only moving species, whereby the concentration of negatively charged vacancies is the outcome of the motion process and do not possess any intrinsic motility. In this sense, there is no direct flow h n ( x , t ) of negative charges, contrary to eq. (25b), and the local concentration of vacancies is altered merely by the chemical ionization reaction eq. (35).
This conceptual picture frames into the following set of mass balance equations, which characterize the immobile lithium LiO , the negative charges n , the transport of the lithium ions Li int + that go interstitial and the remaining Li + that hop:
c LiO t = w ( 3 ) 0 x L e ,
c n t = w ( 3 ) 0 x L e ,
c Li + t + div h Li + = w ( 3 ) w ( 35 ) 0 x L e ,
c Li int + t + div h Li int + = w ( 35 ) 0 x L e .
having set
w ( 35 ) = k f int c Li + k b int c Li int +
according to reaction (35). The ratio
K eq int = k f int / k b int
is the equilibrium constant of reaction (35). The set of 4 mass balance equations (36a)-(36d) contains 5 unknowns, the concentrations c LiO , c n , c Li + , and c Li int + plus the electric potential ϕ , which is constitutively related to the mass fluxes h α . The additional required equation is Ampère’s law (with Maxwell’s correction) 6. To conclude the set of balance equations, the usual balance of forces in small strains was accounted for in [48]
div σ + b = 0 .
The chemo-thermo-elastic strain ε is considered to be made up of two separate contributions: an elastic recoverable part after unloading ε e l and a swelling contribution due to the insertion of species in the host material ε s :
ε = ε e l + ε s .
The swelling contribution ( α = Li + , Li int + )
ε s = α ω α c α c α 0 1
is assumed to be volumetric and proportional to the deviation c α c α 0 from the reference concentration c α 0 by means of the chemical expansion coefficients ω α of species α . They equal one third of the partial molar volumes at a given temperature.
To derive governing equations from the balance Eqs. (36), constitutive laws have been derived from a rigorous thermodynamic setting. The hopping mechanism is thermodynamically quite different from the interstitial motion. Therefore, making recourse to the same thermodynamic description for both mechanisms might be questionable. Aware of this limitation and inspired by [49,50,51] restricted to small strains, elaborating the electromagnetic contribution in the Helmholtz free energy ψ from [24,25], the chemical potential (16b) of species α = Li + , Li int + is extended to
μ α = μ α 0 + R T ln [ θ α 1 θ α ] + R T χ | 1 2 θ α + ψ e l c α ,
as detailed in [34,35]. A simple choice for the elastic part of the free energy density ψ e l in the small strain range is the usual quadratic form
ψ e l ( ε , c α ) = 1 2 K ( c α ) tr ε ε s 2 + G ( c α ) | | dev ε ε s | | 2 ,
where K, G are the bulk and shear modulus respectively and they are made dependent on species concentrations. The stress tensor σ e ( ε , c α ) descends from thermodynamic restrictions (see [34] for details and extension to temperature dependency)
σ e = ψ e l ε = 2 G dev ε + K tr | | ε s | | 1 .
Note that the derivative ψ e l / c α , in eq. (39) is the sum of two contributions
ψ e l c α = ω α tr σ e + 1 2 K c α tr ε ε s 2 + G c α | | dev ε ε s | | 2 .
The first emanates from the swelling part of the strain, and is present even if the material properties are independent on concentration of species. Nernst-Planck equation (18) is extended as follows
h α ( x , t ) = D | α 1 2 χ | θ α ( 1 θ α ) c α ( x , t ) 3 M ( c α ) K ω α 3 ω α c α tr ε D | α F R T c α ( x , t ) ϕ e ( x , t ) ,
with α = Li + , Li int + . The mobility tensor reads ( θ α = c α / c α s a t )
M ( c α ) = D | α R T c α s a t θ α 1 θ α 1 ,
It accounts for saturation and in this differs from Eq. (14). The energetic and entropic contributions in the constitutive law (43) have been already described in eq. (17). The mechanical contribution to the mass flux is driven by the chemical expansion coefficient, and derives from thermodynamic consistency.
Mass balance equations, after inserting (43) into eqs. (36c)-(36d), do not form a complete set, because ionic transport entails movement of mass as well as of charge. In order to build a multiscale compatible theory, the generally accepted electroneutrality assumption cannot be taken, since it prevents to impose the conservation of energy across the scales: this concept has been illustrated with great detail in [24,29] and will not be elaborated here further. Multiscale compatibility is granted by using Ampere’s law (with Maxwell’s correction in the realm of small strains)
div ε grad ϕ e t + F h Li + + h Li int + = 0 0 x L e .
When multiscale is not invoked, the electroneutrality assumption
c Li + ( x , t ) + c Li int + ( x , t ) = c n ( x , t ) .
can be called for.
A widespread choice for the initial conditions for concentrations and electric potential enforces equilibrium conditions. They hold
ϕ e ( x , 0 ) = 0 ,
c LiO ( x , 0 ) = c LiO e q = ( 1 δ ) c 0 ,
c n ( x , 0 ) = c n e q = δ c 0 ,
c Li + ( x , 0 ) = c Li + e q = δ c 0 1 + K eq int = K eq ion 1 δ 1 ,
c Li int + ( x , 0 ) = c Li int + e q = K eq int δ c 0 1 + K eq int = δ c 0 + K eq ion 1 1 δ .
Three independet factors influence the equilibrium concentrations within the system: c 0 and the equilibrium constants for reactions (3) and (35). While c 0 can be determined with precision, estimating K eq ion and K eq int through experiments is fraught with substantial uncertainties. These three parameters are interrelated and play a role in defining the fraction of lithium existing in a mobile state at equilibrium, which is referred to as δ , as detailed in reference [20]. δ holds,
δ = 2 1 + 1 + 4 c 0 K eq ion 1 1 + K eq int 1 .
Equation (49) can be readily transformed to express K eq int in terms of both δ and K eq ion as follows,
K eq int = c 0 δ 2 + ( 1 δ ) K eq ion ( δ 1 ) K eq ion .
Interface conditions for this advanced model are eqs. (29), accounting for identity (33) for the non-faradaic current contribution. The faradaic current emanates from charge transfer kinetics, as proposed in [20]. In view of the splitting of lithium flux in interstitial and hopping, constitutively specified by eq. (43), faradaic interface conditions split, too:
i a / e c t = i a / e c t Li + + i a / e c t Li int + , i e / c c t = i e / c c t Li + + i e / c c t Li int +
with the interstitial and hopping contributions to charge transfer current clearly identified. They can be inferred from Butler-Volmer eqs. (7) or (34). The exchange current read:
i a / e 0 Li + = F k 2 ( c ¯ Li + ) α ( c ¯ Li ) 1 α , i e / c 0 Li + = F k 1 c Li s a t 1 c ¯ Li c Li s a t α c ¯ Li c Li s a t 1 α ( c ¯ Li + ) α
i a / e 0 Li int + = i a / e 0 Li + c ¯ Li int + c ¯ Li + α , i e / c 0 Li int + = i e / c 0 Li + c ¯ Li int + c ¯ Li + α .
where c ¯ Li + , c ¯ Li + int are average bulk concentrations of species Li + and Li + int , respectively. Note that, differently from [20], those averages are not time independent. Lacking more clear understanding, we assume that the non faradaic current i α d l ( t ) as in eq. (33) is proportional to the faradaic splitting, i.e.
i s d l = i s d l Li + + i s d l Li int + , with i s d l Li + = i s c t Li + i s c t c s d l ϕ t and i s d l Li int + = i s c t Li int + i s c t c s d l ϕ t .
where the jump ϕ of the electric potential at the electrolyte/electrode interface is always defined as the electrode potential minus the electrolyte potential and s = a / e , e / c . The Neumann conditions on fluxes at the left and right boundaries of the electrolyte eventually read:
h Li + ( 0 , t ) · n = ( i a / e c t Li + + i a / e d l Li + ) / F , h Li + ( L e , t ) · n = ( i e / c c t Li + + i e / c d l Li + ) / F ,
h Li int + ( 0 , t ) · n = ( i a / e c t Li int + + i a / e d l Li int + ) / F , h Li int + ( L e , t ) · n = ( i e / c c t Li int + + i e / c d l Li int + ) / F .
Continuity of displacements and normal tractions are interface conditions for the mechanical governing equation (36f). The electrodes governing equations and boundary conditions do not differ from Section 2.3.

3. Benchmark Comparison

The two models illustrated in Section 2.3 and Section 2.4 are validated against the experimental outcomes described in [26]. That paper also provides values of material and geometrical parameters, which are collected in Table 1.
The positive electrode is a layer of LiCoO 2 with thickness L c = 0.32 μ m , deposited on a platinum substrate. A Lithium metal foil with thickness L a = 0.50 μ m is used as negative electrode. The solid electrolyte is a one-micron-thick ( L e = 1.00 μ m ) layer of LiPON. The surface area of the deposited electrodes is A = 10 4 m 2 and the theoretical storage capacity of the battery is 10 5 Ah .
The electrochemical cell is subject to a galvanostatic process of discharge at different C r a t e s , under a temperature-controlled condition of 25 o C . The current corresponding to C r a t e = j is denoted with I j C . For C r a t e = 1 , I 1 C amounts at 10 5 A . Initial and boundary conditions are made compatible with thermodynamic equilibrium at t = 0 , tuning the density current i b a t ( t ) in time as:
i b a t ( t ) = ( 1 e t ) I j C A ,
with t in seconds. In view of Eq. (54), the concentrations of ions across all battery components are uniform and at equilibrium at t = 0 since no profiles have established yet. By enforcing the fraction of mobile lithium in the electrolyte δ = 0.18 and a maximum concentration of lithium host sites in the electrolyte c 0 = 6.01 · 10 4 mol / m 3 , eq. (47) provides
c Li ( x , 0 ) = 7.60 · 10 4 mol / m 3 L a x 0 ,
c LiO ( x , 0 ) = 4.93 · 10 4 mol / m 3 0 x L e ,
c n ( x , 0 ) = 1.08 · 10 4 mol / m 3 0 x L e ,
c Li + ( x , 0 ) = 5.68 · 10 3 mol / m 3 0 x L e ,
c Li int + ( x , 0 ) = 5.12 · 10 3 mol / m 3 0 x L e ,
c Li ( x , 0 ) = c Li eq = 1.20 · 10 4 mol / m 3 L e x L e + L c .
The electric potential at the interface between the anode and the solid electrolyte is fixed as:
ϕ ( 0 , t ) = 0 [ V ] t .
All material parameters used in the simulation are listed in Table 1. The equilibrium constants read
K eq ion = 1.125 · 10 5 0.90 · 10 8 = 1250 , K eq int = 8.10 · 10 9 0.90 · 10 8 = 0.9 .
for this benchmark comparison.
The governing equations are numerically solved with the finite element method, with in house implementation of weak forms in the commercial numerical software Matlab. The geometry and the unknown fields (see Figures 1c, 1d) are discretized with 61 linear elements; 1 element is sufficient for the anode, since the lithium concentration is uniform ad the electric potential is linear; the outcomes refer to a tessellation of 40 finite elements covering the electrolyte and 20 panels that discretize the cathode. In both cases, the mesh is refined near the electrode/electrolyte interface. The time marching is dealt with the backward Euler method, with fixed time increments of Δ t = 1.0 s .
The open circuit potential (OCP) used in the simulations has been reconstructed with splines stemming from experimental evidences in [26]. OCP could have been calculated analytically following the approach in [33]. Results, obtained with the analitically OCP, are reported in Appendix A.
The simulations account for a broad range of rates, from 1.0 to 51.2 . The corresponding experimental discharging curves have been plot with dots in Figure 4b as a function of time, continuous lines correspond to simulations. Measurements and simulations agree well across the wide range of investigated C r a t e s . Obviously, the extracted charge decreases with increasing C r a t e due to the higher over-potentials. In fact lower discharge rates implies a lower rate of lithium insertion in the cathode and a more uniform Li distribution in the positive electrode.
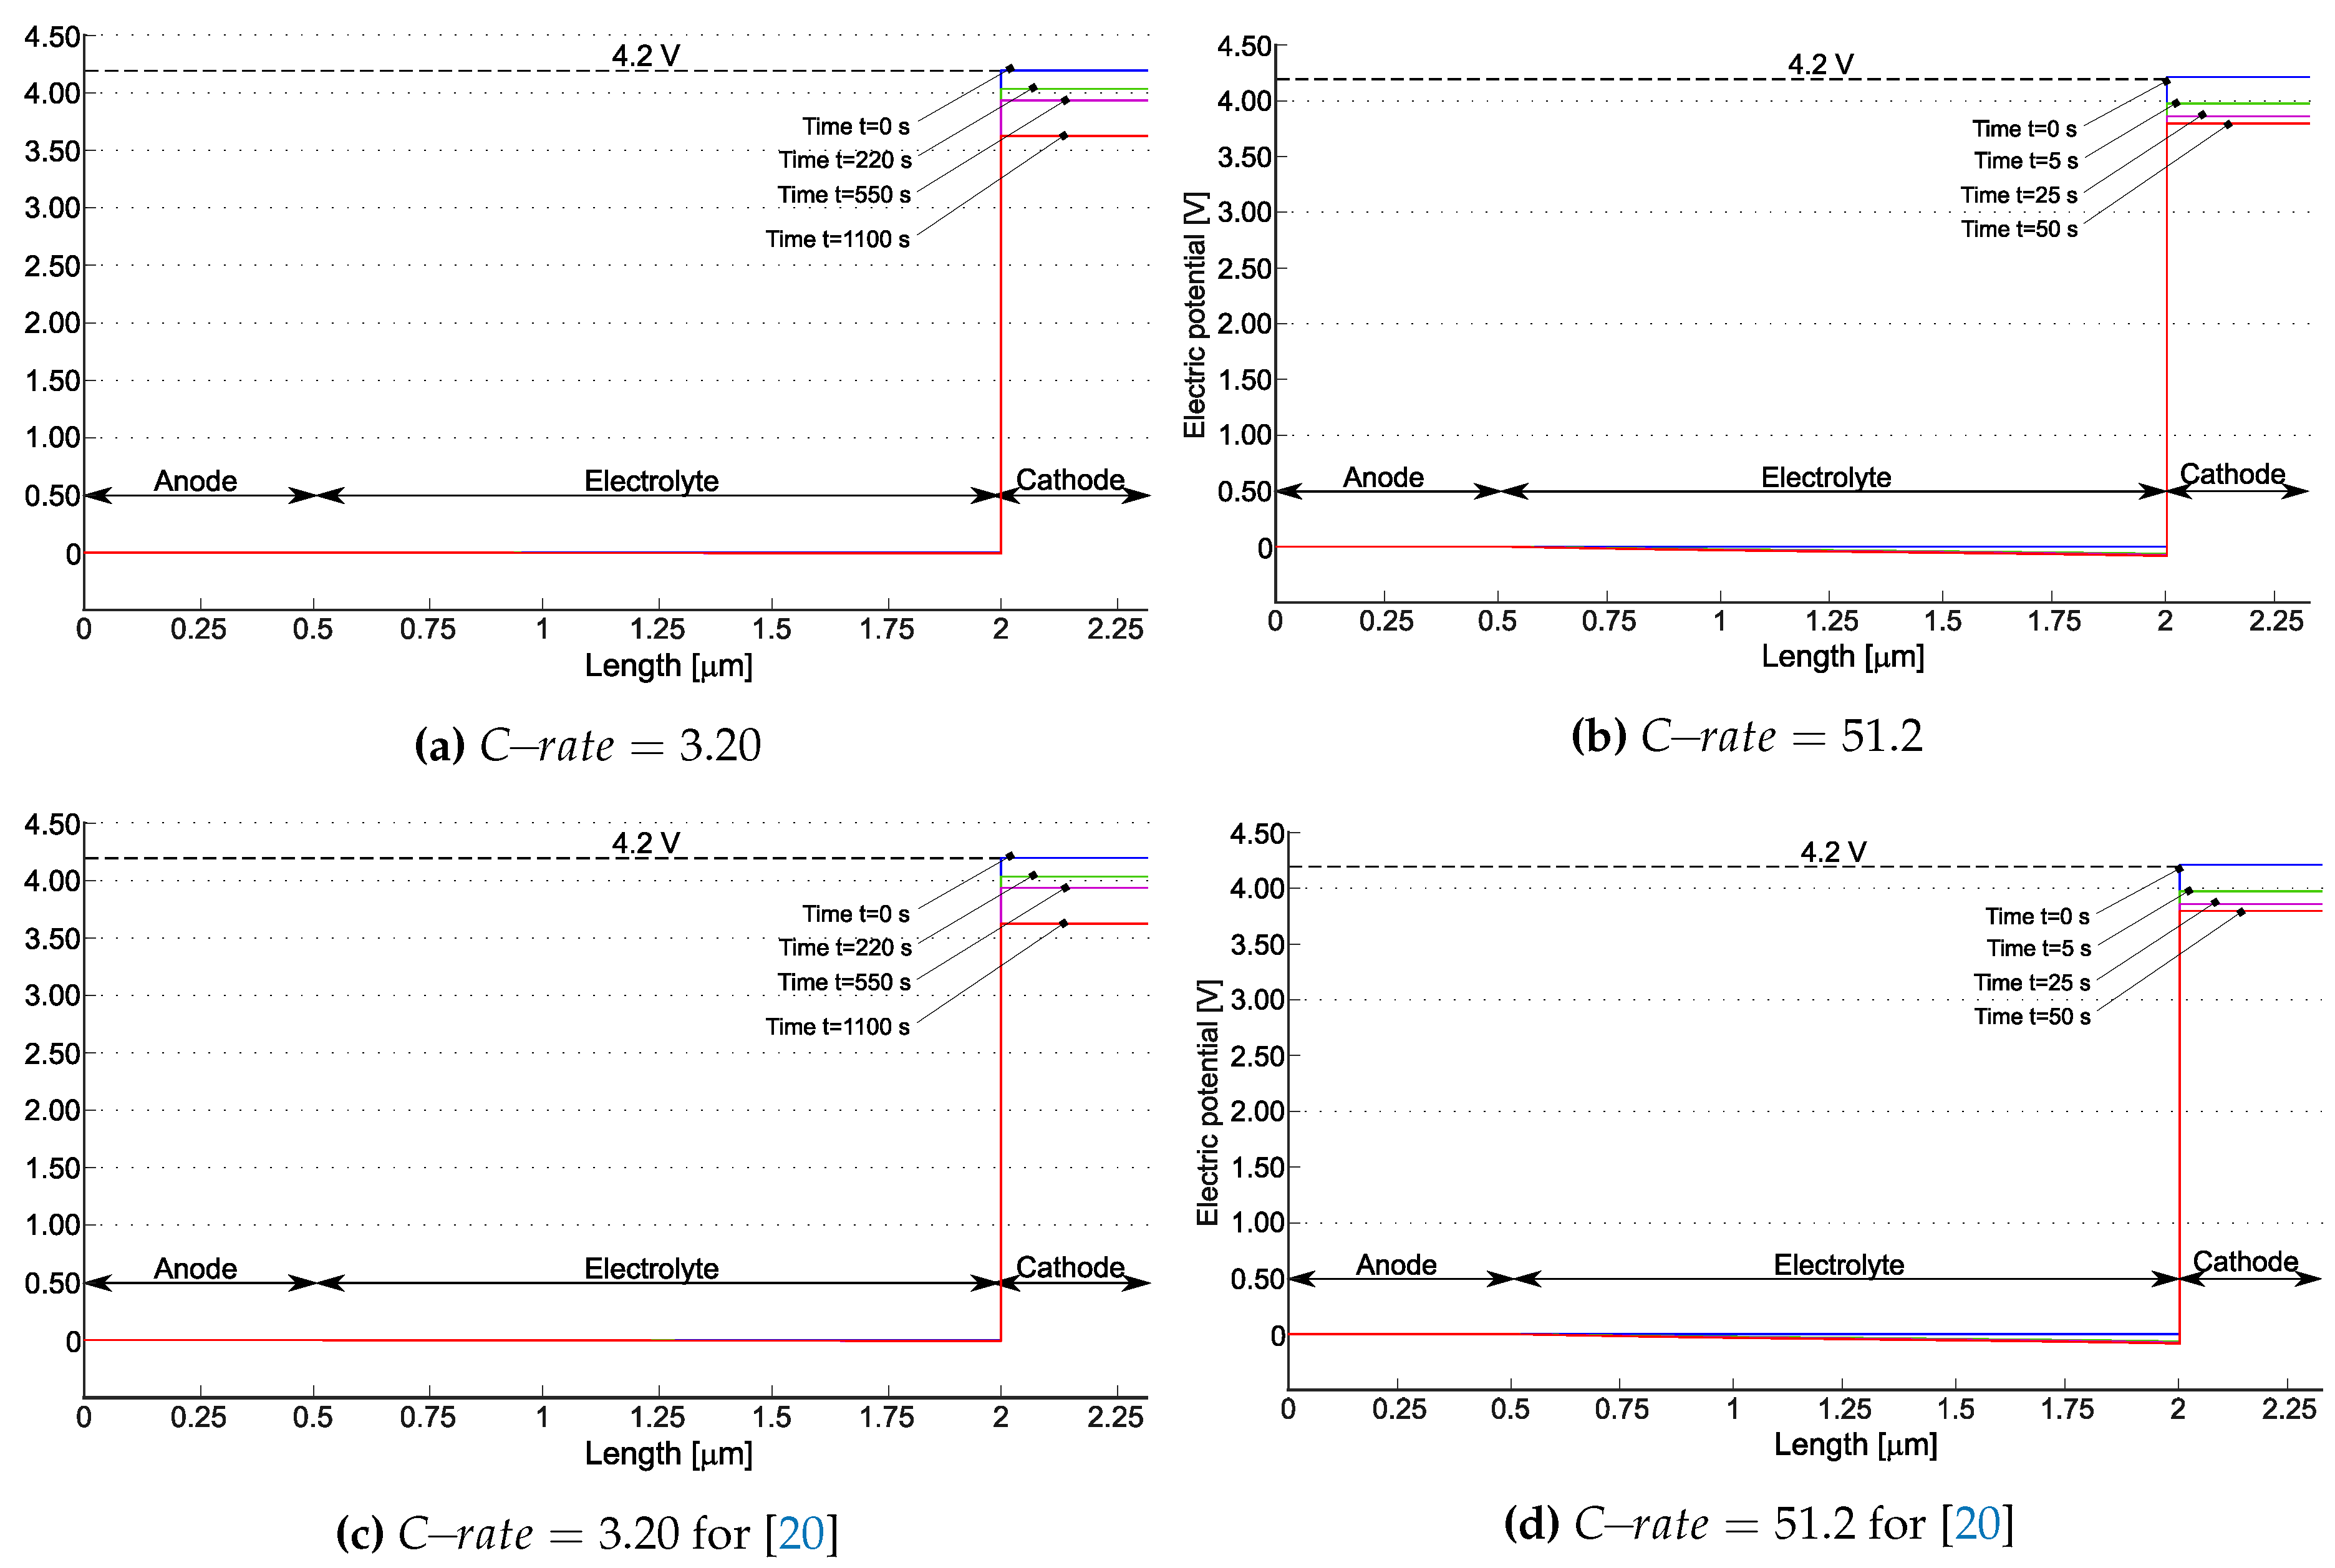
Figure 5 depicts the electric potential ϕ ( x ) profile in the battery at different times for two different discharge rates, i.e. C r a t e = 3.20 (which theoretically allows to discharge the battery in 1125 s ) and C r a t e = 51.2 (for which the battery in principle completes the discharge process in 70 s ). Simulations quit when the concentration of lithium Li inside the cathode reaches the saturation limit c Li s a t , after 1085 s and 50 s respectively. Cathodic saturation is indeed the limit factor for the battery operation (see also [52] for an extensive discussion on limiting factors in electrochemical cells, induced by materials and architectures).
At the initial time the electric potential discontinuity at the interfaces make Butler-Volmer currents vanishing. Based on the measured battery OCP, at full charge state Δ ϕ = 4.2 V , as highlighted in Figure 5. During the discharge, the potential drops in the anode and in the electrolyte. However, the major changes in the potential profile occur at interface between electrolyte and cathode: the battery voltage decreases significantly during discharge as depicted in Figure 5a,b and it results almost uniform within the cathode. A similar behavior is observed for the model in [20] ( see Figure 5c,d).
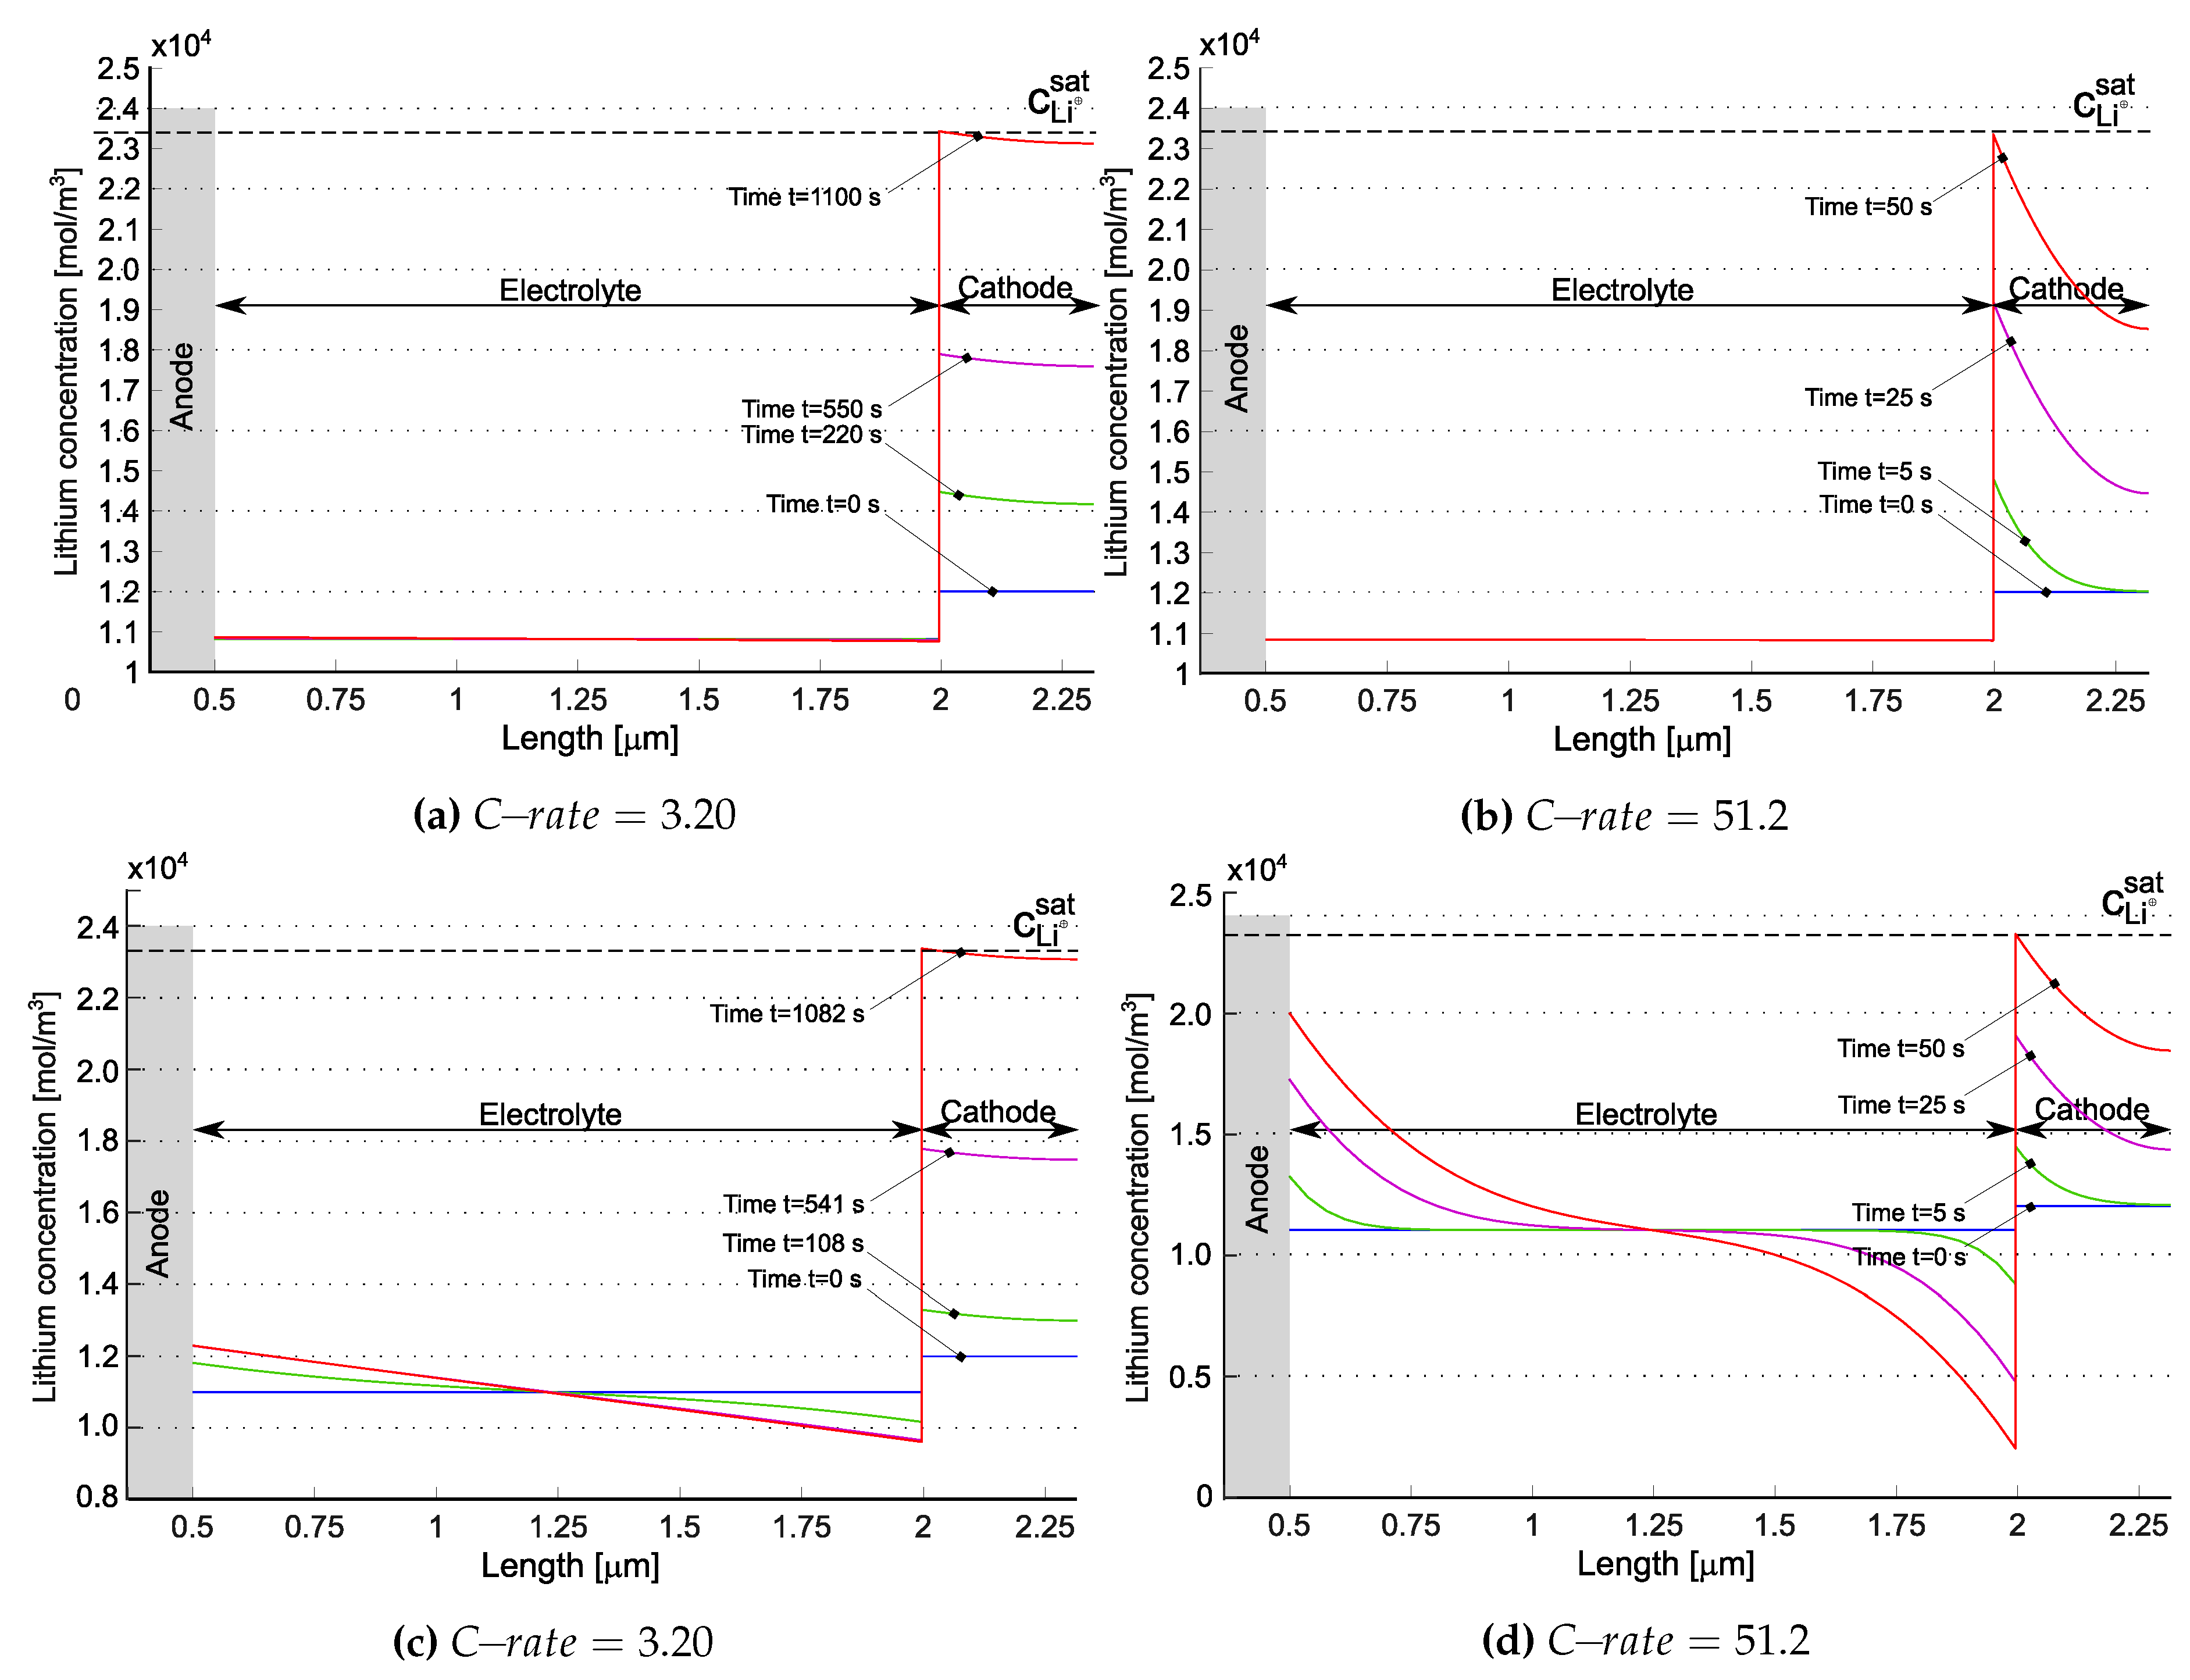
Figure 6 depicts the evolution of lithium concentration c Li ( x ) in the cathode and in the solid electrolyte for the model in [21] ((a) and (b)) as well as for the one proposed in [20] ((c) and (d)). Since two ionic concentrations are concurrently present in the electrolyte, only their sum ( c Li + + c Li int + ) has been plotted in Figure 6a,b.
The anode, made of a metallic foil of lithium, is unaffected by the lithiation/delithiation processes and considered as an unlimited reservoir of lithium. The lithium ions intercalate inside the cathode and accumulates near at the electrolyte/cathode interface. The discharge process ends when the lithium in the cathode reaches its saturation limit c Li s a t = 23400 mol m 3 . Saturation at the interface electrolyte/cathode is thus the limiting factor for the performance of this battery.
The concentration of ( c Li + + c Li int + ) in [20], initially uniform, increases near the anode interface, while decreasing at the cathode interface. This “liquid electrolyte” kind of behavior is justified since in [20] negative charges are allowed to move. In the formulation proposed in [21] negative charges are filled by hopping lithium, which in turn is allowed to intercalate. The time evolution of negative charges and total lithium is driven by the ionization reaction rates w ( 3 ) and w ( 35 ) , as already discussed, and is very small in Figure 6a,b.
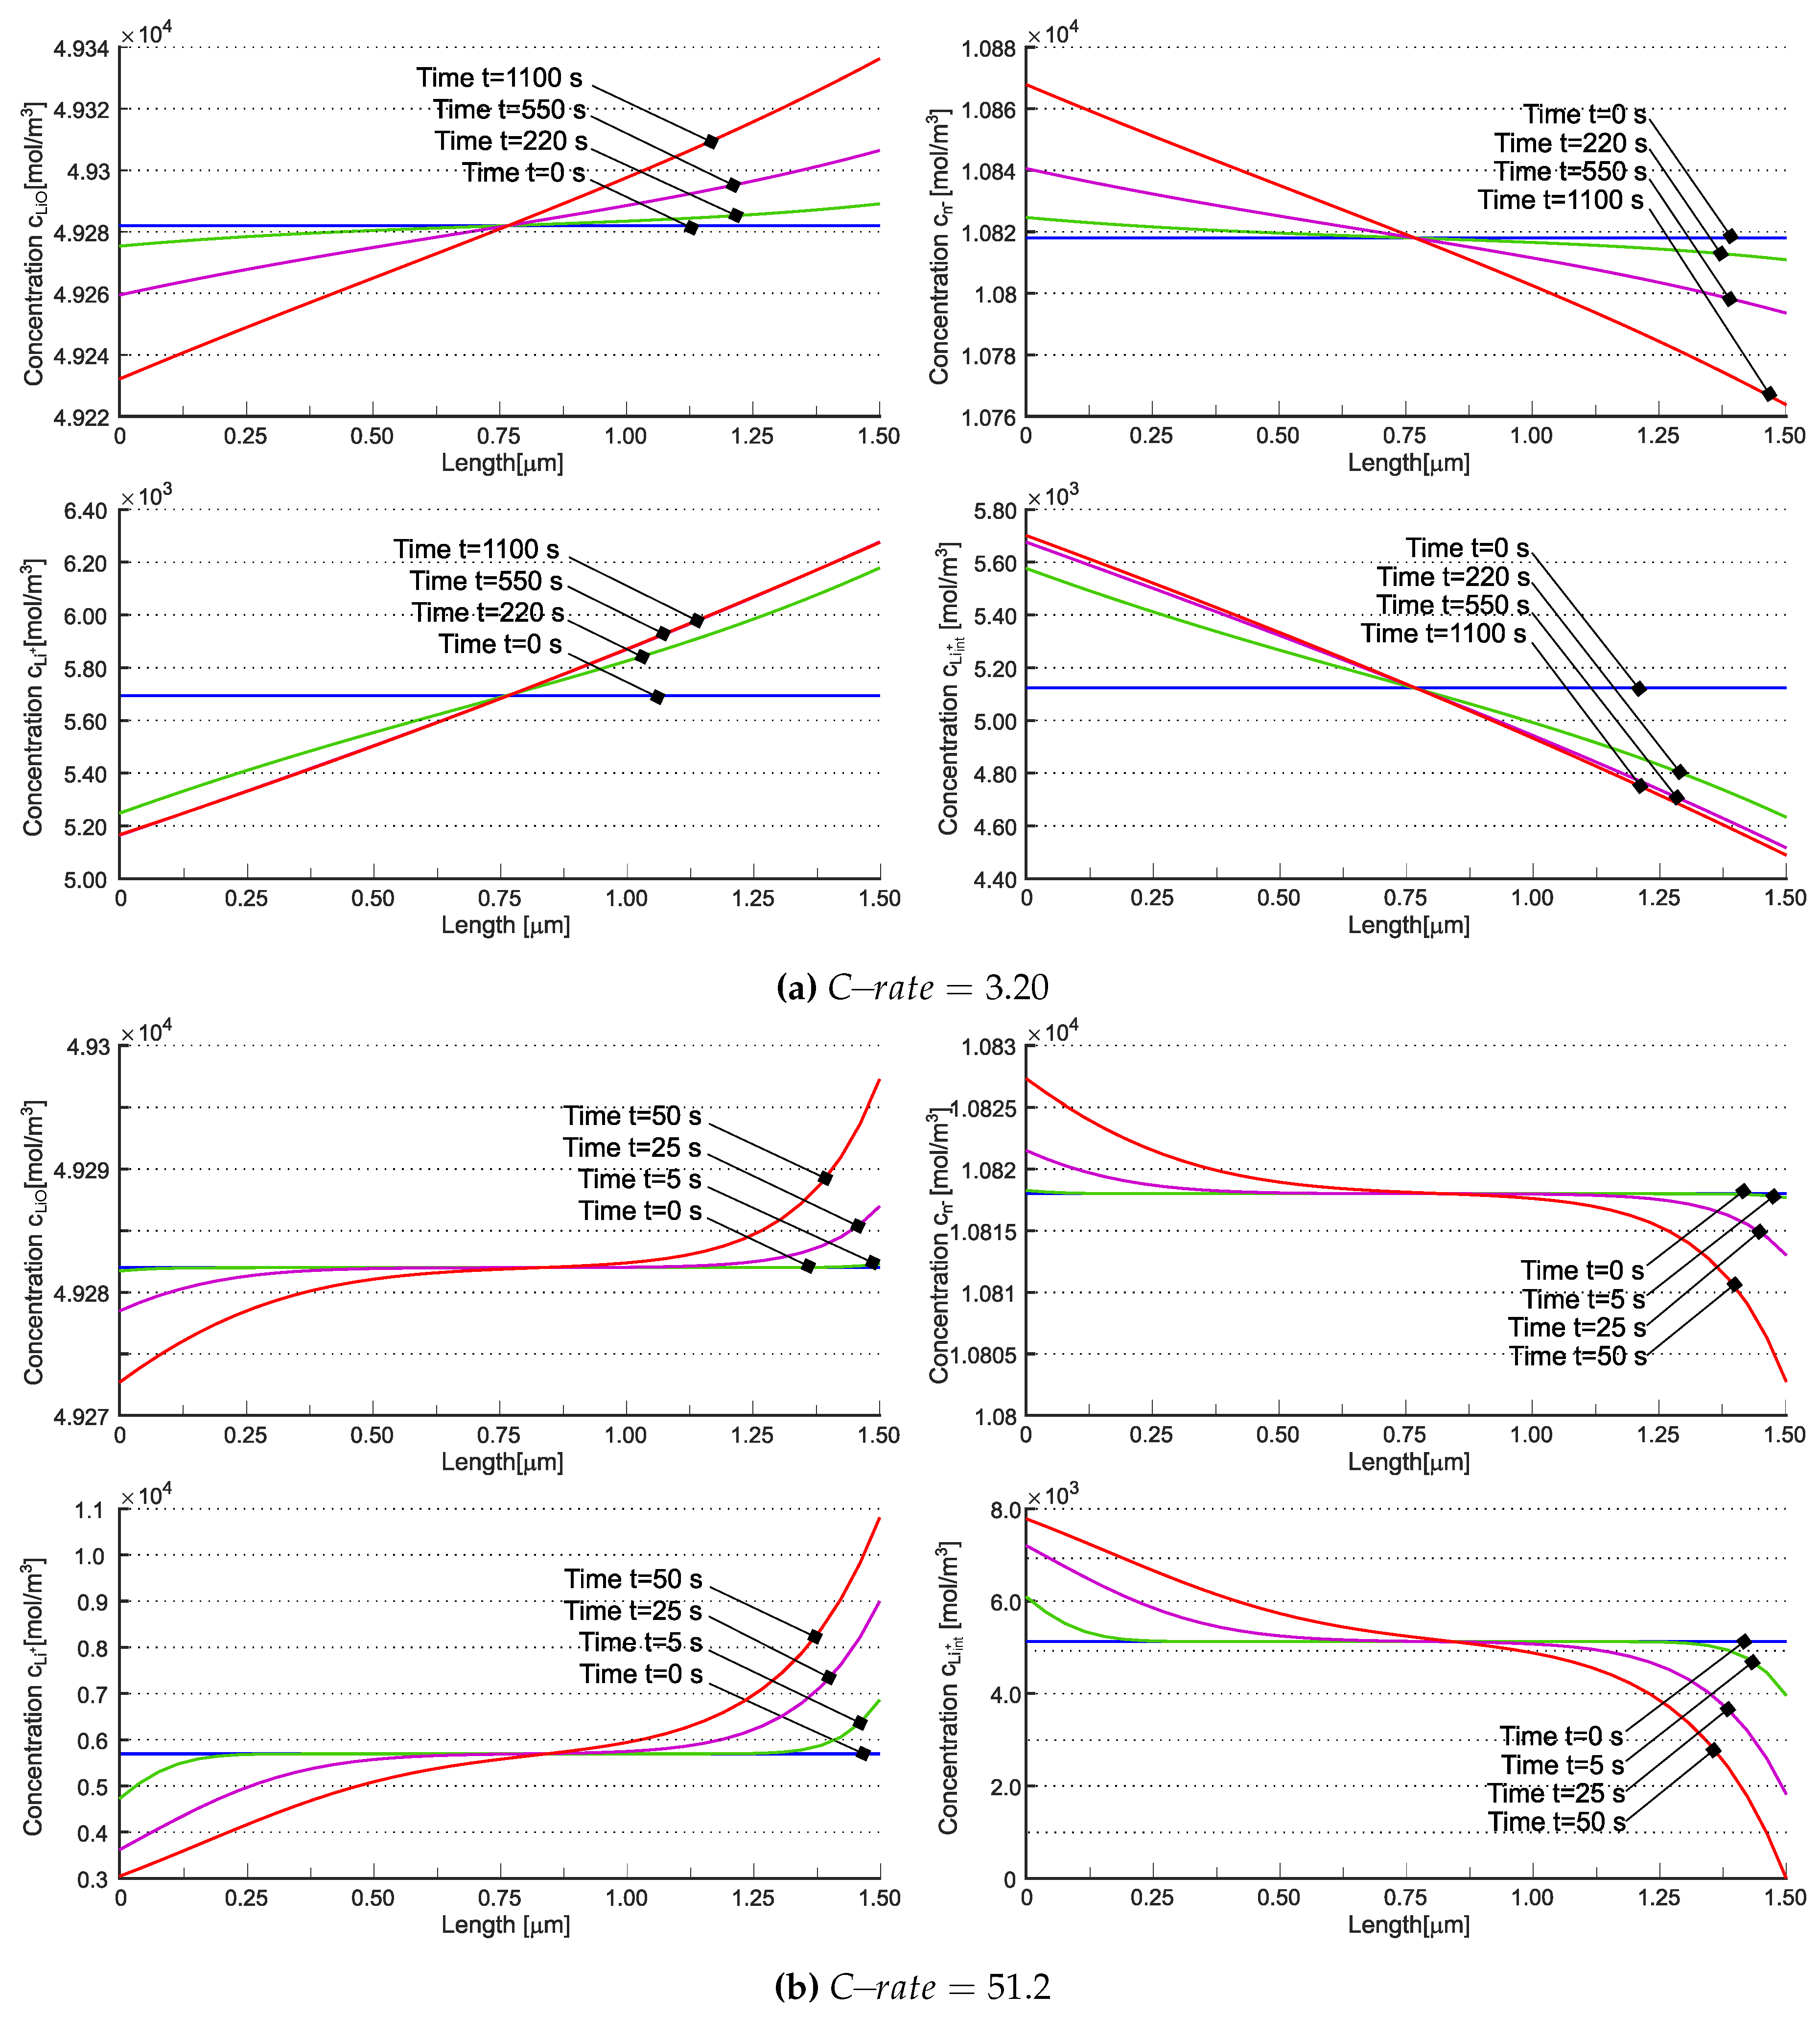
Concentrations c LiO , c n , c Li + , and c Li int + are individually depicted in Figure 7. The concentration of interstitial lithium qualitatively resembles the cationic behavior observed in [20] across varying C-rates. The number of uncompensated negative vacancies, which are offset by interstitial lithium, is higher at the cathode during discharge. Due to electroneutrality and the assumption of no negative charge flow, the total concentration of lithium cannot vanish, unlike in liquid electrolyte systems and in [20] (compare Figure 6b,d). Nevertheless, the contributions of c Li + and c Li int + can independently approach zero (refer to Figure 7b). The implications of this occurrence are currently unclear.
The concentration of Li at the cathode increases with discharge time, consistently with the Li-intercalation reaction described in Eq. (1). At higher C-rates, the expected concentration gradient becomes steeper, potentially leading to diffusion issues within the electrode. At 51.2 , this phenomenon is prominently observed in Figure 6b. Similar behavior is noted in [20] - see Figure 6d.
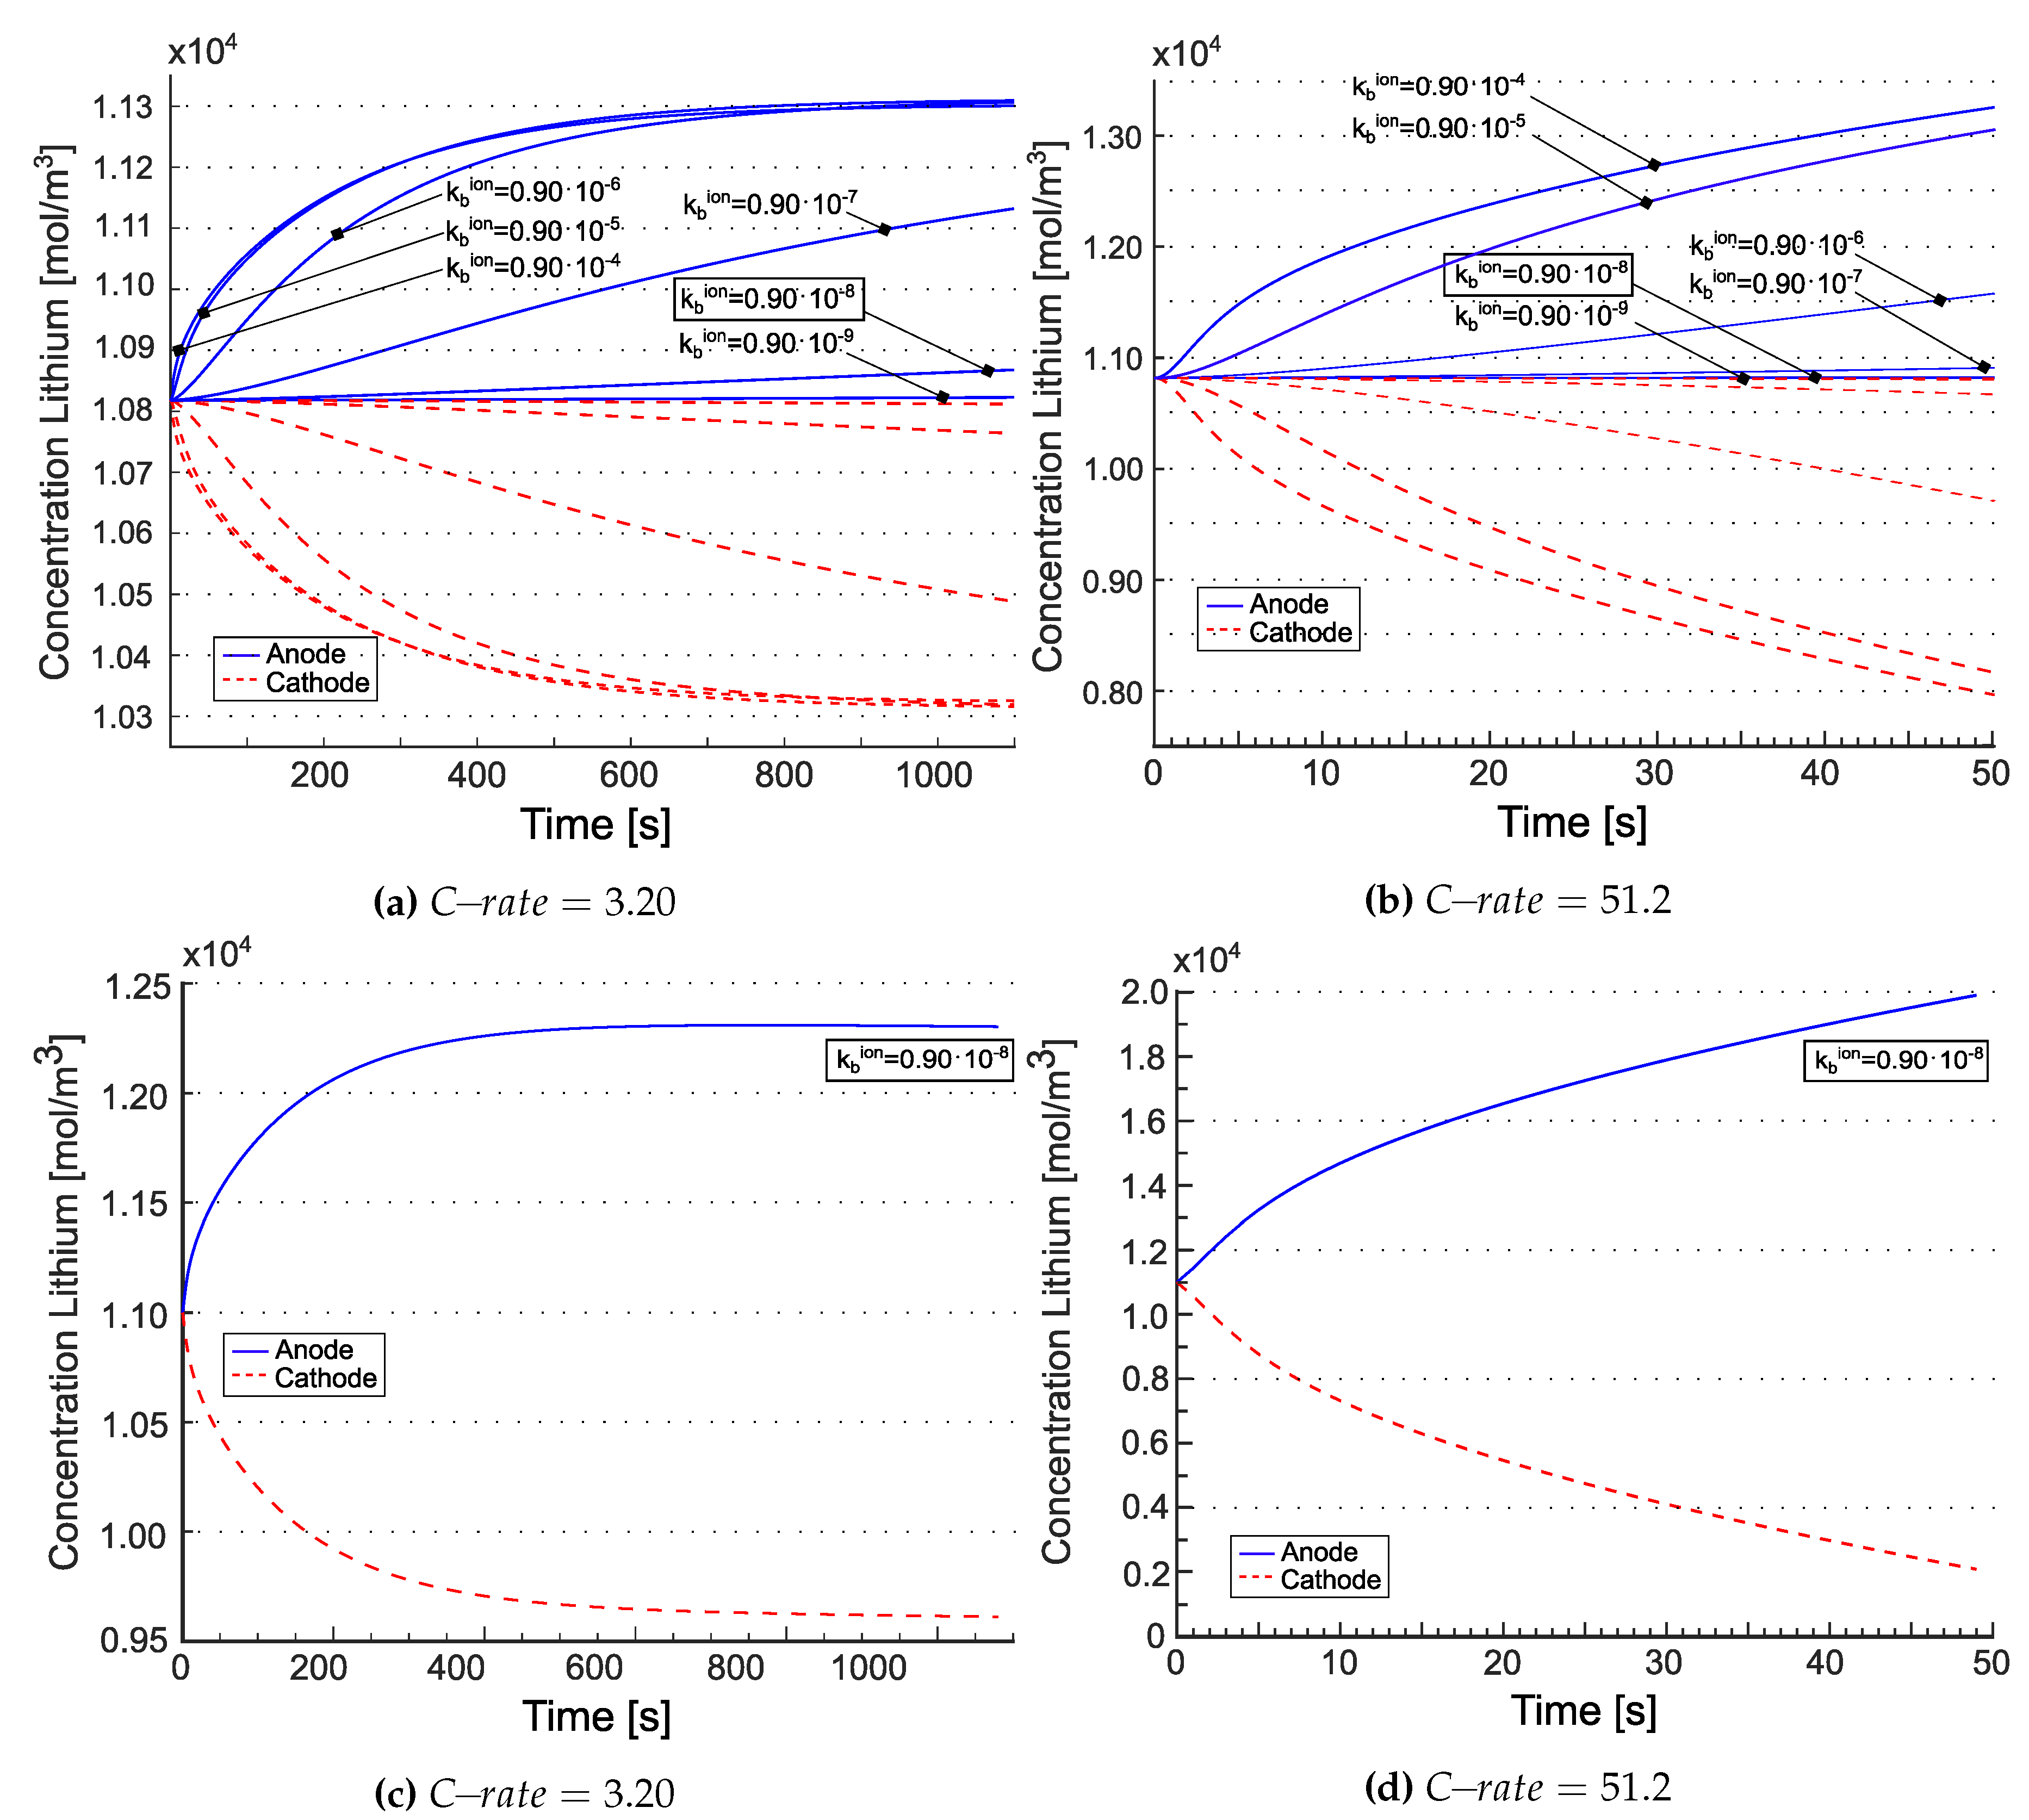
The total lithium concentration is depicted in Figure 8 for the model [21] ((a) and (b)) as well as for the model in [20] ((c) and (d)), at the anode/electrolyte interface with blue line and at the electrolyte/cathode interface with red line. According to [21], the tangent disappears at t = 0 . This is explained by electroneutrality coupled to the equilibrium condition w = 0 imposed at t = 0 in eq. (36b). The concentrations at the two electrodes evolve according to mass balance equations (36c) and (36d). Fluxes tend in time to achieve a uniform value across the electrolyte, i.e. the divergence term becomes less and less important and the evolution of concentrations turns out to be driven by the evolution of w ( 3 ) and w ( 35 ) . It is thus expected that, at the same equilibrium constant, increasing the reaction constant (i.e. making the reaction faster) would allow reaching the steady state in due time. This is numerically confirmed in Figure 8 (a) and (b), where the higher the k f ion and k b ion , keeping K eq ion = 1250 , the sooner the concentration plateau is reached. For the model in [20] the concentration response is similar to liquid electrolytes [24,25], as expected. Note that steady state in that case is obtained only at low C-rates.

4. Conclusion

This note has provided a review of four models of ionic conduction in solid electrolytes, highlighting the assumptions and the most relevant conceptual implications. All the formulations have been comprehensively examined from a theoretical perspective. The model in [21] and its predecessor [20] have also been compared from a computational standpoint via the finite element method. This assessment has been achieved analyzing interface currents, electric potential, flux patterns, and concentration profiles.
An all-solid-state thin-film Li / LiPON / LiCoO 2 microbattery was modelled in one dimension by Fabre et al. [18], addressing the kinetics involved in charge-transfer at the interfaces between the electrodes and the electrolyte, as well as the diffusion and electron migration of lithium within the cathode, along with the migration of lithium ions throughout the solid electrolyte. A modified Poisson-Nernst-Planck(PNP) system of equations for the solid electrolyte was established in [19]. The model in [20] accounts for diffusion and migration of mobile lithium ions in the solid electrolyte, the kinetics regarding the charge transfer at the interfaces between both electrodes and the electrolyte, and the diffusion and migration of lithium ions and electrons at the cathode are all included in these processes. The LiPON and LCO layers between the metallic Li electrode and Pt current collector act as electronic conductors, resembling a dielectric barrier. To enhance the model, a geometric capacitor is introduced. Additionally, to account for the space-charge effect, double-layer capacitors are positioned at both interfaces of the electrode and electrolyte. Ionic mobility in [21] is a result of hopping and interstitial diffusion, i.e. two-mechanisms for ionic conduction have been considered.
While the four models dealt within the paper are presented at higher degree of complexity, they share some common assumptions. They are all thin-film based: the first model encapsulates this assumption in the constitutive equations, while the others are in principle fully three-dimensional and hence applicable also to composite electrode/electrolyte systems. All presented models are isothermal (no self-heating), although it is quite well known, at least in liquide electrolytes, that temperature affects the response of the battery [53]. All above assumptions shall be removed in order to replicate realistic behavior of batteries, especially with the aim of capturing the aging processes in ASSB that may preclude their own market success.
With battery cycling, the volume of electrodes changes due to repeated insertion and removal of Li atoms, causing disconnection and reduced contacts. Swelling is expected also in the solid electrolyte lattice, although this phenomena has certainly been less studied experimentally. In a recent work of Tian et al. [9], the effect of imperfect contact area was incorporated into a 1-D Newman battery model, by assuming the current and Li concentration will be localized at the contacted area of the interfaces. Among the presented publications, only [21] does not neglect volume changes during charge/discharge. In our simulations, though, the active surface area, where redox processes occur, were unaltered over cycling. Our future research plans are addressed to handle the mechanical problem in a three dimensional setting, with large strain mechanics as in [49,54,55,56].

Author Contributions

Conceptualization, A.S. and L.C.; methodology, E.Y, M.S., A.S., L.C.; software, M.S., L.C.; validation, A.S. and L.C.; formal analysis, E.Y, M.S., A.S., L.C.; investigation, E.Y, M.S., A.S., L.C.; resources, A.S.; data curation, E.Y, M.S., A.S., L.C.; writing—original draft preparation, E.Y., L.C.; writing—review and editing, E.Y, M.S., A.S., L.C.; supervision, A.S.; project administration, A.S.; funding acquisition, A.S. All authors have read and agreed to the published version of the manuscript.

Funding

This research received no external funding.

Data Availability Statement

All data will be made available upon communication to the authors.

Acknowledgments

The publication was partially funded within the COMET K2 Competence Centers for Excellent Technologies from the Austrian Federal Ministry for Climate Action (BMK), the Austrian Federal Ministry for Labour and Economy (BMAW), the Province of Styria (Dept. 12) and the Styrian Business Promotion Agency (SFG). The Austrian Research Promotion Agency (FFG) has been authorised for the programme management.

Appendix A Analytical OCP Simulations

An approach to calculate the open circuit over-potential analytically is described in [33], based on the ideal chemical potential μ L i , as reported in Figure 4a with blue dashed line. The discharge curves as a function of the extracted charge, obtained following this analytical approach, are given in Figure A1a,b.
Figure A1. Discharge curves as a function of time (b), and the extracted charge (c) for different C r a t e s , obtained following the analytical approach to evaluate the OCP as given in [33].
Preprints 101857 g0a1
The difference between the results obtained considering the OCP evaluated from experimental tests and from the analytical approach are not negligible for this kind of battery meaning that more complex forms of the chemical potential shall be used as in [57].

References

  1. Schnell, J.; Günther, T.; Knoche, T.; Vieider, C.; Köhler, L.; Just, A.; Keller, M.; Passerini, S.; Reinhart, G. All-solid-state lithium-ion and lithium metal batteries – paving the way to large-scale production. J POWER SOURCES 2018, 382, 160–175. [Google Scholar] [CrossRef]
  2. Zheng, F.; Kotobuki, M.; Song, S.; Lai, M.; Lu, L. Review on solid electrolytes for all-solid-state lithium-ion batteries. J POWER SOURCES 2018, 389, 198–213. [Google Scholar] [CrossRef]
  3. Grazioli, D.; Magri, M.; Salvadori, A. Computational modeling of Li-ion batteries. COMPUT MECH 2016, 58, 889–909. [Google Scholar] [CrossRef]
  4. Li, G.; Monroe, C.W. Multiscale Lithium-Battery Modeling from Materials to Cells. ANNU REV CHEM BIOMOL 2020, 11, 277–310. [Google Scholar] [CrossRef]
  5. Pasta, M.; Armstrong, D.; Brown, Z.; Bu, J.; Castell, M.; Chen, P.; Cocks, A.; Corr, S.; Cussen, E.; Darnbrough, E.; et al. 2020 roadmap on solid-state batteries. J PHYS ENERGY 2020, 2, 032008. [Google Scholar] [CrossRef]
  6. Santhanagopalan, D.; Qian, D.; McGilvray, T.; Wang, Z.; Camino, F.; Graetz, J.; Dudney, N.; Meng, Y. Interface limited lithium transport in solidstate batteries. J PHYS CHEM LETT 2014, 5, 298–303. [Google Scholar] [CrossRef]
  7. Chen, C.; Jiang, M.; Zhou, T.; Raijmakers, L.; Vezhlev, E.; Wu, B.; Schuelli, T.; Danilov, D.; Wei, Y.; Eichel, R.; et al. Interface Aspects in All-Solid-State Li-Based Batteries Reviewed. ADV ENERGY MATER 2021, 2003939. [Google Scholar] [CrossRef]
  8. Zhang, F.; Huang, Q.; Tang, Z.; Li, A.; Shao, Q.; Zhang, L.; Li, X.; Zhang, J. A review of mechanics-related material damages in all-solid-state batteries: Mechanisms, performance impacts and mitigation strategies. NANO ENERGY 2020, 70, 104545. [Google Scholar] [CrossRef]
  9. Tian, H.K.; Qi, Y. Simulation of the Effect of Contact Area Loss in All-Solid-State Li-Ion Batteries. J ELECTROCHEM SOC 2017, 164, 3512–3521. [Google Scholar] [CrossRef]
  10. Waldmann, T.; Hogg, B.; Wohlfahrt-Mehrens, M. Li plating as unwanted side reaction in commercial Li-ion cells – A review. J POWER SOURCES 2018, 384, 107–124. [Google Scholar] [CrossRef]
  11. Porz, L.; Swamy, T.; Sheldon, B.; Rettenwander, D.; Frömling, T.; Thaman, H.; Berendts, S.; Uecker, R.; Carter, W.; Chiang, Y. Mechanism of Lithium Metal Penetration through Inorganic Solid Electrolytes. ADV ENERGY MATER 2017, 7, 1701003. [Google Scholar] [CrossRef]
  12. Shishvan, S.; Fleck, N.; McMeeking, R.; Deshpande, V. Growth rate of lithium filaments in ceramic electrolytes. ACTA MATER 2020, 196, 444–455. [Google Scholar] [CrossRef]
  13. Fan, L.; Wei, S.; Li, S.; Li, Q.; Lu, Y. Recent Progress of the Solid-State Electrolytes for High-Energy Metal-Based Batteries. ADV ENERGY MATER 2018, 8, 1702657. [Google Scholar] [CrossRef]
  14. Yuan, H.; Luan, J.; Yang, Z.; Zhang, J.; Wu, Y.; Lu, Z.; Liu, H. Single Lithium-Ion Conducting Solid Polymer Electrolyte with Superior Electrochemical Stability and Interfacial Compatibility for Solid-State Lithium Metal Batteries. ACS APPL MATER INTER 2020, 12, 7249–7256. [Google Scholar] [CrossRef]
  15. Zheng, Y.; Yao, Y.; Ou, J.; Li, M.; Luo, D.; Dou, H.; Li, Z.; Amine, K.; Yu, A.; Chen, Z. A review of composite solid-state electrolytes for lithium batteries: fundamentals, key materials and advanced structures. CHEM SOC REV 2020, 49, 8790–8839. [Google Scholar] [CrossRef]
  16. Bielefeld, A.; Weber, D.; Janek, J. Microstructural modeling of composite cathodes for all solid state batteries. J PHYS CHEM C 2019, 123, 1626–1634. [Google Scholar] [CrossRef]
  17. Cao, C.; Li, Z.; Wang, X.; Zhao, X.; Han, W. Recent advances in inorganic solid electrolytes for lithium batteries. FRONT ENERGY RES 2014, 2, 25–35. [Google Scholar] [CrossRef]
  18. Fabre, S.; Guy-Bouyssou, D.; Bouillon, P.; Le Cras, F.; Delacourt, C. Charge/Discharge Simulation of an All-Solid-State Thin-Film Battery Using a One-Dimensional Model. J ELECTROCHEM SOC 2012, 159, A104–A115. [Google Scholar] [CrossRef]
  19. Landstorfer, M.; Funken, S.; Jacob, T. An advanced model framework for solid electrolyte intercalation batteries. PHYS CHEM CHEM PHYS 2011, 13, 12817–12825. [Google Scholar] [CrossRef]
  20. Raijmakers, L.; Danilov, D.; Eichel, R.; Notten, P. An advanced all-solid-state Li-ion battery model. ELECTROCHIM ACTA 2020, 330. [Google Scholar] [CrossRef]
  21. Cabras, L.; Danilov, D.; Subber, W.; Oancea, V.; Salvadori, A. A two-mechanism and multiscale compatible approach for solid state electrolytes of (Li-ion) batteries. J ENERGY STORAGE 2022, 48, 103842. [Google Scholar] [CrossRef]
  22. Salvadori, A.; Grazioli, D.; Geers, M. Governing equations for a two-scale analysis of Li-ion battery cells. INT J SOLIDS STRUCT 2015, 59, 90–109. [Google Scholar] [CrossRef]
  23. Mykhaylov, M.; Ganser, M.; Klinsmann, M.; Hildebrand, F.; Guz, I.; McMeeking, R. An elementary 1-dimensional model for a solid state lithium-ion battery with a single ion conductor electrolyte and a lithium metal negative electrode. J MECH PHYS SOLIDS 2019, 123, 207–221. [Google Scholar] [CrossRef]
  24. Salvadori, A.; Grazioli, D.; Geers, M.; Danilov, D.; Notten, P. A multiscale-compatible approach in modeling ionic transport in the electrolyte of (Lithium ion) batteries. J POWER SOURCES 2015, 293, 892–911. [Google Scholar] [CrossRef]
  25. Salvadori, A.; Grazioli, D.; Magri, M.; Geers, M.; Danilov, D.; Notten, P. On the role of saturation in modeling ionic transport in the electrolyte of (Li-ion) batteries. J POWER SOURCES 2015, 294, 696–710. [Google Scholar] [CrossRef]
  26. Danilov, D.; Niessen, R.; Notten, P. Modeling All-Solid-State Li-Ion Batteries. J ELECTROCHEM SOC 2011, 158, A215–A222. [Google Scholar] [CrossRef]
  27. Doyle, M.; Newman, J. The use of mathematical modeling in the design of Lithium/polymer battery systems. ELECTROCHIM ACTA 1995, 40, 2191–2196. [Google Scholar] [CrossRef]
  28. Fuller, T.; Doyle, M.; Newman, J. Simulation and Optimization of the Dual Lithium Ion Insertion Cell. J ELECTROCHEM SOC 1994, 141, 1–10. [Google Scholar] [CrossRef]
  29. Salvadori, A.; Bosco, E.; Grazioli, D. A computational homogenization approach for Li-ion battery cells. Part 1 - Formulation. J MECH PHYS SOLIDS 2014, 65, 114–137. [Google Scholar] [CrossRef]
  30. Franco, A. Multiscale modelling and numerical simulation of rechargeable Lithium ion batteries: concepts, methods and challenges. RSC ADVANCES 2013, 3. [Google Scholar] [CrossRef]
  31. Lee, S.; Sastry, A.; Park, J. Study on microstructures of electrodes in Lithium-ion batteries using variational multi-scale enrichment. J POWER SOURCES 2016, 315, 96–110. [Google Scholar] [CrossRef]
  32. Franco, A.; Rucci, A.; Brandell, D.; Frayret, C.; Gaberscek, M.; Jankowski, P.; Johansson, P. Boosting Rechargeable Batteries R&D by Multiscale Modeling: Myth or Reality? CHEM REV 2019, 119, 4569. [Google Scholar] [PubMed]
  33. Purkayastha, R.; McMeeking, R. An integrated 2-D model of a Lithium ion battery: the effect of material parameters and morphology on storage particle stress. COMPUT MECH 2012, 50, 209–227. [Google Scholar] [CrossRef]
  34. Salvadori, A.; McMeeking, R.; Grazioli, D.; Magri, M. A coupled model of transport-reaction-mechanics with trapping. Part I - small strain analysis. J MECH PHYS SOLIDS 2018, 114, 1–30. [Google Scholar] [CrossRef]
  35. Arricca, M.; Cabras, L.; Serpelloni, M.; Bonanno, C.; McMeeking, R.M.; Salvadori, A. A coupled model of transport-reaction-mechanics with trapping, Part II: Large strain analysis. J MECH PHYS SOLIDS 2023, 181, 105425. [Google Scholar] [CrossRef]
  36. Anand, L. A Cahn-Hilliard-type theory for species diffusion coupled with large elastic-plastic deformations. J MECH PHYS SOLIDS 2012, 60, 1983–2002. [Google Scholar] [CrossRef]
  37. DeHoff, R. Thermodynamic in material science; CRC Press - Taylor and Francis, 2006. [Google Scholar]
  38. Shell, S. Thermodynamics and statistical mechanics: an integrated approach; Cambridge University Press, 2015. [Google Scholar]
  39. Bohn, E.; Eckl, T.; Kamlah, M.; McMeeking, R. A Model for Lithium Diffusion and Stress Generation in an Intercalation Storage Particle with Phase Change. J ELECTROCHEM SOC 2013, 160, A1638–A1652. [Google Scholar] [CrossRef]
  40. Di Leo, C.; Rejovitzky, E.; Anand, L. A Cahn-Hilliard-type phase-field theory for species diffusion coupled with large elastic deformations: Application to phase-separating Li-ion electrode materials. J MECH PHYS SOLIDS 2014, 70, 1–29. [Google Scholar] [CrossRef]
  41. Bower, A.; Guduru, P.; Chason, E. Analytical solutions for composition and stress in spherical elastic–plastic Lithium-ion electrode particles containing a propagating phase boundary. INT J SOLIDS STRUCT 2015, 69-70, 328–342. [Google Scholar] [CrossRef]
  42. Bonnefont, A.; Argoul, F.; Bazant, M. Analysis of diffuse-layer effects on time-dependent interfacial kinetics. J ELECTROANAL CHEM 2001, 500, 52–61. [Google Scholar] [CrossRef]
  43. Bazant, M.; Chu, K.; Bayly, B. Current-voltage relations for elecrochemical thin films. SIAM J APPL MATH 2005, 65, 1463–1484. [Google Scholar] [CrossRef]
  44. Li, D.; Danilov, D.; Xie, J.; Raijmakers, L.; Gao, L.; Yang, Y.; Notten, P. Degradation mechanisms of C6/LiFePO4 batteries: experimental analyses of calendar aging. ELECTROCHIM ACTA 2016, 190, 1124–1133. [Google Scholar] [CrossRef]
  45. Li, D.; Danilov, D.; Gao, L.; Yang, Y.; Notten, P. Degradation mechanisms of C6/LiFePO4 batteries: experimental analyses of cycling-induced aging. ELECTROCHIM ACTA 2016, 210, 445–455. [Google Scholar] [CrossRef]
  46. Bard, A.; Faulkner, L. Electrochemical Methods: Fundamentals and Applications, 2nd ed.; Wiley, 2000. [Google Scholar]
  47. Famprikis, T.; Canepa, P.; Dawson, J.; Islam, M.S.; Masquelier, C. Fundamentals of inorganic solid-state electrolytes for batteries. Nature Materials 2019, 18, 1278–1291. [Google Scholar] [CrossRef] [PubMed]
  48. Cabras, L.; Serpelloni, M.; Salvadori, A. Electro-chemo-mechanics of solid state batteries with lithium plating and stripping. FRONT MATER 2022, 9, 1052617. [Google Scholar] [CrossRef]
  49. Ganser, M.; Hildebrand, F.; Kamlah, M.; McMeeking, R. A finite strain electro-chemo-mechanical theory for ion transport with application to binary solid electrolytes. J MECH PHYS SOLIDS 2019, 125, 681–713. [Google Scholar] [CrossRef]
  50. Bower, A.; Guduru, P.; Chason, E. A continuum model of deformation, transport and irreversible changes in atomic structure in amorphous Lithium–silicon electrodes. ACTA MATER 2015, 98, 229–241. [Google Scholar] [CrossRef]
  51. Bucci, G.; Nadimpalli, S.; Sethuraman, V.; Bower, A.; Guduru, P. Measurement and modeling of the mechanical and electrochemical response of amorphous Si thin film electrodes during cyclic lithiation. J MECH PHYS SOLIDS 2014, 62, 276–294. [Google Scholar] [CrossRef]
  52. Magri, M.; Boz, B.; Cabras, L.; Salvadori, A. Quantitative investigation of the influence of electrode morphology in the electro-chemo-mechanical response of li-ion batteries. ELECTROCHIM ACTA 2022, 405, 139778. [Google Scholar] [CrossRef]
  53. Latz, A.; Zausch, J. Multiscale modeling of Li-ion batteries: thermal aspects. BEILSTEIN J NANOTECHNOL 2015, 6, 987–1007. [Google Scholar] [CrossRef]
  54. Di Leo, C.; Rejovitzky, E.; Anand, L. Diffusion-deformation theory for amorphous silicon anodes: the role of plastic deformation on elecrochemical performance. INT J SOLIDS STRUCT 2015, 67-68, 283–296. [Google Scholar] [CrossRef]
  55. Fathiannasab, H.; Kashkooli, A.; Li, T.; Zhu, L.; Chen, Z. Three-Dimensional Modeling of All-Solid-State Lithium-Ion Batteries Using Synchrotron Transmission X-ray Microscopy Tomography. J ELECTROCHEM SOC 2020, 167, 100558. [Google Scholar] [CrossRef]
  56. Fathiannasab, H.; Zhu, L.; Chen, Z. Chemo-mechanical modeling of stress evolution in all-solid-state lithium-ion batteries using synchrotron transmission X-ray microscopy tomography. J POWER SOURCES 2021, 483, 229028. [Google Scholar] [CrossRef]
  57. Landstorfer, M. A Discussion of the Cell Voltage during Discharge of an Intercalation Electrode for Various C-Rates Based on Non-Equilibrium Thermodynamics and Numerical Simulations. J ELECTROCHEM SOC 2019, 167, 013518. [Google Scholar] [CrossRef]
1
Electroneutrality is extensively discussed in [22] (see also [23])
2
Here
M ( x , t ) = D | Li + R T c Li + ( x , t ) 1
is the expression taken in [19] for the mobility tensor. Note that Equation (56) differs a little from the choice made in [34,35]. This remark also gives a justification for the different outcomes on the final form of the mass balance equation.
3
The chemical potential in (16b) represents the entropy of mixing plus energetic interactions. The term μ Li + 0 is the reference value of the chemical potential that specifies the free energy in the absence of interaction and entropic contributions. The real valued constant χ | in Eq. (16b) - termed the exchange parameter [38] - characterizes the energy of interaction between mobile guest species and insertion sites. If all of the interactions between mobile species and sites are the same, then χ | = 0 and there is no energy of mixing: mixing is purely entropic. The contribution R T χ | 1 2 θ Li + ( x , t ) , emanating from the excess Gibbs energy [34,35], may lead to phase segregation [39,40,41].
4
z α is the valency of ion α , equal to + 1 for Li + cations.
5
This description of transport of vacancies, in a form analogous to liquid electrolytes, appears to be questionable and is replaced by a different formulation in the novel approach to be presented in Section 2.4
6
The electro-neutrality condition c Li + + c Li int + = c n is not used as a fundamental law.
Figure 1. A pictorial view of the ASSBs models proposed in the selected literature, under discharge conditions, together with the unknown fields. In (c) the (yellow) curved arrows indicate the charge-transfer reactions at both interfaces, while i a / c and i e / c are used to specify the charge-transfer current densities across both electrode/electrolyte interfaces. The unknown fields include lithium concentration in the anode, for the sake of generality.
Preprints 101857 g001
Figure 2. LiPON matrix contains nitrogen which has triple and double coordination (a). One of the primary processes of ionic conductivity in LiPON is the movement of charged particles moving the interstitial region through particle hopping (b).
Preprints 101857 g002
Figure 3. Three typical cation migration mechanisms: vacancy, direct interstitial and correlated (interstitialcy) involving a single or multiple sites (blue and red, respectively). Reprinted with permission from [47].
Preprints 101857 g003
Figure 4. (a) The open circuit potential (OCP) is depicted as a function of extracted charge. The OCP obtained from experimental tests is represented by the red line, while the OCP evaluated using the approach in [33] is illustrated by the blue line. (b) Discharge curves plotting voltage against time for various C r a t e s , from [21]. Different C r a t e s are shown by coloured lines, and the experimental values are indicated by dots. Reprinted from [21] with permission.
Preprints 101857 g004
Figure 5. The electric potential profile for the models suggested in [21] ((a) and (b)) and [20] ((c) and (d)) at various times for two different C r a t e s . During the initial stage, when the electric potential within individual constituent of the battery reaches a equilibrium and no specific pattern emerges. The last plot marked on the graph represents the time step at which the concentration of lithium Li within the positive electrode reaches its maximum capacity in terms of saturation c Li sat . Reprinted from [21] with permission.
Preprints 101857 g005
Figure 6. Lithium concentration profiles within the battery for two different C r a t e s at different time steps for the model suggested in [21] ((a) and (b)) and the model suggested in [20] ((c) and (d)). The blue lines refer to the starting time. While no specific profile is shown here, the lithium concentration within the different components of the battery is in equilibrium. The red line depicts the last time step which is the point at which the battery is aforethought as discharged because of the amount of lithium Li in the positive electrode has reached the saturation limit c Li sat . Reprinted from [21] with permission.
Preprints 101857 g006
Figure 7. Concentration of Lithium in the solid electrolyte for the different species such as c LiO , c n , c Li + and c Li int + is given at different time values for a C r a t e = 3.2 (a) and a C r a t e = 51.2 (b). Reprinted from [21] with permission.
Preprints 101857 g007
Figure 8. Considering the model used in [21], the concentration of lithium at the interfaces with the positive and the negative electrodes for the two different C r a t e s ((a) and (b)) as well as for the model proposed in [20] ((c) and (d)). The values recorded at the anode/electrolyte interface are represented by the blue lines, while the red line illustrates the values at the electrolyte/cathode interface. Observe that the initial tangent disappears in Figures (a) and (b). This is described by the electroneutrality that results from coupling the equilibrium condition w = 0 set at t = 0 in Equation (36b). Reprinted from [21] with permission.
Preprints 101857 g008
Table 1. Parameters of the model employed in simulations, as in [21].
Parameter Value Unit Description
T 298.5 K Temperature
L a 0.50 · 10 6 m Thickness of the anode
L e 1.50 · 10 6 m Thickness of the electrolyte
L c 0.32 · 10 6 m Thickness of the cathode
L c o l 0.10 · 10 6 m Thickness of the positive collector
A 1.00 · 10 4 m 2 Geometrical surface area
c Li s a t 2.34 · 10 4 mol / m 3 Maximum concentration of Li ions in the electrode
k a 1.08 · 10 7 S / m Electrical conductivities in the lithium anode
k c o l 10.0 S / m Electrical conductivities in the current collector
k f ion 1.125 · 10 5 ( 1 . 80 · 10 5 ) 1 / s Lithium ion generation reaction rate constant for Equation (3)
k b ion 0.90 · 10 8 m 3 / ( mols ) Lithium ion recombination reaction rate constant for Equation (3)
k f int 8.10 · 10 9 ( 1 . 69 · 10 9 ) 1 / s Lithium ion generation reaction rate constant for Equation (35)
k b int 0.90 · 10 8 m 3 ( mols ) Lithium ion recombination reaction rate constant for Equation (35)
c a d l 1.74 · 10 4 F / m 2 Double layer capacity per unit area of anode
c c d l 5.30 · 10 3 F / m 2 Double layer capacity per unit area of cathode
α n 0.6 - Charge transfer coefficient for the negative electrode
α p 0.6 - Charge transfer coefficient for the positive electrode
D | Li + 5.10 · 10 15 m 2 / s Diffusion coefficient for Li + ions in the electrolyte
D | Li int + 0.90 · 10 15 m 2 / s Diffusion coefficient for Li int + ions in the electrolyte
D | Li 1.76 · 10 15 m 2 / s Diffusion coefficient for Li ions in the cathode
k 1 5.10 · 10 6 m 2.5 mol 0.5 / s Standard reaction rate constant for forward reaction in Equation (1)
k 2 1.09 · 10 5 m / s Standard reaction rate constant for forward reaction in Equation (2)
δ 0.18 - Fraction of mobile ions in the electrolyte in equilibrium
c 0 6.01 · 10 4 mol / m 3 Maximal lithium concentration in the electrolyte
ε r 2.25 Relative permittivity in the electrolyte
Disclaimer/Publisher’s Note: The statements, opinions and data contained in all publications are solely those of the individual author(s) and contributor(s) and not of MDPI and/or the editor(s). MDPI and/or the editor(s) disclaim responsibility for any injury to people or property resulting from any ideas, methods, instructions or products referred to in the content.
Copyright: This open access article is published under a Creative Commons CC BY 4.0 license, which permit the free download, distribution, and reuse, provided that the author and preprint are cited in any reuse.
Prerpints.org logo

Preprints.org is a free preprint server supported by MDPI in Basel, Switzerland.

Subscribe

© 2024 MDPI (Basel, Switzerland) unless otherwise stated