Submitted:
20 March 2024
Posted:
21 March 2024
You are already at the latest version
Abstract
Keywords:
1. Introduction
2. Patients and Methods
2.1. Study Population
2.2. Laboratory Determinations
2.3. Statistical Analysis
3. Results
4. Discussion
5. Conclusions
Authorship Contributions
Funding
Institutional Review Board Statement
Data Availability Statement
Conflict of Interest
References
- Cabanillas ME, McFadden DG. , DuranteC. Thyroid cancer. Lancet 2016, 388, 2783–2795. [Google Scholar] [CrossRef] [PubMed]
- D. S. Cooper, B. Specker, M. Ho, M.Sperling M, P.W. Ladenson, D.S. Ross, K.B. Ain, S.T. Bigos, J.D. Brierley, B.R. Haugen, I. Klein, J.Robbins, S.I. Sherman, T. Taylor, H.R. Maxon. Thyrotropin suppression and disease progression in patients with DTC. Results from the National Thyroid Cancer Treatment Cooperative Registry. Thyroid 1998, 8, 737–744. [Google Scholar]
- M. Papaleontiou,S.T.Hawley, M.R. Haymart MR. Effect of thyrotropin suppression therapy on bone in thyroid cancer patients. The Oncologist 2016, 21, 165–171. [Google Scholar] [CrossRef] [PubMed]
- G. Mazziotti, A.M. Formenti, S. Frara, R. Olivetti, G. Banfi, M.Memo, R, Maroldi, R Giubbini, A Giustina. A High prevalence of radiological vertebral fractures in women on TSH suppressive therapy for thyroid carcinoma. Journal of Clinical Endocrinology and Metabolism 2017, 103, 956–964. [Google Scholar]
- E S Siris, P D Miller, E Barrett-Connor, K G Faulkner, L E Wehren, T A Abbott, M L Berger, A C Santora, L M Sherwood. Identification and fracture outcomes of undiagnosed low bone mineral density in postmenopausal women; results from the national osteoporosis Risk Assessment. JAMA 2001, 286, 2815–22. [Google Scholar] [CrossRef] [PubMed]
- Jie-Eun Lee, Kyoung Min Kim, Lee-Kyung Kim, Kyong Young Kim, Tae Jung Oh, Jae Hoon Moon, Sung Hee Choi, Soo Lim, Sang Wan Kim, Chan Soo Shin, Hak Chul Jang. Comparisons of TBS and lumbar spine BMD in the associations with vertebral fractures according to the T-scores: A cross-sectional observation Bone 2017, 105, 269–275.
- McCloskey Ev, Oden A, HarveyN, Leslie WD, Hans D, Johansson H, Barkmann R, Boutroy S, Brown J, Chaputlat R, et al. Meta-analysis of trabecular bone score in fracture risk prediction and its relationship to FRAX. J Bone Miner Res 2018; 31:940-8.
- 8. M. Diaz Curiel, J.L.Carrasco de la Peña, J. Honorato Perez, R. Perez Cano, A. Rapado,I. Ruiz Martinez. Study of bone mineral density in lumbar spine and femoral neck in a Spanish population. Multicentre Research Project on Osteoporosis. Osteoporosis International 1997; 7: 59-64 .
- JA Kanis, LJ Melton, C Christiansen, CC Johnston, N Khaltaev. The Diagnosis of Osteoporosis. Journal of Bone and Mineral Research 1994, 9, 1137–41. [Google Scholar] [CrossRef] [PubMed]
- V.B.C. Silva, W.D. Leslie, H. Resch, O. Lamy, O.Lesnyak, N.Binkley, E.V.McCloskey, J.A. Kanis. J.P. Bilezikian. Trabecular bone score: a noninvasive analytical method based upon the DXA image. . J Bone Miner Res 2014; 29: 518-530.
- H K Genant, C Y Wu, C van Kuijk, M C Nevitt. Vertebral fracture assessment using a semiquantitative technique. J Bone Miner Res 1993, 8, 1137–48. [Google Scholar] [CrossRef]
- Wang S, Wang Y, Zhu L, He L, Lv M, Zhang H, Wang H, Zhang F, Lai Y, Li Y, ShanZ, Teng W. Effects of TSH suppressive therapy on bone mineral density (BMD) and bone turnover markers (BMT) in patients with differentiated thyroid cancer in Northeast China: a prospective controlled cohort study. Endocrine 2023, 79, 113–124. [Google Scholar]
- Olza J, Aranceta-Bartrina J, González-Gross M, Ortega RM, Serra-Majem L, Varela-Moreiras G, Gil Á. Reported Dietary Intake, Disparity between the Reported Consumption and the Level Needed for Adequacy and Food Sources of Calcium, Phosphorus, Magnesium and Vitamin D in the Spanish Population: Findings from the ANIBES Study. Nutrients. 2017; 21;9(2). pii: E168. [CrossRef]
- Hu, MJ, Zhang Q, Liang L, Wang SY, Zhen XC, Zhou MM, Yang YW, Zhong Q, Huan F. Association between vitamin D deficiency and risk of thyroid cancer: A case-control study and meta-analysis. J Endocrinol Invest 2018, 41, 1199–1210. [Google Scholar] [CrossRef]
- Hawkins F, Guadalixs, De Mingo ML, Allo G, Martin Ariscado C, Lopez B, Martinez Diaz, G. Association of low serum 25OHD levels with abnormal bone microarchitecture in well-differentiated thyroid cancer. 8, 2020; 8.
- Guo CY, Weetman AP, Eastell R. Longitudinal changes of bone mineral density and bone turnover in postmenopausal women on thyroxine. Clin Endocrinol (Oxf) 1997, 46, 301–7. [Google Scholar] [CrossRef] [PubMed]
- Zhang P, Xi H, Yan R. Effects of thyrotropin suppression on lumbar bone mineral density in postmenopausal women with differentiated thyroid carcinoma. Onco Targets Ther 2018, 11, 5587–6692. [Google Scholar]
- Ku EJ, Sang Yoo W, Kyung Lee E, Young Ahn H, Hoon Woo S, Hwa Hong J, Kyung Chung H, Woo Park J. Effect of TSH suppression therapy on bone mineral density in differentiated thyroid cancer: a systematic review and meta-analysis. J Clin Endocrinol Metab. 2021, 106, 3655–3667. [Google Scholar]
- De Mingo Dominguez ML, Guadalix Iglesias S, Martin-Arriscado Arroba C, López Alvarez B, Martínez Diaz-Guerra G, Martinez-Pueyo JI, Ferrero Herrero E, Hawkins F. Low trabecular bone score in postmenopausal women with differentiated thyroid carcinoma after long-term TSH suppressive therapy. Endocrine. 2018, 62, 166–173. [Google Scholar] [CrossRef] [PubMed]
- Moon, JH. Kim KM, Oh TJ, Choi SH, Lim S, Park YJ, Park DJ, Jang HC. The effect of TSH suppression on vertebral trabecular bone scores in patients with differentiated thyroid carcinoma. Journal of Clinical Endocrinology and Metabolism 2017, 102, 78–85. [Google Scholar] [PubMed]
- 21. Sousa BECA, Silva BC,de Oliveria Guidotti T,Pires MC, Soares MM, Kakehasi AM. Trabecular bone score in women with differentiated thyroid cancer on long-term TSH suppressive therapy. Journal of Endocrinological Investigation 2023; 44:2295-2305.
- Hawkins F, Guadalix S, De Mingo ML, Martin Arriscado C, Lopez B, Allo G, Martinez Diaz G. Trabecular bone deterioration in differentiated thyroid cancer: impact of long-term TSH suppressive therapy. Cancer Med. 2020, 9, 5746–5755. [Google Scholar] [CrossRef] [PubMed]
- Sugitani I, Fujimoto Y. Effect of postoperative thyrotropin suppressive therapy on bone mineral density in patients with papillary thyroid carcinoma: a prospective controlled study. Surgery 2011, 150, 1250–7. [Google Scholar] [CrossRef] [PubMed]
- 24. Heijckmann AC, Huijberts MS,Geusens P, de Vries J, Meneere PP, Wolffenbuttel BH. Hip bone mineral density, bone turnover and risk of fractures in patients on long-term suppressive L-thyroxine therapy for differentiated thyroid carcinoma. Eur.J Endocrinol 2005; 153, 23-29.
- Rajesh K Jain, Tamara Vokes. Physical activity as measured by accelerometer in NHANES 2005-2006 is associated with better bone density and trabecular bone score in older adults. Arch Osteoporos. 2019, 14, 29. [Google Scholar] [CrossRef]
- Kim J, Han K, Jung JH, Ha J, Jeong C, Heu JY, Lee SE, Lee J, LimY, Kim MK, Kwon HS, Son KH, Baek KH. Physical activity and reduced risk of fracture in thyroid cáncer after thyroidectomy - a nationwide cohort study. Front Endocrinol (Lausanne). 2023, 14, 1173781. [Google Scholar] [CrossRef]
- Shevroja E,Pio Cafarelli FP,Guglielmi G, HansD. DXA parameters, Trabecular Bone Score (TBS) and Bone Mineral density (BMD) in fracture risk prediction in endocrine-mediated secondary osteoporosis. Endocrine 2021, 74, 2028. [Google Scholar]
- Park H, Park J, Yoo H, Kim S, Koh JH, Jee JH, Min YK, Chung JH, Kim TH, Kang M, Kim SW. Bone density testing interval and transition to osteoporosis in differentiated thyroid carcinoma patients on TSG suppression therapy. Clinical Endocrinology 2022, 97, 130–136. [Google Scholar] [CrossRef]
- Messina C, Buonomenna C, Menon G, Magnani S, Albano D, Gitto S, Ulivieri FB, Sconfienza LM. Fat Mass does not increase the precision error of trabecular bone score measurements. Journal of Clinical Densitometry: Assessment and Management of Musculoskeletal Health, 2023, 22/3, 359–366.


| Studied parameters | Baseline Study (n=145) |
End study (n=145) |
P value |
|
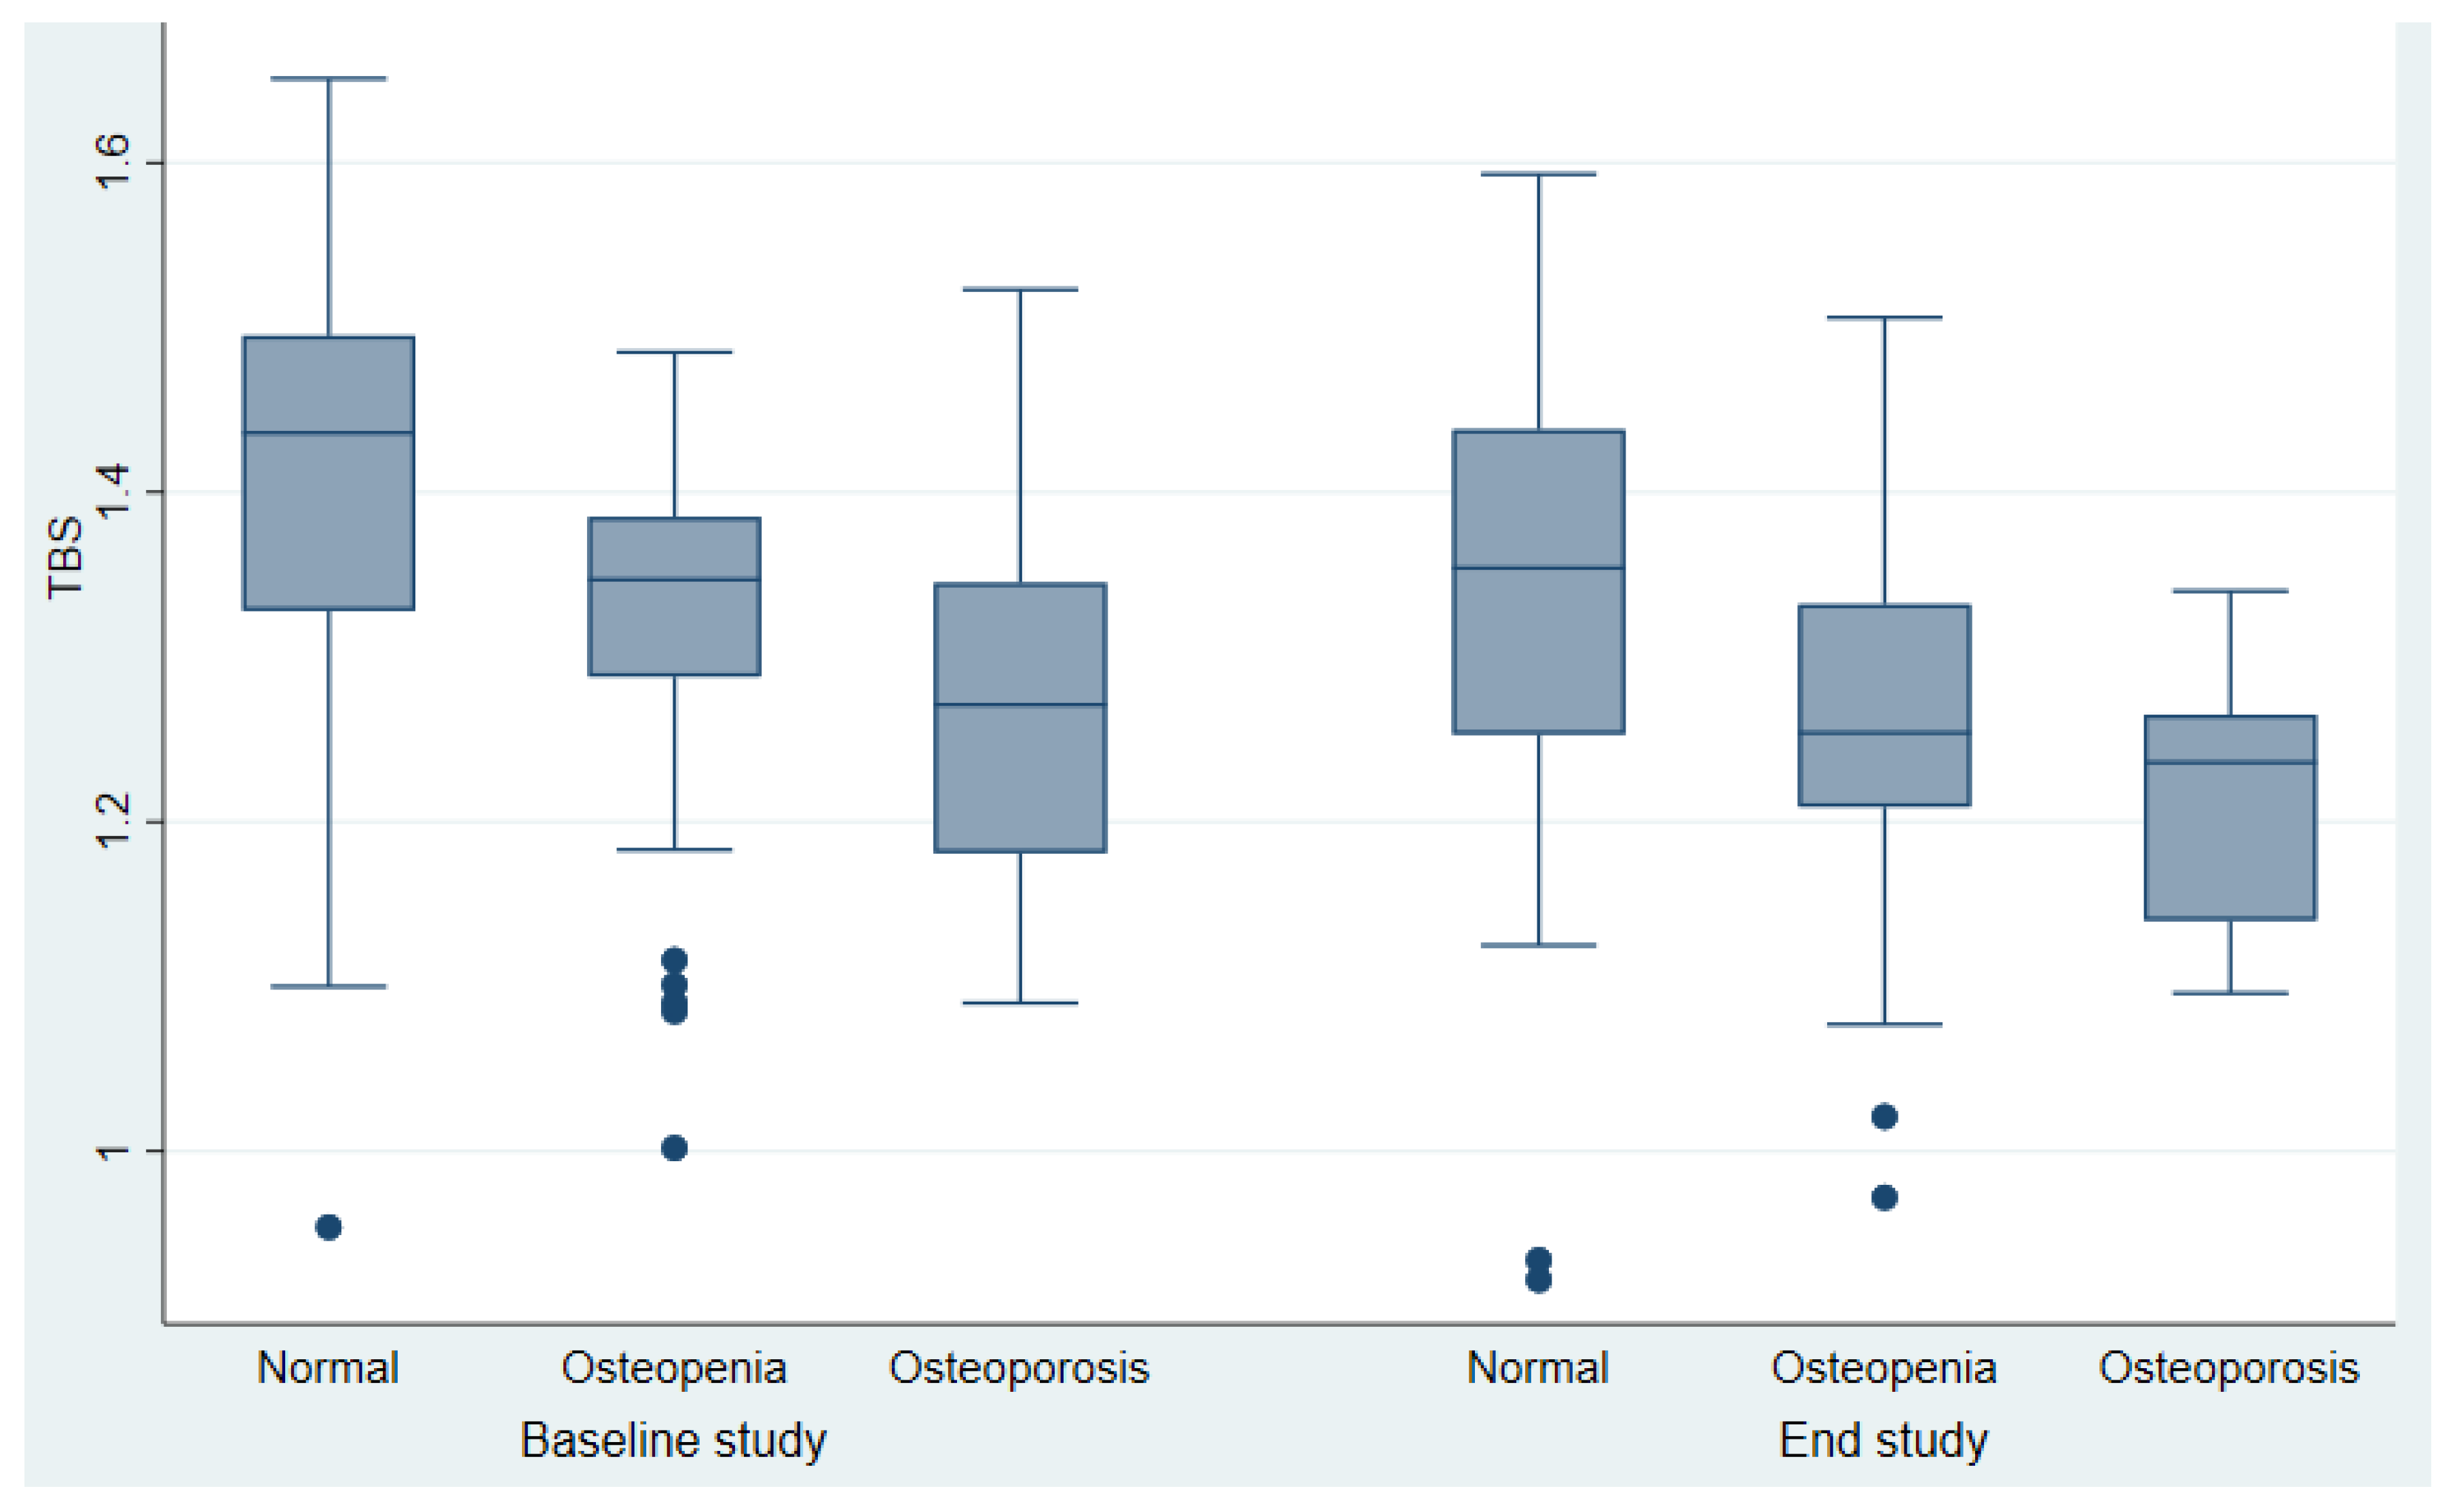
Clinical and hormonal data Age(years) Weight(kg) BMI (kg/m2) Menopausia (years) Smoking yes/no Alcohol ingestion LT4 (mcg/ Kg ) Serum TSH (µU/mL) Serum Free T4 (ng/dl) Duration years (range) Radioactive iodine doses mCi (range) --------------------------------- Bone markers Serum PTH (pg/mL) Serum Osteocalcin(ng/ml) β-CTX (ng/ml) BAP (U/L) Serum 25OHD (ng/ml) Densitometric parameters L-BMD (g/m2) FN-BMD(g/cm2) TH BMD(g/cm2) UD-R BMD(g/cm2) 1/3 RD-BMD(g/cm2) TBS Normal Partial degraded Degraded |
51.48±1.9 67.3 ±11.8 27,27 ± 0.6 61 (57.9%) 25(17.2%) 1(0.69%) 2.29± 0.6) 0.23±0.4 1.64 ± 0.4 - - ------------------------------- 31.03±12.1 6.93±3.5(4.53-9.86) - 10.90±7.42 26.43 ± 10,1 0.91±0.16) 0.74± 0.14) 0.91±0.16 0.42±0.06 0.62±0.05 1.35±0.14 53,79% 30.35% 15,86% |
63.96±10.65 70.28±13.3 28.45±5.3 131 (90.3%) 17(11.7%) 0 1.70± 0.4 0.89±0.1 1.60±0.3 12.23±5.9) 209.17±119.86 --------------------------- 45.65 ± 16.2 19.56(15.68-23.46) 0.30 (0.19-0.47) 22.50±4.9 22.65 ± 12.37 0.89±0.13 0.70±0.11 0,86±0.13 0.40±0.06 0.63±0.08 1.26± 0.13) 26.21% 48,97% 24,83 |
<0.001 0.054 <0.001 <0.001 0.18 0.32 0.0417 <0.001 0.9464 ----------------------- <0.001 <0.001 <0.001 0.013 0.16 0.047 0.42 0.35 0.97 0.002 |
|
DXA T-Scores. |
TBS scores | Total | ||
| ≥1.350 (normal) |
1.200-1.350 (partially degraded) |
≤1.200 (degraded) |
||
| T score ≥1 SD (normal) |
43 (2.6) | 13 (8.9) | 6(4.1) | 62 (42.7) |
| T score <-1.0 and >-2.5 SD (osteopenia) |
29 (20) | 20 (13.7) | 10 (6.8) |
59 (40.6) |
| T score- ≤2.5 SD (osteoporosis) |
6 (4.1) | 12(8.3) | 6 (4.1) | 24 (16.5) |
| Total |
78 (53.7) | 45 (31) | 22(15.1) | 145 (100) |
|
DXA T-Scores. |
TBS scores | Total | ||
| ≥1.350 (normal) |
1.200-1.350 (partially degraded) |
≤1.200 (degraded) |
||
| T score ≥1 SD (normal) |
25 (17.2) | 16 (11.0) | 9 (6.2) 10 |
50(34.4%) |
| T score <-1.0 and >-2.5 SD (osteopenia) |
13 (8.9) | 38 (26.2) | 17(11.7) | 68 (46.8) |
| T score - ≤2.5) SD Osteoporosis |
0 (0) | 17 (11.7) | 10(6.9) 0 |
27 (18.6) |
| Total |
38 (26.2) | 71 (48.9) | 36(24.8) | 145(100) |
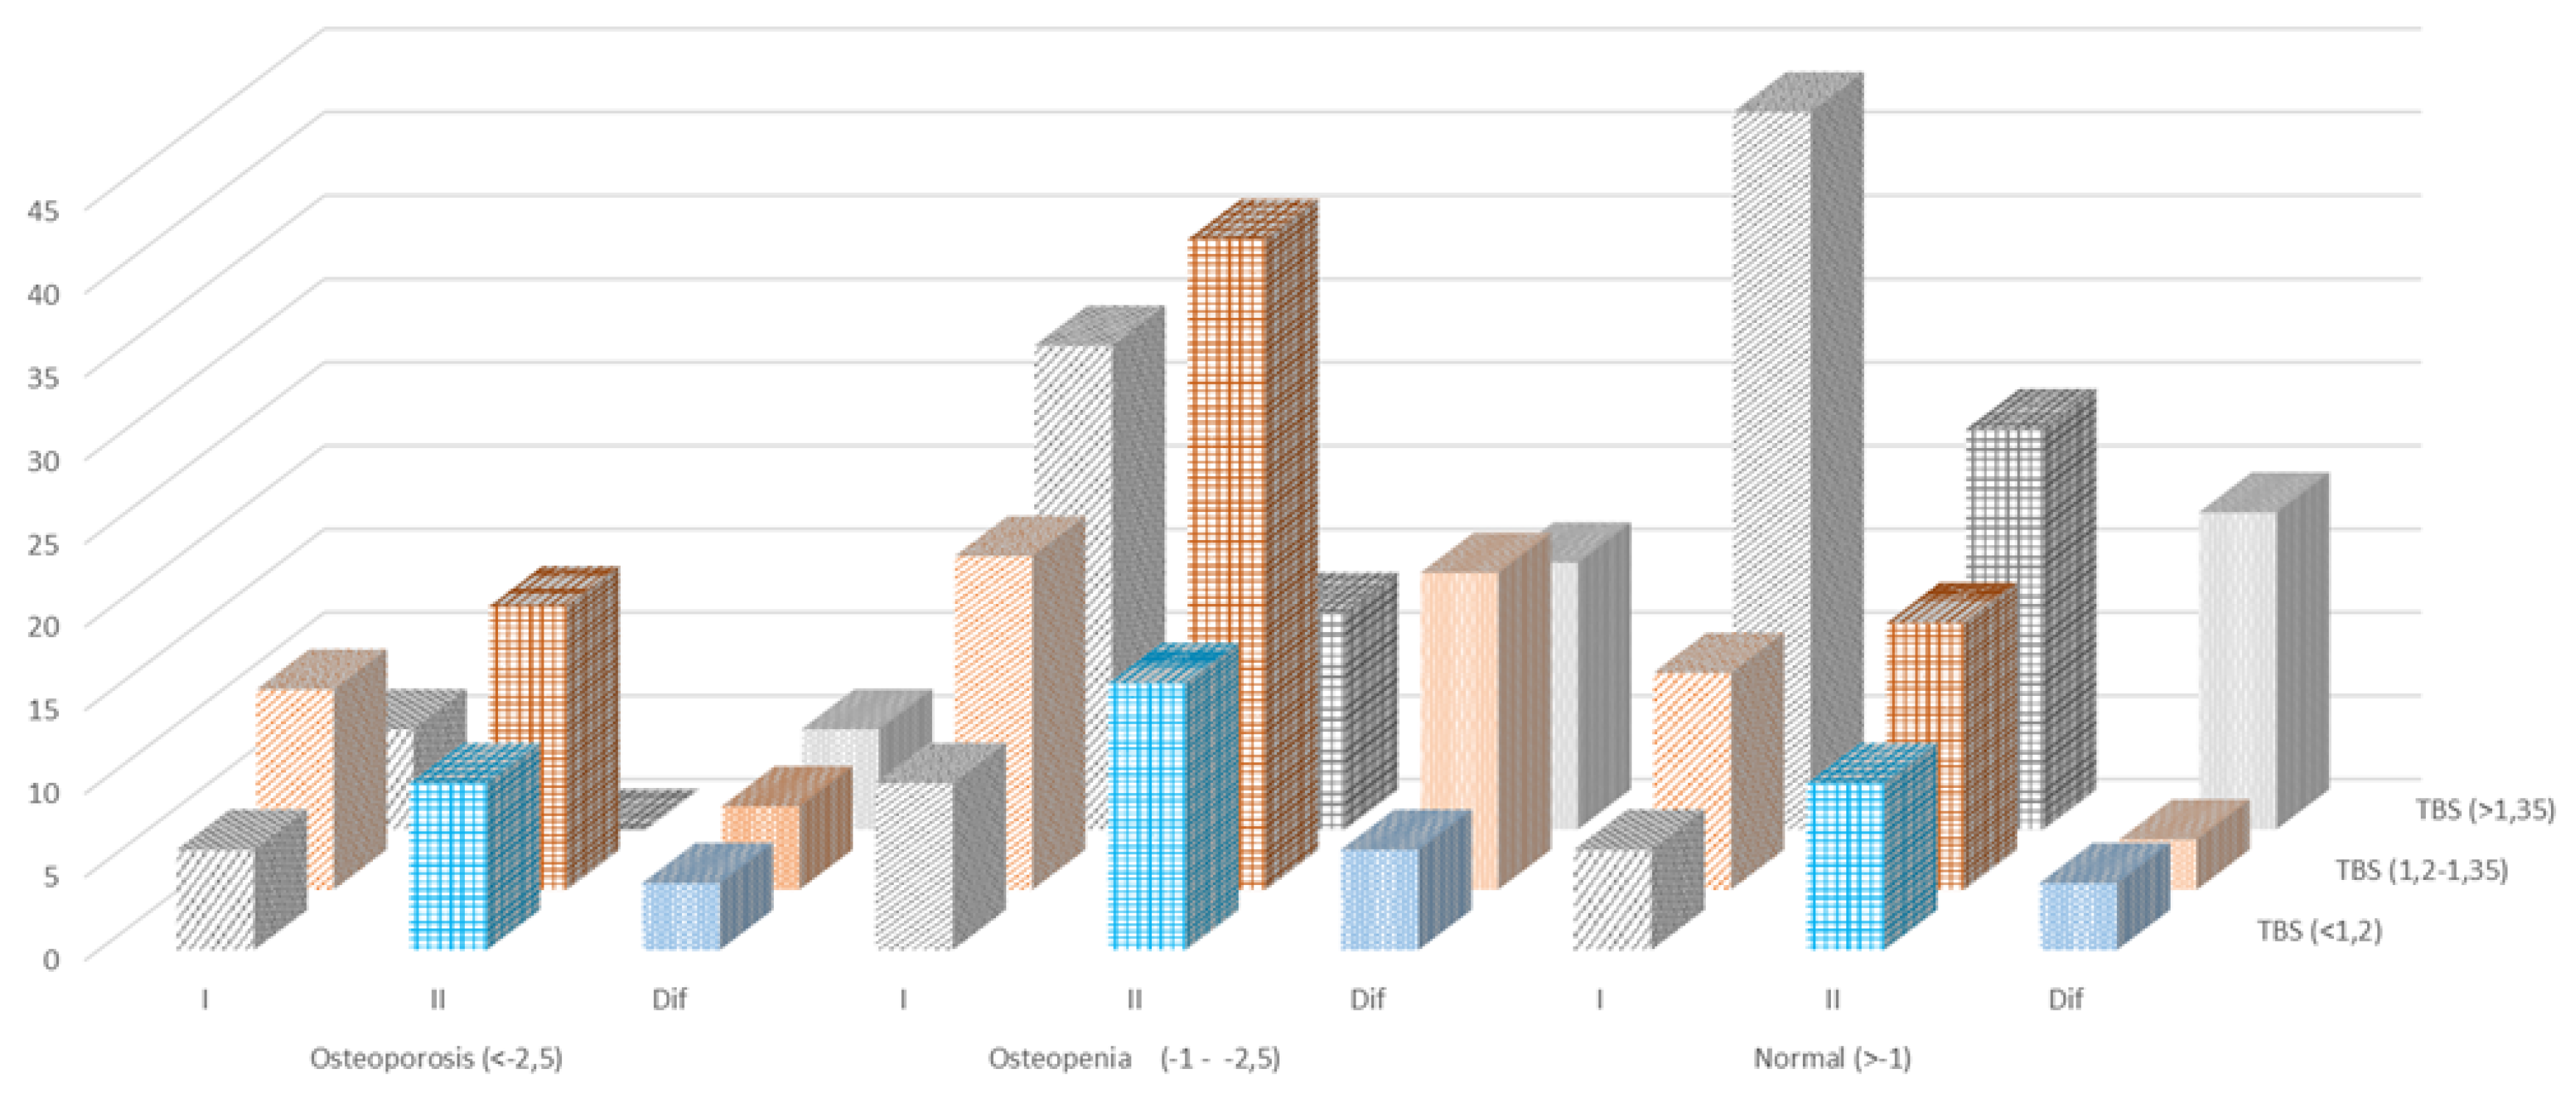
| Methods |
BMD <-2,5 SD osteoporosis |
BMD -1 - -2,5 SD osteopenia |
BMD >-1 SD normal |
||||||
| Initial Study |
End Study |
Difference | Initial Study |
End Study |
Difference | Initial Study |
End Study |
Difference |
|
| TBS (<1,2) degraded |
6 | 10 | -4 | 10 | 16 | -6 |
6 |
10 |
-4 |
| TBS (1,2-1,35) Partially degraded |
12 | 17 | -5 | 20 | 39 | -19 | 13 | 16 | -3 |
| TBS (>1,35) normal |
6 | 0 | 6 | 29 | 13 | 16 | 43 | 24 | 19 |
| Without Vertebral fractures |
With Vertebral fractures |
p | |
| Clinical and hormonal data | |||
| N | 115 | 30 | - |
| Age(years) | 52.0±11.5 | 50.3±13.5 | 0.50 |
| BMI | 26.6 (24.5-30.3) | 25.8 (22.8-28.7) | 0.32 |
| Menarchia (years) | 12.95 | 12.96 | 0.97 |
| Histology Papilar Follicular Others |
89 (85.%) 13 (11%) 4 (3.4%) |
29(96.6%) 1 (3.3%) 0 (0%) |
0.40 |
| TNM initial stage I II III IV |
81(71.8%) 15 (13.2%) 13(11.5%) 4 (3.54 |
18 (64.2) 4(14.2%) 6 (21.4%) 0 (0%) |
0.42 |
| Osteoporosis | 13/102 | 4/26 | 0.76 |
| Exercise (walking-minutes) | 55.00(30-60.00) | 30.00(30-45.00) | 0.043 |
| Milk ingestions (mg/day) | 500 (477.50-750) | 500 (250-750) | 0.29 |
| Smoking yes/no | 19/96 | 6/24 | 0.65 |
| Etanol ingestión yes/no | 1/114 | 0/30 | 0.61 |
| Radioactive iodine doses: mCi (range) | 150.00(126-250.000) | 150.00(100-150.00) | 0.042 |
| Serum Biochemical parameters | |||
| TSH (µU/ml) | 0.03 (0.03-0.15) | 0.10 (0.03-0.40) | 0.20 |
| T4L (ng/ml) | 1.64 (0.42) | 1.63 (0.45) | 0.87 |
| Tiroglobulin (ng/ml) | 0.20 (0.00-1.00) | 0.30 (0.00-1,20) | 0.67 |
| Calcium(mg/dl) | 9.26 (0.57) | 9.24 (0.50) | 0.89 |
| Phosphorus(mg/dl) | 3.40 (3.0-3.90) | 3.60 (3.3-4.o) | 0.15 |
| Creatinine(mg/ml) | 0.71 (0,53.0,83) | 0.75 (0.66-0.86) | 0.50 |
| PTH (pg/ml) | 32.4 (0.63-0.83) | 28.4 (24.5-40.6) | 0.45 |
| 2OHD (ng/ml) | 26.08 (17.0-33.4) | 28.2(22.2-33.6) | 0.37 |
| BAO (U/L) | 10.7 7(7,42-13.70) | 11.30(6.39.13.3) | 1.00 |
| Osteocalcin (ng/ml) | 7.08 (4,66-9.89) | 6.20 (3.74-9.2) | 0.30 |
| Densitometric parameters | |||
| L-BMD | 0.91±0,17 | 0.88±o,12 | 0.27 |
| FN-BMD | 0.75±0.14 | 0.72±0.12 | 0.56 |
| TH-BMD | 0.85±0.11 | 0.83±0.12 | 0.63 |
| UDR-BMD | 0.44±0.04 | 0.38±0.06 | 0.12 |
| 1/3RD-BMD | 0,63±0.5 | 0.65±0.5 | 0.72 |
| TBS Normal Partial degraded Degraded |
1.35±0.14 53.9% 29.8% 16.5% |
1.22±0.14 53.3% 33.3% 13.3% |
0.001 |
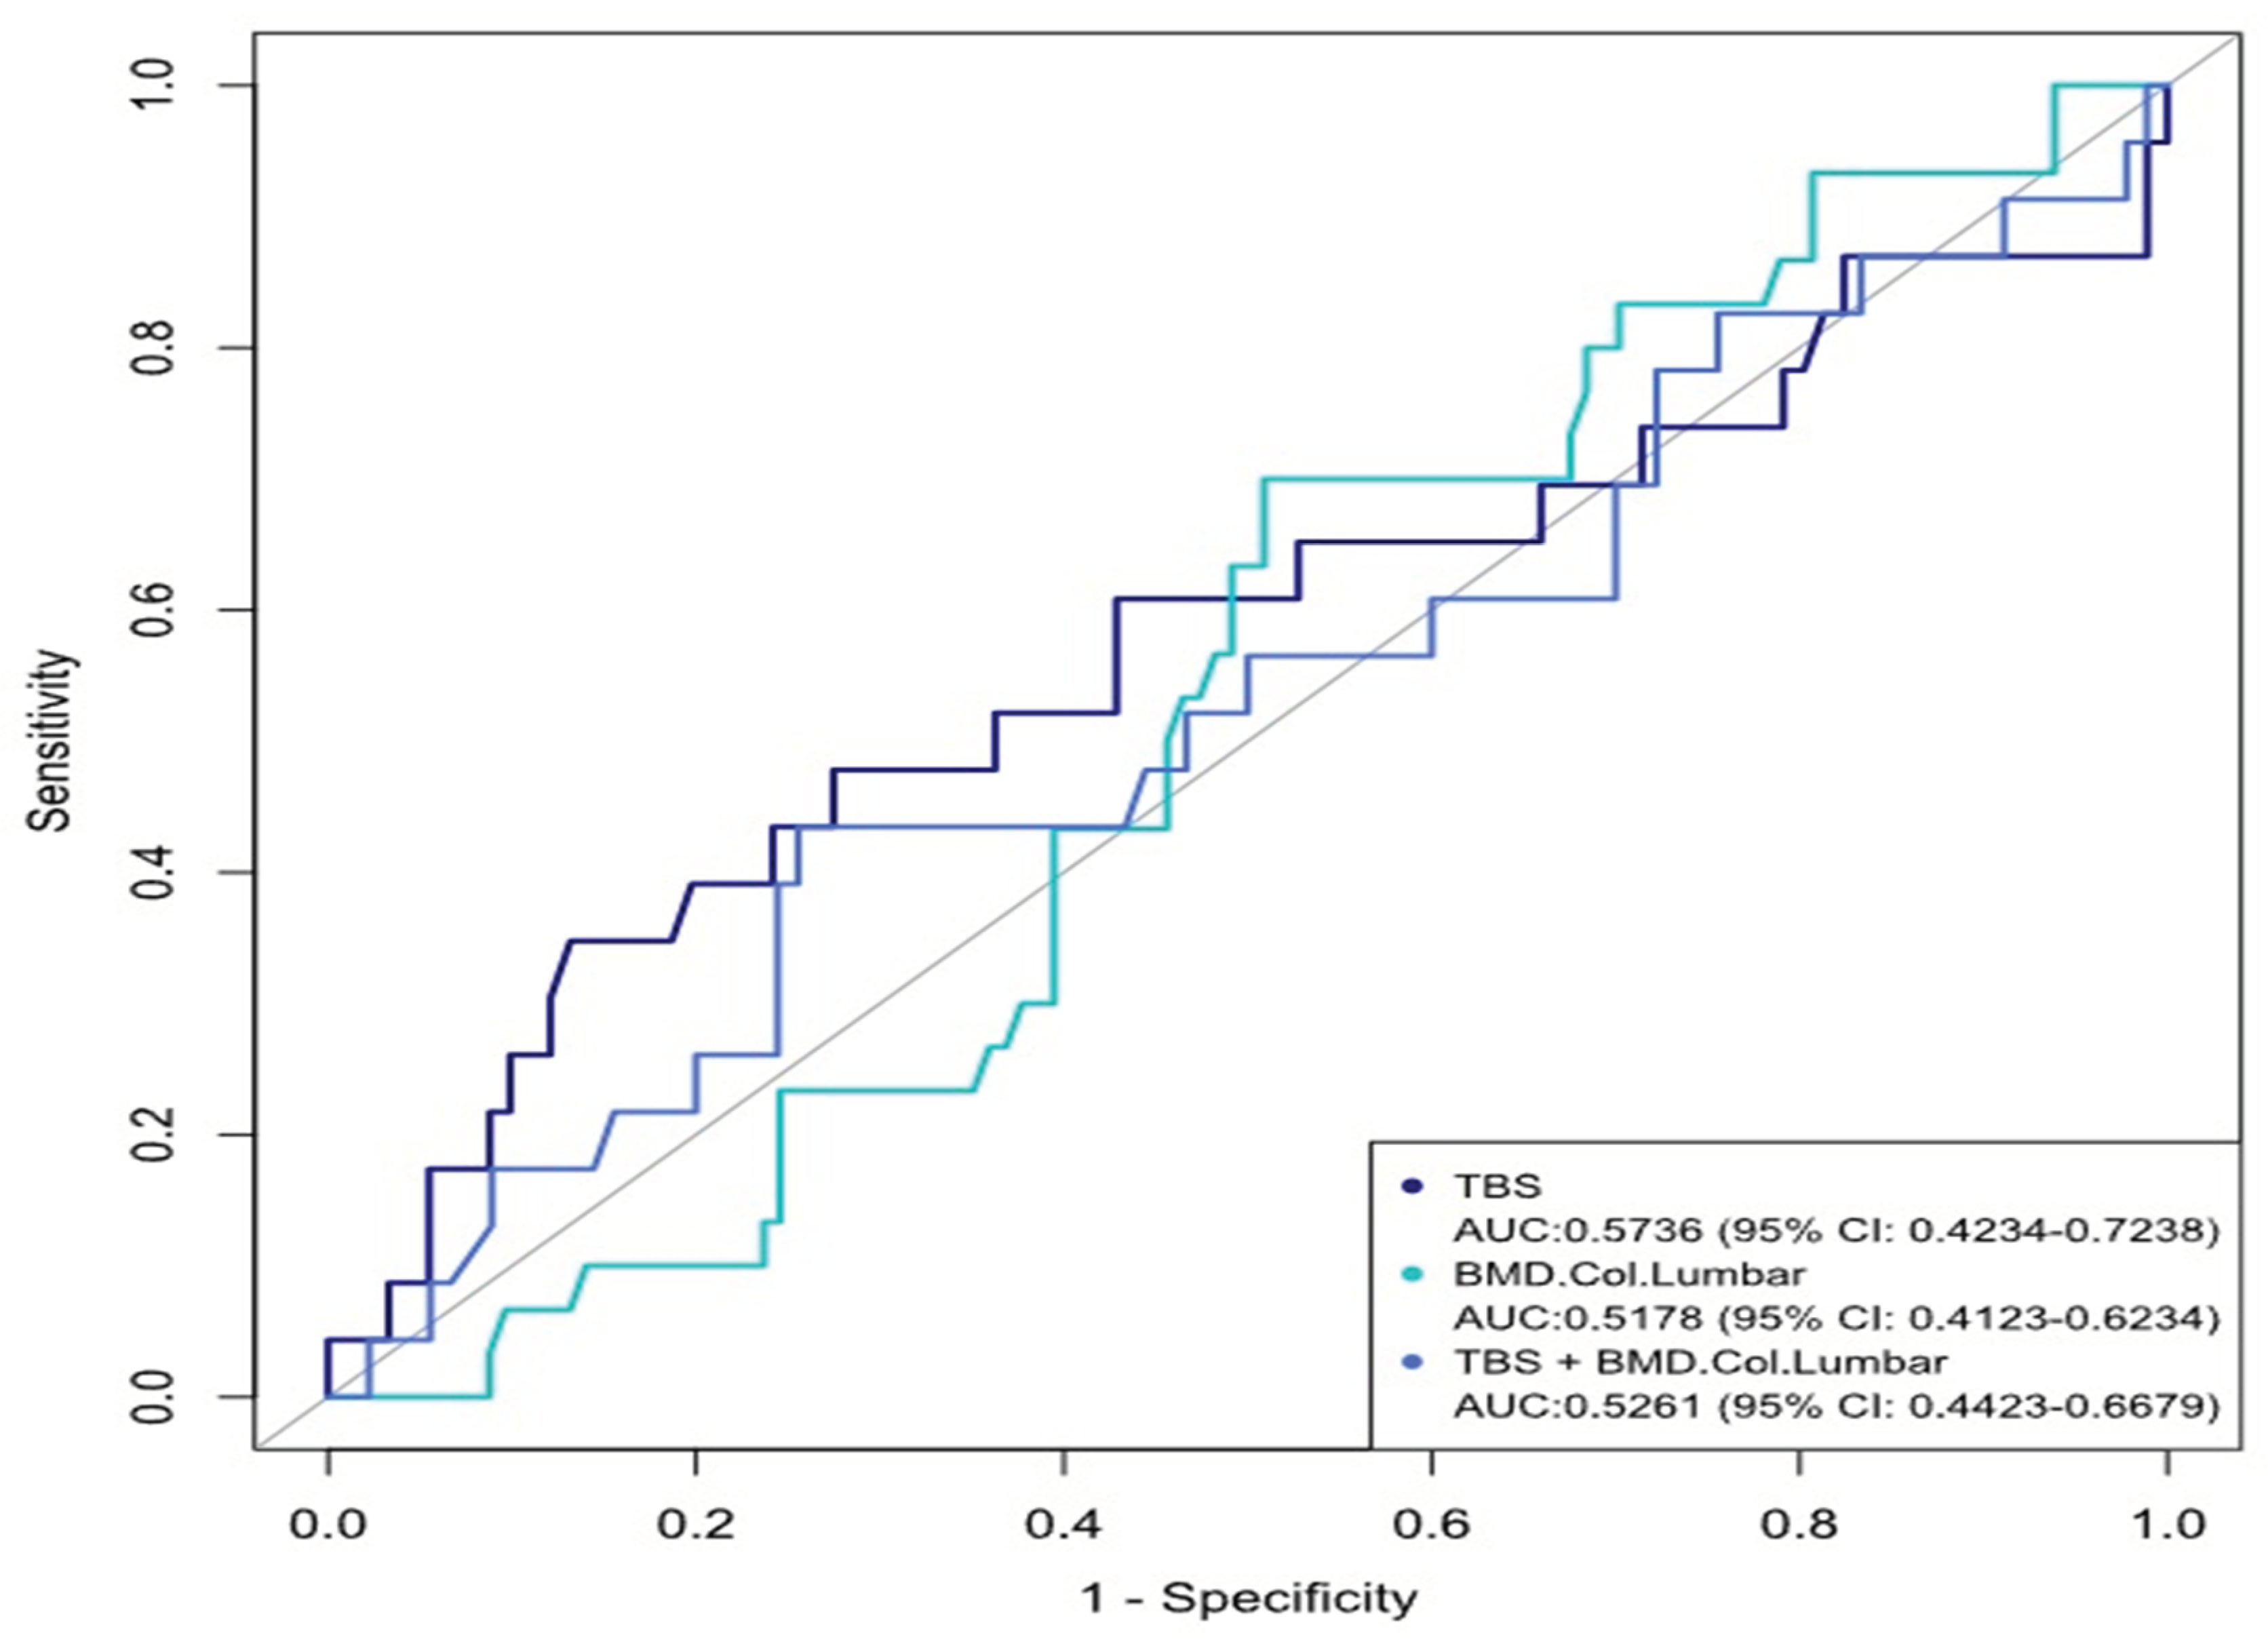
| TBS | ||||
| Partial degraded | Degraded | Normal | Total | |
| DXA -2.5- -1 | 9 (30%) | 5 (16.7%) | 3 (10%) | 17 (56.7%) |
| <.2,5 | 3 (10%) | 0 | 0 | 3 (10%) |
| >-1 | 0 | 2(6.6%) | 8 (26.7%) | 10 (33.3%) |
| Total | 12(40%) | 7 (23.3%) | 11 (36.7%) | 30 (100%) |
Disclaimer/Publisher’s Note: The statements, opinions and data contained in all publications are solely those of the individual author(s) and contributor(s) and not of MDPI and/or the editor(s). MDPI and/or the editor(s) disclaim responsibility for any injury to people or property resulting from any ideas, methods, instructions or products referred to in the content. |
© 2024 by the authors. Licensee MDPI, Basel, Switzerland. This article is an open access article distributed under the terms and conditions of the Creative Commons Attribution (CC BY) license (https://creativecommons.org/licenses/by/4.0/).


