Submitted:
20 March 2024
Posted:
22 March 2024
You are already at the latest version
Abstract
Keywords:
1. Introduction
2. Materials and Methods
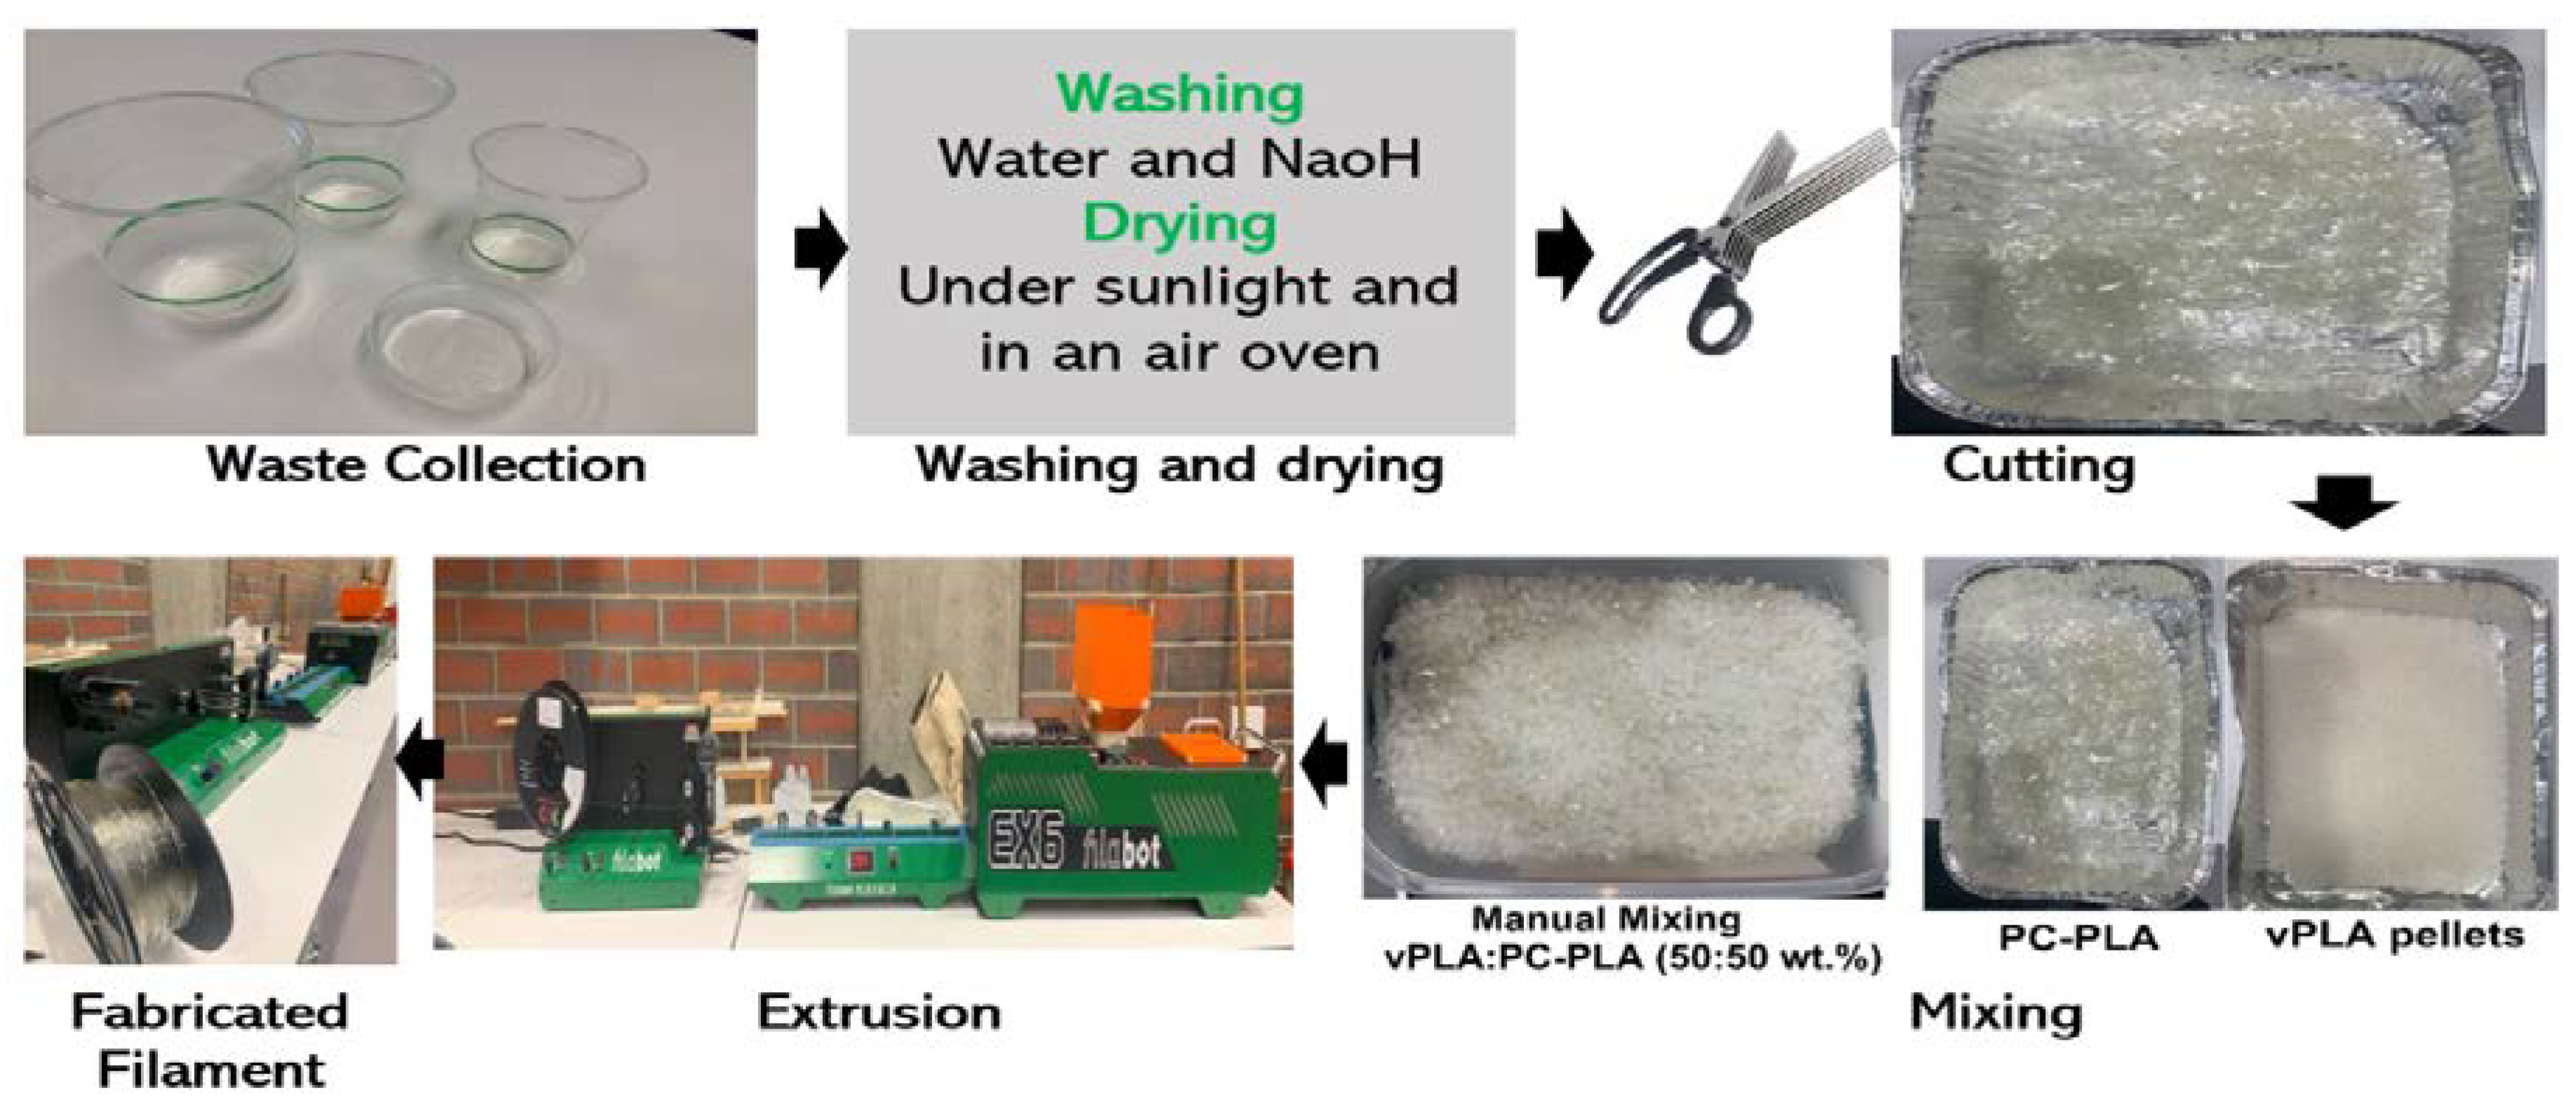
2.1. Preparation of Raw Materials
2.2. Filament Extrusion
2.3. FDM Printing of Specimens
| Experimental run | Coded matrix | Un-coded matrix | ||||
|---|---|---|---|---|---|---|
| A | B | C | Layer height (mm) | Infill (%) | Nozzle temperature (°C) | |
| 1 | 1 | 1 | 1 | 0.1 | 60 | 195 |
| 2 | 1 | 2 | 2 | 0.1 | 80 | 205 |
| 3 | 1 | 3 | 3 | 0.1 | 100 | 215 |
| 4 | 2 | 1 | 2 | 0.2 | 60 | 205 |
| 5 | 2 | 2 | 3 | 0.2 | 80 | 215 |
| 6 | 2 | 3 | 1 | 0.2 | 100 | 195 |
| 7 | 3 | 1 | 3 | 0.3 | 60 | 215 |
| 8 | 3 | 2 | 1 | 0.3 | 80 | 195 |
| 9 | 3 | 3 | 2 | 0.3 | 100 | 205 |
| Parameter | Specific parameter | Values (constant) |
|---|---|---|
| Layer | Shell thickness | 2 mm |
| Extruder | Extrusion width | 0.4 mm |
| Retraction speed | 40 mm/s | |
| Infill | Infill pattern | Rectilinear |
| Speed | Printing speed | 50 mm/s |
| Infill speed | 50 mm/s | |
| Support | Support structure | None |
| Platform addition | None | |
| Temperature | Heat bed temperature | 45°C |
2.4. Mechanical Testing and Material Characterisation
2.5. Optimisation of Process Parameters
2.6. DoE Confirmation Test
2.7. Statistical Analysis
2.8. Comparative Analysis
3. Results and Discussions
3.1. Surface Roughness
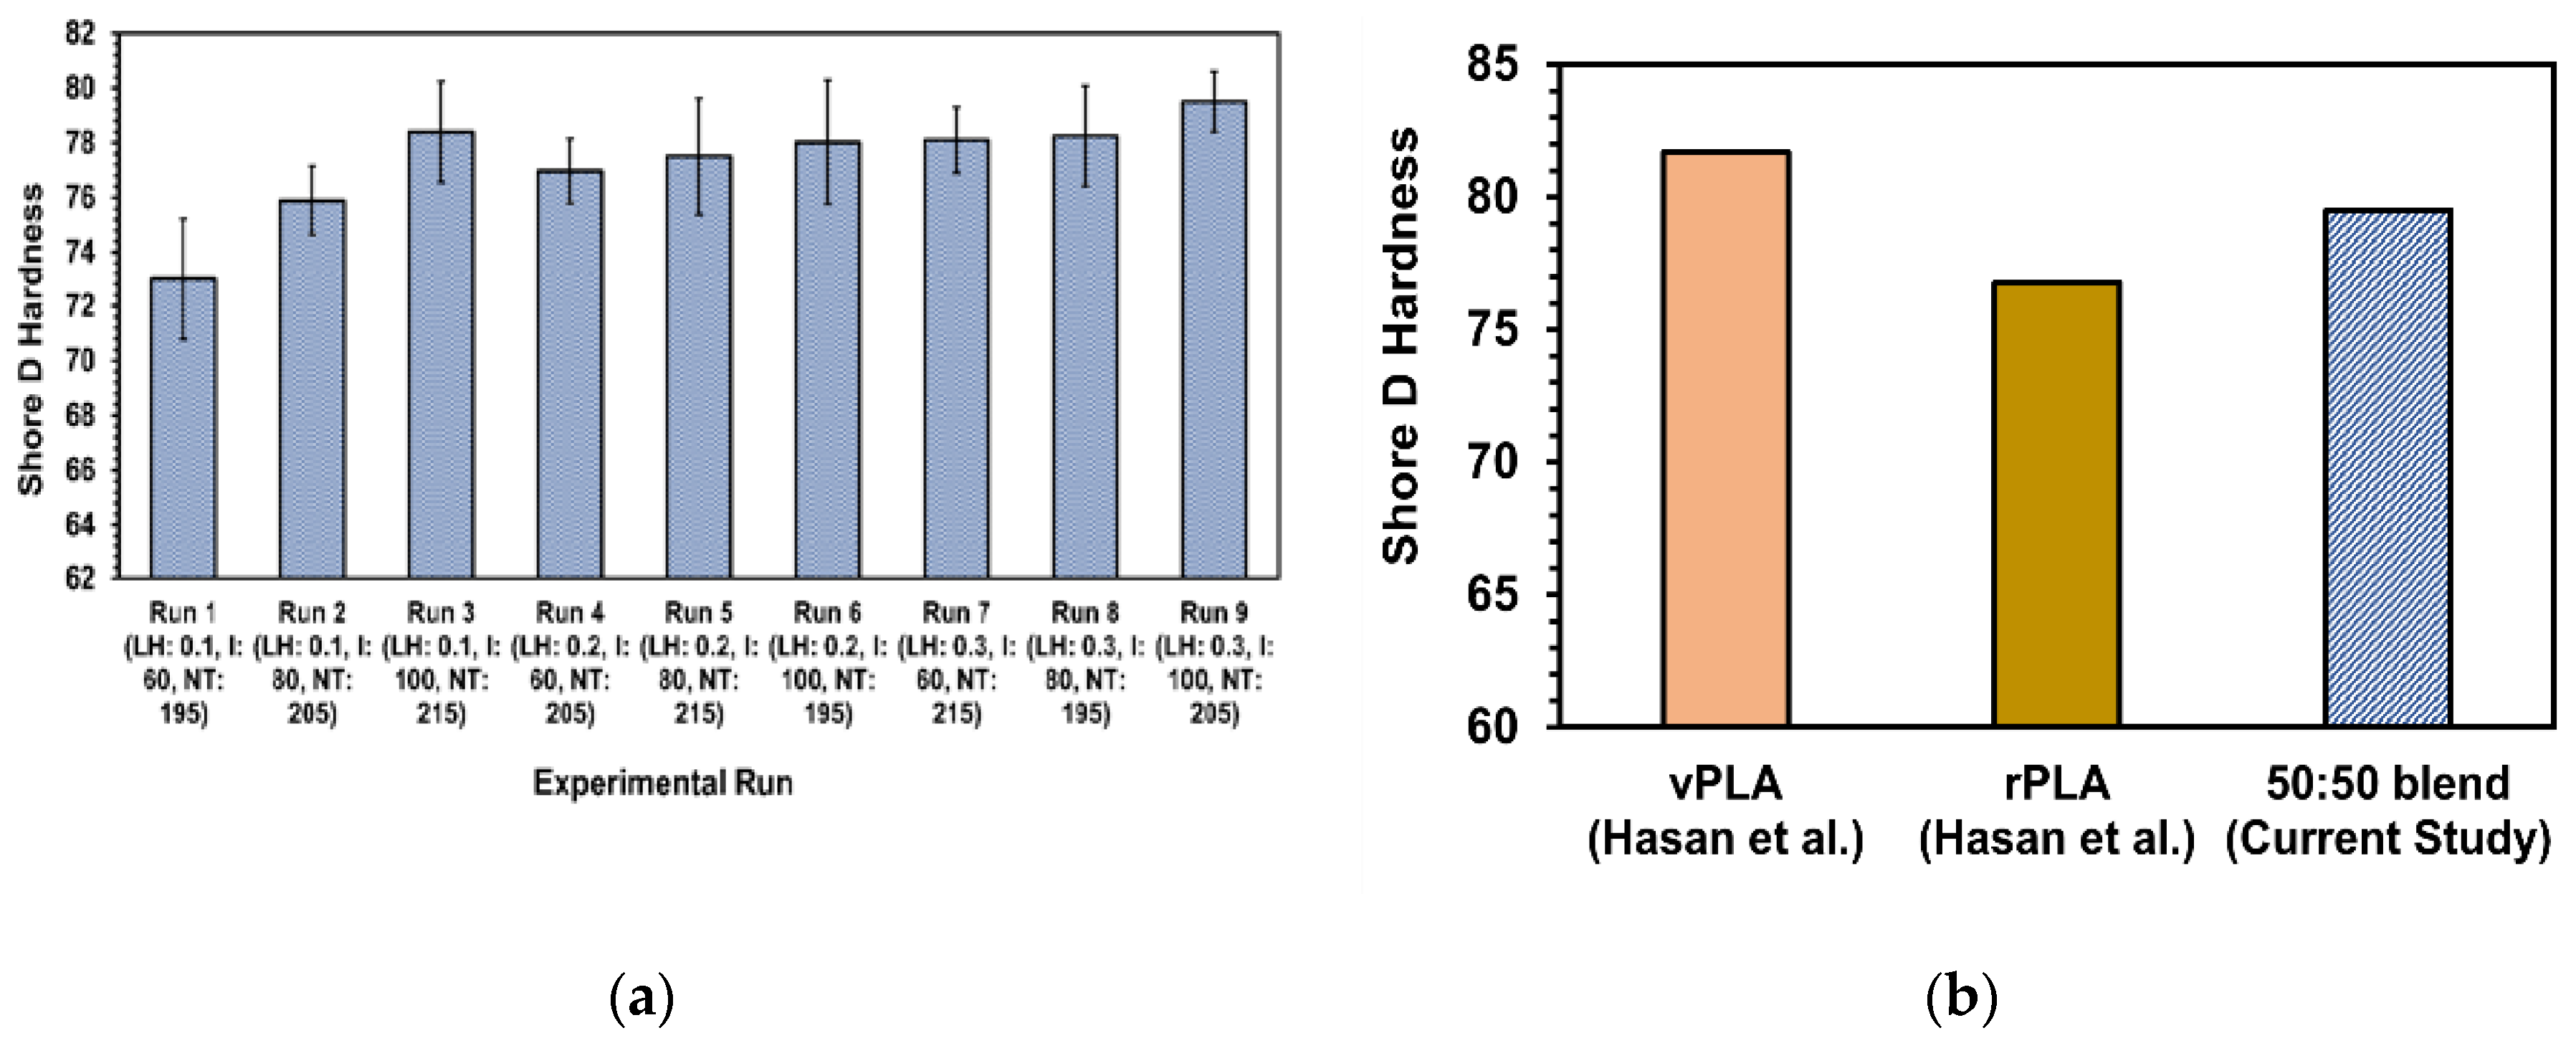
3.2. Hardness
3.3. Tensile Behaviour
3.4. Flexural Behaviour
3.5. Impact Behaviour
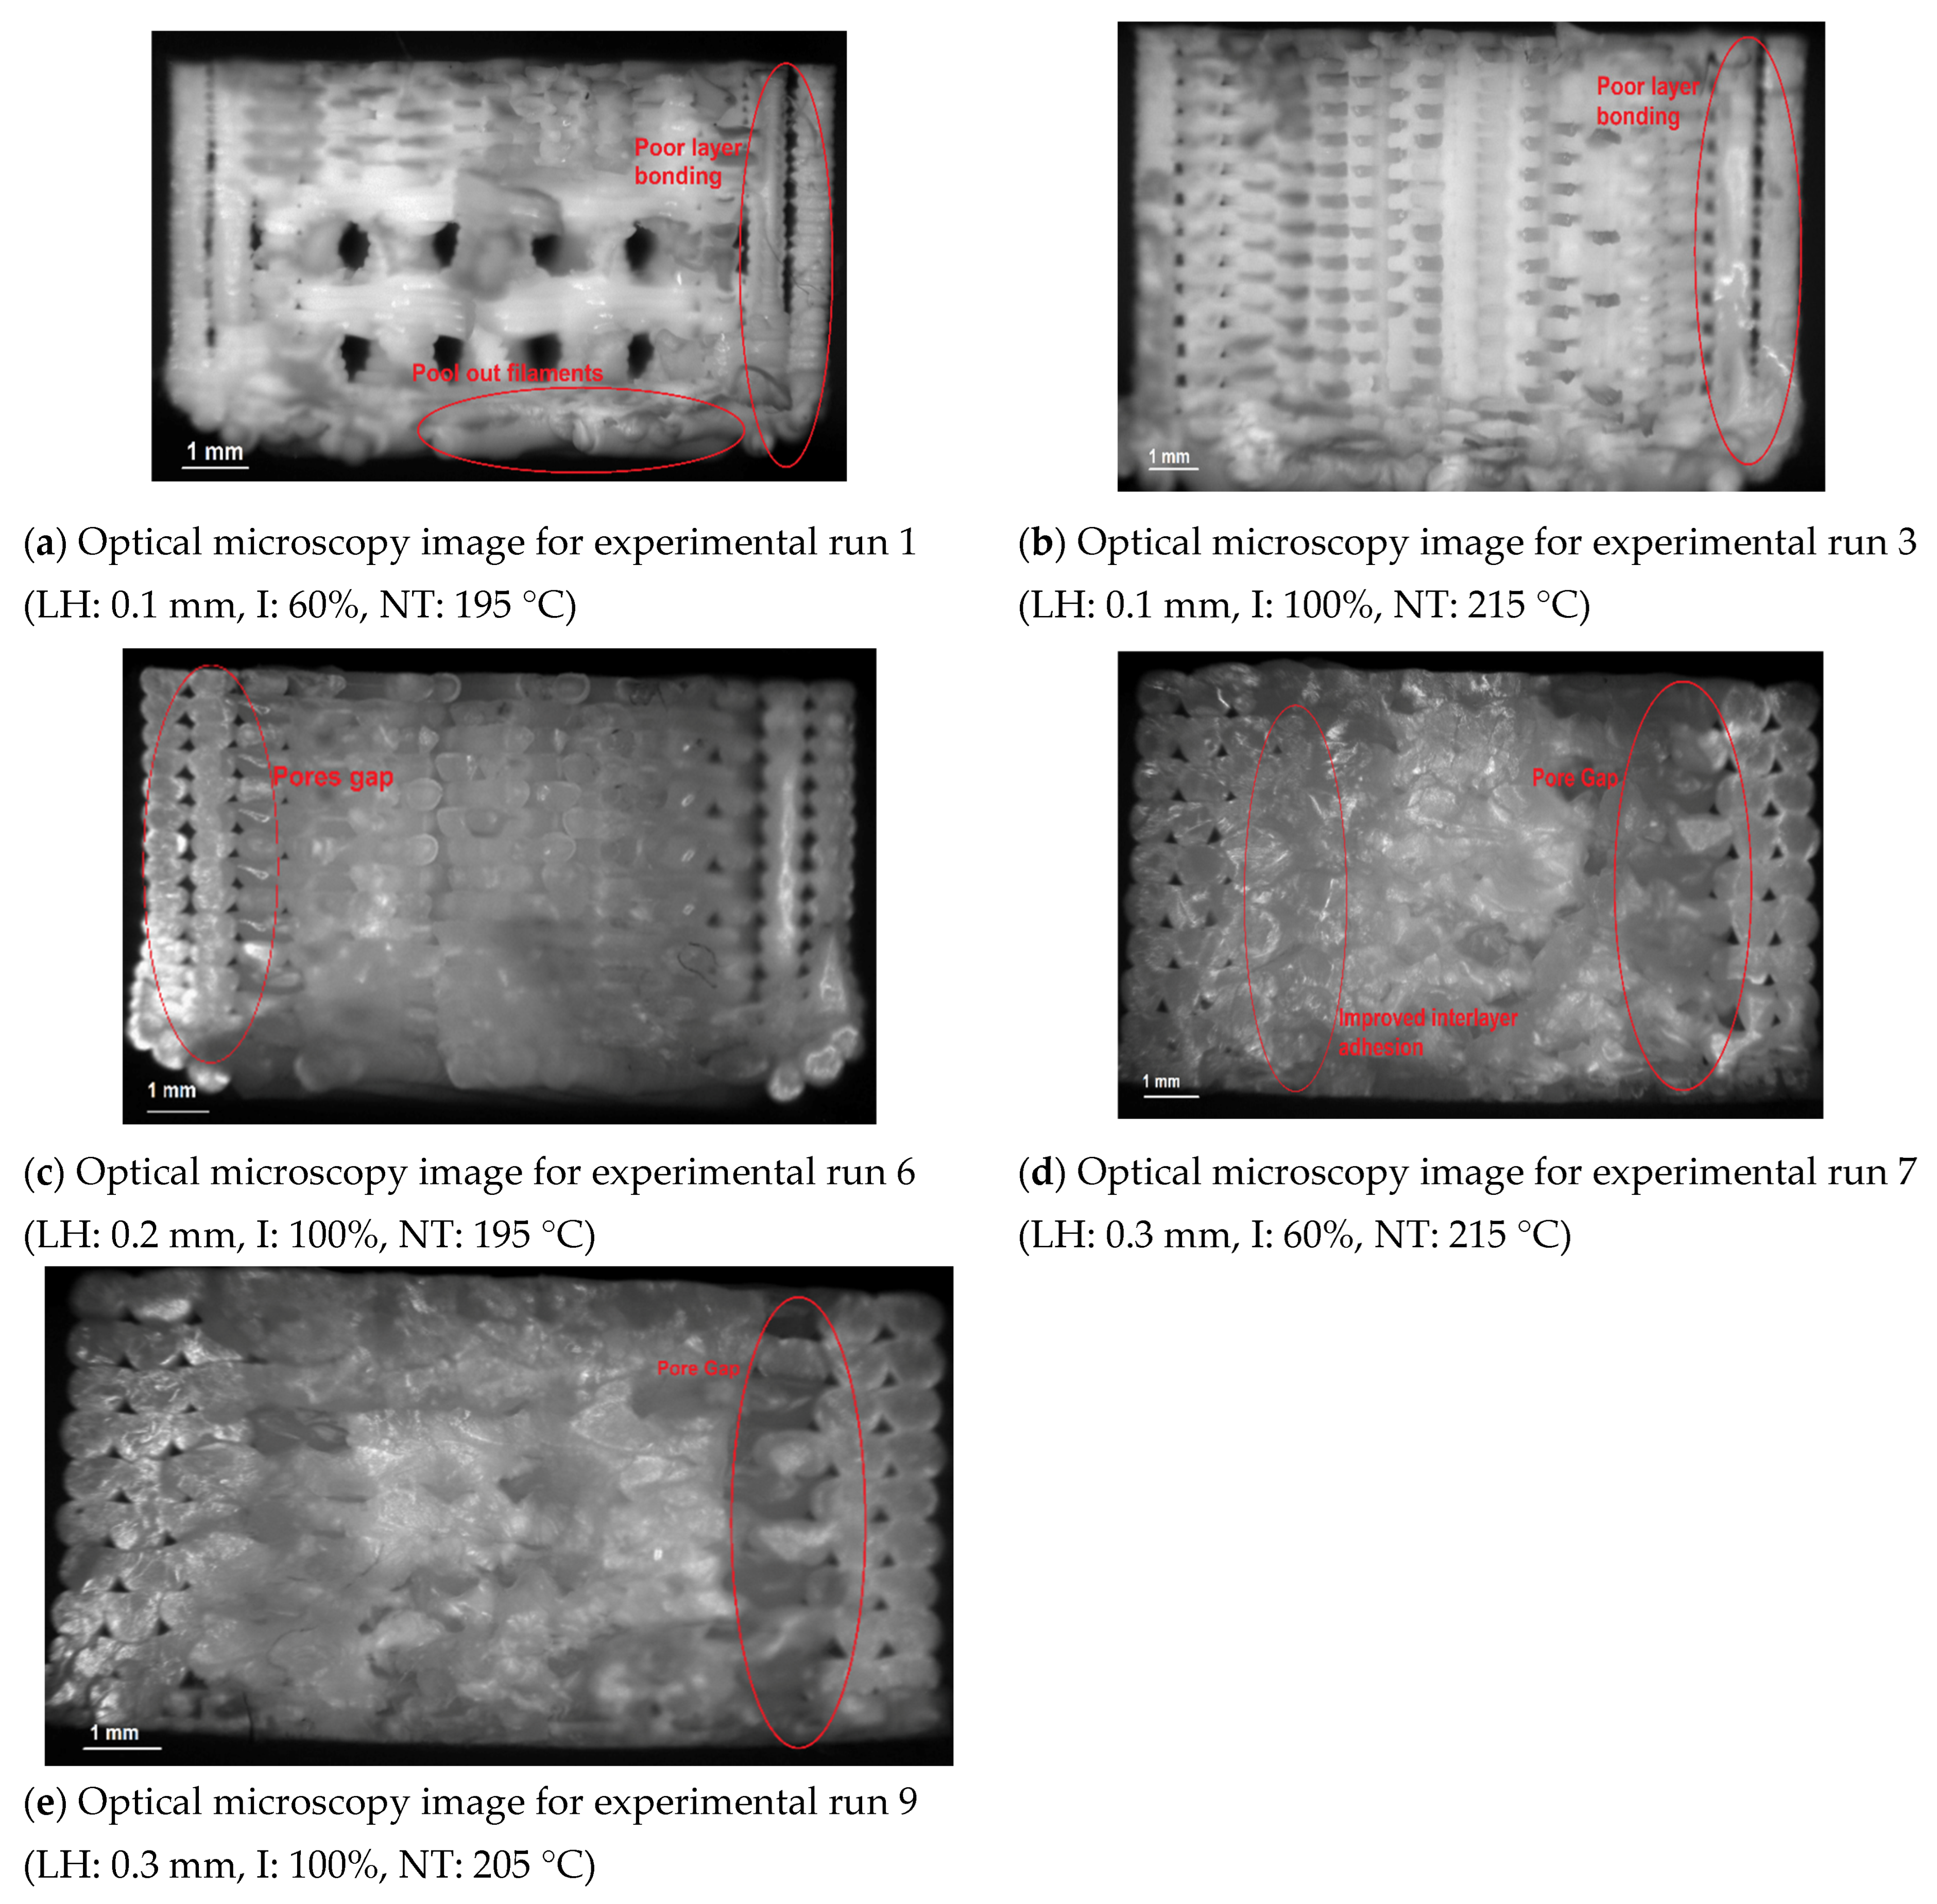
3.6. Fractography Analysis
3.7. Optimisation of Process Parameters

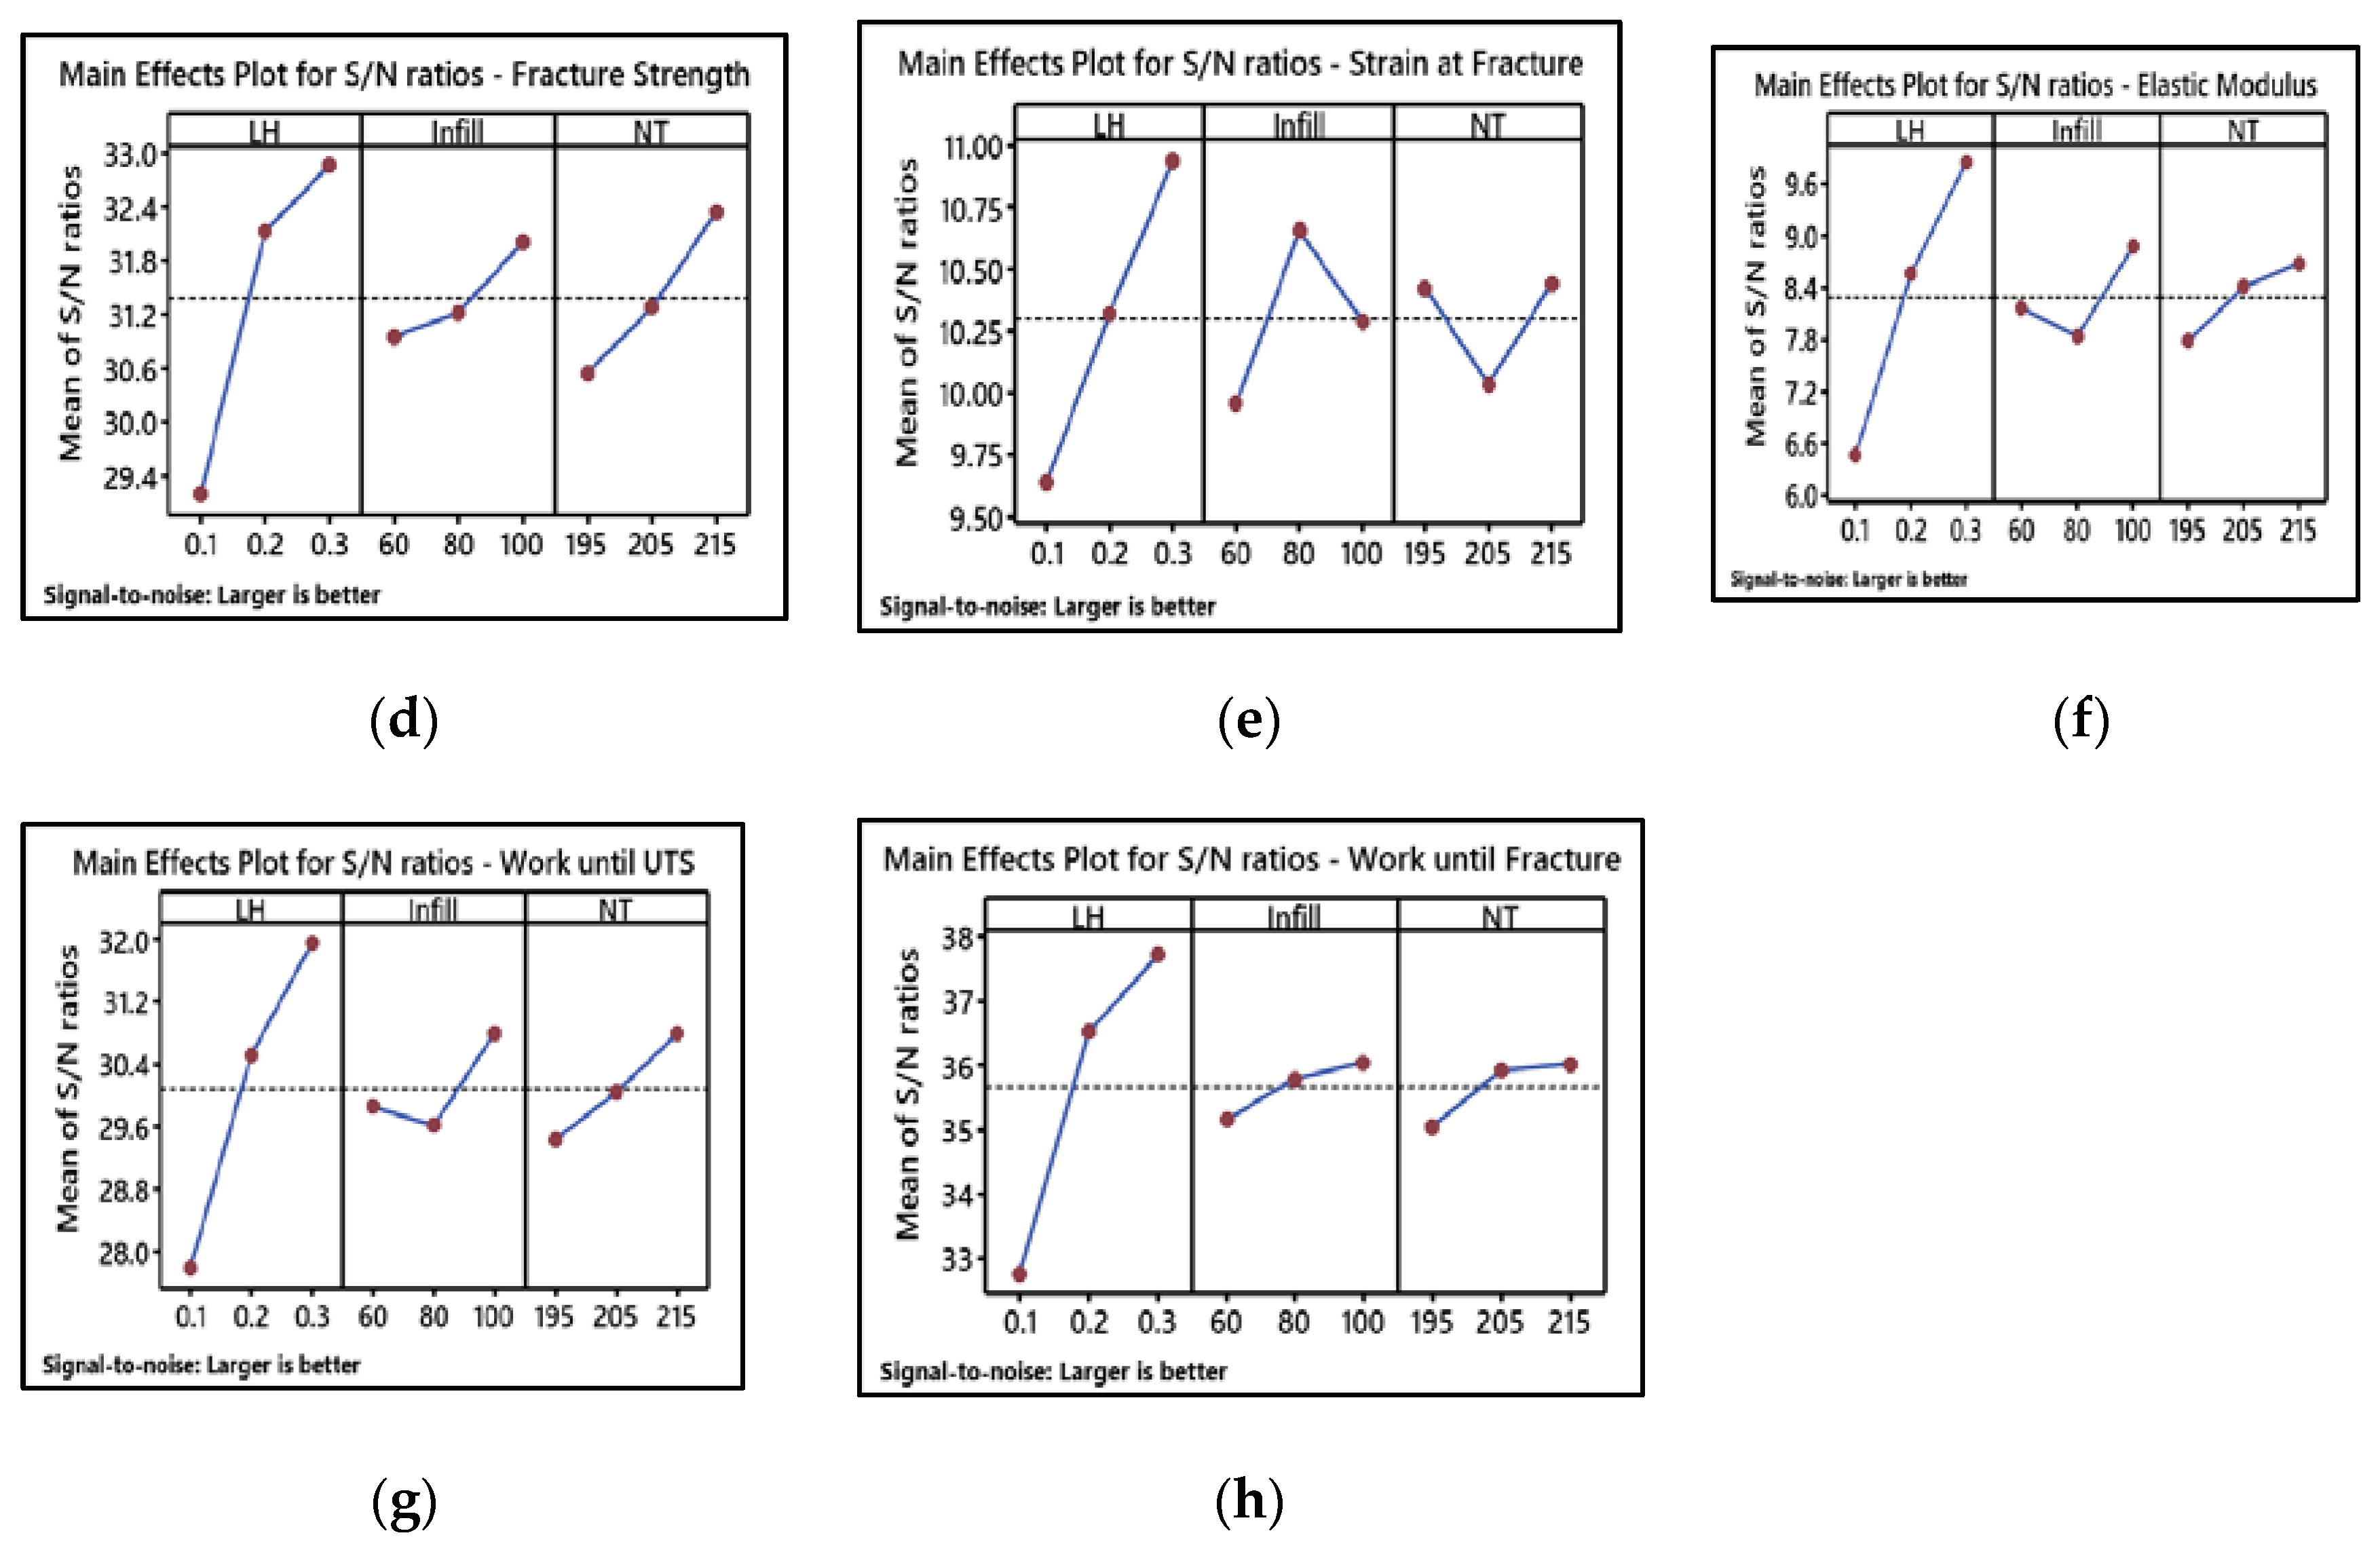
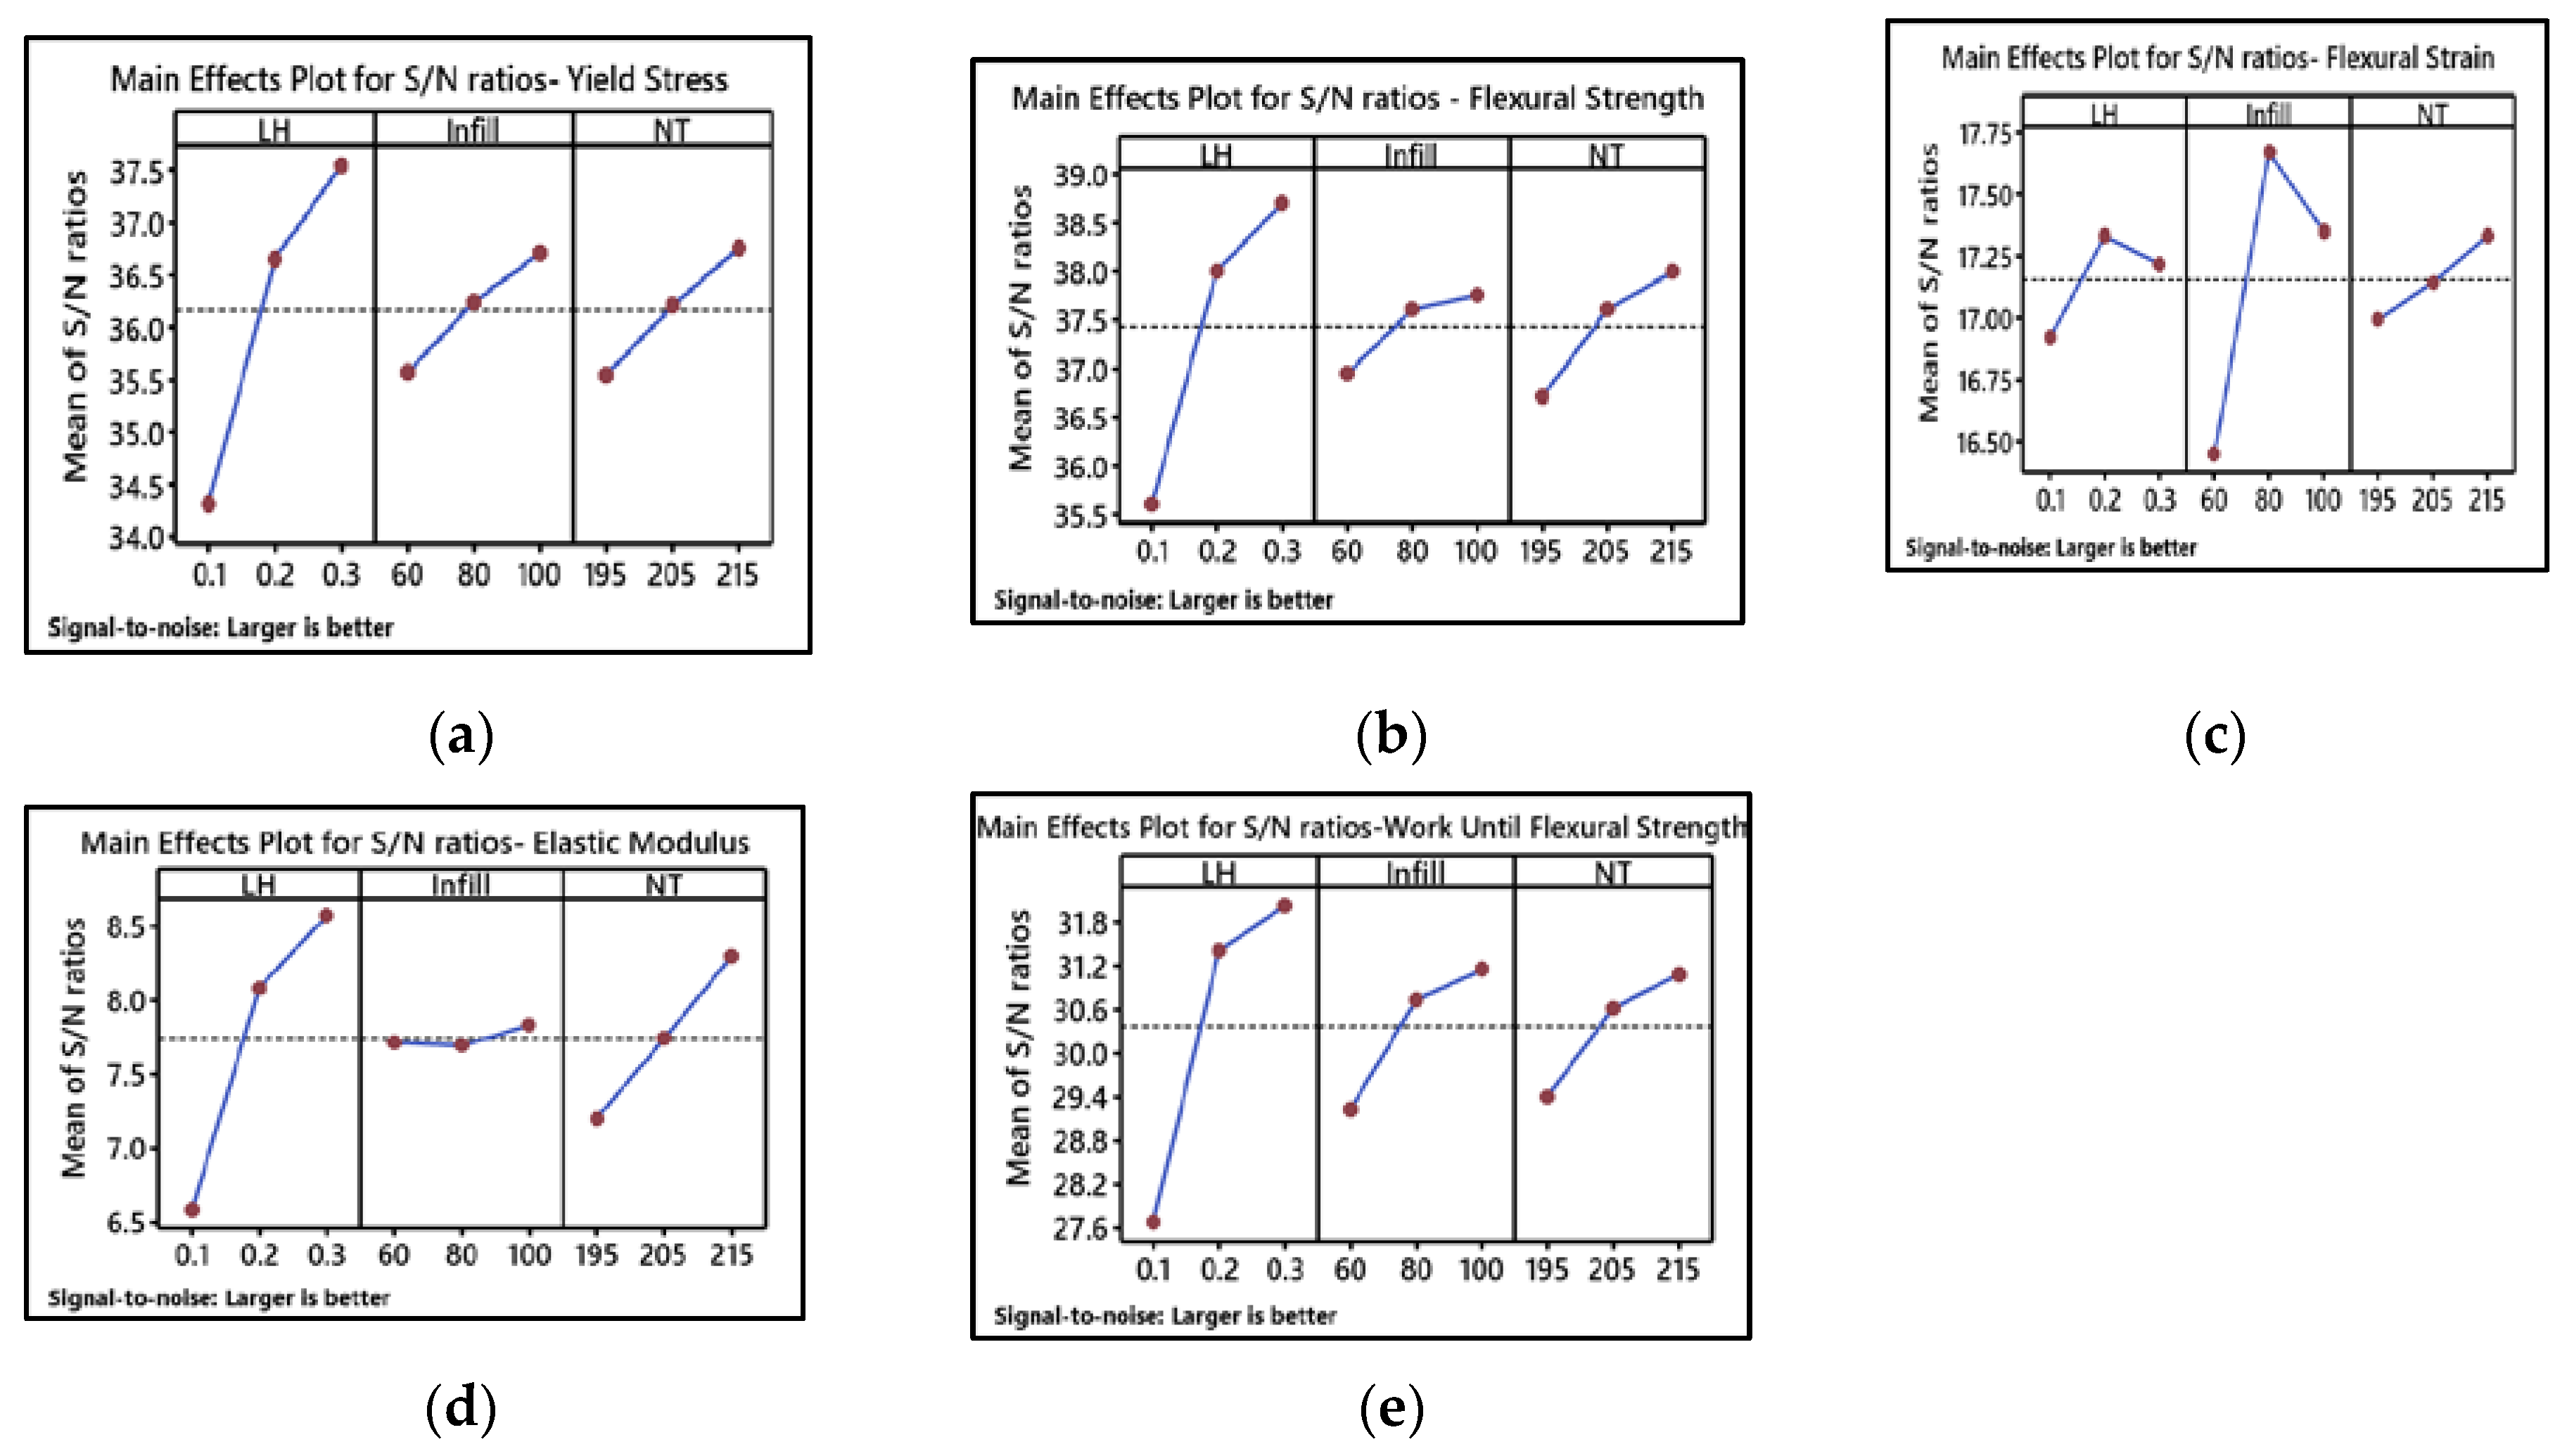
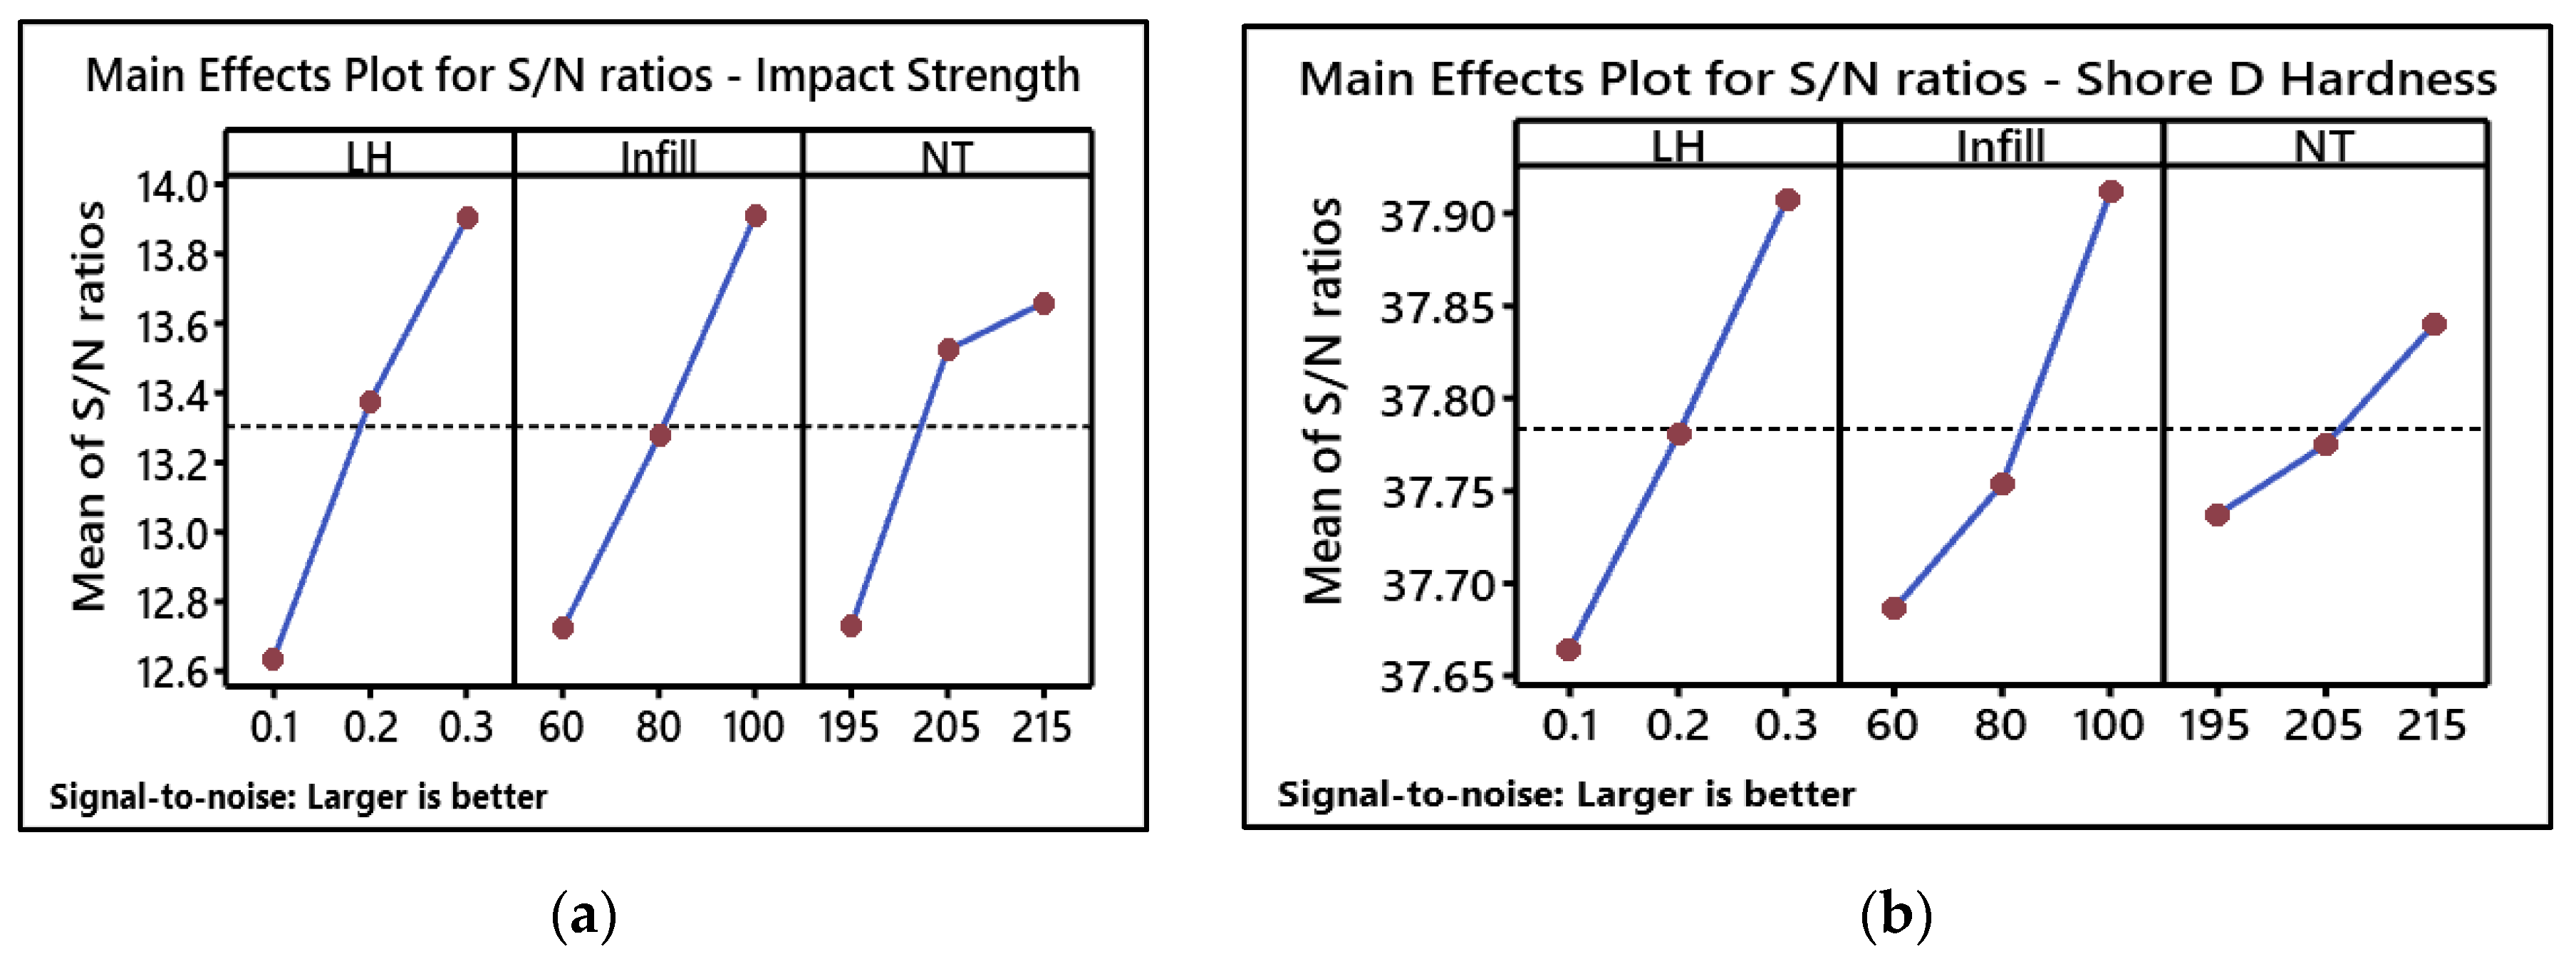
Analysis of Variance (ANOVA) Assessment
| Response | Source | DF | Seq SS | Adj SS | Adj MS | F-Value | P-Value | % contribution |
|---|---|---|---|---|---|---|---|---|
| Tensile strength | LH | 2 | 22.75 | 22.75 | 11.37 | 40.87 | 0.024 | 83.24 |
| Infill | 2 | 1.78 | 1.78 | 0.89 | 3.21 | 0.238 | 6.54 | |
| NT | 2 | 2.23 | 2.23 | 1.12 | 4.01 | 0.199 | 8.18 | |
| Residual error | 2 | 0.55 | 0.55 | 0.28 | 2.04 | |||
| Total | 8 | 27.31 | 100.00 | |||||
| Flexural strength | LH | 2 | 15.87 | 15.87 | 7.93 | 66.19 | 0.015 | 79.89 |
| Infill | 2 | 1.12 | 1.12 | 0.56 | 4.68 | 0.176 | 5.65 | |
| NT | 2 | 2.63 | 2.63 | 1.31 | 10.98 | 0.083 | 13.25 | |
| Residual error | 2 | 0.24 | 0.24 | 0.11 | 1.21 | |||
| Total | 8 | 19.87 | 100.00 | |||||
| Impact strength | LH | 2 | 2.13 | 2.13 | 1.07 | 15.89 | 0.059 | 34.28 |
| Infill | 2 | 2.45 | 2.45 | 1.22 | 18.26 | 0.052 | 39.19 | |
| NT | 2 | 1.52 | 1.52 | 0.76 | 11.33 | 0.081 | 24.38 | |
| Residual error | 2 | 0.13 | 0.13 | 0.07 | 2.15 | |||
| Total | 8 | 6.24 | 100.00 | |||||
| Shore D hardness | LH | 2 | 0.09 | 0.09 | 0.04 | 12.7 | 0.073 | 46.29 |
| Infill | 2 | 0.08 | 0.08 | 0.04 | 11.44 | 0.08 | 41.69 | |
| NT | 2 | 0.02 | 0.02 | 0.01 | 2.3 | 0.303 | 8.37 | |
| Residual error | 2 | 0.01 | 0.01 | 0.00 | 3.64 | |||
| Total | 8 | 0.19 | 100.00 | |||||
| Surface roughness | LH | 2 | 41.56 | 41.56 | 20.78 | 97.84 | 0.01 | 68.47 |
| Infill | 2 | 1.26 | 1.26 | 0.63 | 2.97 | 0.252 | 2.08 | |
| NT | 2 | 17.45 | 17.45 | 8.73 | 41.08 | 0.024 | 28.75 | |
| Residual error | 2 | 0.42 | 0.42 | 0.21 | 0.70 | |||
| Total | 8 | 60.70 | 100.00 |
3.8. Confirmation Test
| Output Response | Prediction | Confirmation | ||
|---|---|---|---|---|
| S/Npredicted | C.Ipredicted | S/Nconfirmation | C.Iconfirmation | |
| Tensile Strength | 34.67 | ± 2.58 | 35.81 | ± 1.52 |
| Flexural Strength | 39.58 | ± 4.19 | 40.34 | ± 2.51 |
| Impact Strength | 14.62 | ± 0.16 | 14.97 | ± 0.15 |
| Shore D Hardness | 38.14 | ± 0.70 | 38.23 | ± 1.05 |
| Surface Roughness | − 14.94 | ± 1.07 | − 5.90 | ± 1.32 |
4. Comparison between 100% PC-PLA and vPLA:PC-PLA (50:50) Blended Specimens
5. Conclusions and Future Work
Author Contributions
Funding
Data Availability Statement
Acknowledgments
Conflicts of Interest
References
- Mishra, V.; Ror, C.K.; Negi, S.; Kar, S.; Borah, L.N. Development of sustainable 3D printing filaments using recycled/virgin ABS blends: Processing and characterization. Polymer Engineering & Science 2023, 63, 1890–1899. [Google Scholar] [CrossRef]
- Belioka, M.P.; Markozanne, G.; Chrissopoulou, K.; Achilias, D.S. Advanced Plastic Waste Recycling-The Effect of Clay on the Morphological and Thermal Behavior of Recycled PET/PLA Sustainable Blends. Polymers 2023, 15, 3145. [Google Scholar] [CrossRef]
- Bioplastics, E. Bioplastics facts and figures. In Berlin, 2023.
- Pinho, A.C.; Amaro, A.M.; Piedade, A.P. 3D printing goes greener: Study of the properties of post-consumer recycled polymers for the manufacturing of engineering components. Waste Manag 2020, 118, 426–434. [Google Scholar] [CrossRef]
- Björklund, A.; Finnveden, G. Recycling revisited—life cycle comparisons of global warming impact and total energy use of waste management strategies. Resources, Conservation and Recycling 2005, 44, 309–317. [Google Scholar] [CrossRef]
- Singh, S.; Ramakrishna, S. Recycling of Thermoplastic Wastes: A Route of Waste to Wealth Via Three-Dimensional Printing. In Encyclopedia of Materials: Plastics and Polymers; 2022; pp. 510–515. [Google Scholar]
- Fernández, P.; Marqués, R.; Beltrán, N.; Puerto, B.; Blanco, D. Using PETG/rPET Blends in Fused Particle Fabrication: Analysis of Feasibility and Mechanical Behaviour. In 10th Manufacturing Engineering Society International Conference (MESIC 2023); 2023; pp. 147–154. [Google Scholar] [CrossRef]
- Cestari, S.P.; Martin, P.J.; Hanna, P.R.; Kearns, M.P.; Mendes, L.C.; Millar, B. Use of virgin/recycled polyethylene blends in rotational moulding. Journal of Polymer Engineering 2021, 41, 509–516. [Google Scholar] [CrossRef]
- Suárez-Eiroa, B.; Fernández, E.; Méndez-Martínez, G.; Soto-Oñate, D. Operational principles of circular economy for sustainable development: Linking theory and practice. Journal of cleaner production 2019, 214, 952–961. [Google Scholar] [CrossRef]
- Hadi, A.J.; Najmuldeen, G.F.; Yusoh, K.B. Dissolution/reprecipitation technique for waste polyolefin recycling using new pure and blend organic solvents. Journal of Polymer Engineering 2013, 33, 471–481. [Google Scholar] [CrossRef]
- Kamalian, P.; Khorasani, S.N.; Abdolmaleki, A.; Karevan, M.; Khalili, S.; Shirani, M.; Neisiany, R.E. Toward the development of polyethylene photocatalytic degradation. Journal of Polymer Engineering 2020, 40, 181–191. [Google Scholar] [CrossRef]
- Sirisinha, K.; Wirasate, S.; Sirisinha, C.; Wattanakrai, N. One-Pot Reactive Melt Recycling of PLA Post-Consumer Waste for the Production of Block Copolymer Nanocomposites of High Strength and Ductility. Polymers 2022, 14, 3642. [Google Scholar] [CrossRef]
- Webb, H.; Arnott, J.; Crawford, R.; Ivanova, E. Plastic Degradation and Its Environmental Implications with Special Reference to Poly(ethylene terephthalate). Polymers 2012, 5, 1–18. [Google Scholar] [CrossRef]
- Torres, N.; Robin, J.; Boutevin, B. Study of thermal and mechanical properties of virgin and recycled poly (ethylene terephthalate) before and after injection molding. European Polymer Journal 2000, 36, 2075–2080. [Google Scholar] [CrossRef]
- Hopewell, J.; Dvorak, R.; Kosior, E. Plastics recycling: challenges and opportunities. Philosophical Transactions of the Royal Society B: Biological Sciences 2009, 364, 2115–2126. [Google Scholar] [CrossRef] [PubMed]
- Huang, Y.; Leu, M.C.; Mazumder, J.; Donmez, A. Additive Manufacturing: Current State, Future Potential, Gaps and Needs, and Recommendations. Journal of Manufacturing Science and Engineering 2015, 137. [Google Scholar] [CrossRef]
- Ferreira, R.T.L.; Amatte, I.C.; Dutra, T.A.; Bürger, D. Experimental characterization and micrography of 3D printed PLA and PLA reinforced with short carbon fibers. Composites Part B: Engineering 2017, 124, 88–100. [Google Scholar] [CrossRef]
- Jayawardane, H.; Davies, I.J.; Gamage, J.R.; John, M.; Biswas, W.K. Sustainability perspectives—a review of additive and subtractive manufacturing. Sustainable Manufacturing and Service Economics 2023, 2. [Google Scholar] [CrossRef]
- Hidalgo-Carvajal, D.; Munoz, A.H.; Garrido-Gonzalez, J.J.; Carrasco-Gallego, R.; Alcazar Montero, V. Recycled PLA for 3D Printing: A Comparison of Recycled PLA Filaments from Waste of Different Origins after Repeated Cycles of Extrusion. Polymers 2023, 15, 3651. [Google Scholar] [CrossRef] [PubMed]
- Pulok, M.K.H.; Rahman, M.S.; Chakravarty, U.K. Crack Propagation and Fracture Toughness of Additively Manufactured Polymers. In Proceedings of the ASME 2021 International Mechanical Engineering Congress and Exposition. Volume 4: Advances in Aerospace Technology, Virtual, Online, 1–5 November 2021; ASME, 2021. [Google Scholar] [CrossRef]
- Jayawardane, H.; Davies, I.J.; Gamage, J.R.; John, M.; Biswas, W.K. Additive manufacturing of recycled plastics: a ‘techno-eco-efficiency’ assessment. The International Journal of Advanced Manufacturing Technology 2023, 126, 1471–1496. [Google Scholar] [CrossRef]
- Al-Mazrouei, N.; Al-Marzouqi, A.H.; Ahmed, W. Characterization and Sustainability Potential of Recycling 3D-Printed Nylon Composite Wastes. Sustainability 2022, 14, 10458. [Google Scholar] [CrossRef]
- Rezvani Ghomi, E.R.; Khosravi, F.; Saedi Ardahaei, A.S.; Dai, Y.; Neisiany, R.E.; Foroughi, F.; Wu, M.; Das, O.; Ramakrishna, S. The Life Cycle Assessment for Polylactic Acid (PLA) to Make It a Low-Carbon Material. Polymers 2021, 13, 1854. [Google Scholar] [CrossRef]
- Balla, E.; Daniilidis, V.; Karlioti, G.; Kalamas, T.; Stefanidou, M.; Bikiaris, N.D.; Vlachopoulos, A.; Koumentakou, I.; Bikiaris, D.N. Poly(lactic Acid): A Versatile Biobased Polymer for the Future with Multifunctional Properties-From Monomer Synthesis, Polymerization Techniques and Molecular Weight Increase to PLA Applications. Polymers 2021, 13, 1822. [Google Scholar] [CrossRef]
- Bioplastics, E. Bioplastics Market Development Update 2023; European Bioplastics e.V.: Berlin, Germany, 2023. [Google Scholar]
- Taib, N.-A.A.B.; Rahman, M.R.; Huda, D.; Kuok, K.K.; Hamdan, S.; Bakri, M.K.B.; Julaihi, M.R.M.B.; Khan, A. A review on poly lactic acid (PLA) as a biodegradable polymer. Polymer Bulletin 2022, 80, 1179–1213. [Google Scholar] [CrossRef]
- Yao, B.; Zhu, Y.; Xu, Z.; Wu, Y.; Yang, L.; Liu, J.; Shang, J.; Fan, J.; Ouyang, L.; Fan, H.J.S. Taguchi design and optimization of the PLA/PCL composite filament with plasticizer and compatibilizer additives for optimal 3D printing. Polymer Engineering & Science 2023, 63, 3743–3761. [Google Scholar] [CrossRef]
- Alexandre, A.; Cruz Sanchez, F.A.; Boudaoud, H.; Camargo, M.; Pearce, J.M. Mechanical Properties of Direct Waste Printing of Polylactic Acid with Universal Pellets Extruder: Comparison to Fused Filament Fabrication on Open-Source Desktop Three-Dimensional Printers. 3D Printing and Additive Manufacturing 2020, 7, 237–247. [Google Scholar] [CrossRef]
- Hasan, M.R.; Davies, I.J.; Pramanik, A.; John, M.; Biswas, W.K. Potential of Recycled PLA in 3D Printing: A Review. Sustainable Manufacturing and Service Economics 2024, 3, 100020. [Google Scholar] [CrossRef]
- Beltran, F.R.; Lorenzo, V.; Acosta, J.; de la Orden, M.U.; Martinez Urreaga, J. Effect of simulated mechanical recycling processes on the structure and properties of poly(lactic acid). J Environ Manage 2018, 216, 25–31. [Google Scholar] [CrossRef]
- Żenkiewicz, M.; Richert, J.; Rytlewski, P.; Moraczewski, K.; Stepczyńska, M.; Karasiewicz, T. Characterisation of multi-extruded poly(lactic acid). Polymer Testing 2009, 28, 412–418. [Google Scholar] [CrossRef]
- Pillin, I.; Montrelay, N.; Bourmaud, A.; Grohens, Y. Effect of thermo-mechanical cycles on the physico-chemical properties of poly(lactic acid). Polymer Degradation and Stability 2008, 93, 321–328. [Google Scholar] [CrossRef]
- Zhao, P.; Rao, C.; Gu, F.; Sharmin, N.; Fu, J. Close-looped recycling of polylactic acid used in 3D printing: An experimental investigation and life cycle assessment. Journal of Cleaner Production 2018, 197, 1046–1055. [Google Scholar] [CrossRef]
- Babagowda; Kadadevara Math, R.S.; Goutham, R.; Srinivas Prasad, K.R. Study of Effects on Mechanical Properties of PLA Filament which is blended with Recycled PLA Materials. In Proceedings of the International Conference on Advances in Materials and Manufacturing Applications (IConAMMA-2017), IOP Conference Series: Materials Science and Engineering. Bengaluru, India, 17–19 August 2018; IOP Publishing, 2018. [Google Scholar] [CrossRef]
- Tanney, D.; Meisel, N.A.; Moore, J.D. Investigating material degradation through the recycling of PLA in additively manufactured parts. In Proceedings of the 28th Annual International Solid Freeform Fabrication Symposium—An Additive Manufacturing Conference, 2017 Annual International Solid Freeform Fabrication Symposium. Austin, United States, 7–9 August 2017; David L. Bourell, Richard H. Crawford, et al., Eds.; University of Texas at Austin. [Google Scholar]
- Bergaliyeva, S.; Sales, D.L.; Delgado, F.J.; Bolegenova, S.; Molina, S.I. Manufacture and Characterization of Polylactic Acid Filaments Recycled from Real Waste for 3D Printing. Polymers 2023, 15, 2165. [Google Scholar] [CrossRef] [PubMed]
- Kam, M.; İpekci, A.; Şengül, Ö. Taguchi Optimization of Fused Deposition Modeling Process Parameters on Mechanical Characteristics of PLA+ Filament Material. Scientia Iranica 2021, 29, 79–89. [Google Scholar] [CrossRef]
- Kam, M.; İpekçi, A.; Şengül, Ö. Investigation of the effect of FDM process parameters on mechanical properties of 3D printed PA12 samples using Taguchi method. Journal of Thermoplastic Composite Materials 2021, 36, 307–325. [Google Scholar] [CrossRef]
- Atakok, G.; Kam, M.; Koc, H.B. Tensile, three-point bending and impact strength of 3D printed parts using PLA and recycled PLA filaments: A statistical investigation. Journal of Materials Research and Technology 2022, 18, 1542–1554. [Google Scholar] [CrossRef]
- Chen, W.H.; Uribe, M.C.; Kwon, E.E.; Lin, K.Y.A.; Park, Y.K.; Ding, L.; Saw, L.H. A comprehensive review of thermoelectric generation optimization by statistical approach: Taguchi method, analysis of variance (ANOVA), and response surface methodology (RSM). Renewable & Sustainable Energy Reviews 2022, 169, 112917. [Google Scholar] [CrossRef]
- Nikam, M.; Pawar, P.; Patil, A.; Patil, A.; Mokal, K.; Jadhav, S. Sustainable fabrication of 3D printing filament from recycled PET plastic. Materials Today: Proceedings 2023. [Google Scholar] [CrossRef]
- Chu, J.S.; Koay, S.C.; Chan, M.Y.; Choo, H.L.; Ong, T.K. Recycled plastic filament made from post-consumer expanded polystyrene and polypropylene for fused filamant fabrication. Polymer Engineering & Science 2022, 62, 3786–3795. [Google Scholar] [CrossRef]
- Mishra, V.; Ror, C.H.K.; Negi, S.; Kar, S.; Borah, L.N. 3D printing with recycled ABS resin: Effect of blending and printing temperature. Materials Chemistry and Physics 2023, 309, 128317. [Google Scholar] [CrossRef]
- Di, L.; Yang, Y. Towards closed-loop material flow in additive manufacturing: Recyclability analysis of thermoplastic waste. Journal of Cleaner Production 2022, 362, 132427. [Google Scholar] [CrossRef]
- Naganaboyina, H.P.S.; Nagaraju, P.; Sonaye, S.Y.; Bokam, V.K.; Sikder, P. In-house processing of carbon fiber-reinforced polyetheretherketone (CFR-PEEK) 3D printable filaments and fused filament fabrication-3D printing of CFR-PEEK parts. The International Journal of Advanced Manufacturing Technology 2023, 128, 5011–5024. [Google Scholar] [CrossRef]
- Hasan, M.R.; Davies, I.J.; Pramanik, A.; John, M.; Biswas, W.K. Impact of process parameters on improving the performance of 3D printed recycled polylactic acid (rPLA) components. The International Journal of Advanced Manufacturing Technology 2024. [Google Scholar] [CrossRef]
- ASTM-D638-22; Standard Test Method for Tensile Properties of Plastics. ASTM International: West Conshohocken, PA, United States, 2022.
- ASTM-D790-17; Standard Test Methods for Flexural Properties of Unreinforced and Reinforced Plastics and Electrical Insulating Materials. ASTM International: West Conshohocken, PA, United States, 2017.
- ASTM-D6110-18; Standard Test Method for Determining the Charpy Impact Resistance of Notched Specimens of Plastics. ASTM International: West Conshohocken, PA, United States, 2018.
- ASTM-D2240-15; Standard Test Method for Rubber Property-Durometer Hardness. ASTM International: West Conshohocken, PA, United States, 2021.
- ASTM-D7127-17; Standard Test Method for Measurement of Surface Roughness of Abrasive Blast Cleaned Metal Surfaces Using a Portable Stylus Instrument. ASTM International: West Conshohocken, PA, United States, 2017.
- Dehnad, K. Quality control, robust design, and the Taguchi method; Springer: New York, NY, USA, 2012. [Google Scholar]
- Ahmad, M.N.; Ishak, M.R.; Mohammad Taha, M.; Mustapha, F.; Leman, Z.; Anak Lukista, D.D.; Irianto; Ghazali, I. Application of Taguchi Method to Optimize the Parameter of Fused Deposition Modeling (FDM) Using Oil Palm Fiber Reinforced Thermoplastic Composites. Polymers 2022, 14, 2140. [Google Scholar] [CrossRef]
- Salam, H.; Dong, Y.; Davies, I.J.; Pramanik, A. Optimization of material formulation and processing parameters in relation to mechanical properties of bioepoxy/clay nanocomposites using Taguchi design of experiments. Journal of Applied Polymer Science 2018, 135. [Google Scholar] [CrossRef]
- Greenwald, A.G.; Gonzalez, R.; Harris, R.J.; Guthrie, D. Effect sizes and p values: what should be reported and what should be replicated? Psychophysiology 1996, 33, 175–183. [Google Scholar] [CrossRef]
- Son, J.; Kim, I.; Kim, H.; Kim, I.; Kang, B.; Kim, H. A study on the prediction of bead geometry in the robotic welding system. Journal of Mechanical Science and Technology 2007, 21, 1726–1731. [Google Scholar] [CrossRef]
- Muhammad, N.; Manurung, Y.H.P.; Jaafar, R.; Abas, S.K.; Tham, G.; Haruman, E. Model development for quality features of resistance spot welding using multi-objective Taguchi method and response surface methodology. Journal of Intelligent Manufacturing 2012, 24, 1175–1183. [Google Scholar] [CrossRef]
- Belavendram, N. Quality by Design, Taguchi Techniques for Industrial Experimentation; Prentice Hall, 1995. [Google Scholar]
- Roy, R.K. A Primer on the Taguchi Method, Second Edition; Society of Manufacturing Engineers, 2010. [Google Scholar]
- Maier, R.; Bucaciuc, S.G.; Mandoc, A.C. Reducing Surface Roughness of 3D Printed Short-Carbon Fiber Reinforced Composites. Materials 2022, 15, 7398. [Google Scholar] [CrossRef] [PubMed]
- Kumar, S.; Ramesh, M.R.; Doddamani, M. Recycling potential of MWCNTs/HDPE nanocomposite filament: 3D printing and mechanical characterization. Journal of Material Cycles and Waste Management 2023, 25, 1168–1178. [Google Scholar] [CrossRef]
- Dorigato, A. Recycling of polymer blends. Advanced Industrial and Engineering Polymer Research 2021, 4, 53–69. [Google Scholar] [CrossRef]
- Kim, G.; Barocio, E.; Tsutsui, W.; Wang, P.; Dubikovsky, S.; Pipes, R.B.; Sterkenburg, R. Enhancing surface characteristics of additively manufactured fiber reinforced thermoplastic mold using thermoset coating with ceramic particles. Surface and Coatings Technology 2021, 422, 127536. [Google Scholar] [CrossRef]
- Kumar, S.; Singh, R.; Singh, T.P.; Batish, A. On investigations of thermal conductivity, circumferential compressive strength, and surface characterization of 3D-printed hybrid blended magnetostrictive PLA composite. Journal of Thermoplastic Composite Materials 2020, 35, 631–650. [Google Scholar] [CrossRef]
- Hsueh, M.H.; Lai, C.J.; Liu, K.Y.; Chung, C.F.; Wang, S.H.; Pan, C.Y.; Huang, W.C.; Hsieh, C.H.; Zeng, Y.S. Effects of Printing Temperature and Filling Percentage on the Mechanical Behavior of Fused Deposition Molding Technology Components for 3D Printing. Polymers 2021, 13, 2910. [Google Scholar] [CrossRef]
- Mani, M.; Karthikeyan, A.G.; Kalaiselvan, K.; Muthusamy, P.; Muruganandhan, P. Optimization of FDM 3-D printer process parameters for surface roughness and mechanical properties using PLA material. Materials Today: Proceedings 2022, 66, 1926–1931. [Google Scholar] [CrossRef]
- Maguluri, N.; Suresh, G.; Guntur, S.R. Effect of printing parameters on the hardness of 3D printed poly-lactic acid parts using DOE approach. In International Conference on Materials Science and Engineering (ICMSE 2022); IOP Conference Series: Materials Science and Engineering; Virtual, Online, IOP Publishing, 2022. [Google Scholar] [CrossRef]
- Abbas, Z.A.; Aleabi, S.H. Studying some of mechanical properties (tensile, impact, hardness) and thermal conductivity of polymer blend reinforce by magnesium oxide. In Xiamen-Custipen Workshop on the Equation of State of Dense Neutron-Rich Matter in the Era of Gravitational Wave Astronomy; 2019. [Google Scholar] [CrossRef]
- Samykano, M.; Selvamani, S.K.; Kadirgama, K.; Ngui, W.K.; Kanagaraj, G.; Sudhakar, K. Mechanical property of FDM printed ABS: influence of printing parameters. The International Journal of Advanced Manufacturing Technology 2019, 102, 2779–2796. [Google Scholar] [CrossRef]
- Farashi, S.; Vafaee, F. Effect of printing parameters on the tensile strength of FDM 3D samples: a meta-analysis focusing on layer thickness and sample orientation. Progress in Additive Manufacturing 2022, 7, 565–582. [Google Scholar] [CrossRef]
- Vanaei, H.R.; Raissi, K.; Deligant, M.; Shirinbayan, M.; Fitoussi, J.; Khelladi, S.; Tcharkhtchi, A. Toward the understanding of temperature effect on bonding strength, dimensions and geometry of 3D-printed parts. Journal of Materials Science 2020, 55, 14677–14689. [Google Scholar] [CrossRef]
- Sanusi, H.; Mohamad Ridzwan, I.; Mohd Sapuan, S.; Noorfaizal, Y.; Syamir Alihan Showkat, A.; Mohd Sabri, H.; Maliki, I.; Asmawi, S. Tensile Properties of 3D Printed Recycled PLA Filament: A Detailed Study on Filament Fabrication Parameters. Journal of Advanced Research in Applied Mechanics 2023, 110, 63–72. [Google Scholar] [CrossRef]
- Sam-Daliri, O.; Ghabezi, P.; Steinbach, J.; Flanagan, T.; Finnegan, W.; Mitchell, S.; Harrison, N. Experimental study on mechanical properties of material extrusion additive manufactured parts from recycled glass fibre-reinforced polypropylene composite. Composites Science and Technology 2023, 241, 110125. [Google Scholar] [CrossRef]
- Algarni, M. The Influence of Raster Angle and Moisture Content on the Mechanical Properties of PLA Parts Produced by Fused Deposition Modeling. Polymers 2021, 13, 237. [Google Scholar] [CrossRef]
- Hamid, R.A.; Hamezah, F.H.; Abd Razak, J. Influence of Humidity on the Tensile Strength of 3D Printed PLA Filament. In Intelligent Manufacturing and Mechatronics; Ali Mokhtar, M.N., Jamaludin, Z., et al., Eds.; Springer: Singapore, 2022. [Google Scholar] [CrossRef]
- Aniskevich, A.; Bulderberga, O.; Stankevics, L. Moisture Sorption and Degradation of Polymer Filaments Used in 3D Printing. Polymers 2023, 15, 2600. [Google Scholar] [CrossRef]
- Ror, C.K.; Negi, S.; Mishra, V. Development and characterization of sustainable 3D printing filaments using post-consumer recycled PET: processing and characterization. Journal of Polymer Research 2023, 30, 350. [Google Scholar] [CrossRef]
- Sharma, P.; Dhanopia, A.K.; Joshi, D. An experimental study on carbon fiber thickness and layer thickness of depositing material in fused deposition modeling. Materials Today: Proceedings 2021, 44, 4479–4484. [Google Scholar] [CrossRef]
- Nugroho, A.; Ardiansyah, R.; Rusita, L.A.; Larasati, I.L. Effect of layer thickness on flexural properties of PLA (PolyLactid Acid) by 3D printing. In Proceedings of the 6th International Seminar of Aerospace Science and Technology; IOP Conference Series: Journal of Physics: Conference Series. IOP Publishing, 2018. [Google Scholar] [CrossRef]
- Nofar, M.; Sacligil, D.; Carreau, P.J.; Kamal, M.R.; Heuzey, M.C. Poly (lactic acid) blends: Processing, properties and applications. Int J Biol Macromol 2019, 125, 307–360. [Google Scholar] [CrossRef]
- Tsuji, H. Poly(lactic acid) stereocomplexes: A decade of progress. Adv Drug Deliv Rev 2016, 107, 97–135. [Google Scholar] [CrossRef] [PubMed]
- Chen, C.C.; Chueh, J.Y.; Tseng, H.; Huang, H.M.; Lee, S.Y. Preparation and characterization of biodegradable PLA polymeric blends. Biomaterials 2003, 24, 1167–1173. [Google Scholar] [CrossRef]
- Syrlybayev, D.; Zharylkassyn, B.; Seisekulova, A.; Akhmetov, M.; Perveen, A.; Talamona, D. Optimisation of Strength Properties of FDM Printed Parts—A Critical Review. Polymers 2021, 13, 1587. [Google Scholar] [CrossRef]
- Rajpurohit, S.R.; Dave, H.K. Impact strength of 3D printed PLA using open source FFF-based 3D printer. Progress in Additive Manufacturing 2020, 6, 119–131. [Google Scholar] [CrossRef]
- Yu, W.; Sun, L.; Li, M.; Li, M.; Lei, W.; Wei, C. FDM 3D Printing and Properties of PBS/PLA Blends. Polymers 2023, 15, 4305. [Google Scholar] [CrossRef] [PubMed]
- Ding, S.; Zou, B.; Wang, P.; Ding, H. Effects of nozzle temperature and building orientation on mechanical properties and microstructure of PEEK and PEI printed by 3D-FDM. Polymer Testing 2019, 78. [Google Scholar] [CrossRef]
- Gunasekaran, K.N.; Aravinth, V.; Muthu Kumaran, C.B.; Madhankumar, K.; Pradeep Kumar, S. Investigation of mechanical properties of PLA printed materials under varying infill density. Materials Today: Proceedings 2021, 45, 1849–1856. [Google Scholar] [CrossRef]
- Maqsood, N.; Rimašauskas, M. Tensile and flexural response of 3D printed solid and porous CCFRPC structures and fracture interface study using image processing technique. Journal of Materials Research and Technology 2021, 14, 731–742. [Google Scholar] [CrossRef]
- Tekinalp, H.L.; Kunc, V.; Velez-Garcia, G.M.; Duty, C.E.; Love, L.J.; Naskar, A.K.; Blue, C.A.; Ozcan, S. Highly oriented carbon fiber–polymer composites via additive manufacturing. Composites Science and Technology 2014, 105, 144–150. [Google Scholar] [CrossRef]
- Kanabenja, W.; Passarapark, K.; Subchokpool, T.; Nawaaukkaratharnant, N.; Román, A.J.; Osswald, T.A.; Aumnate, C.; Potiyaraj, P. 3D printing filaments from plasticized Polyhydroxybutyrate/Polylactic acid blends reinforced with hydroxyapatite. Additive Manufacturing 2022, 59, 103130. [Google Scholar] [CrossRef]
- Gabriel, D.S.; Tiana, A.N. Mechanical Properties Improvement of Recycled Polypropylene with Material Value Conservation Schemes Using Virgin Plastic Blends. Materials Science Forum 2020, 1015, 76–81. [Google Scholar] [CrossRef]
- Maguluri, N.; Suresh, G.; Rao, K.V. Assessing the effect of FDM processing parameters on mechanical properties of PLA parts using Taguchi method. Journal of Thermoplastic Composite Materials 2023, 36, 1472–1488. [Google Scholar] [CrossRef]
- Roy, R.K. Design of Experiments Using the Taguchi Approach: 16 Steps to Product and Process Improvement; John Wiley & Sons, 2001. [Google Scholar]
- Teharia, R.; Singari, R.M.; Kumar, H. Optimization of process variables for additive manufactured PLA based tensile specimen using taguchi design and artificial neural network (ANN) technique. Materials Today: Proceedings 2022, 56, 3426–3432. [Google Scholar] [CrossRef]
- Little, H.A.; Tanikella, N.G.; Reich, M.J.; Fiedler, M.J.; Snabes, S.L.; Pearce, J.M. Towards Distributed Recycling with Additive Manufacturing of PET Flake Feedstocks. Materials 2020, 13, 4273. [Google Scholar] [CrossRef]
- Cisneros-López, E.O.; Pal, A.K.; Rodriguez, A.U.; Wu, F.; Misra, M.; Mielewski, D.F.; Kiziltas, A.; Mohanty, A.K. Recycled poly(lactic acid)–based 3D printed sustainable biocomposites: a comparative study with injection molding. Materials Today Sustainability 2020, 7–8. [Google Scholar] [CrossRef]
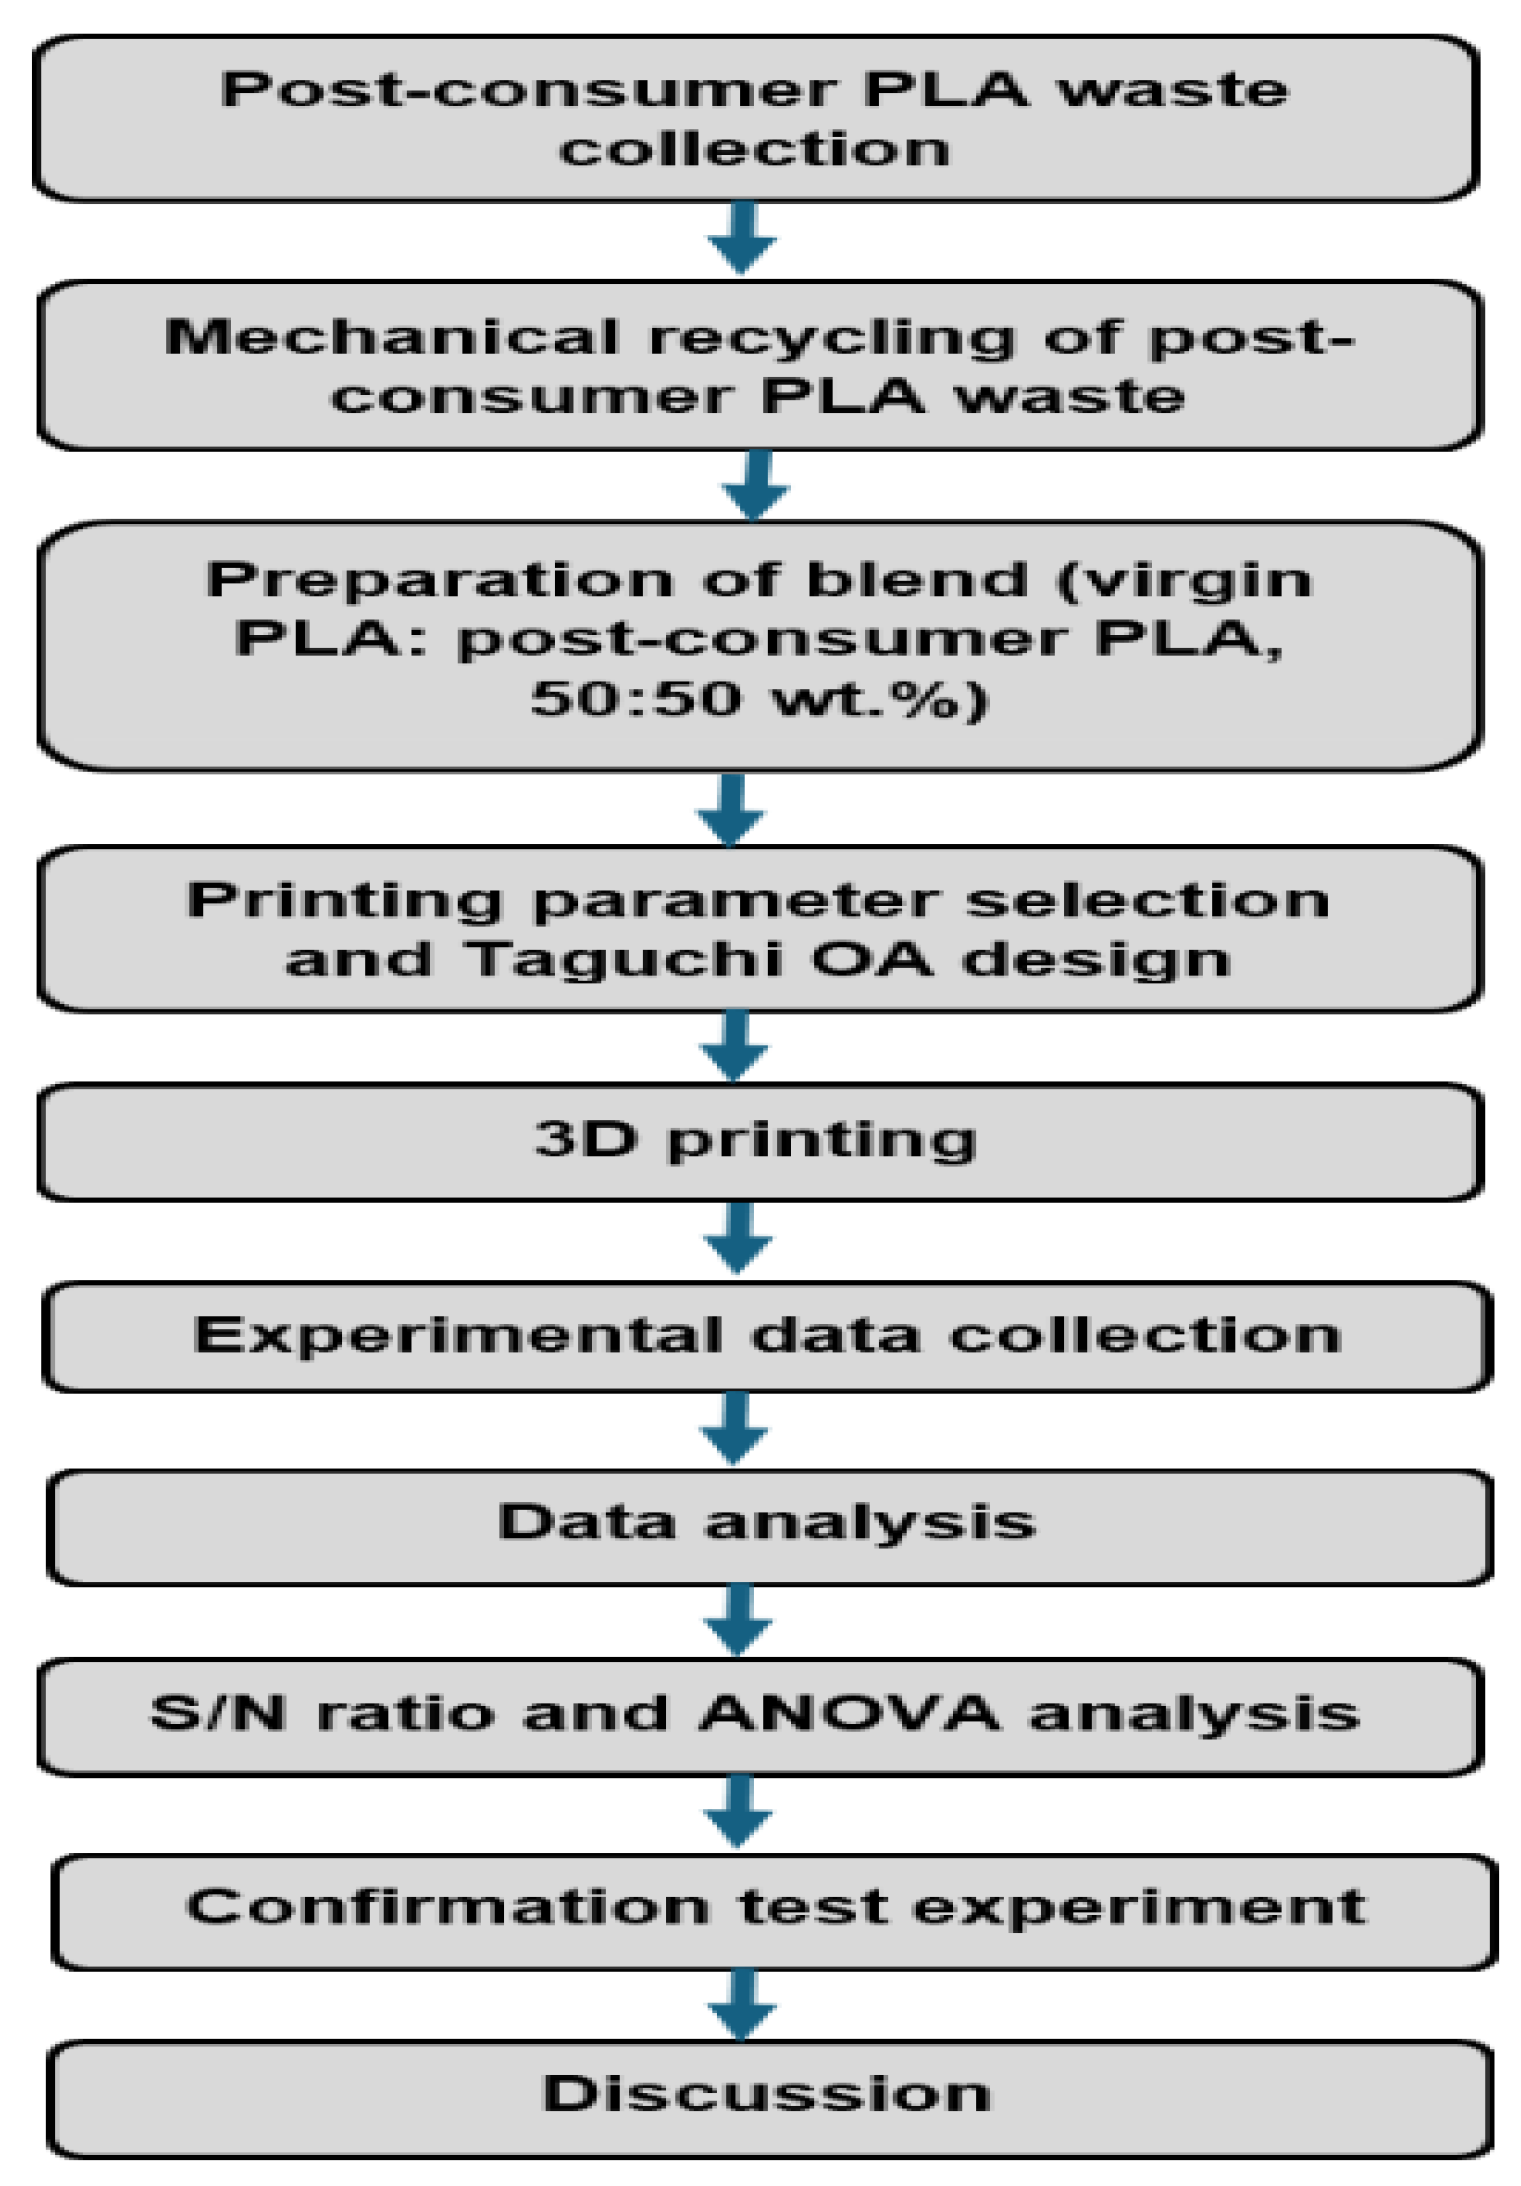


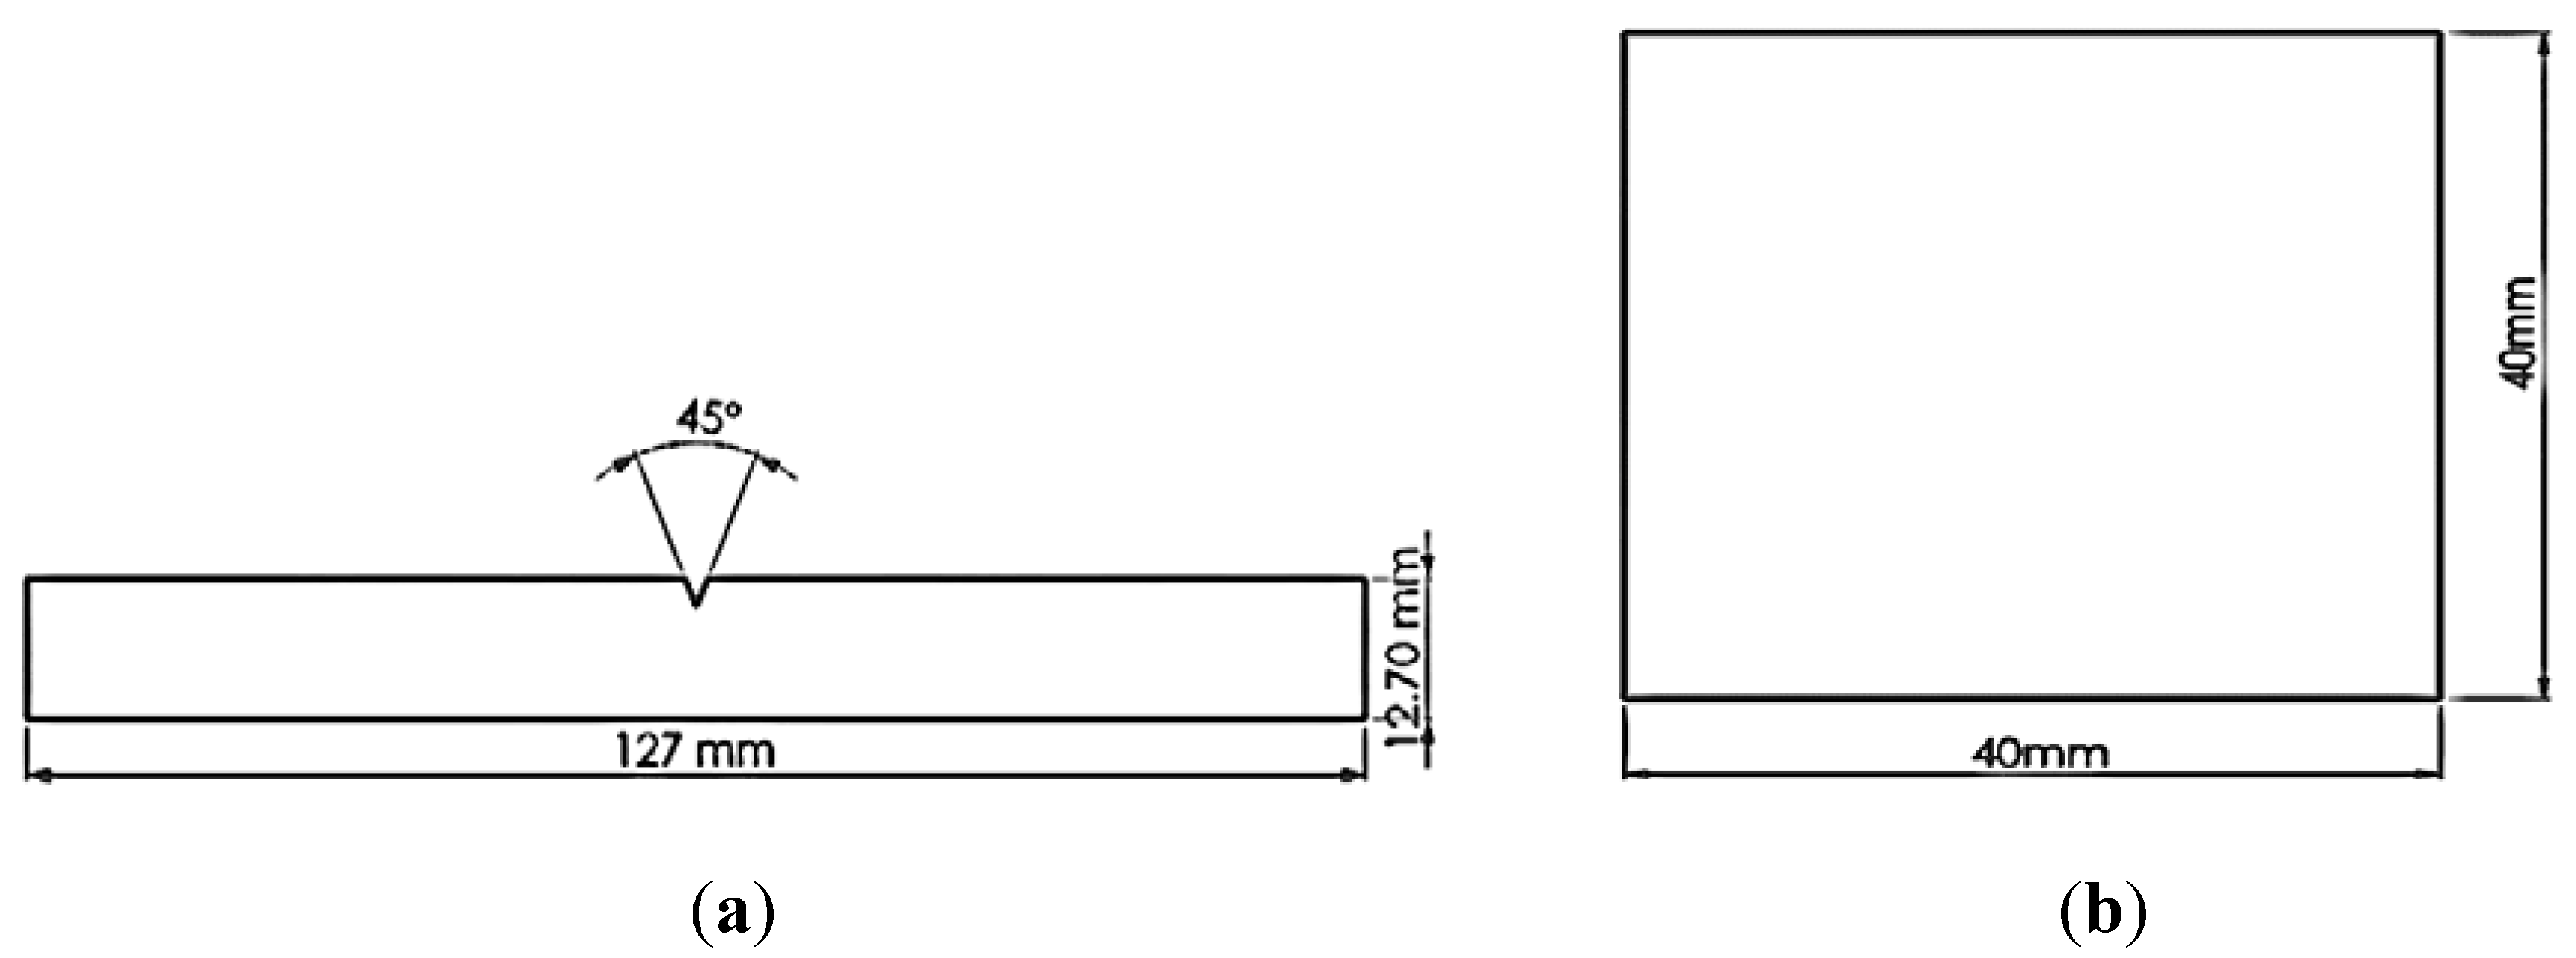

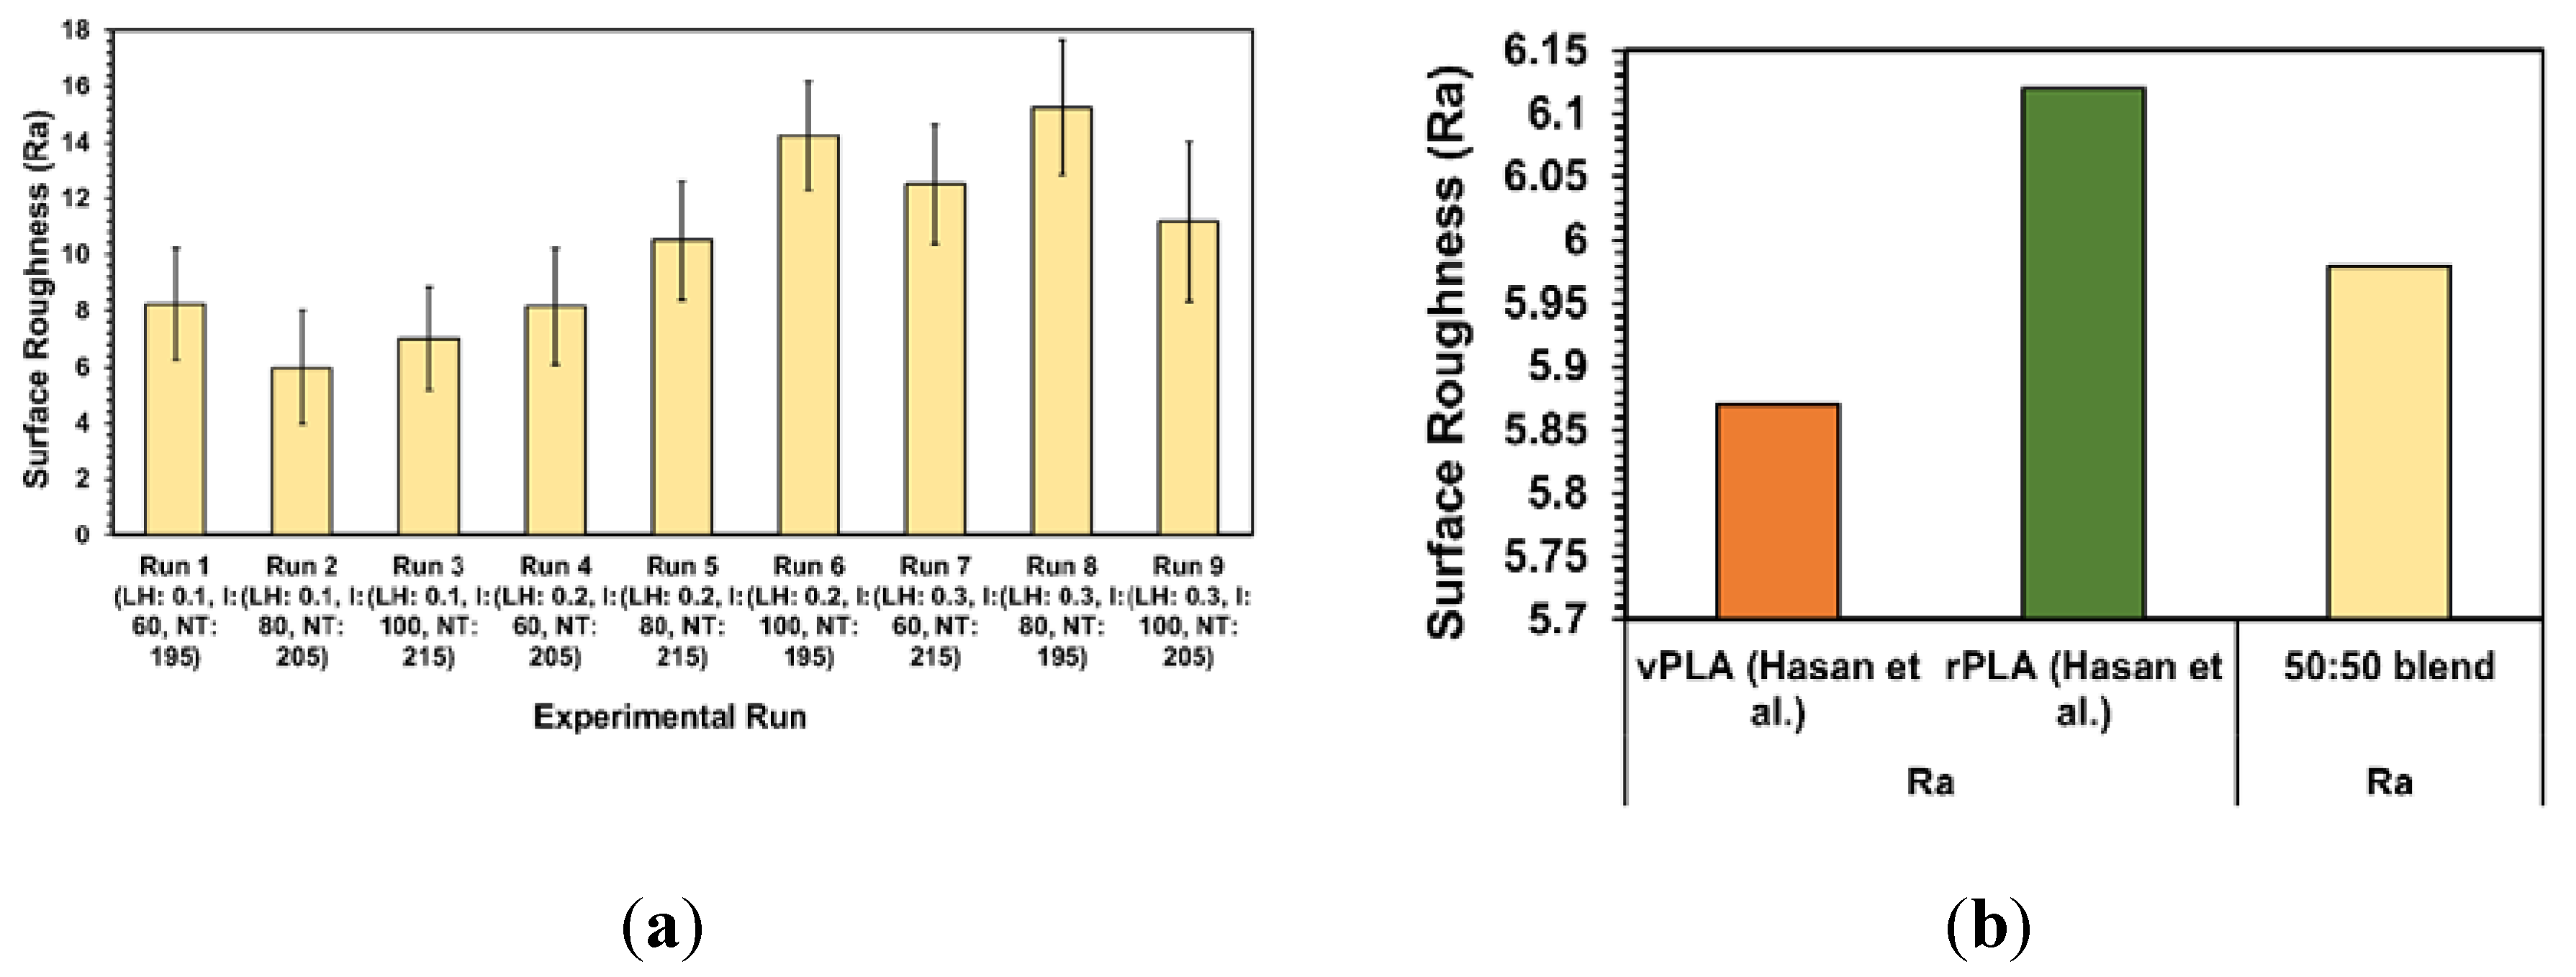
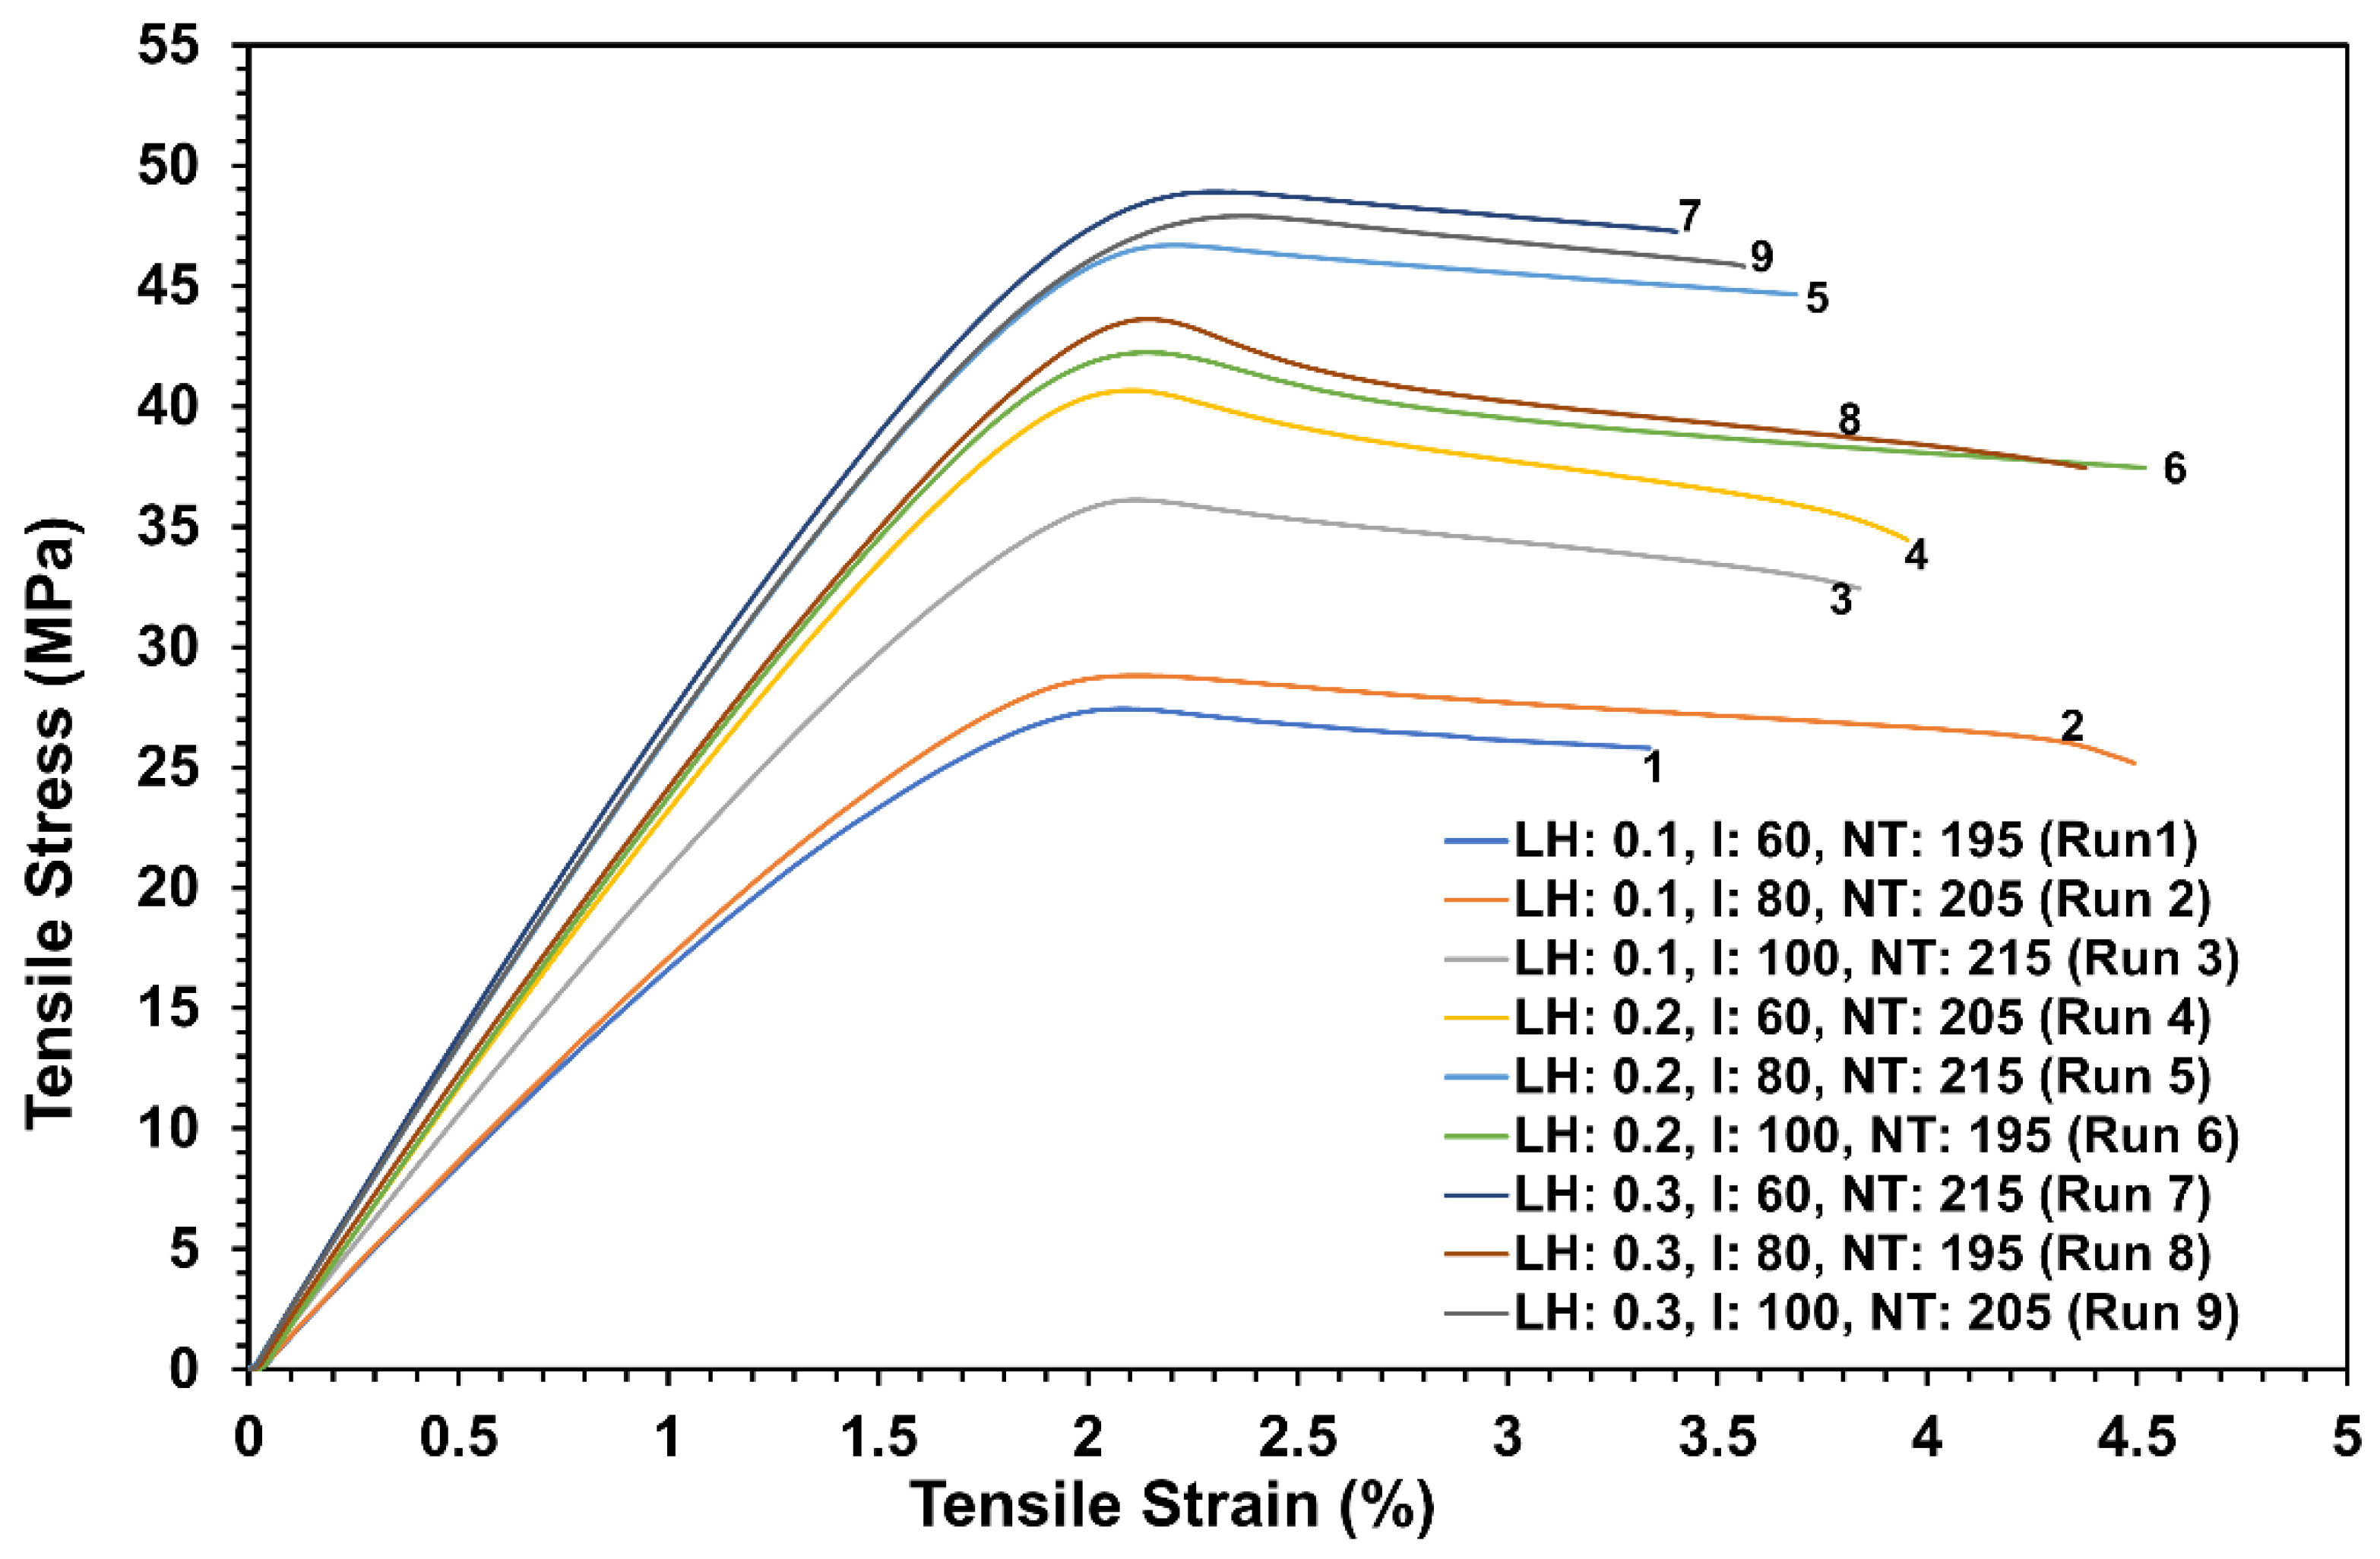
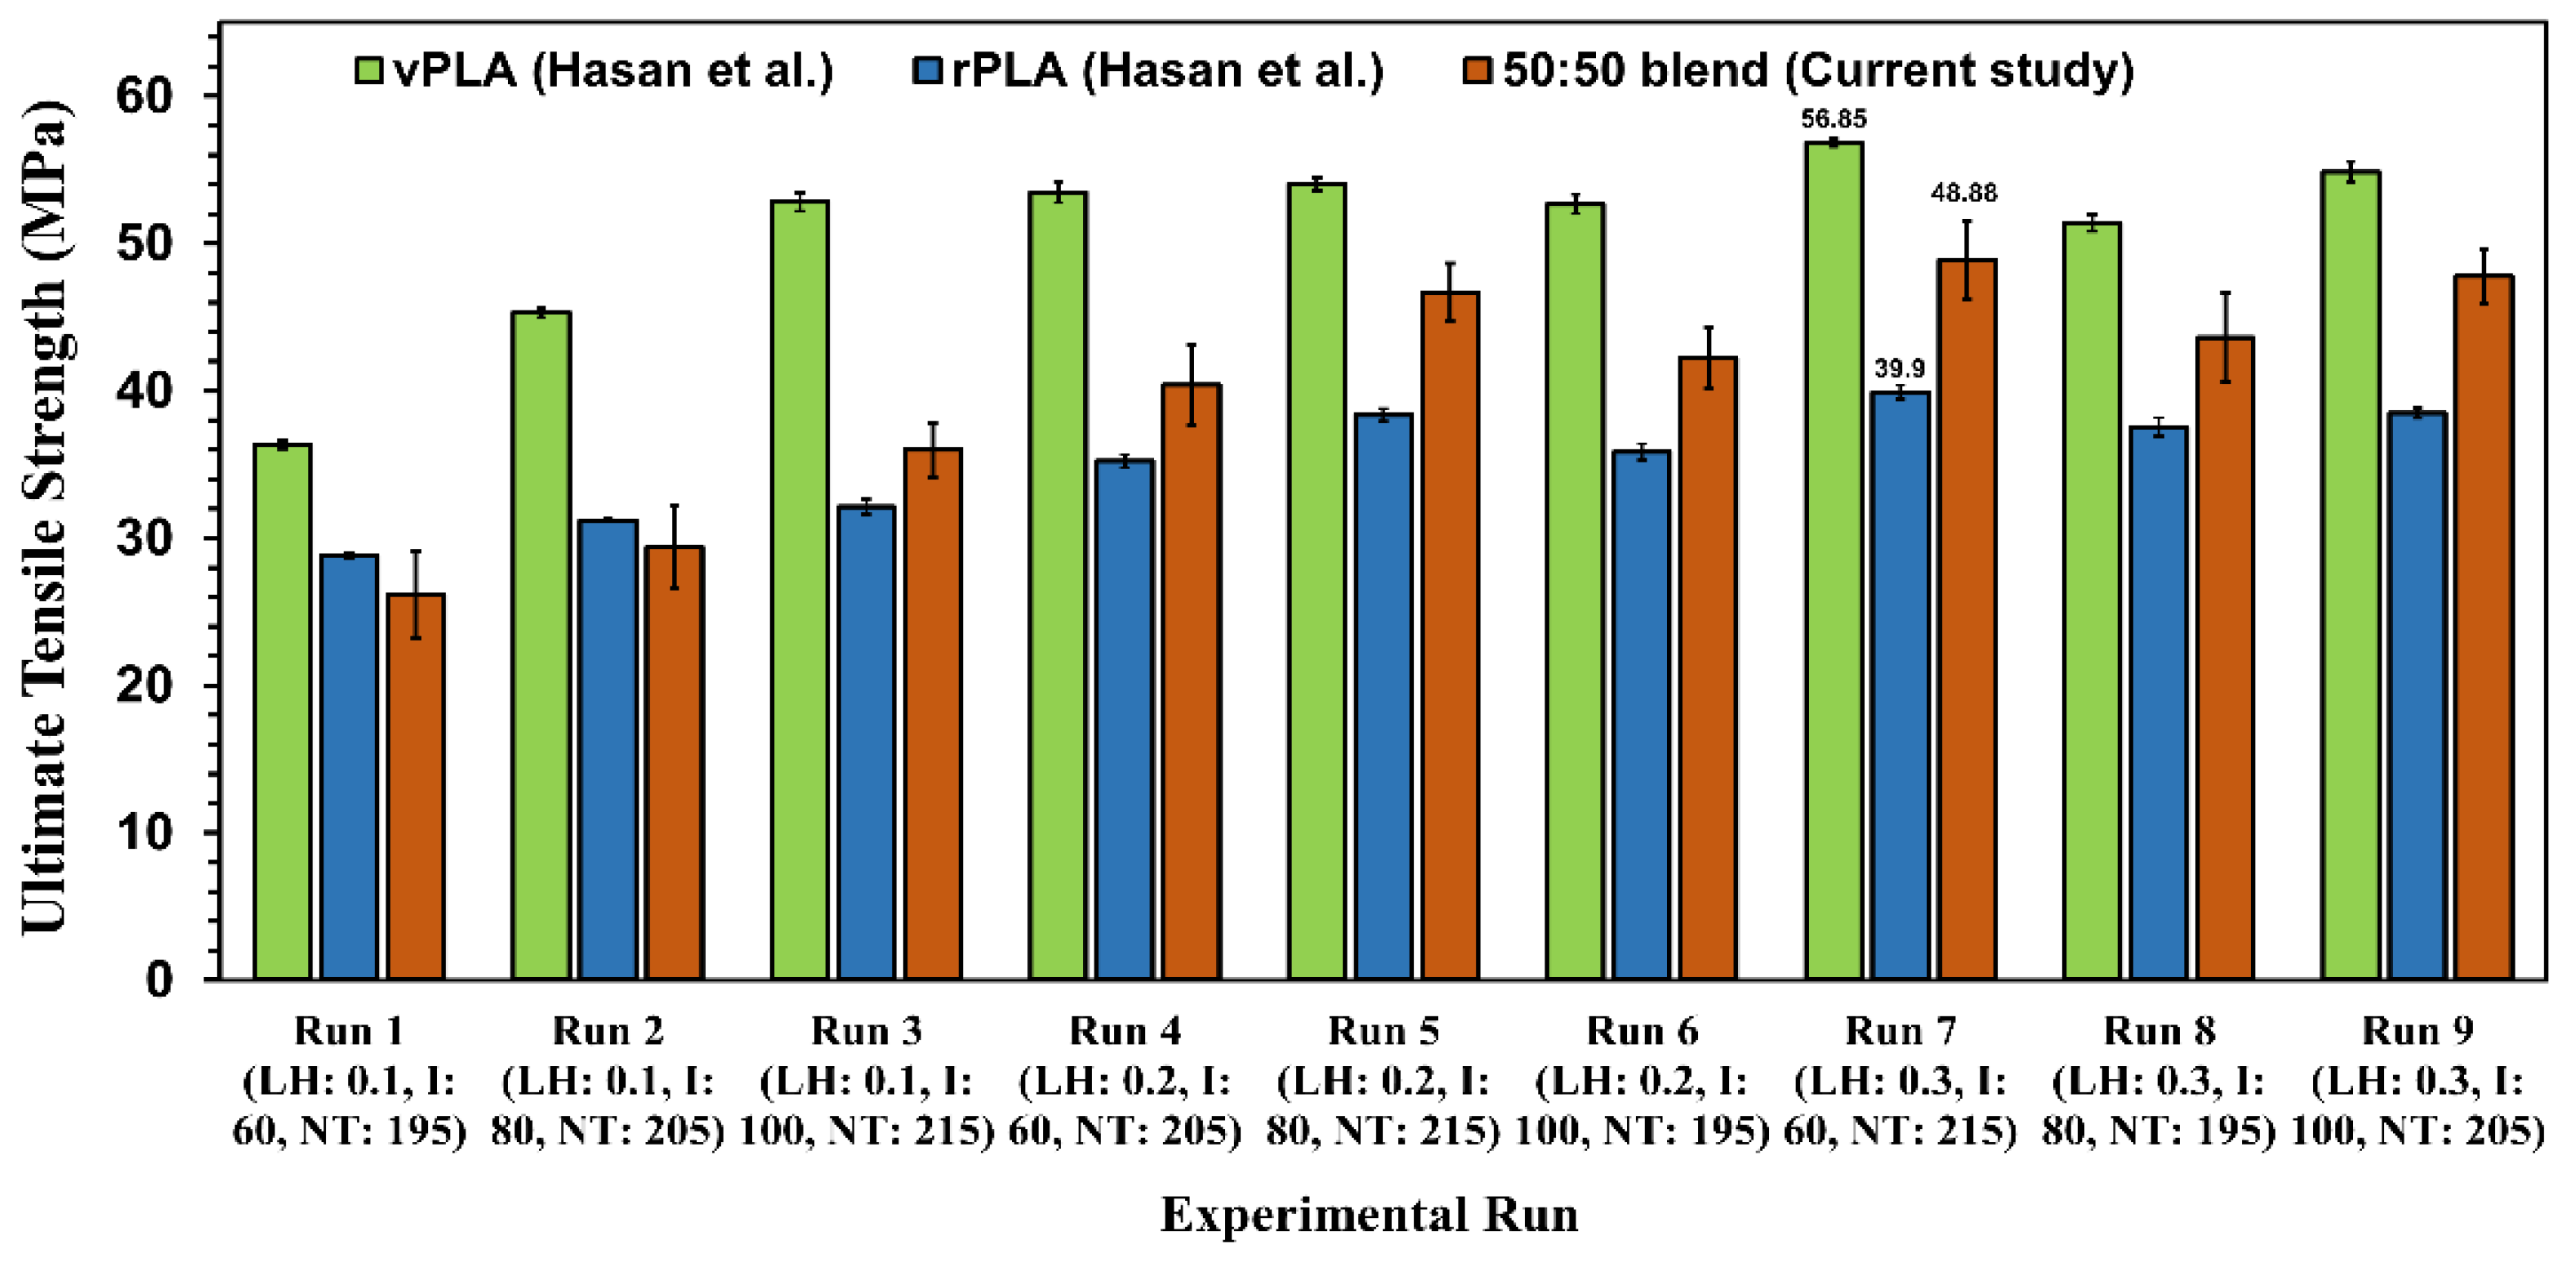
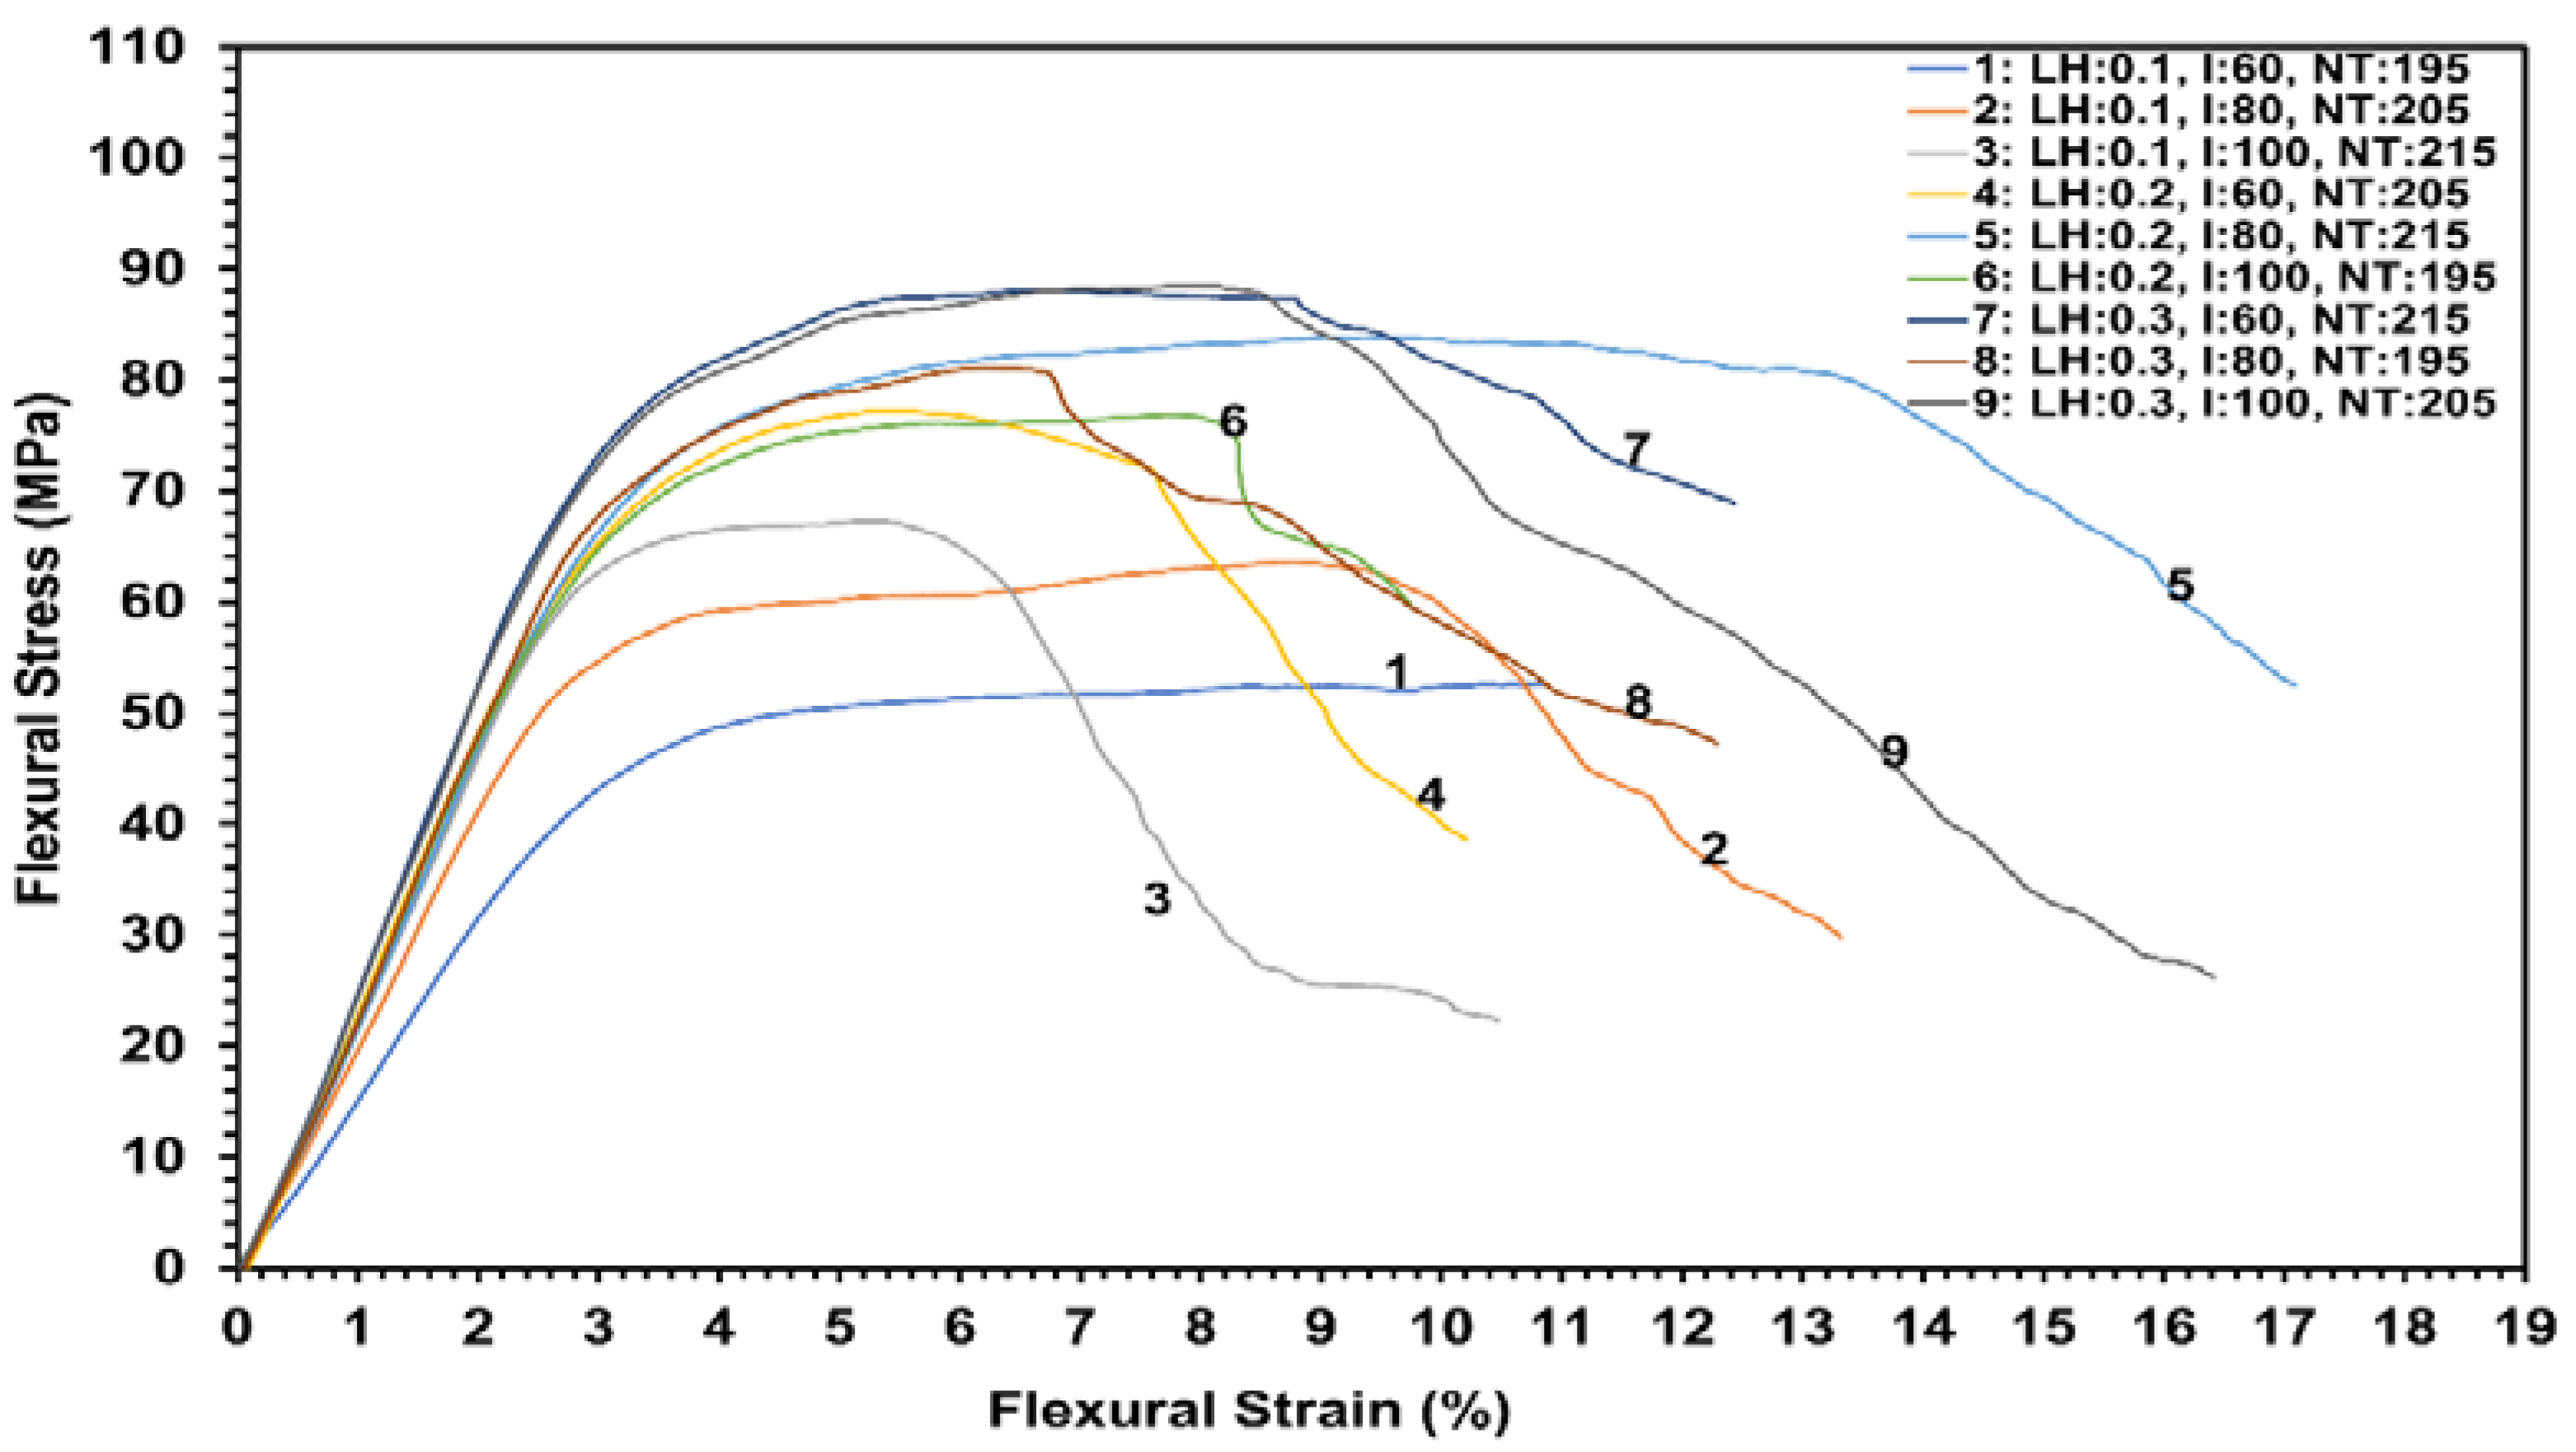
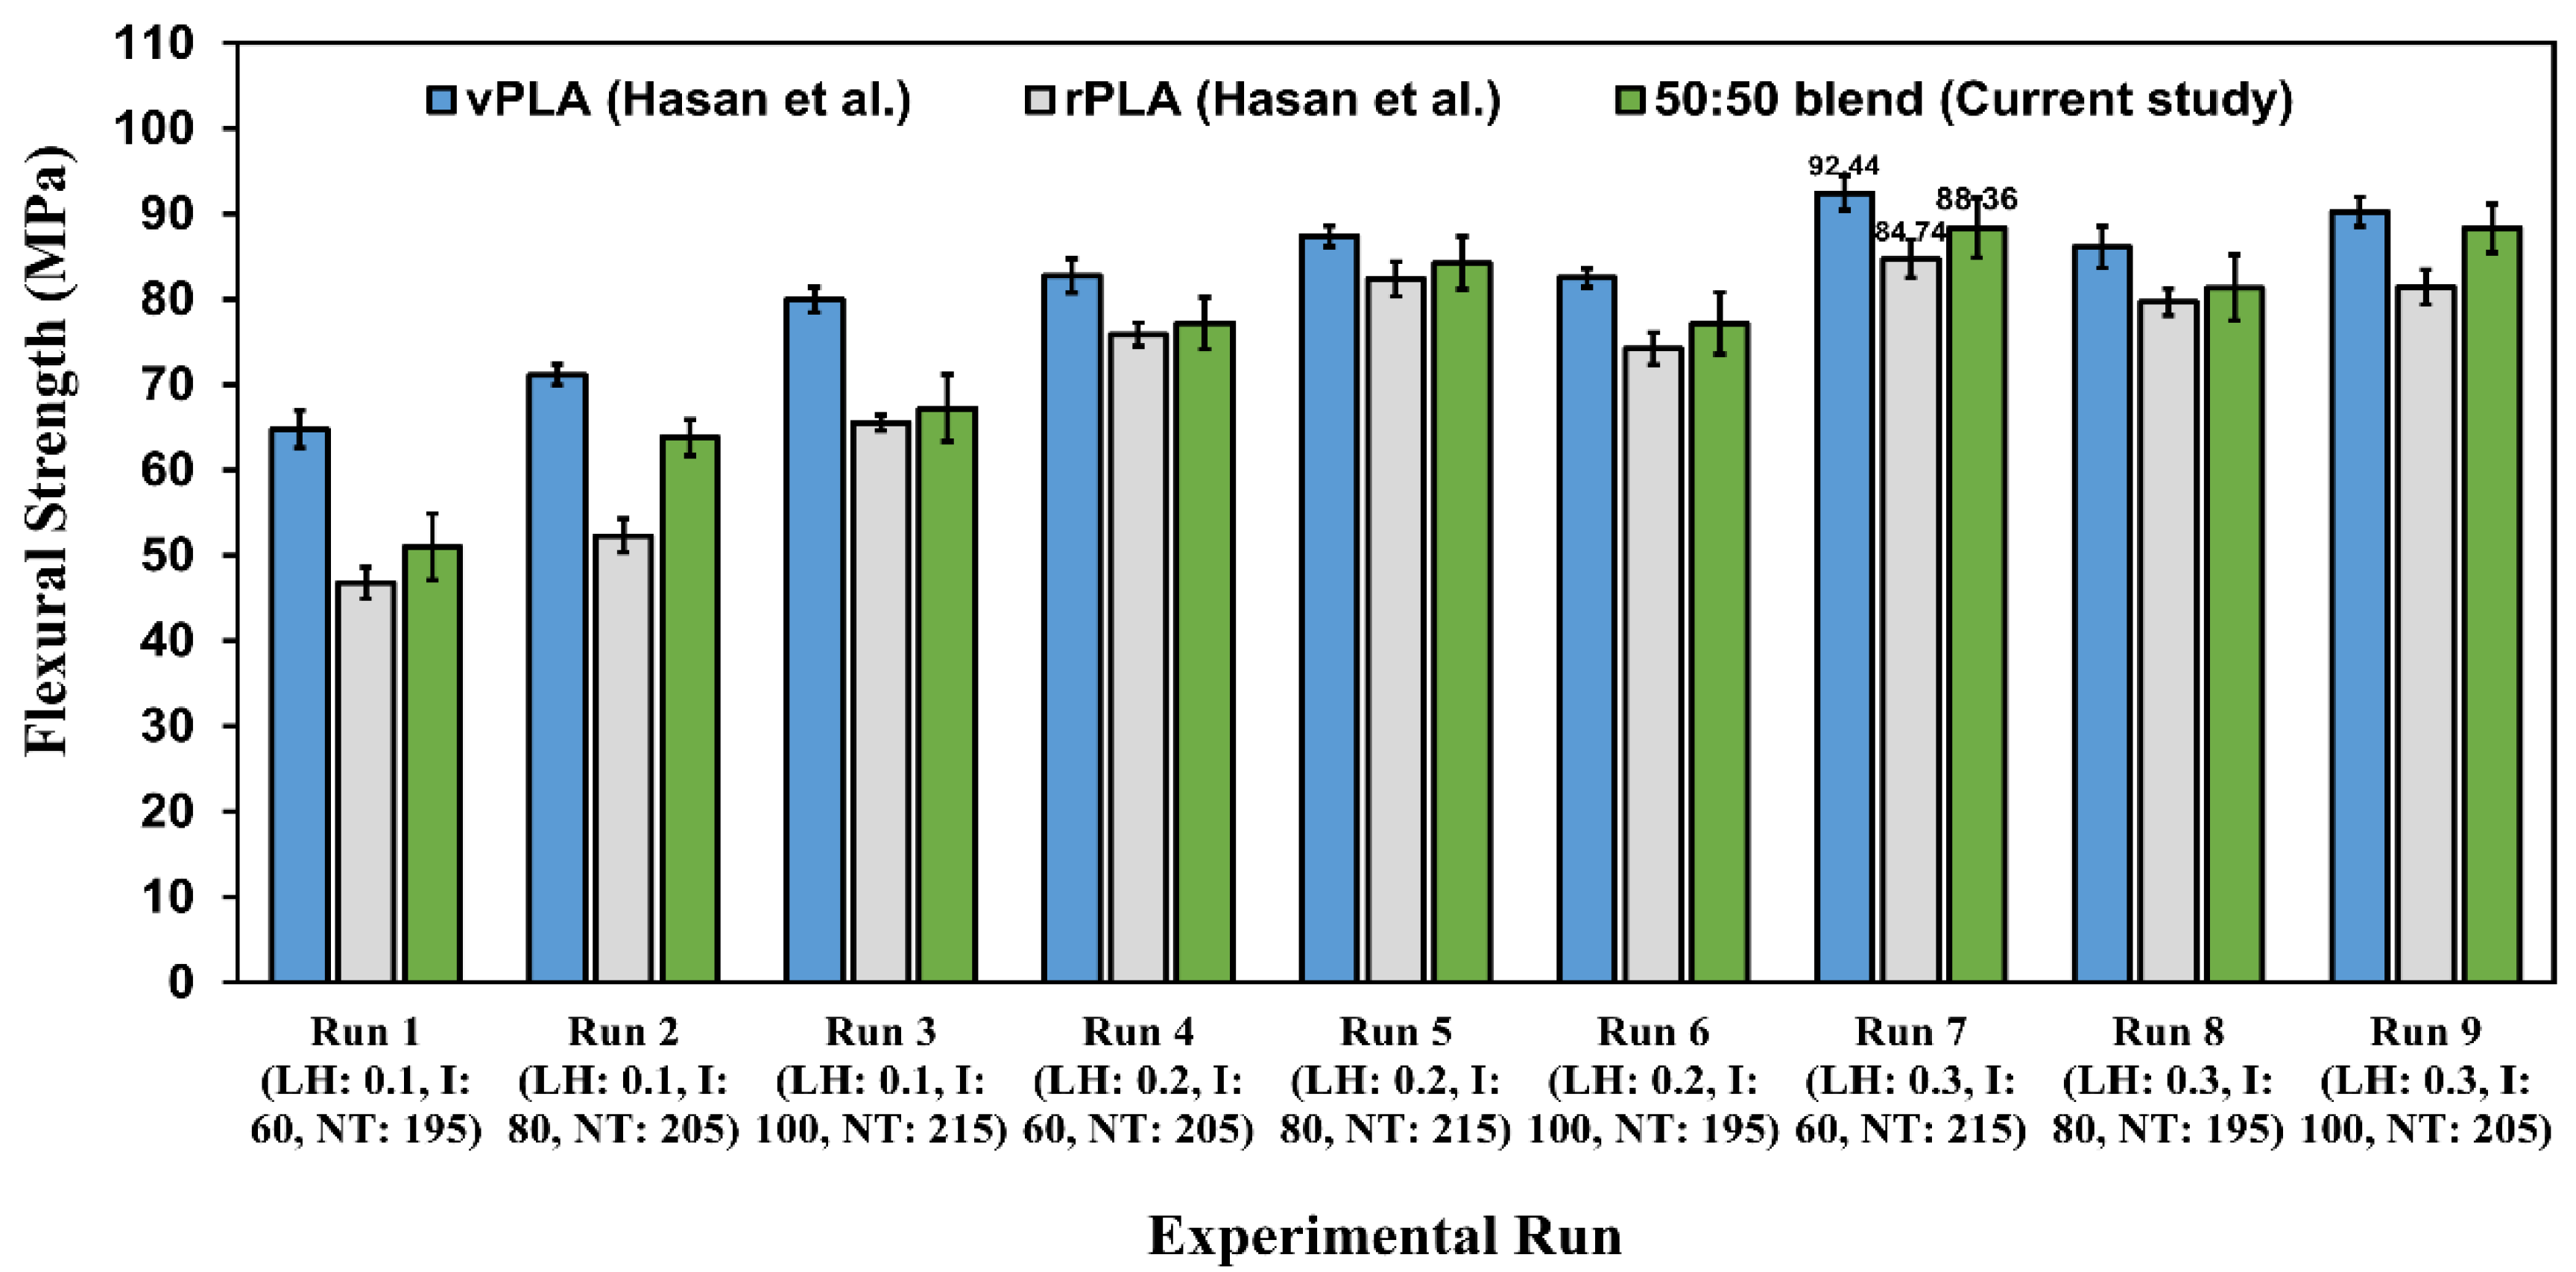
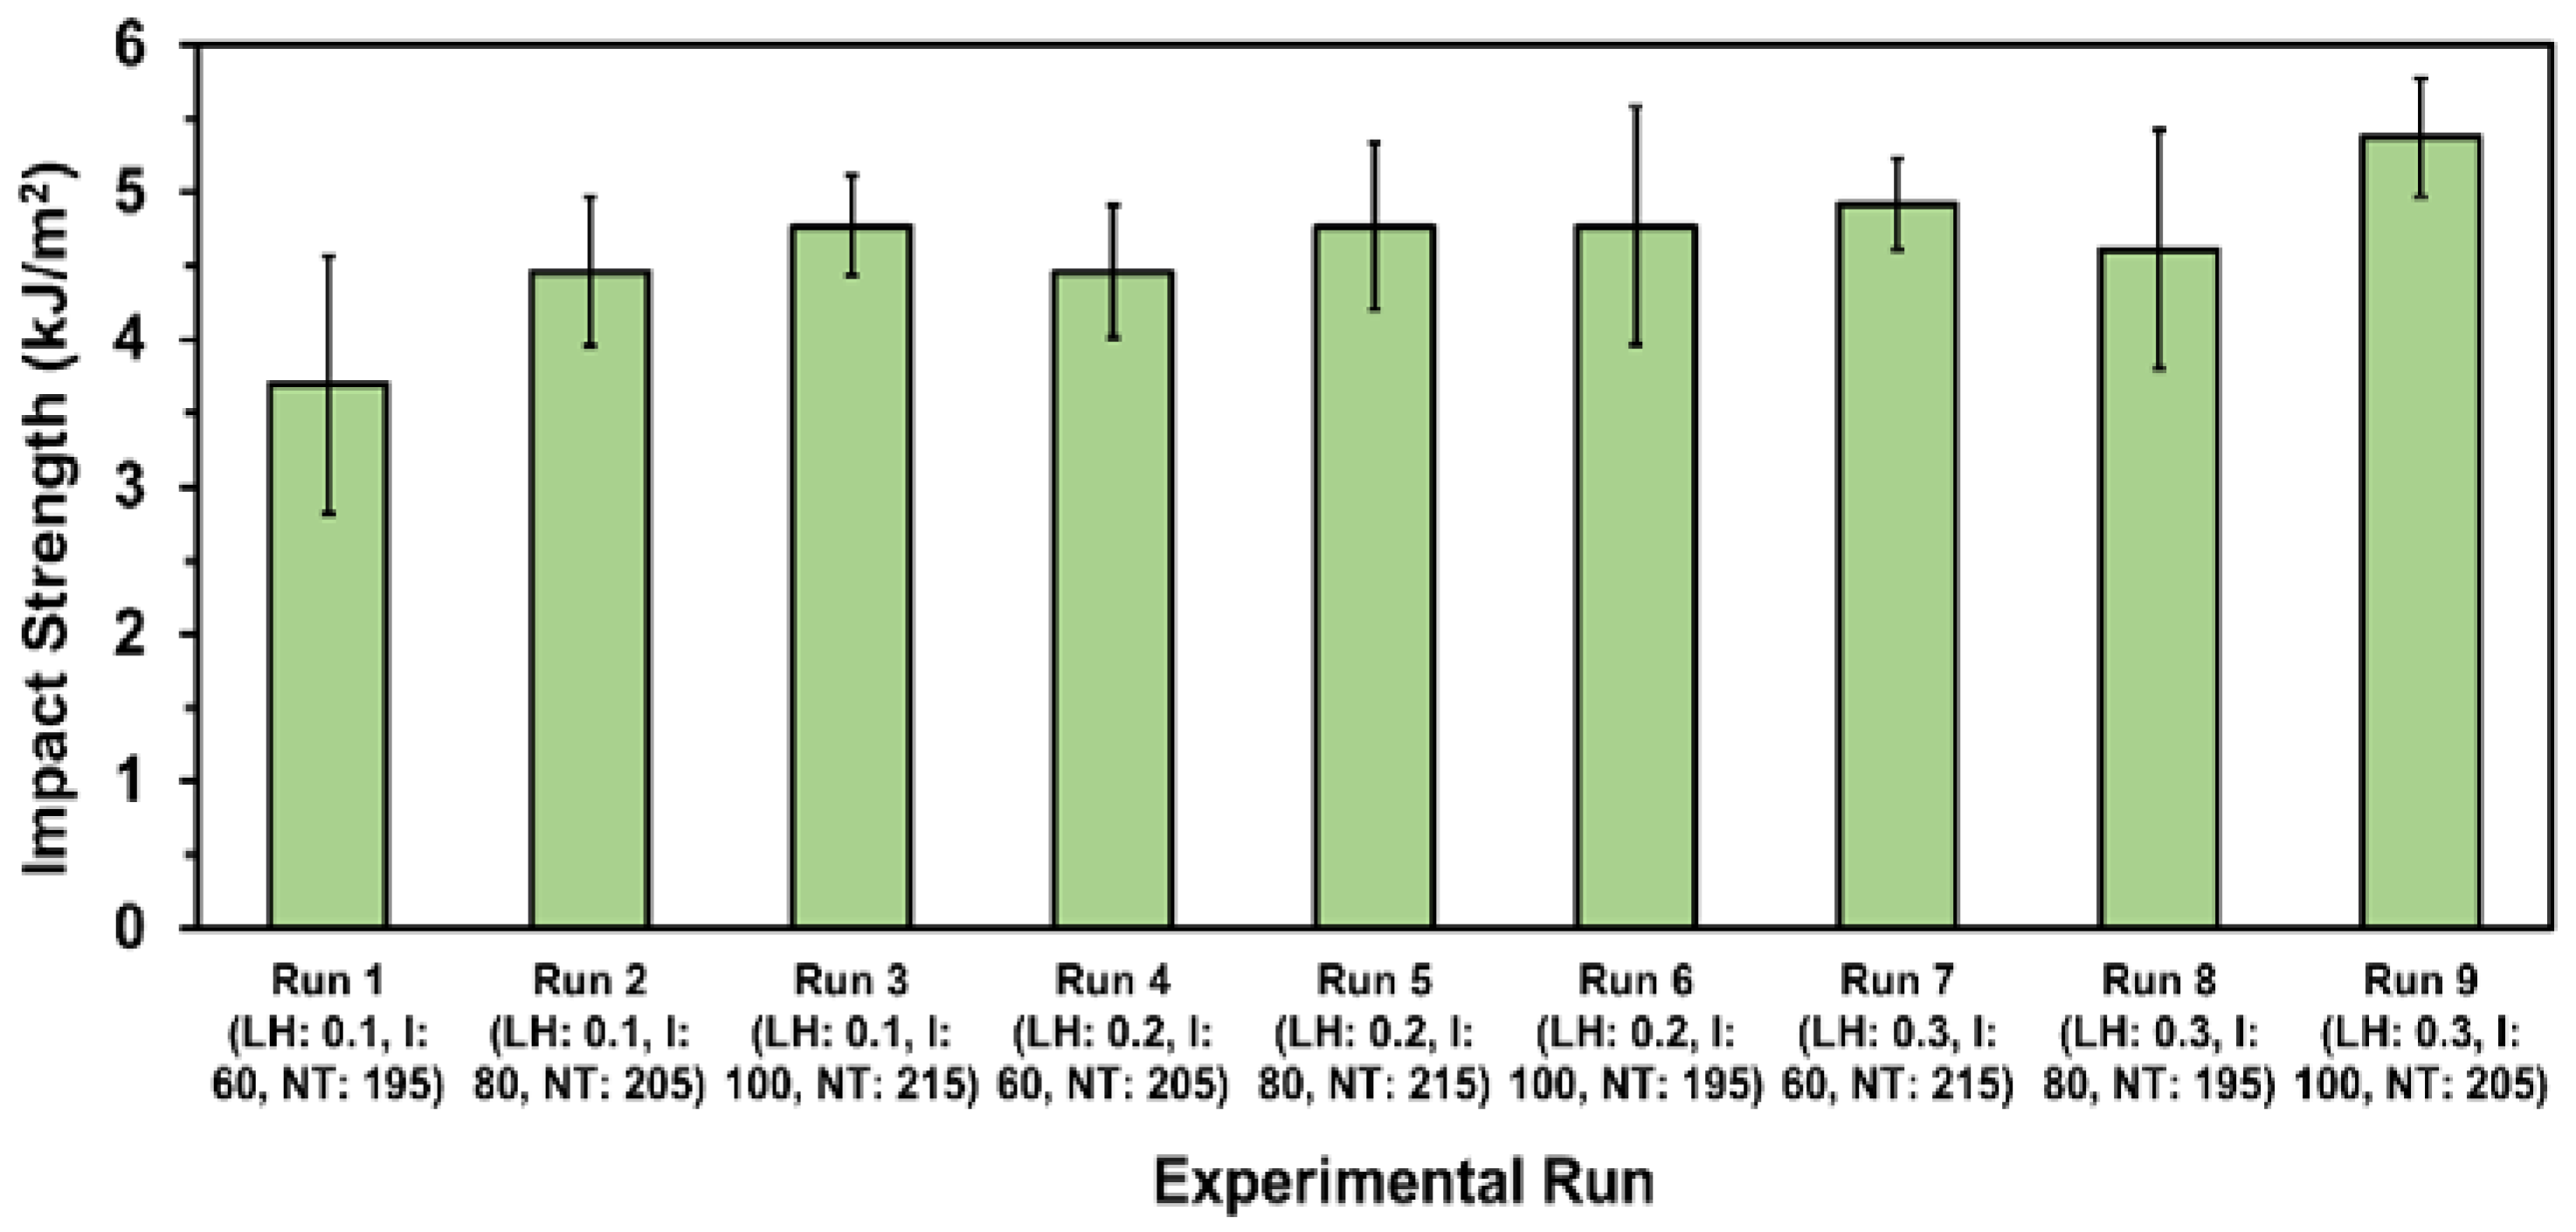
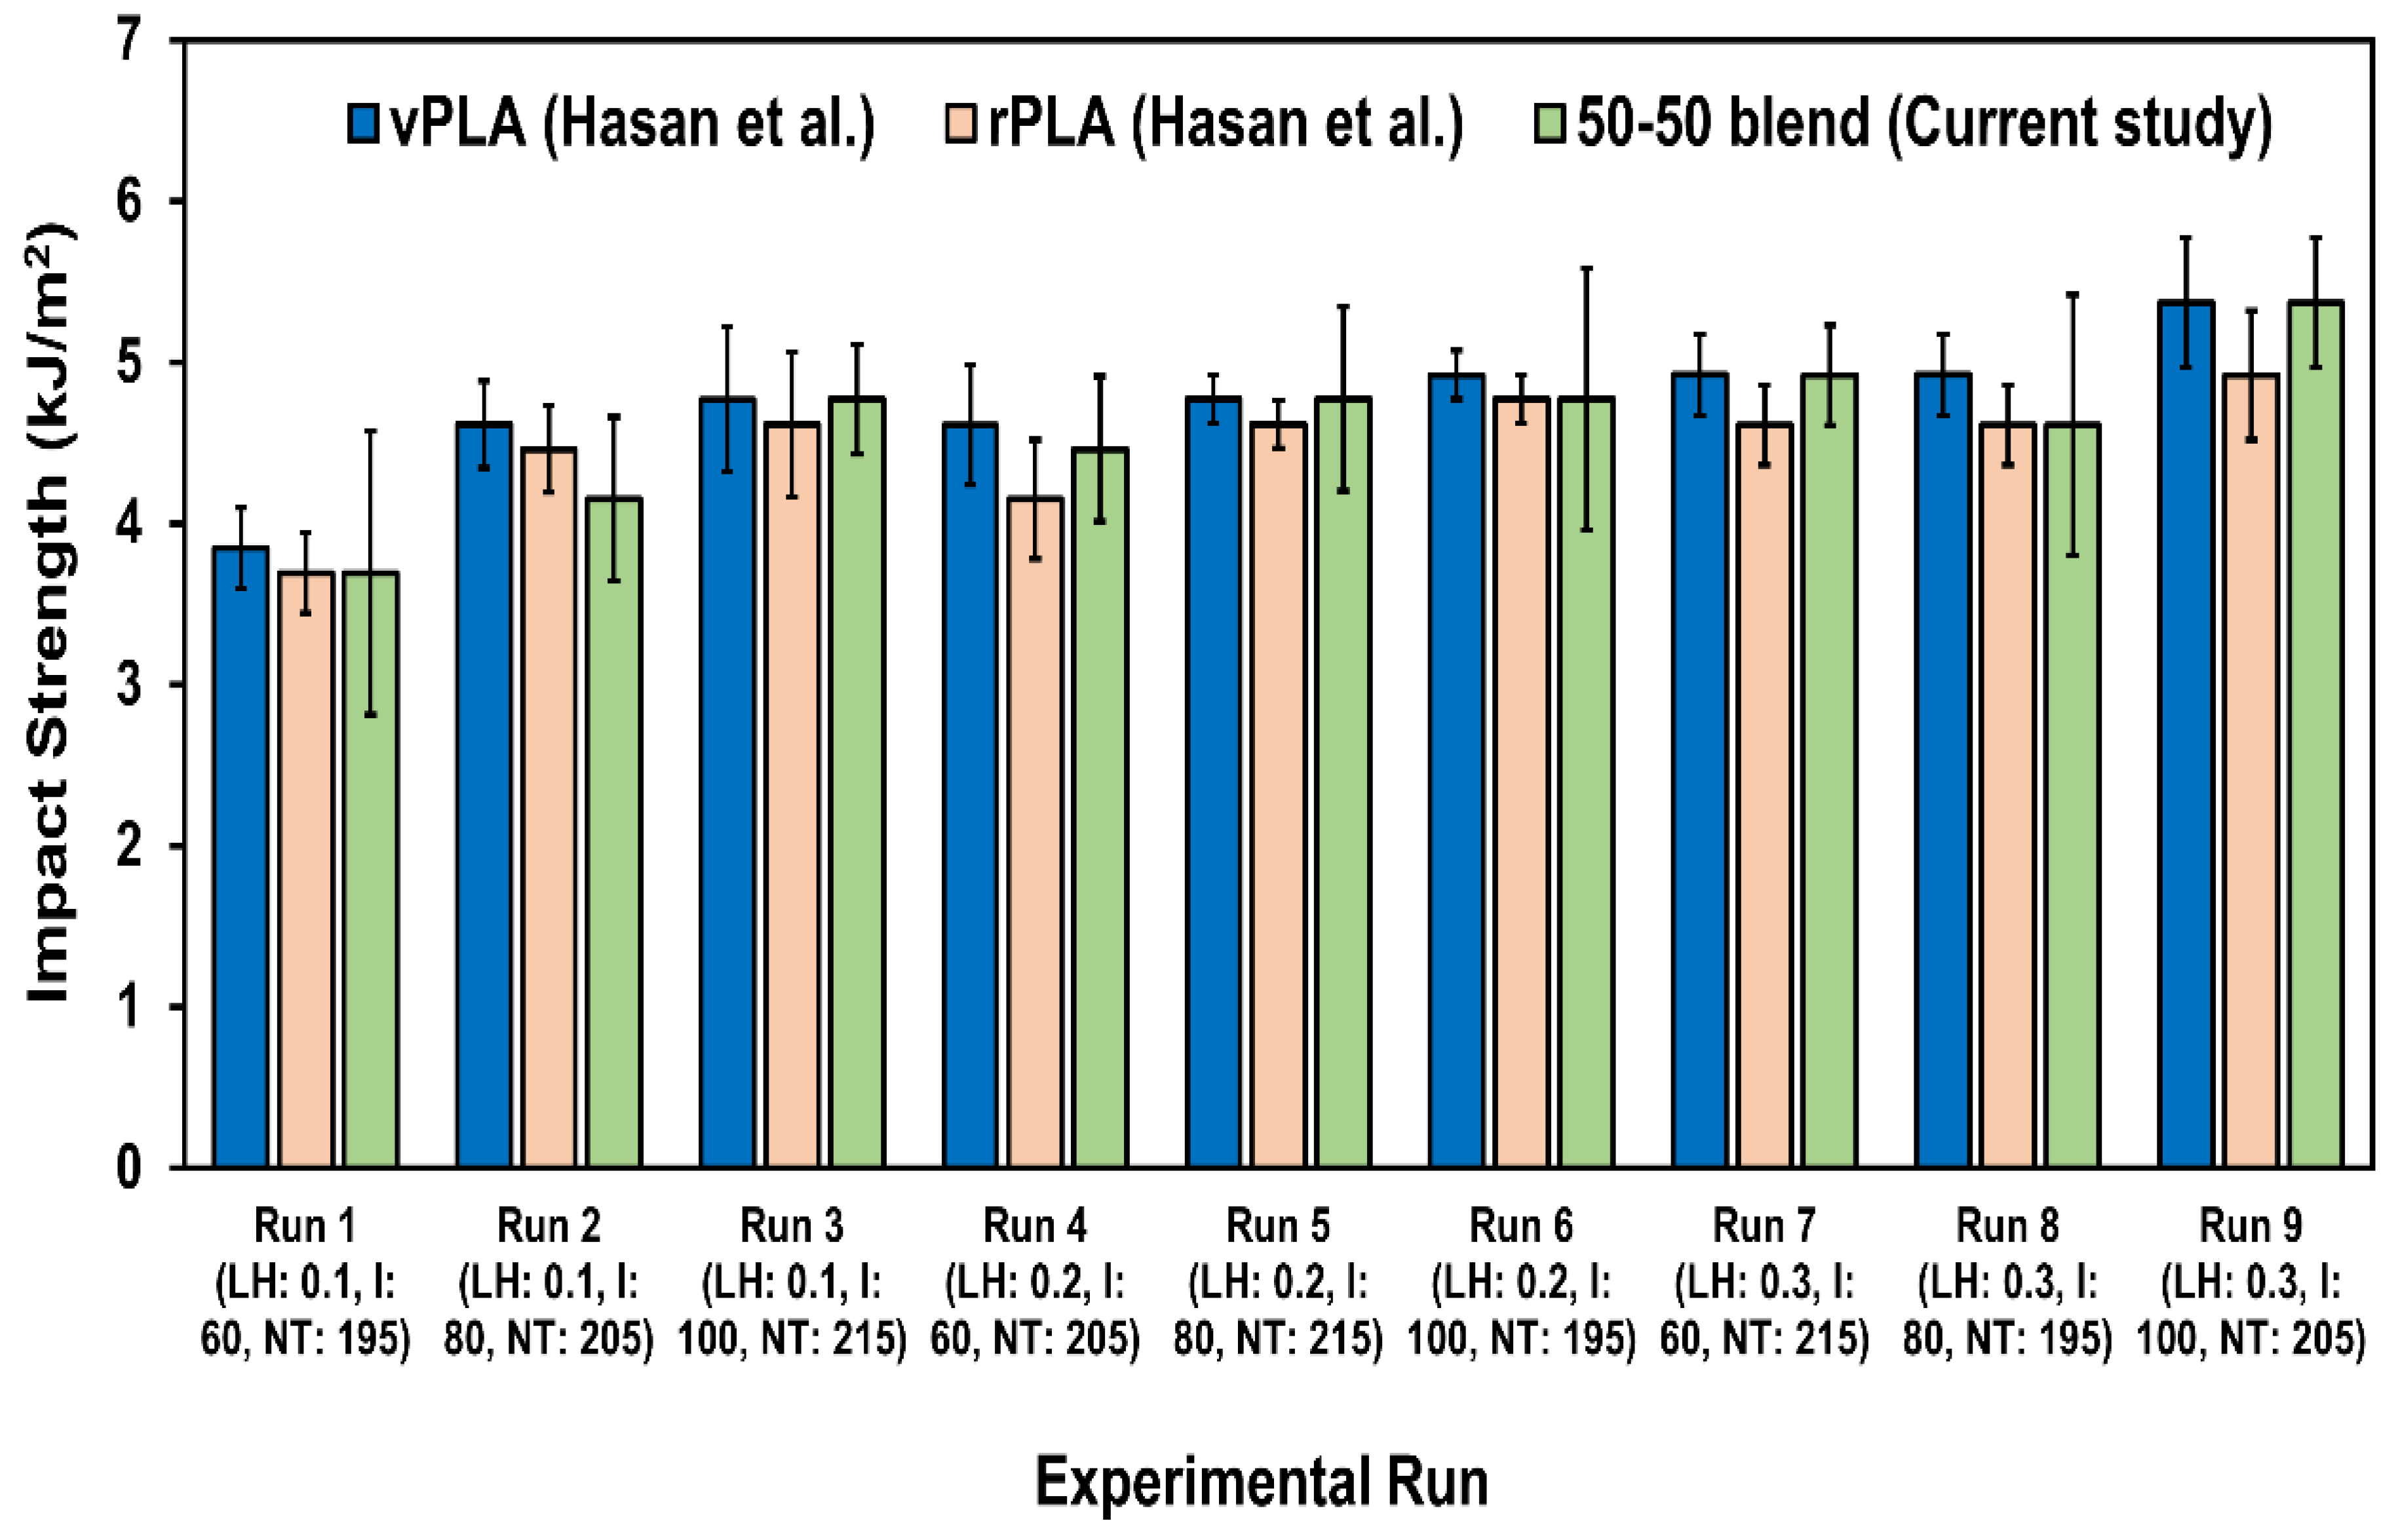
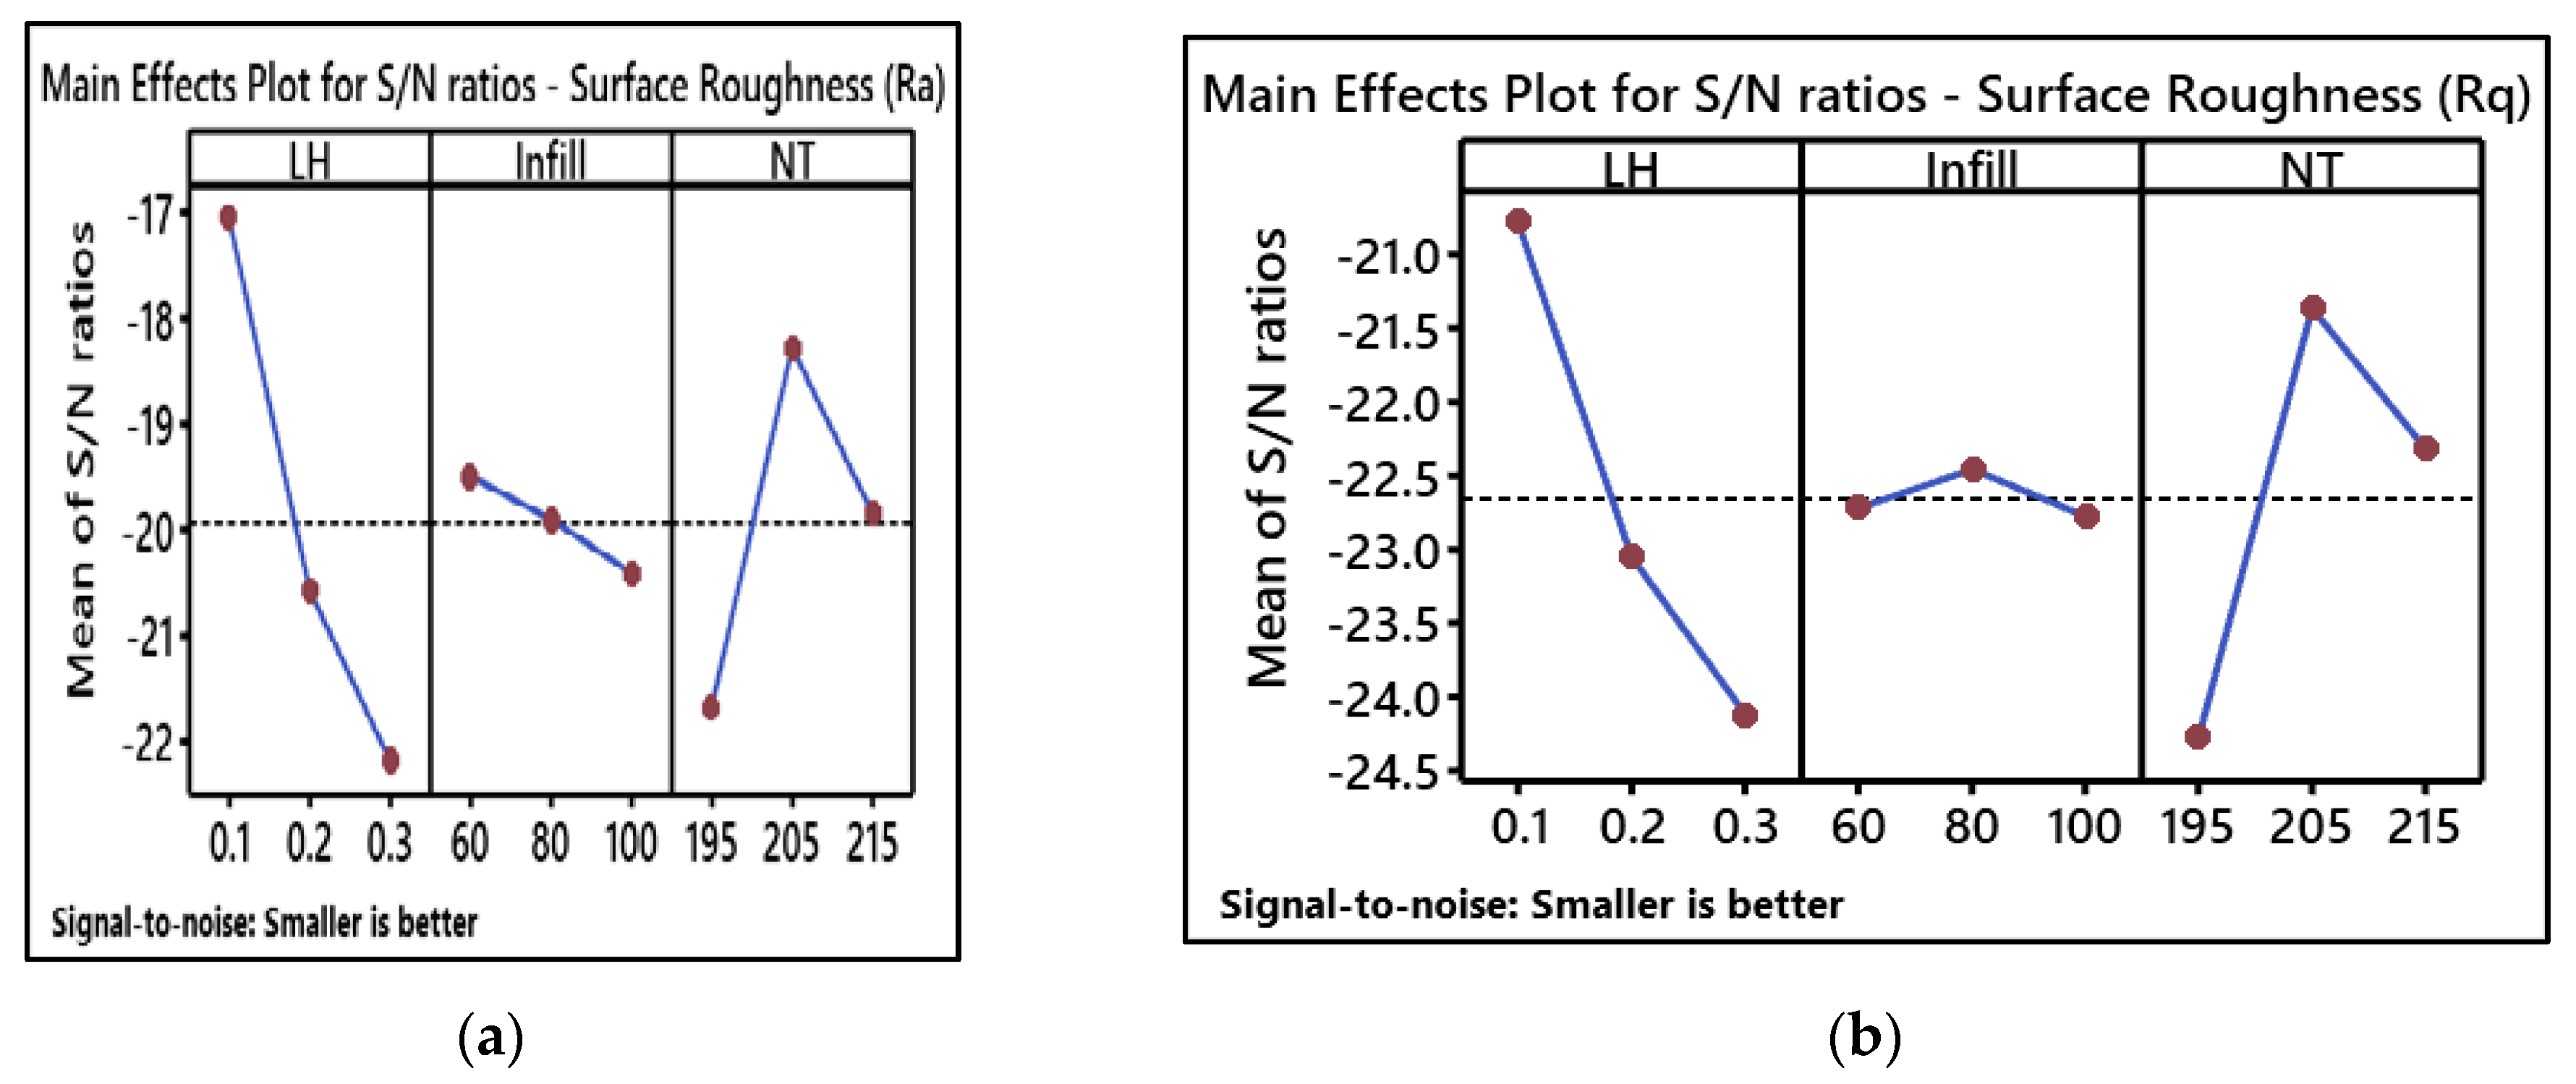
| Experimental Run | Yield Strength (MPa) | Ultimate tensile Strength (UTS) (MPa) |
Strain at UTS (%) |
Fracture Strength (MPa) | Strain at Fracture (%) | Elastic Modulus (GPa) | Work until UTS (kJ/m2) |
Work until Fracture (kJ/m2) |
|---|---|---|---|---|---|---|---|---|
| Run 1 (LH: 0.1, I: 60, NT: 195) | 25.35 ± 1.98 | 26.15 ± 2.95 | 2.09 ± 2.31 | 25.25 ± 1.56 | 2.90 ± 1.86 | 1.98 ± 1.15 | 21.97 ± 1.58 | 35.81 ± 1.51 |
| Run 2 (LH: 0.1, I: 80, NT: 205) | 28.72 ± 2.25 | 29.40 ± 2.85 | 2.13 ± 2.10 | 27.51 ± 1.85 | 3.15 ± 2.85 | 2.02 ± 1.17 | 23.36 ± 1.02 | 46.61 ± 1.92 |
| Run 3 (LH: 0.1, I: 100, NT: 215) | 28.12 ± 2.10 | 36.01 ± 1.85 | 2.14 ± 2.25 | 34.33 ± 1.93 | 3.05 ± 2.53 | 2.33 ± 1.02 | 28.62 ± 1.09 | 49.06 ± 1.52 |
| Run 4 (LH: 0.2, I: 60, NT: 205) | 31.24 ± 2.05 | 40.41 ± 1.12 | 2.12 ± 1.25 | 37.66 ± 1.83 | 3.03 ± 2.14 | 2.65 ± 1.05 | 32.25 ± 1.19 | 67.50 ± 1.38 |
| Run 5 (LH: 0.2, I: 80, NT: 215) | 41.85 ± 1.95 | 46.67 ± 1.98 | 2.20 ± 1.45 | 44.95 ± 1.84 | 3.41 ± 1.97 | 2.85 ± 1.14 | 39.74 ± 1.14 | 75.52 ± 1.52 |
| Run 6 (LH: 0.2, I: 100, NT: 195) | 32.37 ± 1.91 | 42.22 ± 2.25 | 2.17 ± 1.58 | 38.83 ± 1.79 | 3.42 ± 2.05 | 2.70 ± 1.54 | 34.18 ± 1.27 | 66.98 ± 1.24 |
| Run 7 (LH: 0.3, I: 60, NT: 215) | 43.64 ± 1.68 | 48.88 ± 1.56 | 2.37 ± 1.87 | 46.05 ± 1.89 | 3.35 ± 2.61 | 3.20 ± 1.32 | 42.31 ± 1.34 | 77.66 ± 1.34 |
| Run 8 (LH: 0.3, I: 80, NT: 195) | 34.01 ± 1.81 | 43.62 ± 2.10 | 2.14 ± 2.37 | 38.92 ± 1.87 | 3.69 ± 2.13 | 2.75 ± 1.29 | 34.524± 1.51 | 75.36 ± 1.05 |
| Run 9 (LH: 0.3, I: 100, NT: 205) | 43.47 ± 1.88 | 47.78 ± 2.54 | 2.28 ± 2.21 | 47.35 ± 1.94 | 3.54 ± 2.10 | 3.40 ± 1.18 | 42.51 ± 1.24 | 77.74 ± 1.19 |
| Experimental Run | Yield Stress (MPa) |
Flexural Stress (MPa) |
Flexural Strain (%) |
Elastic Modulus (GPa) |
Work until Maximum Flexural Stress (kJ/m2) |
|---|---|---|---|---|---|
| Run 1 (LH: 0.1, I: 60, NT: 195) | 43.76 ± 3.21 | 51.01 ± 1.86 | 6.69 ± 1.89 | 1.97 ± 1.26 | 19.09 ± 2.83 |
| Run 2 (LH: 0.1, I: 80, NT: 205) | 54.04 ± 2.56 | 63.81 ± 2.10 | 7.69 ± 2.67 | 2.15 ± 2.57 | 25.86 ± 2.01 |
| Run 3 (LH: 0.1, I: 100, NT: 215) | 59.32 ± 2.21 | 67.23 ± 2.92 | 6.71 ± 2.15 | 2.29 ± 2.93 | 28.78 ± 2.12 |
| Run 4 (LH: 0.2, I: 60, NT: 205) | 63.80 ± 2.21 | 77.20 ± 2.04 | 6.25 ± 2.65 | 2.52 ± 2.34 | 33.49 ± 2.05 |
| Run 5 (LH: 0.2, I: 80, NT: 215) | 71.13 ± 2.14 | 84.23 ± 2.09 | 8.40 ± 2.39 | 2.65 ± 2.01 | 42.34 ± 2.45 |
| Run 6 (LH: 0.2, I: 100, NT: 195) | 69.19 ± 2.76 | 77.18 ± 1.67 | 7.64 ± 2.95 | 2.44 ± 1.85 | 36.30 ± 1.54 |
| Run 7 (LH: 0.3, I: 60, NT: 215) | 77.34 ± 2.89 | 88.36 ± 1.47 | 7.07 ± 2.28 | 2.89 ± 2.01 | 37.92 ± 2.31 |
| Run 8 (LH: 0.3, I: 80, NT: 195) | 70.87 ± 3.90 | 81.37 ± 1.85 | 6.92 ± 1.12 | 2.50 ± 1.45 | 37.19 ± 1.41 |
| Run 9 (LH: 0.3, I: 100, NT: 205) | 78.11 ± 2.29 | 88.29 ± 2.17 | 7.82 ± 2.56 | 2.67 ± 2.20 | 45.19 ± 2.07 |
| Factors | Tensile Strength | Flexural Strength | Impact Strength | Shore D hardness | Surface Roughness | |||||
|---|---|---|---|---|---|---|---|---|---|---|
| Level | Description | Level | Description | Level | Description | Level | Description | Level | Description | |
| Layer Height (mm) | 3 | 0.3 | 3 | 0.3 | 3 | 0.3 | 3 | 0.3 | 1 | 0.1 |
| Infill (%) | 3 | 100 | 3 | 100 | 3 | 100 | 3 | 100 | 1 | 60 |
| Nozzle Temperature (°C) | 3 | 215 | 3 | 215 | 2 | 205 | 3 | 215 | 2 | 205 |
Disclaimer/Publisher’s Note: The statements, opinions and data contained in all publications are solely those of the individual author(s) and contributor(s) and not of MDPI and/or the editor(s). MDPI and/or the editor(s) disclaim responsibility for any injury to people or property resulting from any ideas, methods, instructions or products referred to in the content. |
© 2024 by the authors. Licensee MDPI, Basel, Switzerland. This article is an open access article distributed under the terms and conditions of the Creative Commons Attribution (CC BY) license (http://creativecommons.org/licenses/by/4.0/).


