1. Introduction
To develop efficient energy storage systems such as supercapacitors and batteries, the design of electrode materials and the manufacture of active materials emerge as essential requirements [
1,
2,
3,
4,
5,
6]. Materials with high power density, long cycle life, and fast charge–discharge characteristics are key requirements for these energy storage devices. In particular, redox-active materials [
7,
8] comprising π- conjugated bonded polymers or inorganic oxides (such as ruthenium oxide) [
9] have been mainly used as active materials in supercapacitors. In the case of inorganic oxides, the charge storage mechanism involves only the surface of the oxide particles because their capacity is limited by surface area, while redox-active polymers have the advantage of being designed to ensure that the entire volume of the polymer is involved in the charge storage process, and their capacities are much higher than those of oxide devices. Other advantages of redox-active polymers include low cost, high conductivity, chemical stability, and ease of designing nanostructures with large surface areas. However, the charge storage capacity and energy density of energy storage systems, especially supercapacitors, still require further improvement. Recently, polyaniline and polypyrrole (PPy), which are π-conjugated polymers, have been widely studied because they have excellent conductivity, are very stable in air, and are advantageous for manufacturing film-type cells or ultralight cells [
7,
8,
9,
10]. In particular, conductive carbon particles, carbon nanotubes, and graphene, which form a conductive network from a complex combined with a conductive polymer, and materials with electrochemically improved physical properties have emerged as subjects of greater interest [
11,
12,
13,
14,
15]. In addition, effective properties can be obtained using nanosized metals or metal oxides, such as iron, manganese, cobalt or vanadium oxide, and iron oxide, as hybridization materials with π-conjugated polymers, which enhance ion diffusion throughout the material and ultimately oxidation [
16,
17].
In this study, we successfully synthesized nitrate-doped PPy capped silver nanowire (Ag NW) nanorod-shaped architectures (Ag NW@PPy) using a simple suspension polymerization method and observed high-performance supercapacitor properties with cycling stability. The Ag NWs surrounded by nitrate-doped PPy formed one-dimensional (1-D) structures with the structural characteristics of a core–shell structure. More importantly, the Ag NWs were first hybridized with a pseudomaterial (PPy) and then assembled into electrodes, and the two materials were tightly bonded in a core–shell structure. The core–shell structure was characterized by a coaxial conductive PPy layer as the outer shell and a highly conductive Ag NW core on the inside. PPy was chosen because it has high electrical conductivity and can enable rapid redox reactions and stable storage/charge processes, and Ag NWs with excellent conductivity were used to improve the capacitance [
18,
19,
20]. However, the incorporation of Ag NWs into the PPy capped structure resulted in improved electrical conductivity, and the Ag NWs acted as efficient conductive pathways, facilitating rapid charge transfer and reducing the internal resistance. The core–shell design of Ag NWs wrapped by PPy provides a high aspect ratio, and this elongated geometry enhances the surface area available for charge storage, leading to increased capacitance. In summary, supercapacitors using these core–shell Ag NW@PPy nanostructures can achieve remarkable performance in terms of electrical conductivity and capacitance, and these nanostructures have the potential for useful applications in energy storage devices.
3. Results and Discussion
Core–shell rod-shaped Ag NW@PPy nanomaterials were successfully synthesized using a simple suspension polymerization technique, as shown in
Scheme 1. In this study, Ag NWs were dispersed in an aqueous solution (0.1 wt%) and mixed with pyrrole monomer to create pseudomaterials, and Ag NW@PPy was prepared via suspension polymerization. As a result, a 1-D Ag NW@PPy with a core–shell structure was created, in which a thin layer composed of conductive PPy chains was assembled as an active material on the surface of the Ag NW, as shown in
Figure 1. Structurally, during polyol synthesis, the 1-D Ag NWs were thinly capped with a polymeric surfactant containing CO groups on the surface so that they can chemically bond with the NH groups present in the conductive PPy chains [
21]. The thickness of the PPy layer was controlled by the amount of pyrrole monomer added during suspension polymerization (
Scheme 1). Here, PPy refers to conductive PPy doped with nitrate. Solubility and processability were improved by nitrate doping, and the critical order and electrical conductivity increased. Following the procedure in
Scheme 1, 1-D Ag NW with a thickness of 50 nm and a length of 15 µm were used, and the PPy layers polymerized to them were 10 nm (sample 1, Ag NW@10-nm PPy), 40 nm (sample 2, Ag NW@40-nm PPy), 50 nm (sample 3, Ag NW@50-nm PPy), and 60 nm (sample 4, Ag NW@60-nm PPy). In rod-shaped Ag NW@PPy, PPy has been shown to significantly improve the electrical conductivity by more easily transferring electrons to the metallic Ag NW and expanding the electron transport path. However, a 1-D material consisting of a highly conductive Ag NW core and a high-capacity PPy shell can exhibit properties that can improve the electrochemical performance of supercapacitor devices by improving charge transport ability and reducing the overall electrical resistance.
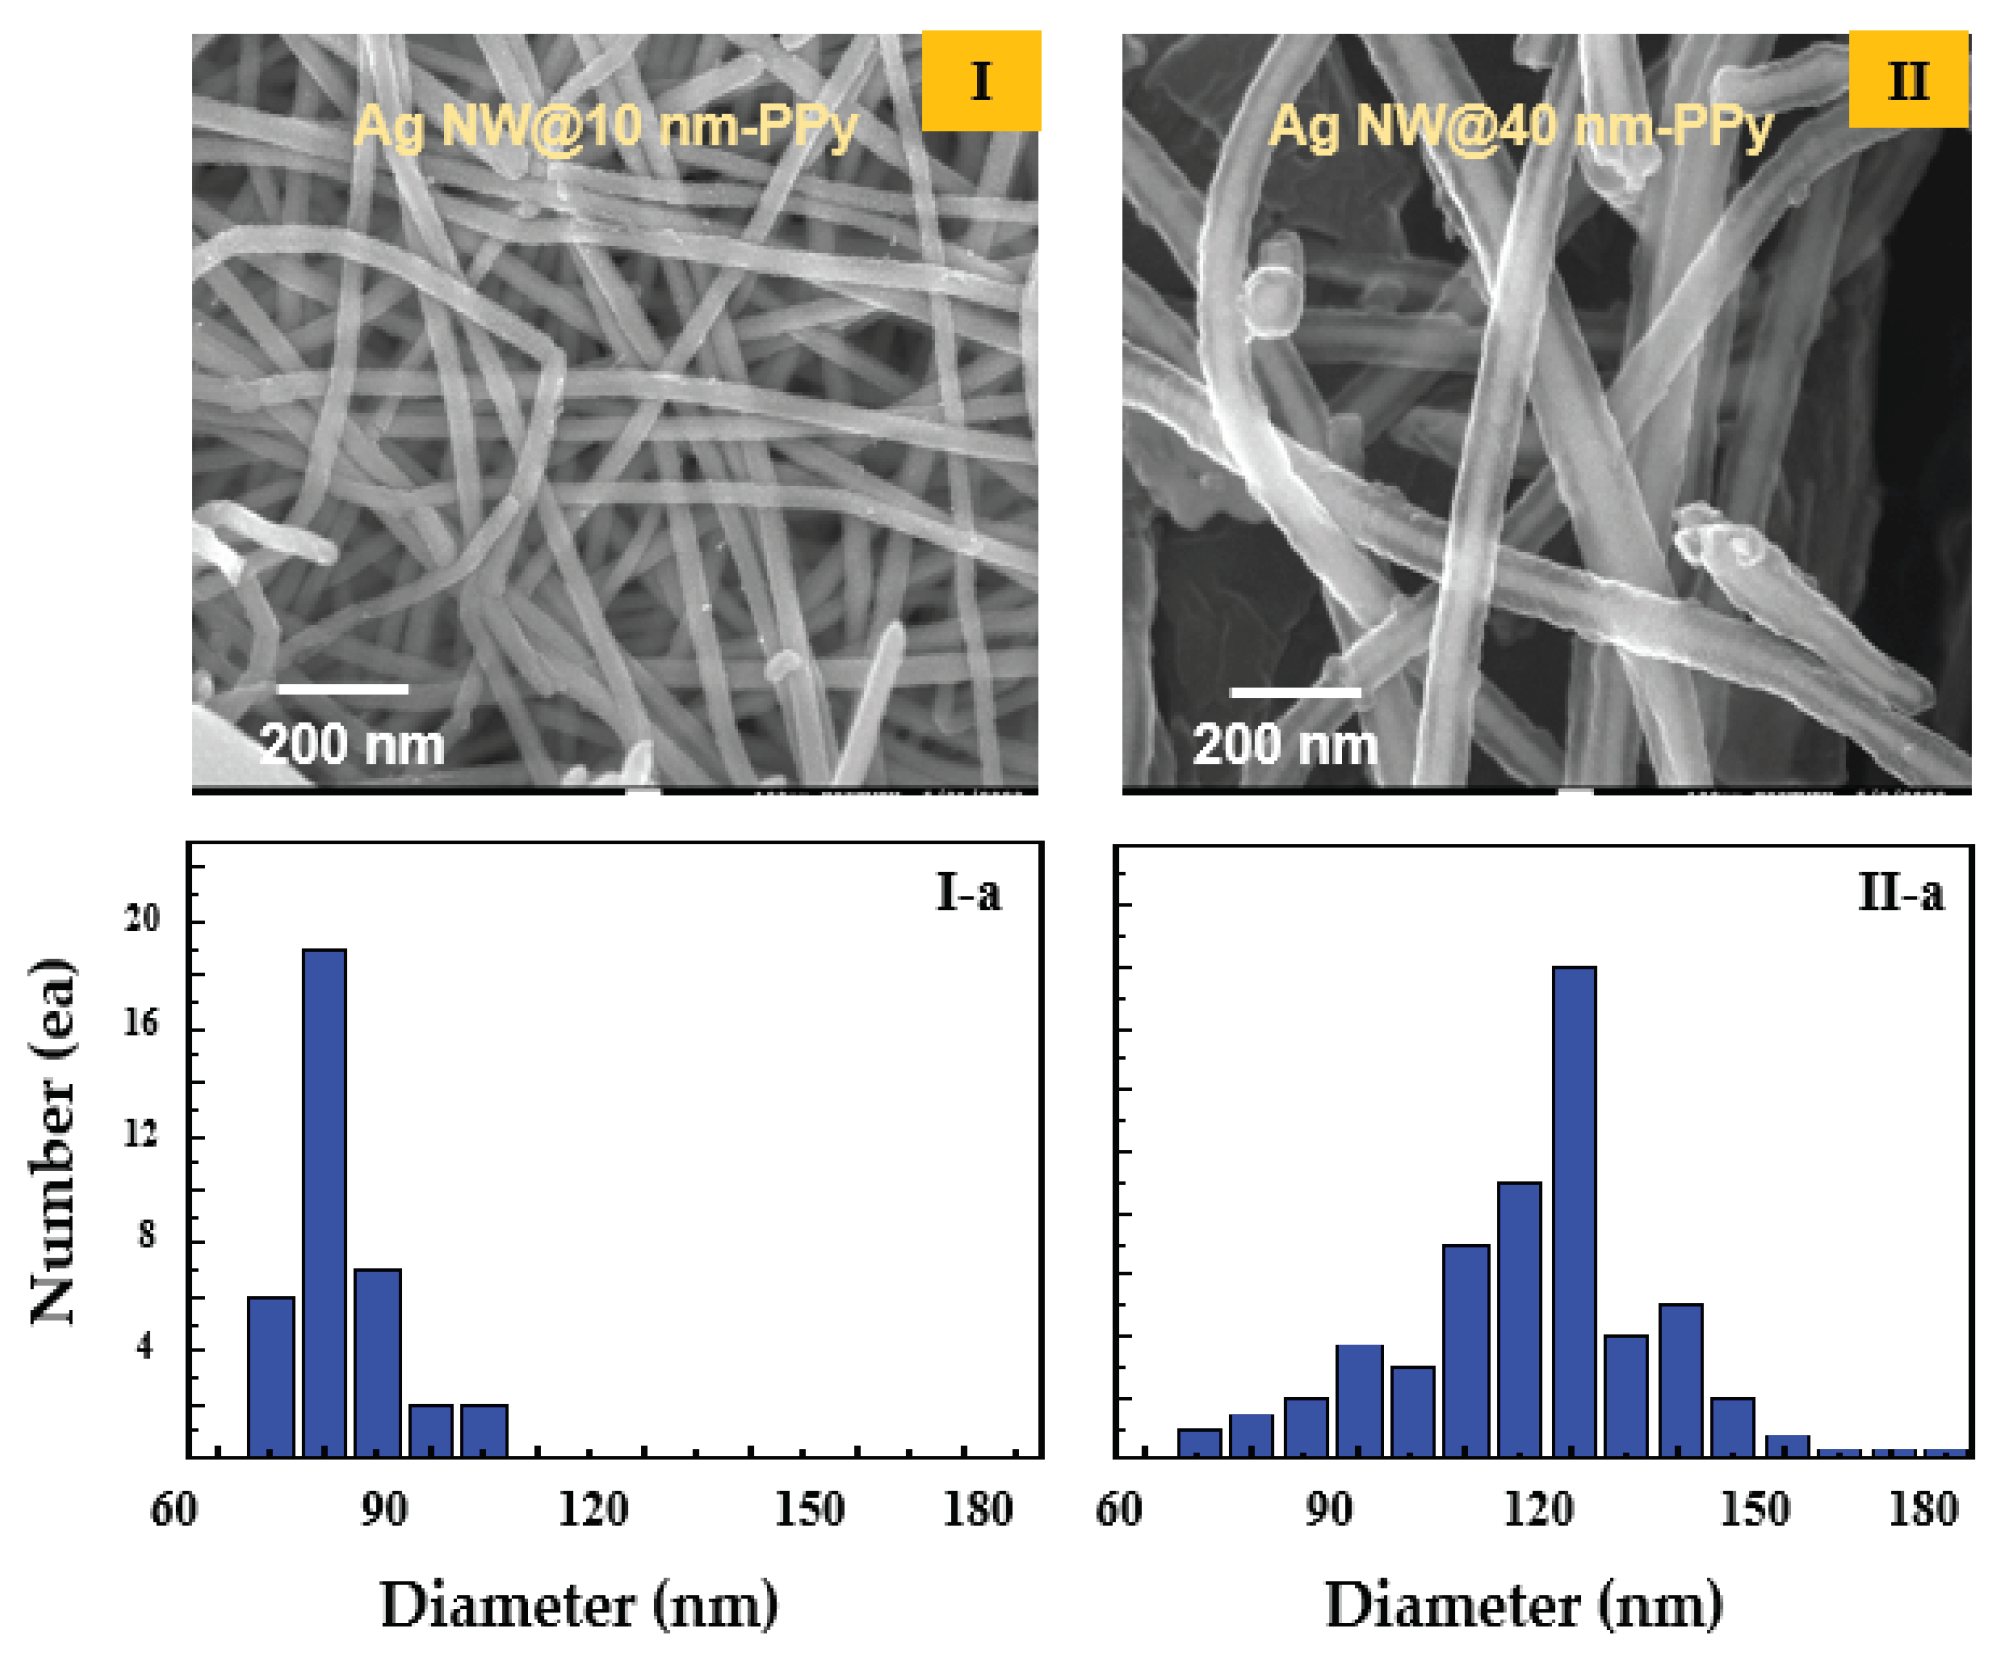
Figure 1(I) and
Figure 1(II) show the SEM images and diameter distributions of two samples of the synthesized Ag NW@PPy nanocomposites. The SEM images of the Ag NW@PPy nanocomposites show a well-defined core–shell structure with the Ag NWs impregnated into PPy in the form of single coaxial nanorods. Their structures exhibited 1-D morphologies with a length of approximately 15 µm and average diameters of 70 nm [
Figure 1(I), sample 1] and 130 nm [
Figure 1(II), sample 2]. The Ag NW@PPy nanocomposites were surrounded by PPy layers of approximately 10 nm (sample 1) and 40 nm (sample 2) on the outer surface of the Ag NWs with a diameter of 50 nm and a length of 15 µm.
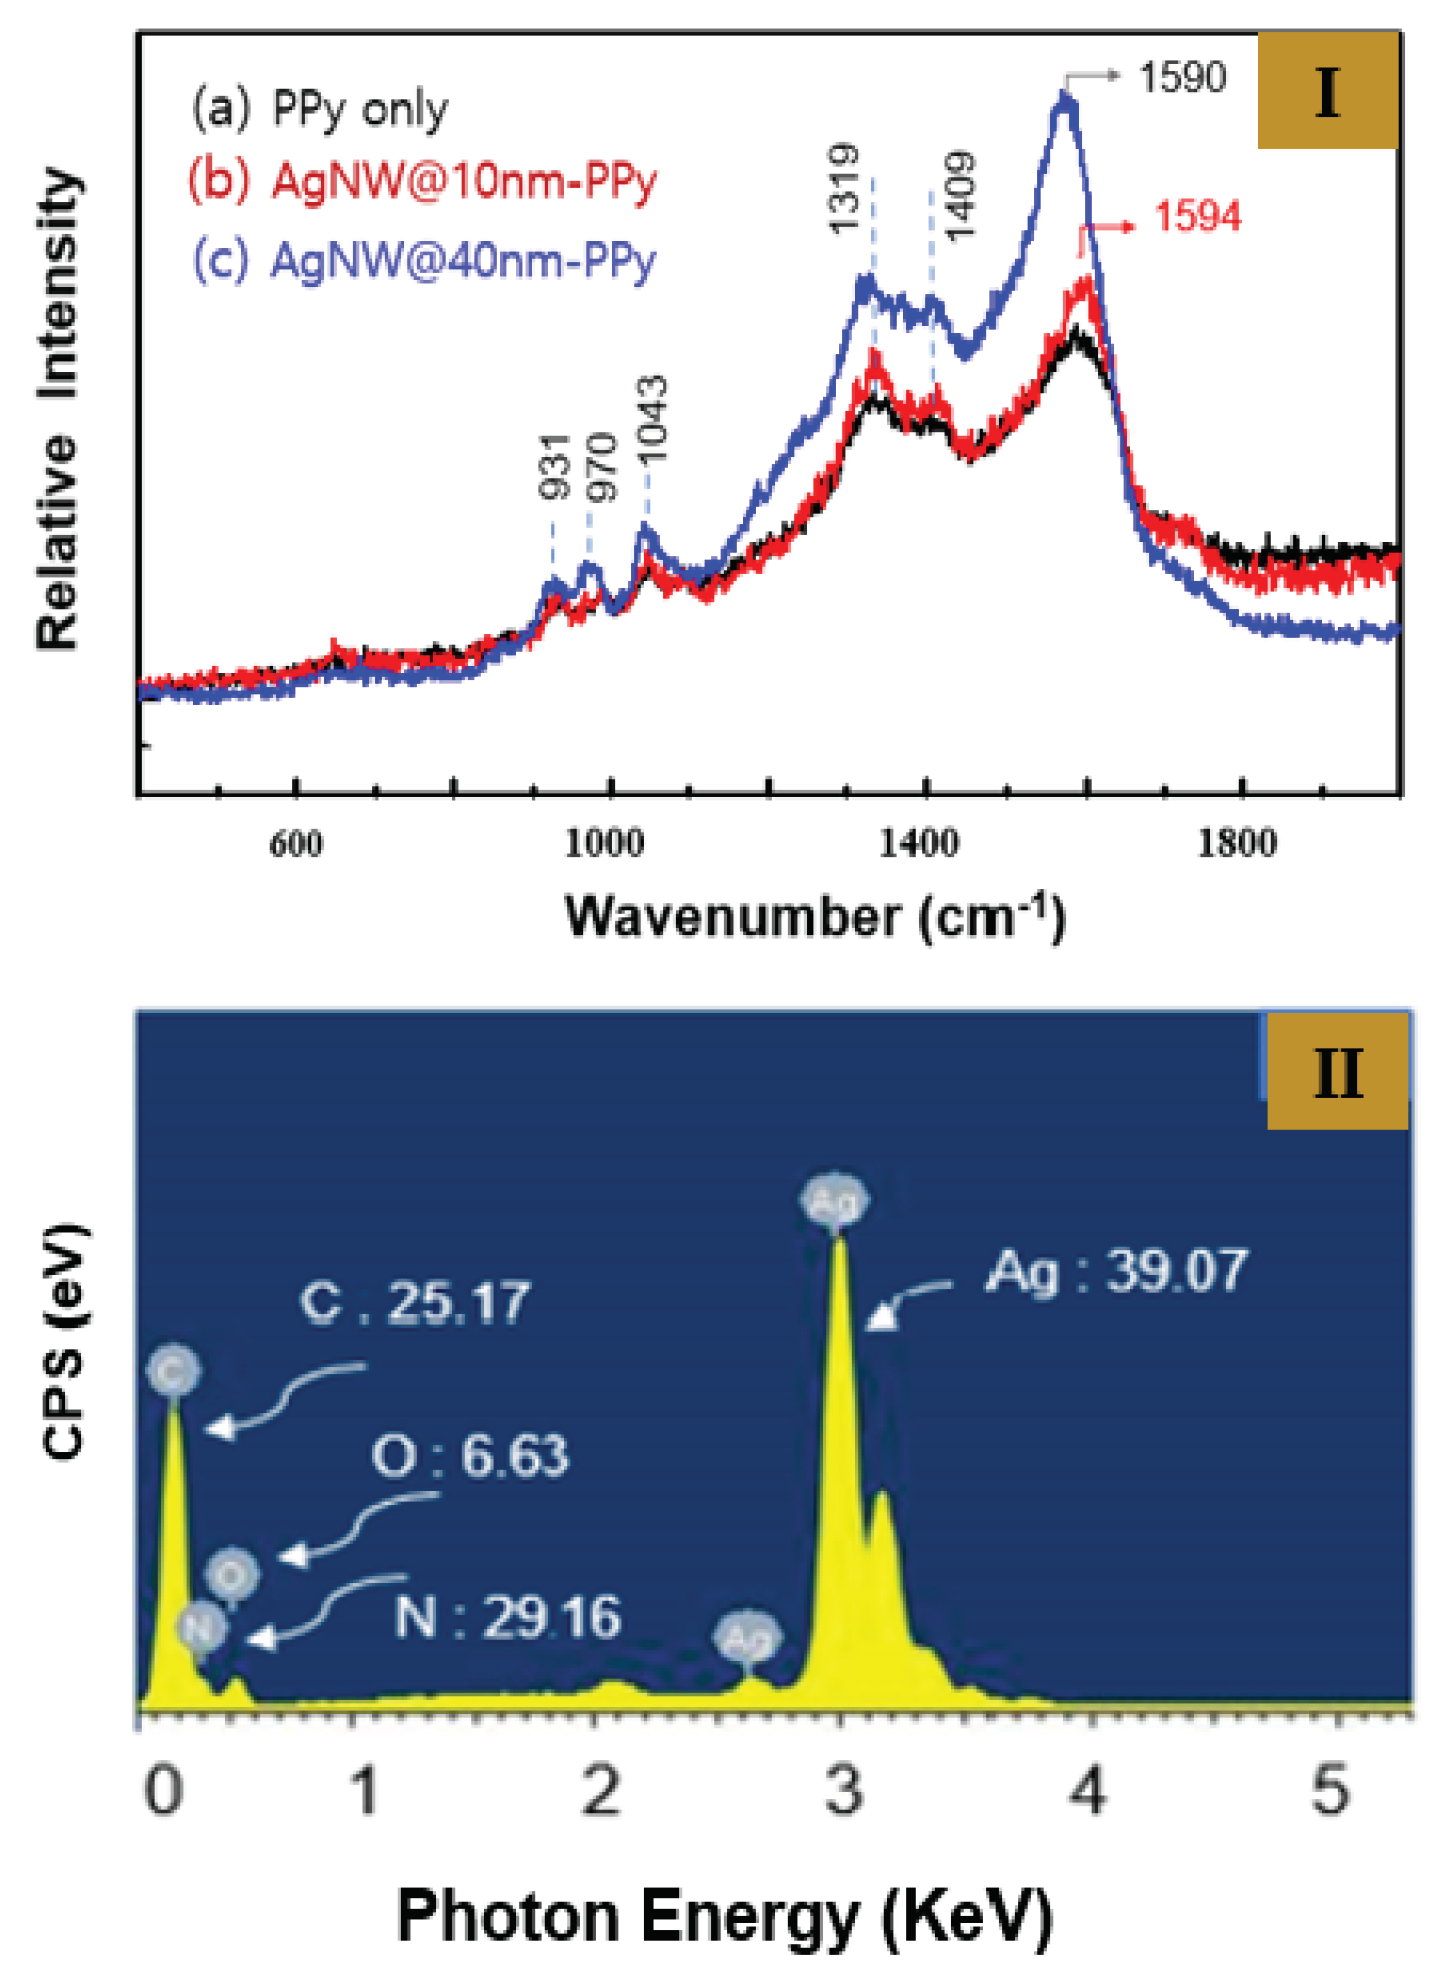
Figure 2 (I) shows the Raman data measured for the structural analysis of sample 1 and 2. Through Raman spectroscopic analysis, we were able to clearly prove the molecular structure of PPy doped with nitrate (NO
3−) surrounding the outer side of the Ag NWs. The Ag NW@PPy nanorods were prepared by suspension polymerization on the Ag NW surface through a facile redox reaction between pyrrole monomer and silver nitrate. During the redox reaction, the pyrrole monomer and silver nitrate acted as the reducing agent and doping, respectively. The pyrrole monomer bound to the Ag NW surface polymerizes with the dopant (nitrate) to form a thin layer on the Ag NW, and trace silver particles were generated and adsorbed on the PPy polymer surface. As a result, an Ag NW@PPy with a core–shell structure surrounded by nitrate-doped PPy on the Ag NW surface was formed.
Figure 2(I-a) shows the Raman data obtained from pure PPy nanoparticles, and
Figure 2(I-b) and
Figure 2(I-c) show the data obtained from samples 1 and 2, respectively, which were surrounded by PPy with thicknesses of 10 and 40 nm (Ag NW@10-nm PPy and Ag NW@40-nm PPy), respectively. In the Raman spectrum of the obtained Ag NW@PPy, the peaks at 1,590–1,594, 1409, 1319, 1043, 970, and 931 cm
−1 are attributed to the C–C/C=C and C–H/C–N stretching bands due to the quinoid structure of pyrrole ring, the C–N stretching of the pyrrole ring, the stretching of the positively charged C–NH
+ group, and the C–H out-of-plane pyrrole ring. In particular, the Raman spectrum of PPy is dominated by a band at approximately 1,319 cm
−1, which is assigned to the positively charged C–NH
+ stretching mode of the pyrrole ring generated by doping. In the figure, the C–C/C=C and C–H/C–N stretching modes due to the pyrrole ring in the range of 1319–1,594 cm
−1 show an increasing trend in their relative intensity in the Ag NW@PPy. In addition, their relative intensity increases with blue shift proportional to the PPy thickness.
Figure 2 (II) shows the energy dispersive X-ray spectroscopy (EDX) spectra of sample 2. These are the EDX data measured to analyze the composition of each atom constituting the Ag NW@PPy nanorods. The mass percentage of the Ag atoms was specifically estimated and compared with the contents of other components. In addition, the ratio of nitrogen to oxygen atoms newly created by doping was estimated. On the basis of the analysis, the weight contents of the major atoms such as C, O, N, and Ag were 25.17%, 6.63%, 29.16%, and 39.07%, respectively. In particular, 6.63% of oxygen atoms, which do not exist in PPy molecules, was observed, and nitrogen atoms were confirmed to be present in excess. These were interpreted as originating from the dopant (nitrate).
The synthesized Ag NW@PPy powder was mixed with super P, SWCNT, and PVDF binder in an NMP solvent to prepare a slurry, and the composited slurry materials were coated on a Cu foil. Under the three-electrode system, Pt and Ag/AgCl were used as the counter and reference electrodes, respectively. CV curves were first observed in 1-M KOH at scan rates between 1 and 50 mV/s, as shown in
Figure 3,
Figure 4 and
Figure 5. The Ag NW@PPy nanorods materials were evaluated under various conditions to confirm their applicability and charge/discharge characteristics as electrochemical supercapacitors. The experiments were particularly focused on evaluating the effect of PPy layer thickness difference on the capacitance of the Ag NW@PPy nanorods.
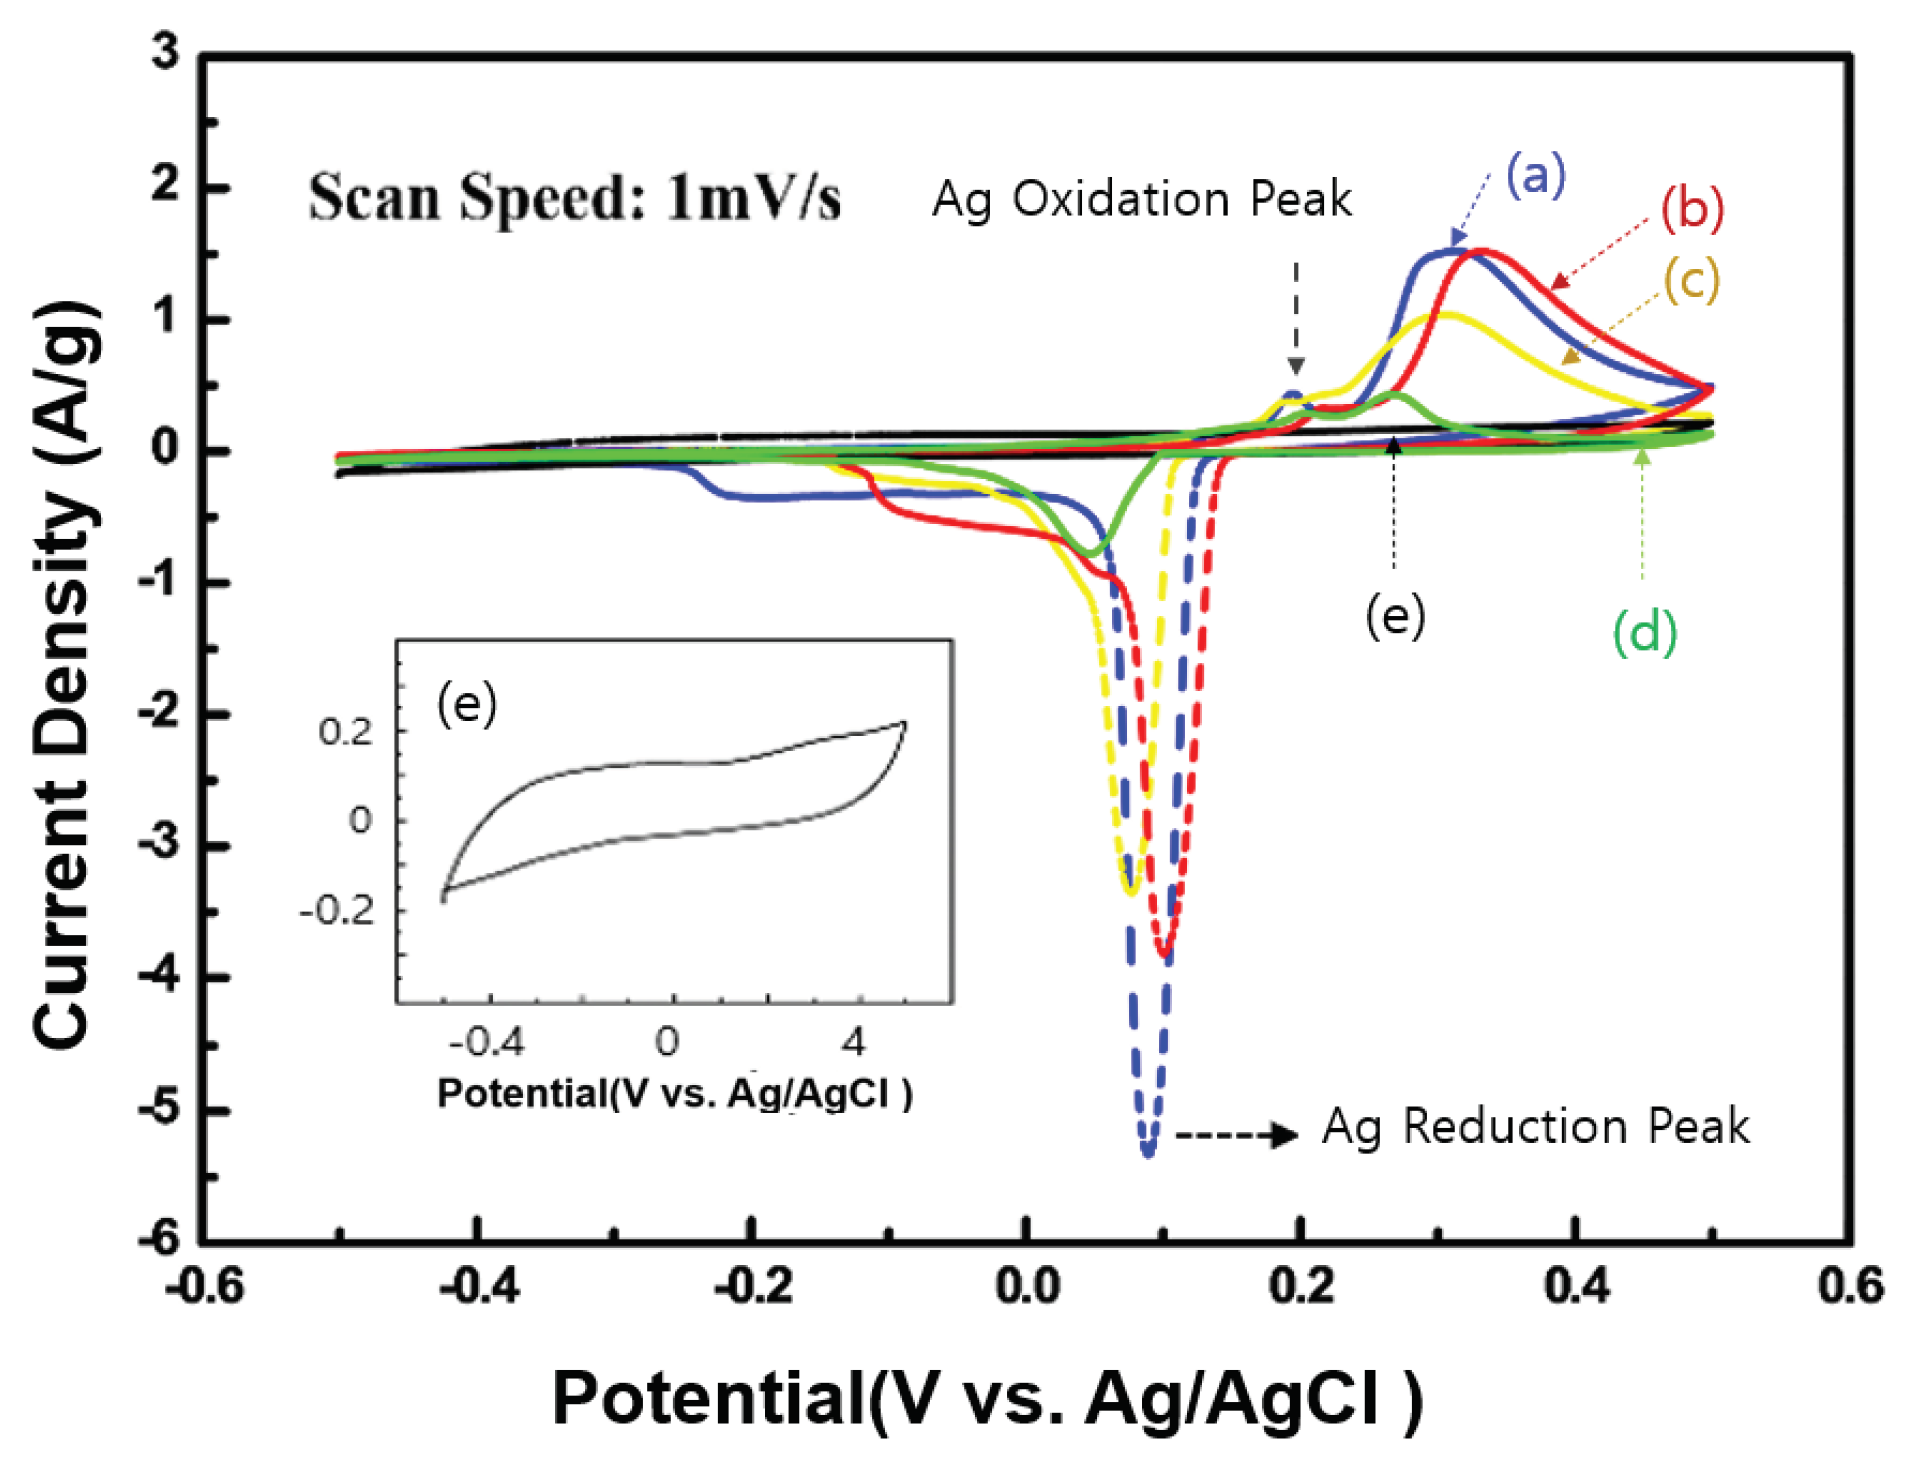
Figure 3 shows the CV properties of the four synthesized Ag NW@PPy nanorod samples (Ag NW@10-nm PPy, Ag NW@40-nm PPy, Ag NW@50-nm PPy, and Ag NW@60-nm PPy) and pure PPy (as a reference). Measurements were made in the range of –0.5 to +0.5V at a scan rate of 1 mV/s, and the capacitance was observed according to changes in the thickness of the PPy layer. The CV curves derived from all samples showed not only distinct pseudocapacitive behavior but also well-defined differences, which were attributed to oxidation and reductions. Two distinct peaks were measured at 0.20–0.32 V and 0.02–0.10 V, which were attributed to oxidation and reduction reactions, respectively [
22,
23]. As shown in
Figure 3, when the Ag NW was complexed with PPy, their redox potential is greatly improved by more than five times that of pure PPy, which was interpreted as the effect of Ag contained in Ag NW@PPy. This indicates that Ag NW@PPy has higher electrical conductivity than pure PPy, allowing for greater current flow. In addition, when 1-D Ag NW@PPy was coated on an Al foil, the film morphology formed a 3-D porous structure with a large surface area. Moreover, the porous form of this 3-D structure can provide a larger surface area for interaction with electrolyte ions in the cell. Therefore, it can be proven that Ag NW@PPy with a 1-D structure will store more charges than pure PPy. The inset in
Figure 3 shows an enlarged version of the CV curve of pure PPy. However, in Ag NW@PPy, when the PPy thickness was greater than 60 nm, there were few peaks due to the redox reaction of Ag.
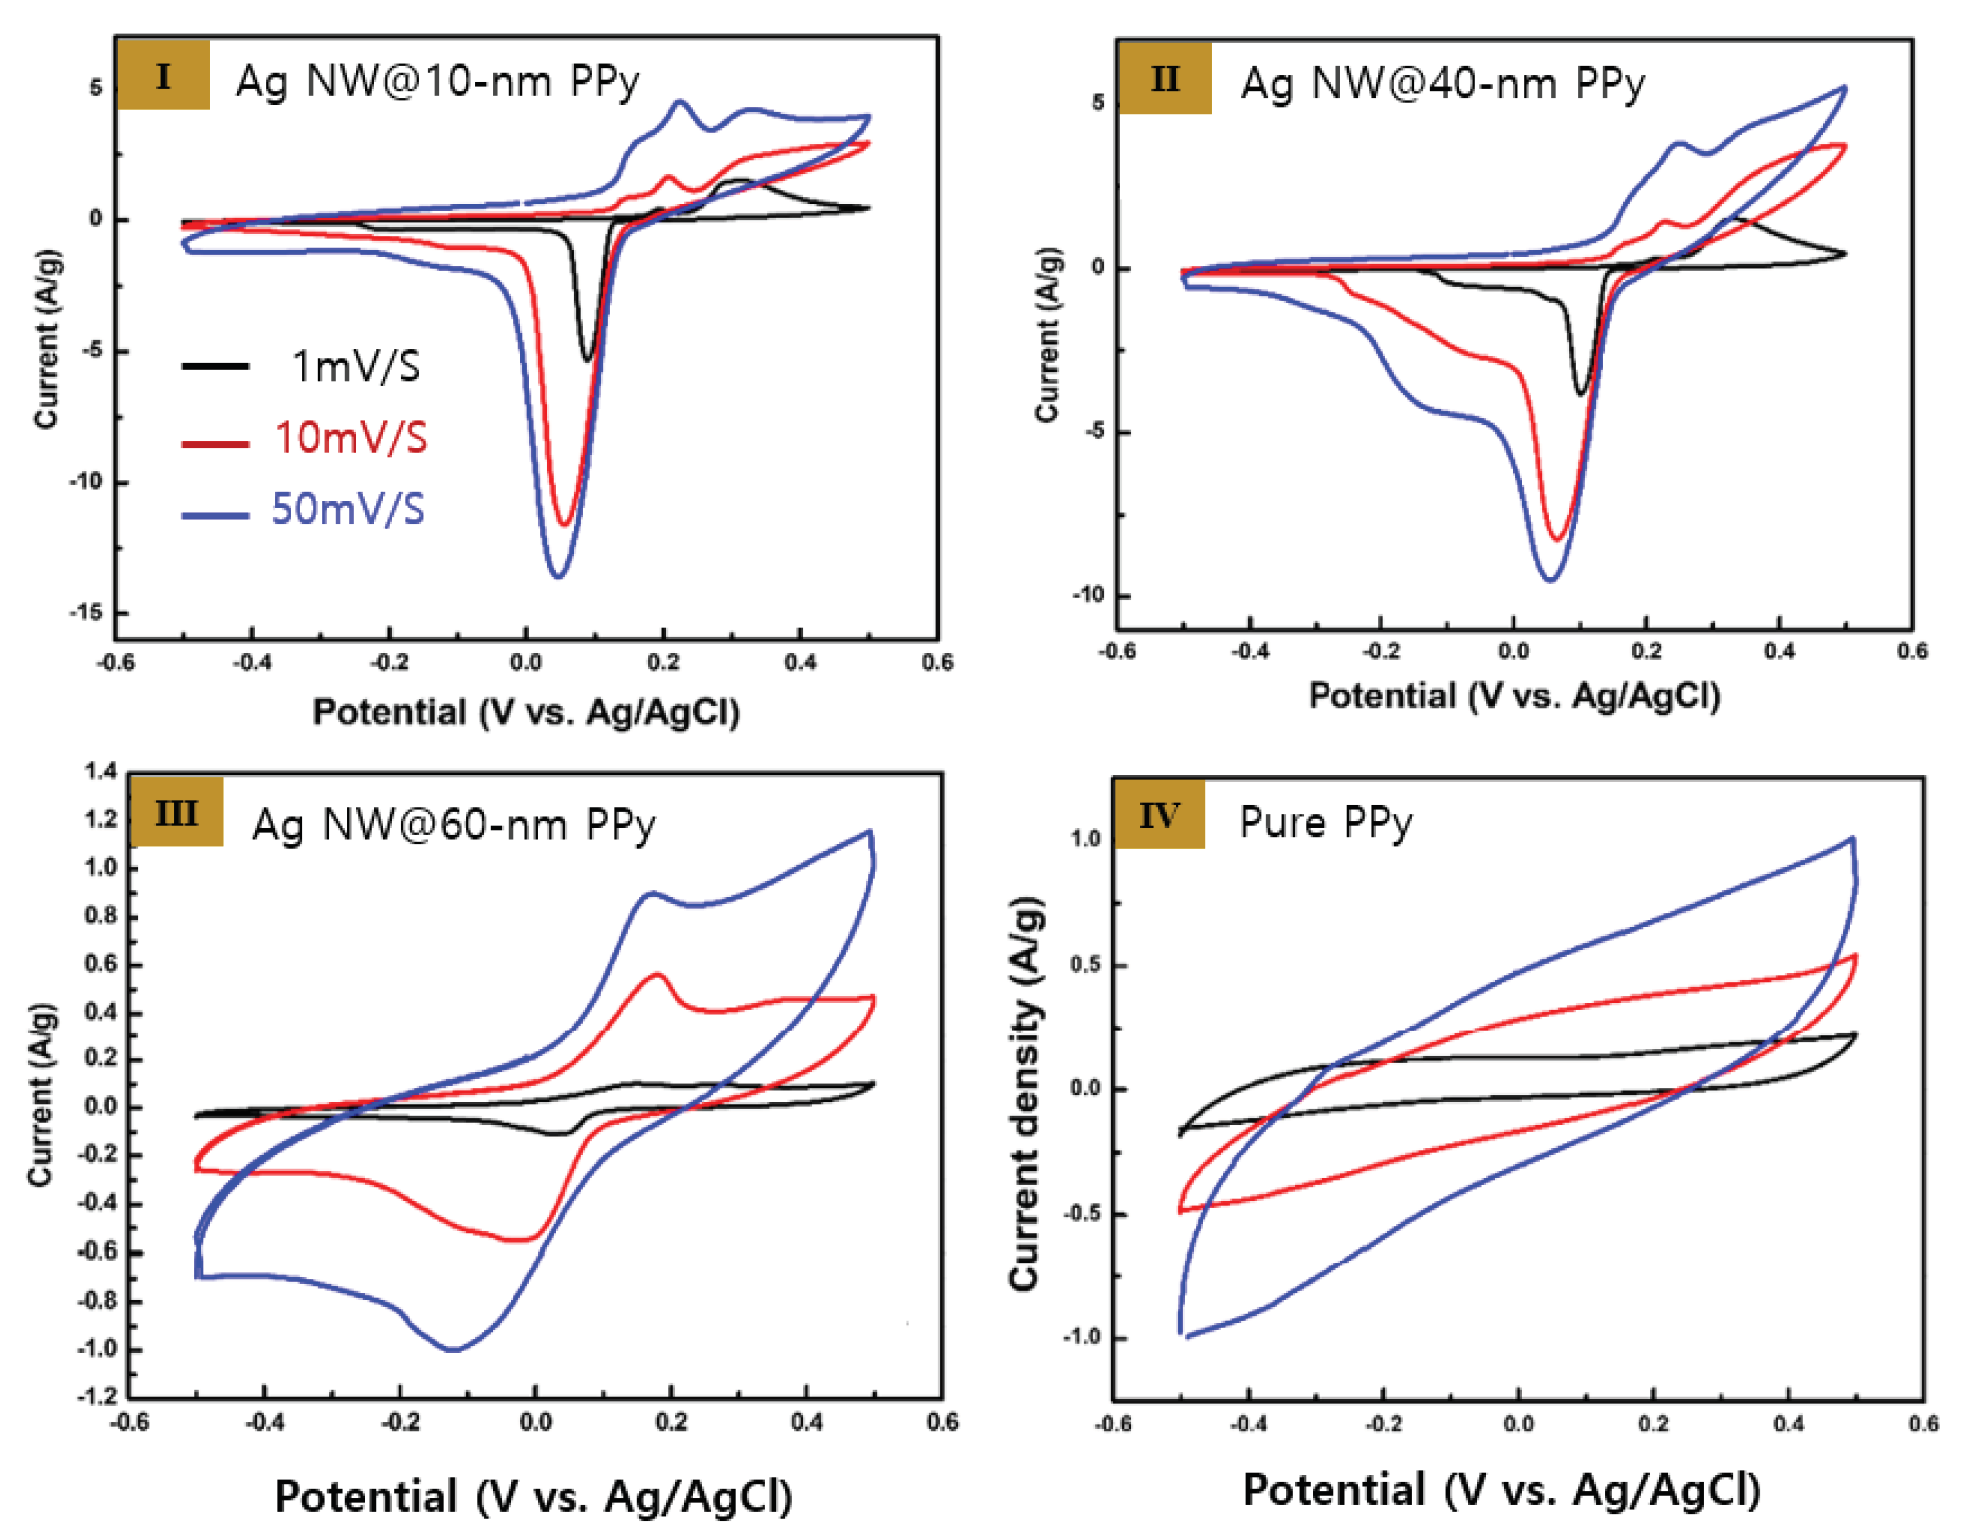
Figure 4 shows the CV curves of the Ag NW@PPy nanorods obtained at scan rate of 1, 10, and 50 mV/s. As shown in the figure, as the scan rate increases, the area of the CV peak tends to increase significantly. In addition, the anodic (oxidation) peak tended to shift to higher voltages, whereas the cathodic (reduction) peak tended to shift to lower voltages. In all Ag NW@PPy samples, the redox response of Ag was confirmed even at high scan rates. In contrast, in pure PPy, it was confirmed that only the ion transfer reaction occurred on the surface. In addition, when the PPy thickness was increased to 60 nm, the flowing current density tended to decrease significantly, and the redox reaction of Ag decreased sharply. However, the main advantage of the Ag NW@PPy nanocomposites is that the charge transfer between the Ag NW in the core part and the PPy shell layer occurs efficiently. Electrolyte ions moved between the large openings of the 3-D microporous structure of the nanocomposites, and these nanocomposites exhibited excellent electrochemical performance. The CV results of the Ag NW@PPy nanocomposite devices with different PPy shell thicknesses showed that as the PPy layer thickness increases, the current density flowing through the device decreases and the redox potential by Ag decreases significantly.
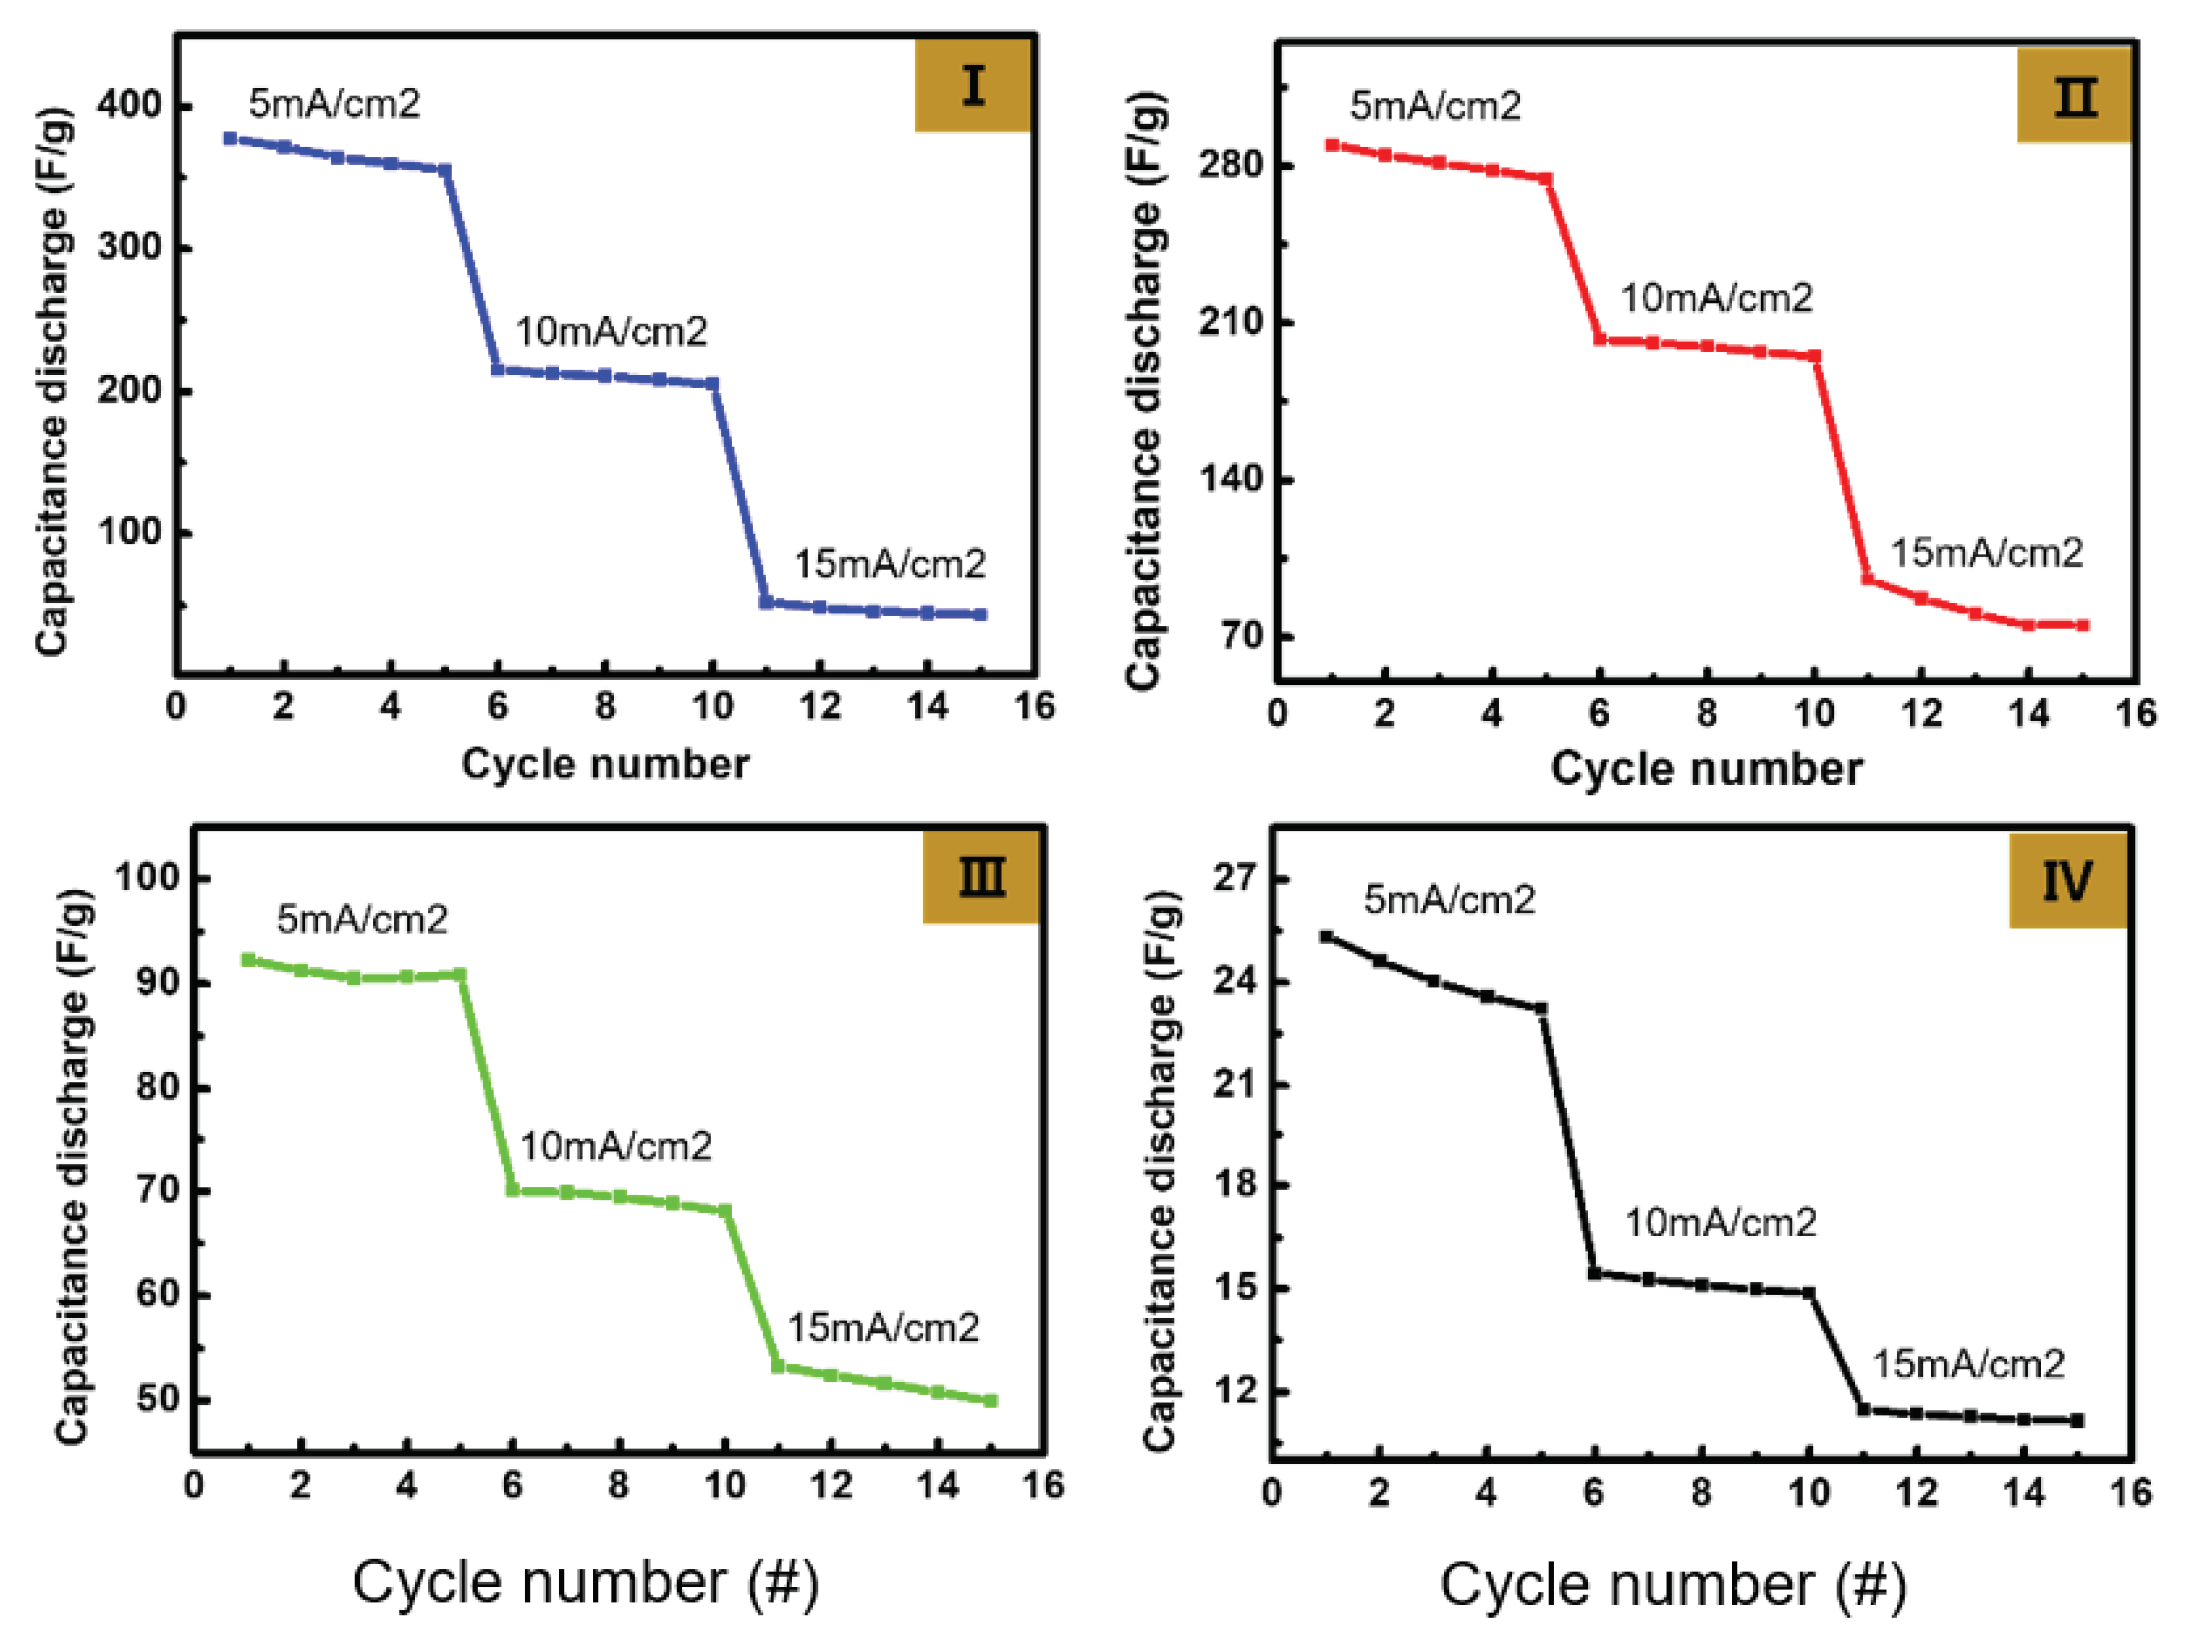
The charge storage properties of Ag NW@PPy were observed through GCD curves at various scan rates. The data measured at scan rates of 5, 10, and 15 mA/cm
2 are shown in
Figure 5.
Figure 5 also shows the GCD characteristics and cycling test results of three Ag NW@PPy nanorod samples and a pure PPy reference sample. GCD measurements were performed in 1-M KOH electrolyte.
Figure 5(I) shows the GCD characteristics obtained from the Ag NW@10-nm PPy sample. The charge and discharge curves are approximately symmetric and exhibit stable discharge/discharge capacitance. The discharge time was observed to be approximately 50 s at 5mA/cm
2 scan rate, and stable charge/discharge characteristics were maintained for 5 cycles. On the contrary, at a scan rate of 15 mA/cm
2, the discharge time was slower (to over 100 s). In Addition, as the scan rate increased to 10mA/cm
2 and 15mA/cm
2, the discharge capacitance value decreased relatively significantly, as shown in
Figure 5. According to the Butler–Volmer equation [
22], the lower the current density, the lower the side reaction and the shorter the discharge time.
Figure 5(II) and
Figure 5(III) show the GCD curves obtained from the Ag NW@40-nm PPy and Ag NW@60-nm PPy samples, respectively. As can be seen in the figure, Ag NW@40-nm PPy and Ag NW@60-nm PPy exhibit more reduced discharge capacity at all scan rates compared to Ag NW@10-nm PPy. However, the discharge capacitance of Ag NW@PPy tended to reduce as the thickness of the PPy layer increased, and the smallest result was obtained for Ag NW@60-nm PPy. In addition, in Ag NW@60-nm PPy, the influence of Ag oxidation/reduction was greatly reduced, and more stable GCD curves were obtained. Nevertheless, all values obtained from Ag NW@PPy were higher than those obtained from pure PPy. As a result of the cycling test, the most stable results were obtained at scan rate 10 mA/cm
2.
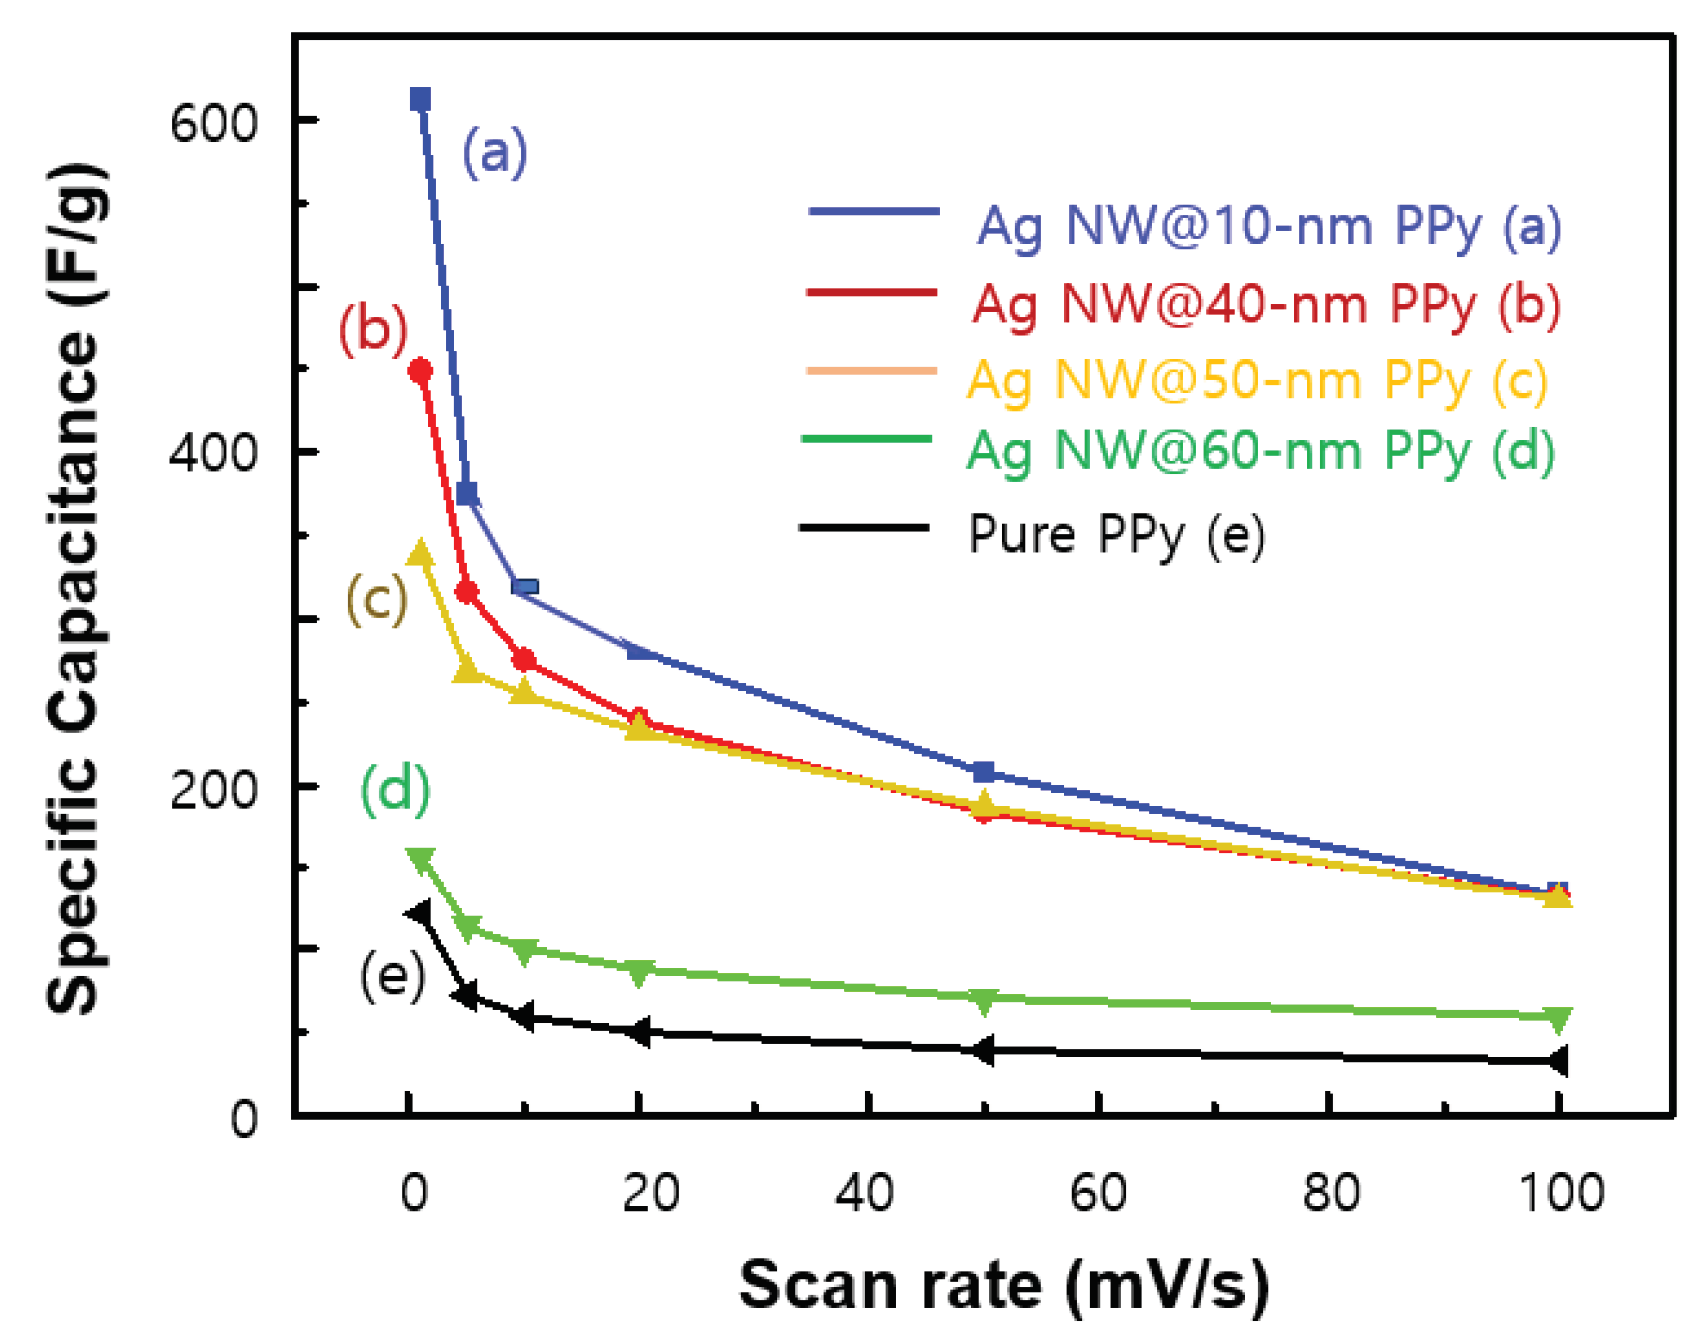
On the basis of the GCD data analysis, the specific capacitance (F/g) according to the scan rate was calculated, as shown in
Figure 6. As shown in
Figure 6(a), for the Ag NW@10-nm PPy sample, the specific capacitances are 625, 372, 325, and 152 F/g at scan rates of 1, 5, 50, and 100 mV/s, respectively. For the Ag NW@60-nm PPy sample [
Figure 6(d)], the specific capacitances tended to decrease sharply to 165, 120, 80, and 75 F/g, respectively, which were higher than those of the pure PPy sample [
Figure 6(e)]. The specific capacitance decreases as the scan rate increases because the diffusion of electrolyte ions inside the PPy layer becomes more difficult when the scan rate is fast, and as a result, the capacitance of the cell decreases. In any case, the Ag NW@PPy cells show improved specific capacitances compared to the pure PPy cell, and in particular, the specific capacitance appears to be greatly affected by the thickness of the PPy layer. This indicates that the 3-D porous Ag NW@PPy layer with higher protonation level and better electrical conductivity is more suitable for the adsorption/desorption of electrolyte ions.
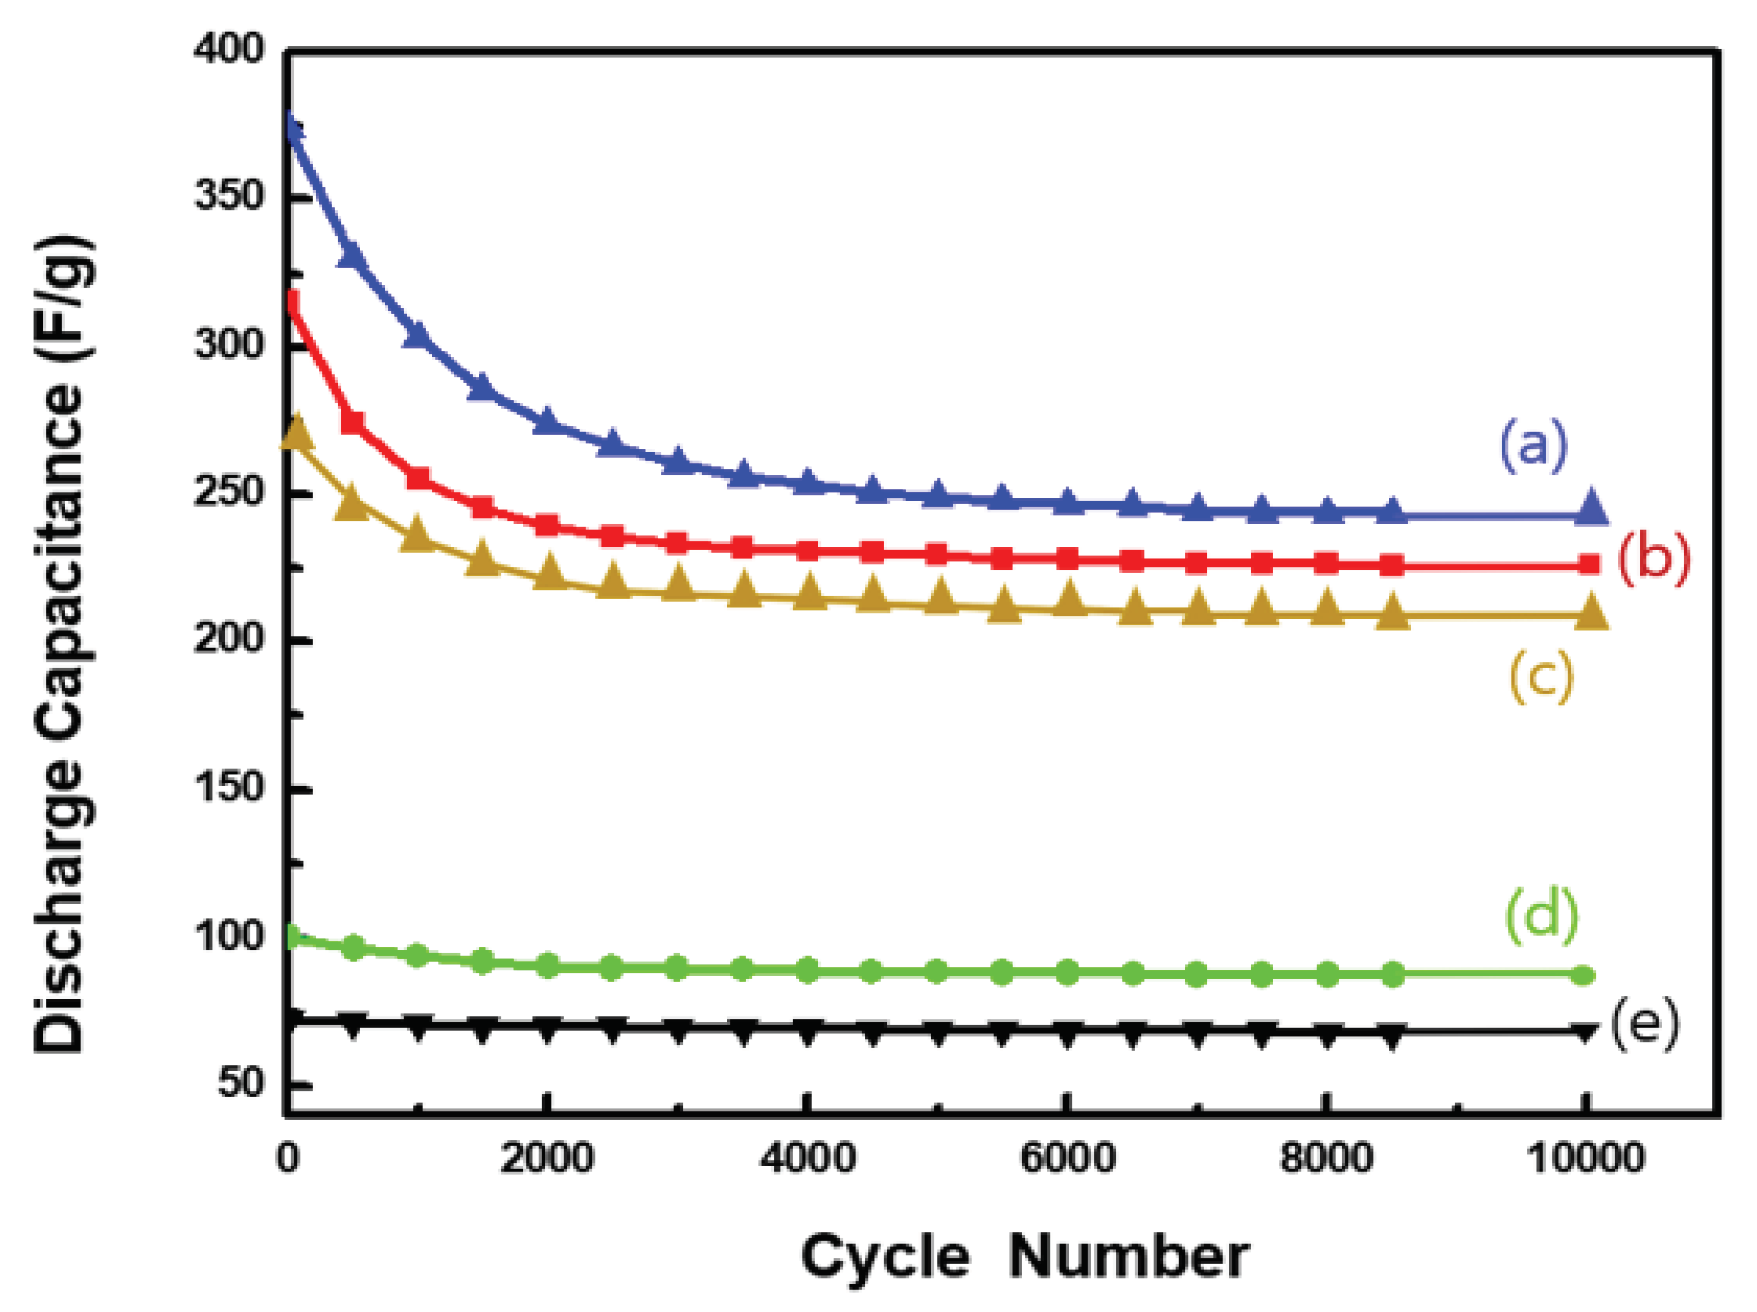
Figure 7 shows the results of the cycling performance evaluation of the discharge capacitance of the Ag NW@PPy composite samples measured at a scan rate of 5 mA/cm
2. We evaluated the cycling performance of the 3-D porous Ag NW@PPy composites over a long period of time (over 10,000 cycles) as an important key parameter for supercapacitor performance. The Ag NW@PPy composite samples with PPy thicknesses of 50 nm or less initially showed high irreversible discharge capacitance but after 2000 cycles, the decrease in discharge capacitance tended to become smaller and stabilized. On the contrary, in the case of the Ag NW@60-nm PPy composite, a slight change in discharge capacitance and stabilized characteristics were observed overall, except for the initial slight irreversible discharge capacitance, as shown in
Figure 7(d). In any case, it has been proven that the discharge capacitances obtained from all Ag NW@PPy composite samples are higher than those of pure PPy [
Figure 7(e)]. In particular, although the reasons for the superior cycling stability of Ag NW@60-nm PPy are not yet fully proven, we propose two important factors that may contribute to the enhancement of cycling stability when the thickness of the PPy layer is greater than 60 nm: (1) in the core–shell structure, a thicker surface layer composed of PPy can reduce the charge resistance and shorten the diffusion path of ions across the surface, and (2) the well-polymerized PPy nanostructures on the core–shell surface provide enhanced mechanical strength to the nanohybrid structure, which can maintain long-term reversible reactions while maintaining the stability of the electrode.
Scheme 1.
Illustrative representation of the synthesis process of the core–shell-structured Ag NW@PPy nanorods and their scanning electron microscopy (SEM) image.
Scheme 1.
Illustrative representation of the synthesis process of the core–shell-structured Ag NW@PPy nanorods and their scanning electron microscopy (SEM) image.
Figure 1.
SEM morphologies of the core–shell rod shaped nanocomposites (Ag NW@PPy). (I) Ag NW@PPy nano composite surrounded by a PPy layer of approximately 10 nm (sample 1) on the outer surface of the Ag NWs with a diameter of 50 nm and a length of 15 µm and (I-a) its diameter distribution. (II) Ag NW@PPy nanocomposite surrounded by a PPy layer of approximately 40 nm (sample 2) and (II-a) its diameter distribution.
Figure 2.
(I) FT Raman spectra of the Ag NW@PPy nanorods (samples 1 and 2): (a) pure PPy particles, (b) Ag NWs with PPy capped to a thickness of 10 nm (Ag NW@10-nm PPy), and (c) Ag NWs with PPy capped to a thickness of 40 nm (Ag NW@40-nm PPy). (II) EDX spectra of sample 2.
Figure 2.
(I) FT Raman spectra of the Ag NW@PPy nanorods (samples 1 and 2): (a) pure PPy particles, (b) Ag NWs with PPy capped to a thickness of 10 nm (Ag NW@10-nm PPy), and (c) Ag NWs with PPy capped to a thickness of 40 nm (Ag NW@40-nm PPy). (II) EDX spectra of sample 2.
Figure 3.
CV curves of the Ag NW@PPy nanorods with a molecular weight of 2 mg/electrode at a scan rate of 1 mV/s in 1-M KOH: (a) Ag NW@10-nm PPy (blue), (b) Ag NW@40-nm PPy (red), (c) Ag NW@50-nm PPy (yellow), (d) Ag NW@60-nm PPy (green), and (e) pure PPy (black, as a reference).
Figure 3.
CV curves of the Ag NW@PPy nanorods with a molecular weight of 2 mg/electrode at a scan rate of 1 mV/s in 1-M KOH: (a) Ag NW@10-nm PPy (blue), (b) Ag NW@40-nm PPy (red), (c) Ag NW@50-nm PPy (yellow), (d) Ag NW@60-nm PPy (green), and (e) pure PPy (black, as a reference).
Figure 4.
CV curves of the Ag NW@PPy nanorods obtained at scan rates of 1 mV/s (black), 10 mV/s (red), and 50 mV/s (blue): (I) Ag NW@10-nm PPy, (II) Ag NW@40-nm PPy, (III) Ag NW@60-nm PPy, and (IV) pure PPy.
Figure 4.
CV curves of the Ag NW@PPy nanorods obtained at scan rates of 1 mV/s (black), 10 mV/s (red), and 50 mV/s (blue): (I) Ag NW@10-nm PPy, (II) Ag NW@40-nm PPy, (III) Ag NW@60-nm PPy, and (IV) pure PPy.
Figure 5.
GCD characteristics of the Ag NW@PPy nanorod supercapacitor cells measured at the scan rates of 5, 10, and 15 mA/cm2: (I) Ag NW@10-nm PPy, (II) Ag NW@40-nm PPy, (III) Ag NW@60-nm PPy, and (IV) pure PPy.
Figure 5.
GCD characteristics of the Ag NW@PPy nanorod supercapacitor cells measured at the scan rates of 5, 10, and 15 mA/cm2: (I) Ag NW@10-nm PPy, (II) Ag NW@40-nm PPy, (III) Ag NW@60-nm PPy, and (IV) pure PPy.
Figure 6.
Change in specific capacitance (F/g) according to the scan rate: (a) Ag NW@10-nm PPy, (b) Ag NW@40-nm PPy, (c) Ag NW@50-nm PPy, (d) Ag NW@60-nm PPy, and (e) pure PPy sample.
Figure 6.
Change in specific capacitance (F/g) according to the scan rate: (a) Ag NW@10-nm PPy, (b) Ag NW@40-nm PPy, (c) Ag NW@50-nm PPy, (d) Ag NW@60-nm PPy, and (e) pure PPy sample.
Figure 7.
Cycling performance of the discharge capacitance measured at a scan rate of 5 mA/cm2, and 25 °C: (a) Ag NW@10-nm PPy, (b) Ag NW@40-nm PPy, (c) Ag NW@50-nm PPy, (d) Ag NW@60-nm PPy, and (e) pure PPy sample.
Figure 7.
Cycling performance of the discharge capacitance measured at a scan rate of 5 mA/cm2, and 25 °C: (a) Ag NW@10-nm PPy, (b) Ag NW@40-nm PPy, (c) Ag NW@50-nm PPy, (d) Ag NW@60-nm PPy, and (e) pure PPy sample.

