Preprint
Article

Research on Weed and Crop Identification System Using Pixel-Wise Segmentation

Altmetrics

Downloads

163

Views

67

Comments

0

This version is not peer-reviewed

Submitted:

20 March 2024

Posted:

22 March 2024

You are already at the latest version

Alerts
Abstract
Deep learning is widely used in image segmentation, effectively identifying crops and weeds and contributing to the reduction of herbicide use. Traditional methods of applying pesticides over large areas are inefficient in dealing with weeds as needed, leading to massive waste of pesticides, high-cost production, and serious environmental pollution. This affects crop yield and quality. Although weed recognition using conventional deep learning methods has evolved over time, there are still challenges in weed extraction, detection, and segmentation. Accurate recognition and detection of weeds are essential prerequisites for implementing variable spraying. This paper proposes a semantic segmentation method based on UNet++ for complex environments where accurate identification of plants and weeds is challenging, targeting weeds in sugar beets, peas, and rice. An attention module is integrated into the upsampling process of UNet++, and UNet++ is used as a backbone network to effectively integrate multi-scale information, efficiently suppressing external noise interference. The UNet++ model with an integrated attention mechanism module achieves higher IOU than the general UNet++ model used in medical image analysis. This method effectively detects crops and weeds in complex backgrounds, providing reference material for the accurate application of robotic herbicides.
Keywords: 
Subject: Computer Science and Mathematics  -   Computer Science

Introduction

1.1. Background

Weeds are one of the naturally grown plants that are not intentionally planted, and they have a significant negative impact on the growth of crops. In China, a wide variety of weeds are abundantly distributed, covering a considerable area. The land area where crops are affected by weeds exceeds 73 million hectares [1], and crops suffer an average food consumption loss of 13.4% due to weeds, resulting in an annual loss of 17,500,000 tons of food production [2].
Weeds periodically grow in agricultural environments and adapt to these conditions. Fine cultivation of land, irrigation, and fertilizer application support crop growth while simultaneously providing favorable conditions for weed proliferation. Weeds compete with crops for sunlight, nutrients, water, and space, hinder the aeration and ventilation of crops, and affect soil temperature, leading to a significant decrease in crop production. This, in turn, negatively impacts the sustainable use of soil [3]. Therefore, controlling and managing weeds is essential to maintain or improve the yield and quality of crops.
Applying pesticides is currently one of the main methods of weed control in agriculture. Excessive use of herbicides and indiscriminate use of pesticides can lead to environmental pollution, increased agricultural costs, and chemical residues. Herbicides are primarily applied through spraying or manual removal. Manual removal is time-consuming and inefficient. The ability to quickly and accurately identify crops and weeds is crucial for automated weed control [4]. Weed recognition is mainly based on color, shape [5,6], spectrum, and texture [7].

1.2. Related Works

In the field of agriculture, various deep learning technologies have been used for research reports published on yield prediction [8], disease detection [9,10], pest damage recognition [11,12], weed detection [13,14], and weight inspection [15,16].
Chao et al. [17] used a charged-couple camera to develop a machine vision system for weed detection in carrot farms. They created binary images that analyze the morphological features of carrots and weeds using color images.
Lin et al. [18], in 2009, introduced a machine vision system for weed recognition and built a Support Vector Machine (SVM) classifier based on the shape characteristics of weed leaves.
Sun et al. [19] introduced a network into the Region Proposal Network (RPN). They developed an improved Convolutional Neural Network (CNN) weed recognition model by combining spatial convolution and global pooling, recognizing crop seedlings and weeds. This method demonstrates the broad prospects of deep learning methods in the field of weed recognition.
Zhou et al. [20], in 2018, proposed the UNet++ model for more accurate image segmentation. The advantage of UNet++ is that it improves the accuracy of the network structure through depth guidance and significantly reduces the number of parameters within an acceptable range.
Wang et al. [21] proposed PCAW-UNet, based on UNet, for real-time weed segmentation. This model uses UNet as the main network and adds an attention mechanism module at the end of the model.
Shang et al. [22] suggested a method using Res-UNet as an image segmentation network. The ResNet50 network can be used as a backbone network of UNet to effectively detect weeds in sugar beet in complex backgrounds.
Peng et al. [23] proposed a Faster R-CNN method for recognizing cotton blight weeds in complex backgrounds. They used residual convolutional networks to extract image features to generate target candidate boxes, and Max-pooling utilized pyramid features as a downsampling method. This method can detect weeds in cotton fields in complex backgrounds and provide reference material for accurate removal.
Convolutional Neural Networks (CNNs) [24] in deep learning have the ability to automatically extract target features without human intervention, effectively and automatically learn target features for multi-task requirements, and perform powerful target detection and recognition. With the application and development of Deep Convolutional Neural Networks (DCNNs) [25,26], more and more researchers are beginning to apply them in the field of target detection and recognition.

2. Proposal Methods

2.1. CBAM(Convolution Block Attention Module)

CBAM (Convolution Block Attention Module) [27] is a module that combines spatial and channel attention mechanisms, mainly used in image classification and target detection tasks. The CBAM module is divided into two sub-modules: the channel attention mechanism [28] and the spatial attention mechanism [29].
  • The channel attention module learns the weights of each channel through global average pooling and global max pooling of each channel, then weights the channels of the input feature map to create a feature map with better representation ability.
  • The spatial attention module learns the weights of each spatial location through max pooling and average pooling in the spatial dimension of the input feature map, then multiplies these weights with the original feature map to enhance useful features and suppress useless background.
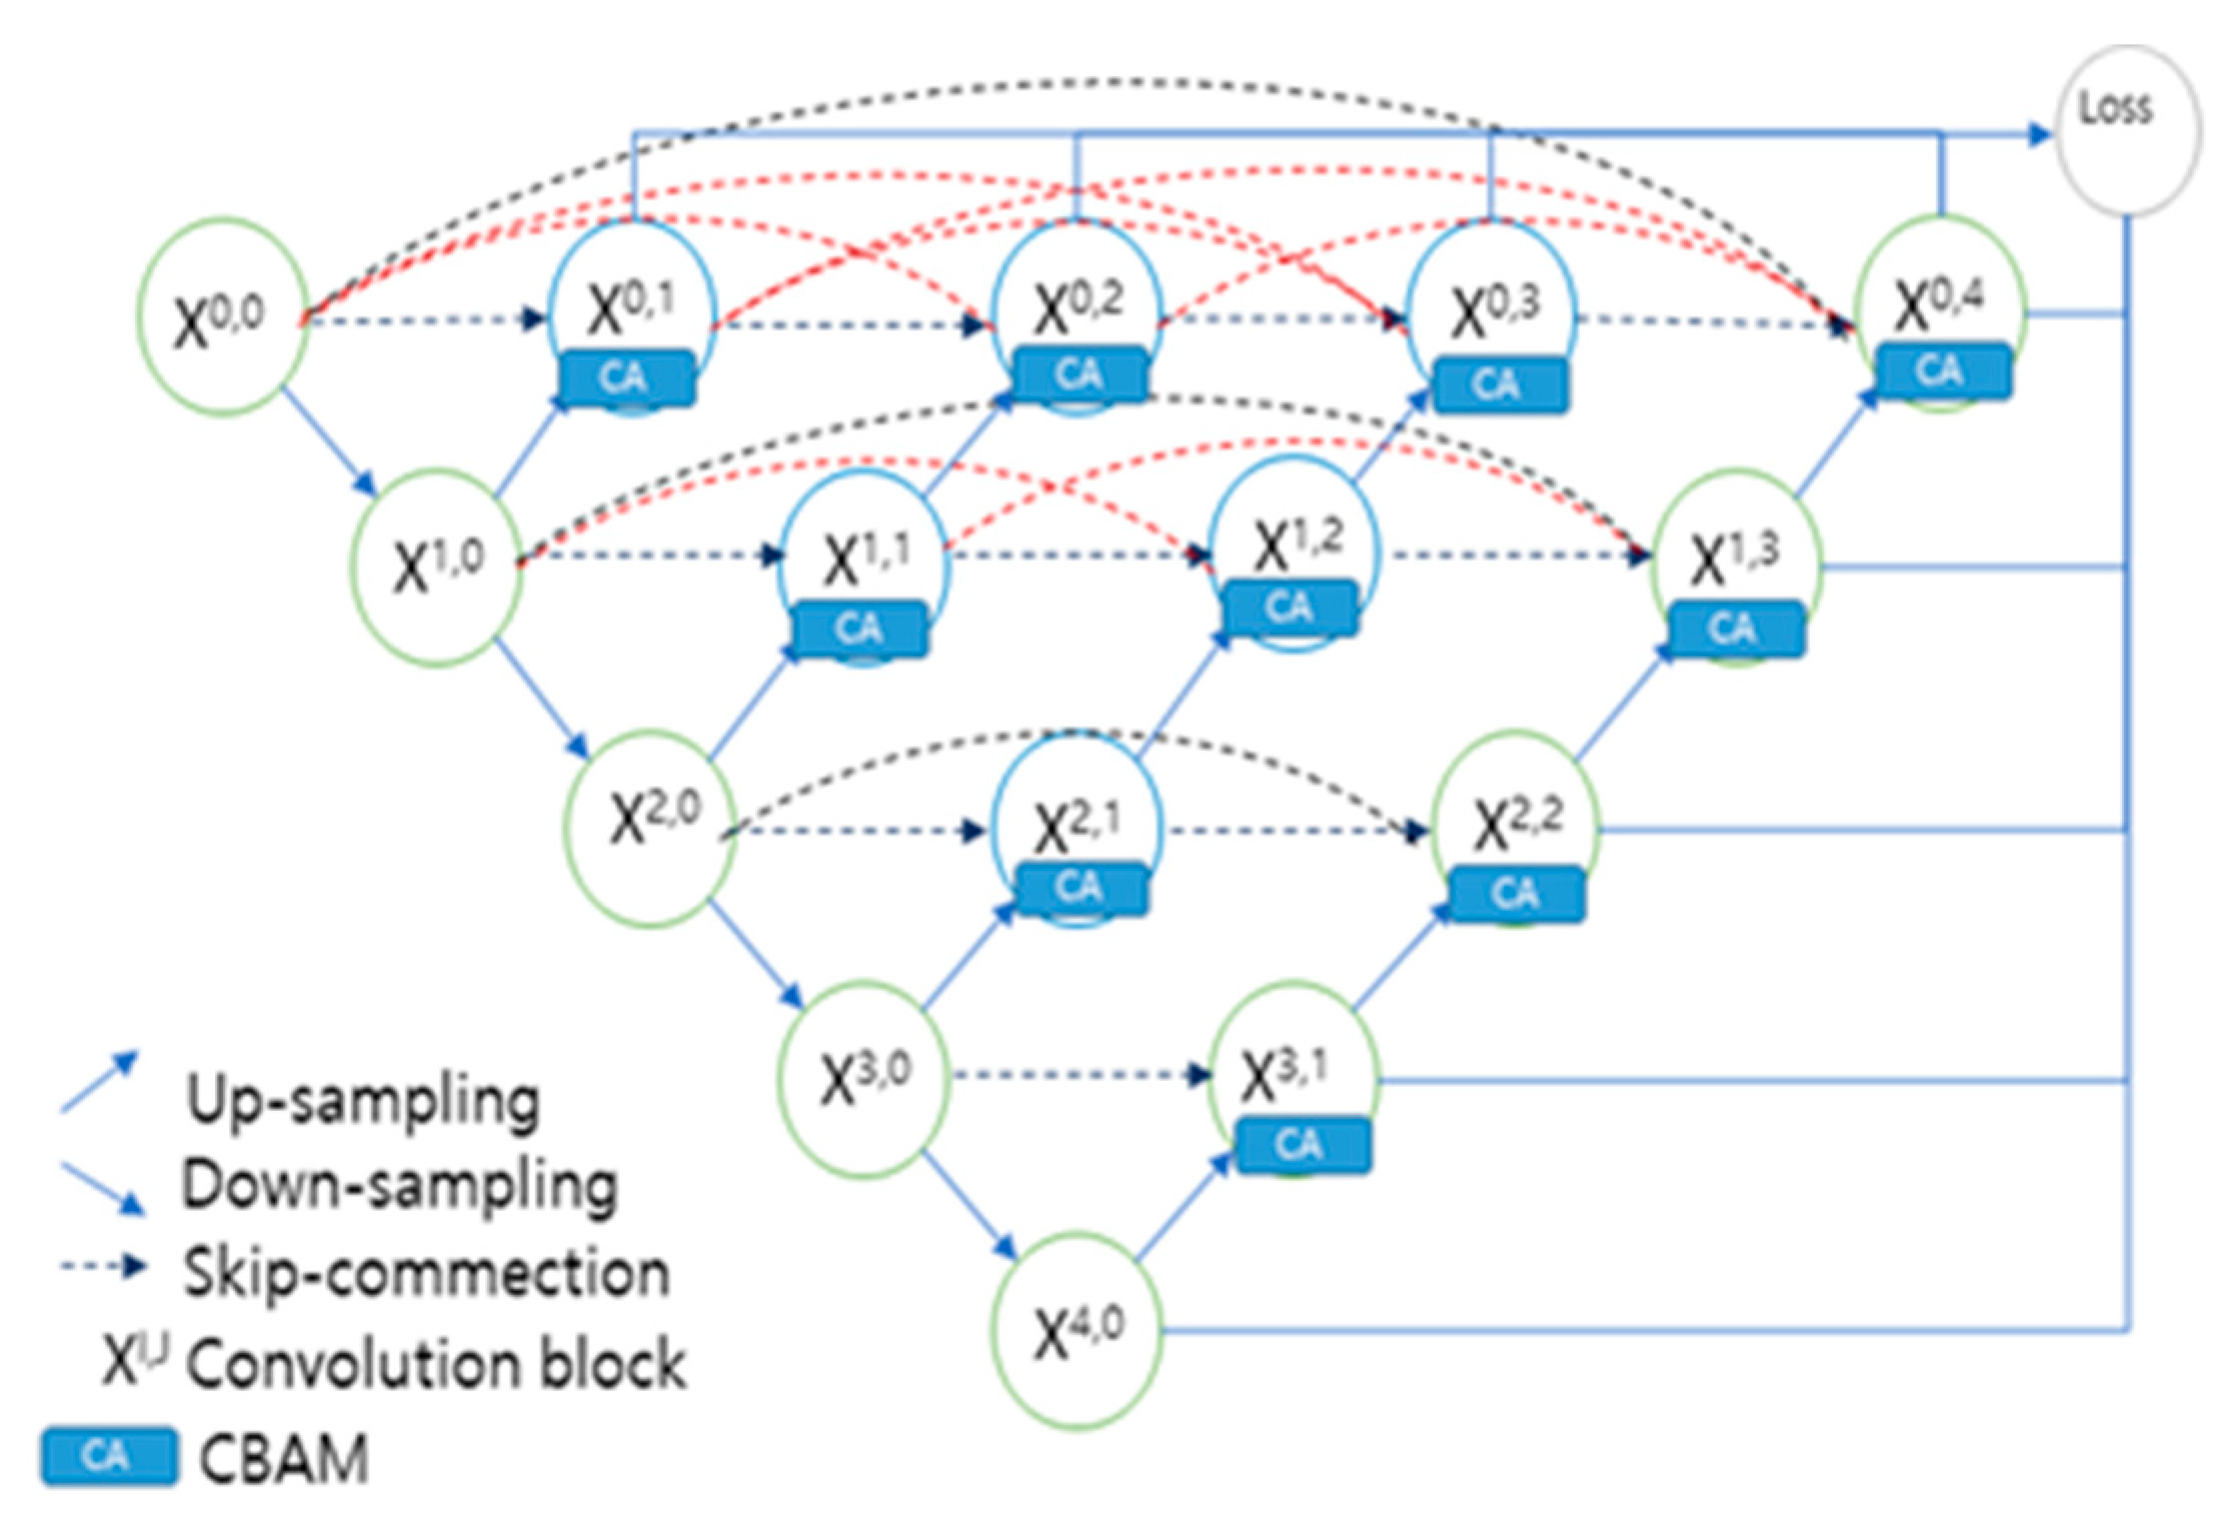
Figure 1. Structure of ATT-UNet.
Preprints 101811 g001
The CBAM's spatial attention mechanism allows this model to more effectively capture various location information in images compared to channel-centric models like SENet. Hence, CBAM generally shows superior performance in tasks like image classification and object detection.
The attention mechanism has been added to the upsampling module of the UNet++ model. It helps improve the detection of local information. In weed and crop recognition, local features such as the shape and texture of plants are crucial for accurate classification and segmentation. By incorporating the attention mechanism, the model can focus more on these local features, capturing the boundaries and details of plants more effectively. The attention mechanism can reduce attention to irrelevant information, helping the model to focus more on key information. In agricultural images, there can be unspecified objects or areas, and using the attention mechanism, the model can selectively ignore this irrelevant information, improving overall performance.
Figure 2 shows the structure of CBAM. The dimensions of the input features are C×1×1, the dimensions of the channel attention model are C×H×W, and the dimensions of the spatial attention model are 1×H×W.
CA stands for "Channel Attention", a mechanism used to enhance channel feature representation in convolutional neural networks. CA learns the weights of each channel through global average pooling or global max pooling and applies these weights to each channel of the input feature map, enhancing useful features and suppressing irrelevant background. Additionally, an advantage of CA is that it can capture a broader range of information compared to other attention mechanisms (e.g., Spatial Attention Mechanism) without introducing more computational costs to improve model performance.

2.2. UNet Overview

Ronneberger et al. [30] proposed UNet in 2015, an improved network based on Fully Convolutional Network (FCN). The UNet model is an effective platform for medical image segmentation. It handles most long-range segmentation tasks. UNet consists of an encoder part (left) and a decoder part (right).
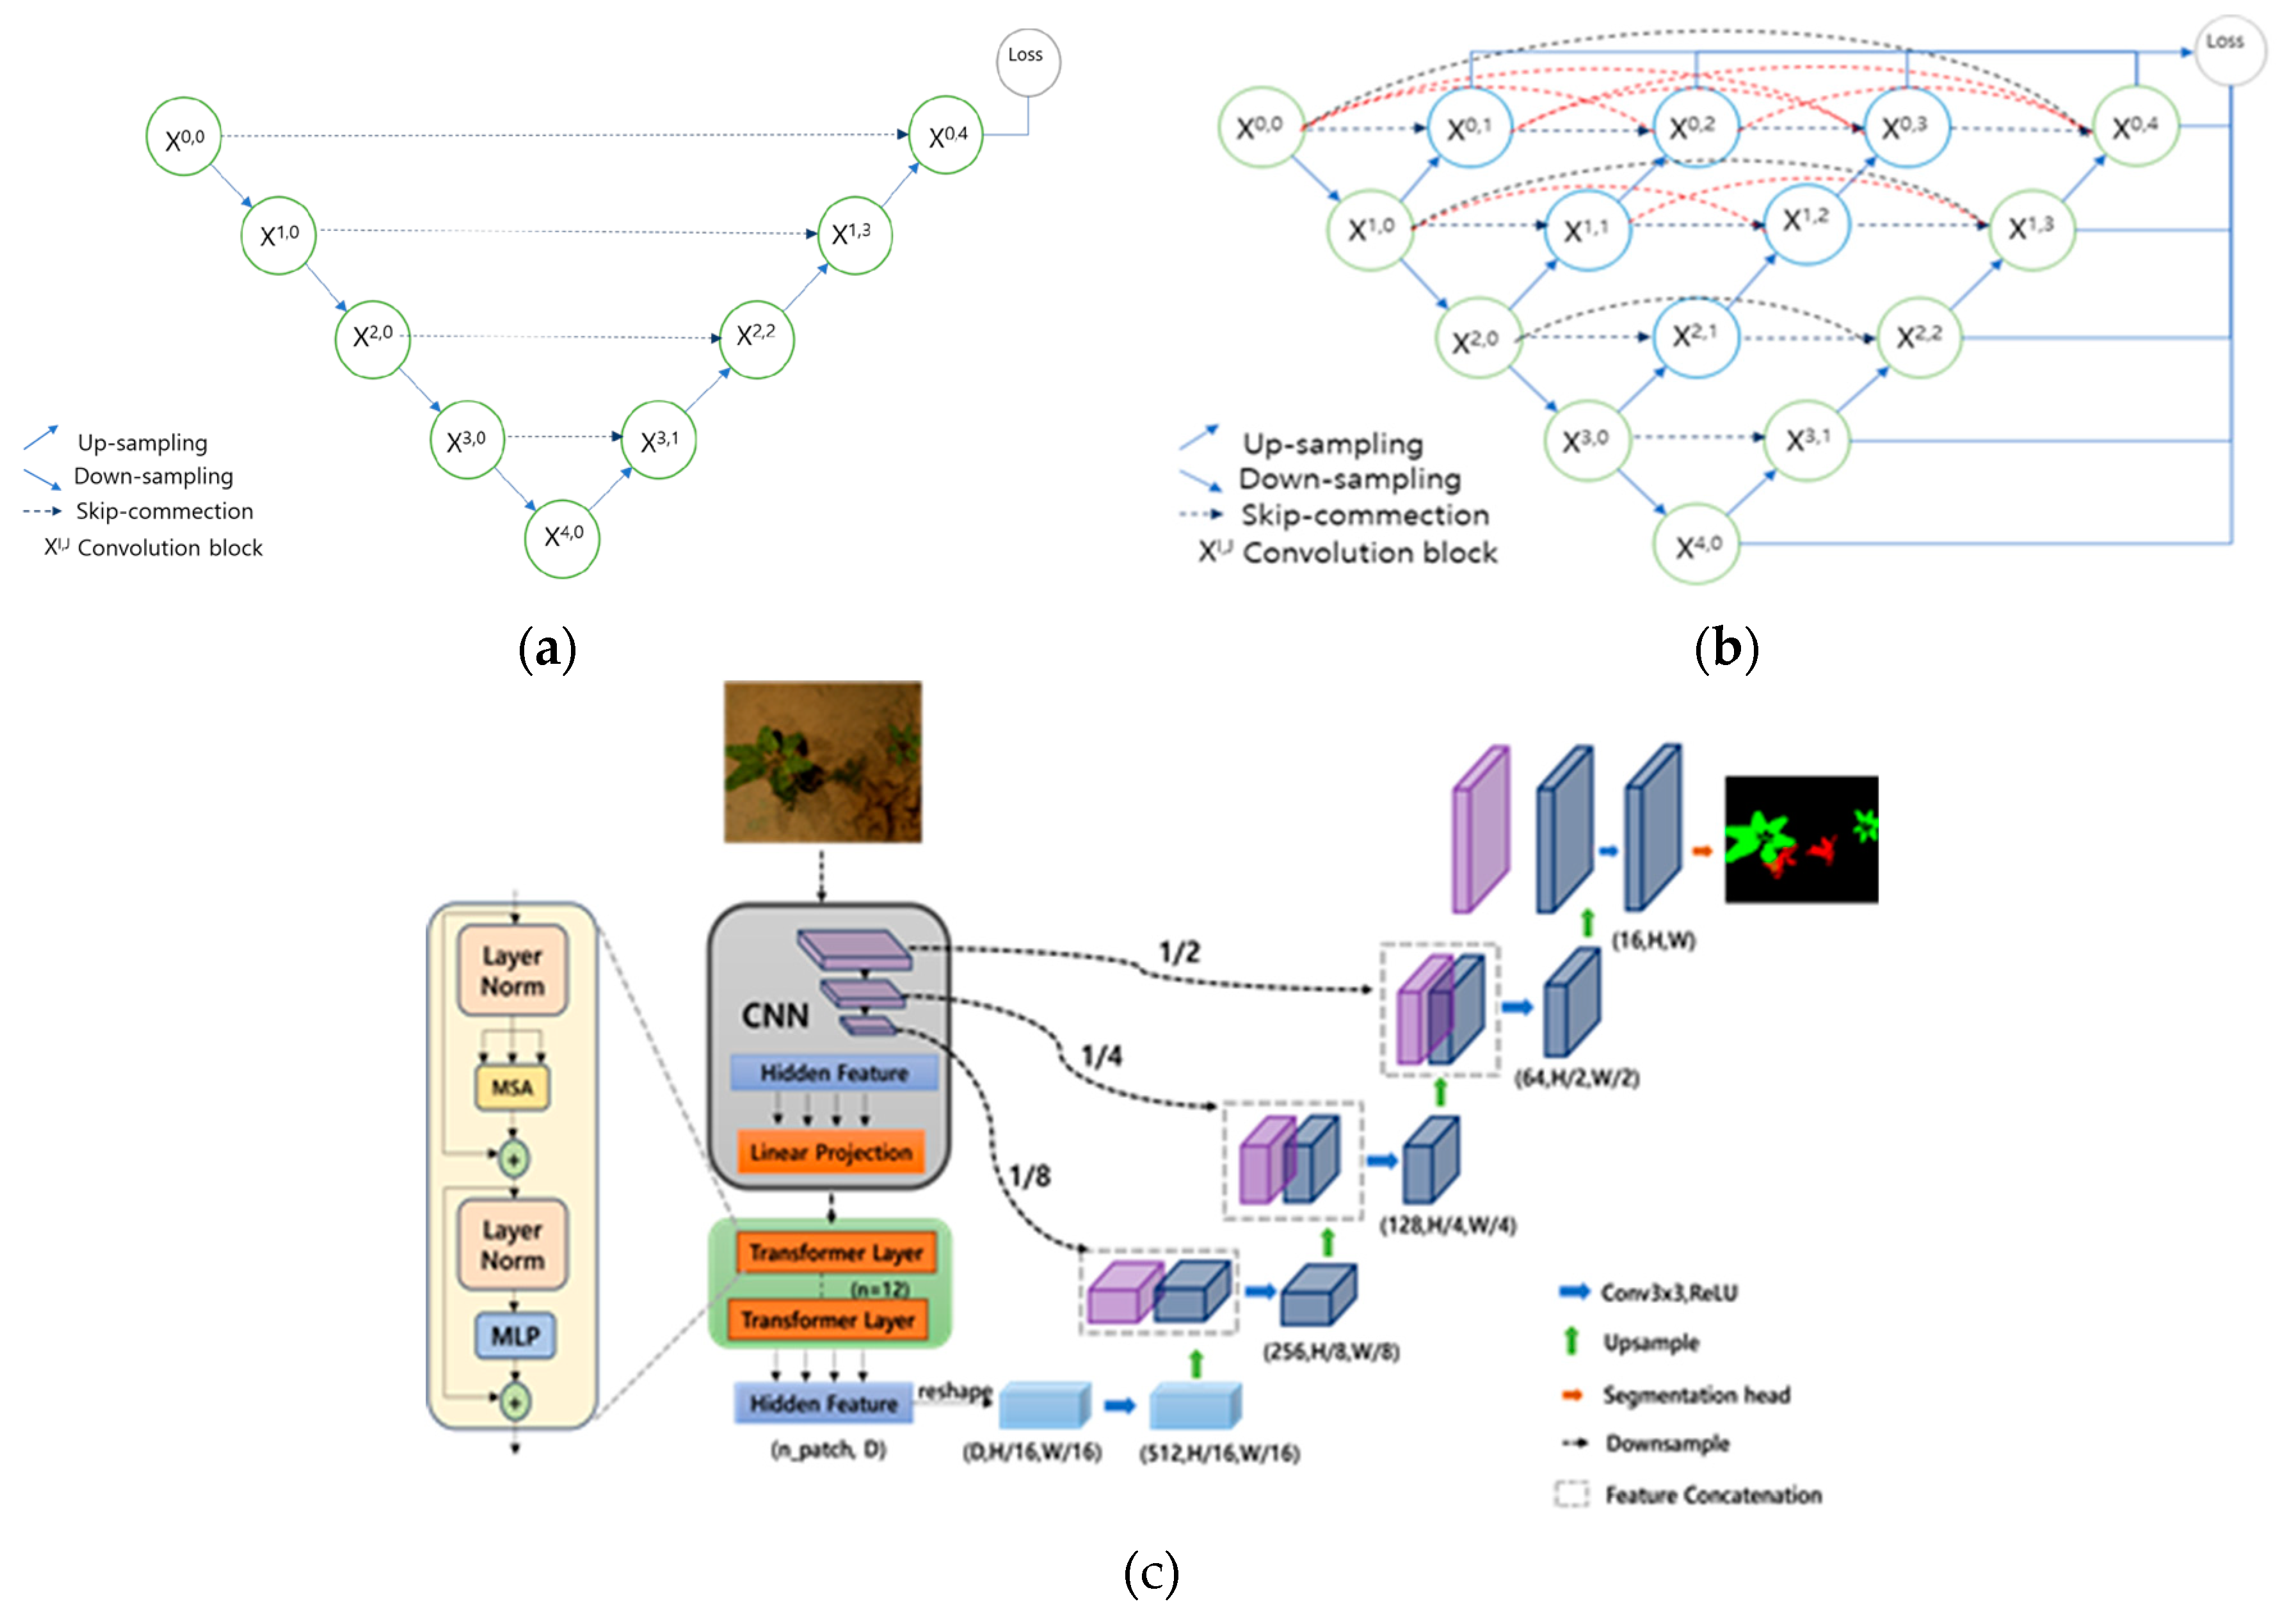
UNet++ [31] introduces various depths of UNet models, as shown in the figure, providing better segmentation performance for objects of different sizes, improving over the fixed-depth UNet. Thus, all these UNet components share alternating encoders and decoders. UNet++ can train all UNets simultaneously. Applying pruning to the trained UNet++ has improved the inference speed and performance of UNet++.
In 2021, Chen et al. proposed a TransUNet model [32]. This model, on the one hand, is used as an input sequence in which Transformer encodes image blocks from convolutional neural network (CNN) feature maps to extract global contexts. On the other hand, the decoder upsamples the encoded features, and then combines them with a high-resolution CNN feature map to identify the exact location. Figure 3-(a) shows the structure of UNet, Figure 3-(b) shows the structure of UNet++, and Figure 3-(c) shows the structure of TransUNet.
UNet is a deep learning model applied primarily for tasks like medical image segmentation, improving upon the FCN(Fully Convolutional Network) structure. Inspired by FCN, UNet is specialized for segmentation tasks with a fully symmetrical encoder-decoder structure, making it more effective in segmentation tasks.
Comparison of additional components between UNet++ and original UNet:
1) 
Multi-Scale Feature Fusion:
UNet++: UNet++ uses iterative encoder-decoder modules to progressively expand the detection area, capturing feature information of various scales.
UNet: UNet uses single-scale features, which may have limitations in capturing multi-scale features.
2) 
Improved Upsampling Module:
UNet++: The upsampling module of UNet++ uses the same technology as backpropagation to better preserve the details of the feature map and improve segmentation accuracy.
UNet: The architecture of UNet is relatively simple and can generally be trained more easily than UNet++.
3) 
Dense Connection:
UNet++: UNet++ maintains skip connections at each iterative level, allowing the network to pass information through multiple levels, capturing multi-scale features, reducing information loss, and enhancing feature transfer capability.
UNet: Traditional UNet only has single-layer skip connections and establishes only one connection between the encoder and decoder.
4) 
Performance Improvement:
UNet++: Thanks to multi-level skip connections and more detection areas, UNet++ generally has better segmentation performance, especially useful for tasks requiring detailed segmentation results and accurate boundaries.
UNet: UNet performs well in various image segmentation tasks but may not be as flexible as UNet++ in handling multi-scale features.
5) 
Application Areas:
UNet++: UNet++ is mainly used in application areas where high-precision segmentation is needed, such as medical image segmentation and satellite image analysis.
UNet: UNet is applied in various image segmentation tasks and has a simpler architecture, suitable for use in resource-limited environments.
6) 
Computational Resource Requirements:
UNet++: Due to its more complex structure, UNet++ typically requires more computational resources and longer training times.
UNet: UNet is relatively economical in terms of computational resources.
7) 
TransUNet:
  • Global Context Detection: TransUNet, based on the Transformer structure, enables the model to capture global context information in images. This helps the model better understand the relationships between different areas of the image and perform tasks more accurately.
  • Scalability: The Transformer structure offers good scalability, adapting to images of various sizes and resolutions. This makes TransUNet more flexible in handling different tasks and datasets.
  • Self-Attention Mechanism: The model uses the self-attention mechanism to help build long-range dependencies between different areas of the image, useful for handling overall image tasks.
  • Fewer Parameters: Compared to traditional CNN-based architectures, Transformers typically require fewer parameters for similar or better performance. This makes the model lighter, resulting in relatively faster training and inference speeds.
  • Applicability to Various Tasks: The structure of TransUNet makes it suitable for various computer vision tasks, such as image segmentation and object detection. This diversity allows the model to have applicability in multiple domains.
By adding a CNN module to the TransUNet model, convolutional neural network (CNN) capabilities are introduced, better capturing local features of the image. This helps the model recognize details better and process images more effectively.

3. Crop and Weed Identification System

3.1. System Overview

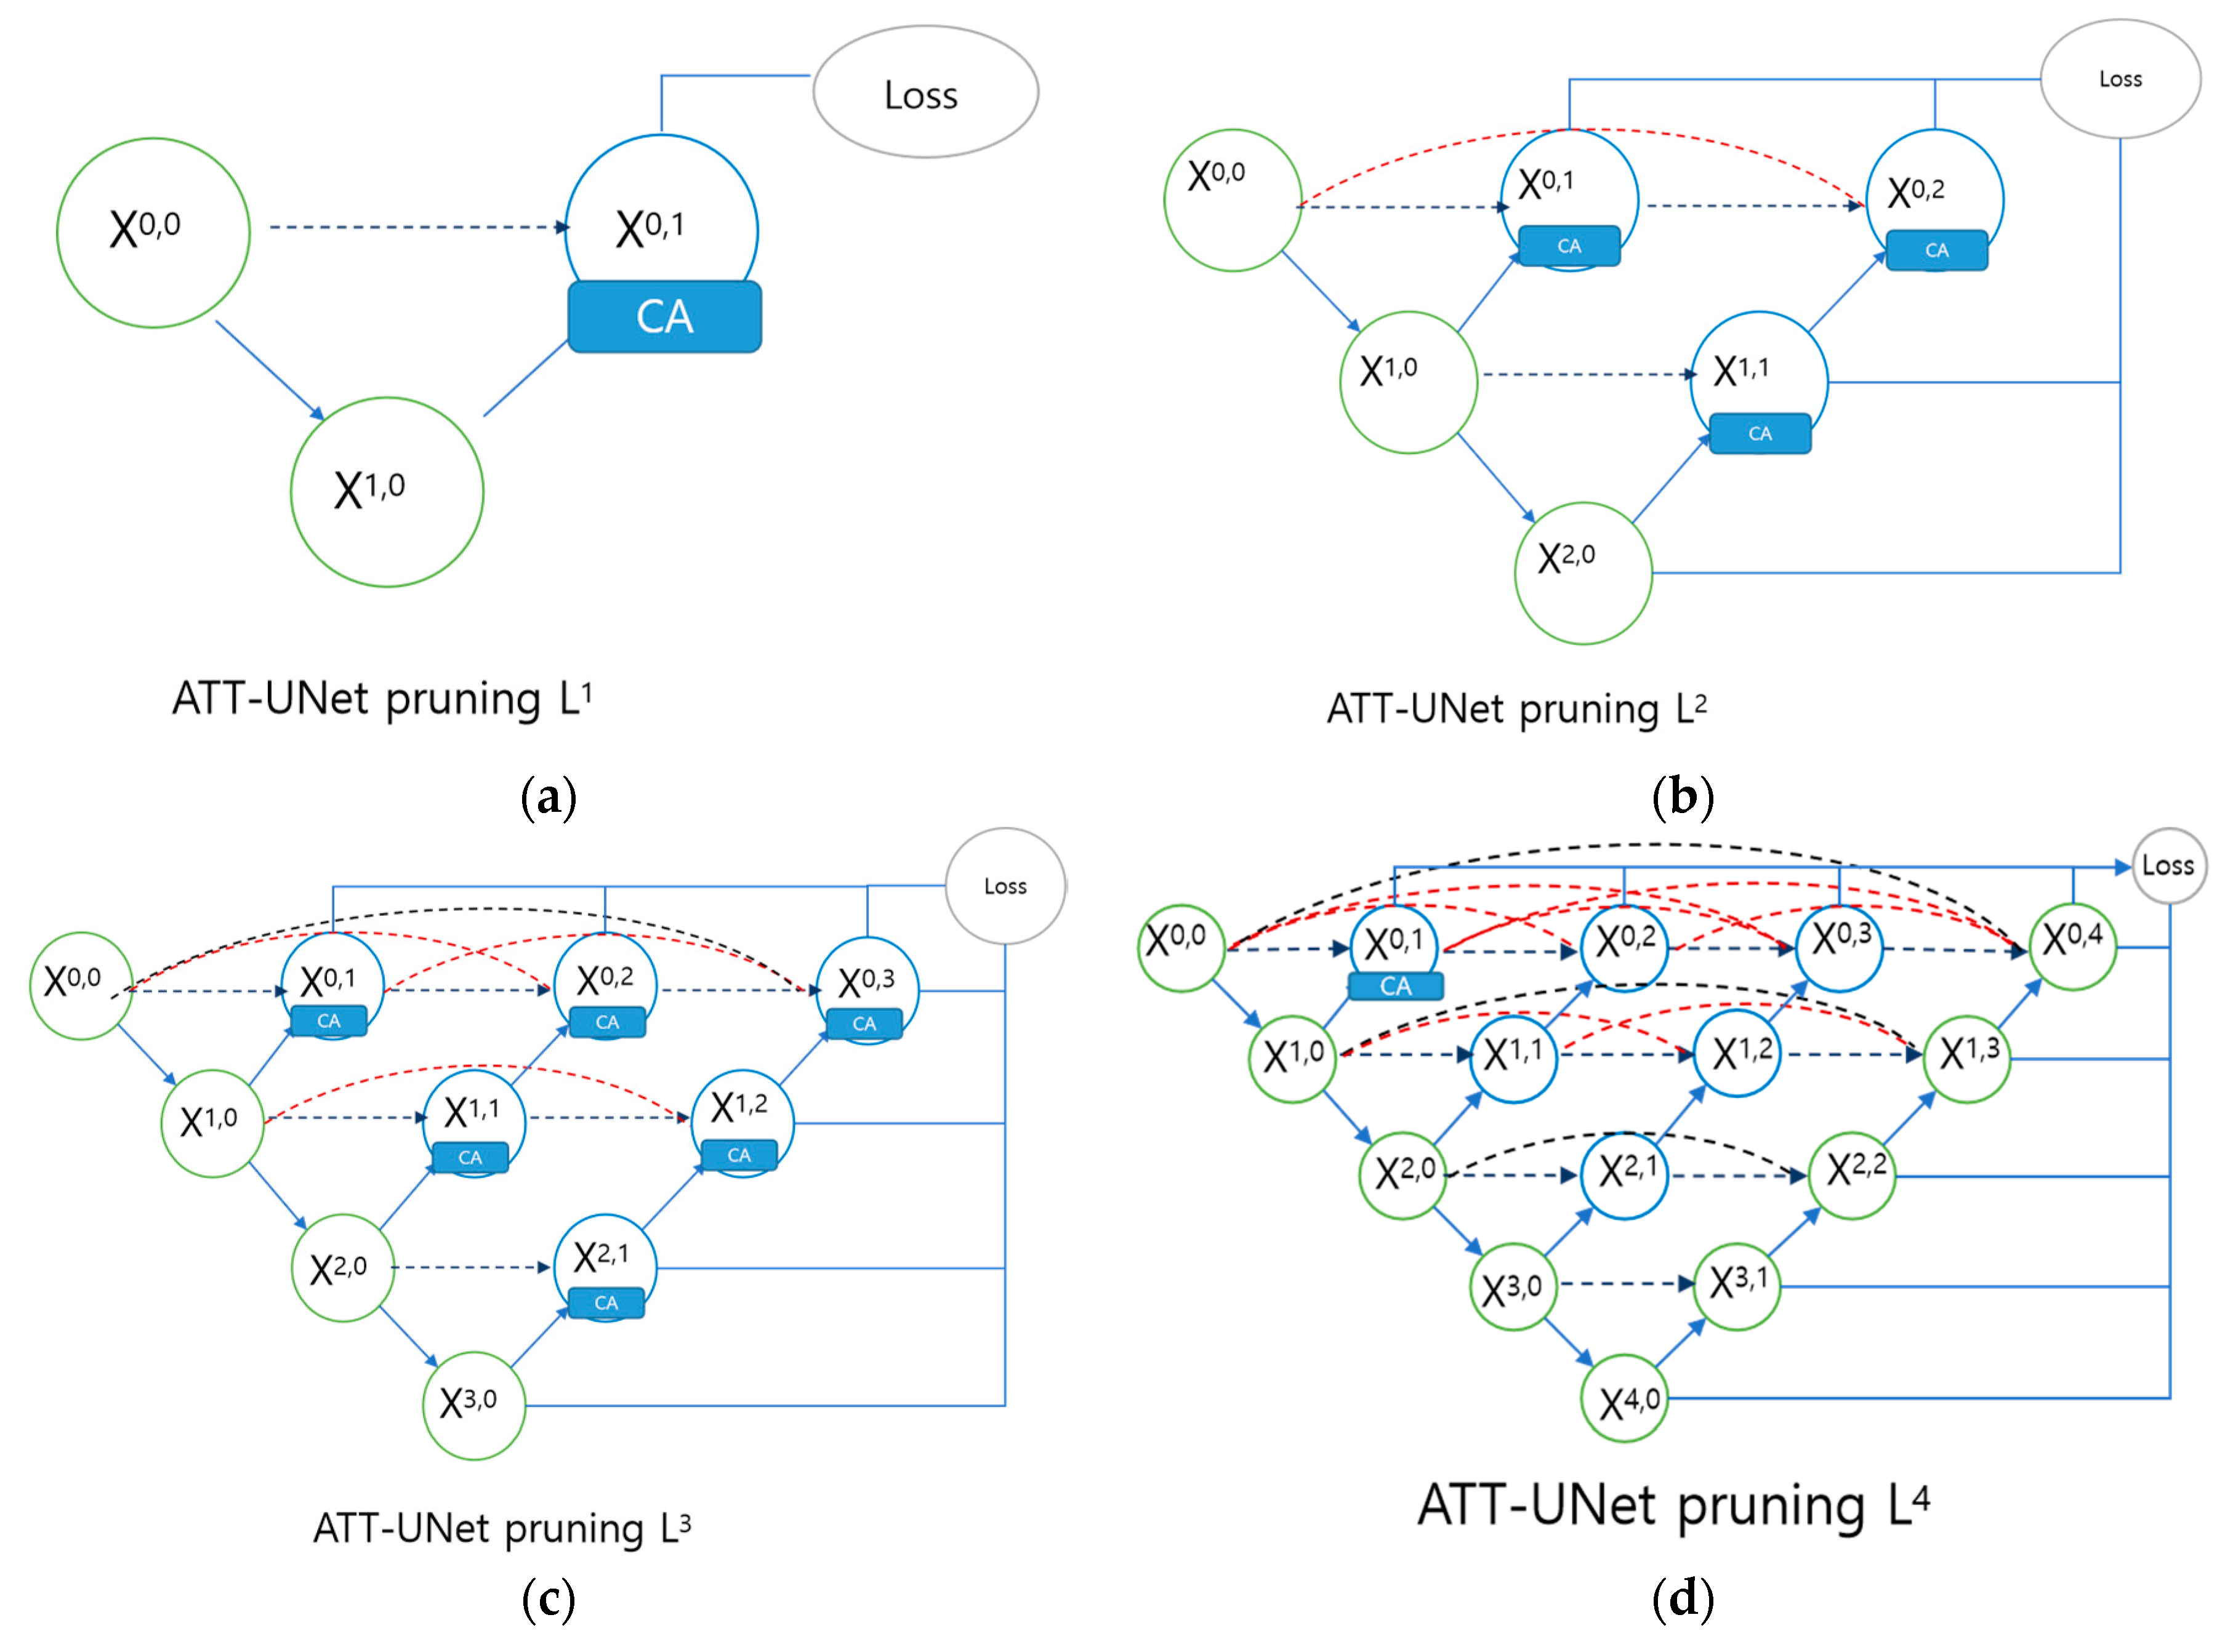
The ATT-UNet model can be divided into four structures of different depths. ATT-UNet(L1) is shown in Figure 4-(a), ATT-UNet(L2) in Figure 4-(b), ATT-UNet(L3) in Figure 4-(c), and ATT-UNet(L4) in Figure 4-(d).
This section may be divided by subheadings. It should provide a concise and precise description of the experimental results, their interpretation, as well as the experimental conclusions that can be drawn.
UNet++ has the advantage of choosing network structures of various depths compared to UNet, due to its inclusion of various depths of UNet components. All these UNet components share one encoder, and their decoders are interconnected.
The improvements in UNet++ have enabled the model to better capture and preserve target boundary information, which is crucial for accurate segmentation of crops and weeds. Accurate boundary information helps better distinguish between adjacent crop and weed areas. The structural improvements in UNet++ have enhanced the model's robustness and generalization ability, which is very important for showing excellent performance in various types of agricultural images and plant varieties. This paper focuses on ATT-UNet (UNet++ with an attention mechanism), an improved version of the traditional UNet image segmentation model. Figure 1 shows this network structure, which is a nested UNet model with an added attention mechanism module in the upsampling. This model consists of four parts: downsampling, upsampling, attention mechanism, and skip connections. To reduce the semantic difference between encoder and decoder, UNet++ uses skip paths before using parallel paths.In UNet++, each encoder block skips over to obtain information and combines with the decoder block, allowing UNet++ to produce better results and learn better features.
ATT-UNet is an encoder closely connected to the decoder through jump connections to fuse shallow and deep features. Finally, after a 1×1 convolution layer and a beta activation function, there are nodes. The 1×1 convolution layer and excitation function are used to output the segmented mapping of crops and weed images of the same original input size as shown in Figure 1.
ATT-UNet allows for the deep supervision of all UNets simultaneously through shared image representations. This not only improves overall segmentation performance but also enables pruning of the model during the inference process. The outputs of different depth models in other plant datasets (rice, sugar beet, pea) are shown in Table 1, Table 2 and Table 3, respectively. Deep supervision means statistically observing and analyzing the outputs of different depths.

3.2. Extracting Crops from Data Images

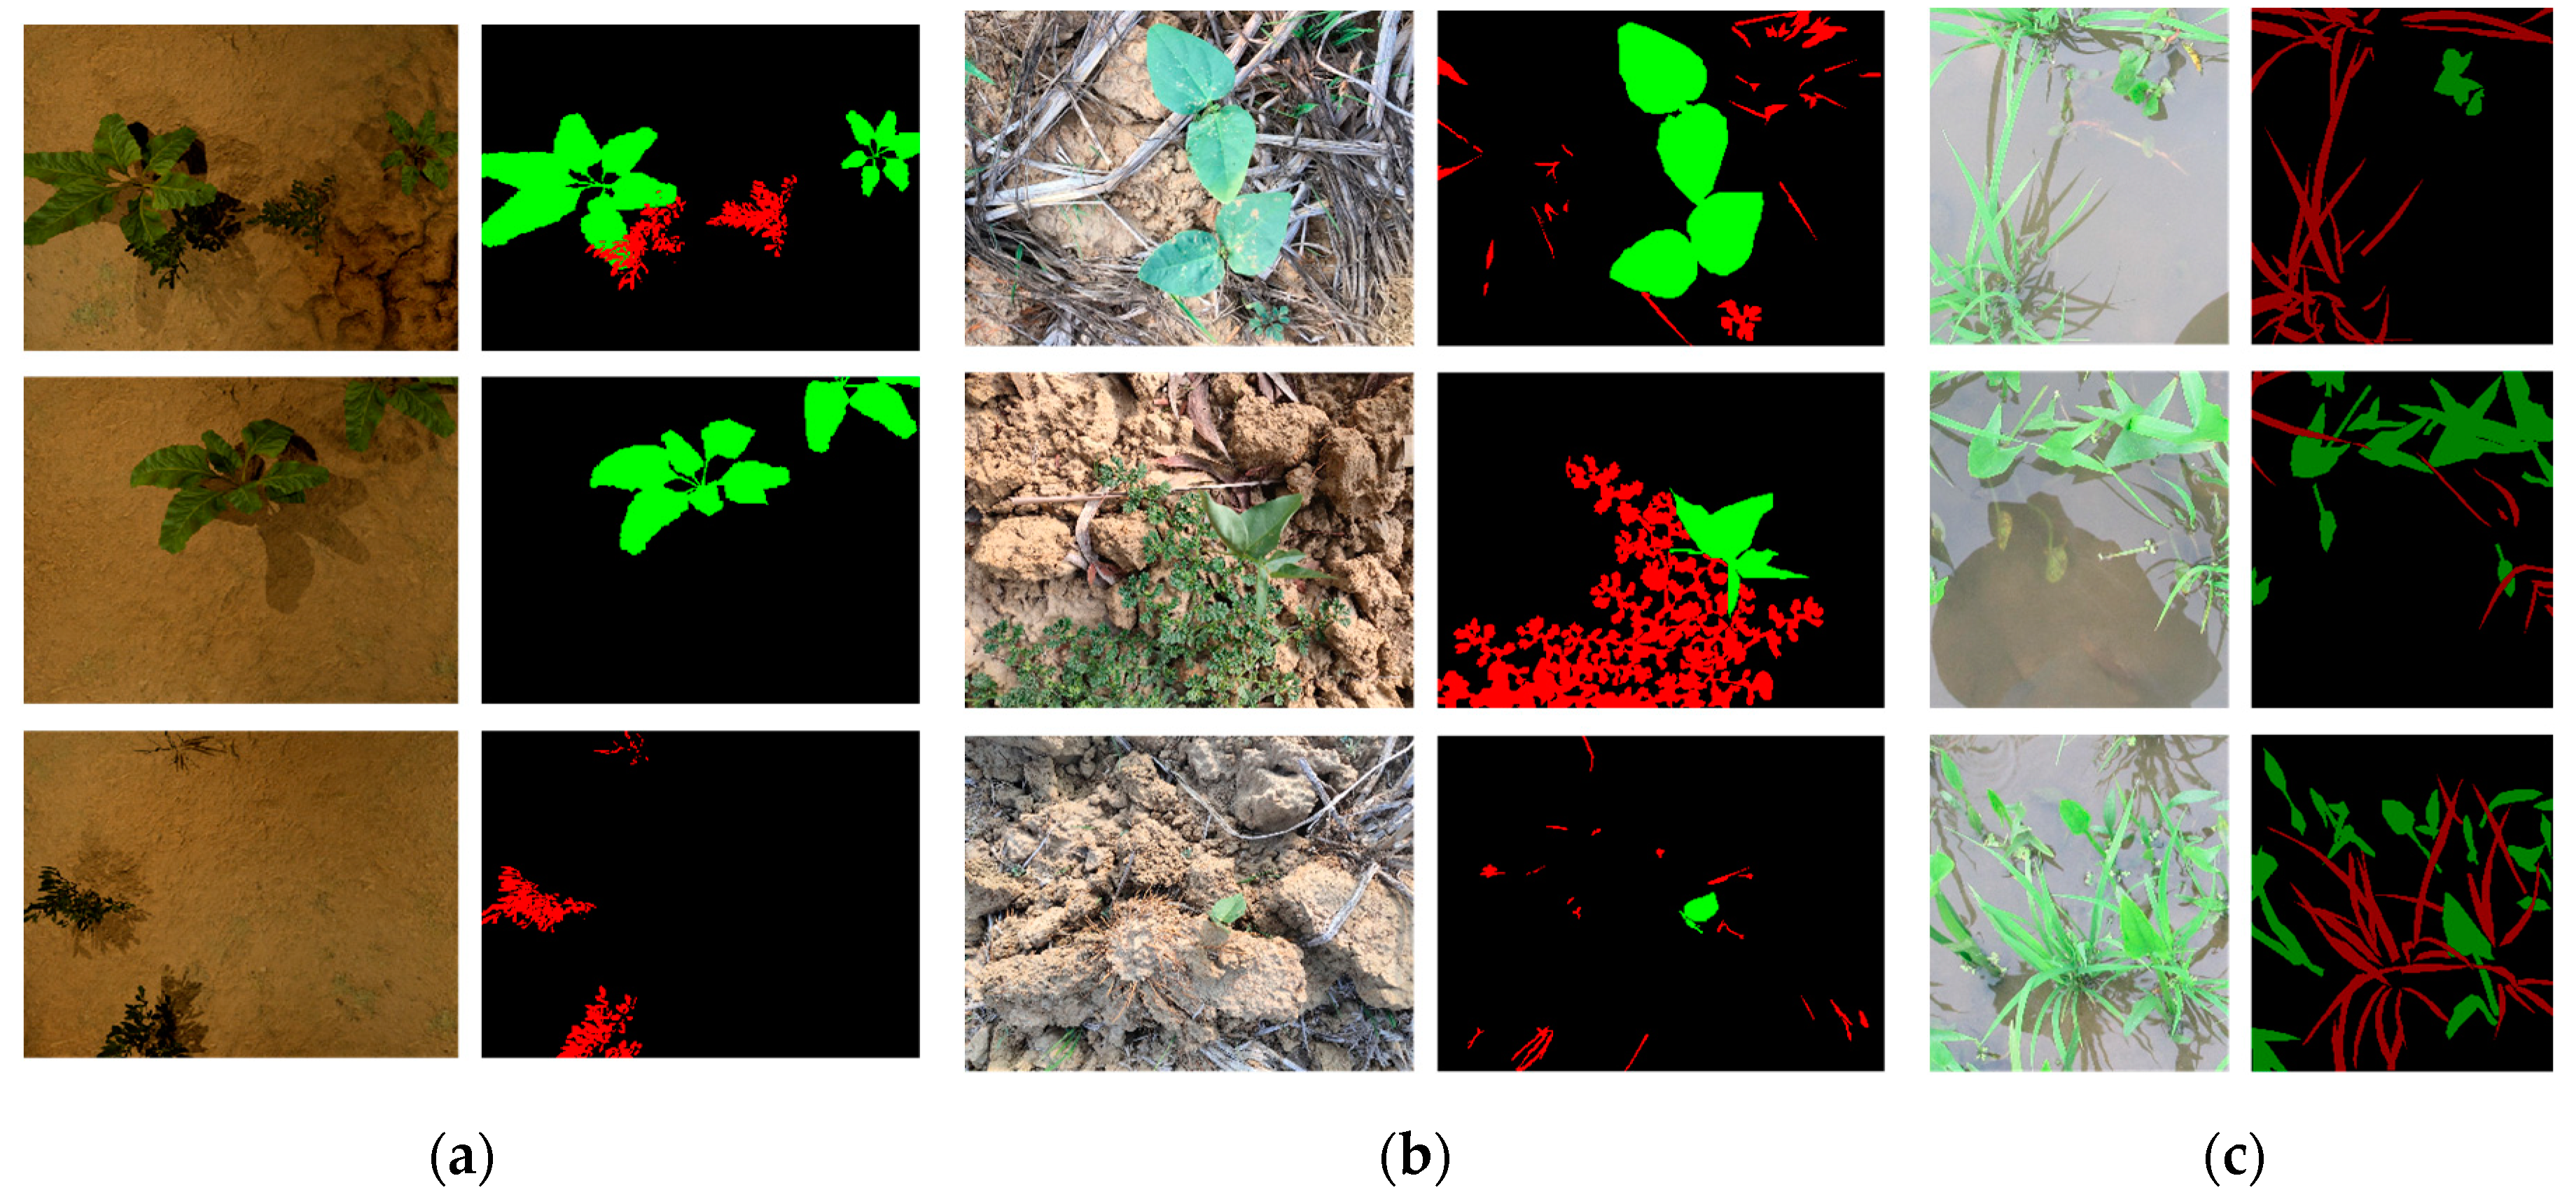
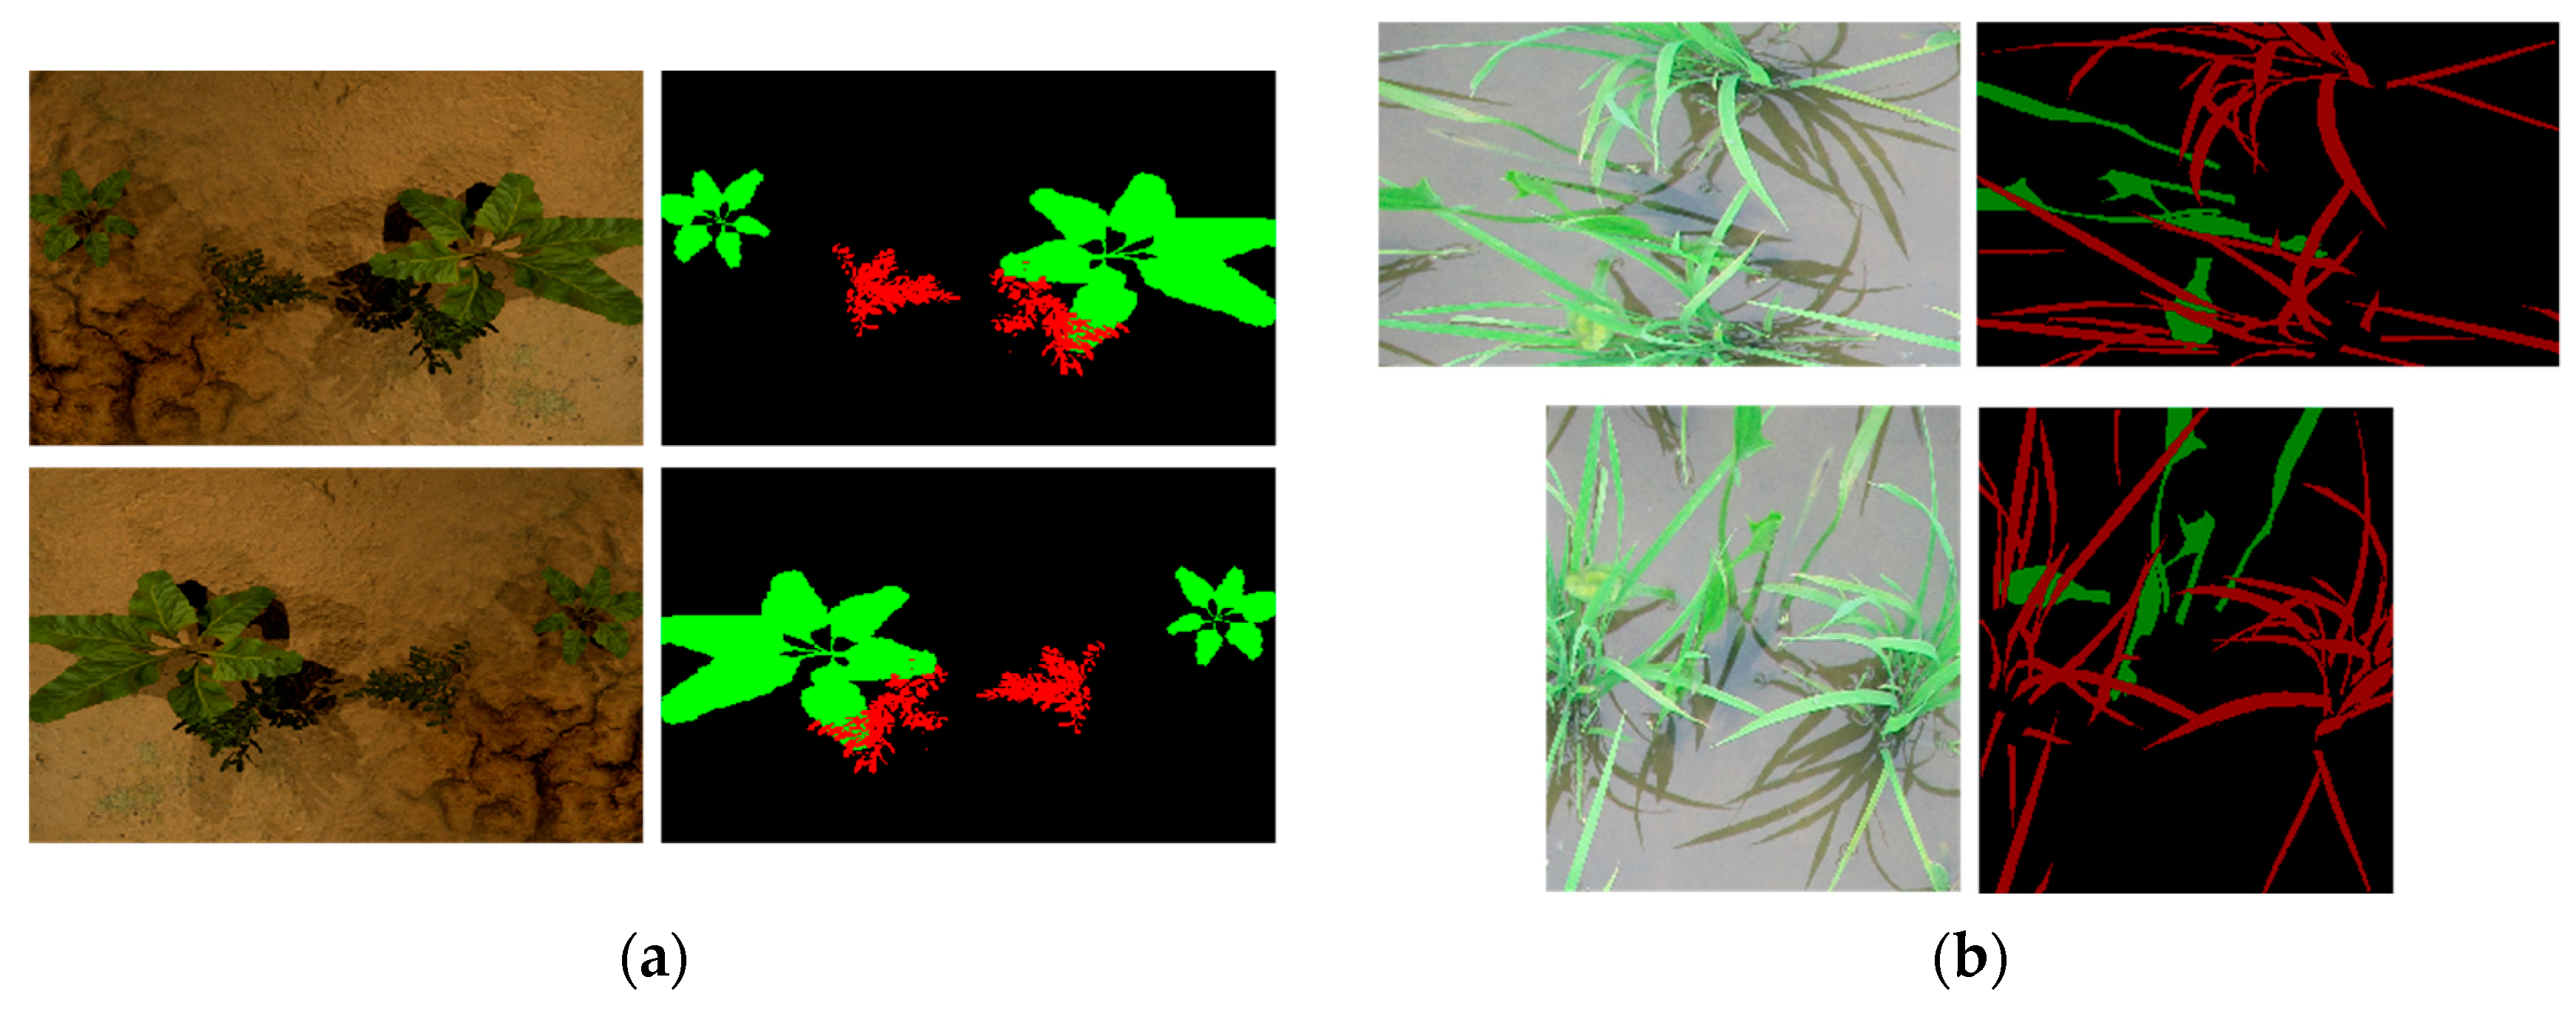
The rice dataset is manually annotated using the labelme tool, with precise annotations for all images. The annotation mode is Polygons, with annotations only for rice and weed areas in the image; all other areas are considered background. The color of the generated label images (Label) is as follows: rice minari is marked in red, weeds in green, and the background in black. The labels are stored in png format, and the annotations are as shown in Figure 8. The rice data consists of a total of 216 images with a resolution of 912×1024. This data was collected on July 3, 2019 [33]. The sugar beet image dataset used in this study was collected at the University of Bonn in Germany [34]. Image collection was conducted by a multifunctional robot manufactured by Bosch DeepField Robotics. The collection equipment is a JAIAD-130GE camera, providing a maximum resolution of 480×360 images. This data was collected on May 23, 2016. The pea dataset was collected in the Kumbidi region of Kerala, India, in 2020 [35], containing a total of 99 images and annotation information. This annotation information was prepared using GIMP (GNU Image Processing Program), and color codes were used for differentiation. Red represents weeds, green represents crops, and black represents the background. All images have a resolution of 1296×972.
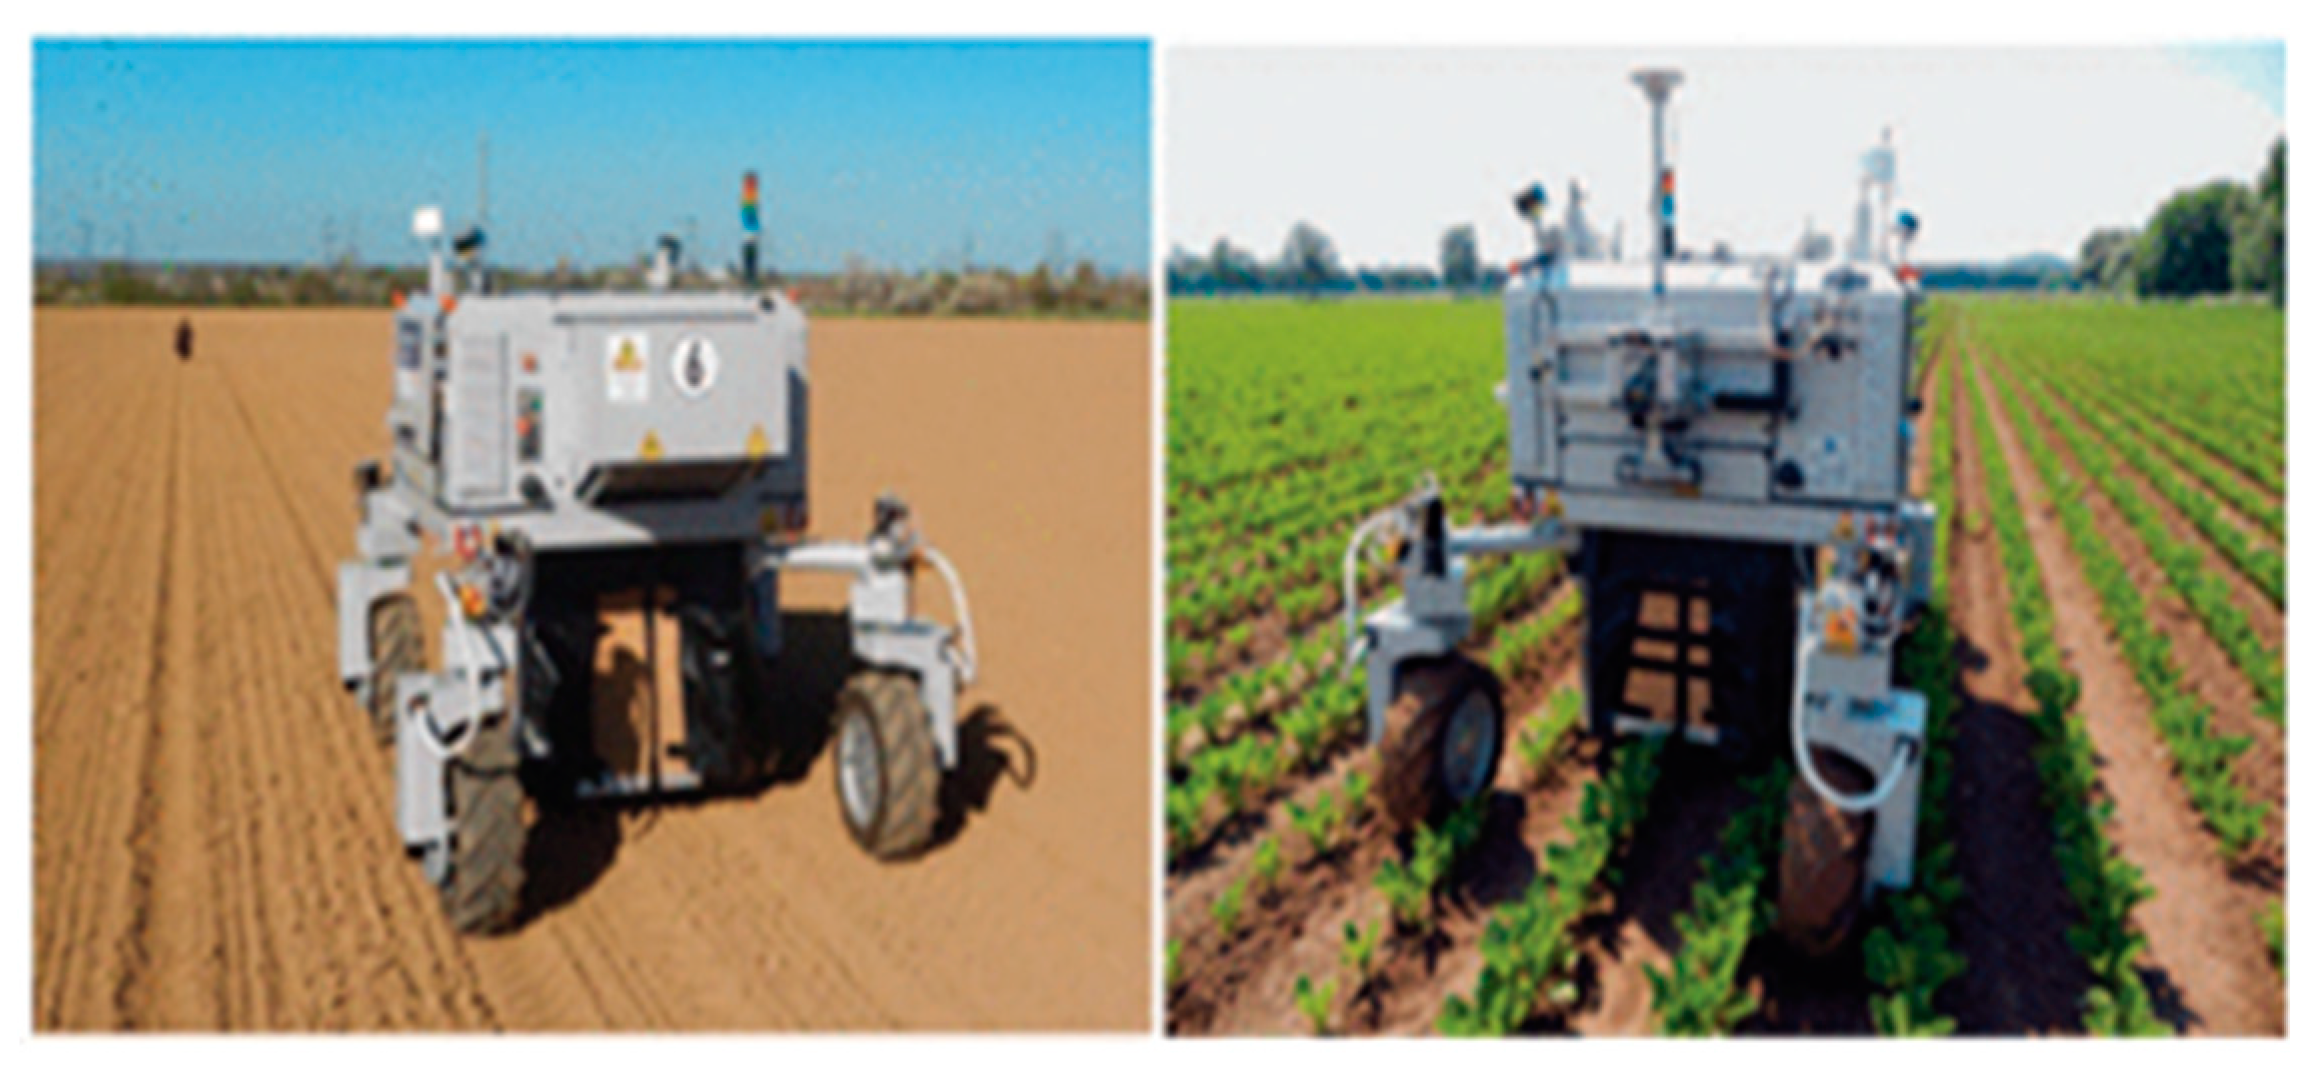
Figure 5 shows the BoniRob farm information collection robot, and Figure 6 displays samples collected from the three datasets and their labeled images. In 6-(a), the sugar beet dataset, green labels represent sugar beets and red labels represent weeds. The first row is the case with both sugar beets and weeds, the second row is with only sugar beets, and the third row is with only weeds. In 6-(b), the pea dataset, green labels represent peas and red labels represent weeds. The first row is the case with many peas and few weeds, the second row is with many weeds and few peas, and the third row is with few peas and weeds.

3.3. Data Preprocessing

In terms of data processing for various datasets, we first conducted preprocessing. This includes normalizing each channel of each image to obtain an average intensity and distinguishing between plant species and other image elements (primarily soil). This step is very important for subsequent image analysis and model training, allowing the model to better process images and more accurately identify targets of interest.
Considering the difficulty of obtaining large amounts of annotated data in actual applications, data augmentation is an effective way to enhance the performance of deep learning models. Through data augmentation, we can generate more training data from the current data. In this experiment, we used various data augmentation techniques such as random 90-degree rotation, random flipping, color and brightness adjustments, and cropping. These techniques not only increase the quantity and diversity of training data but also help improve the robustness and stability of the model. These methods effectively expand the scale of the dataset and increase the diversity of samples, allowing the model to improve performance in various conditions and environments, as shown in Figure 7.
Additionally, these data augmentation operations help reduce duplication and dependency between datasets, allowing the model to better learn and identify plant characteristics in various environments. This strategy is particularly important for semantic segmentation tasks, ensuring the model works effectively not only on training data but also on unseen data. By using these detailed dataset processing and various data augmentation techniques, we can effectively train a powerful deep learning model for accurate agricultural image segmentation. This approach not only improves the model's generalization ability and performance but also provides a feasible method for efficient model training in resource-limited situations.

3.4. Loss Function

BCEDiceLoss loss function is increasingly popular in deep learning, especially in fields related to medical image segmentation [36,37]. This loss function is designed by combining Binary CrossEntropy and Dice coefficient loss to simultaneously address the challenges of classification and segmentation tasks, aiming to improve the overall performance of the model.
Binary Cross Entropy loss is a common loss function suitable for binary classification tasks, a probability-based method that calculates loss by comparing the difference between model predictions and actual labels. This loss function is particularly suitable for handling imbalanced datasets, effectively dealing with the issue of positive and negative data ratios in classification tasks. On the other hand, Dice coefficient loss is a set-based similarity measure, especially suitable for image segmentation tasks. The Dice coefficient (also known as Dice similarity coefficient) measures the similarity of two samples by calculating the overlap area between them. In image segmentation, this quantifies the degree of overlap between the model's predicted segmentation area and the actual segmentation area. Therefore, Dice loss directly optimizes the accuracy of segmentation boundaries, especially when the shape and size of the target object vary significantly.
BCEDiceLoss loss function combines the advantages of these two loss functions, allowing the model to achieve a good balance in both classification accuracy and segmentation accuracy. Such combined loss functions have effectively enhanced the model's ability to process complex images, particularly in scenes with uneven backgrounds and irregular target boundaries. Additionally, BCEDiceLoss accelerates the convergence speed of the model and makes training more efficient by combining these two methods. The formula for the loss function is as follows:
bce = 1 / 2 Y × log σ X + 1 Y × log 1 σ X
dice = 1 2 X Y X + Y + 5
loss = ω × bce + 1 ω ×   dice
Among them, σ(·) is the sigmoid function, X is the model's prediction output, Y is the label, S=1, w is the equilibrium coefficient of the two loss functions, which is 0.5 here.

3.5. Evaluation Metrics

Mean Intersection over Union (MIoU) is an extremely important and widely used metric in the field of semantic segmentation [38,39]. It is particularly used to compare different models or to check the performance of a model on different datasets.
The calculation of MIoU is based on the Intersection over Union (IOU) values of individual images. IOU is a metric for evaluating the quality of individual image segmentation, calculated as the ratio of the overlapping area between the actual segmentation (ground truth) and the predicted segmentation (model prediction) to the total area of both segments. Specifically, IOU is the ratio of the intersection (overlapping part) to the union (total of the two parts minus the overlapping part) of the two areas. This metric intuitively represents how similar the predicted segmentation is to the actual segmentation. MIoU is calculated using the following formula:
MIOU = 1 n n i = 1 TP FP + FN + TP
TP (True Positive) refers to cases where the actual value is Positive, and the predicted value is also Positive. FN (False Negative) refers to cases where the actual value is Positive, but the predicted value is Negative. FP (False Positive) refers to cases where the actual value is Negative, but the predicted value is Positive. TN (True Negative) refers to cases where the actual value is Negative, and the predicted value is also Negative.

4. Experiments and Results Analysis

4.1. Experimental Environment

The experimental environment for this paper is as follows. Experiments were conducted on Windows 10 (64-bit), Anaconda 4.10.3, Python 3.9, CUDA 11.3, cuDNN 8.2.1, and an AMD Ryzen 95900 X 12-core processor at 3.70 GHz, using 32GB of computer memory. The deep learning framework PyTorch was used as the development environment.
The performance and generalization ability of the Semantic Segmentation model were improved by setting pre-trained parameters. The Adam [40] algorithm was used as the optimization function, with a learning rate set to 3e-4 and a minimum learning rate of 1e-4. The Momentum algorithm uses a physical principle that utilizes inertia to mimic the movement of objects. The Momentum is 0.9, weight decay is 1e-4, the loss function is BCEDiceLoss, and the cycle is 300.

4.2. Experimental Results

To select the most suitable model for agricultural image segmentation, TransUNet, CNNTransUNet, UNet, UNet++, and ATT-UNet models were compared and analyzed. The core metric for model performance evaluation was the test cross-union ratio (IOU). According to the document, ATT-UNet showed superior performance over the UNet and UNet++ models in various datasets, especially in processing sugar beet datasets.
ATT-UNet achieved a performance improvement of 1.97% and 2.05% over the UNet and UNet++ models, respectively, in the sugar beet dataset. This result suggests that ATT-UNet can realize more accurate segmentation in image processing with complex backgrounds, despite the UNet and UNet++ already being effective models.
In the case of the rice dataset, where data quantity was small and the rice larvae and weeds had similar color characteristics, UNet was more suitable than UNet++ due to UNet's simpler network structure and fewer parameters, making learning and convergence easier Table 5.
ATT-UNet showed a performance improvement of 2.38% and 7.58% over the UNet and UNet++ models, respectively, in the pea dataset. This significant performance advantage demonstrates ATT-UNet's ability to effectively handle complex scenes <Table 6>.
TransUNet and CNNTransUNet models are more suitable when the dataset is relatively small, with CNNTransUNet showing better performance than TransUNet in cases of large datasets. When comparing all five models comprehensively, although the background IOU values were similar across the models, ATT-UNet demonstrated superior stability and accuracy in complex environments. This indicates that the ATT-UNet algorithm not only performs well in large datasets but also in small datasets. Therefore, ATT-UNet is a highly suitable model for agricultural image segmentation, particularly in scenarios that require handling complex backgrounds and subtle differences.
Table 4. IoU Values for Three Training Models of Sugar Beet.
Model IOU Background Weed Beet
UNet 89.83% 95.29% 95.71% 98.90%
UNet++ 89.75% 95.30% 95.71% 98.91%
ATT-UNet 91.80% 95.29% 95.73% 98.97%
TransUNet 61.11% 66.94% 67.22% 77.75%
CNNTransUNet 68.18% 66.88% 56.08% 80.27%
Table 5. IoU Values for Three Training Models of Rice.
Model IOU Background Weed Rice
UNet 73.88% 82.90% 86.25% 89.68%
UNet++ 74.90% 82.89% 86.26% 89.37%
ATT-UNet 76.38% 82.91% 86.21% 89.50%
TransUNet 77.09% 76.32% 76.44% 77.75%
CNNTransUNet 76.91% 75.25% 76.25% 77.58%
Table 6. Table 6. IoU Values for Three Training Models of Pea.
Model IOU Background Weed Pea
UNet 81.17% 85.36% 90.43% 91.34%
UNet++ 76.52% 85.32% 90.40% 91.38%
ATT-UNet 84.10% 85.36% 90.37% 91.49%
TransUNet 81.56% 68.77% 69.87% 93.26%
CNNTransUNet 81.20% 68.69% 69.56% 92.85%
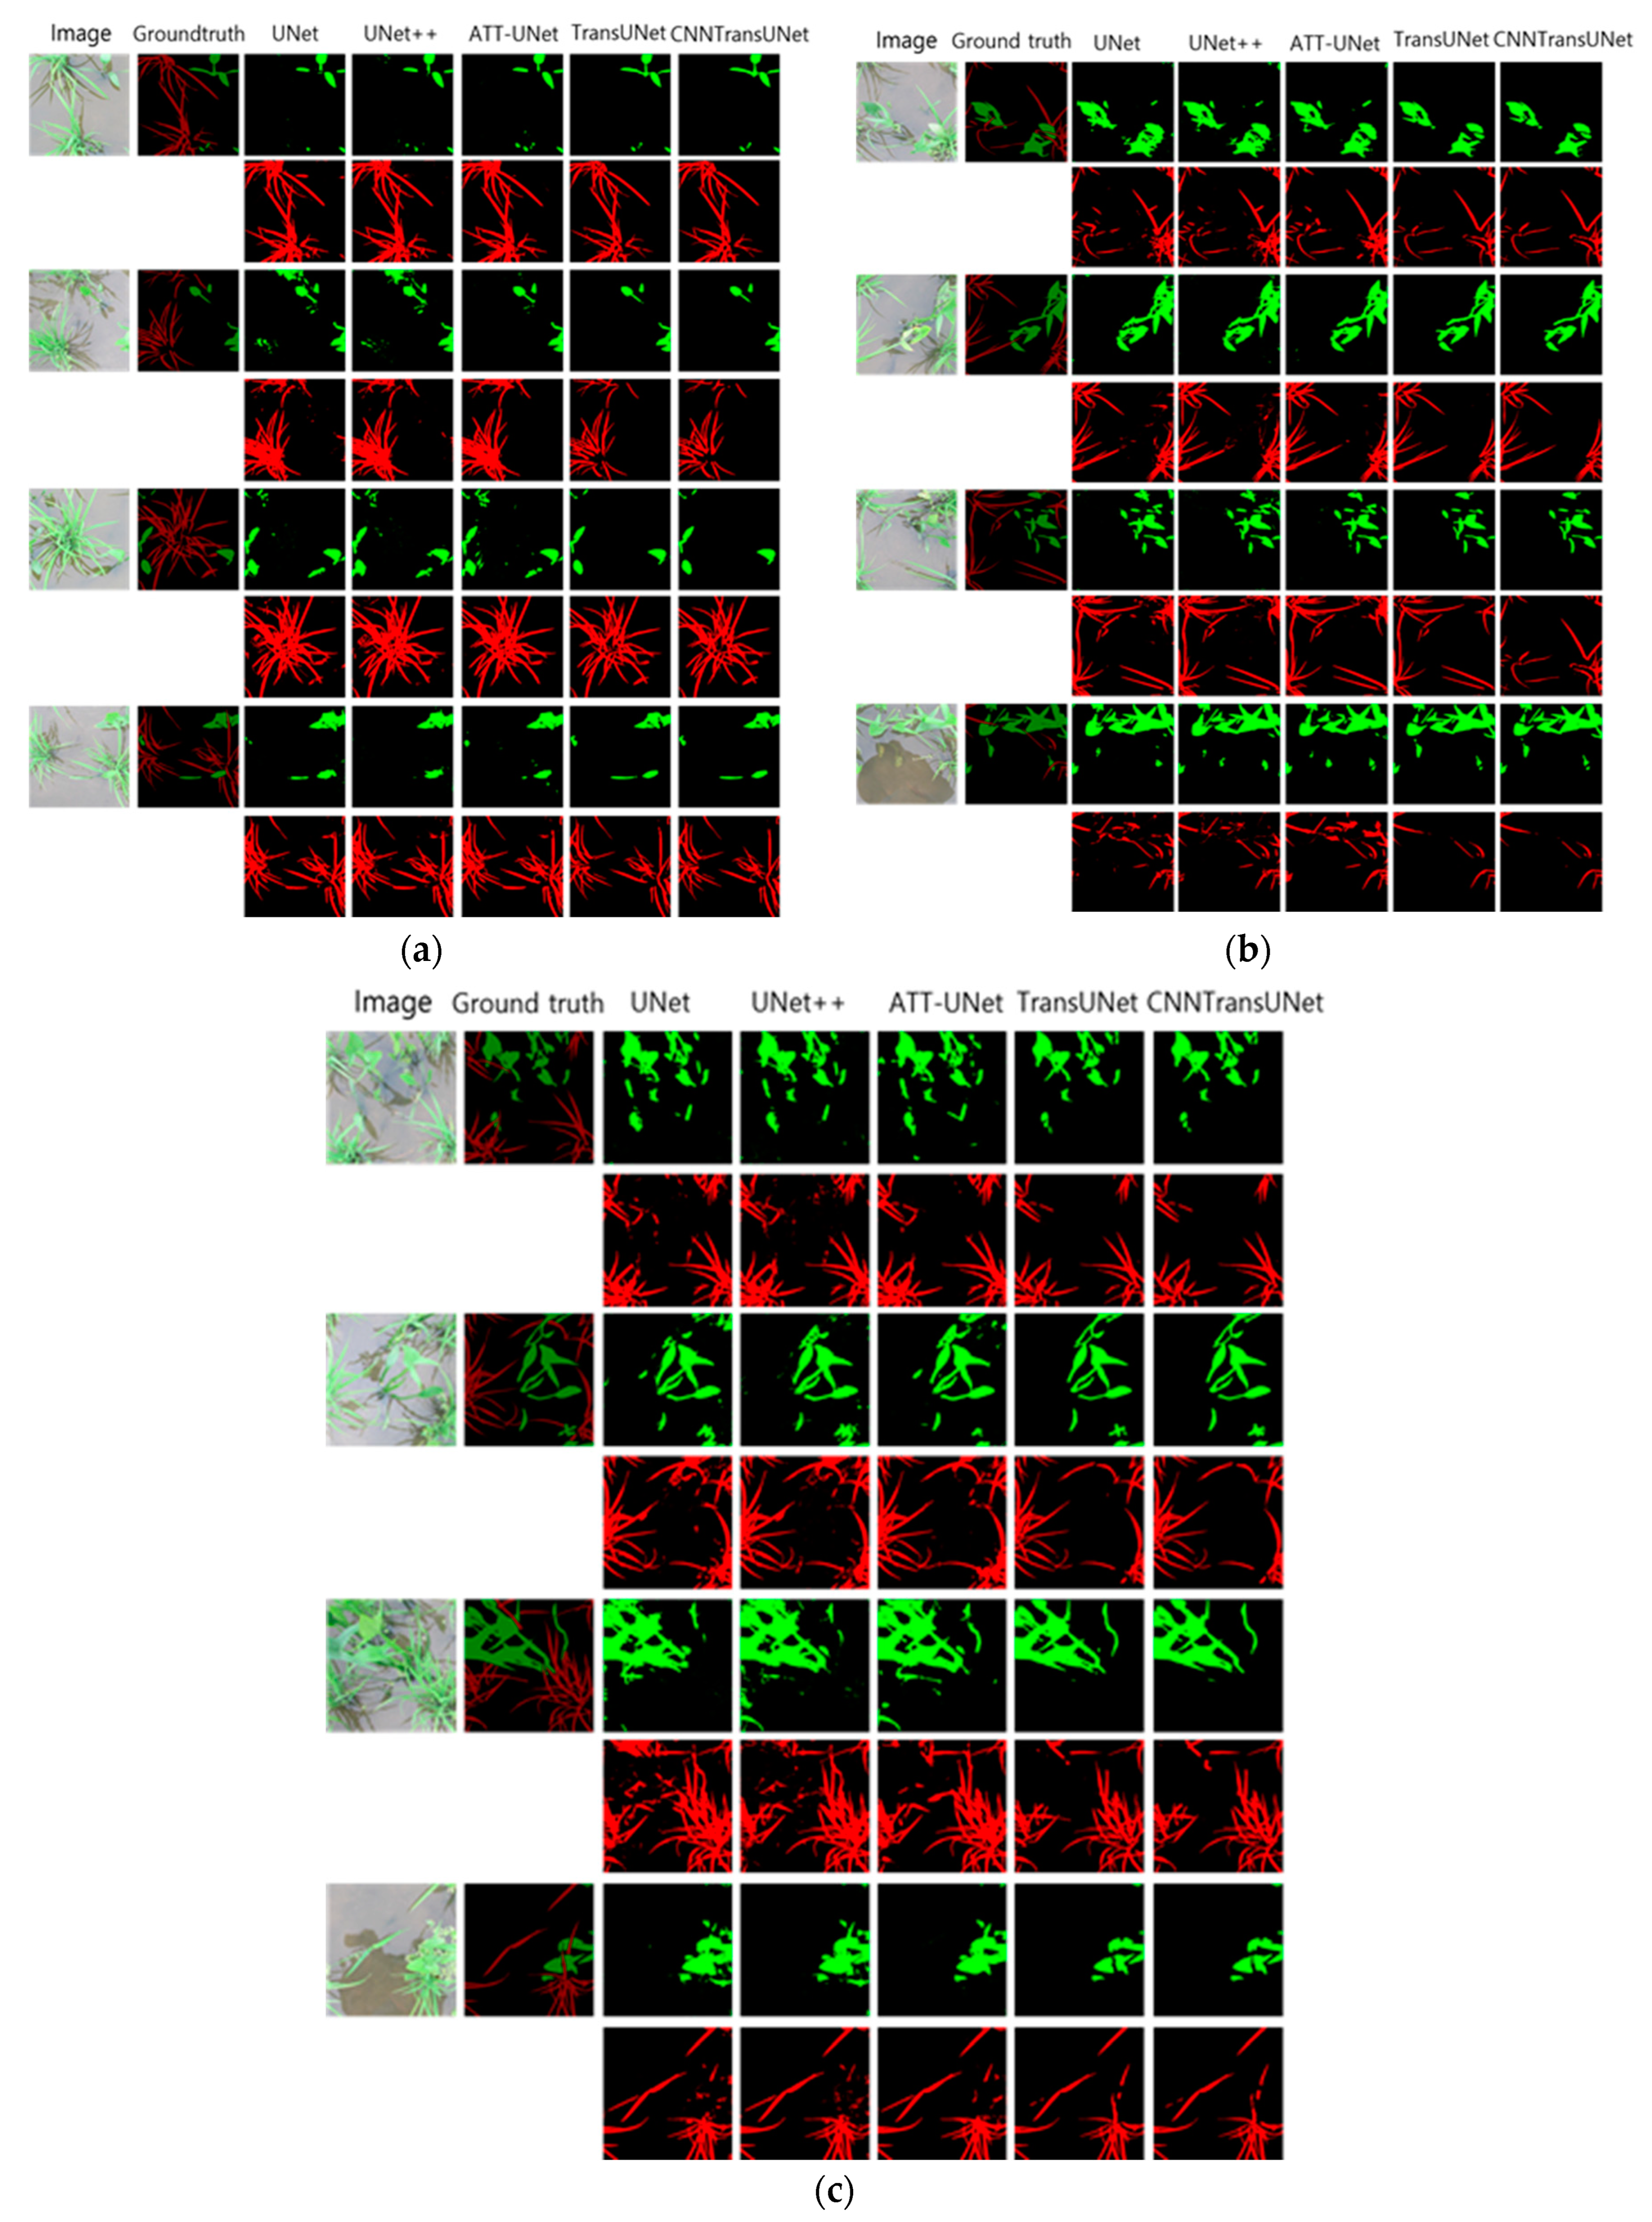
Figure 8. Rice Experiment Results, (a) few weeds and many rice plants; (b) many weeds and few rice plants; (c) both weeds and rice plants are abundant.
Preprints 101811 g008
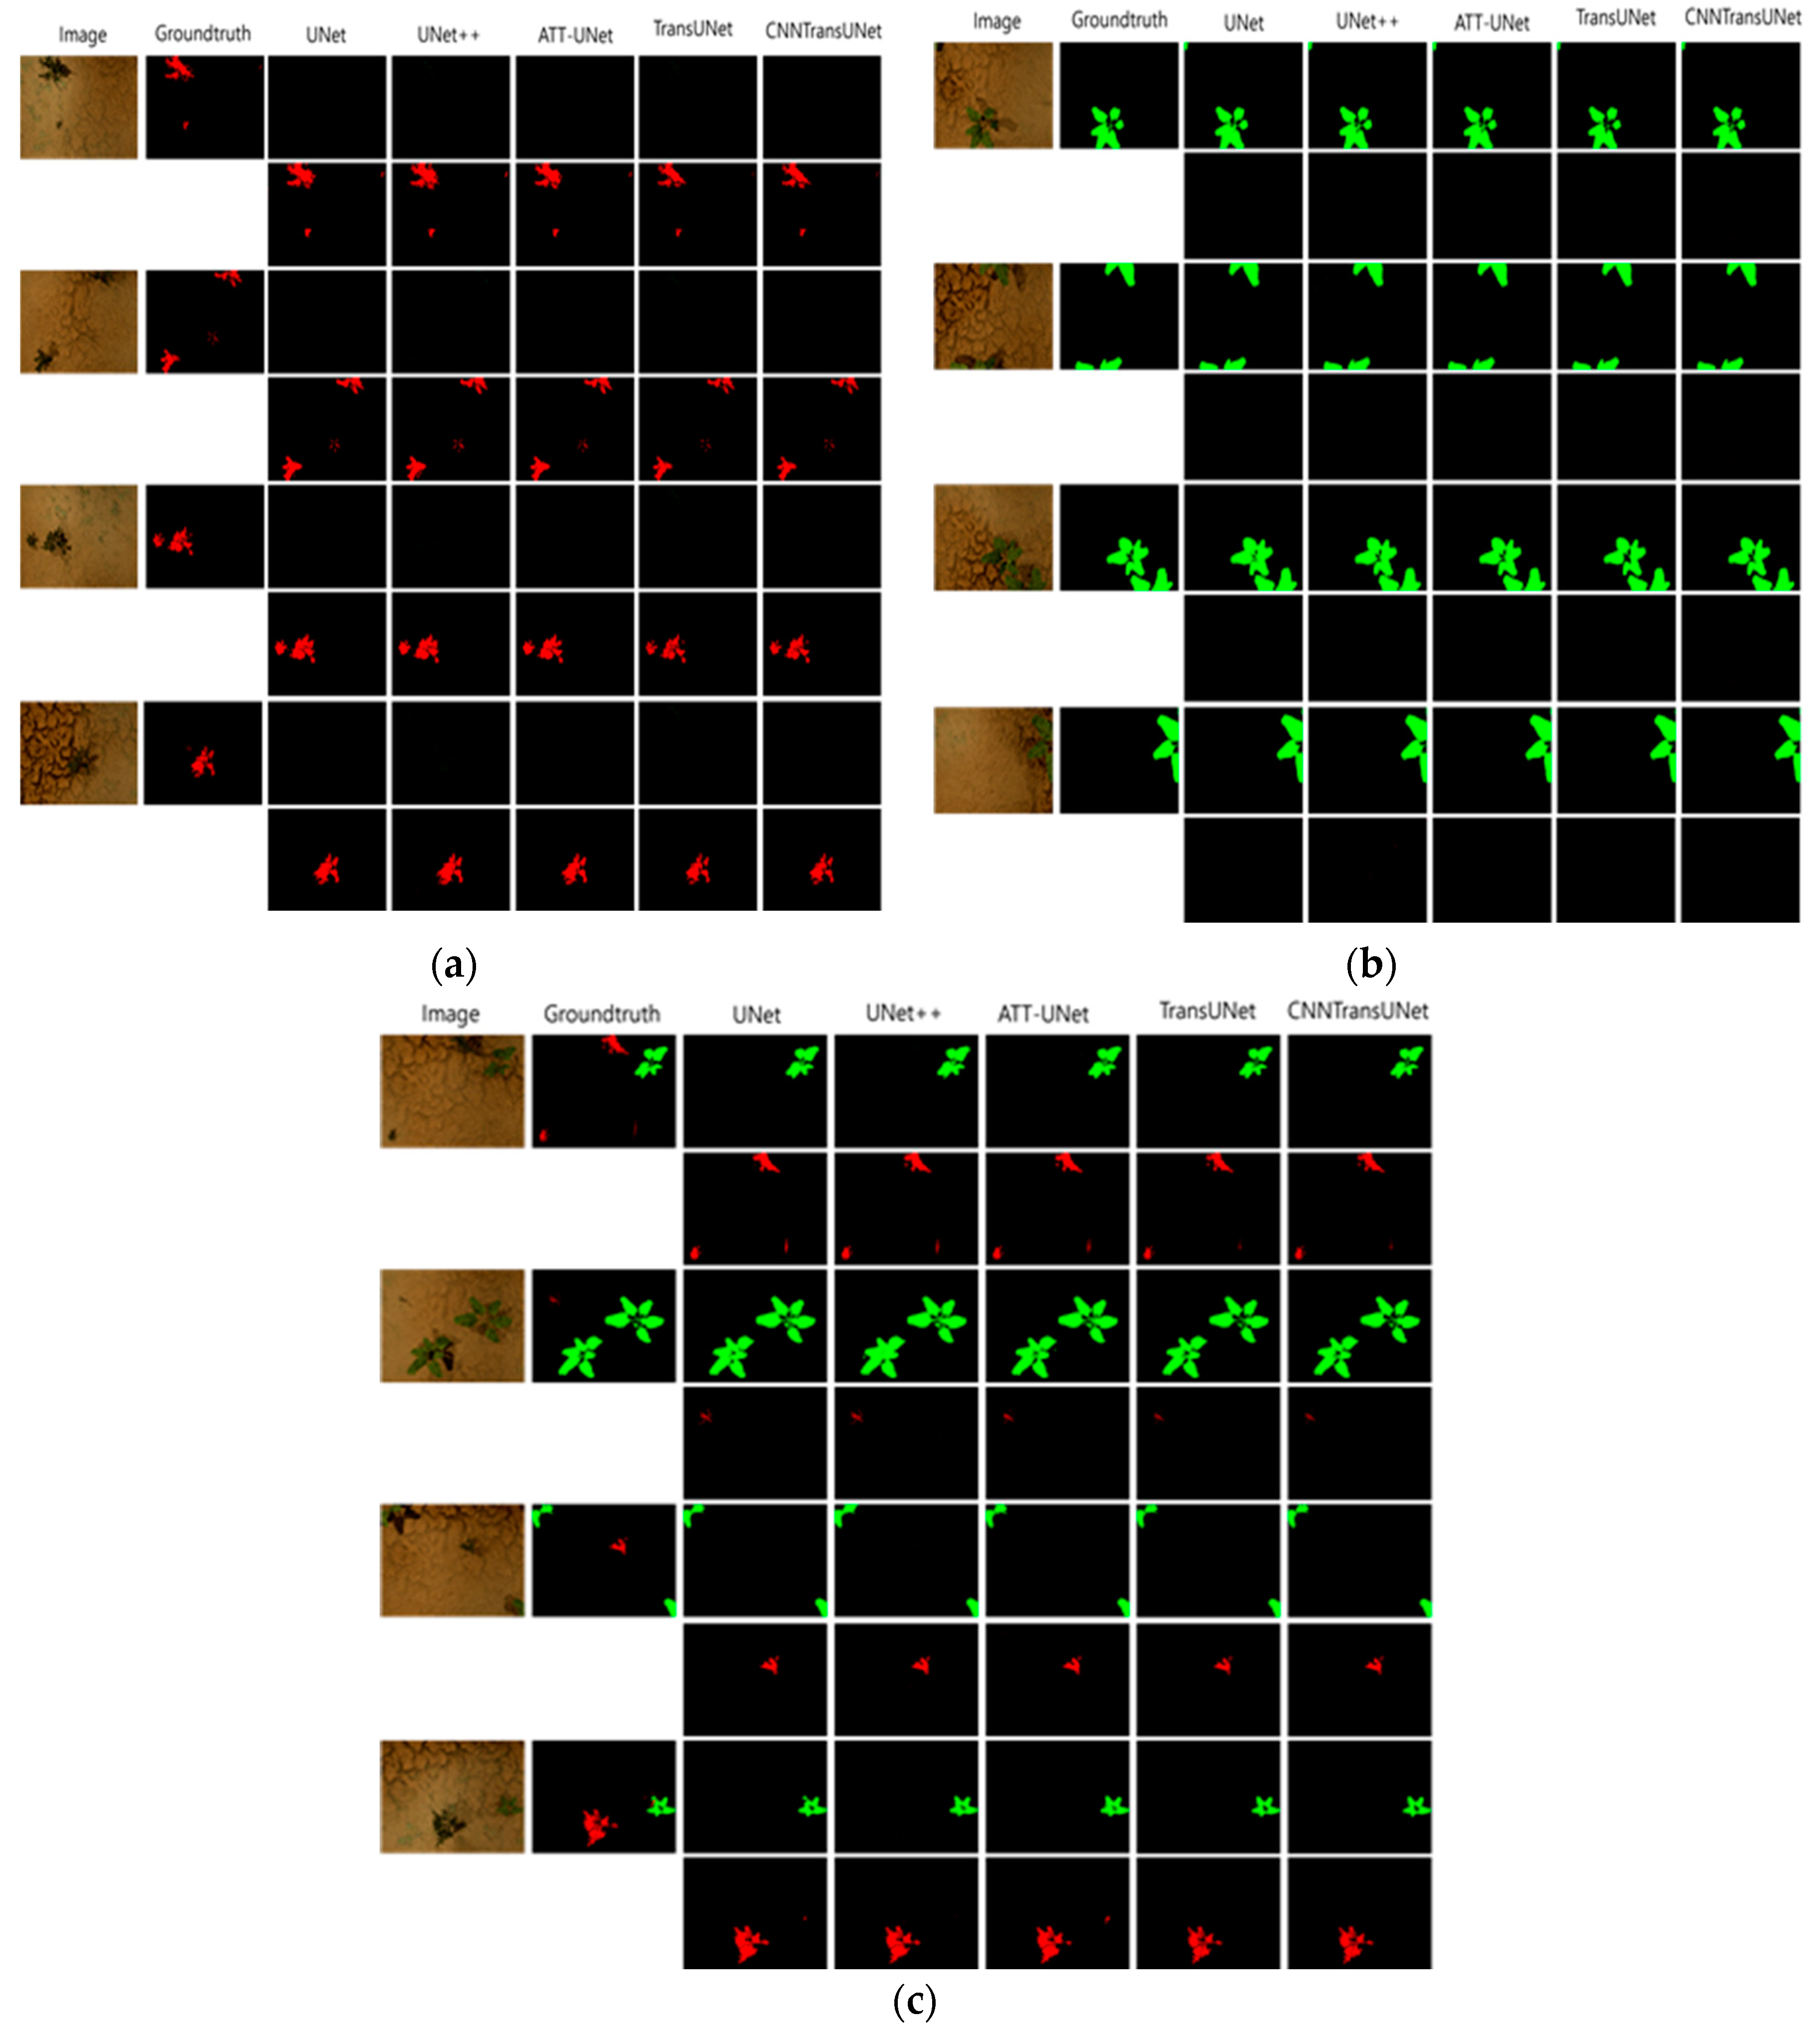
Figure 9. Sugar Beet Experiment Results, (a) only weeds present; (b) only sugar beets present; (c) both sugar beets and weeds present.
Preprints 101811 g009
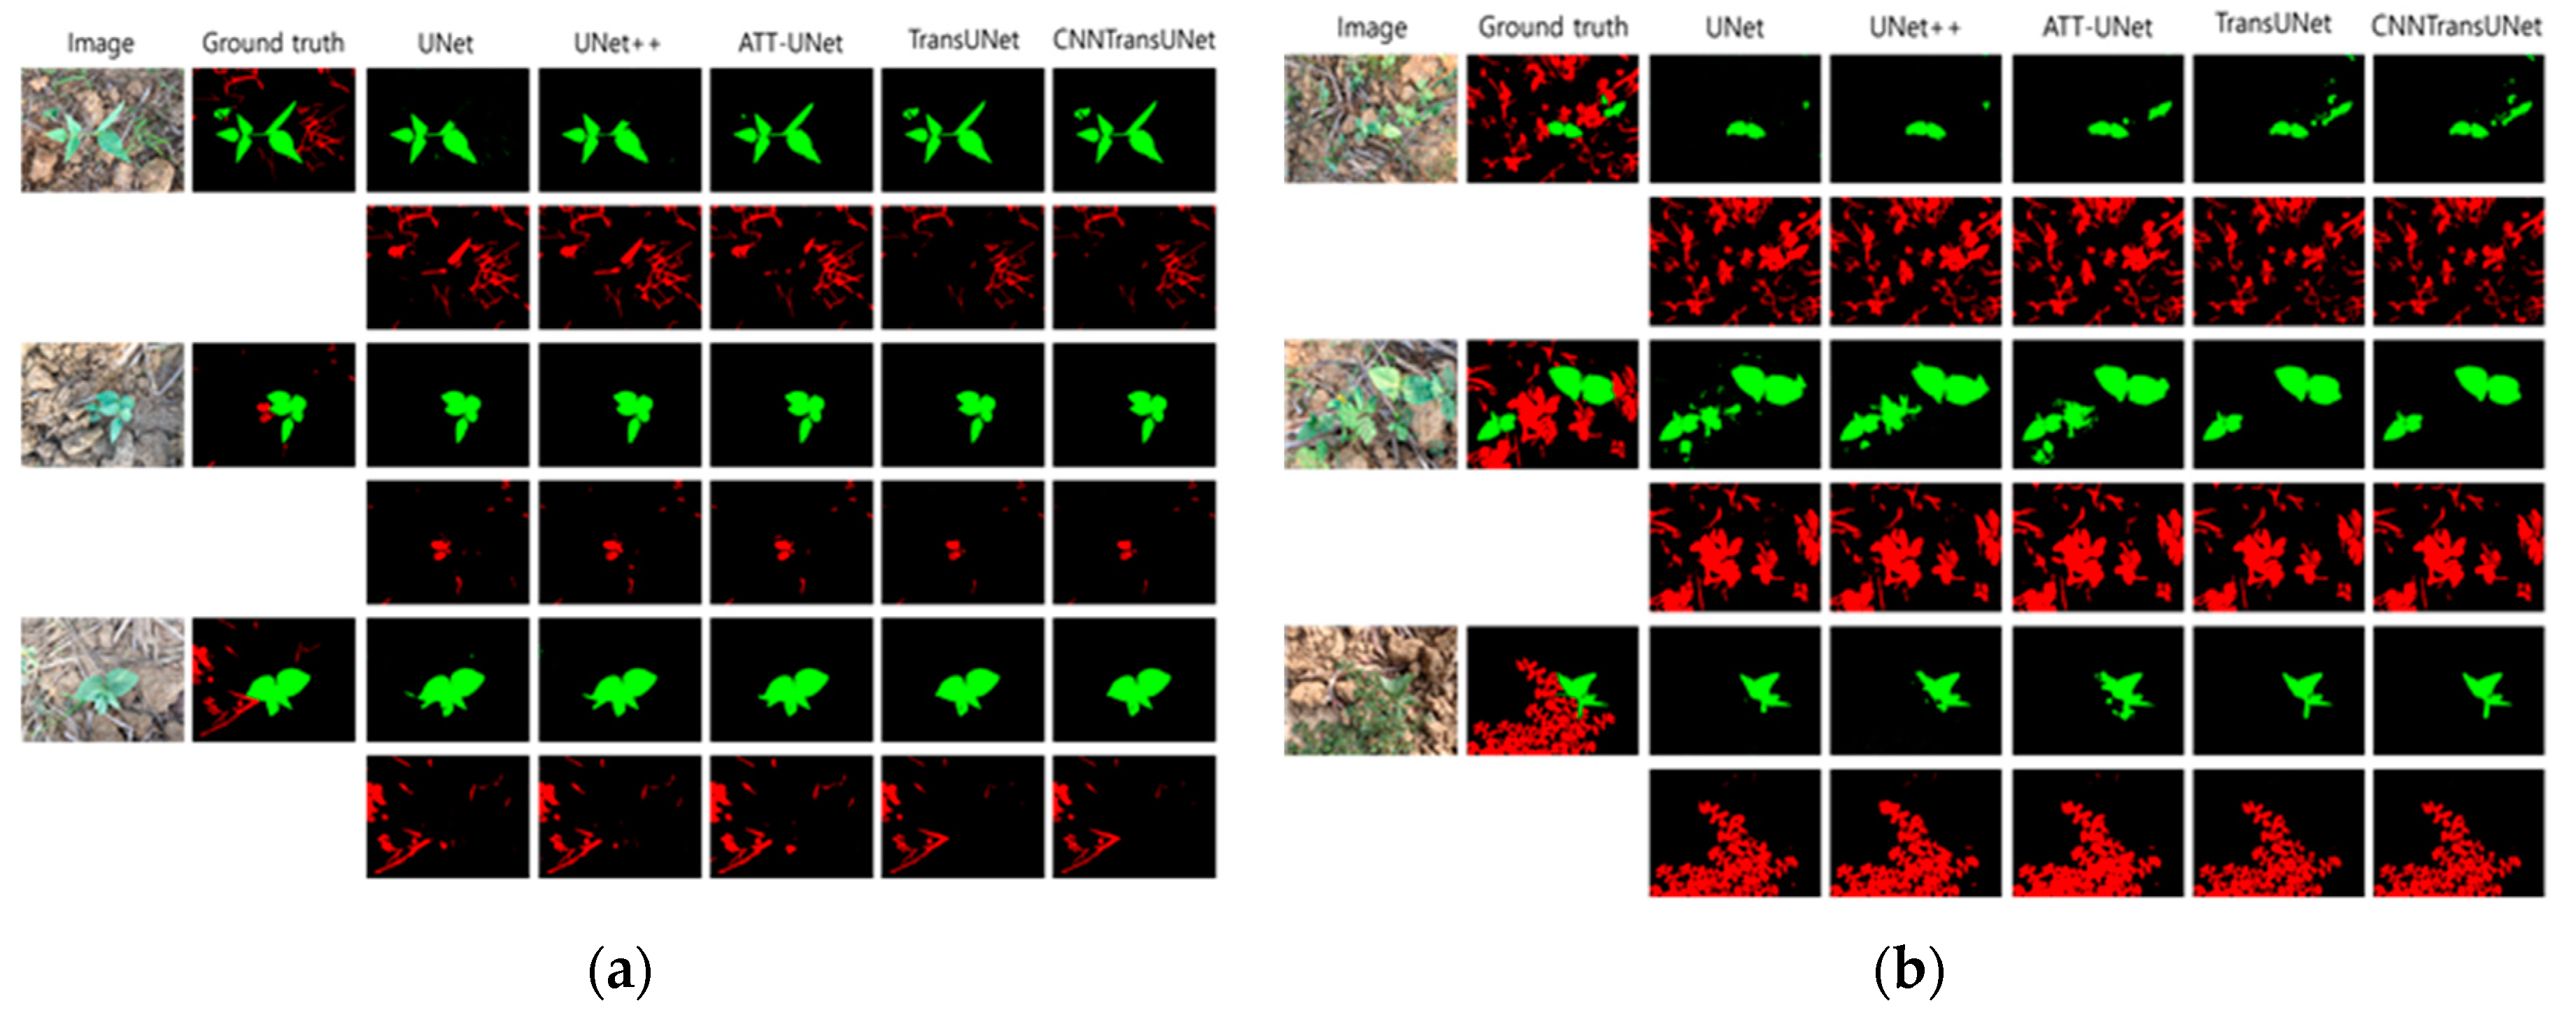
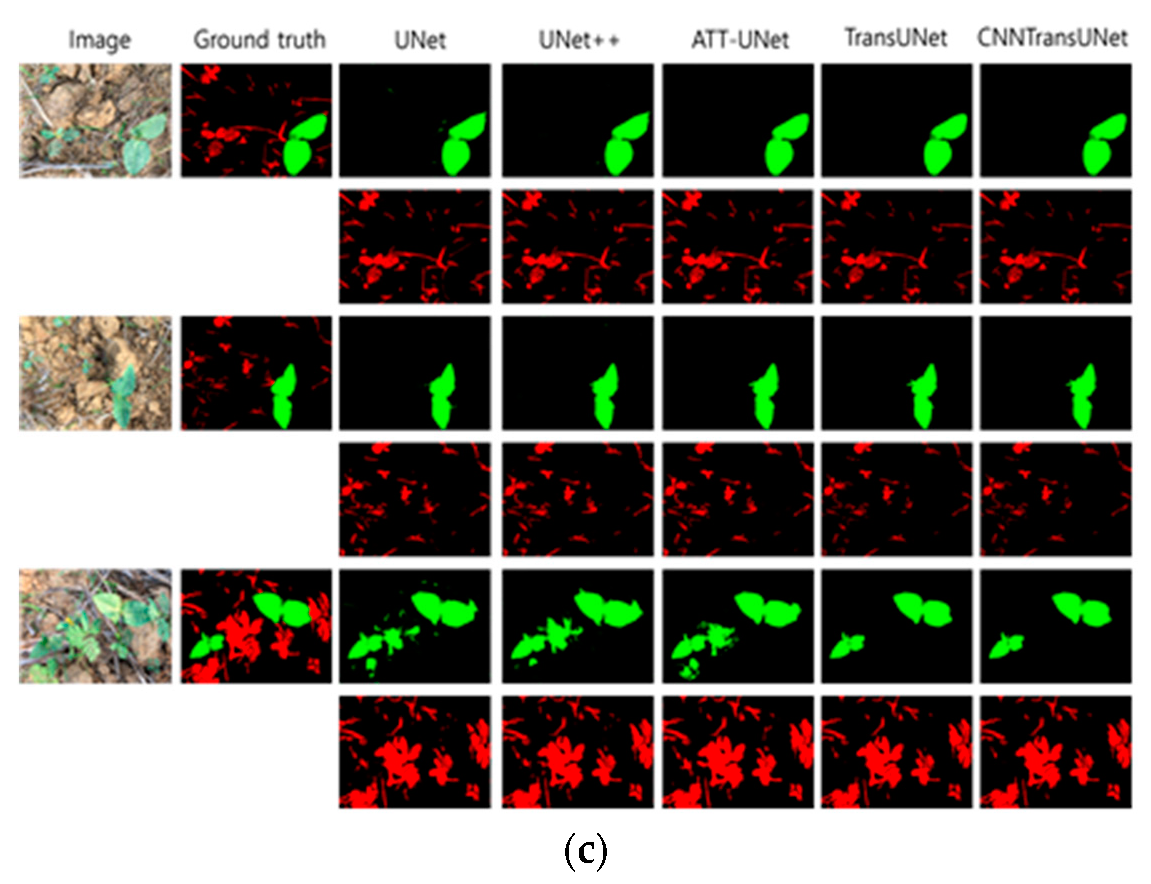
Figure 10. Pea Experiment Results, (a) many peas and few weeds; (b) many weeds and few peas; (c) both peas and weeds are abundant.
Preprints 101811 g010aPreprints 101811 g010b
The results of the ATT-UNet algorithm were compared with those of the TransUNet, CNNTransUNet, UNet, and UNet++ algorithms. The images were presented from left to right as follows: the original image, the ground truth, the segmentation results of UNet, UNet++, ATT-UNet, TransUNet, and CNNTransUNet, respectively. In the sugar beet dataset, the background was marked in black, sugar beets in green, and weeds in red. For the rice dataset, the background was black, weeds green, and rice red. In the pea dataset, the background was black, weeds red, and peas green. We transformed the segmentation results into RGB format for visualization. The results were outputted in three folders, categorized as background, crop, and weed. The experiment showed that the ATT-UNet algorithm had fewer false pixels and was more accurate in segmenting crop and weed images compared to other algorithms.
A series of detailed experiments were designed to comprehensively evaluate the performance of various models in agricultural image segmentation, with a focus on their ability to distinguish different crops such as rice, weeds, sugar beets, and peas. These experiments simulated various real farm environments to deeply understand how models segment under different conditions.
For clarity and ease of analysis of the experiment results, each segmentation result was stored in different folders according to the category. In the sugar beet process, particular attention was paid to the excellent segmentation effect shown by the ATT-UNet model. Compared to other models, ATT-UNet demonstrated fewer pixel errors and higher segmentation accuracy, especially in complex scenes with dense weeds and crops.
These experimental results prove that the ATT-UNet model not only excels in precise segmentation of crops and weeds but also possesses a robust capability to process agricultural images of various types and complexities. The application of this high-precision segmentation technology is expected to bring significant advantages to future agricultural robots and intelligent agricultural systems, realizing more accurate and efficient crop management and weed control, thus enhancing the overall efficiency and sustainability of agricultural production.

5. Conclusion

The ATT-UNet algorithm proposed in this paper is not just an addition of attention mechanisms to the existing UNet++ model but involves deep optimization and adjustment of the entire model structure. The introduction of attention mechanisms allowed the model to focus more on key information such as crop and weed differentiation during image processing, significantly improving the accuracy and efficiency of segmentation. This is particularly evident in processing complex backgrounds or crops and weeds with similar textures, effectively overcoming the limitations of traditional segmentation methods.
During the experimental process, the ATT-UNet model showed outstanding performance in several aspects. Firstly, the model demonstrated high generalization capability on various types of crop images, implying its effective applicability not only to the crops used during training but also to other types of crop images. Moreover, maintaining high efficiency and accuracy in processing large datasets was crucial. Despite the increased complexity of the model, effective network design and parameter optimization allowed it to be somewhat applicable even on devices with limited computational resources.
However, effectively deploying such complex models on low-power mobile devices remains a challenge. Future research will focus on optimizing the model structure while reducing unnecessary computational costs, maintaining the model's efficiency and accuracy. This could include more advanced network compression techniques, lightweight network designs, and even the use of neural network hardware acceleration technologies. The ultimate goal is to develop a versatile model that provides high-precision segmentation on servers while operating efficiently on mobile devices, offering more robust technical support for intelligent agriculture.
In conclusion, the development of the ATT-UNet model marks an important step in the advancement of modern agricultural technology, laying the foundation for the development of future agricultural robots and intelligent agricultural systems, not only improving the accuracy of crop and weed segmentation but also anticipating a more significant role for such advanced image processing technologies in the future of intelligent agriculture.

Funding

This results was supported by "Regional Innovation Strategy (RIS)" through the National Research Foundation of Korea(NRF) funded by the Ministry of Education(MOE)(2021RIS-003)

Institutional Review Board Statement

Not applicable.

Data Availability Statement

The original contributions presented in the study are included in the article, further inquiries can be directed to the corresponding author/s.

Acknowledgments

This results was supported by "Regional Innovation Strategy (RIS)" through the National Research Foundation of Korea (NRF) funded by the Ministry of Education(MOE)(2021RIS-003)

Conflicts of Interest

The authors declare no conflicts of interest.

References

  1. Lü Wei, Dong Li, Sun Yuhan, et al. A Brief Discussion on Weed Control Methods at Home and Abroad. Chinese Agricultural Science Bulletin 2018, 34, 34–39.
  2. Huang Rongxi. Development of a Corn Field Weeding System Based on Computer Vision. Agricultural Mechanization Research 2018, 40, 217–220.
  3. Wu Lanlan. Identification Research on Weeds in the Corn Seedling Stage in the Field Based on Digital Image Processing. Huazhong Agricultural University, 2010.
  4. Li, N.、Grift, TE、Yuan, T.、Zhang, C.、Momin, MA、Li, W. (2016). Image processing of crop/weed discrimination in fields with high weed stress.2016 ASABE International Conference, pp. 1.
  5. Perez AJ、Lopez F、Benlloch, JV. Perez AJ、Lopez F、Benlloch JV. Color and shape analysis techniques for weed detection in grain fields". Agricultural Computer and Electronics 2000, 25, 197–212. [Google Scholar] [CrossRef]
  6. Ross D. Ram, David C. Slaughter and D. Ken Giles. Cotton precision weed control system. ASAE Transactions 45, 231–238.
  7. Guijarro M, Pajares G, Riomoros I, et al. Automatic segmentation of relevant textures in agricultural images. Computers and Electronics in Agriculture 2011, 75, 75–83. [CrossRef]
  8. Cho S I, Lee D S, Jeong J Y. AE—automation and emerging technologies: Weed–plant discrimination by machine vision and artificial neural network. Biosystems engineering 2002, 83, 275–280.
  9. Ramos P J, Prieto F A, Montoya E C, et al. Automatic fruit count on coffee branches using computer vision. Computers and Electronics in Agriculture 2017, 137, 9–22. [CrossRef]
  10. Pantazi, Xanthoula Eirini, et al. Wheat yield prediction using machine learning and advanced sensing techniques. Computers and electronics in agriculture 2016, 121, 57–65. [CrossRef]
  11. Ferentinos, Konstantinos P. Deep learning models for plant disease detection and diagnosis. Computers and electronics in agriculture 2018, 145, 311–318. [CrossRef]
  12. Liu, Wenjie, et al. DFF-ResNet: An insect pest recognition model based on residual networks. Big Data Mining and Analytics 2020, 3, 300–310. [CrossRef]
  13. Rustia, Dan Jeric Arcega, et al. Automatic greenhouse insect pest detection and recognition based on a cascaded deep learning classification method. Journal of Applied Entomology 2021, 145, 206–222. [CrossRef]
  14. Pantazi, Xanthoula-Eirini, Dimitrios Moshou, and Cedric Bravo. Active learning system for weed species recognition based on hyperspectral sensing. Biosystems Engineering 2016, 146, 193–202. [CrossRef]
  15. Binch, Adam, and C. W. Fox. Controlled comparison of machine vision algorithms for Rumex and Urtica detection in grassland. Computers and Electronics in Agriculture 2017, 140, 123–138. [CrossRef]
  16. Zhang, Mengyun, Changying Li, and Fuzeng Yang. Classification of foreign matter embedded inside cotton lint using short wave infrared (SWIR) hyperspectral transmittance imaging. Computers and Electronics in Agriculture 2017, 139, 75–90. [CrossRef]
  17. Maione, Camila, et al. Classification of geographic origin of rice by data mining and inductively coupled plasma mass spectrometry. Computers and Electronics in Agriculture 2016, 121, 101–107. [CrossRef]
  18. Lin, C. A support vector machine embedded weed identification system. University of Illinois at Urbana-Champaign, 2010.
  19. Sun Jun, He Xiaofi, Tan Wenjun, Wu Xiaohong, Shen Jifeng, "Deer Tiger. Hollow convolution combined with global convolutional neural networks to identify crop seedlings and weeds. Proceedings of the Chinese Society of Agricultural Engineering 2018, 34, 159–165.
  20. Zhou, Z.、Rahman Siddiquee, MM、Tajbakhsh, N.、Liang, J. Unet++: A nested u-net architecture for medical image segmentation. Springer International Press, vol. 11042, pp. 3–11.
  21. Wang Hong, Chen Gongping. Field weed real-time segmentation based on PCAW-UNet. Journal of Xi'an University of Arts and Sciences (Natural Science Edition), 2021, 27–37.
  22. Shang Jianwei, Jiang Honghai, Yu Gang, "Deep Learning Based Weed Identification System. Software Guide 2020, 19, 127–130.
  23. Peng Mingxia, Xia Junfang, Peng Hui. Efficient Identification of Cotton Weeds in Complex FPN Context. Journal of Agricultural Engineering 2011, 35, 202–209.
  24. Chua L O, Roska T. The CNN paradigm. IEEE Transactions on Circuits and Systems I: Fundamental Theory and Applications 1993, 40, 147–156. [CrossRef]
  25. Ren A, Li Z, Ding C, et al. Sc-dcnn: Highly-scalable deep convolutional neural network using stochastic computing. ACM SIGPLAN Notices 2017, 52, 405–418. [CrossRef]
  26. Ma B, Li X, Xia Y, et al. Autonomous deep learning: A genetic DCNN designer for image classification. Neurocomputing 2020, 379, 152–161. [CrossRef]
  27. Woo S, Park J, Lee J Y, et al. Cbam: Convolutional Block Attention Module. Proceedings of the European Conference on Computer Vision (ECCV), Munich, Germany, pp. 3–19, 2018.
  28. Chen Ying and Gong Su Ming. Improvement of Human Behavior Recognition Network under Channel Attention Mechanism. Journal of Electronics and Information 2021, 43, 3538–3545.
  29. Ronneberger, O.、Fischer, P.、Brox, T. U-net: Convolutional network for biomedical image segmentation. Springer International Publishing 2015, 9351, 234–241.
  30. Guo Lie, Zhang Tuanshan, Sun Weizhen, & Guo Jielong. Image Semantic Description Algorithm of Fusion Spatial Attention Mechanism. Laser & Optoelectronics Progress, vol. 58, no. 12, pp. 1210030, 2021.
  31. Fan, Xinnan, et al. A Nested Unet with Attention Mechanism for Road Crack Image Segmentation. 2021 IEEE 6th International Conference on Signal and Image Processing (ICSIP), pp. 189–193, 2021.
  32. Chen J, Lu Y, Yu Q, et al. Transunet: Transformers make strong encoders for medical image segmentation. arXiv preprint 2021, arXiv:2102.04306.
  33. Rice/weedy field image dataset for crop/weedy classification. [CrossRef]
  34. Chebrolu, N. 、Lottes, P. 、Schaefer, A.、Winterhalter、W.、Burgard, W.、Stachniss, C. Agricultural Robot Dataset for Beet Field Plant Classification, Location and Mapping. International Journal of Robotics, 2017, 36, 1045–1052. [Google Scholar]
  35. Nachiketh RV, Krishnan A, Krishnan KV, Haritha ZA, Sasinas A (2021) Southern pea/weed field image dataset for semantic segmentation and crop/weed classification using an encoder-decoder network. SSRN Electron J. [CrossRef]
  36. Christopherson, Peter and Chris Jacobs. The importance of the loss function in option valuation. Journal of Financial Economics 2004, 72, 291–318. [CrossRef]
  37. Barron, Jonathan T. A general and adaptive robust loss function. Proceedings of the IEEE/CVF Conference on Computer Vision and Pattern Recognition, pp. 4331–4339, 2019.
  38. Dalianis, Hercules, and Hercules Dalianis. Evaluation metrics and evaluation. Clinical Text Mining: secondary use of electronic patient records, pp. 45–53, 2018.
  39. Wang, Zhaobin, E. Wang, and Ying Zhu. Image segmentation evaluation: a survey of methods. Artificial Intelligence Review 2020, 53, 5637–5674. [CrossRef]
  40. Kingma, Diederik P., and Jimmy Ba. Adam: A method for stochastic optimization. arXiv preprint, 2014; arXiv:1412.6980.
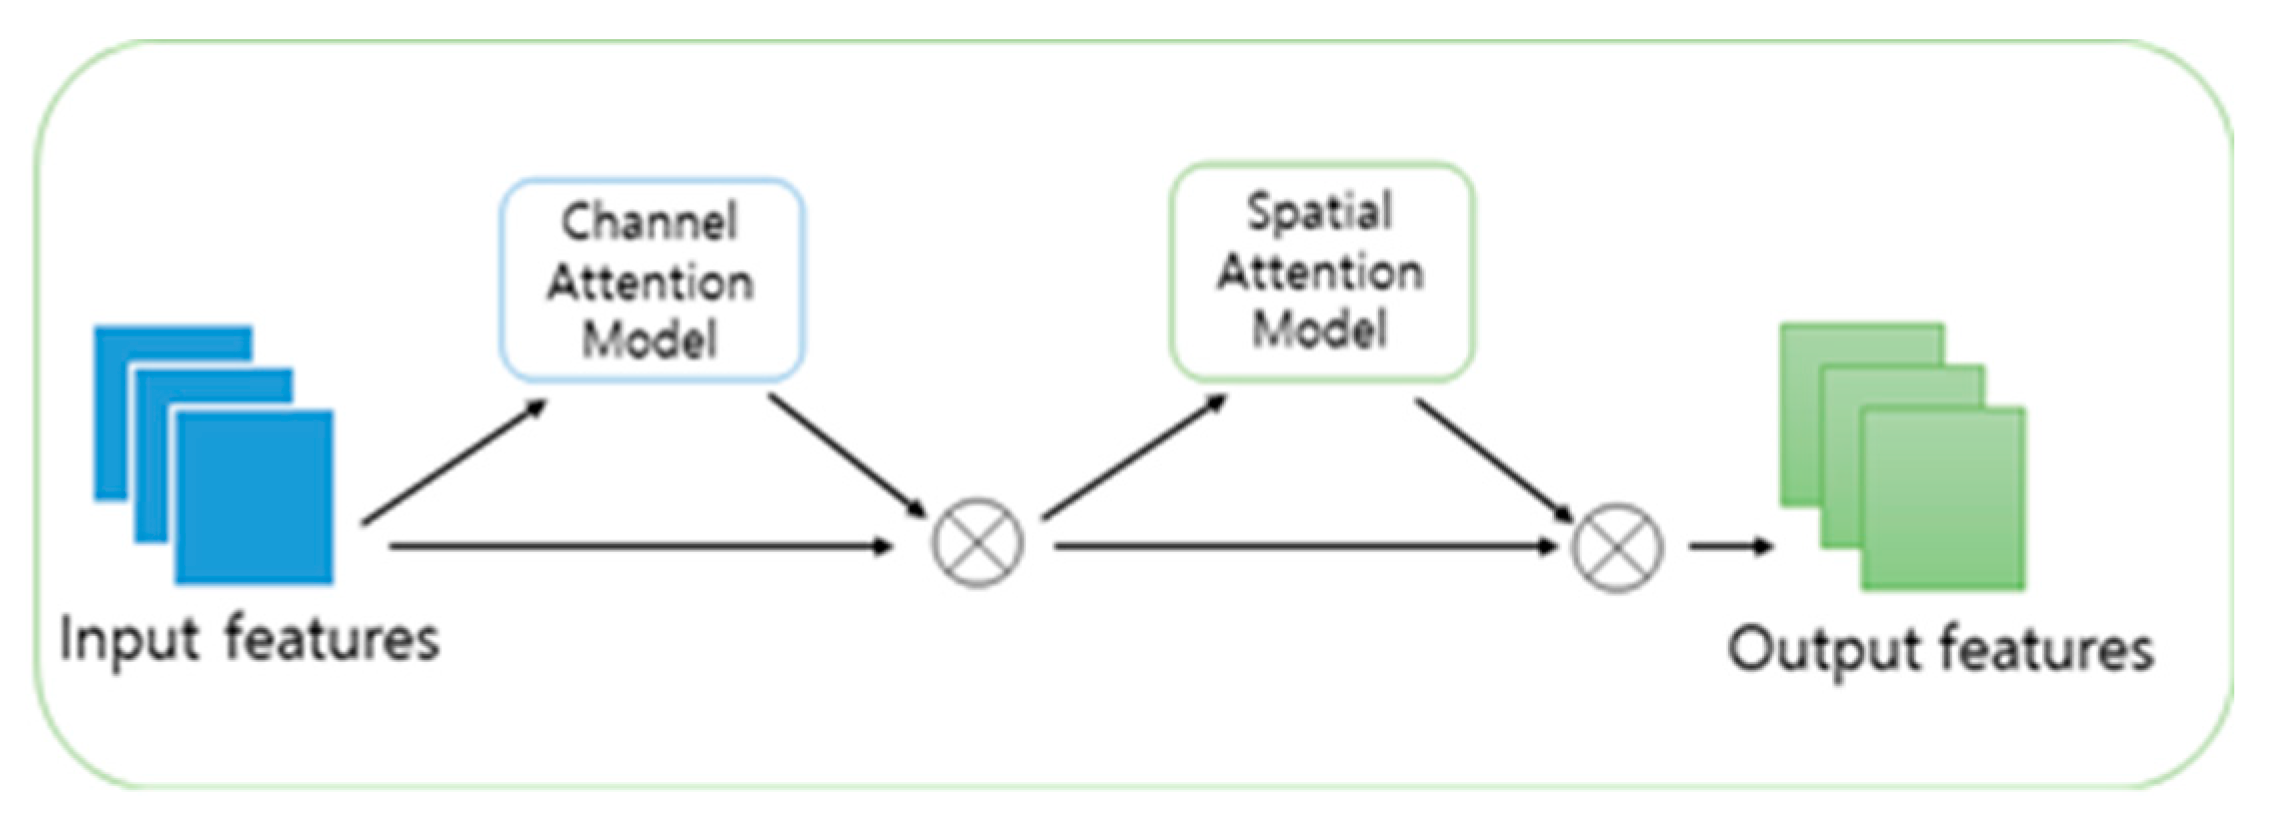
Figure 2. Structure of CBAM.
Preprints 101811 g002
Figure 3. Unet strucrure over view (a) Structure of UNet, (b) Structure of UNet++, (c) Structure of TransUNet.
Preprints 101811 g003
Figure 4. System overview (a) Structure of ATT-UNet L1, (b)Structure of ATT-UNet L2, (c)Structure of ATT-UNet L3, (d)Structure of ATT-UNet L4.
Preprints 101811 g004
Figure 5. BoniRob Agricultural Information Collection Robot.
Preprints 101811 g005
Figure 6. Data type (a) Sugar Beet, (b) Peas, (c) Rice Sample Collection and Marking.
Preprints 101811 g006
Figure 7. (a) Random 90-degree rotation (b) random flipping.
Preprints 101811 g007
Table 1. IoU Values for Rice, L1, L2, L3, L4.
Model IOU
ATT-UNet L1 74.27%
ATT-UNet L2 73.51%
ATT-UNet L3 74.28%
ATT-UNet L4 75.03%
Table 2. IoU Values for Sugar Beet, L1, L2, L3, L4.
Model IOU
ATT-UNet L1 89.76%
ATT-UNet L2 90.24%
ATT-UNet L3 89.06%
ATT-UNet L4 89.42%
Table 3. IoU Values for Pea, L1, L2, L3, L4.
Model IOU
ATT-UNet L1 77.96%
ATT-UNet L2 77.78%
ATT-UNet L3 77.02%
ATT-UNet L4 77.60%
Disclaimer/Publisher’s Note: The statements, opinions and data contained in all publications are solely those of the individual author(s) and contributor(s) and not of MDPI and/or the editor(s). MDPI and/or the editor(s) disclaim responsibility for any injury to people or property resulting from any ideas, methods, instructions or products referred to in the content.
Copyright: This open access article is published under a Creative Commons CC BY 4.0 license, which permit the free download, distribution, and reuse, provided that the author and preprint are cited in any reuse.
Prerpints.org logo

Preprints.org is a free preprint server supported by MDPI in Basel, Switzerland.

Subscribe

© 2024 MDPI (Basel, Switzerland) unless otherwise stated