Submitted:
20 March 2024
Posted:
21 March 2024
You are already at the latest version
Abstract
Keywords:
1. Introduction
- -
- Attachment: At first, G protein of virus attaches itself to the cell surface receptors. [11];
- -
- -
- -
- -
- -
- Translation: Viral mRNA strand is used for the Translation of 5 major proteins (N, P, M, G, and L);
- -
- Assembly: All these viral particles (genome and proteins) assembled into new virions [11];
- -
- Budding: Assembled virions bud off from the cell surface of host cells acquiring its envelope from the host cell membrane [13];
- -
- Release: The mature rabies virus normally releases from the cells through cell lysis and spread through the central nervous system and brain to infect healthy cells [13].
2. Materials and Methods
2.1. Protein Datasets
2.2. Exploration of the Intrinsic Disorder Predisposition
2.3. ELMs: Eukaryotic Linear Motifs
2.4. Functional Annotation Derived from Disorder
2.5. FuzDrop Analysis: Identifying LLPS Promoters
2.6. Protein-Protein Interaction Network
2.7. CH-CDF Analysis
2.8. 3D Structures of Proteins
3. Results and Discussion
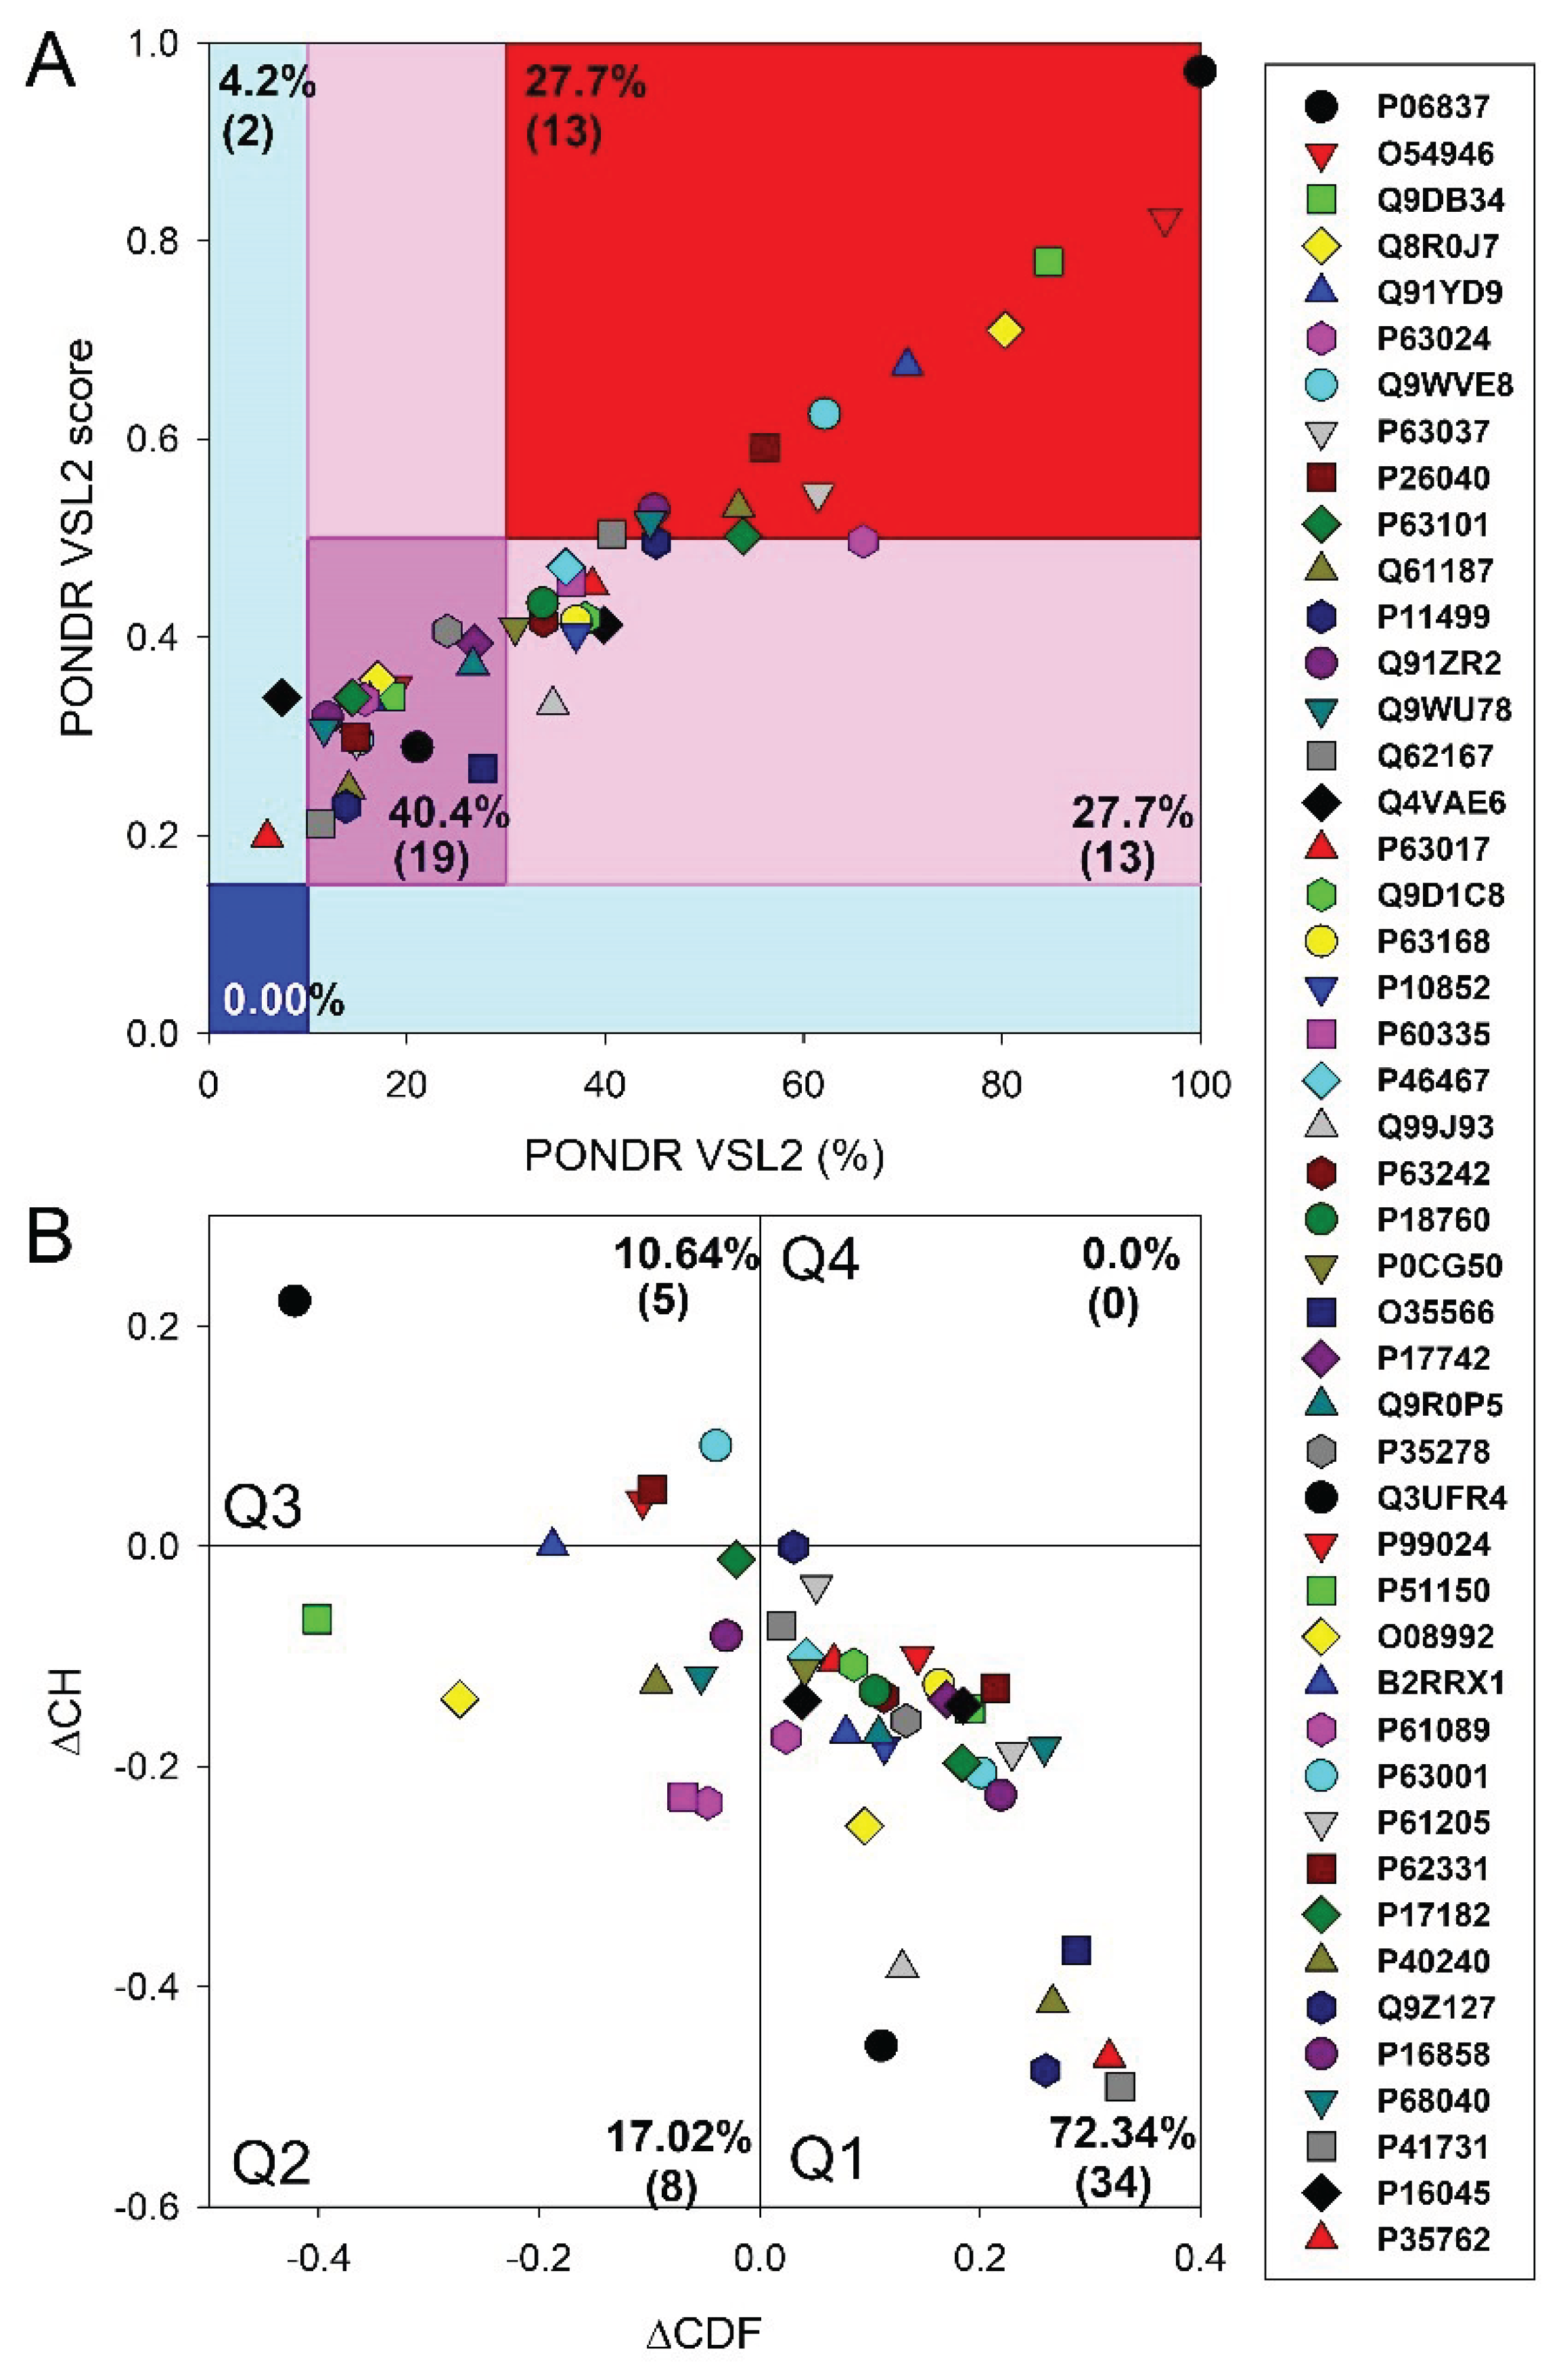
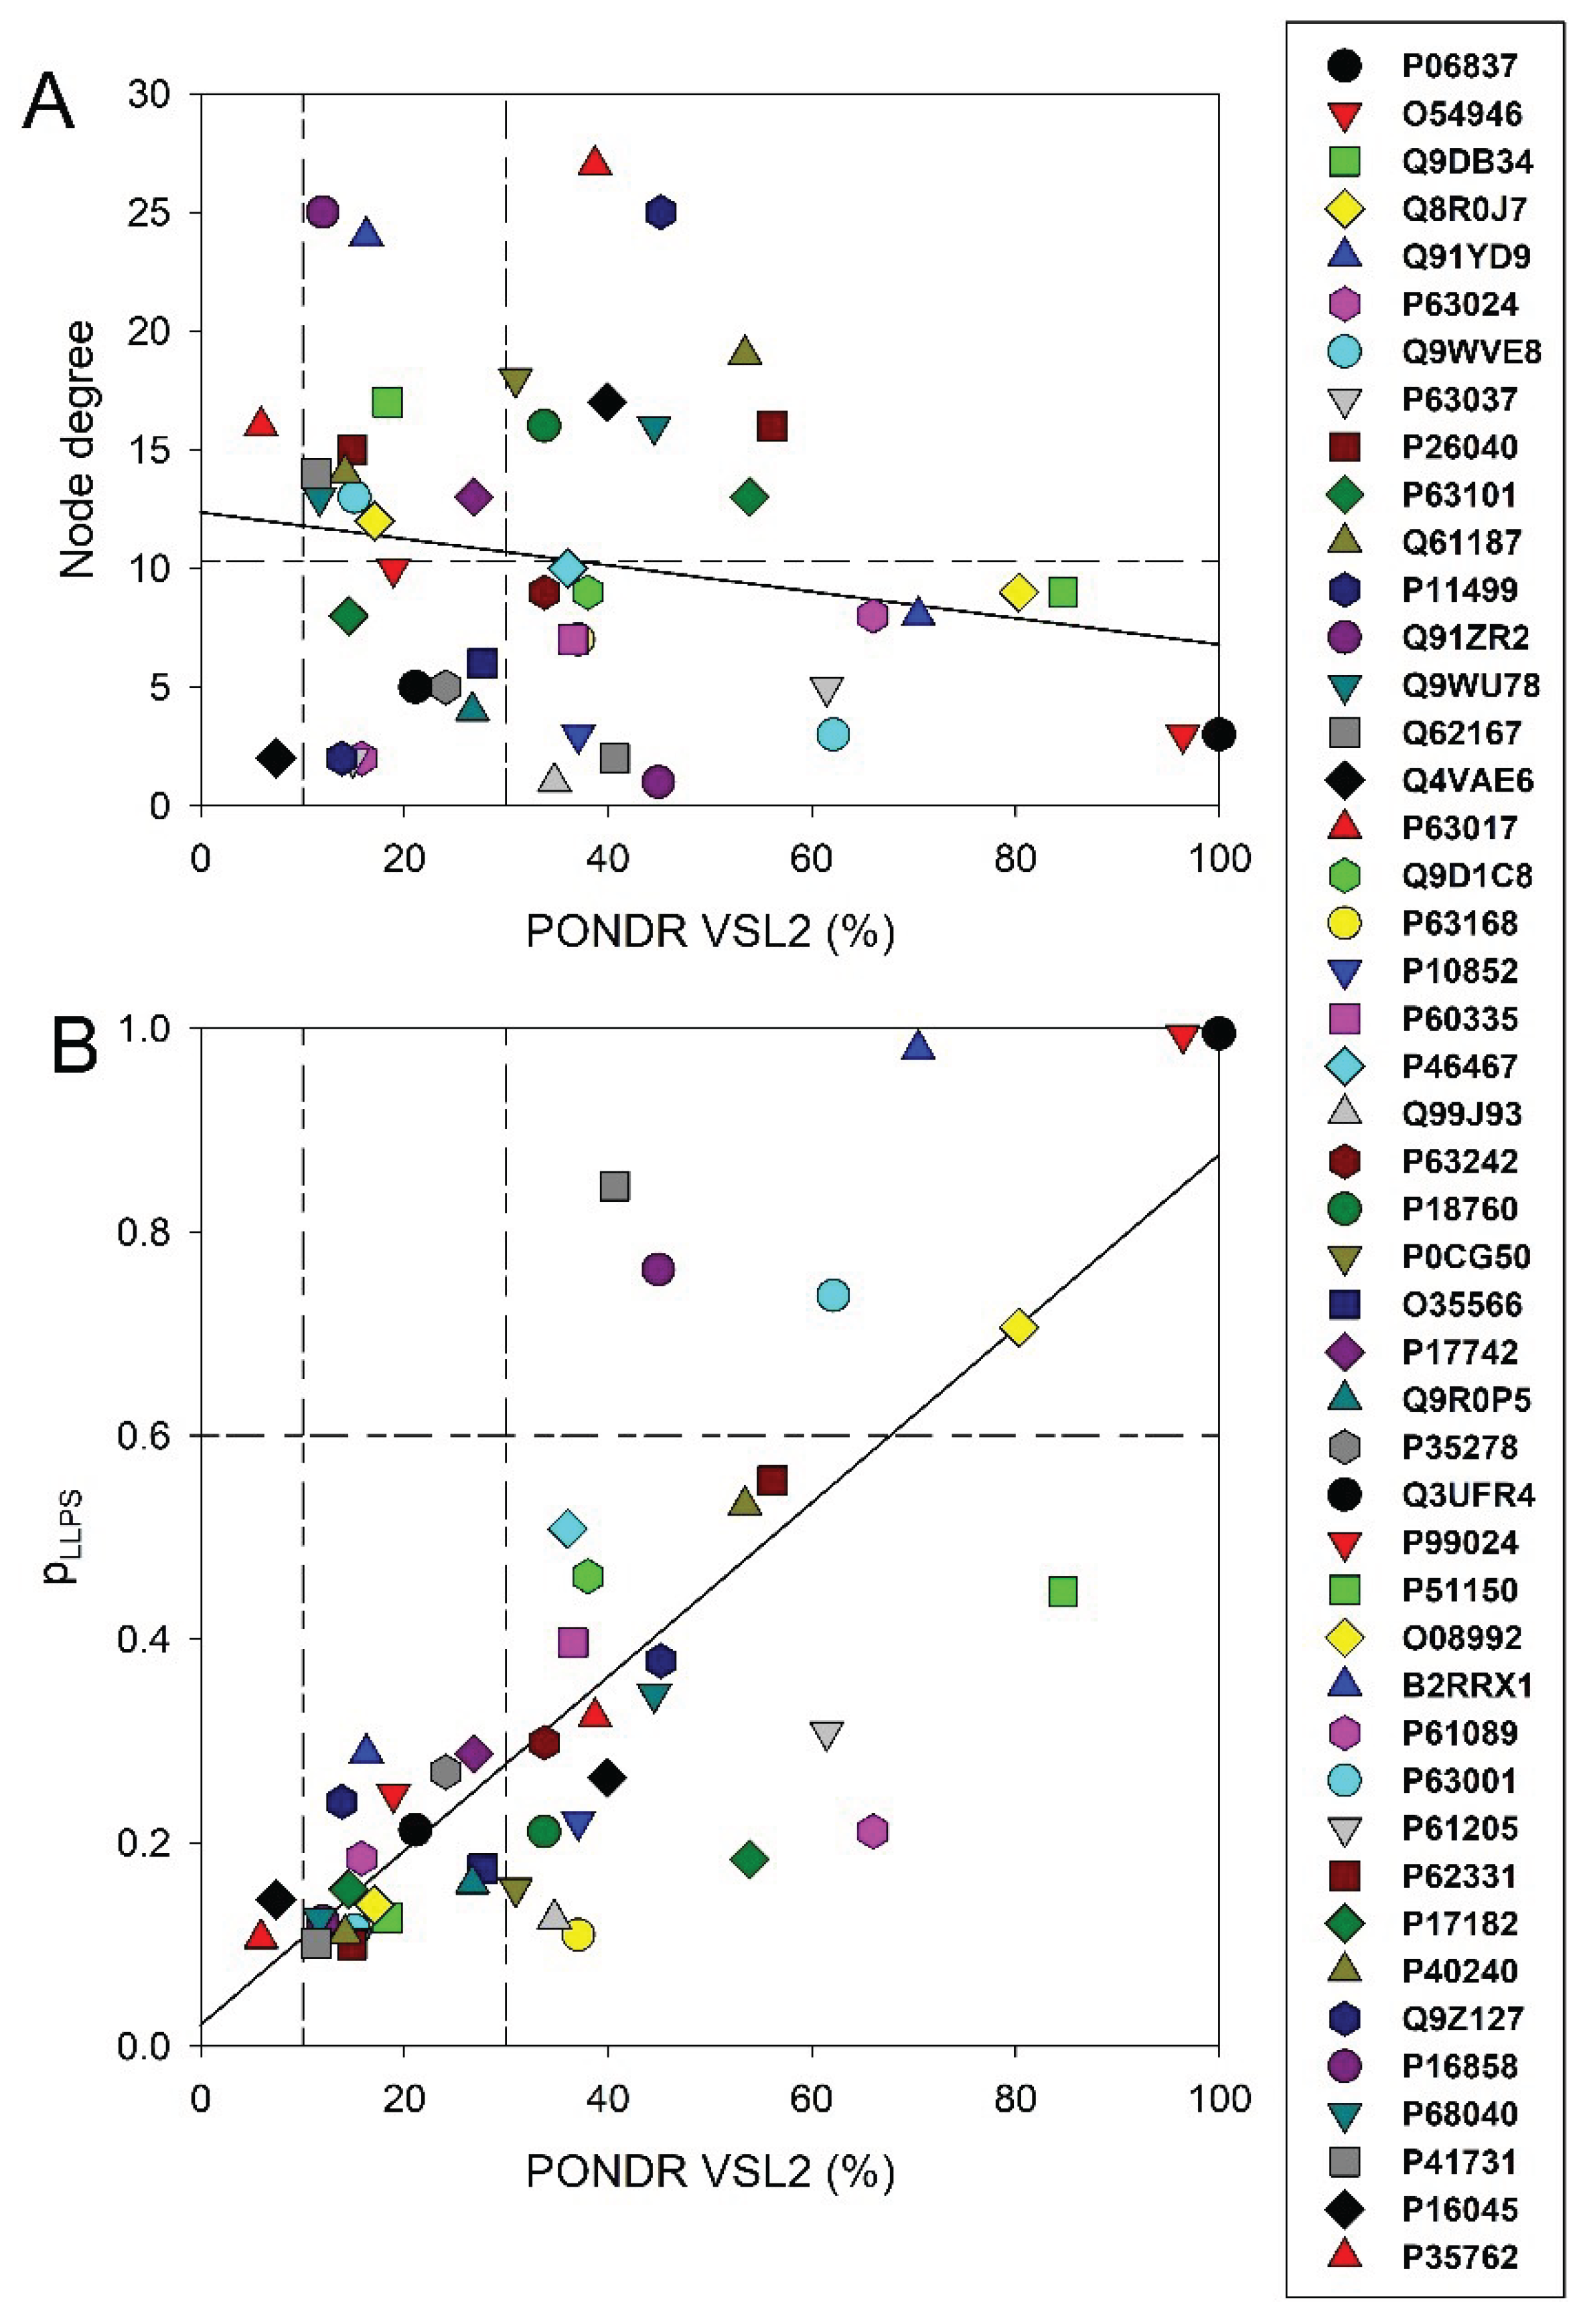
3.1. Global Disorder Analysis of Host Proteins Entrapped in RABV Particles
3.2. Functional Intrinsic Disorder in the Most Disordered Mouse Proteins Found in the Rabies Virus
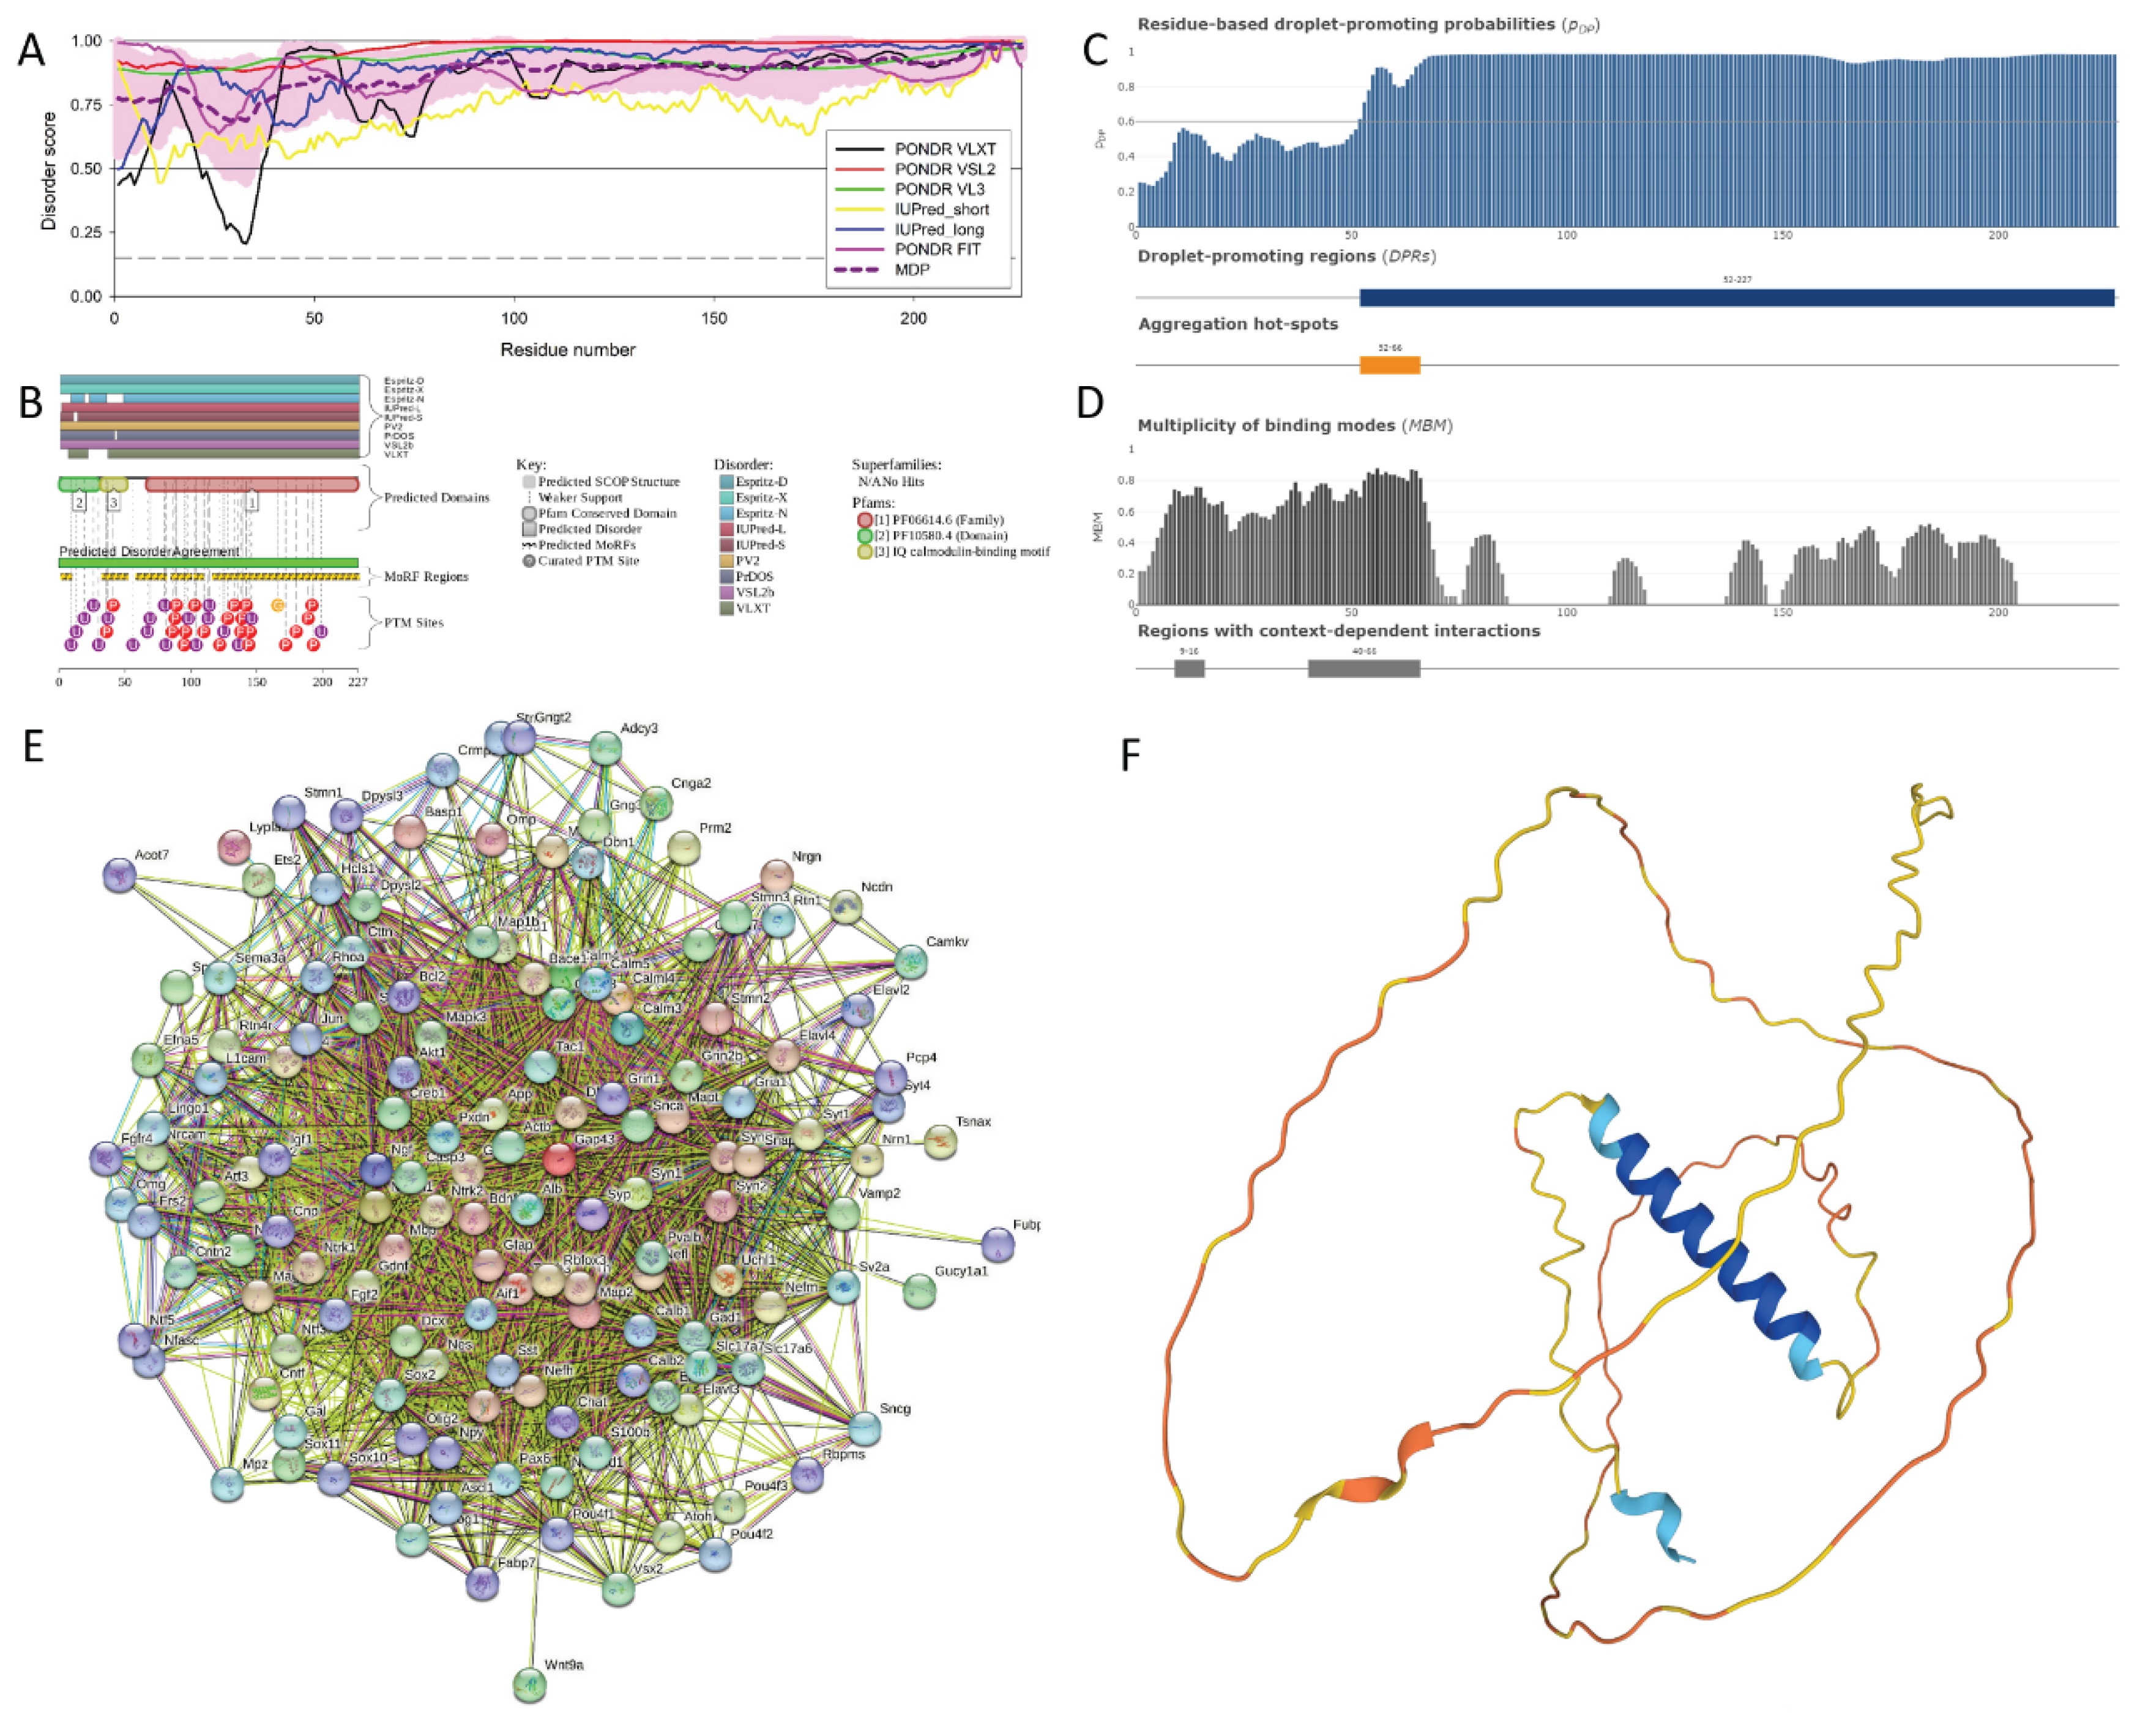
3.2.1. Neuromodulin (UniProt ID: P06837)
3.2.2. Charged Multivesicular Body Protein 4b (Chmp4b, UniProt ID: Q9D8B3)
3.2.3. DnaJ Homolog Subfamily B Member 6 (DNAJB6; UniProt ID: O54946)
3.2.4. Vacuolar Protein Sorting-Associated Protein 37B (Vps37B, UniProt ID: Q8R0J7)
3.2.5. Actin Nucleation-Promoting Factor Wasl (UniProt ID: Q91YD9)
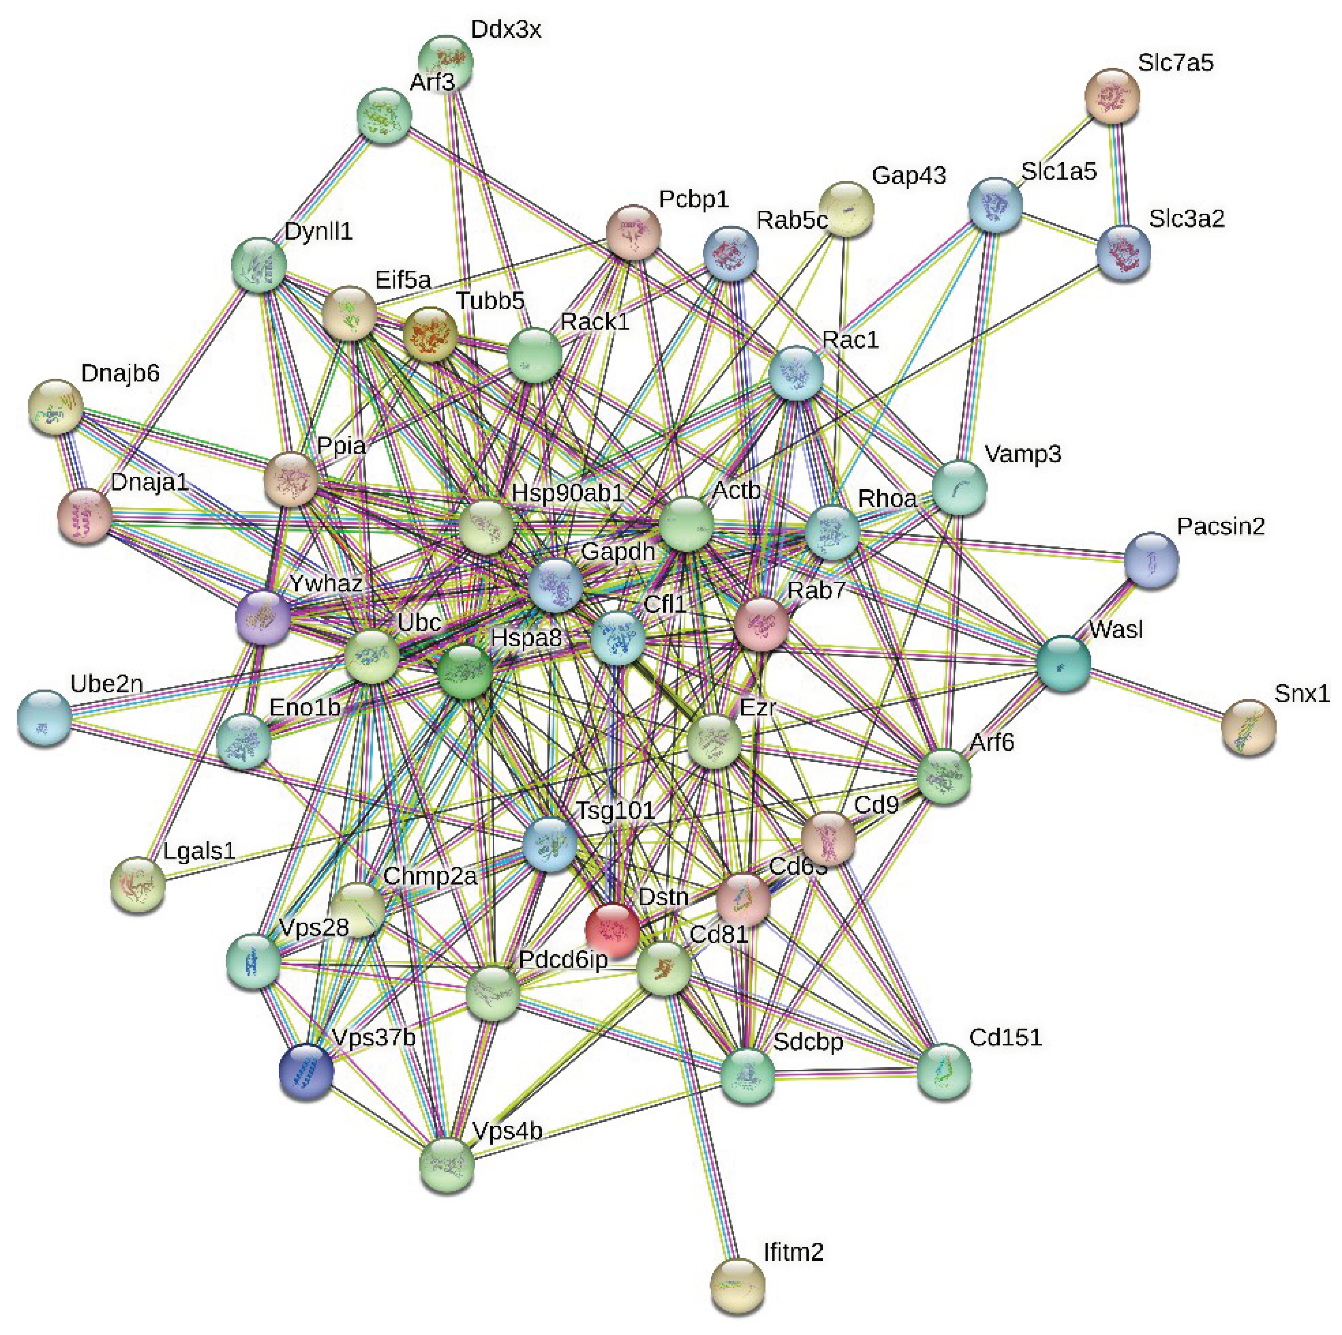
3.3. Global PPI Networks Analysis of the Most Disordered Mouse Proteins Found in the Rabies Virus
3.4. The Roles of Intrinsically Disordered Host Proteins in Viral Immune Evasion and Pathogenesis Enhancement
4. Conclusions
Supplementary Materials
Author Contributions
Funding
Institutional Review Board Statement
Informed Consent Statement
Data Availability Statement
Conflicts of Interest
References
- Hemachudha, T.; Laothamatas, J.; Rupprecht, C.E. Human rabies: a disease of complex neuropathogenetic mechanisms and diagnostic challenges. Lancet Neurol 2002, 1, 101–109. [Google Scholar] [CrossRef] [PubMed]
- Greenlee, J.E. Rabies. Available online: https://www.merckmanuals.com/professional/neurologic-disorders/brain-infections/rabies (accessed on March 18).
- Pieracci, E.G.; Pearson, C.M.; Wallace, R.M.; Blanton, J.D.; Whitehouse, E.R.; Ma, X.; Stauffer, K.; Chipman, R.B.; Olson, V. Vital Signs: Trends in Human Rabies Deaths and Exposures - United States, 1938-2018. MMWR Morb Mortal Wkly Rep 2019, 68, 524–528. [Google Scholar] [CrossRef] [PubMed]
- Hampson, K.; Coudeville, L.; Lembo, T.; Sambo, M.; Kieffer, A.; Attlan, M.; Barrat, J.; Blanton, J.D.; Briggs, D.J.; Cleaveland, S.; et al. Estimating the global burden of endemic canine rabies. PLoS Negl Trop Dis 2015, 9, e0003709. [Google Scholar] [CrossRef]
- Brunker, K.; Mollentze, N. Rabies Virus. Trends Microbiol 2018, 26, 886–887. [Google Scholar] [CrossRef]
- Rupprecht, C.E. Rhabdoviruses: Rabies Virus. In Medical Microbiology, 4th ed.; Baron, S., Ed.; Galveston (TX), 1996.
- Horwitz, J.A.; Jenni, S.; Harrison, S.C.; Whelan, S.P.J. Structure of a rabies virus polymerase complex from electron cryo-microscopy. Proc Natl Acad Sci U S A 2020, 117, 2099–2107. [Google Scholar] [CrossRef] [PubMed]
- Riedel, C.; Vasishtan, D.; Prazak, V.; Ghanem, A.; Conzelmann, K.K.; Rumenapf, T. Cryo EM structure of the rabies virus ribonucleoprotein complex. Sci Rep 2019, 9, 9639. [Google Scholar] [CrossRef]
- Warrell, M.J.; Warrell, D.A. Rabies: the clinical features, management and prevention of the classic zoonosis. Clinical Medicine 2015, 15, 78. [Google Scholar] [CrossRef]
- Singh, R.; Singh, K.P.; Cherian, S.; Saminathan, M.; Kapoor, S.; Manjunatha Reddy, G.; Panda, S.; Dhama, K. Rabies–epidemiology, pathogenesis, public health concerns and advances in diagnosis and control: a comprehensive review. Veterinary Quarterly 2017, 37, 212–251. [Google Scholar] [CrossRef]
- Davis, B.M.; Rall, G.F.; Schnell, M.J. Everything You Always Wanted to Know About Rabies Virus (But Were Afraid to Ask). Annu Rev Virol 2015, 2, 451–471. [Google Scholar] [CrossRef]
- Potratz, M.; Zaeck, L.M.; Weigel, C.; Klein, A.; Freuling, C.M.; Muller, T.; Finke, S. Neuroglia infection by rabies virus after anterograde virus spread in peripheral neurons. Acta Neuropathol Commun 2020, 8, 199. [Google Scholar] [CrossRef]
- Wunner, W.H.; Conzelmann, K.K. Rabies virus. In Rabies, 3rd Edition ed.; AC., J., Ed.; Academic Press/Elsevier: Oxford, UK, 2013; pp. 17-60.
- Burnie, J.; Guzzo, C. The Incorporation of Host Proteins into the External HIV-1 Envelope. Viruses 2019, 11. [Google Scholar] [CrossRef] [PubMed]
- Uversky, V.N. A decade and a half of protein intrinsic disorder: biology still waits for physics. Protein Sci 2013, 22, 693–724. [Google Scholar] [CrossRef] [PubMed]
- Zhang, Y.; Wang, Y.; Feng, Y.; Tu, Z.; Lou, Z.; Tu, C. Proteomic Profiling of Purified Rabies Virus Particles. Virol Sin 2020, 35, 143–155. [Google Scholar] [CrossRef] [PubMed]
- Lahaye, X.; Vidy, A.; Fouquet, B.; Blondel, D. Hsp70 protein positively regulates rabies virus infection. J Virol 2012, 86, 4743–4751. [Google Scholar] [CrossRef]
- Chen, B.J.; Lamb, R.A. Mechanisms for enveloped virus budding: can some viruses do without an ESCRT? Virology 2008, 372, 221–232. [Google Scholar] [CrossRef] [PubMed]
- Votteler, J.; Sundquist, W.I. Virus budding and the ESCRT pathway. Cell Host Microbe 2013, 14, 232–241. [Google Scholar] [CrossRef] [PubMed]
- Vera-Velasco, N.M.; Garcia-Murria, M.J.; Sanchez Del Pino, M.M.; Mingarro, I.; Martinez-Gil, L. Proteomic composition of Nipah virus-like particles. J Proteomics 2018, 172, 190–200. [Google Scholar] [CrossRef] [PubMed]
- Shaw, M.L.; Stone, K.L.; Colangelo, C.M.; Gulcicek, E.E.; Palese, P. Cellular proteins in influenza virus particles. PLoS Pathog 2008, 4, e1000085. [Google Scholar] [CrossRef]
- Uversky, V.N. Functional unfoldomics: Roles of intrinsic disorder in protein (multi)functionality. Adv Protein Chem Struct Biol 2024, 138, 179–210. [Google Scholar] [CrossRef]
- Bondos, S.E.; Dunker, A.K.; Uversky, V.N. Intrinsically disordered proteins play diverse roles in cell signaling. Cell Commun Signal 2022, 20, 20. [Google Scholar] [CrossRef]
- Kulkarni, P.; Bhattacharya, S.; Achuthan, S.; Behal, A.; Jolly, M.K.; Kotnala, S.; Mohanty, A.; Rangarajan, G.; Salgia, R.; Uversky, V. Intrinsically Disordered Proteins: Critical Components of the Wetware. Chem Rev 2022, 122, 6614–6633. [Google Scholar] [CrossRef]
- Uversky, V.N. Recent Developments in the Field of Intrinsically Disordered Proteins: Intrinsic Disorder-Based Emergence in Cellular Biology in Light of the Physiological and Pathological Liquid-Liquid Phase Transitions. Annu Rev Biophys 2021, 50, 135–156. [Google Scholar] [CrossRef]
- Peng, Z.; Yan, J.; Fan, X.; Mizianty, M.J.; Xue, B.; Wang, K.; Hu, G.; Uversky, V.N.; Kurgan, L. Exceptionally abundant exceptions: comprehensive characterization of intrinsic disorder in all domains of life. Cell Mol Life Sci 2015, 72, 137–151. [Google Scholar] [CrossRef]
- Xue, B.; Dunker, A.K.; Uversky, V.N. Orderly order in protein intrinsic disorder distribution: disorder in 3500 proteomes from viruses and the three domains of life. J Biomol Struct Dyn 2012, 30, 137–149. [Google Scholar] [CrossRef]
- Dyson, H.J. Making Sense of Intrinsically Disordered Proteins. Biophys J 2016, 110, 1013–1016. [Google Scholar] [CrossRef]
- Wright, P.E.; Dyson, H.J. Intrinsically disordered proteins in cellular signalling and regulation. Nat Rev Mol Cell Biol 2015, 16, 18–29. [Google Scholar] [CrossRef] [PubMed]
- Sun, X.; Xue, B.; Jones, W.T.; Rikkerink, E.; Dunker, A.K.; Uversky, V.N. A functionally required unfoldome from the plant kingdom: intrinsically disordered N-terminal domains of GRAS proteins are involved in molecular recognition during plant development. Plant Mol Biol 2011, 77, 205–223. [Google Scholar] [CrossRef] [PubMed]
- Uversky, V.N.; Dave, V.; Iakoucheva, L.M.; Malaney, P.; Metallo, S.J.; Pathak, R.R.; Joerger, A.C. Pathological unfoldomics of uncontrolled chaos: intrinsically disordered proteins and human diseases. Chem Rev 2014, 114, 6844–6879. [Google Scholar] [CrossRef]
- Uversky, V.N.; Dunker, A.K. Understanding protein non-folding. Biochim Biophys Acta 2010, 1804, 1231–1264. [Google Scholar] [CrossRef] [PubMed]
- Turoverov, K.K.; Kuznetsova, I.M.; Uversky, V.N. The protein kingdom extended: ordered and intrinsically disordered proteins, their folding, supramolecular complex formation, and aggregation. Prog Biophys Mol Biol 2010, 102, 73–84. [Google Scholar] [CrossRef]
- Dunker, A.K.; Silman, I.; Uversky, V.N.; Sussman, J.L. Function and structure of inherently disordered proteins. Curr Opin Struct Biol 2008, 18, 756–764. [Google Scholar] [CrossRef] [PubMed]
- Uversky, V.N.; Oldfield, C.J.; Dunker, A.K. Intrinsically disordered proteins in human diseases: introducing the D2 concept. Annu Rev Biophys 2008, 37, 215–246. [Google Scholar] [CrossRef] [PubMed]
- Dayhoff, G.W., 2nd; Uversky, V.N. Rapid prediction and analysis of protein intrinsic disorder. Protein Sci 2022, 31, e4496. [Google Scholar] [CrossRef] [PubMed]
- Puntervoll, P.; Linding, R.; Gemund, C.; Chabanis-Davidson, S.; Mattingsdal, M.; Cameron, S.; Martin, D.M.; Ausiello, G.; Brannetti, B.; Costantini, A.; et al. ELM server: A new resource for investigating short functional sites in modular eukaryotic proteins. Nucleic Acids Res 2003, 31, 3625–3630. [Google Scholar] [CrossRef]
- Gould, C.M.; Diella, F.; Via, A.; Puntervoll, P.; Gemund, C.; Chabanis-Davidson, S.; Michael, S.; Sayadi, A.; Bryne, J.C.; Chica, C.; et al. ELM: the status of the 2010 eukaryotic linear motif resource. Nucleic Acids Res 2010, 38, D167–180. [Google Scholar] [CrossRef]
- Davey, N.E.; Van Roey, K.; Weatheritt, R.J.; Toedt, G.; Uyar, B.; Altenberg, B.; Budd, A.; Diella, F.; Dinkel, H.; Gibson, T.J. Attributes of short linear motifs. Mol Biosyst 2012, 8, 268–281. [Google Scholar] [CrossRef] [PubMed]
- Dinkel, H.; Michael, S.; Weatheritt, R.J.; Davey, N.E.; Van Roey, K.; Altenberg, B.; Toedt, G.; Uyar, B.; Seiler, M.; Budd, A.; et al. ELM--the database of eukaryotic linear motifs. Nucleic Acids Res 2012, 40, D242–251. [Google Scholar] [CrossRef]
- Gouw, M.; Samano-Sanchez, H.; Van Roey, K.; Diella, F.; Gibson, T.J.; Dinkel, H. Exploring Short Linear Motifs Using the ELM Database and Tools. Curr Protoc Bioinformatics 2017, 58, 8–22. [Google Scholar] [CrossRef]
- Kumar, M.; Gouw, M.; Michael, S.; Samano-Sanchez, H.; Pancsa, R.; Glavina, J.; Diakogianni, A.; Valverde, J.A.; Bukirova, D.; Calyseva, J.; et al. ELM-the eukaryotic linear motif resource in 2020. Nucleic Acids Res 2020, 48, D296–D306. [Google Scholar] [CrossRef]
- Kumar, M.; Michael, S.; Alvarado-Valverde, J.; Zeke, A.; Lazar, T.; Glavina, J.; Nagy-Kanta, E.; Donagh, J.M.; Kalman, Z.E.; Pascarelli, S.; et al. ELM-the Eukaryotic Linear Motif resource-2024 update. Nucleic Acids Res 2024, 52, D442–D455. [Google Scholar] [CrossRef]
- Van Roey, K.; Uyar, B.; Weatheritt, R.J.; Dinkel, H.; Seiler, M.; Budd, A.; Gibson, T.J.; Davey, N.E. Short linear motifs: ubiquitous and functionally diverse protein interaction modules directing cell regulation. Chem Rev 2014, 114, 6733–6778. [Google Scholar] [CrossRef] [PubMed]
- Oates, M.E.; Romero, P.; Ishida, T.; Ghalwash, M.; Mizianty, M.J.; Xue, B.; Dosztanyi, Z.; Uversky, V.N.; Obradovic, Z.; Kurgan, L.; et al. D(2)P(2): database of disordered protein predictions. Nucleic Acids Res 2013, 41, D508–516. [Google Scholar] [CrossRef]
- Hardenberg, M.; Horvath, A.; Ambrus, V.; Fuxreiter, M.; Vendruscolo, M. Widespread occurrence of the droplet state of proteins in the human proteome. Proc Natl Acad Sci U S A 2020, 117, 33254–33262. [Google Scholar] [CrossRef]
- Hatos, A.; Tosatto, S.C.E.; Vendruscolo, M.; Fuxreiter, M. FuzDrop on AlphaFold: visualizing the sequence-dependent propensity of liquid-liquid phase separation and aggregation of proteins. Nucleic Acids Res 2022, 50, W337–W344. [Google Scholar] [CrossRef]
- Antifeeva, I.A.; Fonin, A.V.; Fefilova, A.S.; Stepanenko, O.V.; Povarova, O.I.; Silonov, S.A.; Kuznetsova, I.M.; Uversky, V.N.; Turoverov, K.K. Liquid-liquid phase separation as an organizing principle of intracellular space: overview of the evolution of the cell compartmentalization concept. Cell Mol Life Sci 2022, 79, 251. [Google Scholar] [CrossRef]
- Nesterov, S.V.; Ilyinsky, N.S.; Uversky, V.N. Liquid-liquid phase separation as a common organizing principle of intracellular space and biomembranes providing dynamic adaptive responses. Biochim Biophys Acta Mol Cell Res 2021, 1868, 119102. [Google Scholar] [CrossRef]
- Gomes, E.; Shorter, J. The molecular language of membraneless organelles. J Biol Chem 2019, 294, 7115–7127. [Google Scholar] [CrossRef]
- Szklarczyk, D.; Gable, A.L.; Nastou, K.C.; Lyon, D.; Kirsch, R.; Pyysalo, S.; Doncheva, N.T.; Legeay, M.; Fang, T.; Bork, P.; et al. The STRING database in 2021: customizable protein-protein networks, and functional characterization of user-uploaded gene/measurement sets. Nucleic Acids Res 2021, 49, D605–D612. [Google Scholar] [CrossRef]
- Szklarczyk, D.; Gable, A.L.; Lyon, D.; Junge, A.; Wyder, S.; Huerta-Cepas, J.; Simonovic, M.; Doncheva, N.T.; Morris, J.H.; Bork, P.; et al. STRING v11: protein-protein association networks with increased coverage, supporting functional discovery in genome-wide experimental datasets. Nucleic Acids Res 2019, 47, D607–D613. [Google Scholar] [CrossRef] [PubMed]
- Szklarczyk, D.; Franceschini, A.; Kuhn, M.; Simonovic, M.; Roth, A.; Minguez, P.; Doerks, T.; Stark, M.; Muller, J.; Bork, P.; et al. The STRING database in 2011: functional interaction networks of proteins, globally integrated and scored. Nucleic Acids Res 2011, 39, D561–568. [Google Scholar] [CrossRef] [PubMed]
- Oldfield, C.J.; Cheng, Y.; Cortese, M.S.; Brown, C.J.; Uversky, V.N.; Dunker, A.K. Comparing and combining predictors of mostly disordered proteins. Biochemistry 2005, 44, 1989–2000. [Google Scholar] [CrossRef]
- Uversky, V.N.; Gillespie, J.R.; Fink, A.L. Why are "natively unfolded" proteins unstructured under physiologic conditions? Proteins 2000, 41, 415–427. [Google Scholar] [CrossRef] [PubMed]
- Mohan, A.; Sullivan, W.J., Jr.; Radivojac, P.; Dunker, A.K.; Uversky, V.N. Intrinsic disorder in pathogenic and non-pathogenic microbes: discovering and analyzing the unfoldomes of early-branching eukaryotes. Mol Biosyst 2008, 4, 328–340. [Google Scholar] [CrossRef] [PubMed]
- Jumper, J.; Evans, R.; Pritzel, A.; Green, T.; Figurnov, M.; Ronneberger, O.; Tunyasuvunakool, K.; Bates, R.; Zidek, A.; Potapenko, A.; et al. Highly accurate protein structure prediction with AlphaFold. Nature 2021, 596, 583–589. [Google Scholar] [CrossRef] [PubMed]
- Djulbegovic, M.B.; Taylor, D.J.; Antonietti, M.; Cordova, M.; Dayhoff, G.; Uversky, V.; Galor, A.; Karp, C.L. Intrinsic disorder and the human tear film proteome. Investigative Ophthalmology & Visual Science 2023, 64, 187–187. [Google Scholar]
- Taylor Gonzalez, D.J.; Djulbegovic, M.; Antonietti, M.; Cordova, M.; Dayhoff, G.W., 2nd; Mattes, R.; Galor, A.; Uversky, V.N.; Karp, C.L. Intrinsic Disorder in the Human Tear Proteome. Invest Ophthalmol Vis Sci 2023, 64, 14. [Google Scholar] [CrossRef] [PubMed]
- Djulbegovic, M.; Uversky, V.N. The aqueous humor proteome is intrinsically disordered. Biochemistry and Biophysics Reports 2022, 29. [Google Scholar] [CrossRef] [PubMed]
- Rajagopalan, K.; Mooney, S.M.; Parekh, N.; Getzenberg, R.H.; Kulkarni, P. A majority of the cancer/testis antigens are intrinsically disordered proteins. J Cell Biochem 2011, 112, 3256–3267. [Google Scholar] [CrossRef]
- Necci, M.; Piovesan, D.; Tosatto, S.C. Critical assessment of protein intrinsic disorder prediction. Nature methods 2021, 18, 472–481. [Google Scholar] [CrossRef]
- Huang, F.; Oldfield, C.; Meng, J.; Hsu, W.L.; Xue, B.; Uversky, V.N.; Romero, P.; Dunker, A.K. Subclassifying disordered proteins by the CH-CDF plot method. Pac Symp Biocomput 2012, 128–139. [Google Scholar]
- Xue, B.; Oldfield, C.J.; Van, Y.Y.; Dunker, A.K.; Uversky, V.N. Protein intrinsic disorder and induced pluripotent stem cells. Mol Biosyst 2012, 8, 134–150. [Google Scholar] [CrossRef]
- Dunker, A.K.; Lawson, J.D.; Brown, C.J.; Williams, R.M.; Romero, P.; Oh, J.S.; Oldfield, C.J.; Campen, A.M.; Ratliff, C.M.; Hipps, K.W.; et al. Intrinsically disordered protein. J Mol Graph Model 2001, 19, 26–59. [Google Scholar] [CrossRef] [PubMed]
- Oldfield, C.J.; Dunker, A.K. Intrinsically disordered proteins and intrinsically disordered protein regions. Annu Rev Biochem 2014, 83, 553–584. [Google Scholar] [CrossRef]
- Uversky, V.N. Unusual biophysics of intrinsically disordered proteins. Biochim Biophys Acta 2013, 1834, 932–951. [Google Scholar] [CrossRef]
- Uversky, V.N. Multitude of binding modes attainable by intrinsically disordered proteins: a portrait gallery of disorder-based complexes. Chem. Soc. Rev. 2011, 40, 1623–1634. [Google Scholar] [CrossRef]
- Uversky, V.N. Intrinsic disorder-based protein interactions and their modulators. Curr Pharm Des 2013, 19, 4191–4213. [Google Scholar] [CrossRef] [PubMed]
- Uversky, V.N. The multifaceted roles of intrinsic disorder in protein complexes. FEBS Lett 2015. [Google Scholar] [CrossRef] [PubMed]
- Mammen, M.; Choi, S.K.; Whitesides, G.M. Polyvalent interactions in biological systems: Implications for design and use of multivalent ligands and inhibitors. Angewandte Chemie-International Edition 1998, 37, 2755–2794. [Google Scholar] [CrossRef]
- Schulz, G.E. Nucleotide Binding Proteins. In Molecular Mechanism of Biological Recognition, Balaban, M., Ed.; Elsevier/North-Holland Biomedical Press: New York, 1979; pp. 79–94. [Google Scholar]
- Dunker, A.K.; Brown, C.J.; Lawson, J.D.; Iakoucheva, L.M.; Obradovic, Z. Intrinsic disorder and protein function. Biochemistry 2002, 41, 6573–6582. [Google Scholar] [CrossRef]
- Dunker, A.K.; Brown, C.J.; Obradovic, Z. Identification and functions of usefully disordered proteins. Adv Protein Chem 2002, 62, 25–49. [Google Scholar]
- Wright, P.E.; Dyson, H.J. Linking folding and binding. Curr Opin Struct Biol 2009, 19, 31–38. [Google Scholar] [CrossRef]
- Meador, W.E.; Means, A.R.; Quiocho, F.A. Modulation of calmodulin plasticity in molecular recognition on the basis of x-ray structures. Science 1993, 262, 1718–1721. [Google Scholar] [CrossRef]
- Kriwacki, R.W.; Hengst, L.; Tennant, L.; Reed, S.I.; Wright, P.E. Structural studies of p21Waf1/Cip1/Sdi1 in the free and Cdk2-bound state: conformational disorder mediates binding diversity. Proc Natl Acad Sci U S A 1996, 93, 11504–11509. [Google Scholar] [CrossRef]
- Dunker, A.K.; Garner, E.; Guilliot, S.; Romero, P.; Albrecht, K.; Hart, J.; Obradovic, Z.; Kissinger, C.; Villafranca, J.E. Protein disorder and the evolution of molecular recognition: theory, predictions and observations. Pac Symp Biocomput 1998, 473–484. [Google Scholar]
- Uversky, V.N. Protein folding revisited. A polypeptide chain at the folding-misfolding-nonfolding cross-roads: which way to go? Cell Mol Life Sci 2003, 60, 1852–1871. [Google Scholar] [CrossRef] [PubMed]
- Dunker, A.K.; Cortese, M.S.; Romero, P.; Iakoucheva, L.M.; Uversky, V.N. Flexible nets: The roles of intrinsic disorder in protein interaction networks. FEBS Journal 2005, 272, 5129–5148. [Google Scholar] [CrossRef] [PubMed]
- Dajani, R.; Fraser, E.; Roe, S.M.; Yeo, M.; Good, V.M.; Thompson, V.; Dale, T.C.; Pearl, L.H. Structural basis for recruitment of glycogen synthase kinase 3beta to the axin-APC scaffold complex. Embo J 2003, 22, 494–501. [Google Scholar] [CrossRef]
- Dyson, H.J.; Wright, P.E. Coupling of folding and binding for unstructured proteins. Curr Opin Struct Biol 2002, 12, 54–60. [Google Scholar] [CrossRef] [PubMed]
- Hsu, W.L.; Oldfield, C.J.; Xue, B.; Meng, J.; Huang, F.; Romero, P.; Uversky, V.N.; Dunker, A.K. Exploring the binding diversity of intrinsically disordered proteins involved in one-to-many binding. Protein Sci 2013, 22, 258–273. [Google Scholar] [CrossRef] [PubMed]
- Oldfield, C.J.; Meng, J.; Yang, J.Y.; Yang, M.Q.; Uversky, V.N.; Dunker, A.K. Flexible nets: disorder and induced fit in the associations of p53 and 14-3-3 with their partners. BMC Genomics 2008, 9 Suppl 1, S1. [Google Scholar] [CrossRef]
- Tompa, P.; Fuxreiter, M. Fuzzy complexes: polymorphism and structural disorder in protein-protein interactions. Trends Biochem. Sci. 2008, 33, 2–8. [Google Scholar] [CrossRef] [PubMed]
- Hazy, E.; Tompa, P. Limitations of induced folding in molecular recognition by intrinsically disordered proteins. Chemphyschem 2009, 10, 1415–1419. [Google Scholar] [CrossRef] [PubMed]
- Sigalov, A.; Aivazian, D.; Stern, L. Homooligomerization of the cytoplasmic domain of the T cell receptor zeta chain and of other proteins containing the immunoreceptor tyrosine-based activation motif. Biochemistry 2004, 43, 2049–2061. [Google Scholar] [CrossRef] [PubMed]
- Sigalov, A.B.; Zhuravleva, A.V.; Orekhov, V.Y. Binding of intrinsically disordered proteins is not necessarily accompanied by a structural transition to a folded form. Biochimie 2007, 89, 419–421. [Google Scholar] [CrossRef] [PubMed]
- Permyakov, S.E.; Millett, I.S.; Doniach, S.; Permyakov, E.A.; Uversky, V.N. Natively unfolded C-terminal domain of caldesmon remains substantially unstructured after the effective binding to calmodulin. Proteins 2003, 53, 855–862. [Google Scholar] [CrossRef]
- Fuxreiter, M. Fuzziness: linking regulation to protein dynamics. Mol Biosyst 2012, 8, 168–177. [Google Scholar] [CrossRef]
- Fuxreiter, M.; Tompa, P. Fuzzy complexes: a more stochastic view of protein function. Adv Exp Med Biol 2012, 725, 1–14. [Google Scholar] [CrossRef]
- Sharma, R.; Raduly, Z.; Miskei, M.; Fuxreiter, M. Fuzzy complexes: Specific binding without complete folding. FEBS Lett 2015. [Google Scholar] [CrossRef]
- Patil, A.; Nakamura, H. Disordered domains and high surface charge confer hubs with the ability to interact with multiple proteins in interaction networks. FEBS Lett 2006, 580, 2041–2045. [Google Scholar] [CrossRef]
- Ekman, D.; Light, S.; Bjorklund, A.K.; Elofsson, A. What properties characterize the hub proteins of the protein-protein interaction network of Saccharomyces cerevisiae? Genome Biol 2006, 7, R45. [Google Scholar] [CrossRef]
- Haynes, C.; Oldfield, C.J.; Ji, F.; Klitgord, N.; Cusick, M.E.; Radivojac, P.; Uversky, V.N.; Vidal, M.; Iakoucheva, L.M. Intrinsic disorder is a common feature of hub proteins from four eukaryotic interactomes. PLoS Comput Biol 2006, 2, e100. [Google Scholar] [CrossRef] [PubMed]
- Dosztanyi, Z.; Chen, J.; Dunker, A.K.; Simon, I.; Tompa, P. Disorder and sequence repeats in hub proteins and their implications for network evolution. J Proteome Res 2006, 5, 2985–2995. [Google Scholar] [CrossRef] [PubMed]
- Singh, G.P.; Dash, D. Intrinsic disorder in yeast transcriptional regulatory network. Proteins 2007, 68, 602–605. [Google Scholar] [CrossRef]
- Singh, G.P.; Ganapathi, M.; Dash, D. Role of intrinsic disorder in transient interactions of hub proteins. Proteins 2007, 66, 761–765. [Google Scholar] [CrossRef]
- Antifeeva, I.A.; Fonin, A.V.; Fefilova, A.S.; Stepanenko, O.V.; Povarova, O.I.; Silonov, S.A.; Kuznetsova, I.M.; Uversky, V.N.; Turoverov, K.K. Liquid–liquid phase separation as an organizing principle of intracellular space: overview of the evolution of the cell compartmentalization concept. Cellular and Molecular Life Sciences 2022, 79. [Google Scholar] [CrossRef]
- Turoverov, K.K.; Kuznetsova, I.M.; Fonin, A.V.; Darling, A.L.; Zaslavsky, B.Y.; Uversky, V.N. Stochasticity of Biological Soft Matter: Emerging Concepts in Intrinsically Disordered Proteins and Biological Phase Separation. Trends Biochem Sci 2019, 44, 716–728. [Google Scholar] [CrossRef]
- Shin, Y.; Brangwynne, C.P. Liquid phase condensation in cell physiology and disease. Science 2017, 357. [Google Scholar] [CrossRef] [PubMed]
- !!! INVALID CITATION !!! [52-67].
- Uversky, V.N.; Kuznetsova, I.M.; Turoverov, K.K.; Zaslavsky, B. Intrinsically disordered proteins as crucial constituents of cellular aqueous two phase systems and coacervates. FEBS Lett 2015, 589, 15–22. [Google Scholar] [CrossRef]
- Brangwynne, C.P. Phase transitions and size scaling of membrane-less organelles. J Cell Biol 2013, 203, 875–881. [Google Scholar] [CrossRef]
- Uversky, V.N. Intrinsically disordered proteins in overcrowded milieu: Membrane-less organelles, phase separation, and intrinsic disorder. Curr Opin Struct Biol 2016, 44, 18–30. [Google Scholar] [CrossRef]
- Brangwynne, Clifford P. ; Tompa, P.; Pappu, Rohit V. Polymer physics of intracellular phase transitions. Nat Phys 2015, 11, 899–904. [Google Scholar] [CrossRef]
- Zuber, M.X.; Strittmatter, S.M.; Fishman, M.C. A membrane-targeting signal in the amino terminus of the neuronal protein GAP-43. Nature 1989, 341, 345–348. [Google Scholar] [CrossRef]
- Liu, Y.C.; Chapman, E.R.; Storm, D.R. Targeting of neuromodulin (GAP-43) fusion proteins to growth cones in cultured rat embryonic neurons. Neuron 1991, 6, 411–420. [Google Scholar] [CrossRef] [PubMed]
- Liu, Y.; Fisher, D.A.; Storm, D.R. Intracellular sorting of neuromodulin (GAP-43) mutants modified in the membrane targeting domain. J Neurosci 1994, 14, 5807–5817. [Google Scholar] [CrossRef] [PubMed]
- Kumar, V.; Chichili, V.P.; Zhong, L.; Tang, X.; Velazquez-Campoy, A.; Sheu, F.S.; Seetharaman, J.; Gerges, N.Z.; Sivaraman, J. Structural basis for the interaction of unstructured neuron specific substrates neuromodulin and neurogranin with Calmodulin. Sci Rep 2013, 3, 1392. [Google Scholar] [CrossRef] [PubMed]
- Shen, Y.; Mani, S.; Donovan, S.L.; Schwob, J.E.; Meiri, K.F. Growth-associated protein-43 is required for commissural axon guidance in the developing vertebrate nervous system. J Neurosci 2002, 22, 239–247. [Google Scholar] [CrossRef] [PubMed]
- Chapman, E.R.; Au, D.; Alexander, K.A.; Nicolson, T.A.; Storm, D.R. Characterization of the calmodulin binding domain of neuromodulin. Functional significance of serine 41 and phenylalanine 42. J Biol Chem 1991, 266, 207–213. [Google Scholar] [CrossRef]
- Katuwawala, A.; Peng, Z.; Yang, J.; Kurgan, L. Computational Prediction of MoRFs, Short Disorder-to-order Transitioning Protein Binding Regions. Comput Struct Biotechnol J 2019, 17, 454–462. [Google Scholar] [CrossRef] [PubMed]
- Marnik, E.A.; Updike, D.L. Membraneless organelles: P granules in Caenorhabditis elegans. Traffic 2019, 20, 373–379. [Google Scholar] [CrossRef]
- Mohammed, A.S.; Uversky, V.N. Intrinsic Disorder as a Natural Preservative: High Levels of Intrinsic Disorder in Proteins Found in the 2600-Year-Old Human Brain. Biology (Basel) 2022, 11. [Google Scholar] [CrossRef]
- Zhou, Y.; Bennett, T.M.; Shiels, A. A charged multivesicular body protein (CHMP4B) is required for lens growth and differentiation. Differentiation 2019, 109, 16–27. [Google Scholar] [CrossRef]
- Schmidt, O.; Teis, D. The ESCRT machinery. Curr Biol 2012, 22, R116–120. [Google Scholar] [CrossRef] [PubMed]
- Lippincott-Schwartz, J.; Freed, E.O.; van Engelenburg, S.B. A Consensus View of ESCRT-Mediated Human Immunodeficiency Virus Type 1 Abscission. Annu Rev Virol 2017, 4, 309–325. [Google Scholar] [CrossRef]
- Sharma, R.; Sharma, A.; Patil, A.; Tsunoda, T. Discovering MoRFs by trisecting intrinsically disordered protein sequence into terminals and middle regions. BMC Bioinformatics 2019, 19, 378. [Google Scholar] [CrossRef] [PubMed]
- Hagen, C.; Dent, K.C.; Zeev-Ben-Mordehai, T.; Grange, M.; Bosse, J.B.; Whittle, C.; Klupp, B.G.; Siebert, C.A.; Vasishtan, D.; Bauerlein, F.J.; et al. Structural Basis of Vesicle Formation at the Inner Nuclear Membrane. Cell 2015, 163, 1692–1701. [Google Scholar] [CrossRef] [PubMed]
- Zhang, Y.; Yang, Z.; Cao, Y.; Zhang, S.; Li, H.; Huang, Y.; Ding, Y.Q.; Liu, X. The Hsp40 family chaperone protein DnaJB6 enhances Schlafen1 nuclear localization which is critical for promotion of cell-cycle arrest in T-cells. Biochem J 2008, 413, 239–250. [Google Scholar] [CrossRef]
- Sarparanta, J.; Jonson, P.H.; Golzio, C.; Sandell, S.; Luque, H.; Screen, M.; McDonald, K.; Stajich, J.M.; Mahjneh, I.; Vihola, A.; et al. Mutations affecting the cytoplasmic functions of the co-chaperone DNAJB6 cause limb-girdle muscular dystrophy. Nat Genet 2012, 44, 450–455. [Google Scholar] [CrossRef]
- Hageman, J.; Rujano, M.A.; van Waarde, M.A.; Kakkar, V.; Dirks, R.P.; Govorukhina, N.; Oosterveld-Hut, H.M.; Lubsen, N.H.; Kampinga, H.H. A DNAJB chaperone subfamily with HDAC-dependent activities suppresses toxic protein aggregation. Mol Cell 2010, 37, 355–369. [Google Scholar] [CrossRef] [PubMed]
- Osterlund, N.; Frankel, R.; Carlsson, A.; Thacker, D.; Karlsson, M.; Matus, V.; Graslund, A.; Emanuelsson, C.; Linse, S. The C-terminal domain of the antiamyloid chaperone DNAJB6 binds to amyloid-beta peptide fibrils and inhibits secondary nucleation. J Biol Chem 2023, 299, 105317. [Google Scholar] [CrossRef]
- Kuiper, E.F.E.; Gallardo, P.; Bergsma, T.; Mari, M.; Kolbe Musskopf, M.; Kuipers, J.; Giepmans, B.N.G.; Steen, A.; Kampinga, H.H.; Veenhoff, L.M.; et al. The chaperone DNAJB6 surveils FG-nucleoporins and is required for interphase nuclear pore complex biogenesis. Nat Cell Biol 2022, 24, 1584–1594. [Google Scholar] [CrossRef]
- Izawa, I.; Nishizawa, M.; Ohtakara, K.; Ohtsuka, K.; Inada, H.; Inagaki, M. Identification of Mrj, a DnaJ/Hsp40 family protein, as a keratin 8/18 filament regulatory protein. J Biol Chem 2000, 275, 34521–34527. [Google Scholar] [CrossRef]
- Vietri, M.; Radulovic, M.; Stenmark, H. The many functions of ESCRTs. Nat Rev Mol Cell Biol 2020, 21, 25–42. [Google Scholar] [CrossRef]
- Szymanska, E.; Budick-Harmelin, N.; Miaczynska, M. Endosomal "sort" of signaling control: The role of ESCRT machinery in regulation of receptor-mediated signaling pathways. Semin Cell Dev Biol 2018, 74, 11–20. [Google Scholar] [CrossRef]
- Olmos, Y.; Carlton, J.G. The ESCRT machinery: new roles at new holes. Curr Opin Cell Biol 2016, 38, 1–11. [Google Scholar] [CrossRef] [PubMed]
- Hurley, J.H. ESCRTs are everywhere. EMBO J 2015, 34, 2398–2407. [Google Scholar] [CrossRef] [PubMed]
- Wunderley, L.; Brownhill, K.; Stefani, F.; Tabernero, L.; Woodman, P. The molecular basis for selective assembly of the UBAP1-containing endosome-specific ESCRT-I complex. J Cell Sci 2014, 127, 663–672. [Google Scholar] [CrossRef] [PubMed]
- Stefani, F.; Zhang, L.; Taylor, S.; Donovan, J.; Rollinson, S.; Doyotte, A.; Brownhill, K.; Bennion, J.; Pickering-Brown, S.; Woodman, P. UBAP1 is a component of an endosome-specific ESCRT-I complex that is essential for MVB sorting. Curr Biol 2011, 21, 1245–1250. [Google Scholar] [CrossRef]
- Kolmus, K.; Erdenebat, P.; Szymanska, E.; Stewig, B.; Goryca, K.; Derezinska-Wolek, E.; Szumera-Cieckiewicz, A.; Brewinska-Olchowik, M.; Piwocka, K.; Prochorec-Sobieszek, M.; et al. Concurrent depletion of Vps37 proteins evokes ESCRT-I destabilization and profound cellular stress responses. J Cell Sci 2021, 134. [Google Scholar] [CrossRef]
- Bajorek, M.; Morita, E.; Skalicky, J.J.; Morham, S.G.; Babst, M.; Sundquist, W.I. Biochemical analyses of human IST1 and its function in cytokinesis. Mol Biol Cell 2009, 20, 1360–1373. [Google Scholar] [CrossRef]
- Derry, J.M.; Ochs, H.D.; Francke, U. Isolation of a novel gene mutated in Wiskott-Aldrich syndrome. Cell 1994, 78, 635–644. [Google Scholar] [CrossRef]
- Campellone, K.G.; Welch, M.D. A nucleator arms race: cellular control of actin assembly. Nat Rev Mol Cell Biol 2010, 11, 237–251. [Google Scholar] [CrossRef]
- Alekhina, O.; Burstein, E.; Billadeau, D.D. Cellular functions of WASP family proteins at a glance. J Cell Sci 2017, 130, 2235–2241. [Google Scholar] [CrossRef] [PubMed]
- Goley, E.D.; Welch, M.D. The ARP2/3 complex: an actin nucleator comes of age. Nat Rev Mol Cell Biol 2006, 7, 713–726. [Google Scholar] [CrossRef]
- Burianek, L.E.; Soderling, S.H. Under lock and key: spatiotemporal regulation of WASP family proteins coordinates separate dynamic cellular processes. Semin Cell Dev Biol 2013, 24, 258–266. [Google Scholar] [CrossRef] [PubMed]
- Stanganello, E.; Hagemann, A.I.; Mattes, B.; Sinner, C.; Meyen, D.; Weber, S.; Schug, A.; Raz, E.; Scholpp, S. Filopodia-based Wnt transport during vertebrate tissue patterning. Nat Commun 2015, 6, 5846. [Google Scholar] [CrossRef] [PubMed]
- Verboon, J.M.; Sugumar, B.; Parkhurst, S.M. Wiskott-Aldrich syndrome proteins in the nucleus: aWASH with possibilities. Nucleus 2015, 6, 349–359. [Google Scholar] [CrossRef]
- Damian, R.T. Molecular mimicry: antigen sharing by parasite and host and its consequences. The American Naturalist 1964, 98, 129–149. [Google Scholar] [CrossRef]
- Root-Bernstein, R. Human Immunodeficiency Virus Proteins Mimic Human T Cell Receptors Inducing Cross-Reactive Antibodies. Int J Mol Sci 2017, 18. [Google Scholar] [CrossRef] [PubMed]
- Sorci, G.; Cornet, S.; Faivre, B. Immune evasion, immunopathology and the regulation of the immune system. Pathogens 2013, 2, 71–91. [Google Scholar] [CrossRef]
- Rojas, M.; Restrepo-Jimenez, P.; Monsalve, D.M.; Pacheco, Y.; Acosta-Ampudia, Y.; Ramirez-Santana, C.; Leung, P.S.C.; Ansari, A.A.; Gershwin, M.E.; Anaya, J.M. Molecular mimicry and autoimmunity. J Autoimmun 2018, 95, 100–123. [Google Scholar] [CrossRef]
- Maginnis, M.S. Virus-Receptor Interactions: The Key to Cellular Invasion. J Mol Biol 2018, 430, 2590–2611. [Google Scholar] [CrossRef]
- Simmons, R.A.; Willberg, C.B.; Paul, K. Immune evasion by viruses. eLS 2013. [Google Scholar]
- Bule, M.; Khan, F.; Niaz, K. Antivirals: past, present and future. Recent advances in animal virology 2019, 425–446. [Google Scholar]
- Morris, O.M.; Torpey, J.H.; Isaacson, R.L. Intrinsically disordered proteins: modes of binding with emphasis on disordered domains. Open Biol 2021, 11, 210222. [Google Scholar] [CrossRef] [PubMed]
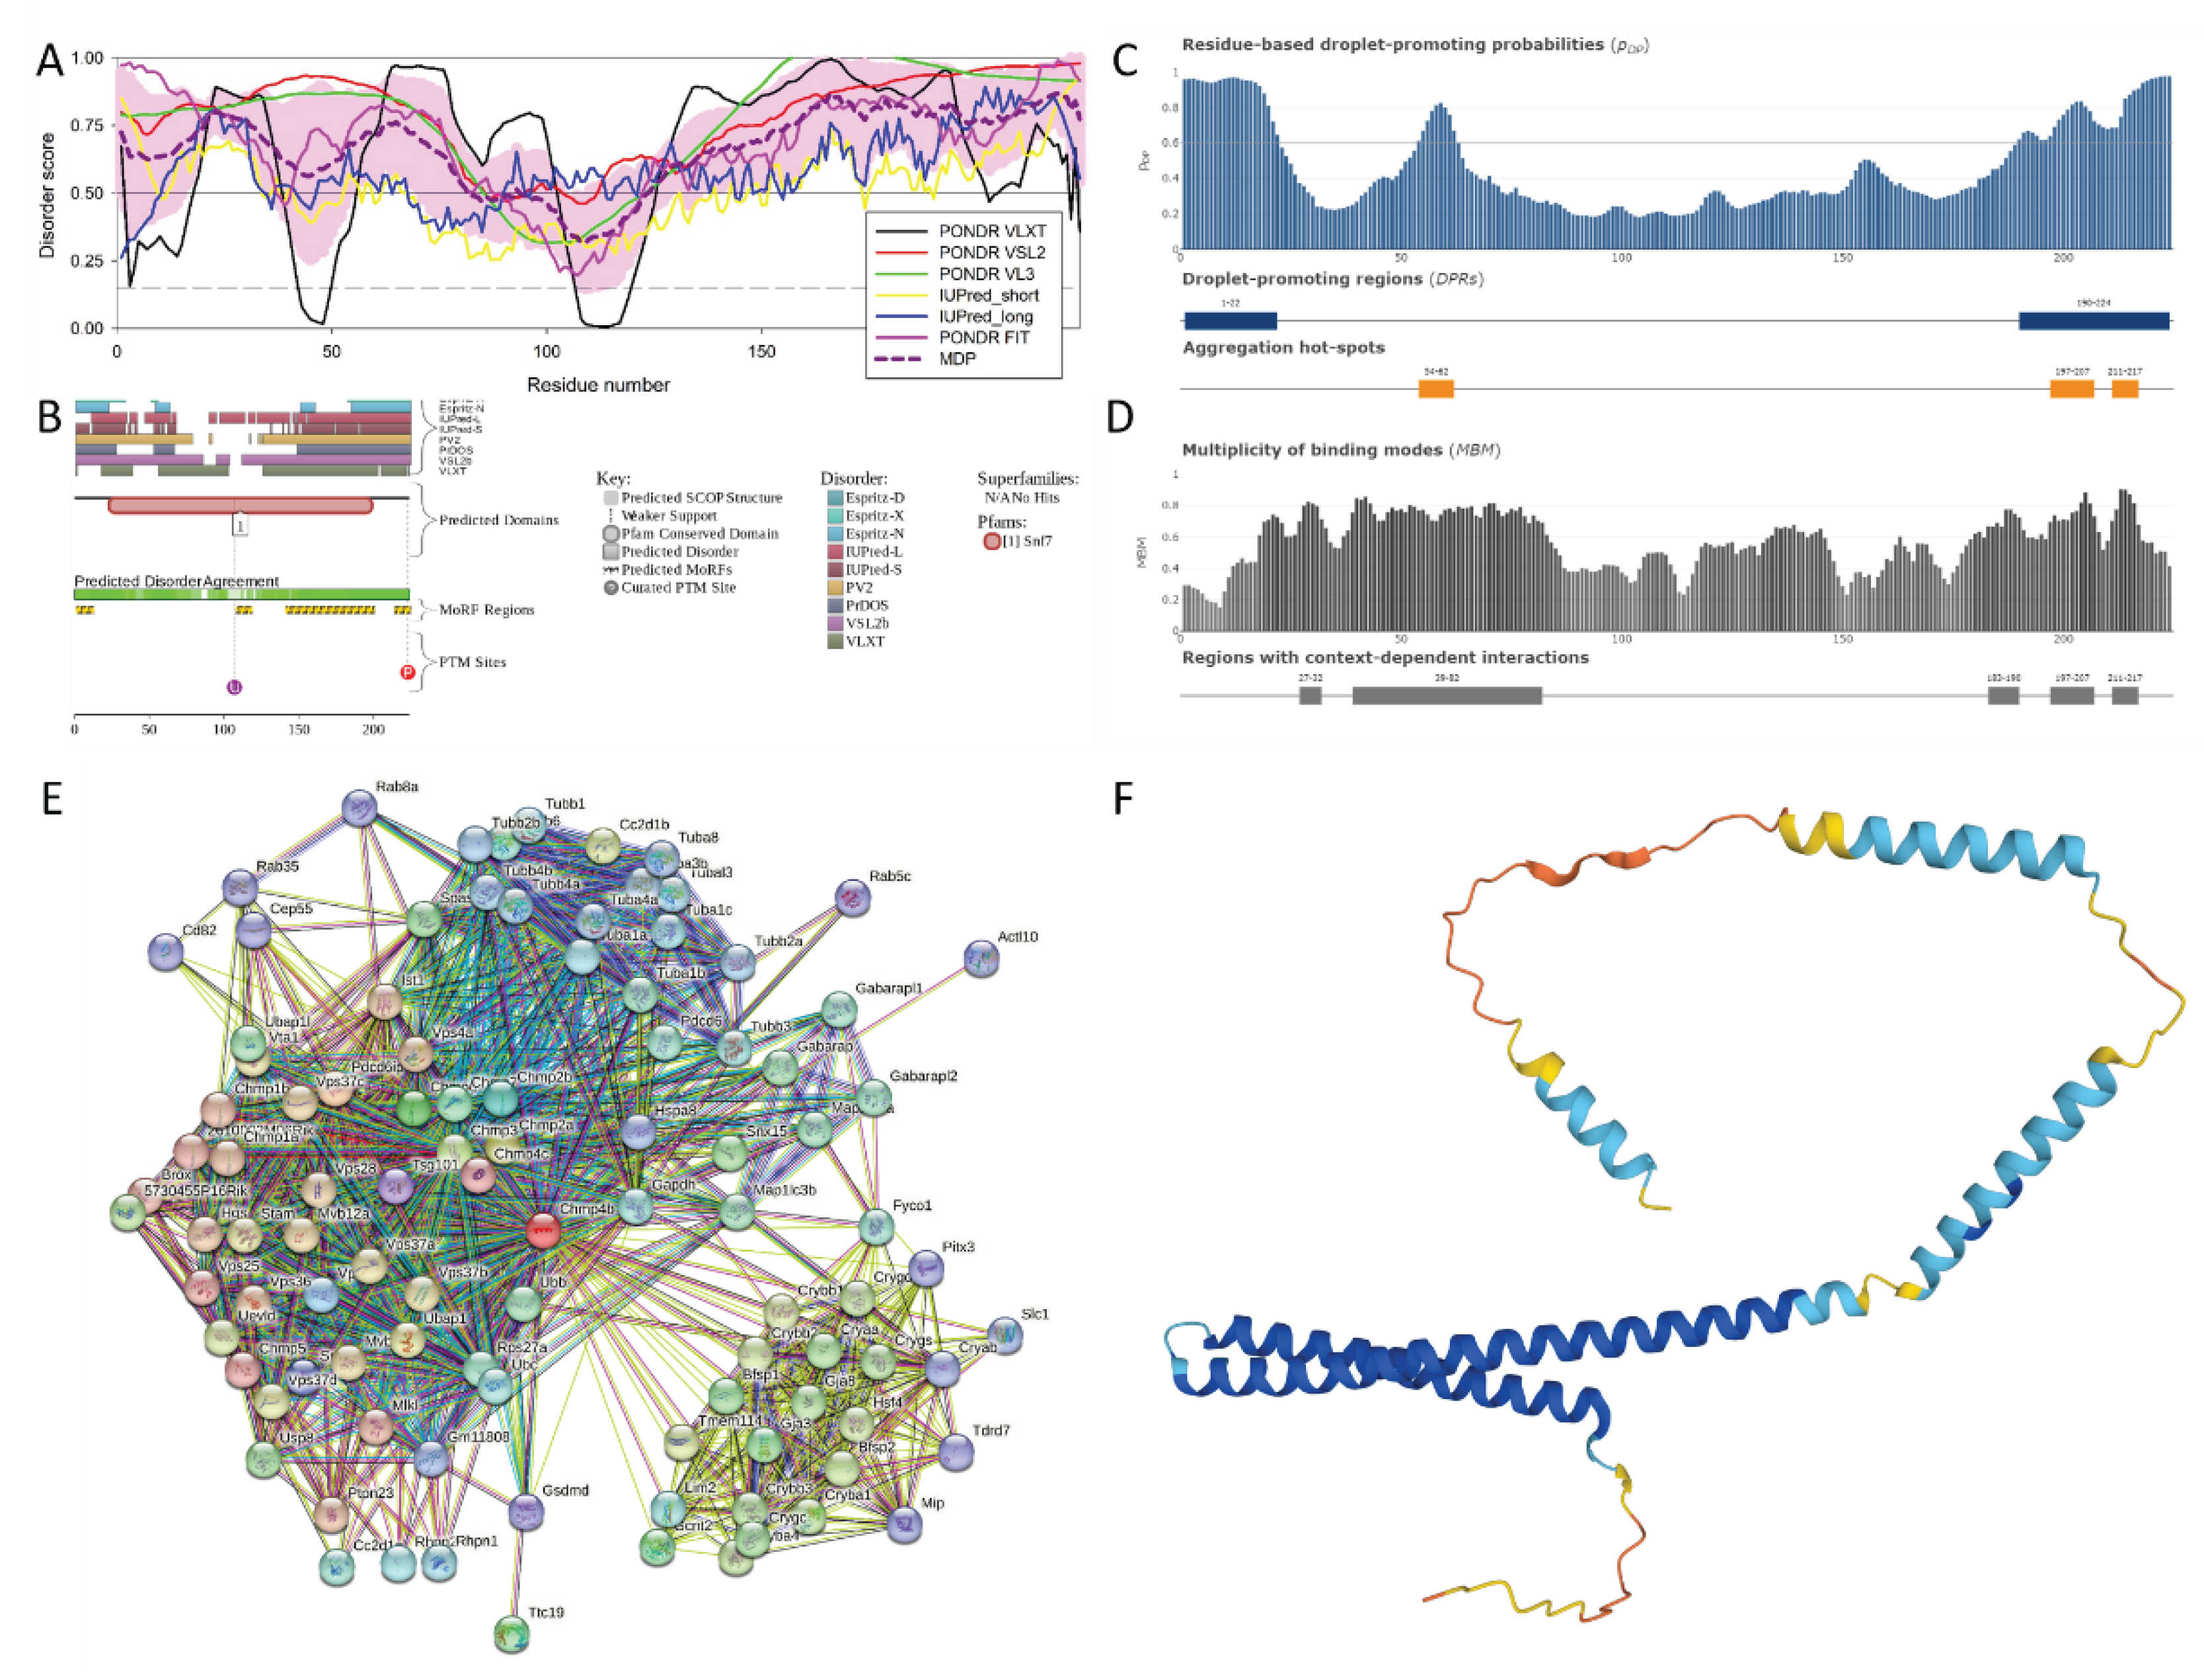
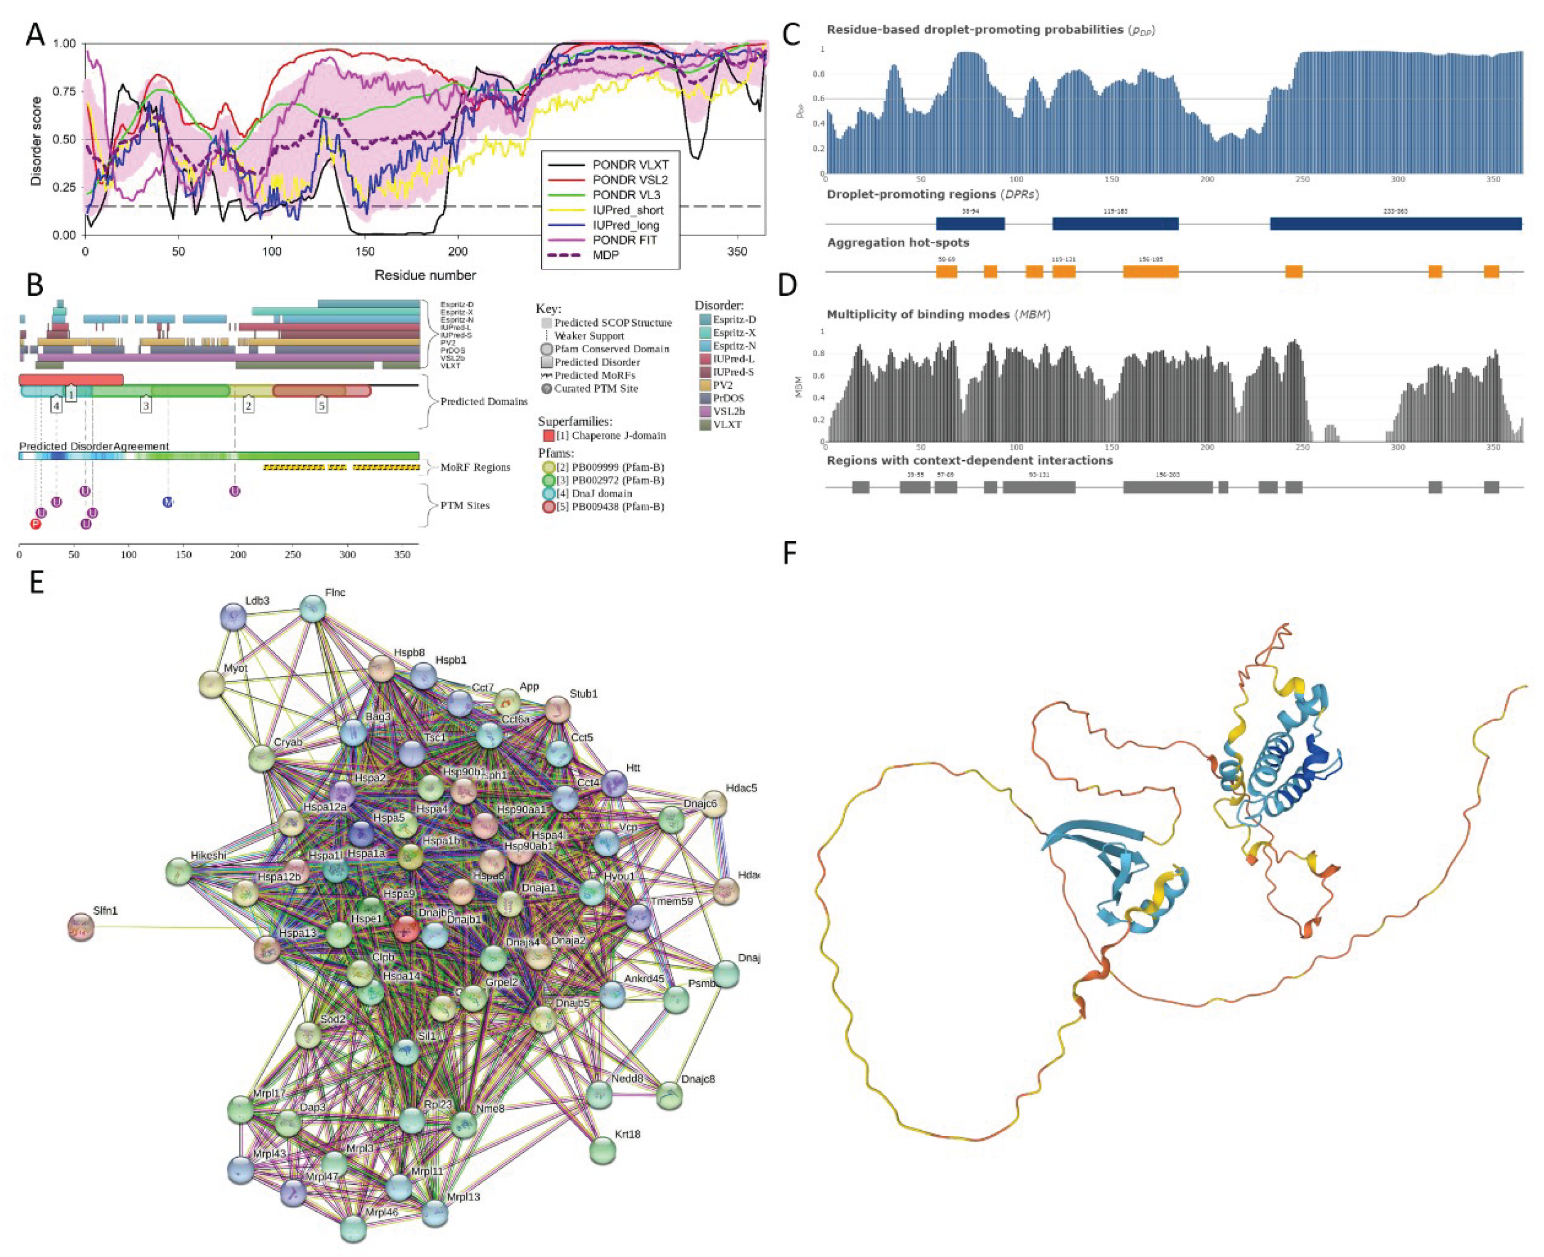
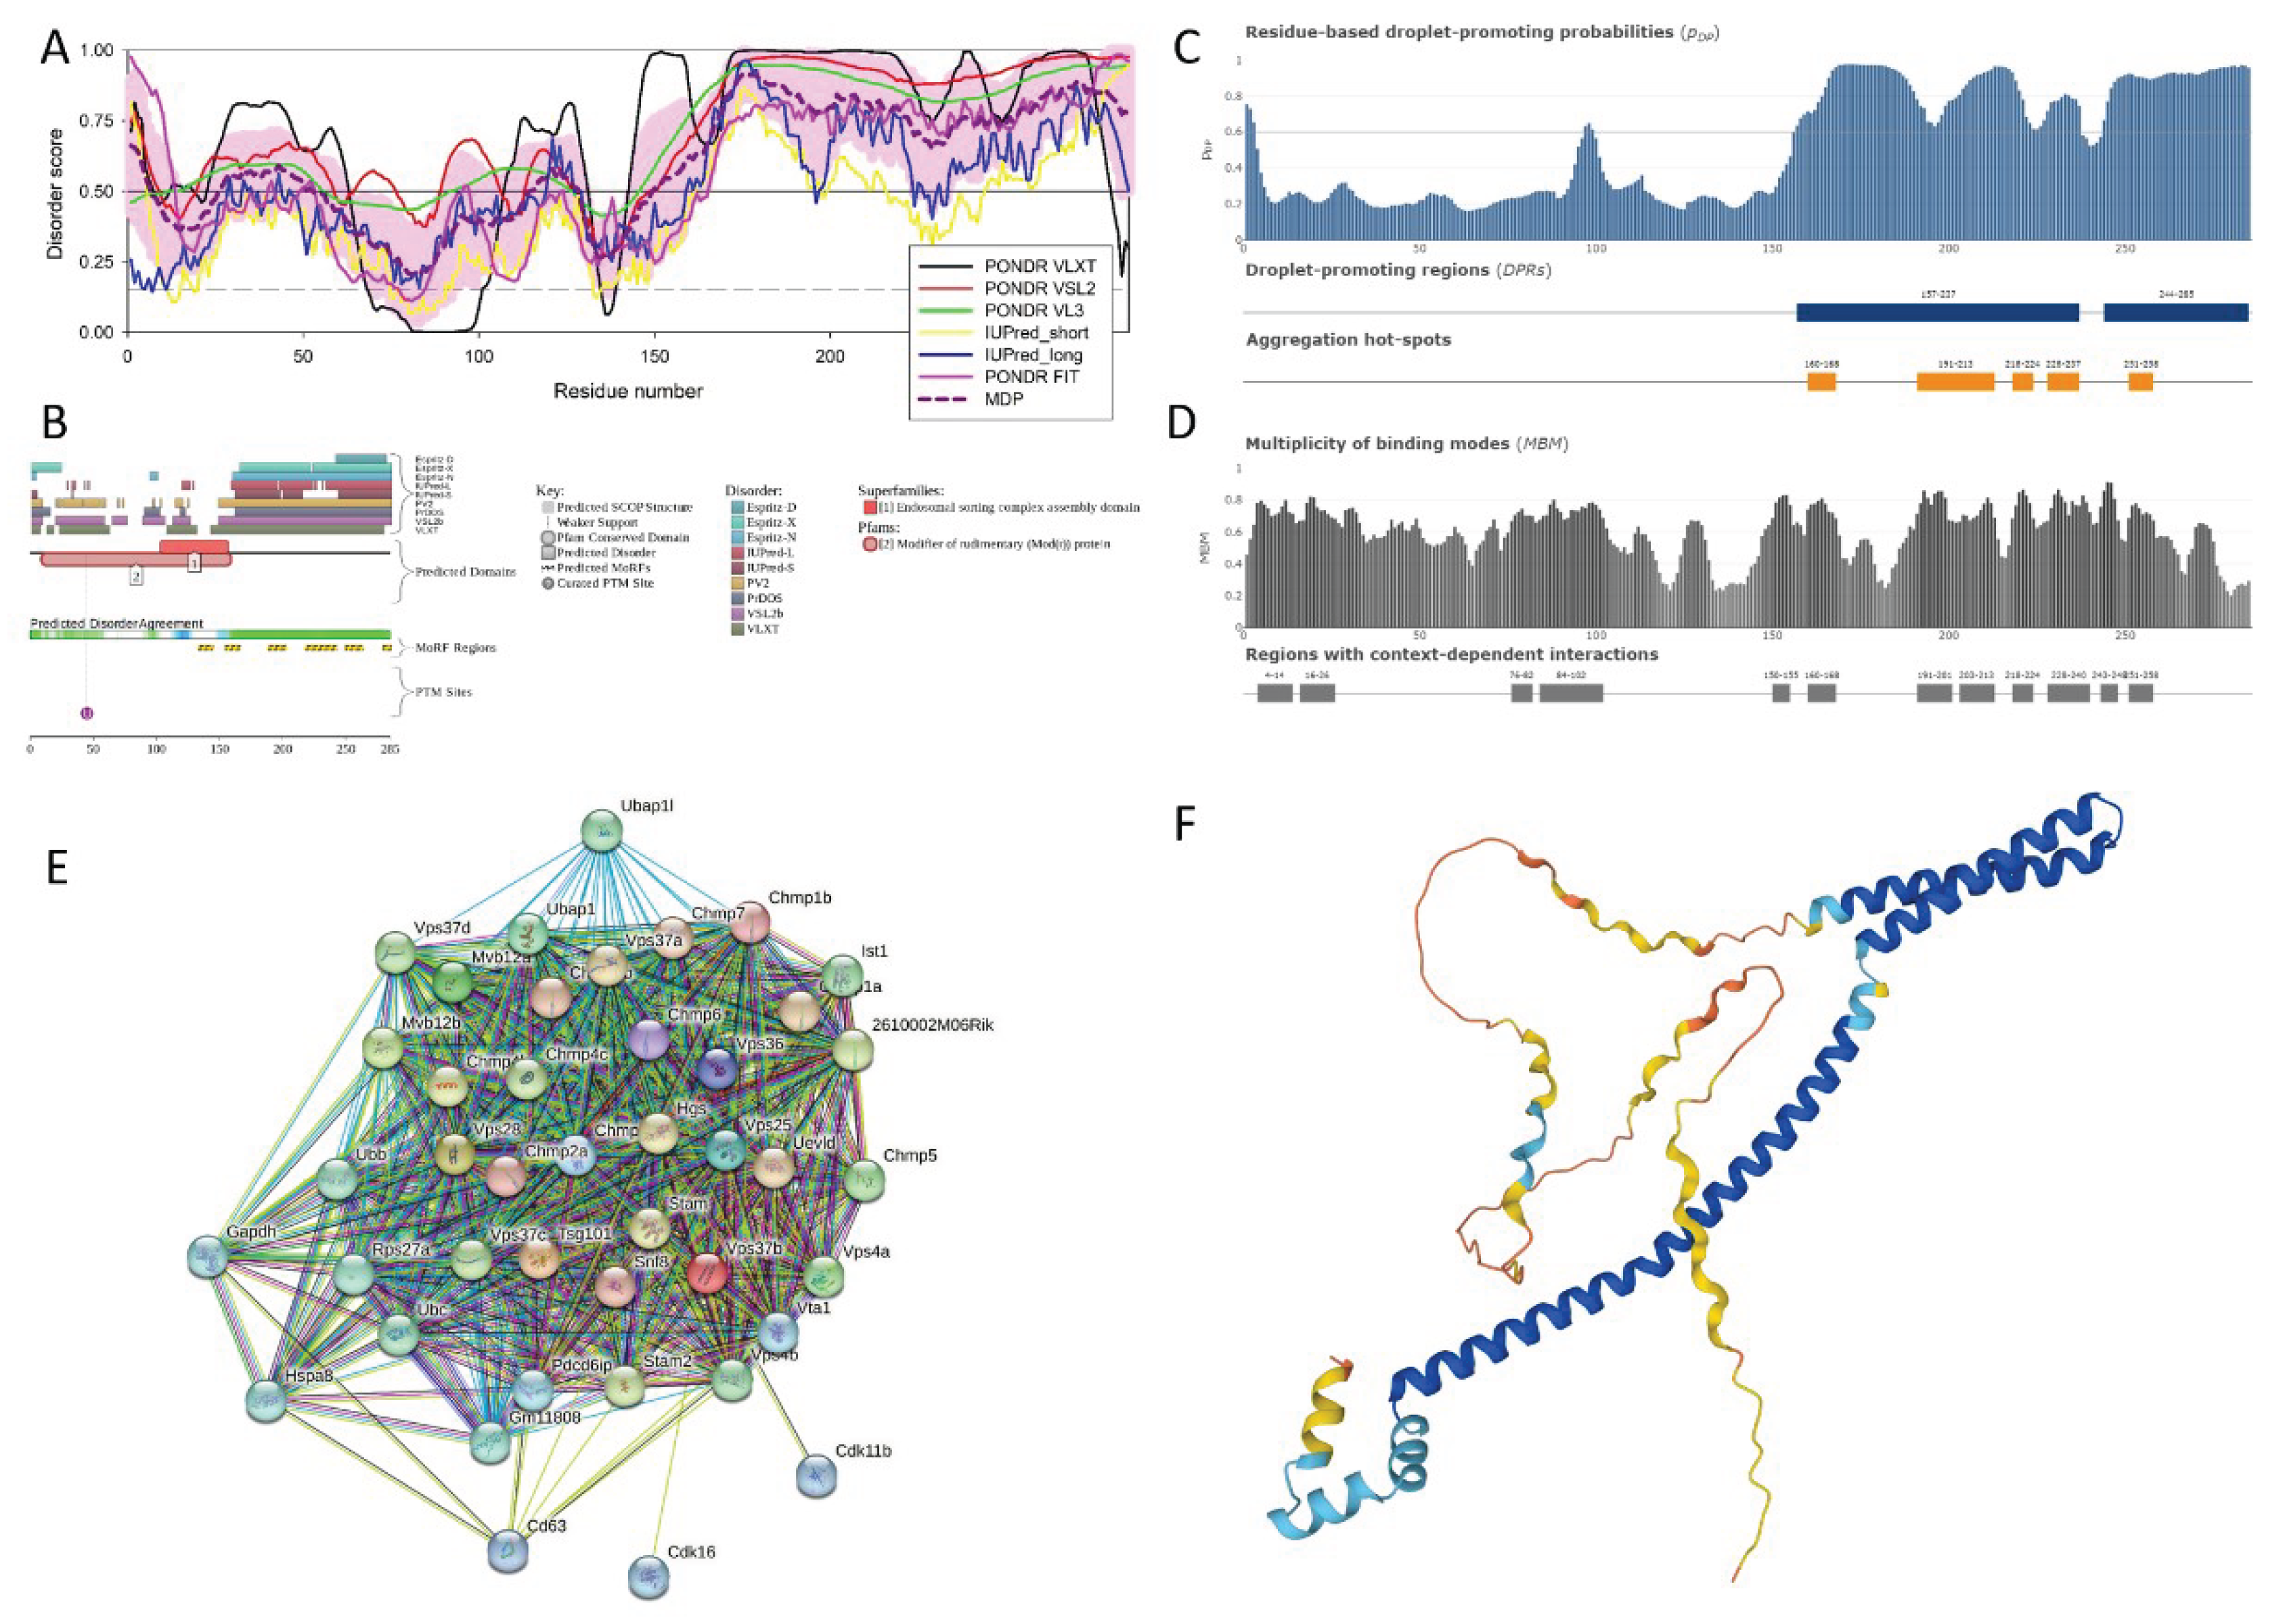
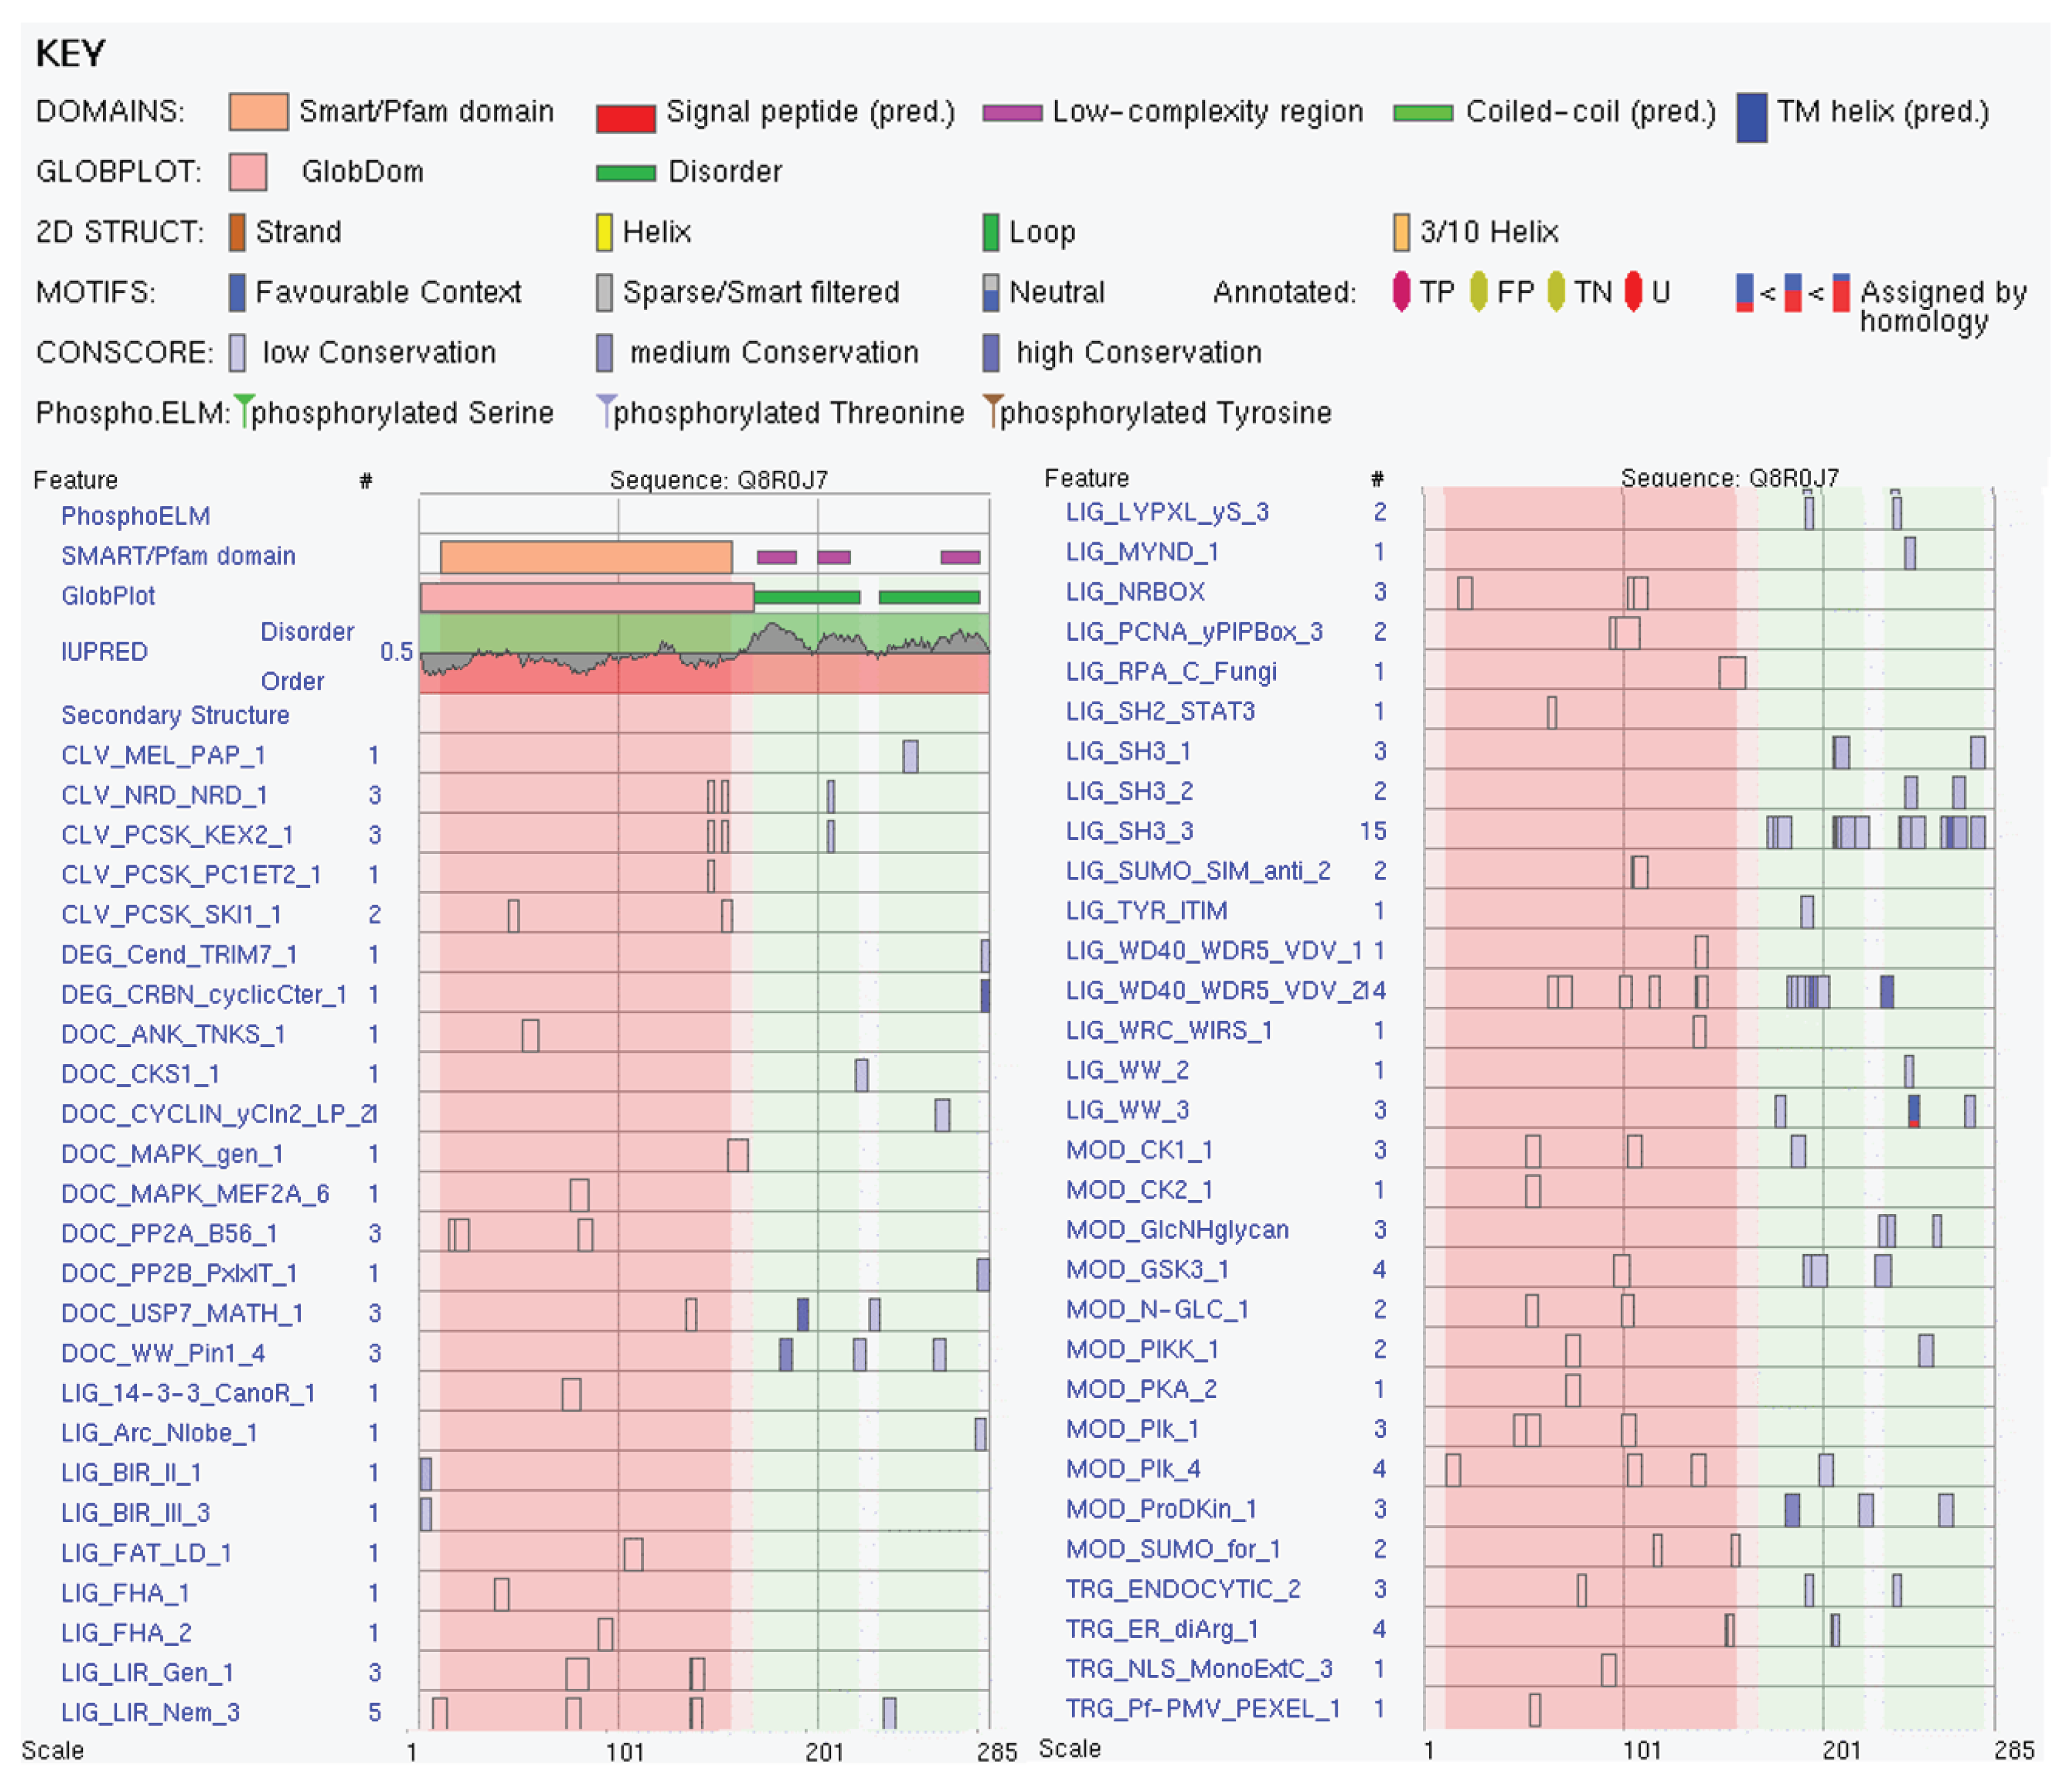
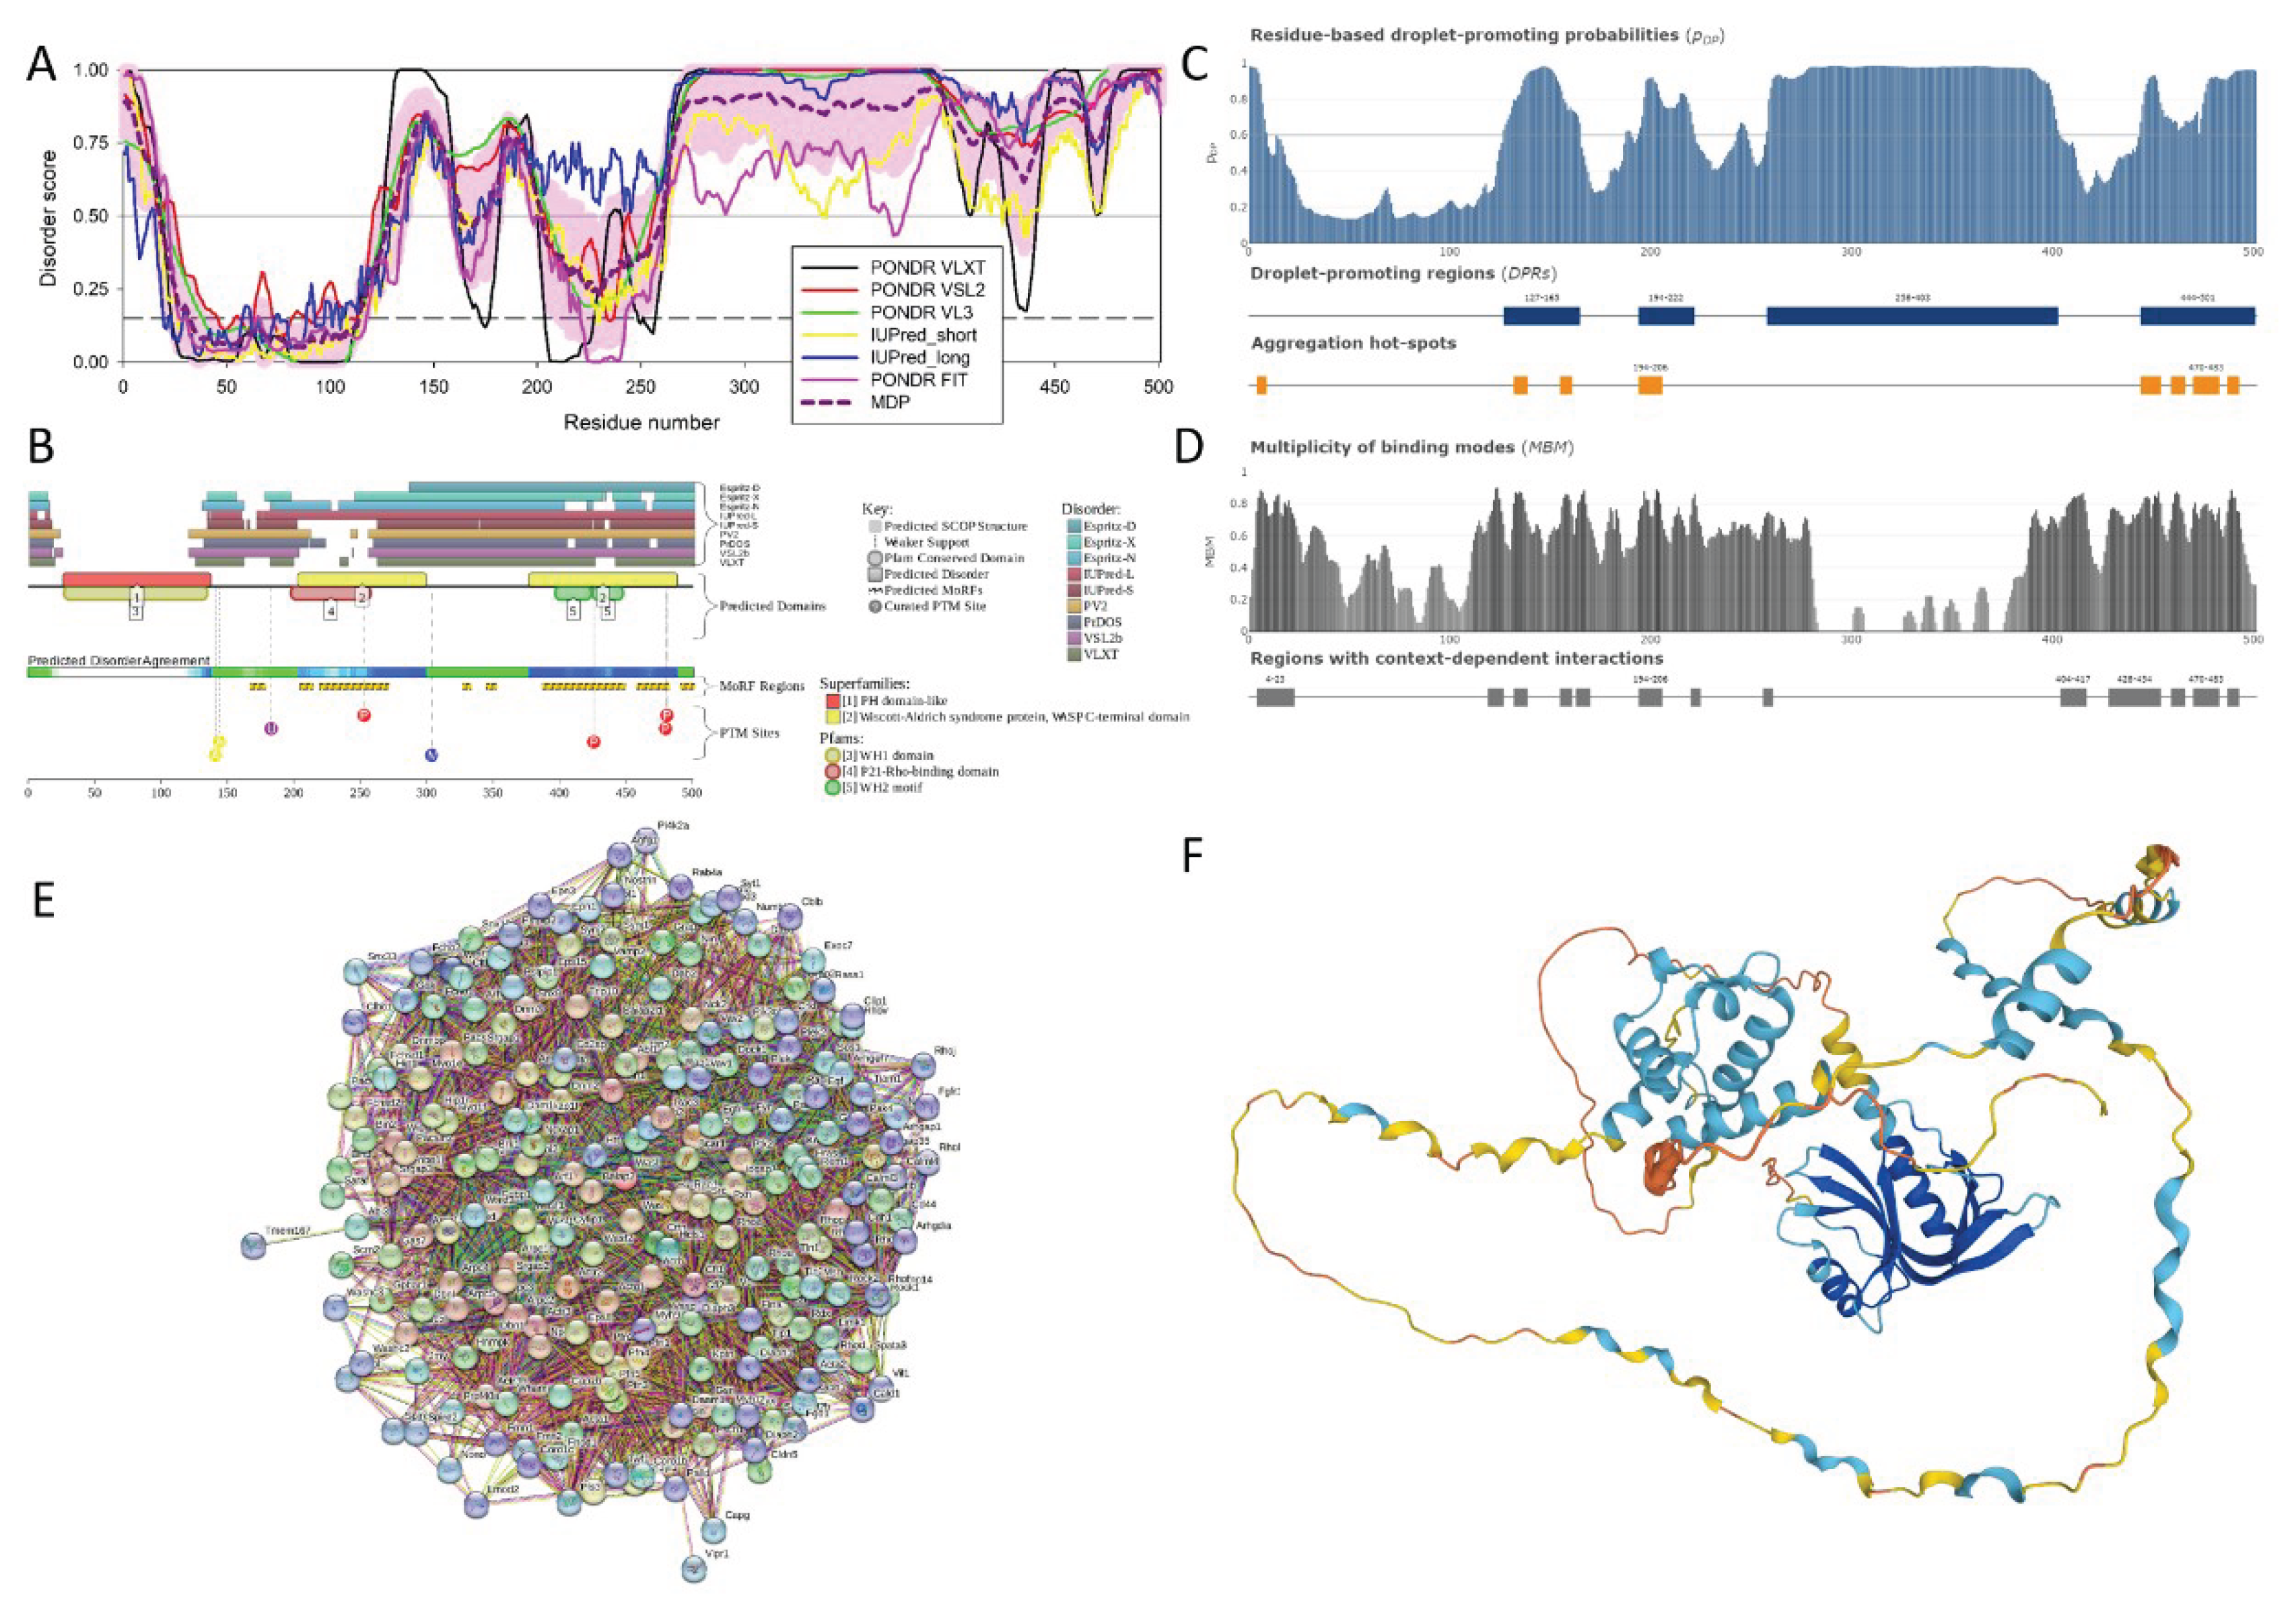
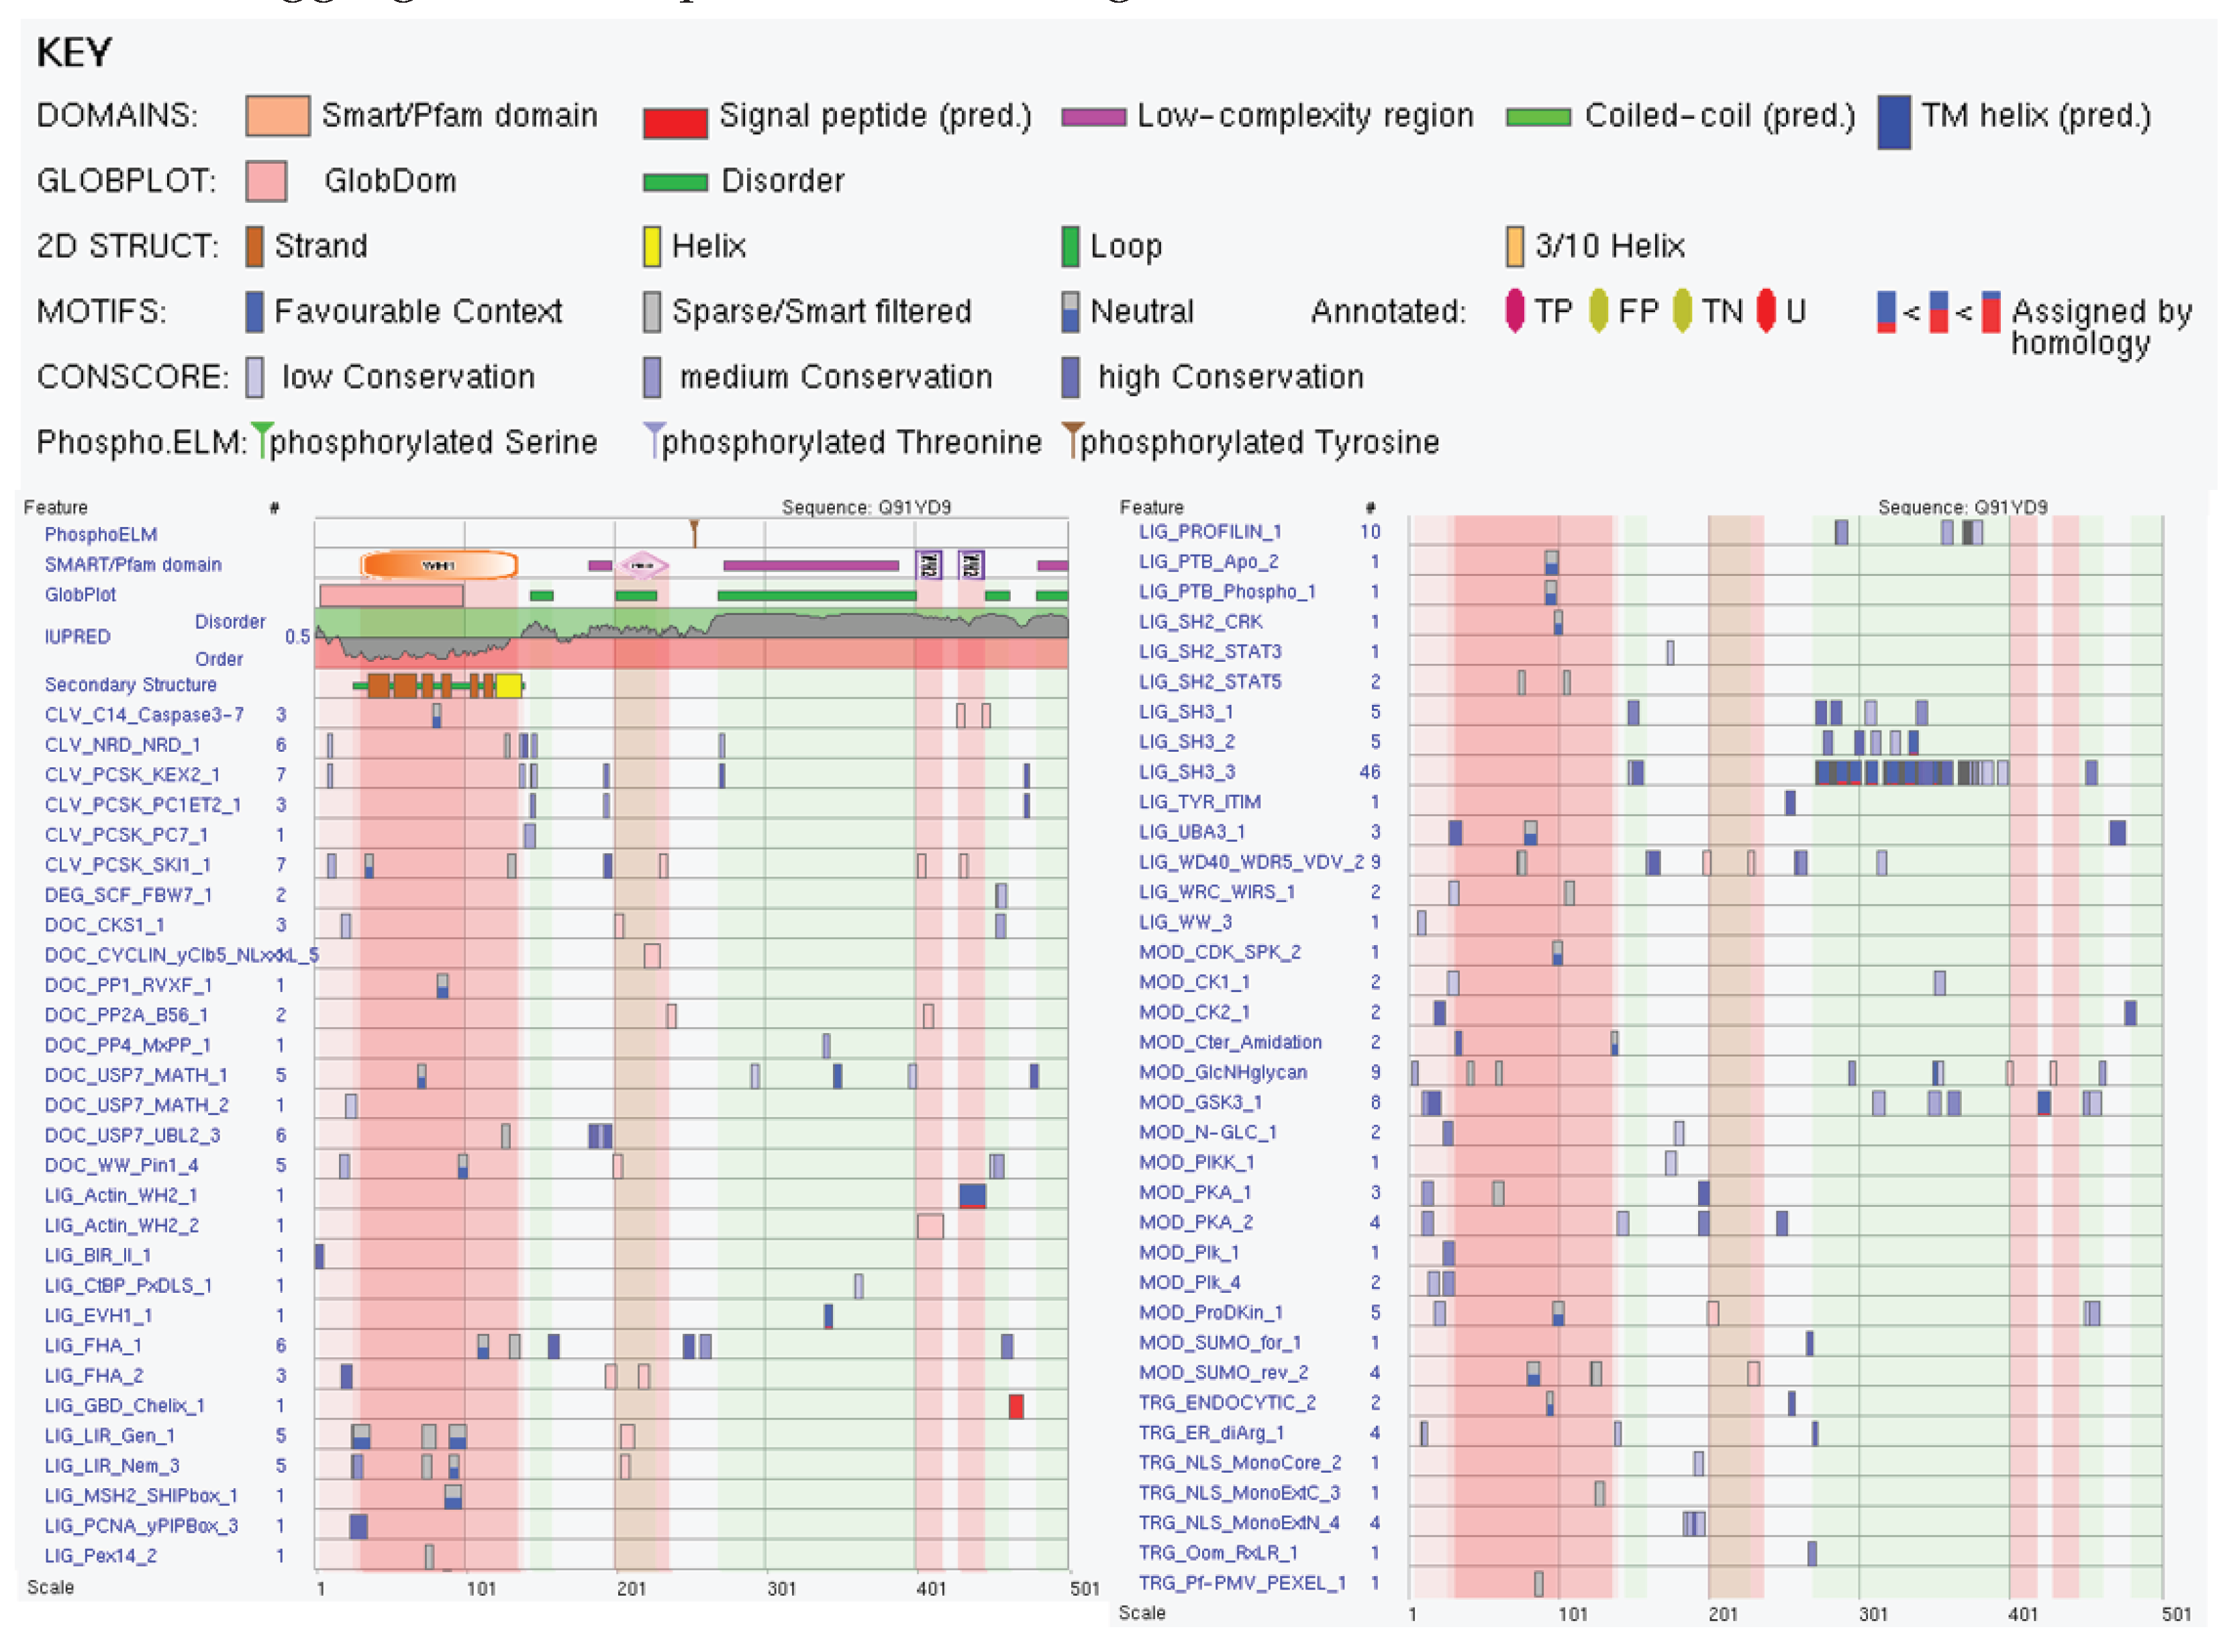
| Region Type | Region Range | ELM ID | Position |
| Droplet Promoting region | 52-277 | LIG_PDZ_Class_3 | 222-227 |
| LIG_WD40_WDR5_VDV_2 | 219-222 | ||
| 218-222 | |||
| 215-222 | |||
| 155-161 | |||
| 154-161 | |||
| 133-137 | |||
| 132-137 | |||
| 131-137 | |||
| 96-99 | |||
| 95-99 | |||
| 64-66 | |||
| 58-64 | |||
| MOD_GlcNHglycan | 209-212 | ||
| 132-135 | |||
| 127-130 | |||
| 85-88 | |||
| 84-88 | |||
| MOD_SUMO_rev_2 | 203-207 | ||
| 200-207 | |||
| 198-207 | |||
| 196-201 | |||
| 193-201 | |||
| 192-201 | |||
| 191-201 | |||
| 154-159 | |||
| 149-159 | |||
| 122-126 | |||
| 118-126 | |||
| CLV_C14_Caspase3-7 | 197-201 | ||
| DOC_USP7_MATH_1 | 207-211 | ||
| 190-194 | |||
| 119-123 | |||
| MOD_CK2_1 | 190-196 | ||
| 142-148 | |||
| MOD_GSK3_1 | 186-193 | ||
| 135-142 | |||
| MOD_PIKK_1 | 190-196 | ||
| LIG_TRAF6_MATH_1 | 184-192 | ||
| DOC_WW_Pin1_4 | 169-174 | ||
| 139-144 | |||
| 93-98 | |||
| MOD_ProDKin_1 | 169-175 | ||
| 139-145 | |||
| 93-99 | |||
| DOC_USP7_UBL2_3 | 153-157 | ||
| MOD_SUMO_for_1 | 152-155 | ||
| 97-100 | |||
| 25-28 | |||
| MOD_CK1_1 | 142-148 | ||
| 128-134 | |||
| 86-92 | |||
| LIG_BIR_III_2 | 118-122 | ||
| MOD_Plk_2-3 | 107-113 | ||
| MOD_CDK_SPK_2 | 93-98 | ||
| MoRF | 102-109 | MOD_Plk_2-3 | 107-113 |
| MoRF | 58-81 | LIG_WD40_WDR5_VDV_2 | 58-64 |
| 63-66 | |||
| Aggregation Hotspot | 52-66 | LIG_WD40_WDR5_VDV_2 | 58-64 |
| 63-66 | |||
| MoRF | 1-9 | LIG_UBA3_1 | 1-9 |
| LIG_FHA_1 | 6-12 | ||
| MOD_PKA_2 | 5-11 | ||
| CLV_NRD_NRD_1 | 6-8 | ||
| CLV_PCSK_KEX2_1 | 6-8 | ||
| TRG_ER_diArg_1 | 5-7 | ||
| DEG_Nend_Nbox_1 | 1-3 |
| Region Type | Region range | ELM ID | Position |
| MoRF | 1-12 | LIG_BIR_II_1 | 1-5 |
| LIG_LIR_Nem_3 | 2-7 | ||
| LIG_Pex14_2 | 4-8 | ||
| Droplet-promoting region | 1-22 | LIG_BIR_II_1 | 1-5 |
| LIG_LIR_Nem_3 | 2-7 | ||
| LIG_Pex14_2 | 4-8 | ||
| DOC_WW_Pin1_4 | 18-23 | ||
| MOD_ProDKin_1 | 18-24 | ||
| LIG_FHA_2 | 19-25 | ||
| Region with multiplicity of binding modes | 27-32 | MOD_PKA_2 | 29-35 |
| Region with multiplicity of binding modes | 39-82 | MOD_SUMO_rev_2 | 41-47 |
| TRG_NLS_Bipartite_1 | 55-75 | ||
| DOC_USP7_UBL2_3 | 56-60 | ||
| CLV_PCSK_PC1ET2_1 | 62-64 | ||
| TRG_NLS_MonoExtN_4 | 70-75 | ||
| TRG_NLS_MonoCore_2 | 69-74 | ||
| 70-75 | |||
| TRG_NLS_MonoExtC_3 | 69-74 | ||
| 70-75 | |||
| Aggregation Hotspot | 54-62 | DOC_USP7_UBL2_3 | 56-60 |
| CLV_PCSK_PC1ET2_1 | 62-64 | ||
| MoRF | 108-118 | LIG_SH2_STAP1 | 111-115 |
| LIG_WD40_WDR5_VDV_2 | 111-115 | ||
| CLV_PCSK_SKI1_1 | 114-118 | ||
| MoRF | 141-200 | MOD_GSK3_1 | 143-150 |
| 181-188 | |||
| DOC_PP1_RVXF_1 | 149-156 | ||
| LIG_Pex14_2 | 155-159 | ||
| LIG_WD40_WDR5_VDV_2 | 161-168 | ||
| 162-168 | |||
| 163-168 | |||
| 177-183 | |||
| CLV_PCSK_SKI1_1 | 178-182 | ||
| TRG_Pf-PMV_PEXEL_1 | 178-182 | ||
| LIG_SUMO_SIM_par_1 | 179-184 | ||
| MOD_CK2_1 | 181-187 | ||
| MOD_GlcNHglycan | 182-186 | ||
| 183-186 | |||
| LIG_FHA_1 | 186-192 | ||
| LIG_SH3_3 | 186-192 | ||
| 189-195 | |||
| 194-200 | |||
| 197-203 | |||
| DOC_USP7_MATH_1 | 198-202 | ||
| Region with multiplicity of binding modes | 183-190 | LIG_WD40_WDR5_VDV_2 | 177-183 |
| TRG_Pf-PMV_PEXEL_1 | 178-182 | ||
| LIG_SUMO_SIM_par_1 | 179-184 | ||
| MOD_CK2_1 | 181-187 | ||
| MOD_GlcNHglycan | 182-186 | ||
| 183-186 | |||
| LIG_FHA_1 | 186-192 | ||
| LIG_SH3_3 | 186-192 | ||
| 189-195 | |||
| Region with multiplicity of binding modes | 197-207 | DOC_USP7_MATH_1 | 198-202 |
| LIG_SH3_2 | 200-205 | ||
| CLV_PCSK_SKI1_1 | 202-206 | ||
| DOC_USP7_UBL2_3 | 202-206 | ||
| Aggregation Hotspot | 197-207 | DOC_USP7_MATH_1 | 198-202 |
| LIG_SH3_2 | 200-205 | ||
| CLV_PCSK_SKI1_1 | 202-206 | ||
| DOC_USP7_UBL2_3 | 202-206 | ||
| Droplet-promoting region | 190-224 | LIG_FHA_1 | 186-192 |
| LIG_SH3_3 | 186-192 | ||
| 189-195 | |||
| 194-200 | |||
| 197-203 | |||
| DOC_USP7_MATH_1 | 198-202 | ||
| LIG_SH3_2 | 200-205 | ||
| CLV_PCSK_SKI1_1 | 202-206 | ||
| DOC_USP7_UBL2_3 | 202-206 | ||
| LIG_SH3_4 | 202-209 | ||
| TRG_NESrev_CRM1_2 | 208-217 | ||
| 209-217 | |||
| 210-217 | |||
| 211-217 | |||
| 212-217 | |||
| Aggregation Hotspot | 211-217 | TRG_NESrev_CRM1_2 | 208-217 |
| 209-217 | |||
| 210-217 | |||
| 211-217 | |||
| 212-217 | |||
| MoRF | 214-224 | TRG_NESrev_CRM1_2 | 208-217 |
| 209-217 | |||
| 210-217 | |||
| 211-217 | |||
| 212-217 | |||
| MOD_SUMO_rev_2 | 212-217 |
| Region Type | Region Range | ELM ID | Position |
| Region with multiplicity of binding modes | 14-23 | DOC_WW_Pin1_4 | 12-17 |
| CLV_NRD_NRD_1 | 23-25 | ||
| Region with multiplicity of binding modes | 39-55 | CLV_NRD_NRD_1 | 43-45 |
| CLV_PCSK_SKI1_1 | 44-48 | ||
| Droplet Promoting Region | 58-94 | LIG_LIR_Nem_3 | 63-68 |
| DOC_WW_Pin1_4 | 83-88 | ||
| DOC_PP4_FxxP_1 | 84-87 | ||
| Region with multiplicity of binding modes | 57-69 | TRG_Pf-PMV_PEXEL_1 | 62-66 |
| LIG_LIR_Nem_3 | 63-68 | ||
| Aggregation hotspot | 58-69 | TRG_Pf-PMV_PEXEL_1 | 62-66 |
| LIG_LIR_Nem_3 | 63-68 | ||
| Droplet Promoting Region | 58-94 | TRG_Pf-PMV_PEXEL_1 | 62-66 |
| DOC_PP4_FxxP_1 | 84-87 | ||
| 94-97 | |||
| Region with multiplicity of binding modes | 83-90 | DOC_WW_Pin1_4 | 83-88 |
| MOD_ProDKin_1 | 83-89 | ||
| DOC_PP4_FxxP_1 | 84-87 | ||
| Aggregation hotspot | 83-90 | DOC_WW_Pin1_4 | 83-88 |
| MOD_ProDKin_1 | 83-89 | ||
| DOC_PP4_FxxP_1 | 84-87 | ||
| Region with multiplicity of binding modes | 93-131 | DOC_PP4_FxxP_1 | 84-87 |
| 94-97 | |||
| CLV_PCSK_SKI1_1 | 102-106 | ||
| Aggregation hotspot | 105-114 | LIG_BRCT_BRCA1_1 | 111-115 |
| LIG_AP2alpha_2 | 109-111 | ||
| Aggregation hotspot | 119-131 | DOC_PP4_FxxP_1 | 116-119 |
| LIG_AP2alpha_1 | 116-120 | ||
| 120-124 | |||
| LIG_AP2alpha_2 | 118-120 | ||
| CLV_NRD_NRD_1 | 127-129 | ||
| CLV_PCSK_KEX2_1 | 127-129 | ||
| Droplet Promoting Region | 119-185 | DOC_PP4_FxxP_1 | 116-119 |
| LIG_AP2alpha_1 | 116-120 | ||
| 120-124 | |||
| CLV_NRD_NRD_1 | 127-129 | ||
| CLV_PCSK_KEX2_1 | 127-129 | ||
| LIG_Arc_Nlobe_1 | 148-152 | ||
| 155-120 | |||
| OC_USP7_MATH_1 | 164-168 | ||
| LIG_BRCT_BRCA1_1 | 177-181 | ||
| Aggregation hotspot | 156-185 | LIG_Arc_Nlobe_1 | 155-159 |
| DOC_WW_Pin1_4 | 160-165 | ||
| OC_USP7_MATH_1 | 164-168 | ||
| LIG_BRCT_BRCA1_1 | 177-181 | ||
| Region with multiplicity of binding modes | 156-203 | OC_USP7_MATH_1 | 164-168 |
| LIG_BRCT_BRCA1_1 | 177-181 | ||
| CLV_PCSK_SKI1_1 | 202-206 | ||
| DOC_USP7_UBL2_3 | 203-207 | ||
| Region with multiplicity of binding modes | 206-211 | CLV_PCSK_SKI1_1 | 202-206 |
| DOC_USP7_UBL2_3 | 203-207 | ||
| CLV_PCSK_KEX2_1 | 207-209 | ||
| MoRF | 223-278 | CLV_NRD_NRD_1 | 245-247 |
| CLV_PCSK_SKI1_1 | 226-230 | ||
| Region with multiplicity of binding modes | 227-237 | CLV_PCSK_SKI1_1 | 226-230 |
| Droplet Promoting Region | 233-365 | CLV_NRD_NRD_1 | 245-247 |
| DEG_ODPH_VHL_1 | 253-264 | ||
| DOC_USP7_MATH_1 | 291-295 | ||
| 293-297 | |||
| 334-338 | |||
| DEG_SCF_FBW7_1 | 271-278 | ||
| 273-278 | |||
| 275-282 | |||
| 277-282 | |||
| 287-294 | |||
| DOC_USP7_UBL2_3 | 310-314 | ||
| 341-345 | |||
| 348-352 | |||
| 352-356 | |||
| 358-362 | |||
| Region with multiplicity of binding modes | 241-250 | CLV_NRD_NRD_1 | 245-247 |
| DOC_CKS1_1 | 248-253 | ||
| Aggregation hotspot | 241-250 | CLV_NRD_NRD_1 | 245-247 |
| DOC_CKS1_1 | 248-253 | ||
| MoRF | 282-298 | DEG_SCF_FBW7_1 | 275-282 |
| 277-282 | |||
| 287-294 | |||
| DOC_WW_Pin1_4 | 279-284 | ||
| 287-292 | |||
| DOC_USP7_MATH_1 | 291-295 | ||
| 293-297 | |||
| LIG_WD40_WDR5_VDV_2 | 290-295 | ||
| Region with multiplicity of binding modes | 316-323 | MOD_CK2_1 | 312-318 |
| DOC_ANK_TNKS_1 | 323-330 | ||
| Aggregation hotspot | 316-323 | MOD_CK2_1 | 312-318 |
| DOC_ANK_TNKS_1 | 323-330 | ||
| Aggregation hotspot | 345-353 | OC_USP7_UBL2_3 | 341-345 |
| 348-352 | |||
| 352-356 | |||
| DOC_USP7_UBL2_3 | 341-345 | ||
| 348-352 | |||
| 352-356 | |||
| TRG_NLS_Bipartite_1 | 345-361 | ||
| 346-261 | |||
| 347-361 | |||
| CLV_NRD_NRD_1 | 345-347 | ||
| CLV_PCSK_KEX2_1 | 345-347 | ||
| Region with multiplicity of binding modes | 345-353 | OC_USP7_UBL2_3 | 341-345 |
| 348-352 | |||
| 352-356 | |||
| DOC_USP7_UBL2_3 | 341-345 | ||
| 348-352 | |||
| 352-356 | |||
| TRG_NLS_Bipartite_1 | 345-361 | ||
| 346-261 | |||
| 347-361 | |||
| CLV_NRD_NRD_1 | 345-347 | ||
| CLV_PCSK_KEX2_1 | 345-347 | ||
| MoRF | 305-365 | DOC_USP7_UBL2_3 | 310-314 |
| 341-345 | |||
| 348-352 | |||
| 352-356 | |||
| 358-362 | |||
| OC_USP7_UBL2_3 | 341-345 | ||
| 348-352 | |||
| 352-356 | |||
| 368-362 | |||
| TRG_NLS_Bipartite_1 | 345-361 | ||
| 346-261 | |||
| 347-361 | |||
| DOC_USP7_MATH_1 | 334-338 | ||
| CLV_NRD_NRD_1 | 345-347 | ||
| CLV_PCSK_KEX2_1 | 345-347 |
Disclaimer/Publisher’s Note: The statements, opinions and data contained in all publications are solely those of the individual author(s) and contributor(s) and not of MDPI and/or the editor(s). MDPI and/or the editor(s) disclaim responsibility for any injury to people or property resulting from any ideas, methods, instructions or products referred to in the content. |
© 2024 by the authors. Licensee MDPI, Basel, Switzerland. This article is an open access article distributed under the terms and conditions of the Creative Commons Attribution (CC BY) license (http://creativecommons.org/licenses/by/4.0/).


