1. Introduction
Due to the characteristics of stable transmission performance, good insulation performance, high temperature resistance, easy laying and simple operation and maintenance, power cables have been widely used in the power grid. However, the layout of power cables is mostly in the form of tunnels, channels, pipes and direct burial [
1]. The layout of these cables brings much inconvenience to the prediction and maintenance of power cable faults [
2]. The insulation medium of the cable is easy to be damp in the ground, and the ability of ventilation and heat dissipation is poor. This will reduce the insulation performance of the cable. In addition to natural reasons, some artificial reasons, such as artificial destruction of the cable and installation of non-standard operation, will also cause the cable failure [
3]. Therefore, it is very important to carry out the detection of cable aging, defects and faults.
The cable detection methods are mainly divided into offline detection methods and online detection methods. Offline detection methods include dielectric loss factor test, partial discharge test, DC voltage test, AC voltage test, etc. Online monitoring methods include DC superposition method, DC component method, AC superposition method, etc [4–6]. All these methods are based on the detection of current and discharge phenomena caused by the electric field, which have two obvious shortcomings. On the one hand, in the cable test, it is necessary to add measurement equipment and modify the grounding system, which will destroy the operating state of the cable system. On the other hand, the detection signal is easily interfered with by external environmental factors, and the detection signal is easily overwhelmed. Therefore, the new sensor and detention methods are increasingly required for the easy and fast monitoring of the cable system.
Because of its own nature and working conditions, the power cable will produce a magnetic field around its daily work. As magnetic field sensors have the advantages of high accuracy, high sensitivity and wide detection depth [
7], it is proposed to apply the magnetic field detection method in the monitoring and evaluation of power cable systems. However, up to now, there is no suitable magnetic field sensor for power cable detection. Therefore, this paper optimizes the design and development of the magnetic field detection sensor for AC power cables. The influencing factors of coil quality and noise were analyzed to determine the parameters of the coil. In this paper, the amplifying circuit based on negative flux feedback is designed by using Multisim, and the hardware of the sensor is designed and assembled. After that, this paper sets up an experimental circuit for sensitivity testing, and the experimental results show that the magnetic field sensor designed in this paper can achieve high sensitivity. The sensor designed in this paper has the advantages of small size, high sensitivity, ease of carry and high reliability, which is of great significance for maintaining the stable operation of power cables and finding and repairing power cable faults in time, which is of great significance for maintaining the stable operation of power cable, promptly discovering and repairing power cable faults.
2. Principle of Magnetic Field Sensor
Magnetic field measurement involves a wide range, and there are many measurement methods corresponding to different physical principles. Currently, there is a wide range of measurement methods in industrial applications, which can be roughly divided into: the magnetic torque method, fluxgate method, electromagnetic induction method, electromagnetic effect method and magneto-optical effect method, as shown in
Table 1 [
8,
9,
10,
11,
12].
The magnetic field around the power cable is a medium-low intensity magnetic field [
13]. For the method of measuring medium-low intensity magnetic field, the magnetic saturation method is suitable for low-frequency or constant magnetic fields, while the magneto-optical effect method requires very high instrument manufacturing processes. As a kind of electromagnetic induction mode, inductive sensor has the advantages of simple working principle, simple manufacture and installation, relatively small volume, and much lower production cost than the magneto-optic effect. It can be seen that the magnetic field measured by the electromagnetic induction is less than 0.1 T, which can be used to measure alternating magnetic field and weakly varying magnetic field.
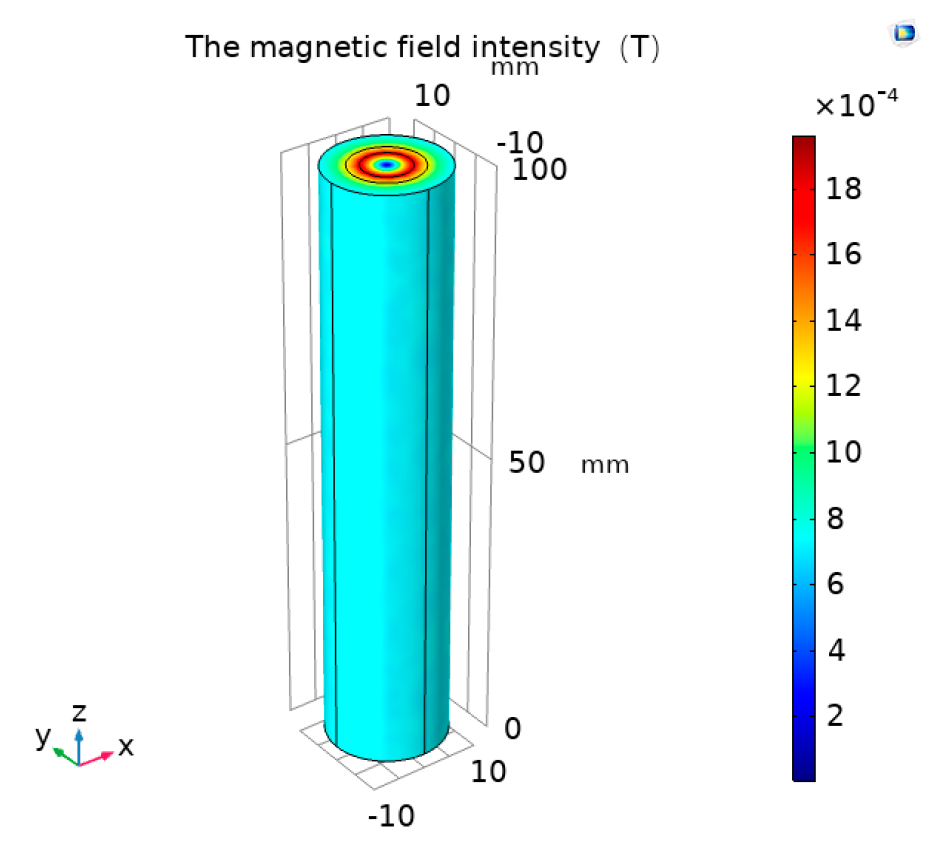
Using COMSOL, a single-phase cable model was established. Applying an alternating current with an effective value of 200 A in the cable, the distribution diagram of the magnetic field strength of the cable is shown in
Figure 1. It can be seen that the intensity of the cable magnetic field is on the order of -4. When the current passing through the cable is tens of amperes, the magnetic field in the cable is on the order of -5. Therefore, the electromagnetic induction method is chosen as the basic designing principle of magnetic field sensor [
14].
The design of the magnetic field sensor in this paper is divided into three parts: magnetic core, induction coil and amplifier circuit, as shown in
Figure 2.
3. Design of Magnetic Core
The design of the magnetic core mainly considers two aspects: the selection of the magnetic core material and the determination of the geometric size of the magnetic core.
3.1. Selection of Magnetic Core Material
Loss is an important index to evaluate the properties of a magnetic material. There are two main ways of core loss: hysteresis loss and eddy current loss. The hysteresis loss is caused by the energy consumed by changing the direction of the magnetic moment in the domain. Eddy current loss is usually divided into two parts: one is called classical eddy current loss and the other is called residual loss.
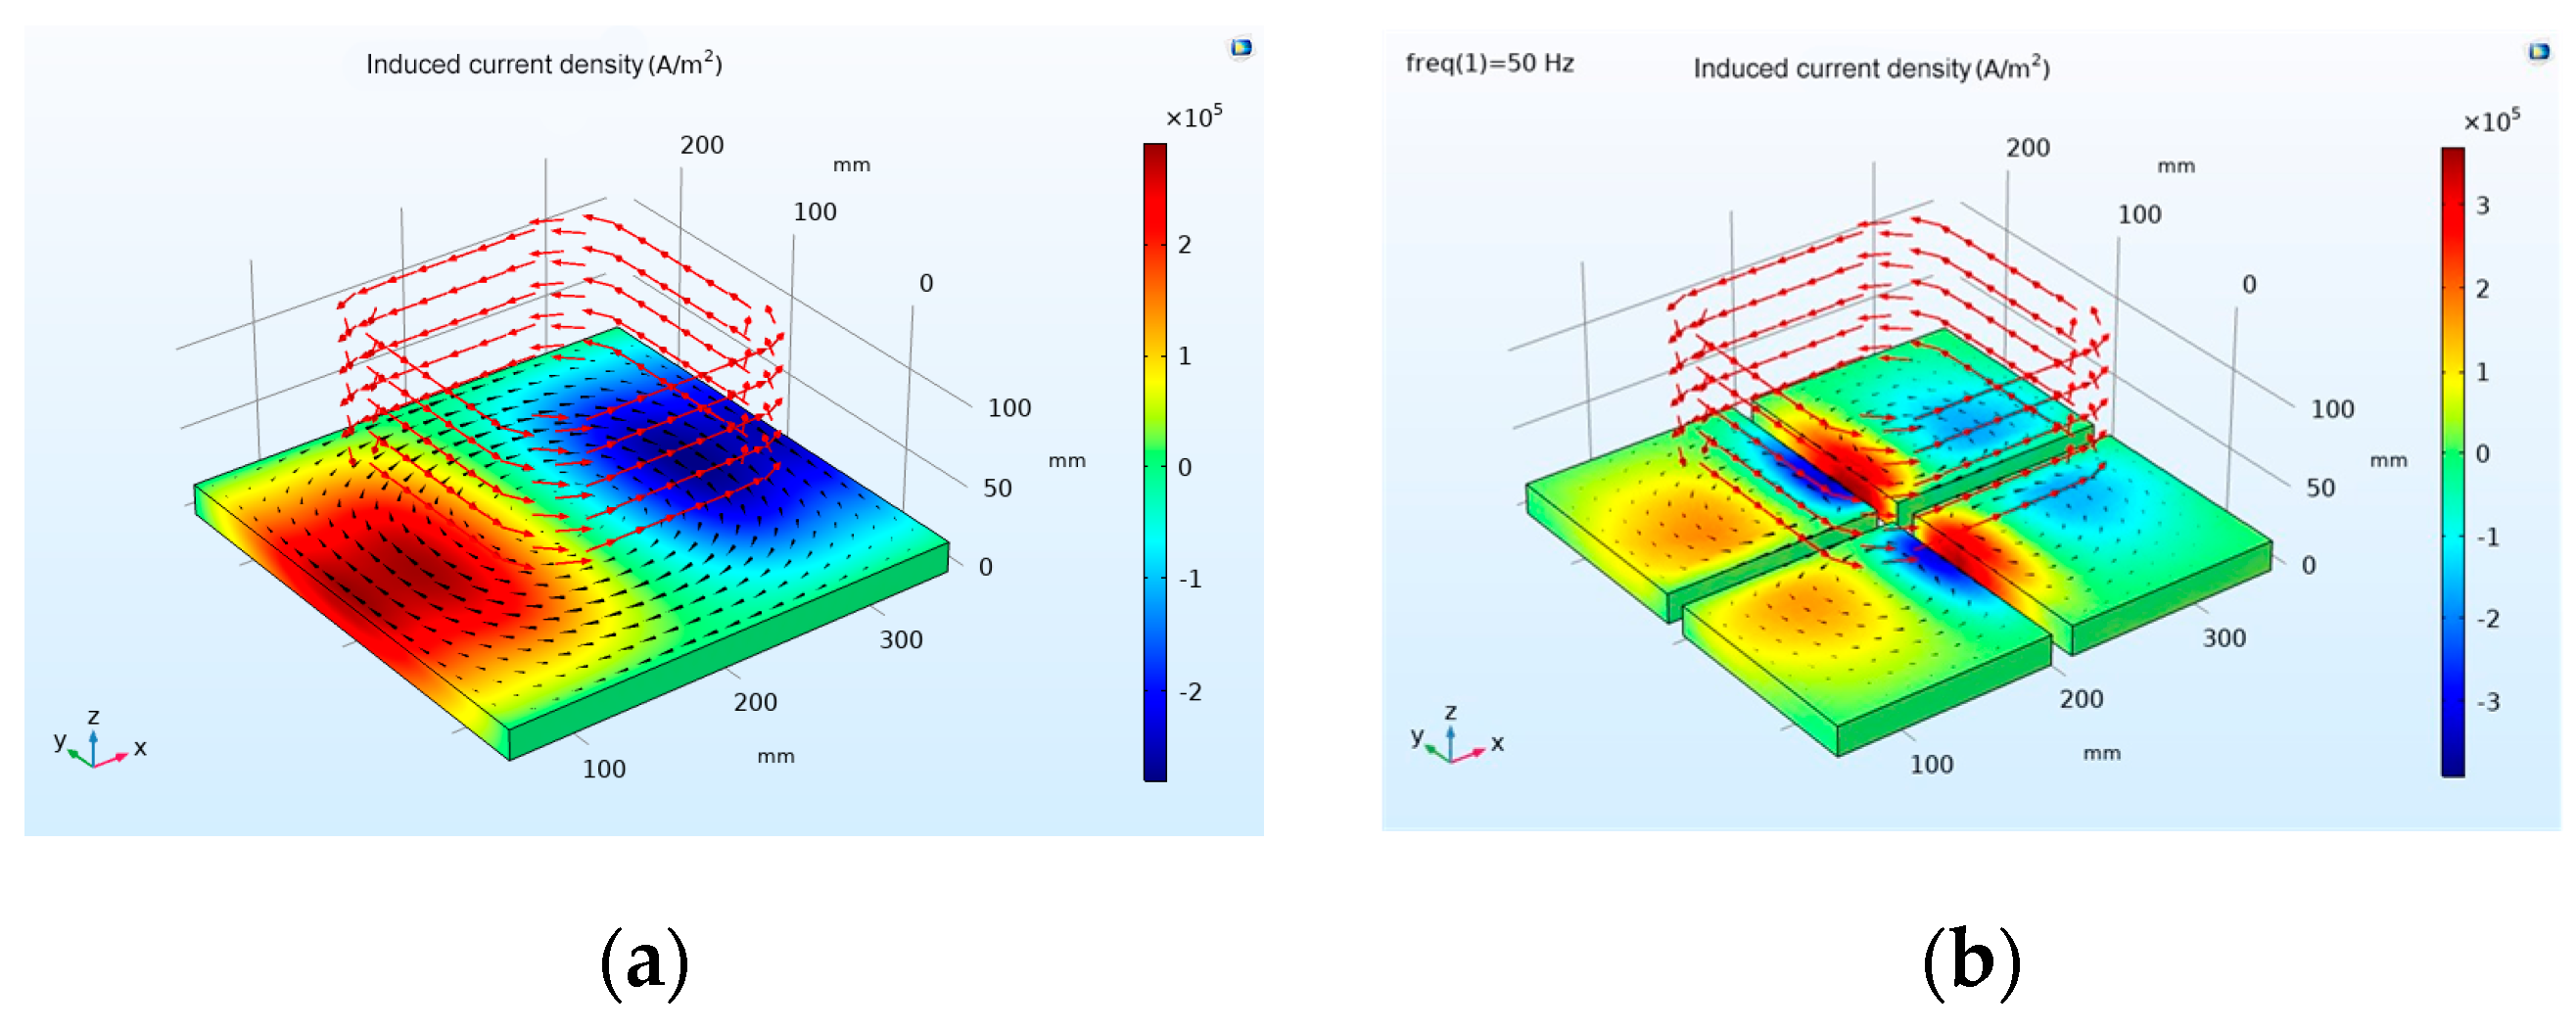
A model for simulating eddy current generation is established in COMSOL, as shown in
Figure 3(a), where above the aluminum plate is a multi-turn coil. The number of turns of the coil is 2472 turns, and a current with an amplitude of 1A and a frequency of 50Hz is passed into each turn, and the current is sinusoidal. When an AC is passed through the coil, an induced eddy current and an induced magnetic field will be generated on the aluminum plate. The aluminum plate in
Figure 3(a) is divided into four parts and then simulated, and the eddy current effect in the conductor is shown in
Figure 3(b).
The size of the magnetic core determines the sensitivity of the sensor. The material of the magnetic core plays a role in converging magnetic flux and increasing the induced voltage. The application frequency band of the induction magnetic sensor to be designed is 10-500Hz, the operating temperature is -40°C-125°C, and the magnetic induction intensity is less than 1mT. Therefore, the requirements for the magnetic core are as follows: the saturation magnetic induction strength can be on the order of T; the low coercive force is to reduce hysteresis loss; the permeability has high stability to temperature and frequency; the low resistivity is to reduce eddy current losses; the frequency range is moderate, including the frequency band of the sensor; the relative permeability is above 104.
Table 2 gives the typical parameters for several materials [
15,
16,
17,
18,
19]. The resistivity of Permalloy is not much different from that of amorphous or nanocrystalline alloys. However, Permalloy has lower coercive force and high saturation magnetic field strength. Compared to amorphous alloys and nanocrystalline alloys, Permalloy thin ribbons are softer and easier to make laminated magnetic cores, and they are cheaper. Therefore, Permalloy was selected as the core material.
3.2. Determination of Magnetic Core Parameters
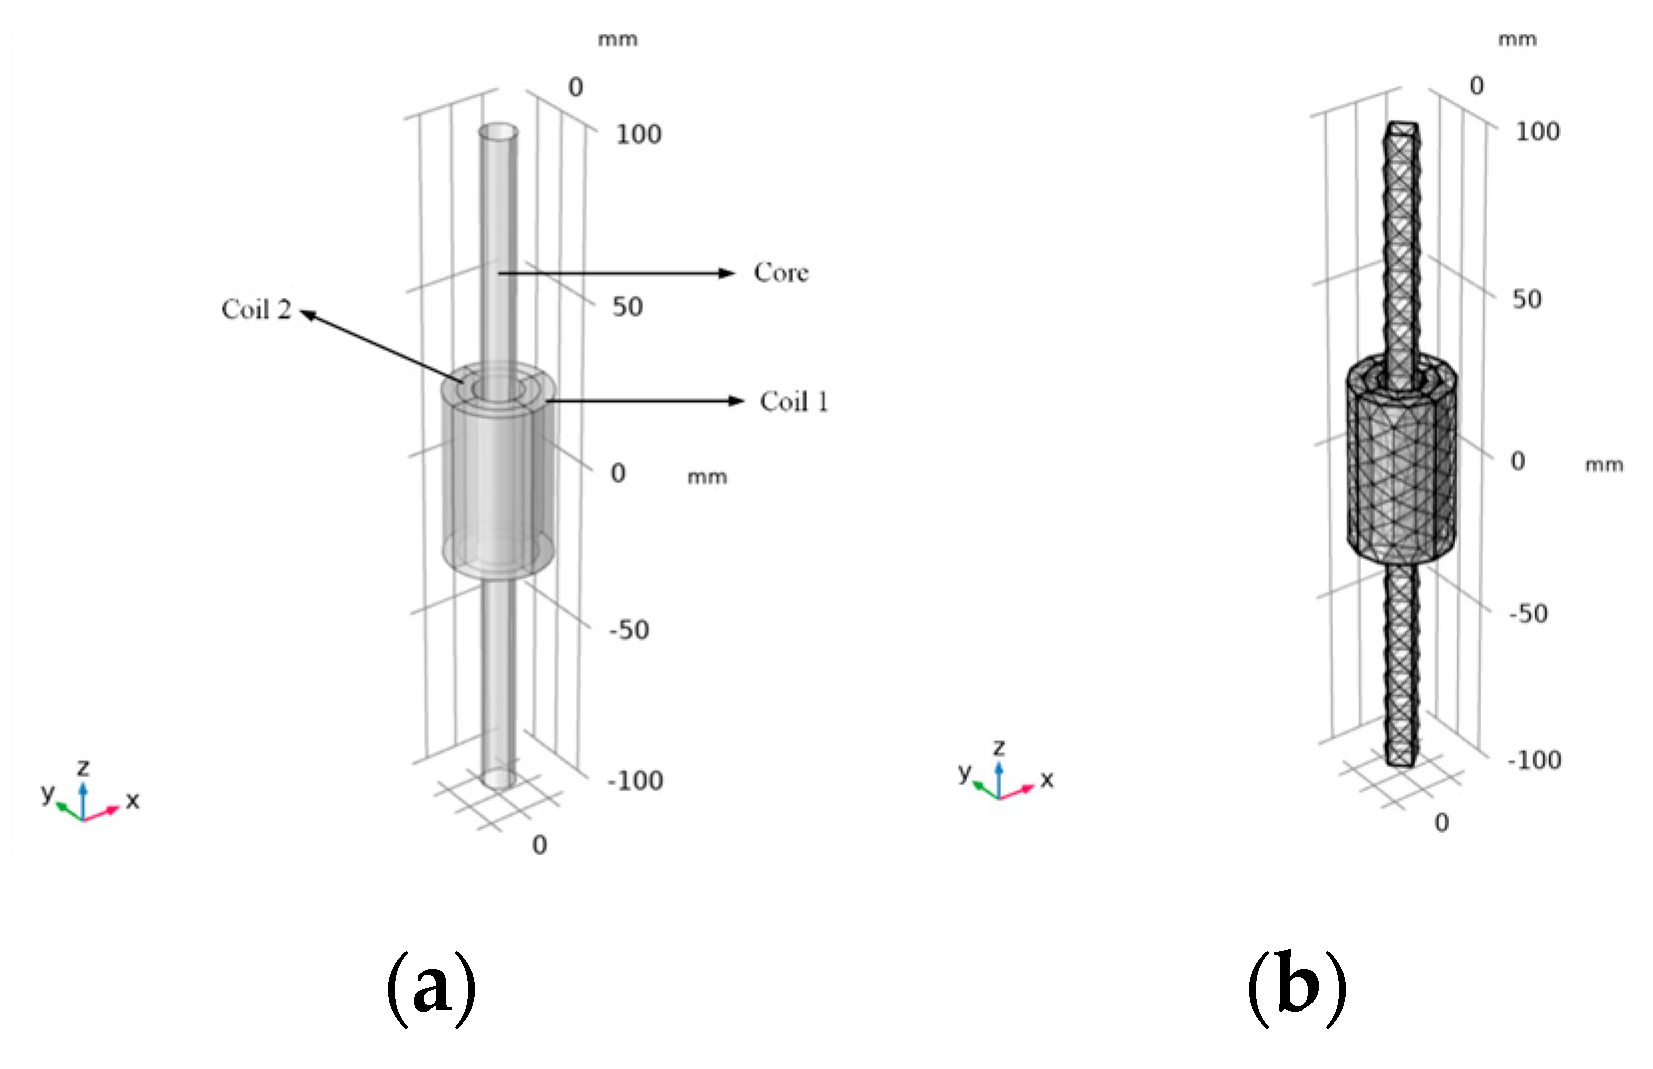
As shown in
Figure 4, the model of the magnetic core and coil is established by COMSOL. This model considers the nonlinear
B-H curve of the magnetic core and calculates the spatial distribution of magnetic and electric fields, the magnetic saturation effects, and the transient response. Coil 1 and coil 2 are simulated using the “coil” feature. The external circuit of coil 1 and coil 2 is connected to the AC voltage source and the resistor through the “circuit” interface. The “coil geometry analysis” research step is used to calculate the current in the coil. By adding a “transient” study, the voltage and current in coil 1 and coil 2 are determined. The coil 1 is connected to an external AC power source and a resistor, and its role is to generate a changing magnetic field. Due to the generation of the AC magnetic field, an induced potential will be generated across the coil 2. The coil 2 is externally connected to a resistor, and the output voltage of the coil is represented by the voltage across the resistor. The magnetic core can limit the magnetic field to the middle of the coil to the greatest extent [
20].
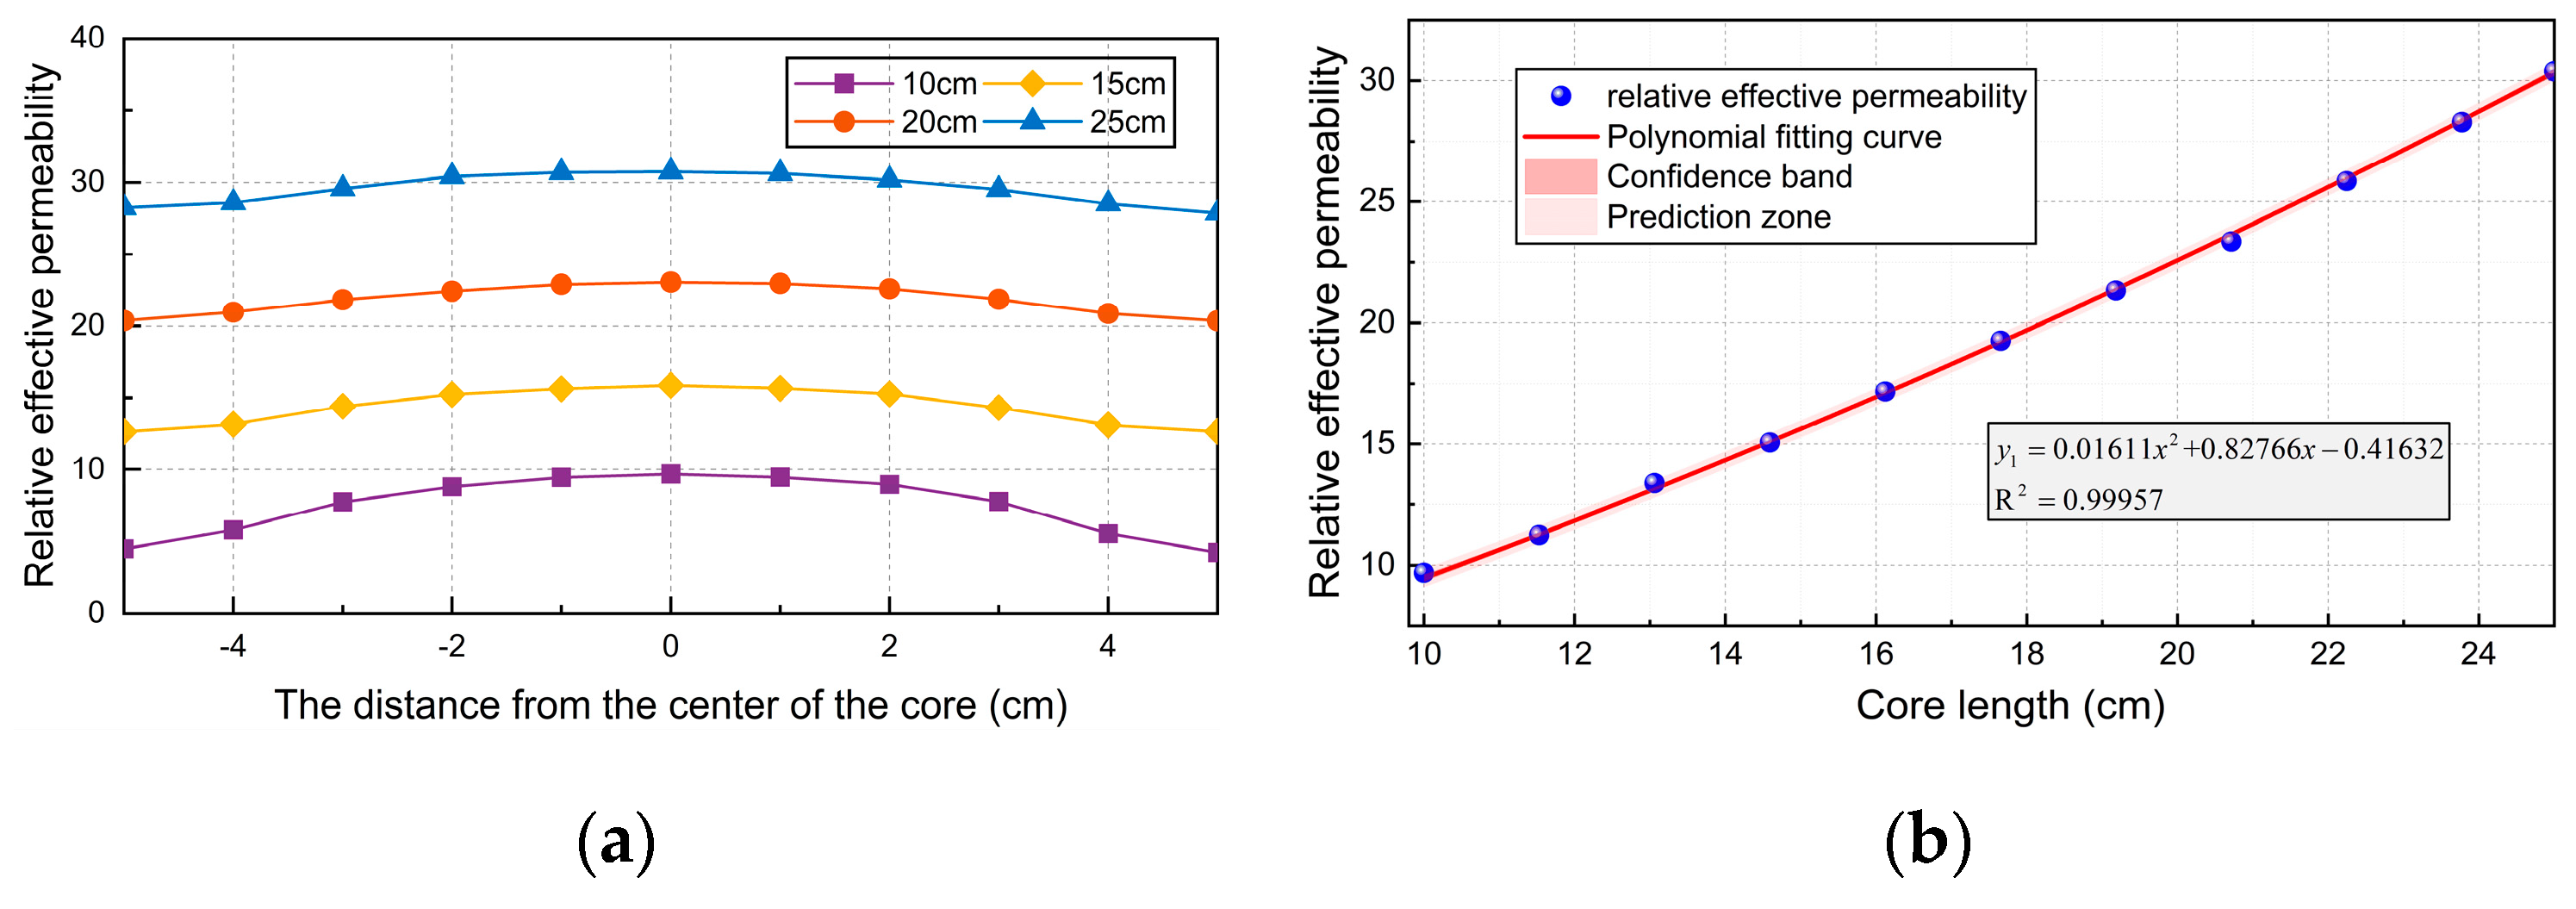
The influence of core length on the performance of the sensor is studied by establishing the simulation model of four cylindrical cores. The radius of the core is 2cm, and the length is 10, 15, 20 and 25cm respectively. The relationship between the relative effective permeability of each length of the core and its position in the core is shown in
Figure 5(a).
Figure 5(b) shows the relationship between the relative effective permeability of the geometric center of the core and the length of the core.
When the material is magnetized by the external magnetic field, the expression of the demagnetization field is [
21]:
The
B of the material can be expressed as:
The demagnetization factor
Nd can be expressed as:
The relative effective permeability
μapp is:
The material of the core needs to have high permeability, so
μ/
μ0 is much greater than 1, and the equation can be expressed as:
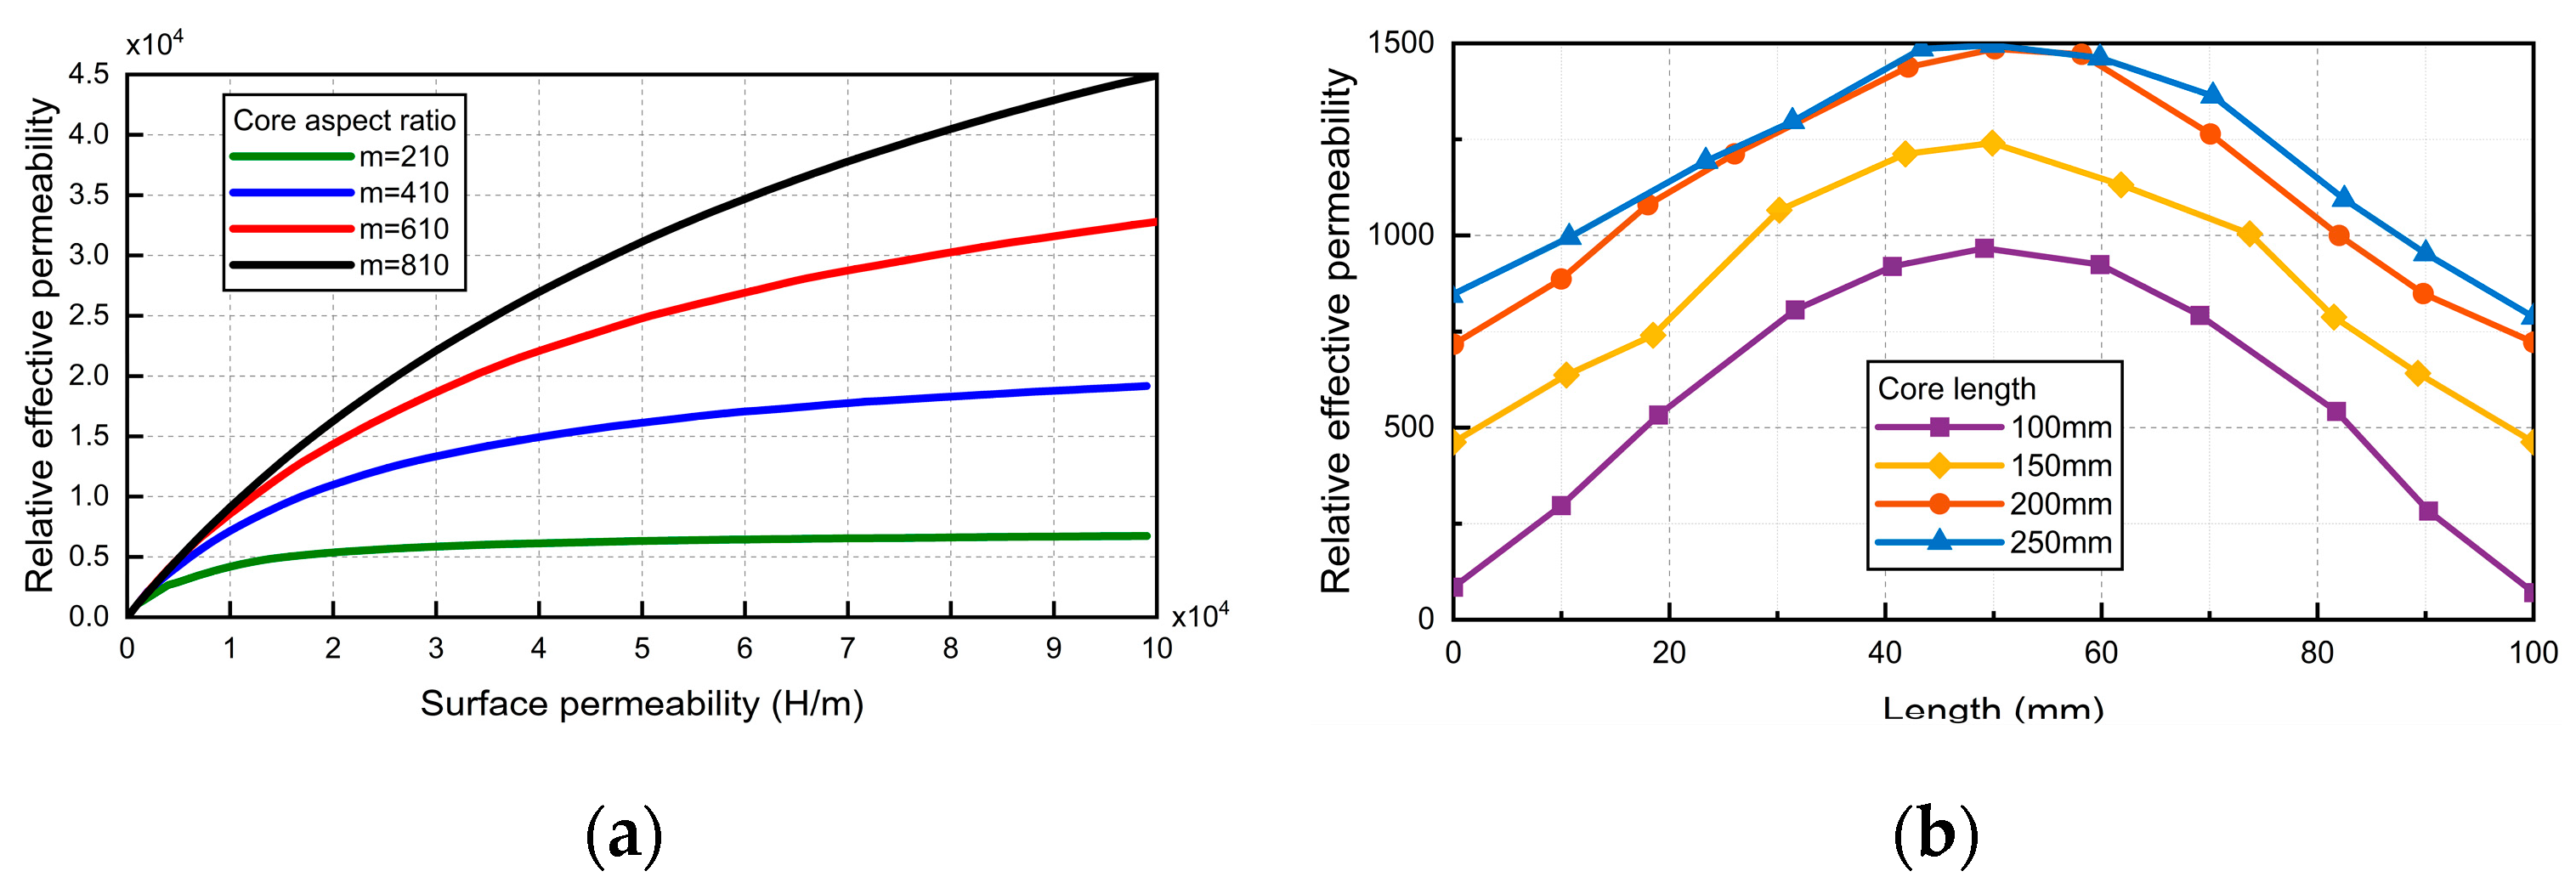
Figure 6(a) shows the relationship between the effective permeability, aspect ratio and surface permeability of the core. Through comparison, it can be determined that permalloy is the best choice as the core material of the sensor.
The sensor simulation model is established in COMSOL. When the core diameter is set to 10mm, the length of the core is constantly changing, as shown in
Figure 6(b). It can be seen that the longer the core is, the greater the relative effective permeability is. When it increases to 200mm, the effective permeability no longer increases with the increase of core length. Therefore, the optimum aspect ratio of the core is 20.
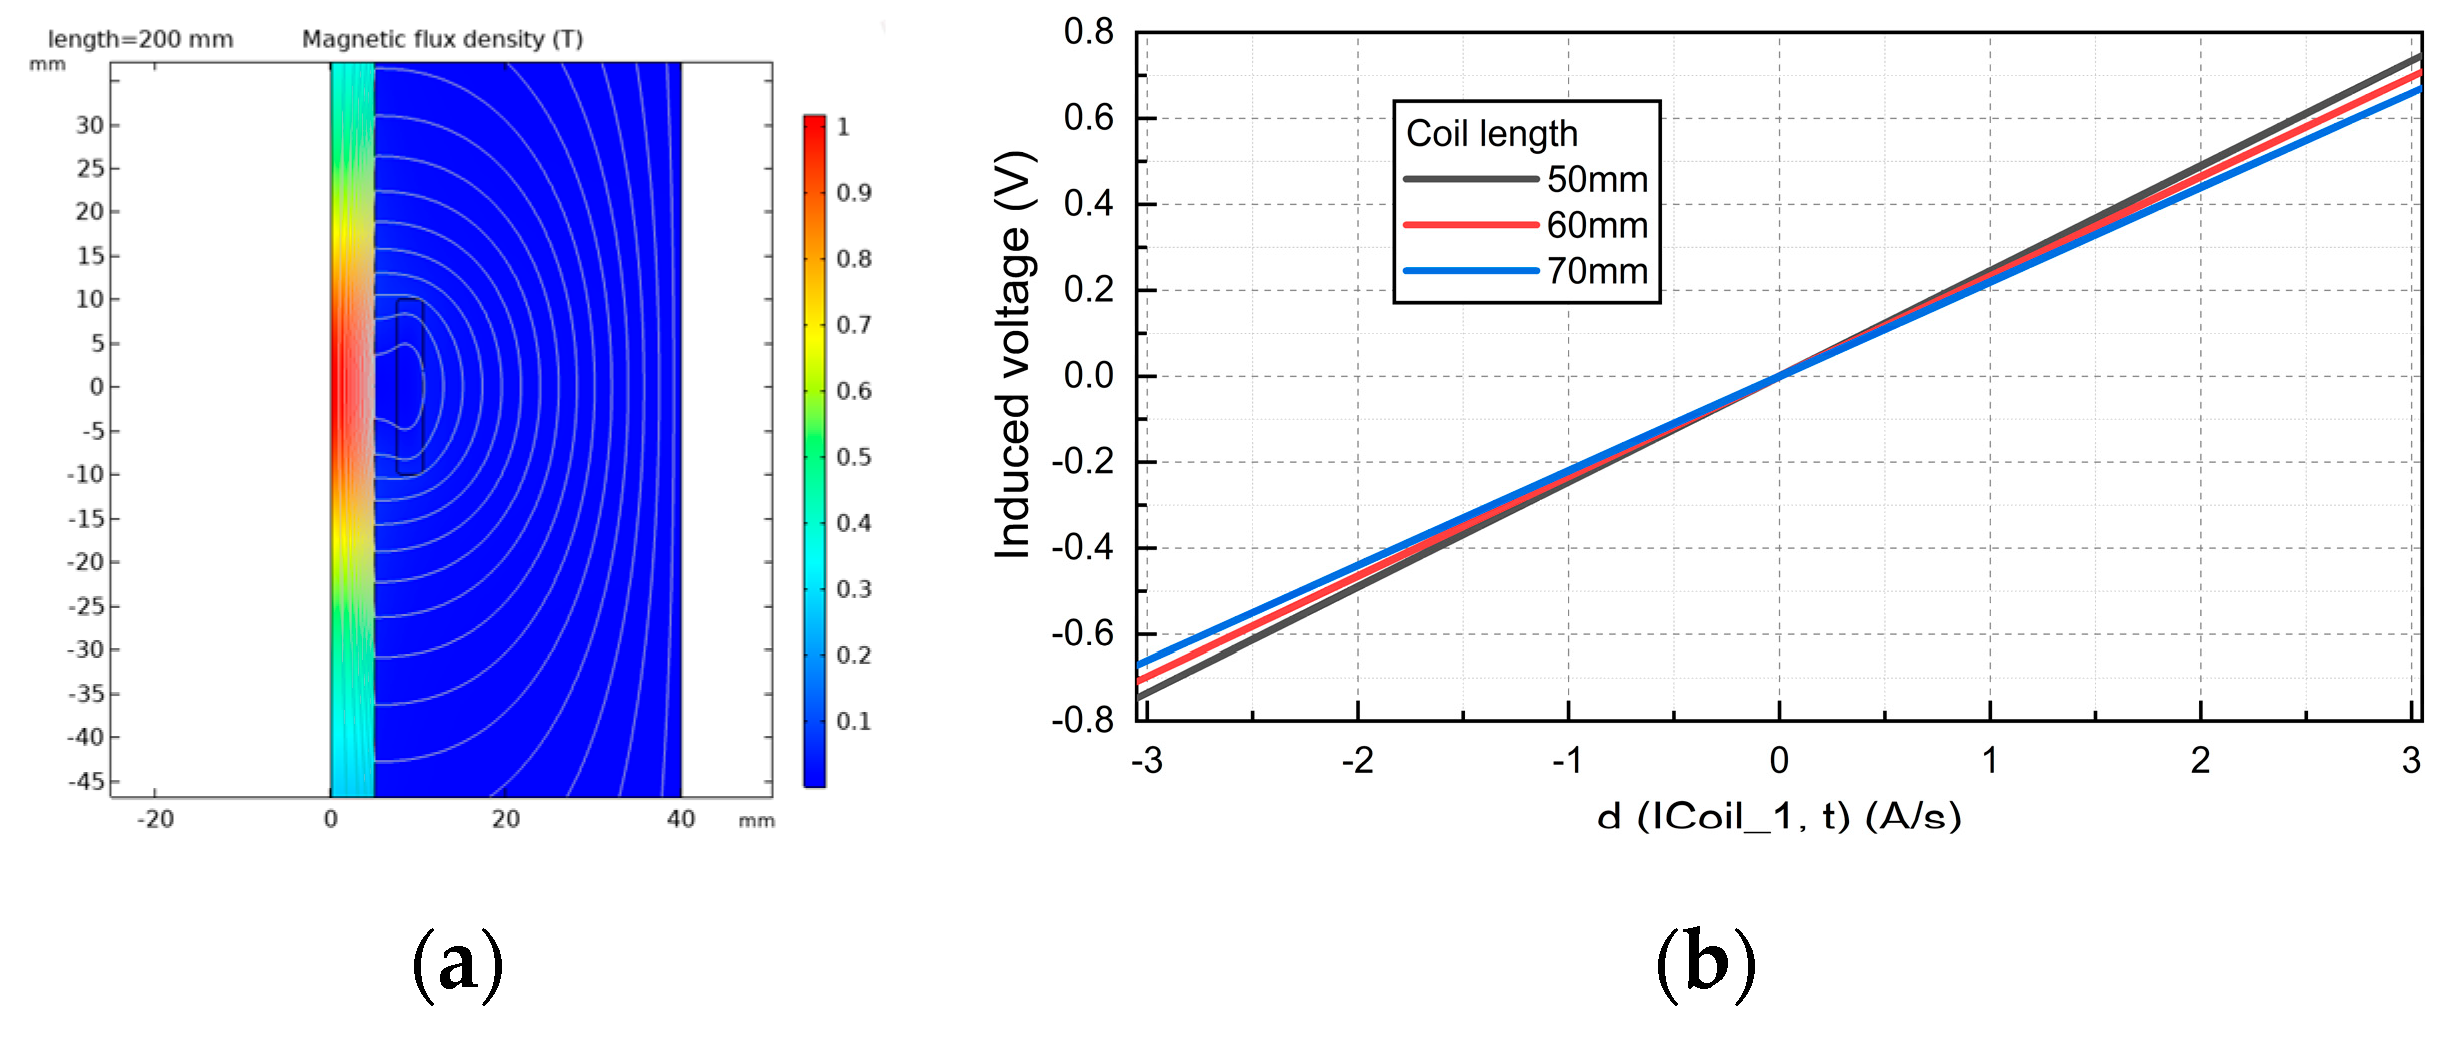
When the core length is equal to 200mm, the magnetic field distribution in the core is shown in
Figure 7(a). The results show that the magnetic induction intensity at the center of the core is the highest and the sensitivity is the highest. Therefore, to avoid the edge effect, the length of the coil should be less than the length of the magnetic core. However, the length of the coil should not be too short, because the length of the copper wire with the same number of coils will be longer, thus making the DC impedance higher. The longer the length of the coil, the greater the noise and the greater the interference to the output signal. Therefore, it is necessary to choose an appropriate coil length to ensure the excellent performance of the sensor.
The effect of the ratio of coil length to core length on the inductive magnetic field sensor is shown in
Figure 7(b). The simulation results show that to obtain a larger induction voltage, the induction coil should be distributed near the center of the magnetic core. Taking a magnetic core with a diameter of 10mm and a length of 200mm as an example, at a distance from the center of the core ±33mm, the magnetic field intensity of the core is reduced by about 7% to the maximum value, and the sensitivity of the sensor also meets the requirements. Therefore, the induction coil is distributed at the center of the magnetic core, and the ratio of the length of the magnetic core to the length of the induction coil is 0.3.
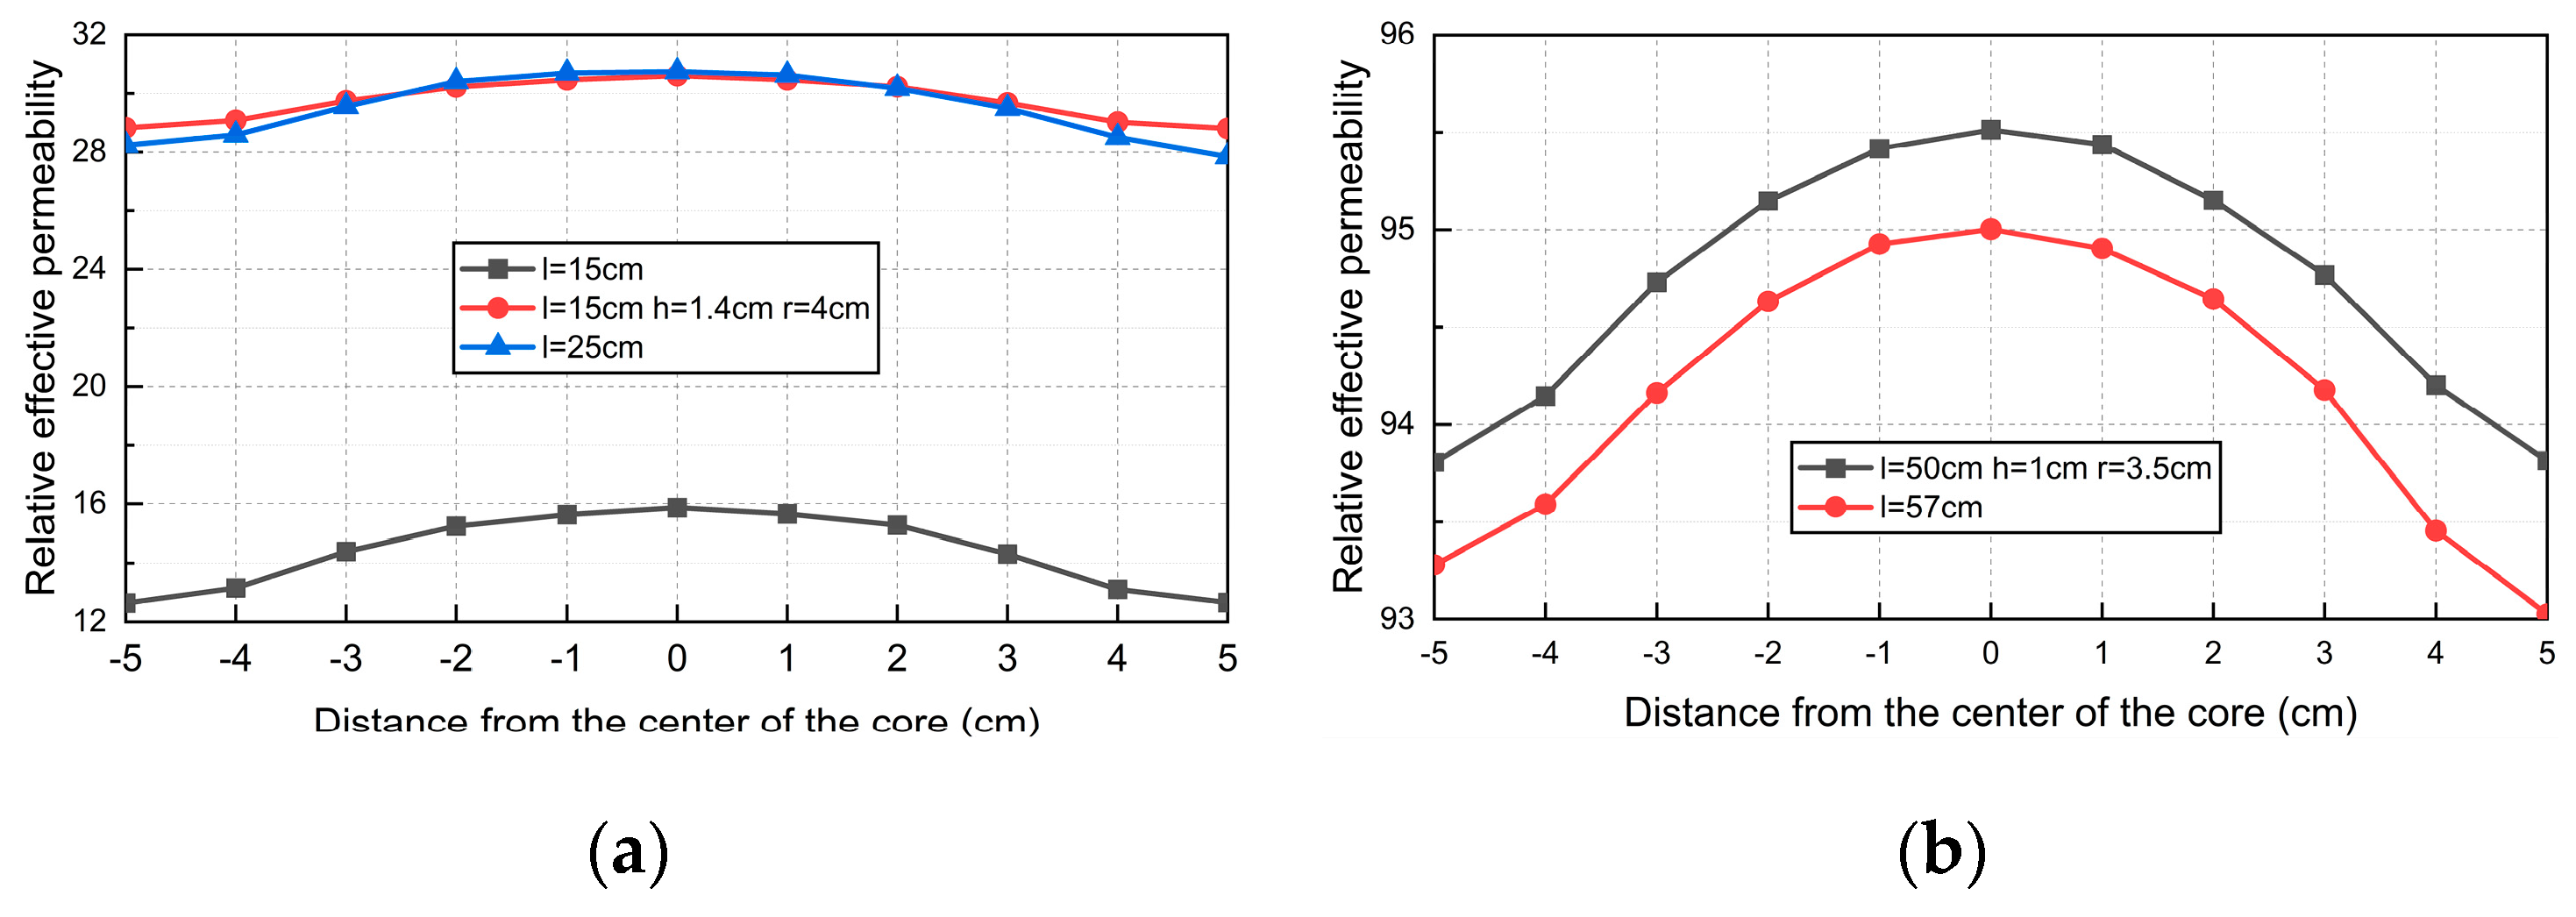
A preliminary conclusion can be drawn from
Figure 8 that when the length of the core Is small or the length-diameter ratio of the core is small, the efficiency of adding the flux collector to increase the effective permeability of the core is not high; when the length of the core reaches a certain value, the efficiency of adding flux collector is higher.
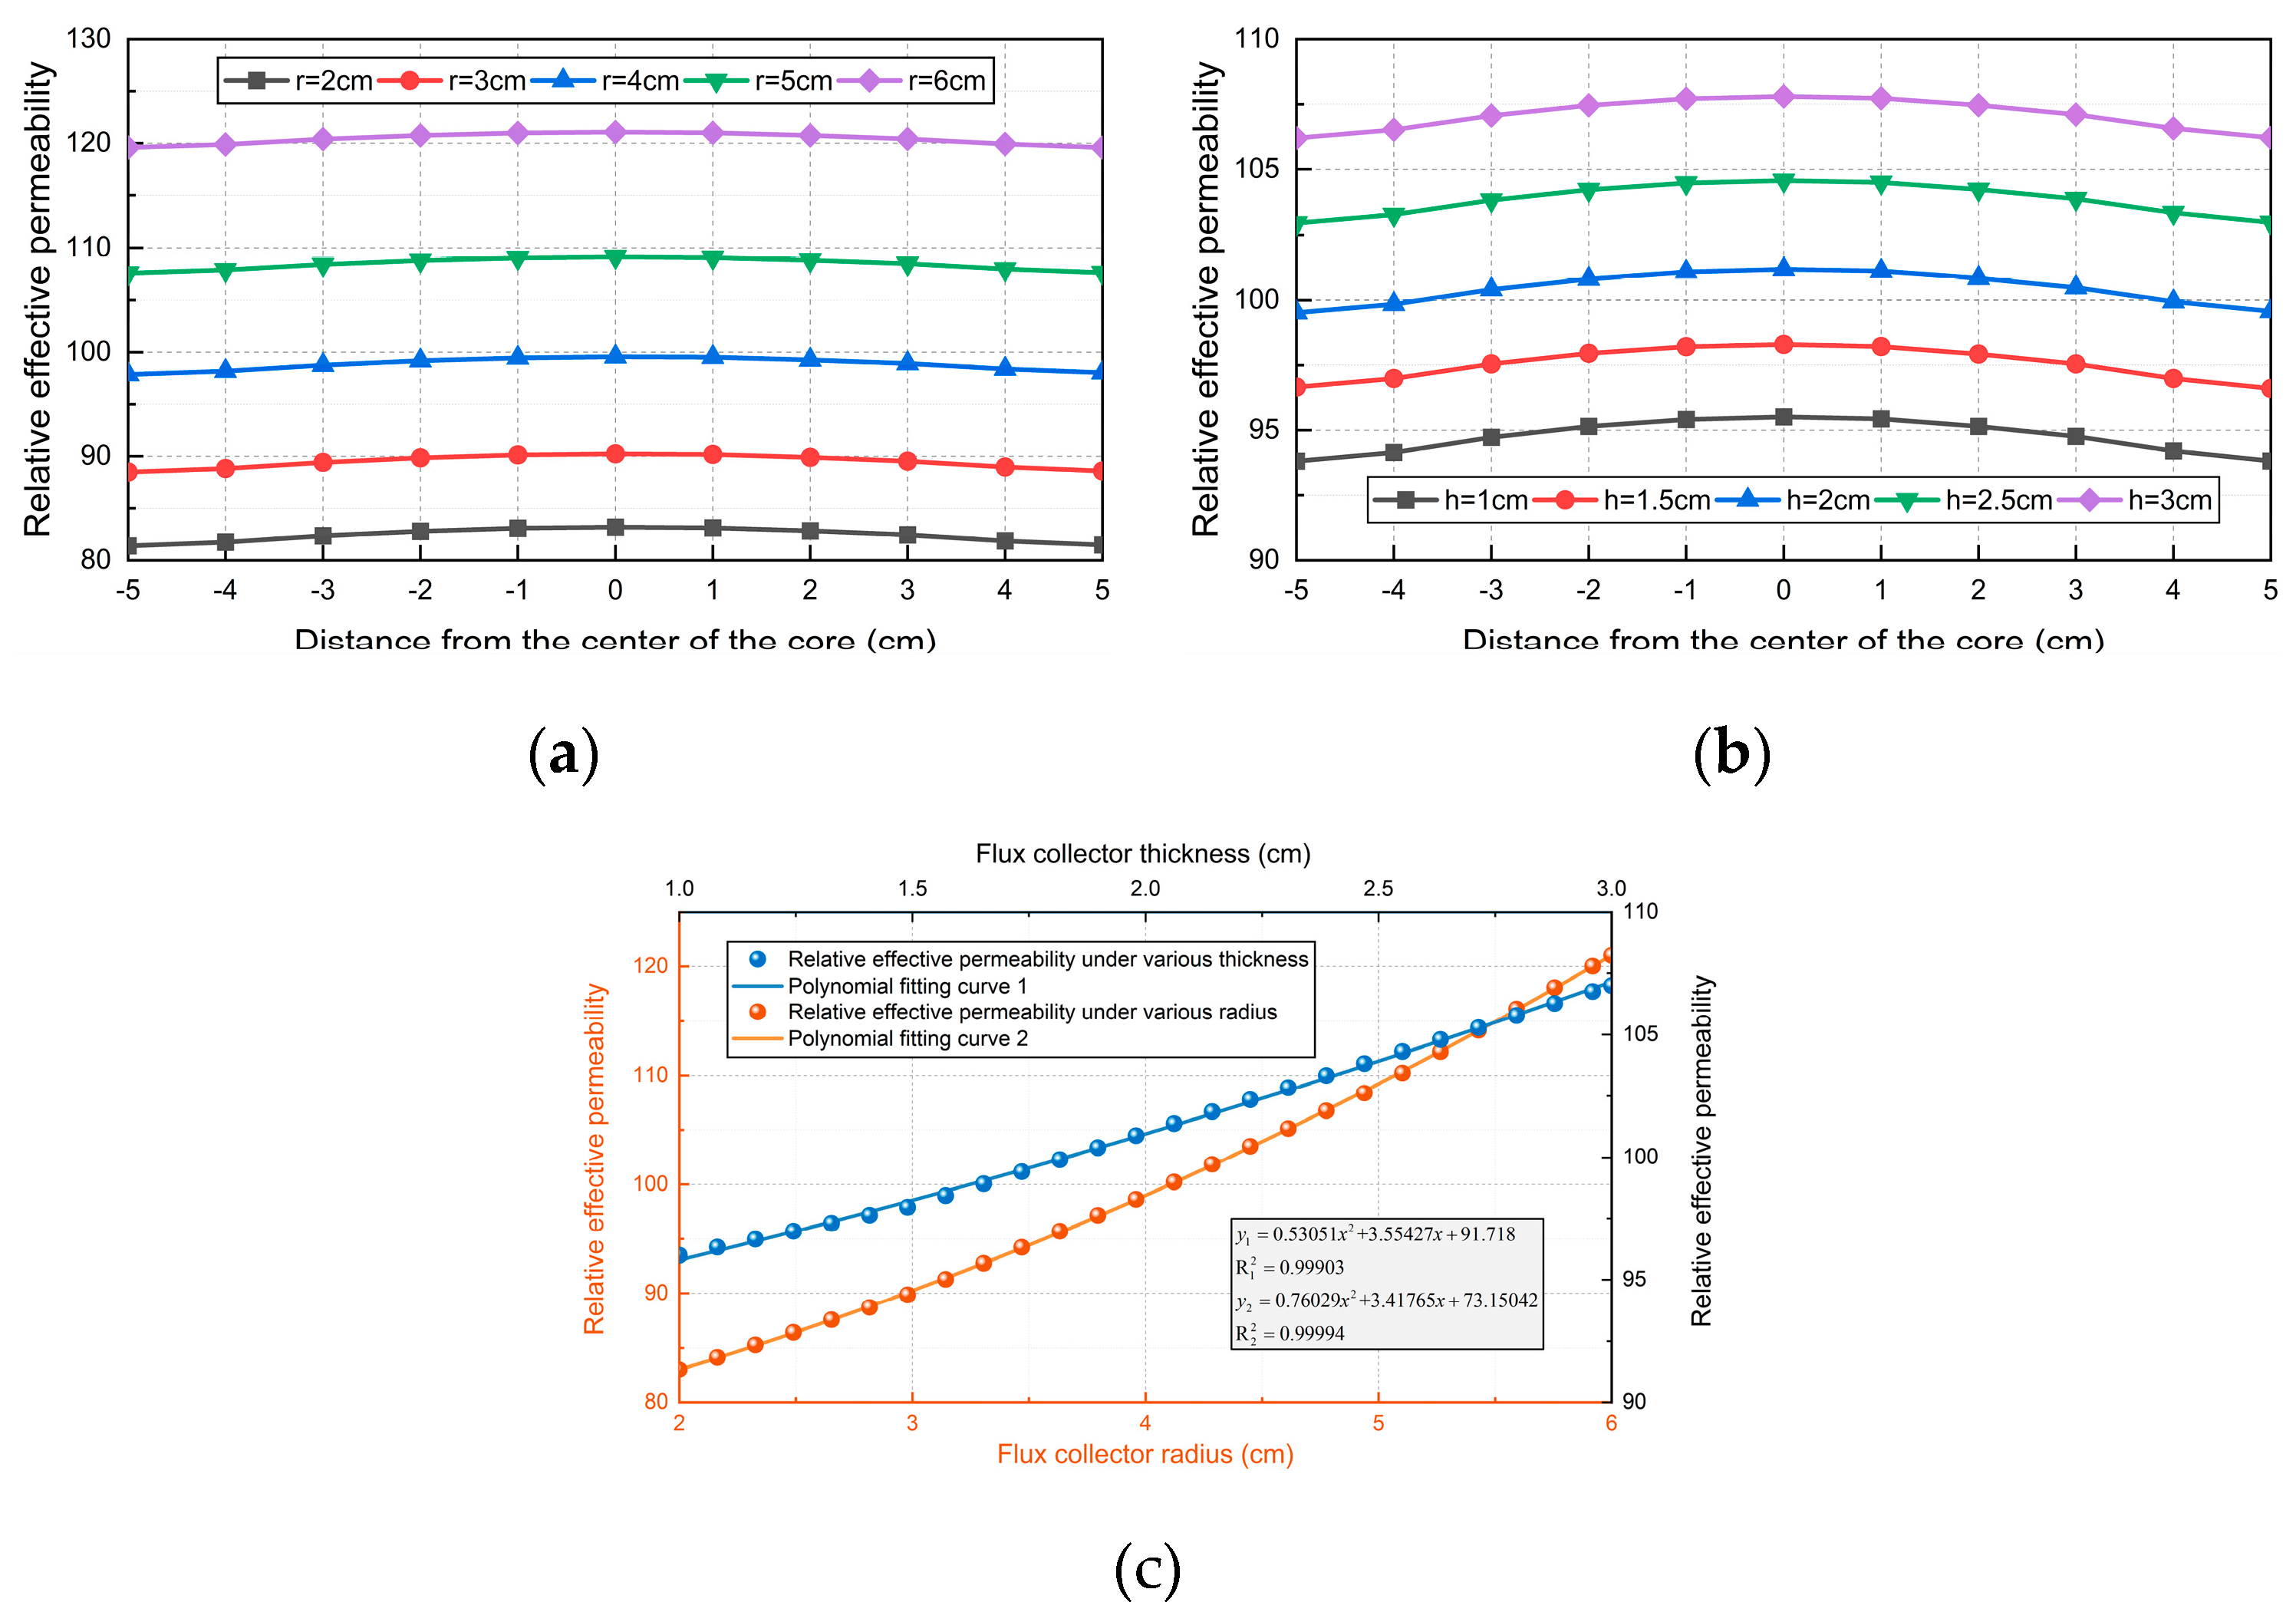
When the radius
r of the flux collector is constant and the thickness
h is different, the relative effective permeability of the core axis is shown in
Figure 9(a). With the increase of the thickness of the flux collector, the relative effective permeability of the core will increase. As shown in
Figure 9(d), the relative effective permeability of the core increases with the increase of the thickness of the trap.
When the thickness
h of the flux collector is a certain value and the radius
r is different, the relative effective permeability distribution is shown in
Figure 9(b). We can see that when
r increases at equal intervals, the rate of increase of relative effective permeability will gradually increase. The fitting curve is shown in
Figure 9(c), the relative effective permeability increases in a parabola with the increase of the radius of the collector.
4. Design of Induction Coil
4.1. Resistance and Inductance of Induction Coil
Loss is an important index to evaluate the properties of a magnetic material. There are two main ways of core loss: hysteresis loss and eddy current loss. The hysteresis loss is caused by the energy consumed by changing the direction of the magnetic moment in the domain. Eddy current loss is usually divided into two parts: one is called classical eddy current loss and the other is called residual loss.
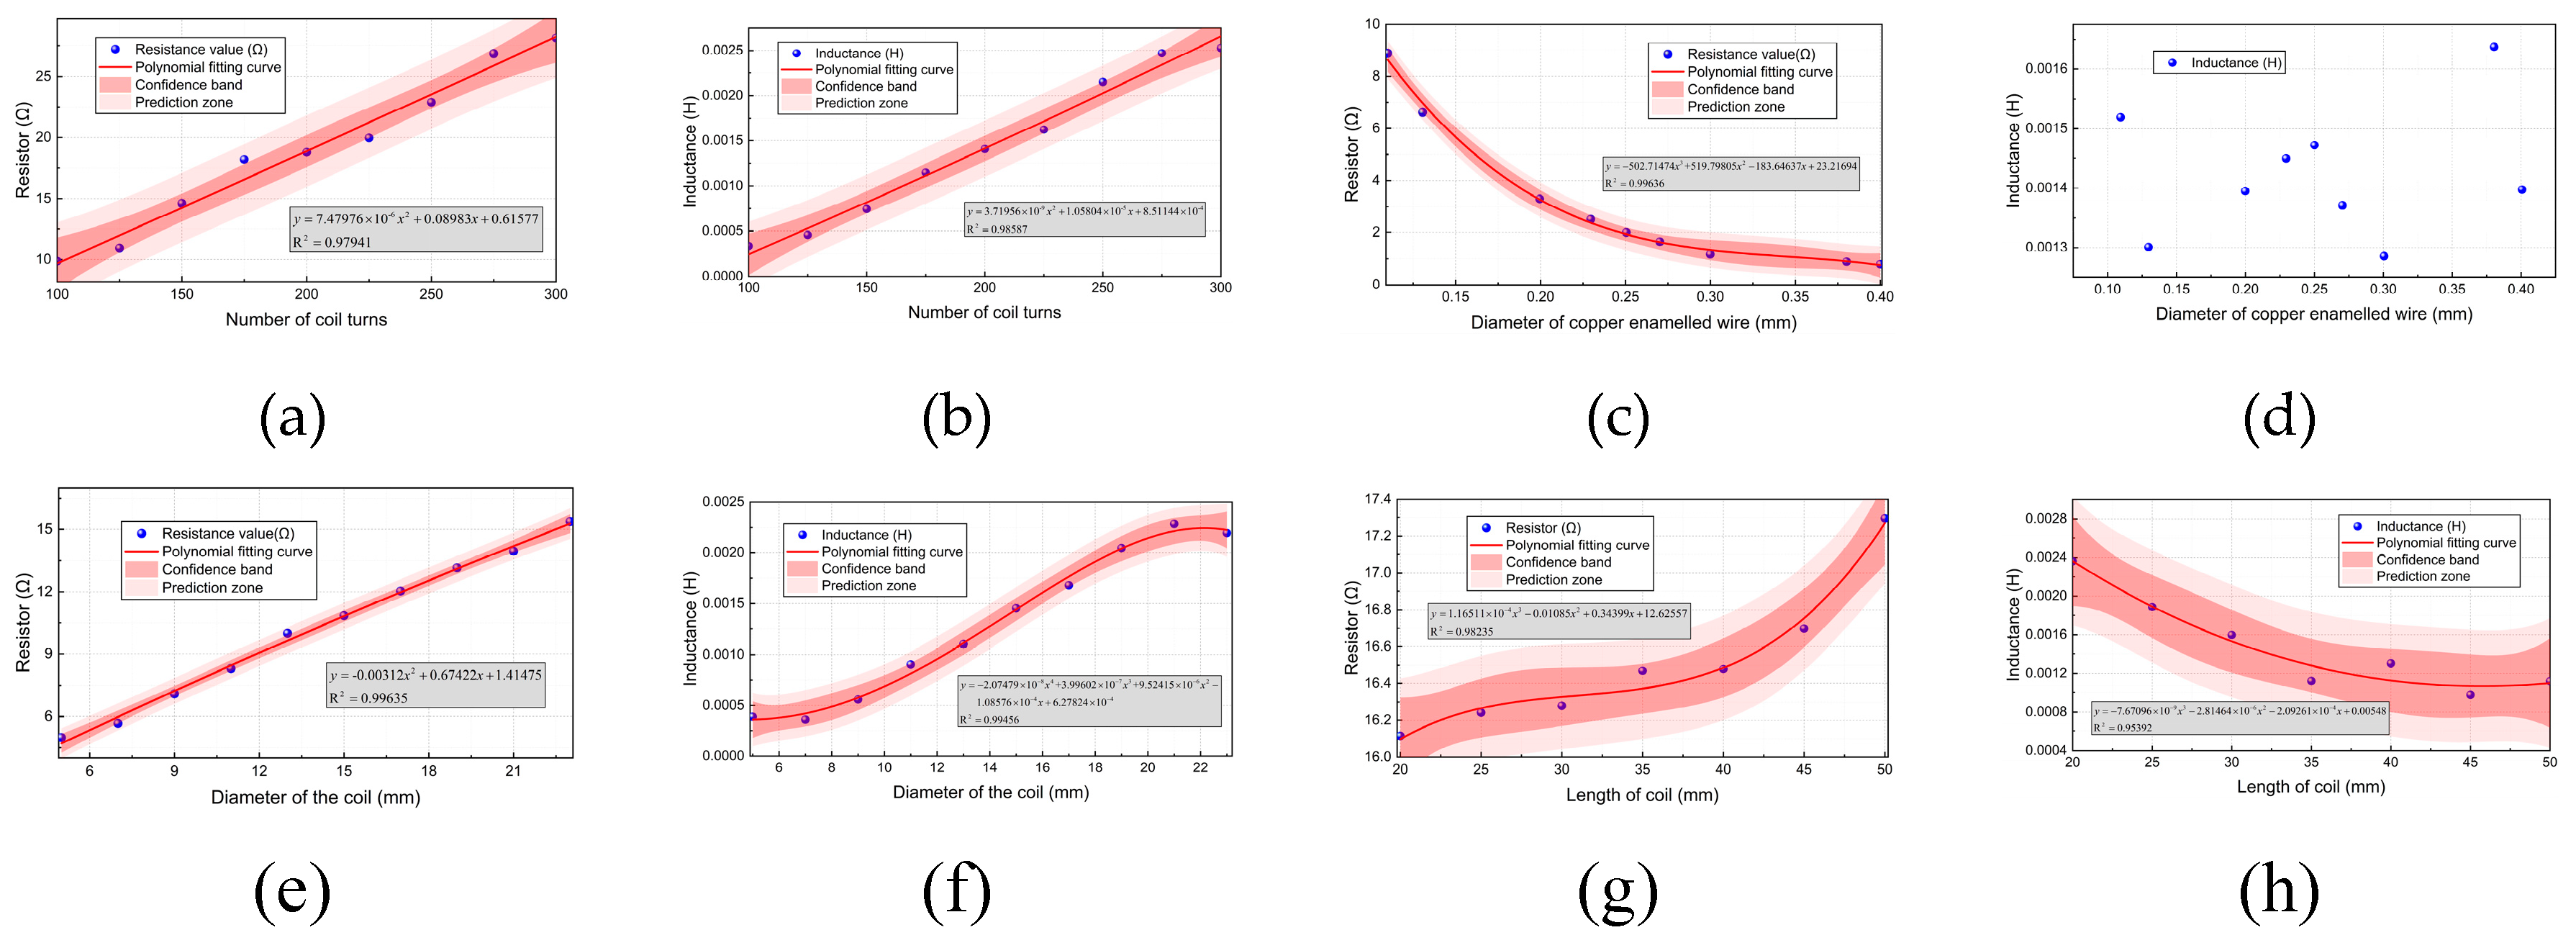
As shown in
Figure 10, the effects of coil turn, copper enameled wire diameter, coil diameter and coil length on coil resistance and inductance are analyzed by experiment.
The number of turns, coil radius and coil length will affect the coil inductance, and the diameter of copper enameled wire will not affect the change of coil inductance. The simplified formula of coil inductance can be obtained:
4.2. Noise Analysis of Magnetic Field Sensor
Loss is an important index to evaluate the properties of a magnetic material. There are two main ways of core loss: hysteresis loss and eddy current loss. The hysteresis loss is caused by the energy consumed by changing the direction of the magnetic moment in the domain. Eddy current loss is usually divided into two parts: one is called classical eddy current loss and the other is called residual loss.
Reducing noise can improve the detection accuracy and sensitivity of the sensor. The average spectral density of equivalent magnetic field noise can be written as [
22]:
The minimum magnetic field that can be detected by the magnetic field sensor can be determined by the formula (10). The noise expressed in formula (10) can be regarded as white noise [
23]:. According to this assumption, it is reasonable to ignore the noise of
1/f. Therefore, it can be simplified to:
The resistance thermal noise produced can be expressed as:
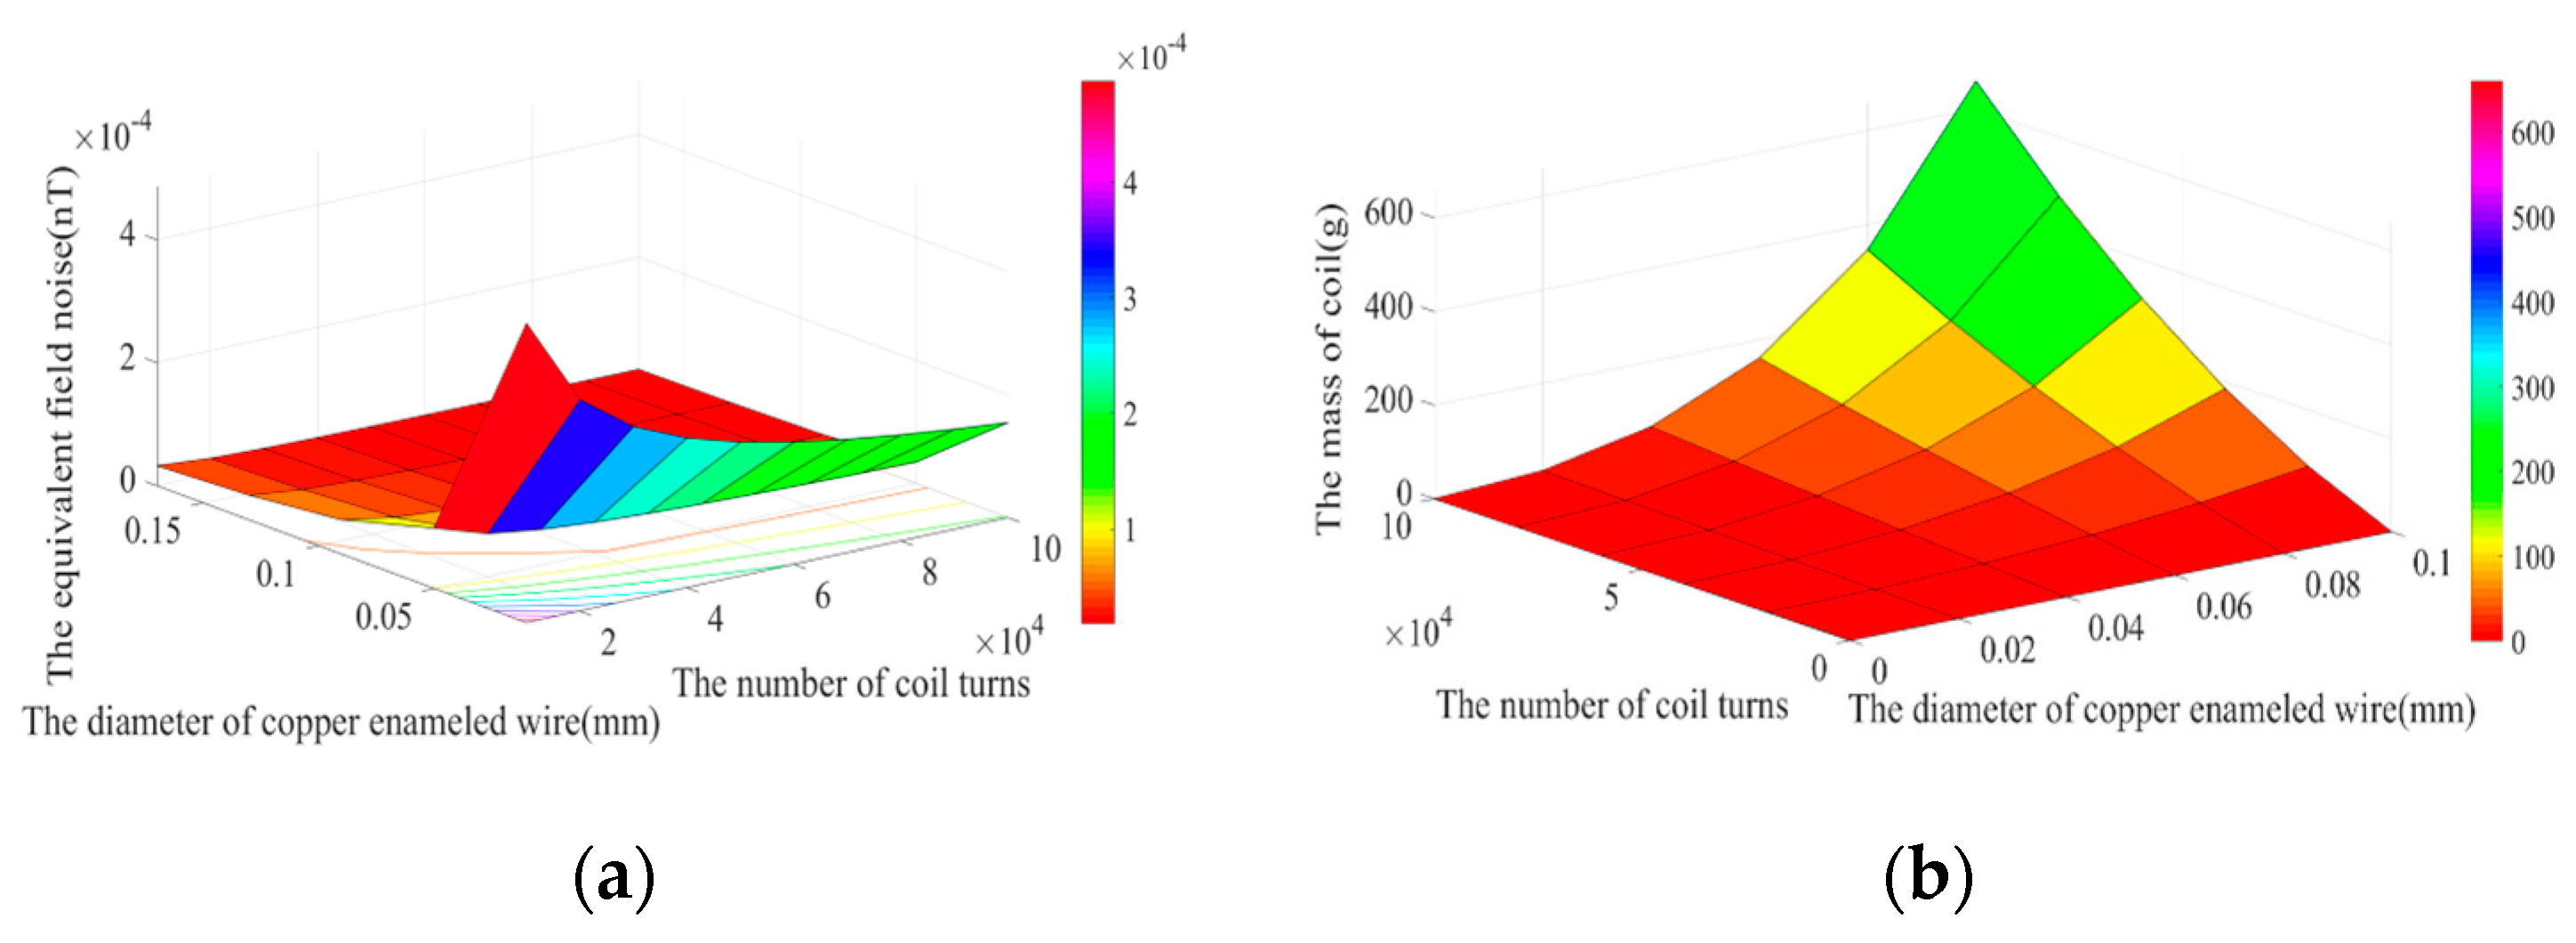
The equivalent magnetic field noise of the magnetic field sensor at 100Hz is shown in
Figure 11(a). When the number of turns of the coil remains constant, the diameter of the enameled copper wire increases, resulting in the decrease of the equivalent magnetic field noise of the sensor. When the diameter of the enameled copper wire remains constant, the number of turns of the coil increases, resulting in the decrease of the equivalent magnetic field noise of the sensor.
4.3. Noise Analysis of Magnetic Field Sensor
The mass of induction coil can be calculated as follows:
where ρ is the bulk density of copper.
Figure 11(b) gives the relationship between the coil mass, the coil parameters and the diameter of copper enameled wire. When the diameter of copper enameled wire is less than 0.06mm, the quality of the induction coil remains unchanged with the increase in the coil turns. When the diameter of copper enameled wire is greater than 0.06mm, the mass of the induction coil increases with increasing the coil turns.
4.4. Determination of Coil Parameters
By using the Lagrange multiplier method, it is calculated that the optimum number of turns of the coil is 11000 turns and the diameter of the enameled wire is 0.08mm. When the frequency is 100Hz, the diameter of the enameled copper wire is dcu=0.08mm and the number of turns of the coil is 11000 turns, the equivalent magnetic field noise of the magnetic field sensor Bs is 0.06pT/Hz1/2 and the mass of the coil is 30g.
5. Design of Magnetic Field Sensor
5.1. Structure Design of Amplifier Circuit
Schematic diagrams of inverted and in-phase proportional amplifiers are shown in
Figure 12(a) and (b), where
Z is the total impedance of the induction coil.
The output of the inverse amplifier is:
The output of the in-phase proportional amplifier is:
In this paper, the amplifying link of the amplifying circuit is realized by two-stage amplification, and the in-phase proportional amplifier is used in each stage amplifying circuit, and the magnifying multiple is 33 times. According to this value, the parameters of the amplifying circuit are selected. In the preamplifier, R
1 chooses 200Ω resistance and R
2 uses 2kΩ resistance. The R
3 of the secondary amplifier selects a resistance of 1kΩ and the R
4 selects a resistance of 2kΩ, as shown in
Figure 12© and (d).
The overall magnification of the preamplifier circuit is:
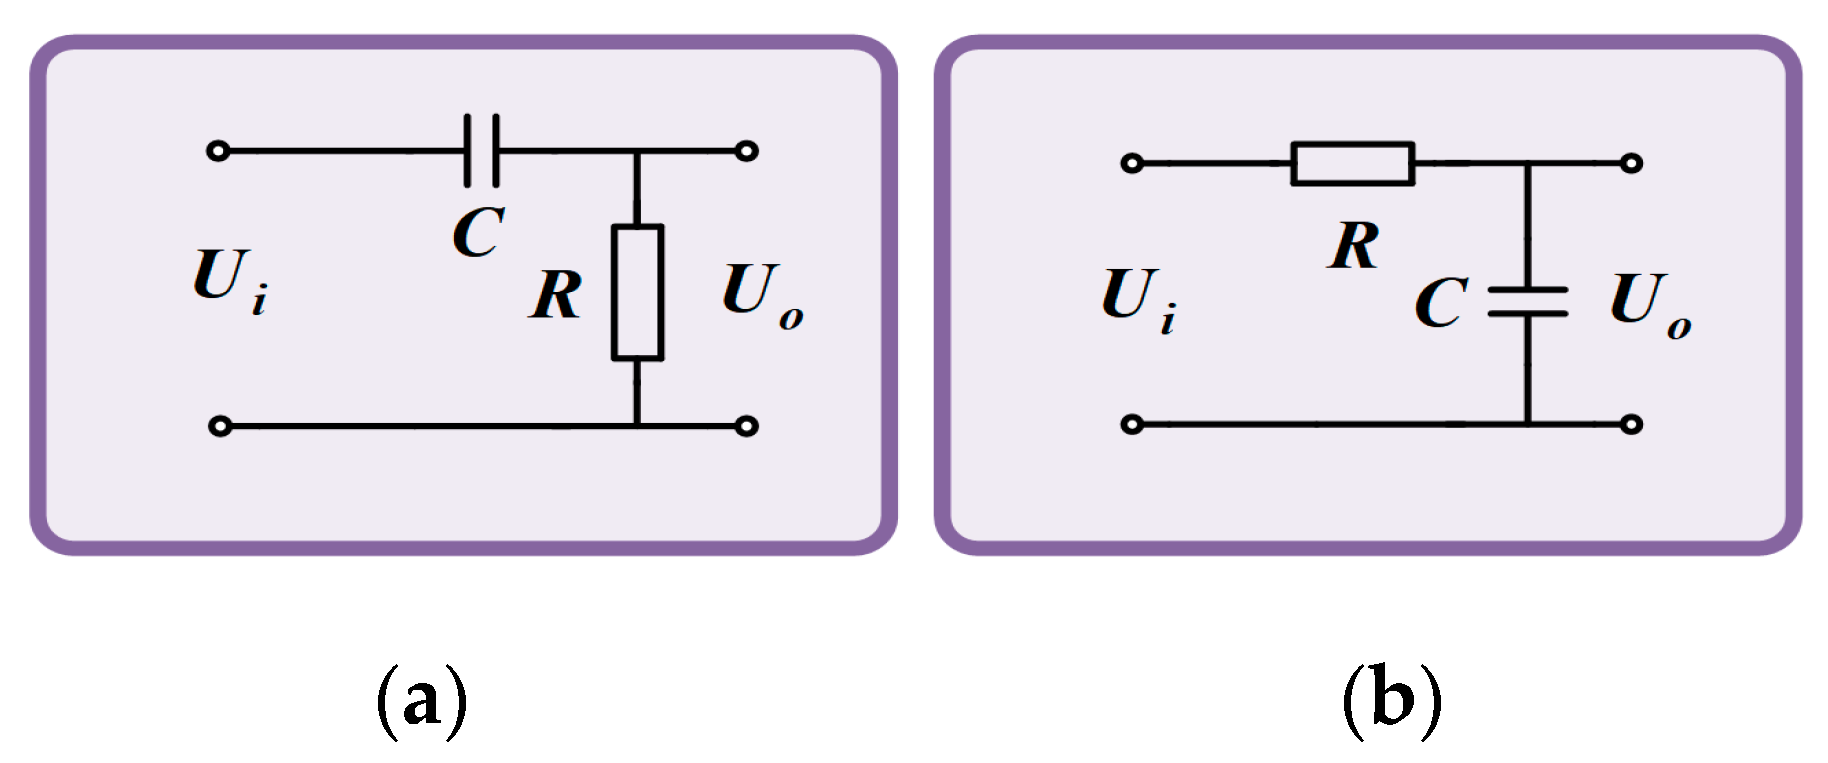
In this paper, both high-pass filter circuit and low-pass filter circuit use
RC filter circuit.
RC filter circuit has the advantages of simple structure and small size. The schematic diagram is shown in
Figure 13.
The relationship between the output voltage
Uo and the input voltage
Ui of the high pass filter circuit is as follows:
The relationship between the output voltage
Uo and the input voltage
Ui of the low pass filter circuit is as follows:
The cutoff frequency of the
RC filter circuit is:
To make the amplitude-frequency characteristic curve in the set frequency range more straight, the
R of the high-pass filter circuit is 30kΩ, the
C is 10μF, and the lower cut-off frequency
fL of the filter link is:
The
R of the low-pass filter circuit is 3kΩ, the
C is 0.01μF, and the upper cut-off frequency
fH of the filter is:
After adding the feedback coil, the magnetic induction intensity through the induction coil should be
B=Bj-Bf, and the voltage to the input of the amplifier should be:
After the
Ui is magnified
G times by the amplifier, the
Uo:
The formula of feedback magnetic induction intensity is:
The formula of output voltage
Uo is:
The transfer function between the output voltage
Uo and the magnetic induction intensity
Bj of the measured magnetic field is:
The amplitude-frequency characteristics are:
The phase-frequency characteristics are:
5.2. Simulation of Amplifier Circuit
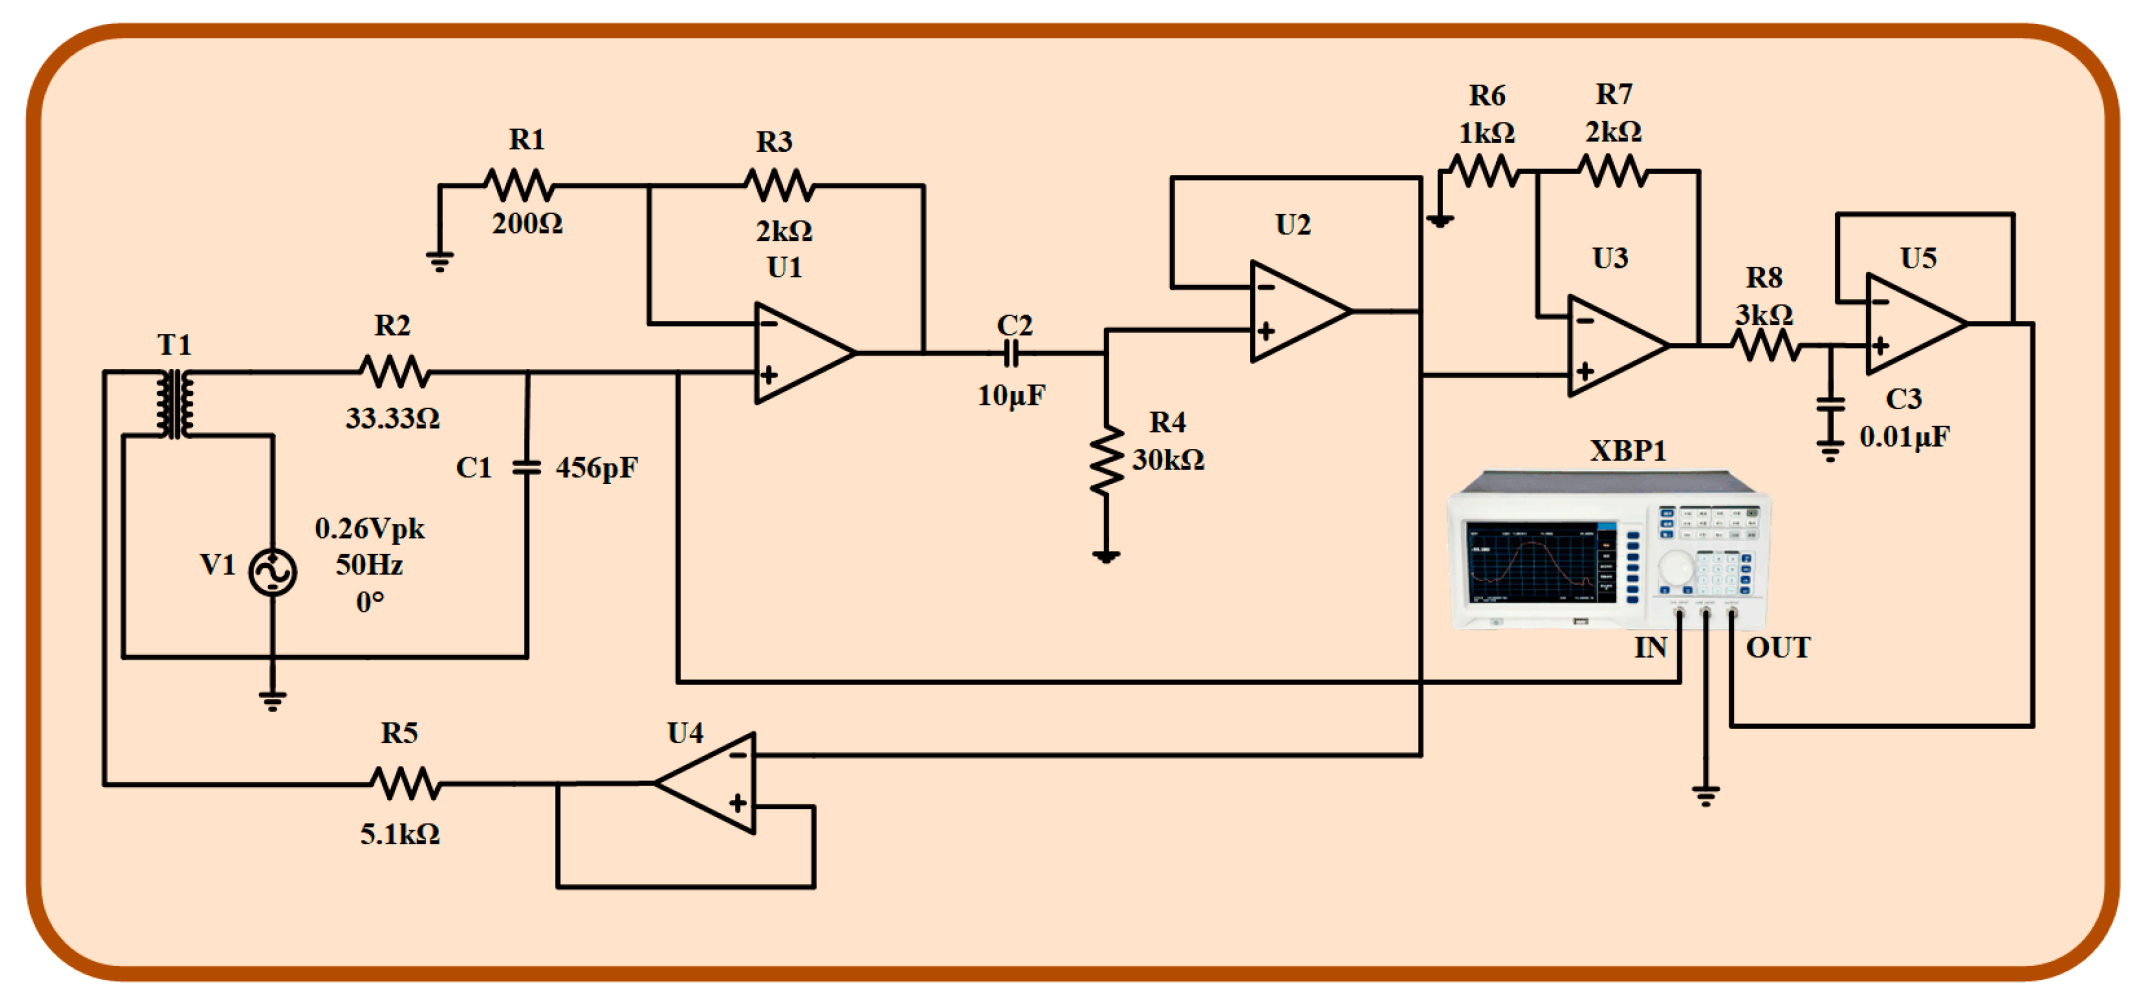
The simulation circuit diagram of the amplification circuit of the inductive magnetic sensor is built by using Multisim14. As shown in
Figure 14, the AC voltage source V
1 is used to simulate the induced electromotive force produced by the induction coil, and the coupled induction coil T
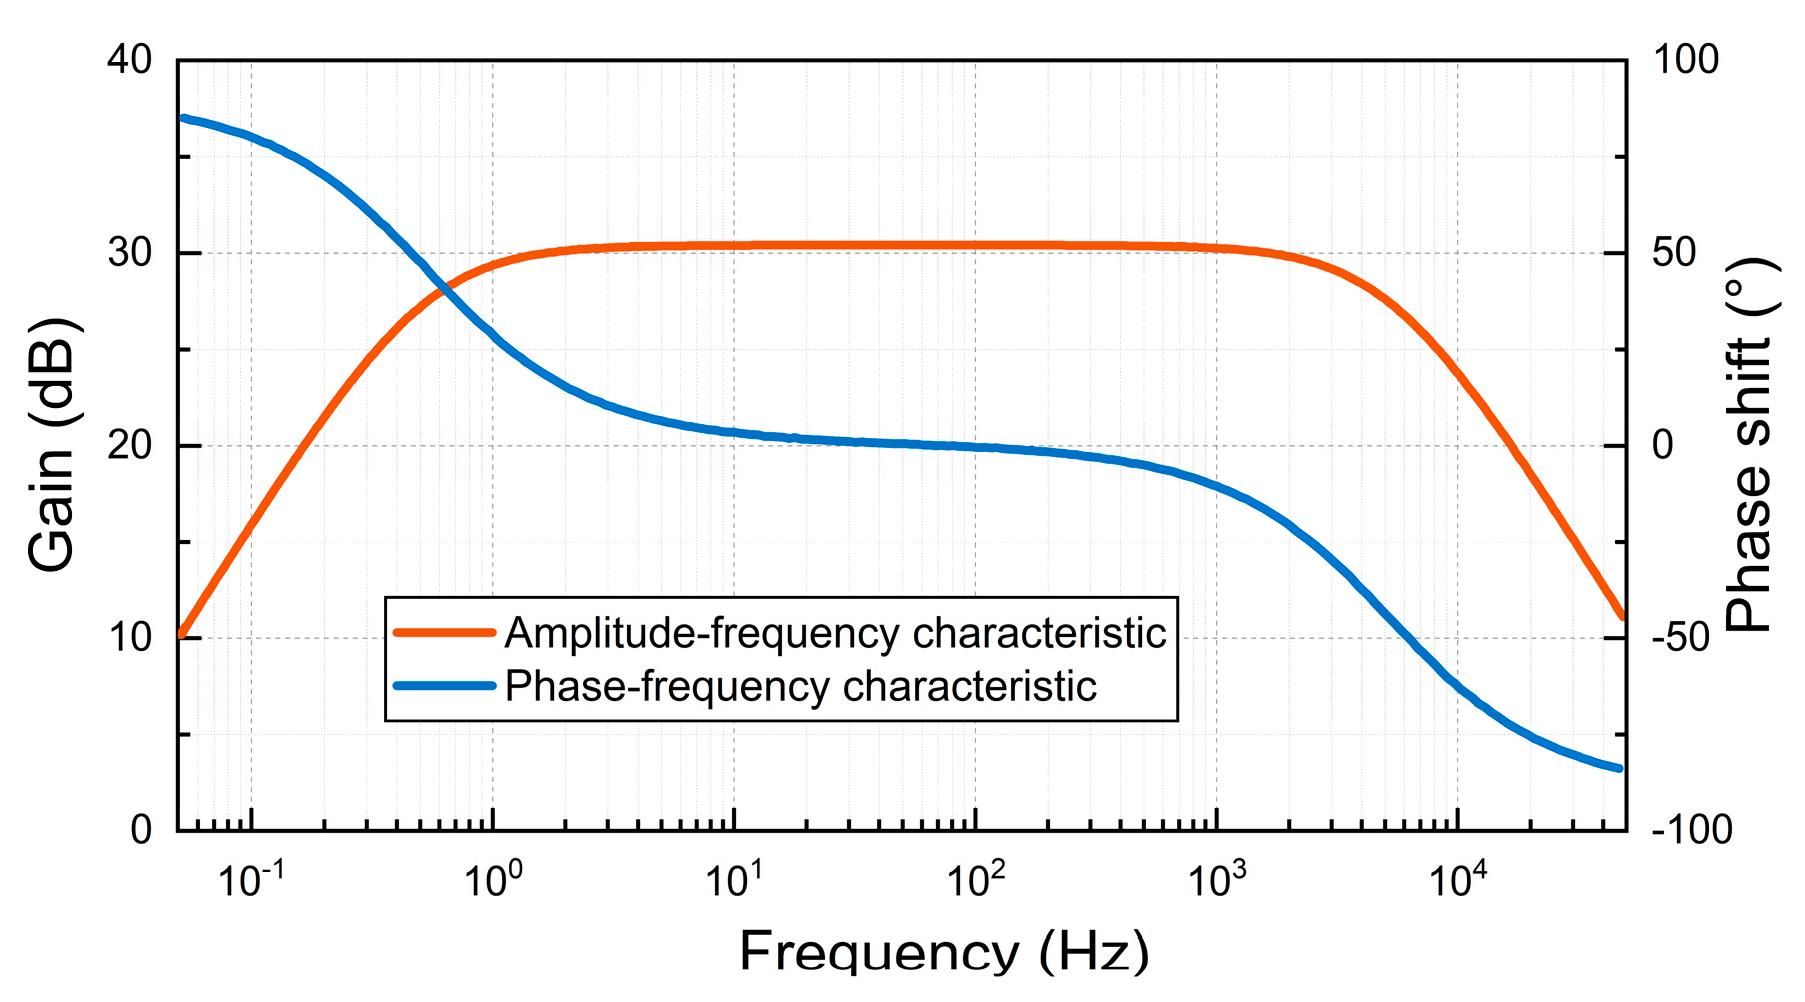
1 is used to simulate the induction coil and feedback coil. The amplitude-frequency and phase-frequency characteristics of the amplifying circuit are detected by Multisim, and the amplitude-frequency characteristic curve and phase-frequency characteristic curve are obtained, as shown in
Figure 15. The amplitude-frequency characteristic curve and phase-frequency characteristic curve in the range of 10-1000Hz are relatively flat, and the magnification meets the design requirements, which meets the design requirements of the inductive magnetic field sensor in this paper.
5.3. Physical Design of Amplifier Circuit
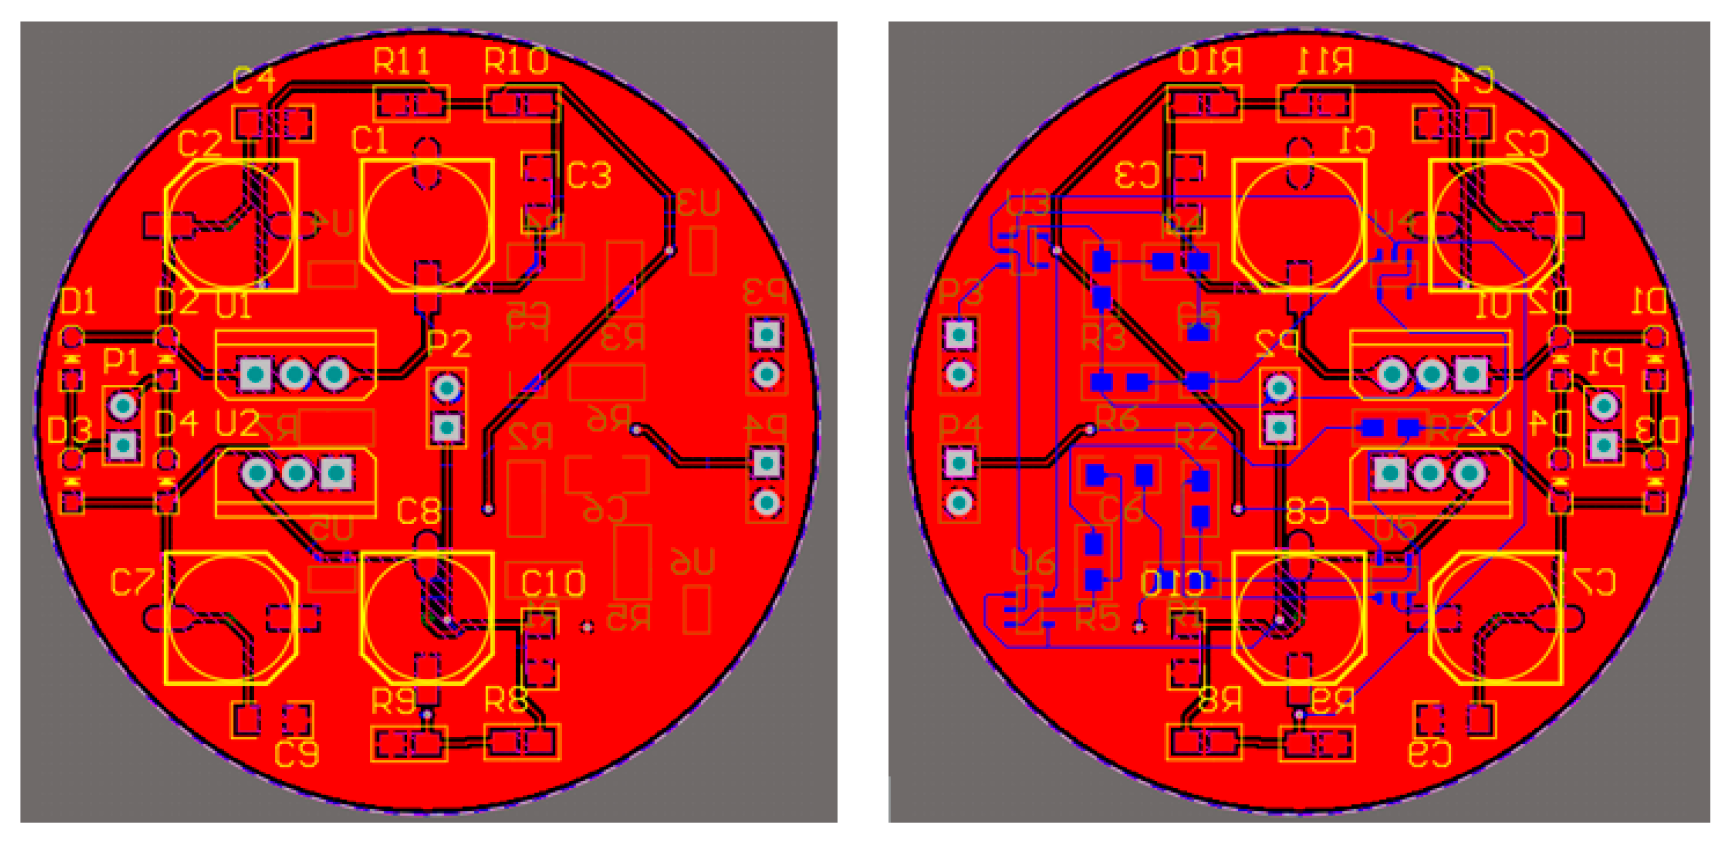
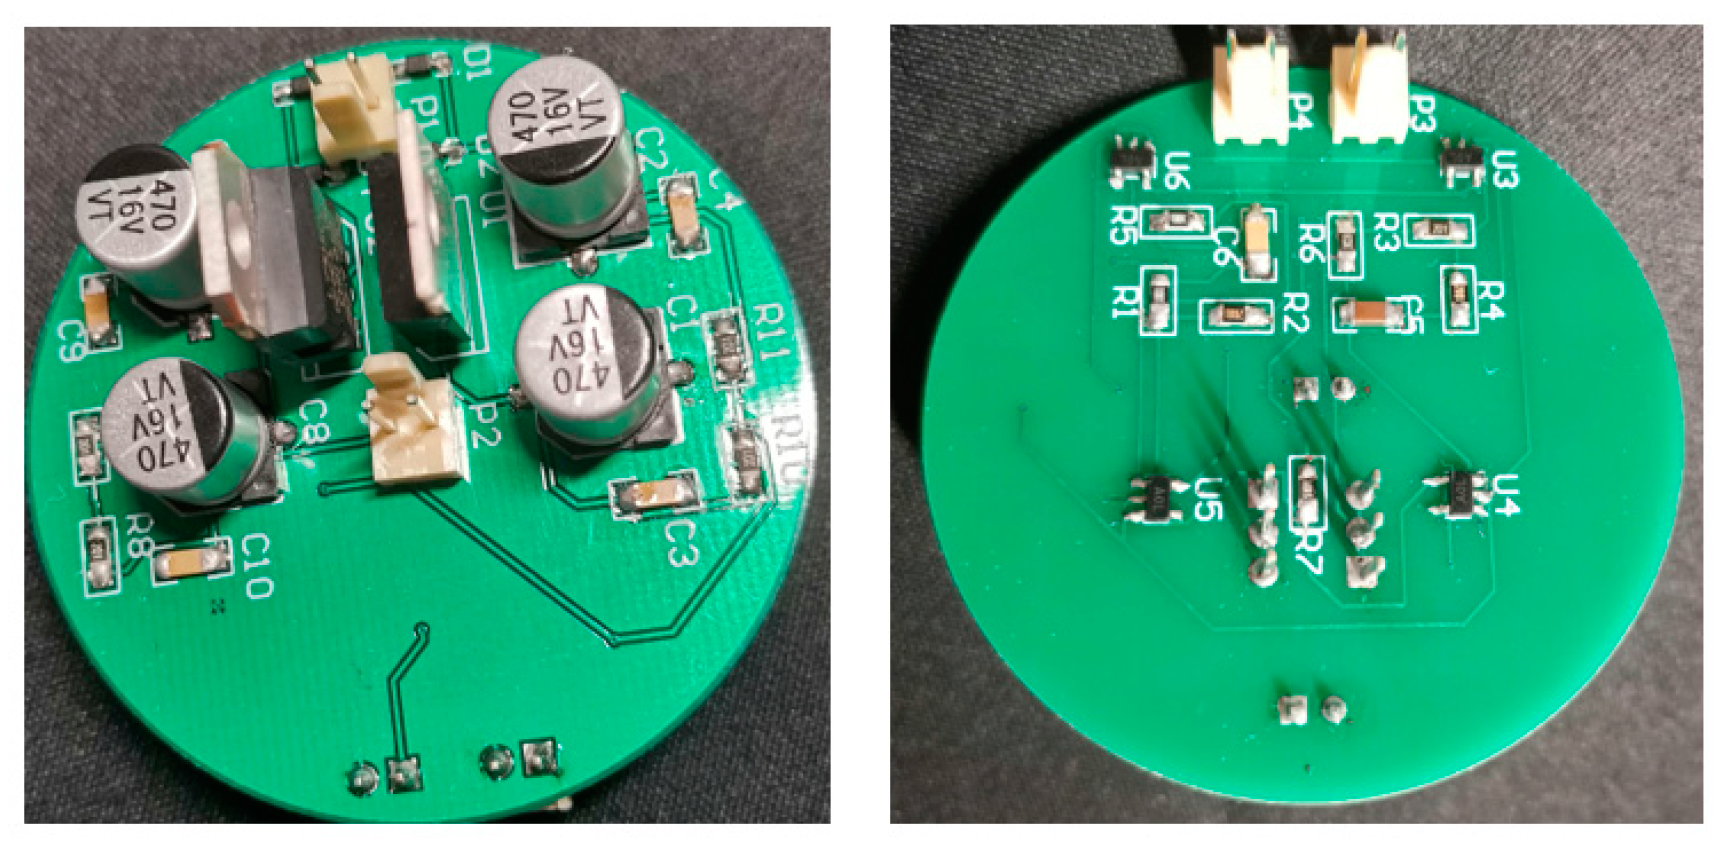
The corresponding PCB diagram is generated according to the schematic diagram of the amplifying circuit. To reduce the volume of the magnetic field sensor, the PCB circuit board adopts a double-layer design, the top layer is the power supply circuit, and the bottom layer is the amplification circuit. The 2D effect and physical drawings of the circuit wiring are shown in
Figure 16 and
Figure 17.
6. Experimental Results
6.1. Test of Amplifier Circuit
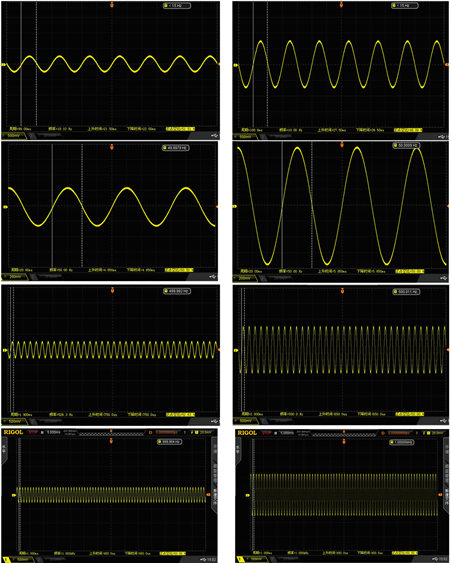
The test of the circuit shows that the input of the ±2.5V dual power supply circuit needs to be supplied by a sinusoidal AC voltage with an amplitude of 12V, which is provided by a transformer with a ratio of 220 to 12. The output waveforms of primary amplification and secondary amplification of the amplifying circuit are tested respectively. As shown in
Table 3, this paper shows output waveforms of several typical frequencies. When the frequency changes, whether primary amplification or secondary amplification, the output waveform keeps a complete sine wave without distortion and no external noise is introduced. This shows that the designed amplifying circuit has high reliability.
6.2. Fabrication of Sensor and Calibration of Sensitivity
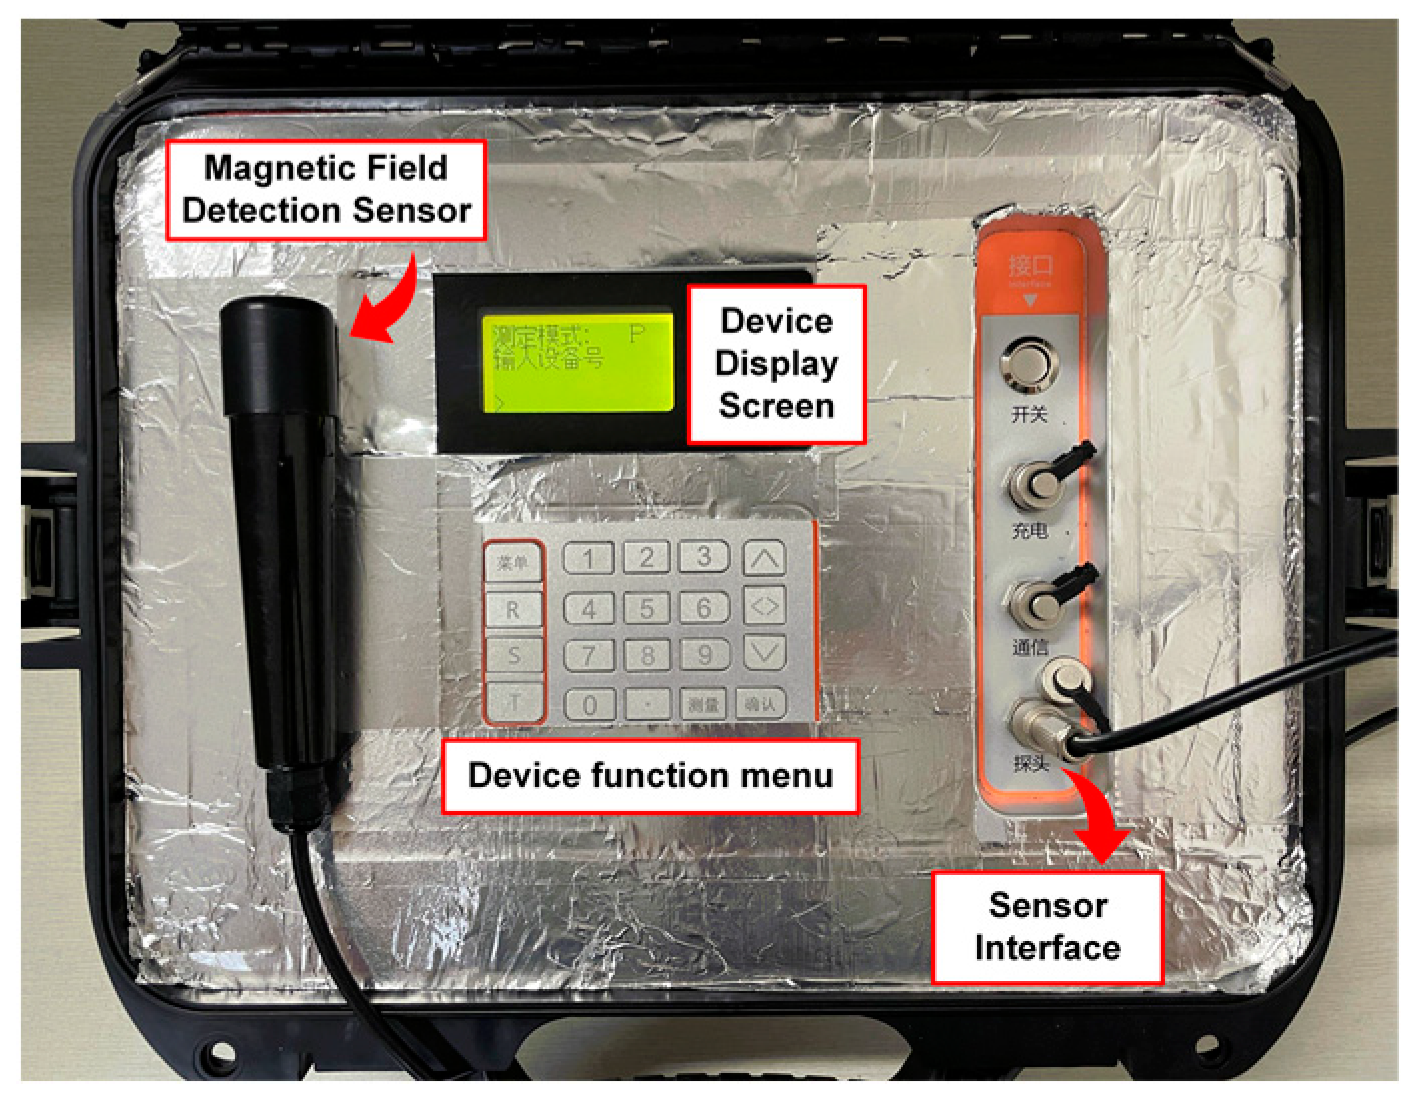
Figure 18 is the physical diagram of the sensor designed in this paper, and its sensitivity is about 327.6mV/μT. Compared with the same type of sensor, it has the advantages of small size, high sensitivity, easy to carry and high reliability.
6.3. Experimental Detection
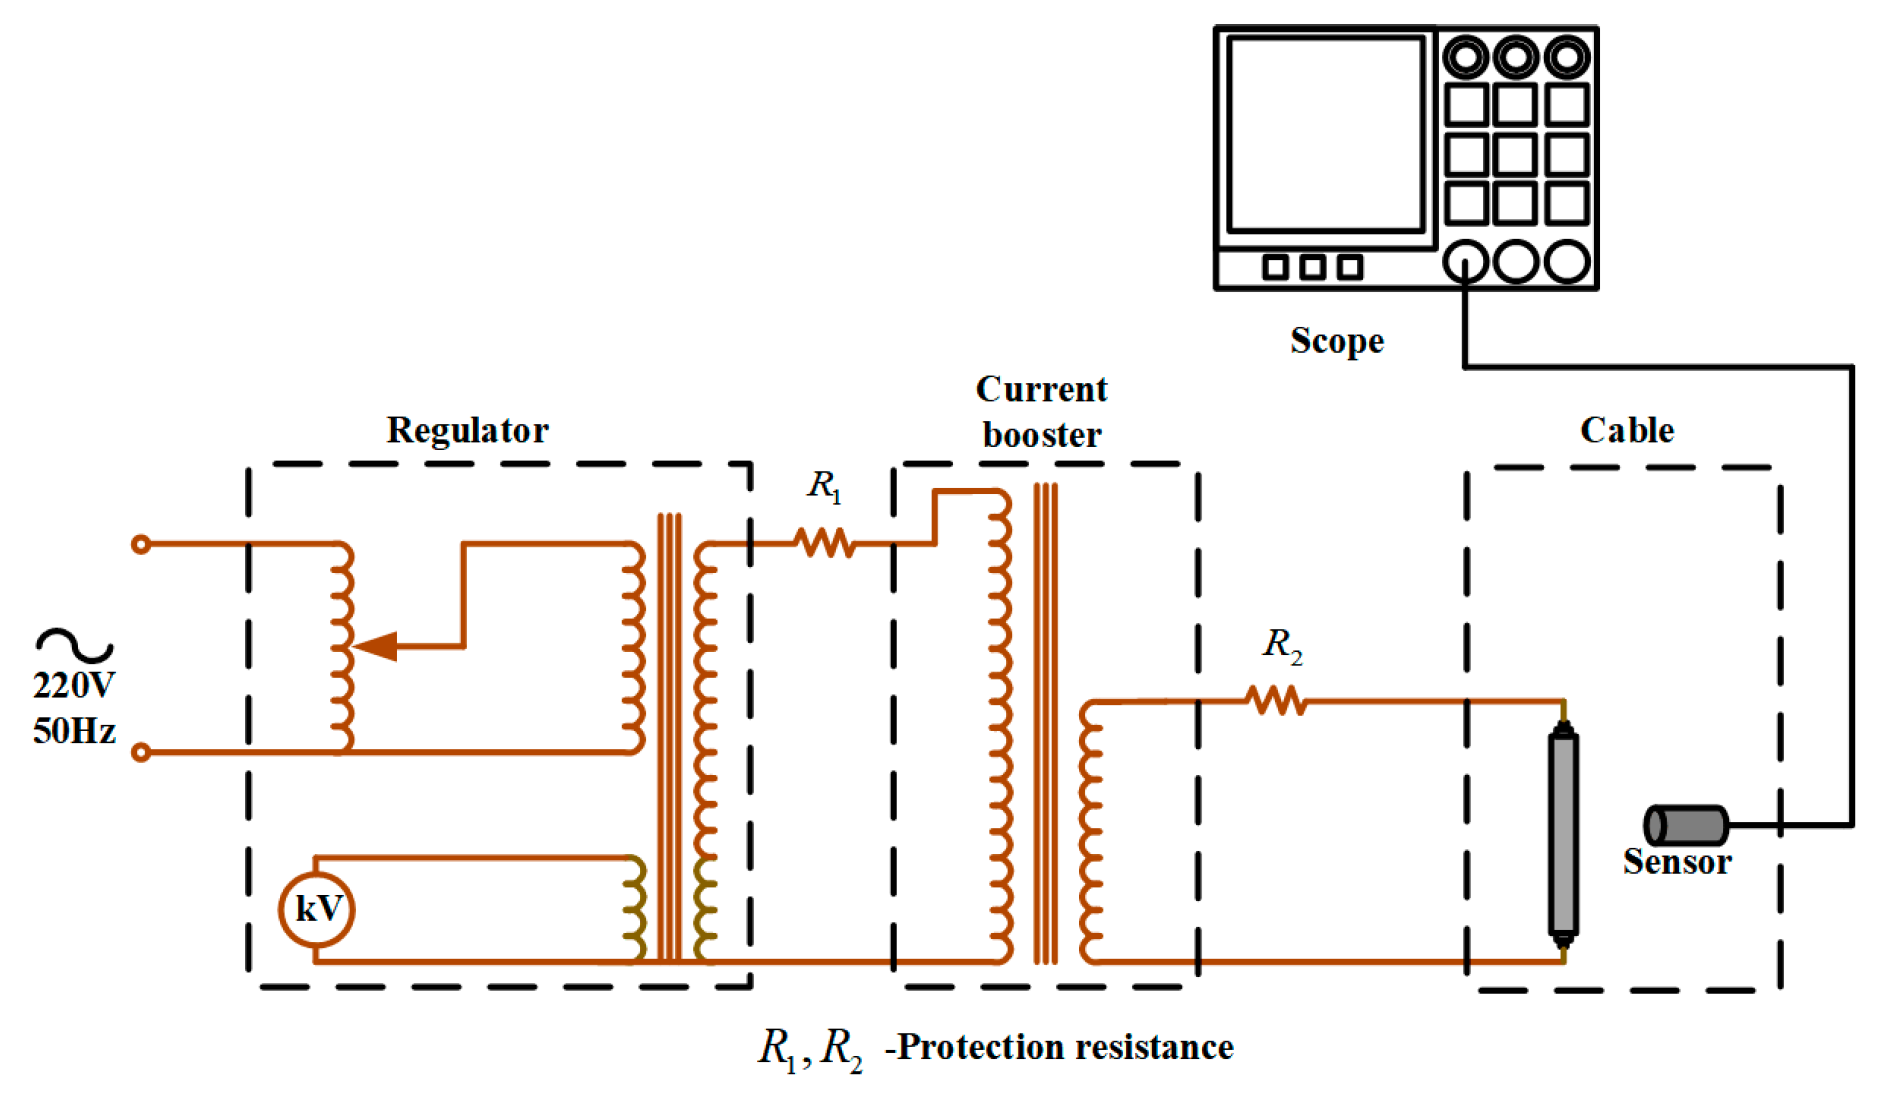
Figure 19 shows the experimental test platform, which consists of a power supply system, a cable, a magnetic field sensor and an oscilloscope. The power supply system consists of a 220V AC power supply, a voltage regulator and a boost. The rated output power of the voltage regulator is 7.5kV·A and the rated output voltage is 450V. The voltage regulator can provide different voltages for the load and linearly adjust the voltage when it is powered on. The rated output power of the converter is 5kV·A, the rated primary current is 20A, and the range of output secondary current is 0-2000A. The booster can adjust the output current steplessly to make the output current rise more balanced.
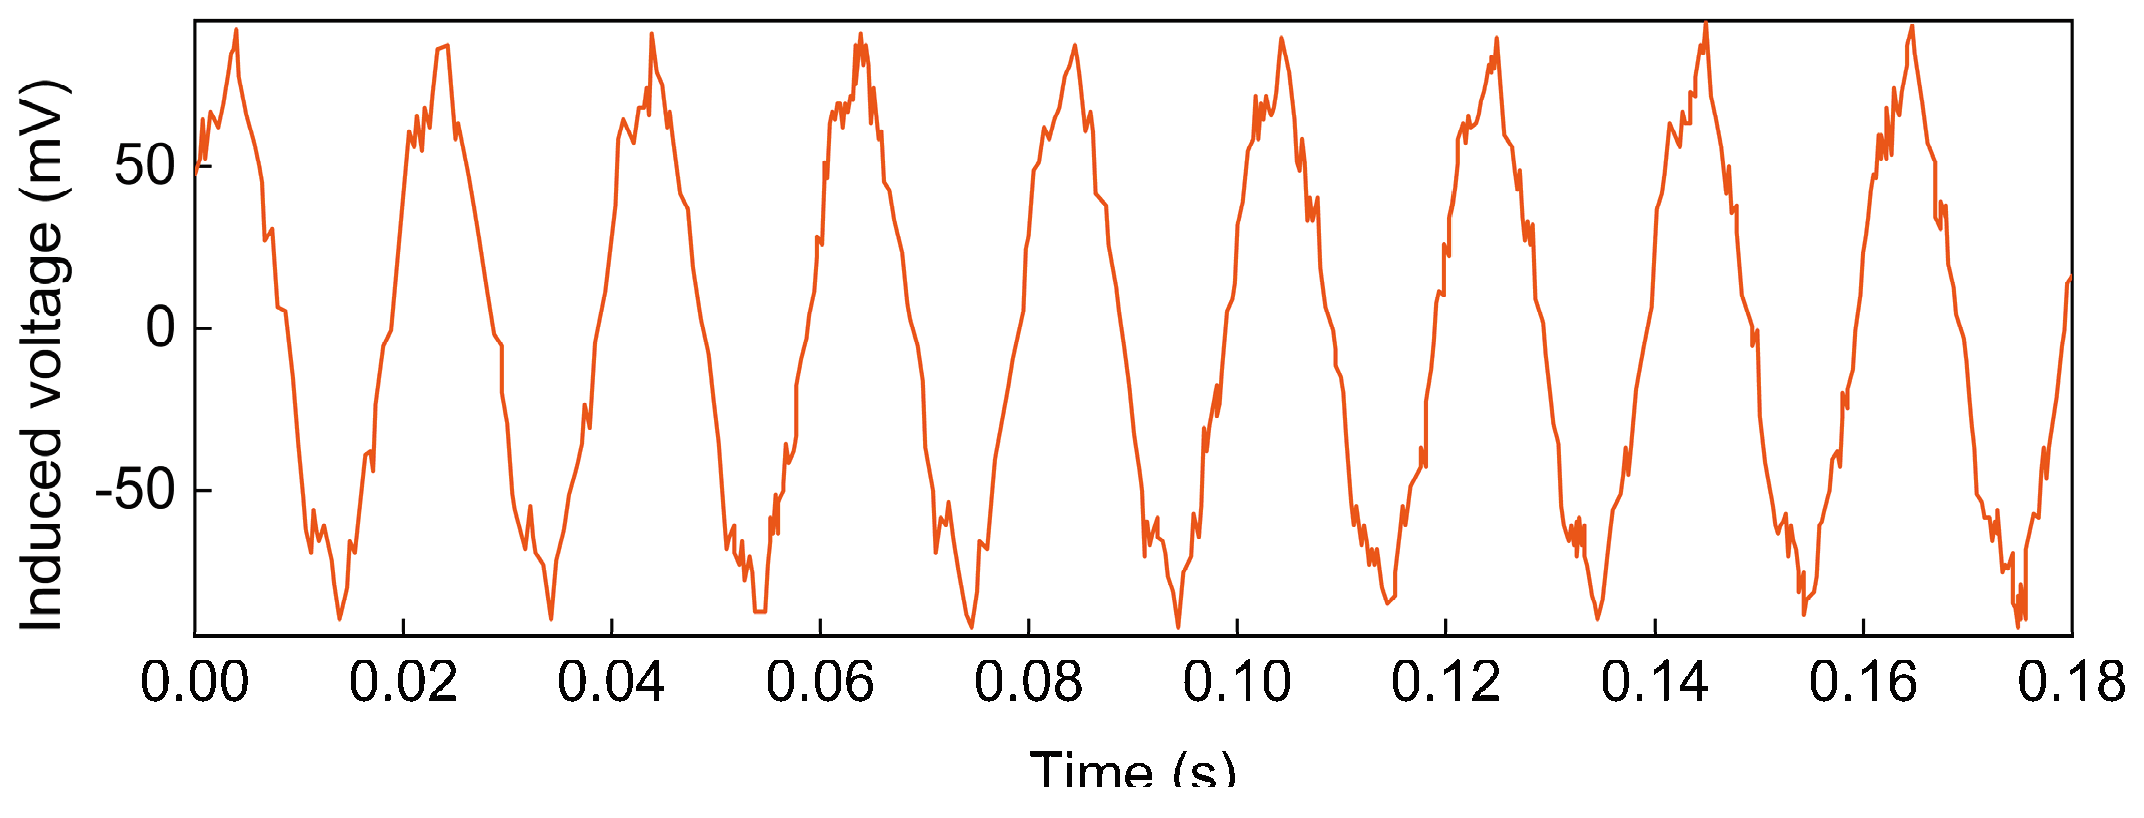
The magnetic field sensor is close to the single-phase cable and displays the induced voltage waveform measured by the magnetic field sensor through the oscilloscope. By adjusting the voltage regulator, the current through the cable is set to 60A. When the single-core cable passes through the power frequency alternating current, the power frequency magnetic field is bound to be generated around the cable. The voltage that changes when the sensor is placed in an alternating magnetic field. The induced voltage waveform measured by the magnetic field sensor is shown in
Figure 20.
The measured waveform is approximately sine wave, which is consistent with the waveform obtained by simulation analysis. The waveform distortion caused by some harmonics contained in the waveform may be due to the interference of external noise and the internal problems of the cable, which is a normal phenomenon.
7. Conclusions
Based on the electromagnetic characteristics of AC power cable, this paper optimizes the design and development of AC power cable magnetic field detection sensor. The main conclusions are as follows:
Permalloy has enough initial permeability and good ductility, the price is relatively cheaper but it also has good thermal stability, so permalloy is selected as the material of magnetic core in this paper.
The geometric parameters of the magnetic core are optimized by the simulation model, and the optimal aspect ratio of the magnetic core is determined to be 20.
The smaller the ratio of coil length to core length, the higher the sensitivity of the sensor. After analysis, the ratio of coil length to core length is set to 0.3.
When the diameter of the copper enameled wire is 0.08 mm and the number of turns of the coil is 11000, the equivalent magnetic field noise of the sensor is 0.06pT and the mass of the coil is only 30g.
In this paper, the magnetic flux negative feedback link is introduced into the amplifying circuit, which greatly improves the transmission characteristics of the sensor, makes the amplitude-frequency characteristic and phase-frequency characteristic curve smoother, and expands the frequency bandwidth of the magnetic field sensor. Verified by simulation and experimental tests, the amplifying circuit has high reliability.
In this paper, a new type of non-contact magnetic field sensor is designed, which is small and easy for measuring personnel to use. It can be used for the rapid detection of power cables and the timely detection and repair of power cable faults. It is of great significance to maintain the safe and stable operation of the power grid.
Author Contributions
Conceptualization, Yong Liu and Yuepeng Xin; Data curation, Yuepeng Xin; Formal analysis, Xingwang Huang; Funding acquisition, Yong Liu; Investigation, Jingang Su; Methodology, Boxue Du; Project administration, Yong Liu; Resources, Yong Liu; Software, Xingwang Huang; Supervision, Jingang Su; Validation, Yong Liu, Yuepeng Xin and Boxue Du; Visualization, Xingwang Huang; Writing – original draft, Yuepeng Xin; Writing – review & editing, Boxue Du. All authors have read and agreed to the published version of the manuscript.
Funding
This work is supported by the Chinese National Natural Science Foundation under Grant 51677128 and the Key Research and Development Program of Tianjin under Grant 19YFHBQY00030.
Institutional Review Board Statement
Not applicable.
Informed Consent Statement
Not applicable.
Data Availability Statement
Data are contained within the article.
Acknowledgments
We would like to thank the editor and reviewers for their help in improving this article.
Conflicts of Interest
The authors declare no conflicts of interest.
References
- Parol, M.; Wasilewski, J.; Jakubowski, J. Assessment of Electric Shock Hazard Coming From Earth Continuity Conductors in 110 kV Cable Lines. Ieee T Power Deliver 2020, 35. [Google Scholar] [CrossRef]
- Guo, W.; Zhou, S.l.; Wang, L.; Pei, H.; Zhang, C.; Li, H.C. Design and Application of Online Monitoring System for Electrical Cable States. High Voltage Engineering 2019, 3459–3466. [Google Scholar]
- Lim, H.; Kwon, G.Y.; Shin, Y.J. Fault Detection and Localization of Shielded Cable via Optimal Detection of Time-Frequency-Domain Reflectometry. Ieee T Instrum Meas 2021, 70. [Google Scholar] [CrossRef]
- Zhang, J.; Jiao, Y.; Chen, Q.; Zhou, L.; Li, H.B.; Tong, Y. An Online Measuring Method for Tangent Delta of Power Cables Based on an Injected Very-Low-Frequency Signal. Ieee Sens J 2022, 22, 980–988. [Google Scholar] [CrossRef]
- Lu, L.; Zhou, K.; Zhu, G.Y.; Chen, B.D.; Yang, X.M. Partial Discharge Signal Denoising with Recursive Continuous S-Shaped Algorithm in Cables. Ieee T Dielect El In 2021, 28, 1802–1809. [Google Scholar] [CrossRef]
- Qin, W.Q.; Ma, G.M.; Wang, S.H.; Hu, J.; Guo, T.J.; Shi, R.B. Distributed Discharge Detection Based on Improved COTDR Method With Dual Frequency Pulses. Ieee T Instrum Meas 2023, 72. [Google Scholar] [CrossRef]
- Liu, X.H.; He, W.; Zhao, Y.; Guo, Y.; Xu, Z. Nonintrusive Current Sensing for Multicore Cables Considering Inclination With Magnetic Field Measurement. Ieee T Instrum Meas 2021, 70. [Google Scholar] [CrossRef]
- Li, J.J.; Wang, Y.Z.; Zhang, X.; Ji, C.; Shi, J.Q. Sensitivity and Resolution Enhancement of Coupled-Core Fluxgate Magnetometer by Negative Feedback. Ieee T Instrum Meas 2019, 68, 623–631. [Google Scholar] [CrossRef]
- Bang, T.K.; Shin, K.H.; Koo, M.M.; Han, C.; Cho, H.W.; Choi, J.Y. Measurement and Torque Calculation of Magnetic Spur Gear Based on Quasi 3-D Analytical Method. Ieee T Appl Supercon 2018, 28. [Google Scholar] [CrossRef]
- Pan, D.H.; Li, J.; Jin, C.Y.; Liu, T.H.; Lin, S.X.; Li, L.Y. A New Calibration Method for Triaxial Fluxgate Magnetometer Based on Magnetic Shielding Room. Ieee T Ind Electron 2020, 67, 4183–4192. [Google Scholar] [CrossRef]
- Fetisov, Y.K. Piezoinductive Effect in Piezoelectric Disk With Electrodes Due to Combination of Electromagnetic Induction and Piezoelectricity. Ieee Sensor Lett 2023, 7. [Google Scholar] [CrossRef]
- Jiang, J.; Wu, Z.M.; Sheng, J.; Zhang, J.W.; Song, M.; Ryu, K.; Li, Z.Y.; Hong, Z.Y.; Jin, Z.J. A New Approach to Measure Magnetic Field of High-Temperature Superconducting Coil Based on Magneto-Optical Faraday Effect. Ieee T Appl Supercon 2021, 31. [Google Scholar] [CrossRef]
- Tang, X.L.; Wang, X.H.; Cattley, R.; Gu, F.S.; Ball, A.D. Energy Harvesting Technologies for Achieving Self-Powered Wireless Sensor Networks in Machine Condition Monitoring: A Review. Sensors-Basel 2018, 18. [Google Scholar] [CrossRef] [PubMed]
- Xie, S.P.; Zhang, Y.F.; Jin, M.H.; Li, C.Y.; Meng, Q.Y. High Sensitivity and Wide Range Soft Magnetic Tactile Sensor Based on Electromagnetic Induction. Ieee Sens J 2021, 21, 2757–2766. [Google Scholar] [CrossRef]
- Shimizu, K.; Furuya, A.; Uehara, Y.; Fujisaki, J.; Kawano, H.; Tanaka, T.; Ataka, T.; Oshima, H. Loss Simulation by Finite-Element Magnetic Field Analysis Considering Dielectric Effect and Magnetic Hysteresis in EI-Shaped Mn-Zn Ferrite Core. Ieee T Magn 2018, 54. [Google Scholar]
- Yabu, N.; Sugimura, K.; Sonehara, M.; Sato, T. Fabrication and Evaluation of Composite Magnetic Core Using Iron-Based Amorphous Alloy Powder With Different Particle Size Distributions. Ieee T Magn 2018, 54. [Google Scholar] [CrossRef]
- Ohta, M.; Hasegawa, R. Soft Magnetic Properties of Magnetic Cores Assembled With a High Fe-Based Nanocrystalline Alloy. Ieee T Magn 2017, 53. [Google Scholar] [CrossRef]
- He, W.; Zhang, J.T.; Qu, C.W.; Wu, J.; Peng, J.C. A Passive Electric Current Sensor Based on Ferromagnetic Invariant Elastic Alloy, Piezoelectric Ceramic, and Permalloy Yoke. Ieee T Magn 2016, 52. [Google Scholar] [CrossRef]
- Mimura, M.; Takahashi, N.; Nakano, M.; Ujigawa, S.; Shinnoh, T.; Miyagi, D. Examination of Precise Measurement of DC Magnetic Properties of Permalloy Under Low Flux Density More Than a Few mT. Ieee T Magn 2012, 48, 3614–3617. [Google Scholar] [CrossRef]
- Yang, R.P.; Wang, H.P.; Liu, H.; Luo, W.; Ge, J.; Dong, H.B. A new digital single-axis fluxgate magnetometer according to the cobalt-based amorphous effects. Rev Sci Instrum 2022, 93. [Google Scholar] [CrossRef]
- Huang, X.W.; Liu, Yong.; Li, Q.R. Optimal design of magnetic field sensor for condition monitoring of high voltage power cable. International Conference on Electrical Materials and Power Equipment (ICEMPE), Chongqing, China, 11-15 April 2021.
- Song, J.L.; Cao, R.Q.; Jin, F.; Dong, K.F.; Mo, W.Q.; Hui, Y.J. Design and Optimization of Miniaturized Single Frequency Point Inductive Magnetic Sensor. I C Comm Softw Net 2021, 247–254. [Google Scholar]
- Ying, Y.; Xu, K.; Sun, L.L.; Zhang, R.; Guo, X.F.; Si, G.Y. D-Shaped Fiber Magnetic-Field Sensor Based on Fine-Tuning Magnetic Fluid Grating Period. Ieee T Electron Dev 2017, 64, 1735–1741. [Google Scholar] [CrossRef]
Figure 1.
Cable magnetic field distribution.
Figure 1.
Cable magnetic field distribution.
Figure 2.
Structure diagram of designing the magnetic field sensor.
Figure 2.
Structure diagram of designing the magnetic field sensor.
Figure 3.
Simulation diagram of eddy current generation: (a) Induced current density in conductor during 50Hz; (b) Induced current density in conductor after Block during 50Hz.
Figure 3.
Simulation diagram of eddy current generation: (a) Induced current density in conductor during 50Hz; (b) Induced current density in conductor after Block during 50Hz.
Figure 4.
The geometric model and the meshing diagram of the magnetic core and coil: (a) the geometric model of the magnetic core and coil; (b) the meshing diagram of the model.
Figure 4.
The geometric model and the meshing diagram of the magnetic core and coil: (a) the geometric model of the magnetic core and coil; (b) the meshing diagram of the model.
Figure 5.
The influence of Magnetic Core length on the performance of the Sensor: (a) The relationship between the relative effective permeability of each length core and its position in the core; (b) The relationship between relative effective permeability and magnetic core length.
Figure 5.
The influence of Magnetic Core length on the performance of the Sensor: (a) The relationship between the relative effective permeability of each length core and its position in the core; (b) The relationship between relative effective permeability and magnetic core length.
Figure 6.
Effect of length-diameter ratio of magnetic core on sensor performance: (a) The relationship between effective permeability, aspect ratio and surface permeability of magnetic core; (b) Effect of length-diameter ratio of magnetic core on effective permeability.
Figure 6.
Effect of length-diameter ratio of magnetic core on sensor performance: (a) The relationship between effective permeability, aspect ratio and surface permeability of magnetic core; (b) Effect of length-diameter ratio of magnetic core on effective permeability.
Figure 7.
Effect of the ratio of Coil length to Core length on the performance of the Sensor: (a) Magnetic field distribution of magnetic core; (b) Effect of Coil length on induced Voltage of Magnetic Field Sensor.
Figure 7.
Effect of the ratio of Coil length to Core length on the performance of the Sensor: (a) Magnetic field distribution of magnetic core; (b) Effect of Coil length on induced Voltage of Magnetic Field Sensor.
Figure 8.
Effect of Flux Collector on the performance of Sensor: (a) Effect of adding flux collector and increasing core length on effective permeability of magnetic core; (b) Relative effective permeability of magnetic core with or without flux collector.
Figure 8.
Effect of Flux Collector on the performance of Sensor: (a) Effect of adding flux collector and increasing core length on effective permeability of magnetic core; (b) Relative effective permeability of magnetic core with or without flux collector.
Figure 9.
Effect of Flux Collector on the performance of Sensor: (a)Relative effective permeability of magnetic core of flux collector with different thickness; (b)Relative effective permeability of magnetic core of flux collector of each radius; (c)Polynomial fitting curve.
Figure 9.
Effect of Flux Collector on the performance of Sensor: (a)Relative effective permeability of magnetic core of flux collector with different thickness; (b)Relative effective permeability of magnetic core of flux collector of each radius; (c)Polynomial fitting curve.
Figure 10.
The experiment verifies the diagram: (a) The effect of the number of turns of the coil on the resistance; (b) The effect of the number of turns of the coil on the inductance; (c) The effect of copper enameled wire diameter on resistance; (d) The effect of copper enameled wire diameter on inductance; € The effect of coil diameter on the resistance; (f) The effect of coil diameter on inductance; (g) The effect of coil length on the resistance; (h) The effect of coil length on inductance.
Figure 11.
Simulation diagram related to parameter optimization of induction coil: (a) The equivalent magnetic field noise from the magnetic field sensor; (b) The relationship between the coil mass, the coil parameters and the diameter of copper enameled wire.
Figure 11.
Simulation diagram related to parameter optimization of induction coil: (a) The equivalent magnetic field noise from the magnetic field sensor; (b) The relationship between the coil mass, the coil parameters and the diameter of copper enameled wire.
Figure 12.
The basic circuit of the amplifier and the two-stage amplifier principle. .
Figure 12.
The basic circuit of the amplifier and the two-stage amplifier principle. .
Figure 13.
Filter circuit.
Figure 13.
Filter circuit.
Figure 14.
The circuit diagram of the amplifier circuit.
Figure 14.
The circuit diagram of the amplifier circuit.
Figure 15.
Amplitude-frequency characteristic and phase-frequency characteristic.
Figure 15.
Amplitude-frequency characteristic and phase-frequency characteristic.
Figure 16.
Magnifying circuit wiring 2D effect drawing.
Figure 16.
Magnifying circuit wiring 2D effect drawing.
Figure 17.
Physical diagram of the amplifier circuit.
Figure 17.
Physical diagram of the amplifier circuit.
Figure 18.
Physical diagram of the sensor and supporting equipment.
Figure 18.
Physical diagram of the sensor and supporting equipment.
Figure 19.
Experimental test circuit.
Figure 19.
Experimental test circuit.
Figure 20.
Induced voltage waveform.
Figure 20.
Induced voltage waveform.
Table 1.
Introduction of magnetic field measurement methods.
Table 1.
Introduction of magnetic field measurement methods.
| Principle of measurement |
Example |
Range of measurement (T) |
Application |
| Magnetic torque |
Geomagnetic variometer |
10-11~10-7
|
Earth's magnetic field |
| Fluxgate |
Peak detector |
10-9~10-1
|
Weak magnetic field |
| Electromagnetic induction |
Fixed coil |
10-10~10-1
|
Alternating magnetic field |
| Electromagnetic effect |
Hall transducer |
10-7~10 |
Pulsed magnetic field |
| Magneto-optical effect |
Faraday magneto-optical effect |
10-2~10 |
The laser device |
Table 2.
Representative parameters of magnetic core materials.
Table 2.
Representative parameters of magnetic core materials.
| Materials |
Bs/T |
μi |
μm |
ρ/μΩ*cm
|
Applicable frequency range |
| Mn – Zn ferrite |
0.38 |
3000 |
12000 |
1-10 |
Tens of MHz |
| Permalloy |
0.74 |
50000 |
150000 |
55 |
<20kHz |
| Iron-based amorphous alloy |
1.56 |
50000 |
200000 |
130 |
50Hz-10kHz |
| Nanocrystalline iron-based alloy |
1.45 |
100000 |
800000 |
115 |
<500kHz |
Table 3.
The output waveform of the amplifier circuit when the frequency changes.
Table 3.
The output waveform of the amplifier circuit when the frequency changes.
|
Typicalfrequency
|
Primary amplification |
Secondary amplification |
| 10Hz |
 |
| 50Hz |
| 500Hz |
| 1000Hz |
|
Disclaimer/Publisher’s Note: The statements, opinions and data contained in all publications are solely those of the individual author(s) and contributor(s) and not of MDPI and/or the editor(s). MDPI and/or the editor(s) disclaim responsibility for any injury to people or property resulting from any ideas, methods, instructions or products referred to in the content. |
© 2024 by the authors. Licensee MDPI, Basel, Switzerland. This article is an open access article distributed under the terms and conditions of the Creative Commons Attribution (CC BY) license (http://creativecommons.org/licenses/by/4.0/).
