Submitted:
22 March 2024
Posted:
25 March 2024
You are already at the latest version
Abstract
Keywords:
1. Introduction
2. Materials and Methods
3. Results and Discussion
3.1. Steady-State Conditions
3.2. Transient Conditions
4. Conclusions
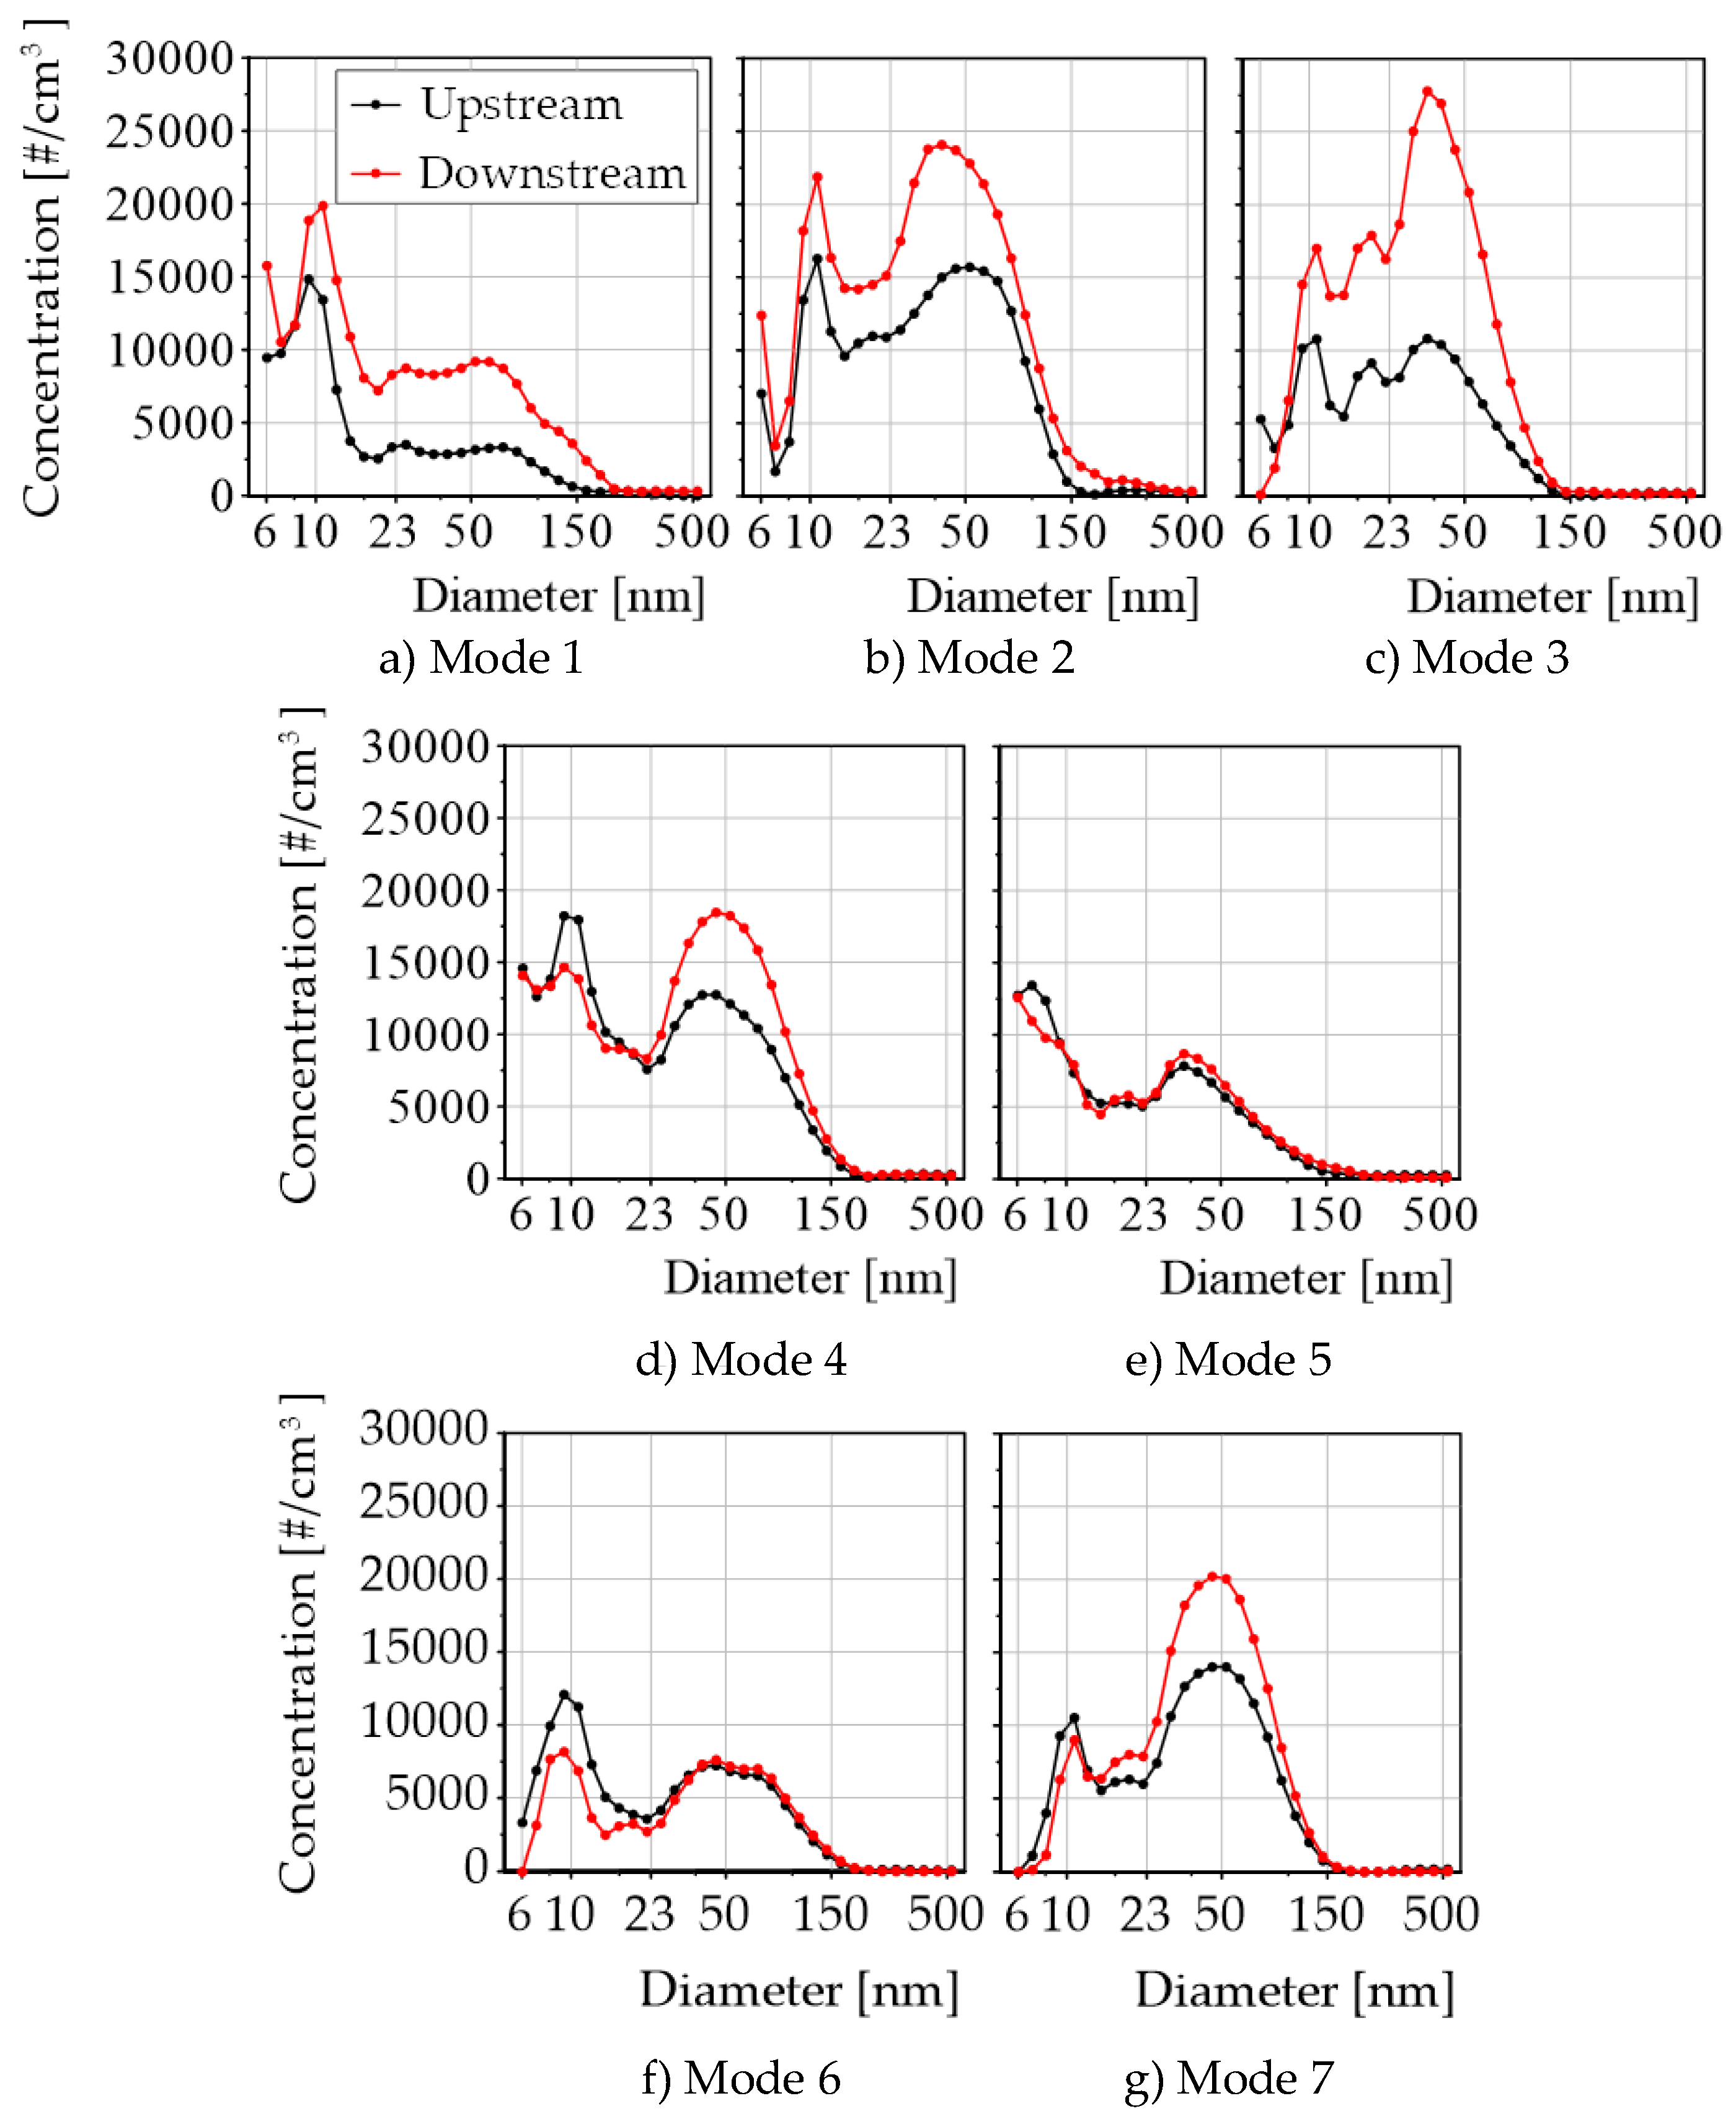
- The PN emission increased after TWC when conditions of steady-state modes had temperatures around 500°C and exhaust gas flows lower than 120 kg/h (high residence time), facts that increase the PN formation from UHC conversion and division of particles whose diameters are between 500 nm and 1000 nm. Steady-state modes with temperatures around 600°C and 700 °C whose exhaust flows were medium and high show negligible differences in PN and a slight shift towards larger particles in PSD, both upstream and downstream of the TWC.
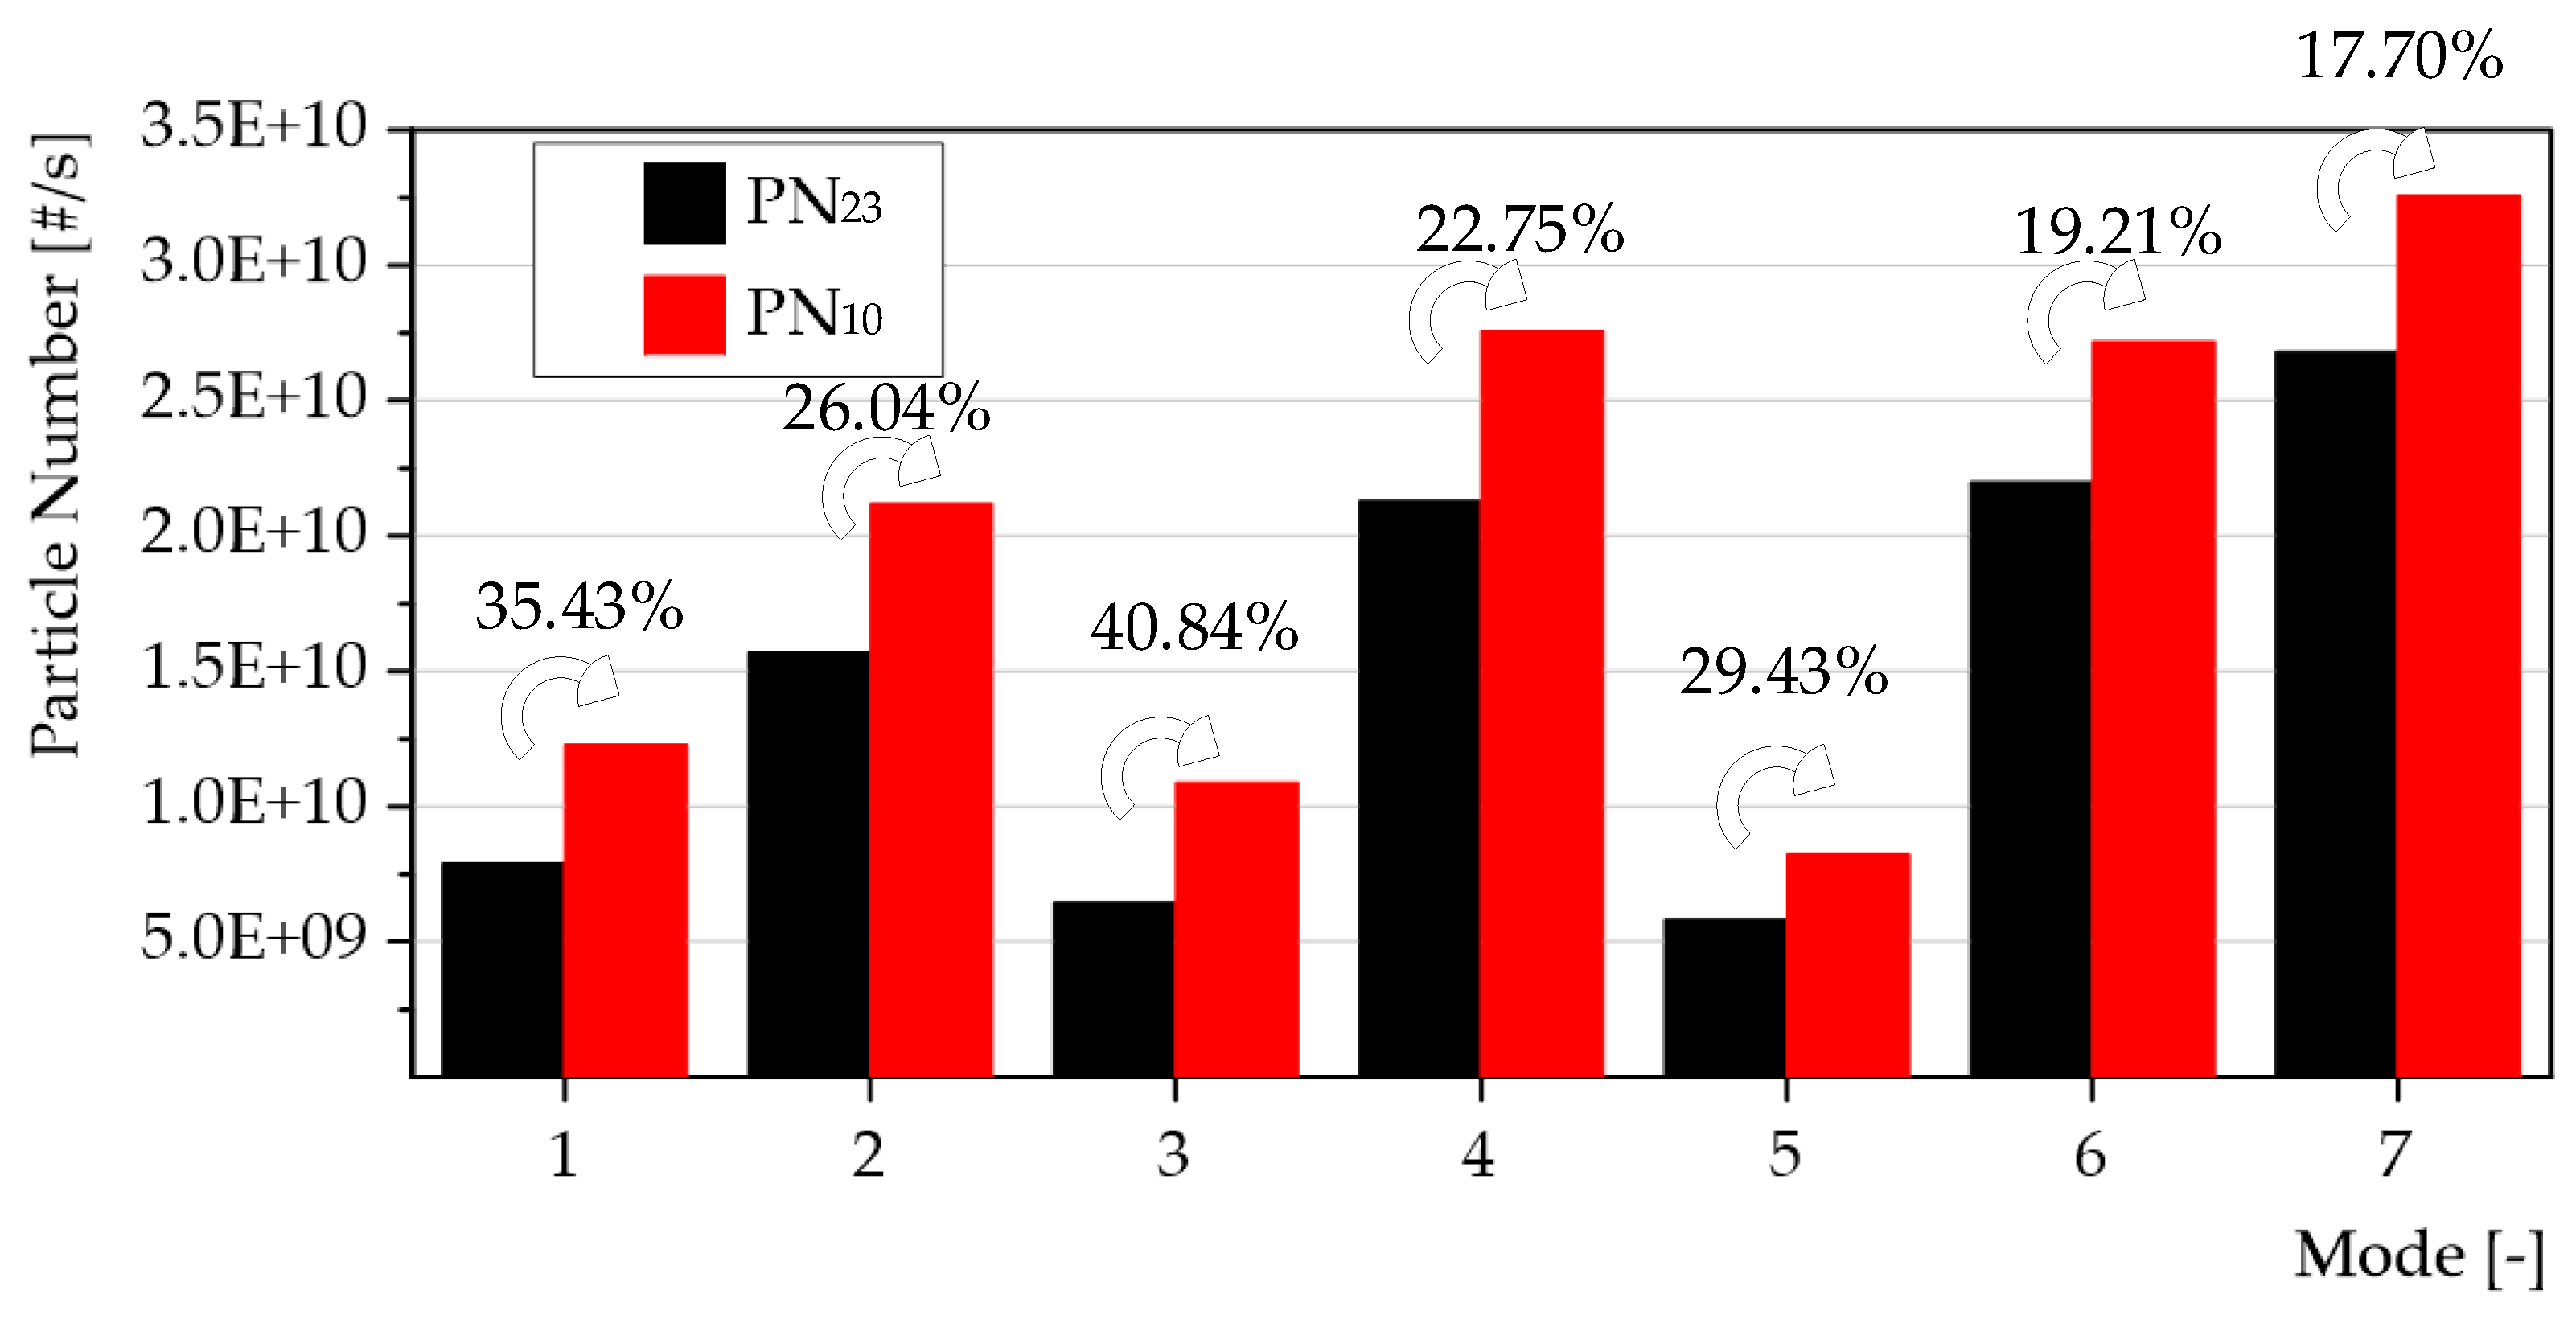
- It was observed that PN when it is measured particles with diameters from 10 nm instead of 23 nm, total PN increase between 17.70% and 40.84%. Modes characterized by lower exhaust temperatures and mass flow rates exhibited the greatest increases.
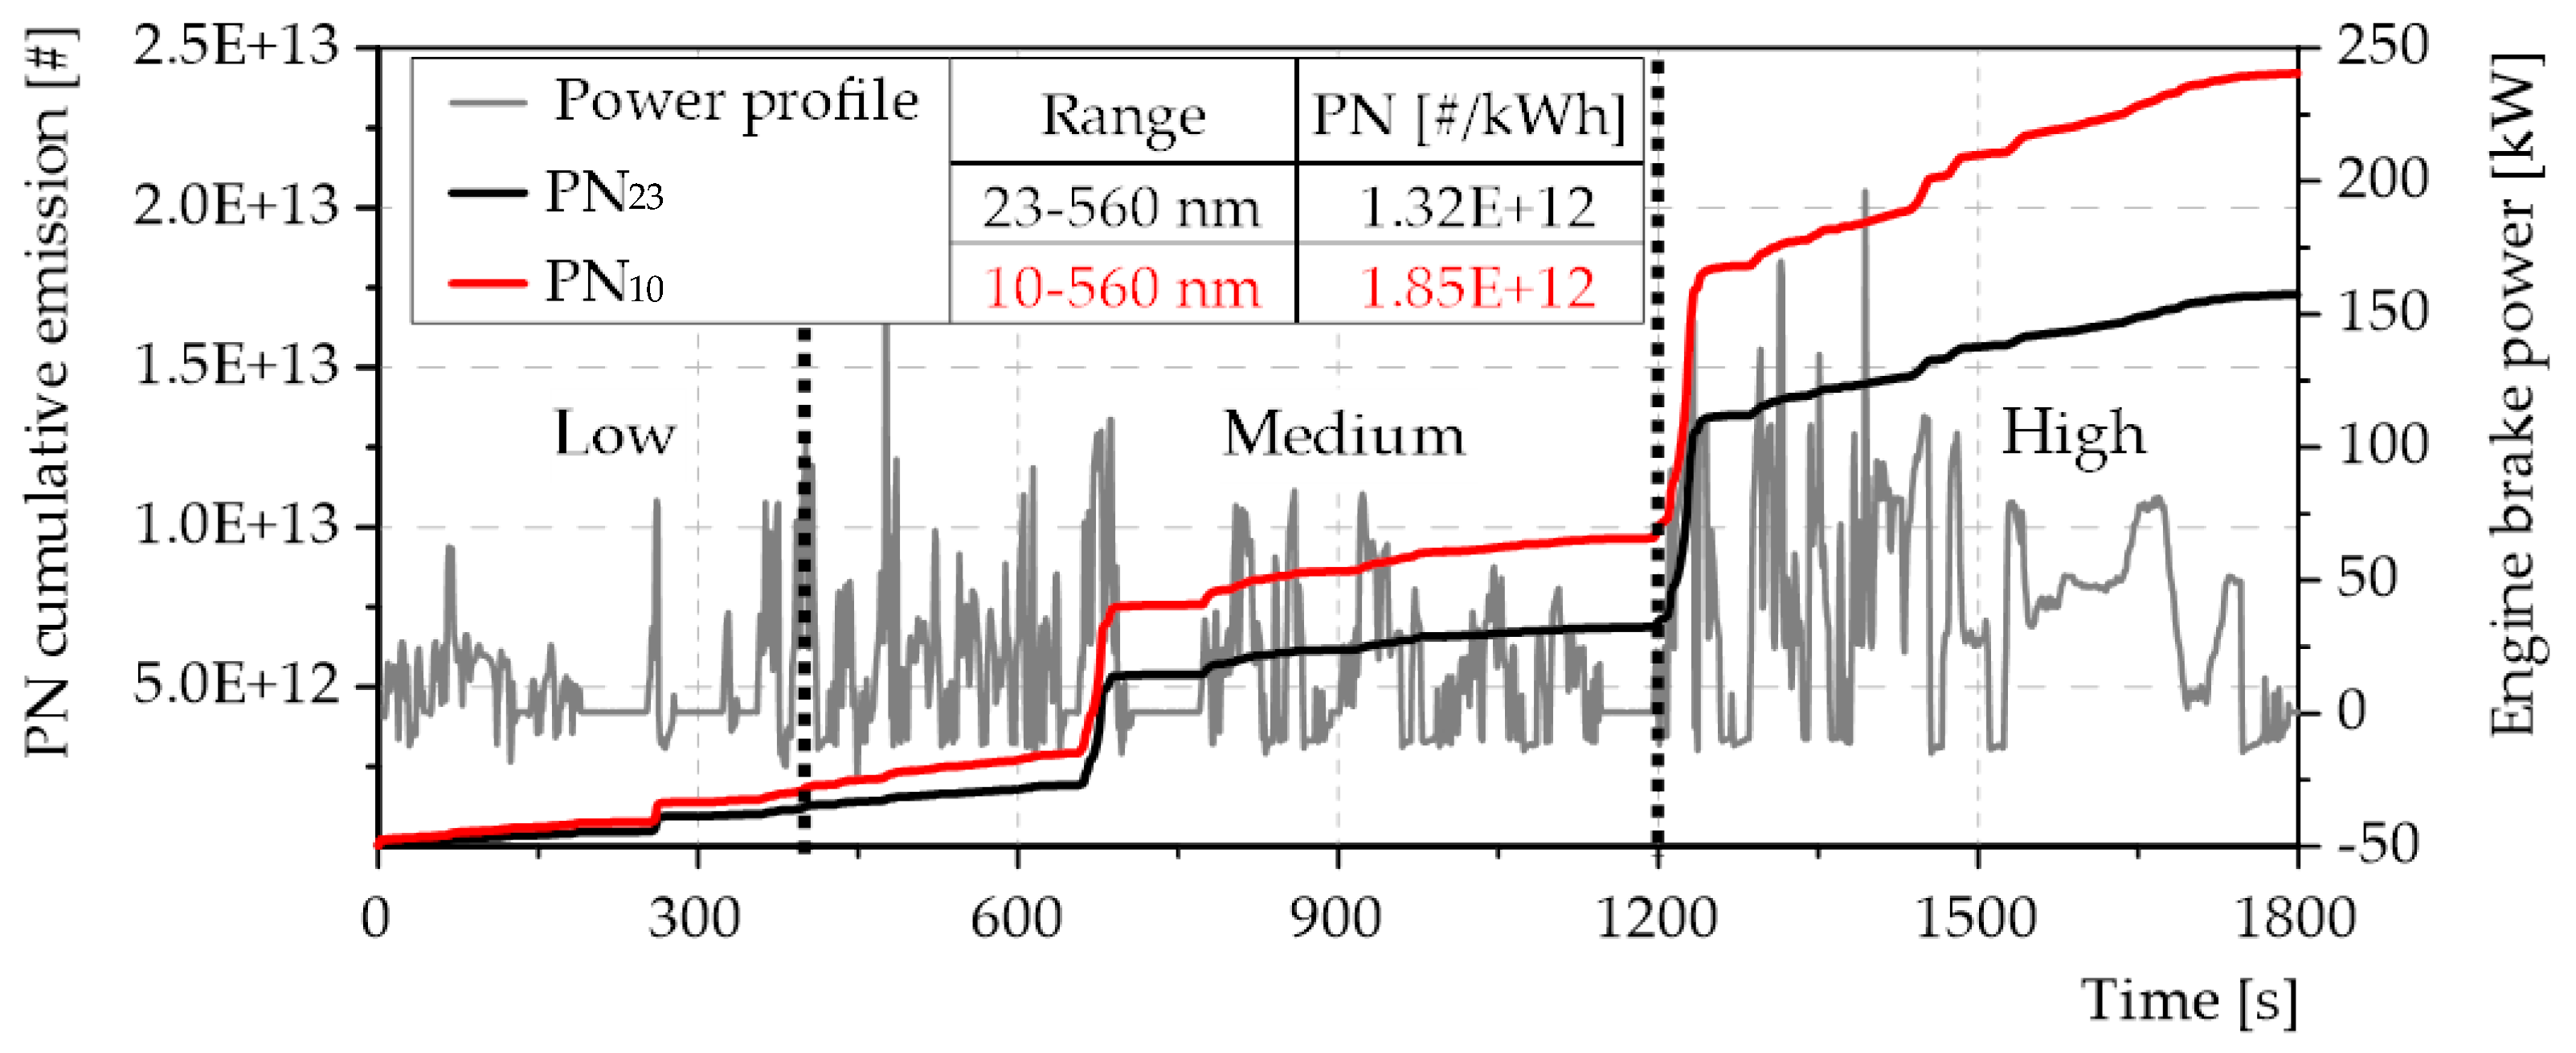
- Transient states of the engine showed to have an effect on PN emission, because these emissions increase due to variations in the engine power and the most critical parts were under dynamic variations after quasi-steady state conditions. Additionally, PN emissions were higher two time and three times higher than current Euro 6 limit (6e+11 #/kWh) when particles are measure from 23 nm and 10 nm respectively.
- Future research on the application of particulate filters should focus on evaluating the efficacy of these devices on particles sized between 10 nm and 23 nm, during both steady-state and transient conditions. This approach aims to determine if current technologies are adequate for meeting forthcoming regulatory requirements, or if there is a need for the development of new technologies.
Author Contributions
Funding
Institutional Review Board Statement
Informed Consent Statement
Data Availability Statement
Conflicts of Interest
Nomenclature
| ATS | aftertreatment systems |
| CNG | compressed natural gas |
| CO | carbon monoxide |
| CO2 | carbon dioxide |
| EEPS | engine exhaust particle sizer |
| HD | heavy-duty |
| LPG | liquefied petroleum gas |
| NOx | nitrogen oxides |
| PN | particle number |
| PN10 | particle number with diameters equal to or larger than 10 nm |
| PN23 | particle number with diameters equal to or larger than 23 nm |
| PTD | porous tube diluter |
| PSD | particle size distribution |
| RON | research octane number |
| SI | spark-ignition |
| TWC | three-way catalyst |
| UHC | unburned hydrocarbons |
| WHTC | world harmonized transient cycle |
References
- IEA, (International Energy Agency) Key World Energy Statistics 2020. Int. Energy Agency 2020, 33, 4649.
- Zhang, M.; Chen, Y.; Shen, Y.; Li, B. Tracking Climate Change in Central Asia through Temperature and Precipitation Extremes. J. Geogr. Sci. 2019, 29, 3–28. [CrossRef]
- Toumasatos, Z.; Kontses, A.; Doulgeris, S.; Samaras, Z.; Ntziachristos, L. Particle Emissions Measurements on CNG Vehicles Focusing on Sub-23nm. Aerosol Sci. Technol. 2021, 55, 182–193. [CrossRef]
- Ioannidis, G.; Li, C.; Tremper, P.; Riedel, T.; Ntziachristos, L. Application of CFD Modelling for Pollutant Dispersion at an Urban Traffic Hotspot. 2024, 1–18.
- Martin, W.; Ray, M. A Technical Summary of Euro 6/VI Vehicle Emission Standards. ICCT Brief. Pap. 2016, 1–17.
- Catapano, F.; Iorio, S. Di; Sementa, P.; Vaglieco, B.M. Optimization of the Compressed Natural Gas Direct Injection in a Small Research Spark Ignition Engine. Int. J. Engine Res. 2017, 18, 118–130. [CrossRef]
- Payri, R.; Gimeno, J.; Marti-Aldaravi, P.; Mendoza Alvarez, V. Study of the Hydraulic Characteristics of Two Injectors Fed with Different Fuels in a GDI System. Fuel 2022, 317. [CrossRef]
- General Secretariat of the European Union Council Limite En; Brussels, 2023; Vol. 1;.
- Pastor, J. V.; Micó, C.; Lewiski, F.; Tejada, F.J.; Tornatore, C. A Synergic Application of High-Oxygenated E-Fuels and New Bowl Designs for Low Soot Emissions: An Optical Analysis. Appl. Sci. 2023, 13. [CrossRef]
- Boger, T.; Rose, D.; He, S.; Joshi, A. Developments for Future EU7 Regulations and the Path to Zero Impact Emissions – A Catalyst Substrate and Filter Supplier’s Perspective. Transp. Eng. 2022, 10, 100129. [CrossRef]
- Noll, B.; del Val, S.; Schmidt, T.S.; Steffen, B. Analyzing the Competitiveness of Low-Carbon Drive-Technologies in Road-Freight: A Total Cost of Ownership Analysis in Europe. Appl. Energy 2022, 306. [CrossRef]
- Pastor, J. V.; García-Oliver, J.M.; Micó, C.; García-Carrero, A.A.; Gómez, A. Experimental Study of the Effect of Hydrotreated Vegetable Oil and Oxymethylene Ethers on Main Spray and Combustion Characteristics under Engine Combustion Network Spray A Conditions. Appl. Sci. 2020, 10. [CrossRef]
- Bermúdez, V.; Ruiz, S.; Sanchis, E.J.; Conde, B. Assessment of Exhaust Raw Emissions and Aftertreatment Performance in a Retrofitted Heavy Duty-Spark Ignition Engine Operating with Liquefied Petroleum Gas. J. Clean. Prod. 2024, 434, 140139. [CrossRef]
- Yeo, S.J.; Kim, J.; Lee, W.J. Potential Economic and Environmental Advantages of Liquid Petroleum Gas as a Marine Fuel through Analysis of Registered Ships in South Korea. J. Clean. Prod. 2022, 330, 129955. [CrossRef]
- García-Oliver, J.M.; Novella, R.; Micó, C.; De Leon-Ceriani, D. Numerical Analysis of the Combustion Process of Oxymethylene Ethers as Low-Carbon Fuels for Compression Ignition Engines. Int. J. Engine Res. 2023, 24, 2175–2186. [CrossRef]
- Nguyen Duc, K.; Nguyen Duy, V.; Hoang-Dinh, L.; Nguyen Viet, T.; Le-Anh, T. Performance and Emission Characteristics of a Port Fuel Injected, Spark Ignition Engine Fueled by Compressed Natural Gas. Sustain. Energy Technol. Assessments 2019, 31, 383–389. [CrossRef]
- Fosudo, T.; Kar, T.; Windom, B.; Olsen, D. Low-Carbon Fuels for Spark-Ignited Engines: A Comparative Study of Compressed Natural Gas and Liquefied Petroleum Gas on a CFR Engine with Exhaust Gas Recirculation. Fuel 2024, 360. [CrossRef]
- Splitter, D.; Boronat, V.; Chuahy, F.D.F.; Storey, J. Performance of Direct Injected Propane and Gasoline in a High Stroke-to-Bore Ratio SI Engine: Pathways to Diesel Efficiency Parity with Ultra Low Soot. Int. J. Engine Res. 2021, 22, 3475–3488. [CrossRef]
- Giechaskiel, B.; Lähde, T.; Clairotte, M.; Suarez-Bertoa, R.; Valverde, V.; Melas, A.D.; Selleri, T.; Bonnel, P. Emissions of Euro 6 Mono-and Bi-Fuel Gas Vehicles. Catalysts 2022, 12. [CrossRef]
- Ramalingam, S.; Mahalakshmi, N. V. Influence of High Pressure Fuel Injection System on Engine Performance and Combustion Characteristics of Moringa Oleifera Biodiesel and Its Blends. Fuel 2020, 279, 118461. [CrossRef]
- Distaso, E.; Amirante, R.; Tamburrano, P.; Reitz, R.D.; Liu, H.; Li, Z.; Xu, H.; Ma, X.; Shuai, S.; Napolitano, P.; et al. Particle Emissions from a HD SI Gas Engine Fueled with LPG and CNG. Appl. Energy 2020, 269, 671–678. [CrossRef]
- Bermúdez, V.; Ruiz, S.; Conde, B.; Soto, L. Analysis of the Aftertreatment Performance in HD-SI Engine Fueled with LPG. Int. J. Engine Res. 2023, 24, 16–28. [CrossRef]
- Kontses, A.; Triantafyllopoulos, G.; Ntziachristos, L.; Samaras, Z. Particle Number (PN) Emissions from Gasoline, Diesel, LPG, CNG and Hybrid-Electric Light-Duty Vehicles under Real-World Driving Conditions. Atmos. Environ. 2020, 222. [CrossRef]
- Distaso, E.; Amirante, R.; Calò, G.; De Palma, P.; Tamburrano, P. Evolution of Soot Particle Number, Mass and Size Distribution along the Exhaust Line of a Heavy-Duty Engine Fueled with Compressed Natural Gas. Energies 2020, 13. [CrossRef]
- Napolitano, P.; Di Maio, D.; Guido, C.; Merlone Borla, E.; Torbati, R. Experimental Investigation on Particulate Filters for Heavy-Duty Natural Gas Engines: Potentialities toward EURO VII Regulation. J. Environ. Manage. 2023, 331. [CrossRef]
- Claßen, J.; Pischinger, S.; Krysmon, S.; Sterlepper, S.; Dorscheidt, F.; Doucet, M.; Reuber, C.; Görgen, M.; Scharf, J.; Nijs, M.; et al. Statistically Supported Real Driving Emission Calibration: Using Cycle Generation to Provide Vehicle-Specific and Statistically Representative Test Scenarios for Euro 7. Int. J. Engine Res. 2020, 21, 1783–1799. [CrossRef]
- Samaras, Z.C.; Andersson, J.; Bergmann, A.; Hausberger, S.; Toumasatos, Z.; Keskinen, J.; Haisch, C.; Kontses, A.; Ntziachristos, L.D.; Landl, L.; et al. Measuring Automotive Exhaust Particles down to 10 Nm. SAE Tech. Pap. 2020, 2017, 539–550. [CrossRef]
- Giechaskiel, B.; Lähde, T.; Gandi, S.; Keller, S.; Kreutziger, P.; Mamakos, A. Assessment of 10-Nm Particle Number (Pn) Portable Emissions Measurement Systems (Pems) for Future Regulations. Int. J. Environ. Res. Public Health 2020, 17. [CrossRef]
- Veremchuk, L. V.; Vitkina, T.I.; Barskova, L.S.; Gvozdenko, T.A.; Mineeva, E.E. Estimation of the Size Distribution of Suspended Particulate Matters in the Urban Atmospheric Surface Layer and Its Influence on Bronchopulmonary Pathology. Atmosphere (Basel). 2021, 12, 1–10. [CrossRef]
- Schraufnagel, D.E. The Health Effects of Ultrafine Particles. Exp. Mol. Med. 2020, 52, 311–317. [CrossRef]
- Samaras, Z.; Rieker, M.; Papaioannou, E.; van Dorp, W.F.; Kousoulidou, M.; Ntziachristos, L.; Andersson, J.; Bergmann, A.; Hausberger, S.; Keskinen, J.; et al. Perspectives for Regulating 10 Nm Particle Number Emissions Based on Novel Measurement Methodologies. J. Aerosol Sci. 2022, 162. [CrossRef]
- Fosudo, T.; Kar, T.; Marchese, A.; Windom, B.; Olsen, D. The Impact of LPG Composition on Performance, Emissions, and Combustion Characteristics of a Pre-Mixed Spark-Ignited CFR Engine. SAE Tech. Pap. 2022, 1–11. [CrossRef]
- Liu, H.; Li, Z.; Xu, H.; Ma, X.; Shuai, S. Nucleation Mode Particle Evolution in a Gasoline Direct Injection Engine with/without a Three-Way Catalyst Converter. Appl. Energy 2020, 259. [CrossRef]
- Xing, J.; Shao, L.; Zheng, R.; Peng, J.; Wang, W.; Guo, Q.; Wang, Y.; Qin, Y.; Shuai, S.; Hu, M. Individual Particles Emitted from Gasoline Engines: Impact of Engine Types, Engine Loads and Fuel Components. J. Clean. Prod. 2017, 149, 461–471. [CrossRef]
- Yang, Z.; Ge, Y.; Thomas, D.; Wang, X.; Su, S.; Li, H.; He, H. Real Driving Particle Number (PN) Emissions from China-6 Compliant PFI and GDI Hybrid Electrical Vehicles. Atmos. Environ. 2019, 199, 70–79. [CrossRef]
- Napolitano, P.; Di Domenico, D.; Di Maio, D.; Guido, C.; Golini, S. Ultra-Fine Particle Emissions Characterization and Reduction Technologies in a NG Heavy Duty Engine. Atmosphere (Basel). 2022, 13. [CrossRef]
- Liu, H.; Li, Z.; Zhang, M.; Xu, H.; Ma, X.; Shuai, S. Exhaust Non-Volatile Particle Filtration Characteristics of Three-Way Catalyst and Influencing Factors in a Gasoline Direct Injection Engine Compared to Gasoline Particulate Filter. Fuel 2021, 290. [CrossRef]
- Giechaskiel, B.; Grigoratos, T.; Dilara, P.; Karageorgiou, T.; Ntziachristos, L.; Samaras, Z. Light-Duty Vehicle Brake Emission Factors. Atmosphere (Basel). 2024, 15, 1–20. [CrossRef]
- Gelner, A.D.; Rothe, D.; Kykal, C.; Irwin, M.; Sommer, A.; Pastoetter, C.; Härtl, M.; Jaensch, M.; Wachtmeister, G. Particle Emissions of a Heavy-Duty Engine Fueled with Polyoxymethylene Dimethyl Ethers (OME). Environ. Sci. Atmos. 2022, 2, 291–304. [CrossRef]
| Characteristic | Value |
|---|---|
| Style | 4-stroke, HD-SI Engine |
| Emission standard | EURO VI |
| Maximum power | 221 kW@2250rpm |
| Maximum brake torque | 1070Nm@1890rpm |
| Maximum injection | 12 bar |
| Injector type | Peak and Hold |
| Number of valves per cylinder | 2 |
| Total displaced volume | 7200 cm3 |
| Number of cylinders | 8 |
| Compression ratio | 11.2:1 |
| TWC length | 0.1438 m |
| TWC diameter | 0.1524 |
| TWC volume | 0.002262 m3 |
| TWC cell density | 600 cpsi |
| Characteristic | Value |
|---|---|
| C2 content | 0.53 %V/V |
| C3 content | 93.62 %V/V |
| C4 content | 5.82 %V/V |
| C5 content | 0.03 %V/V |
| Density (T=15°C) | 511.05 kg/m3 |
| Density (T=50°C) | 454.59 kg/m3 |
| Viscosity (T=20°C) | 78.96 μP |
| Air to fuel ratio (AFR) | 15.42 |
| Vaporization temperature | −37 °C |
| Lower heating value | 45.86 MJ/kg |
| Research octane number (RON) | 110.35 |
| Magnitude | Sensor/Instrument | Range | Sensitivity |
|---|---|---|---|
| Mean pressure | Piezoelectric sensor | 0 - 70 bar | ±1 [%] |
| Air mass flow | AVL Flowsonix Air | 0 ± 2400 kg/h | ±1 [%] |
| Fuel mass flow | Emerson Coriolis | 0 - 2180 kg/h | ±0.35 [%] |
| Temperature | Thermocouple Type K | -200 – 1, 2000°C | ±2.5 [°C] |
| Torque | Torquimeter HBM T40 | 0 – 2000 Nm | ±0.05 [%] |
| PN and PSD | TSI-EEPS | 5.6 nm: 108 #/cm3 | ±5% actual value |
| 560 nm: 106 #/cm3 |
Disclaimer/Publisher’s Note: The statements, opinions and data contained in all publications are solely those of the individual author(s) and contributor(s) and not of MDPI and/or the editor(s). MDPI and/or the editor(s) disclaim responsibility for any injury to people or property resulting from any ideas, methods, instructions or products referred to in the content. |
© 2024 by the authors. Licensee MDPI, Basel, Switzerland. This article is an open access article distributed under the terms and conditions of the Creative Commons Attribution (CC BY) license (http://creativecommons.org/licenses/by/4.0/).


