Submitted:
22 March 2024
Posted:
25 March 2024
You are already at the latest version
Abstract
Keywords:
1. Introduction
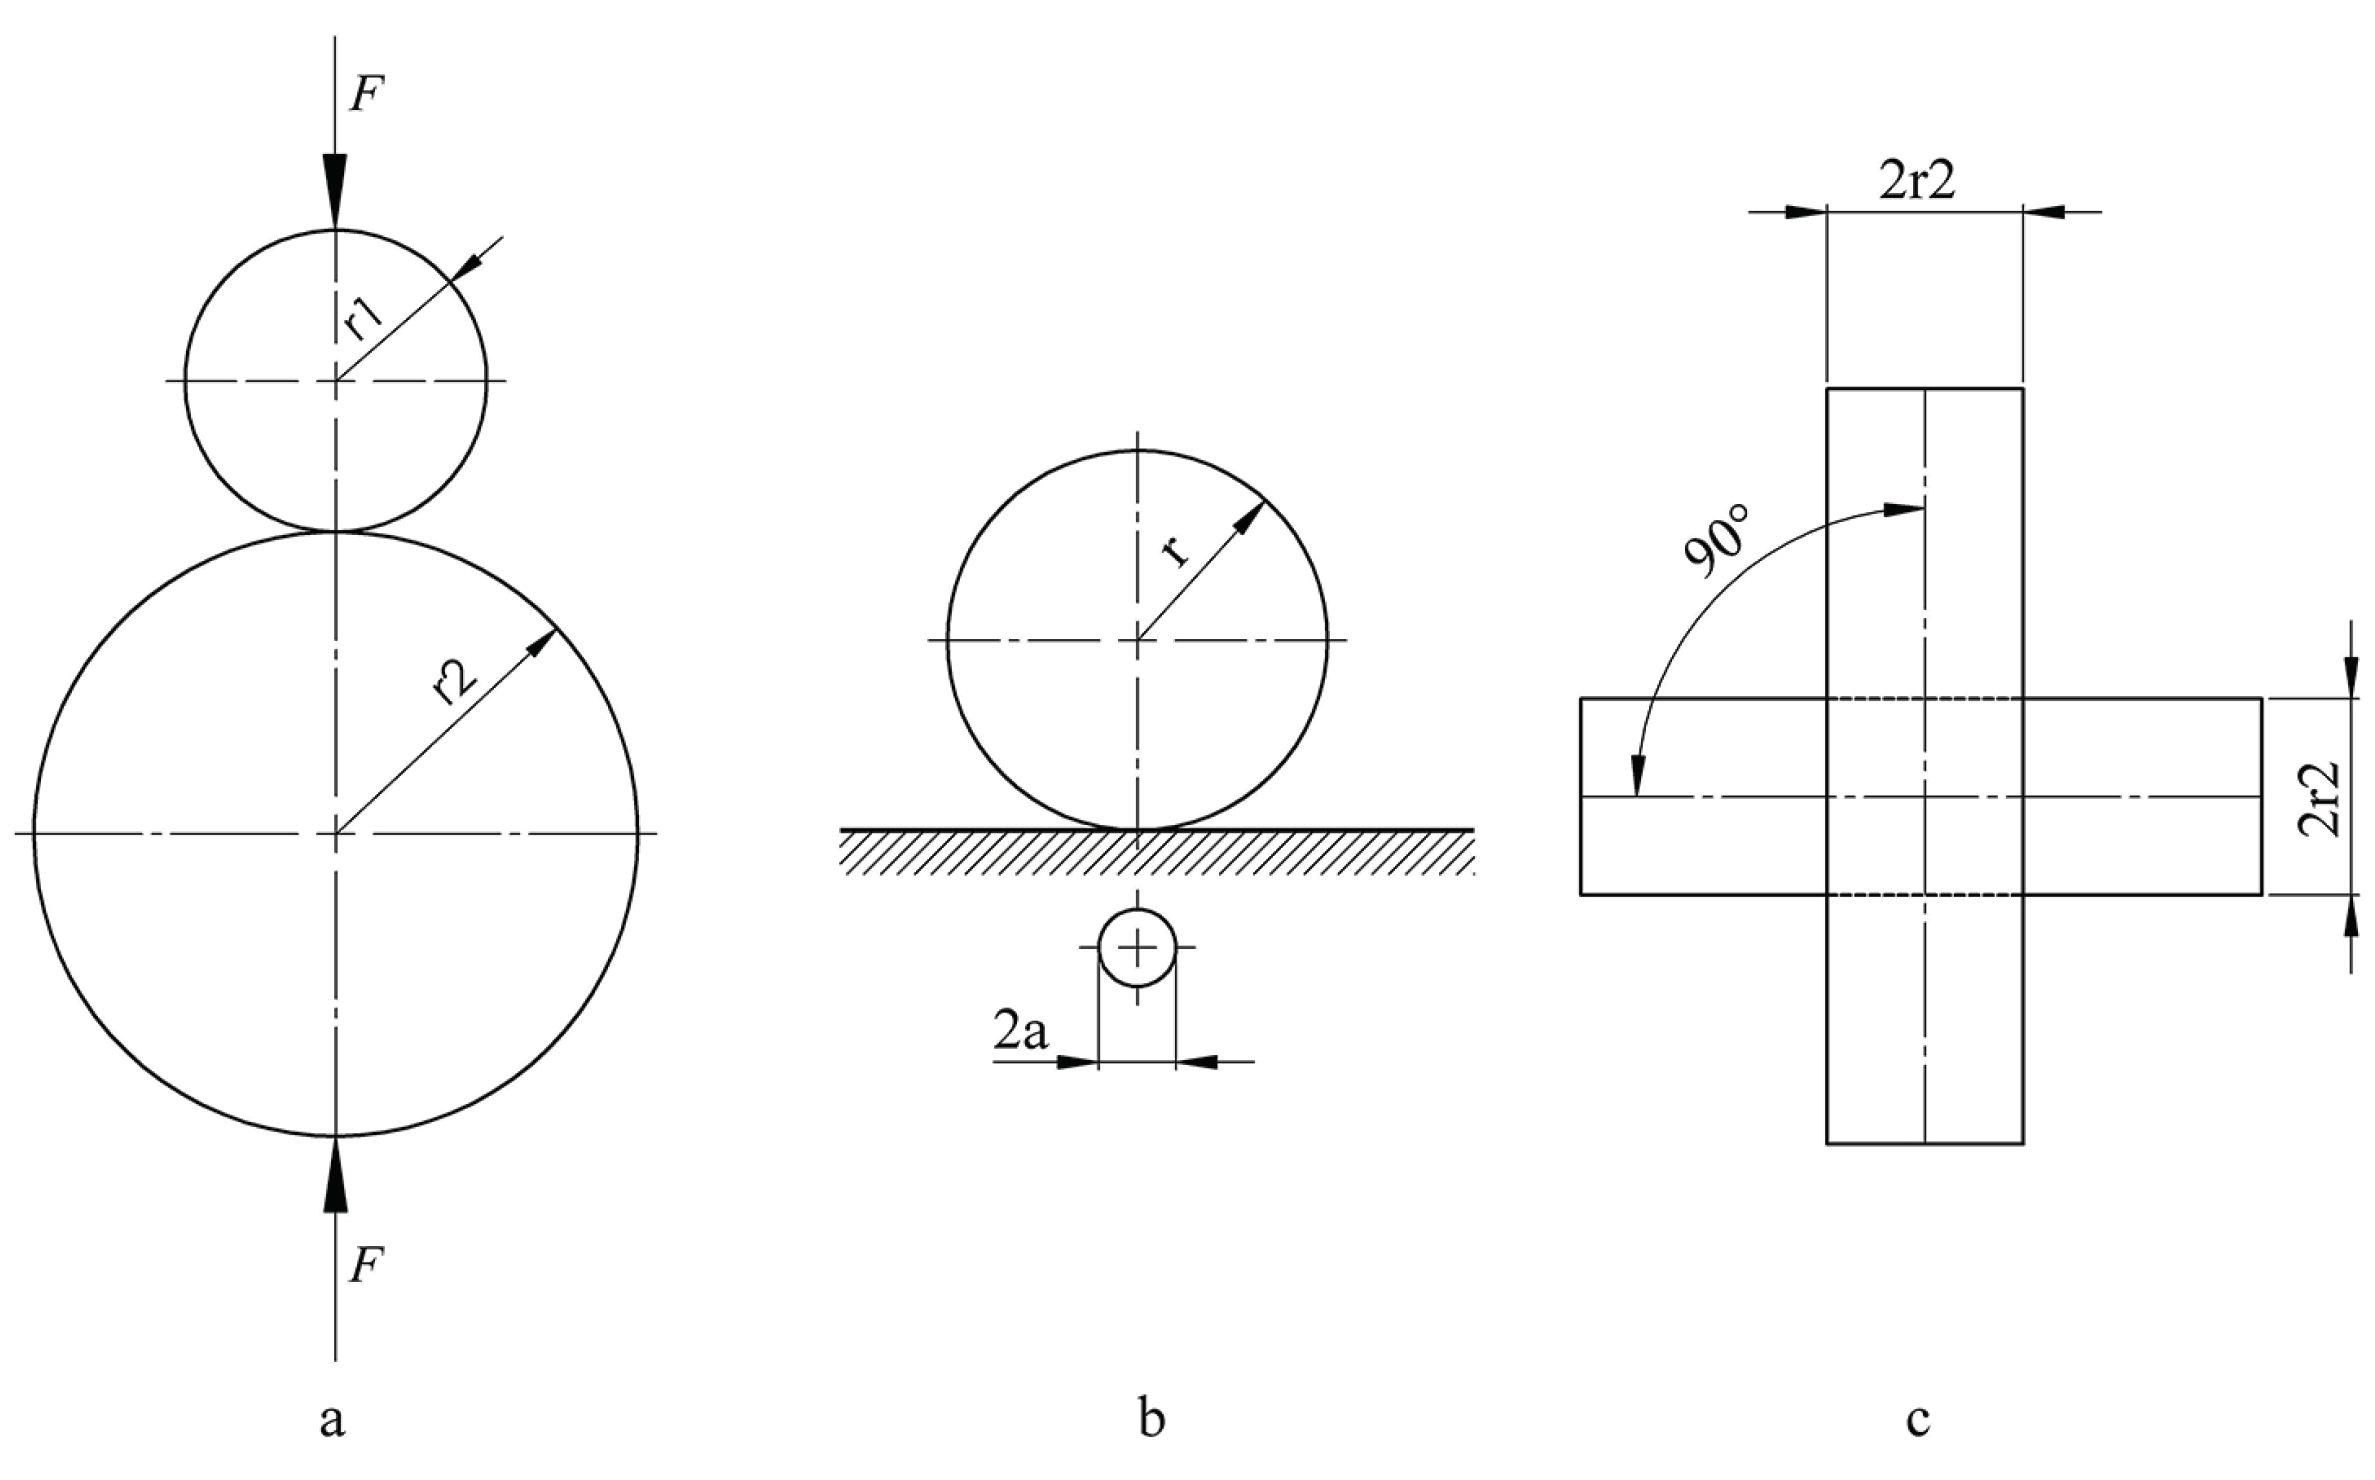
2. Theoretical Considerations about Electrical Contacts
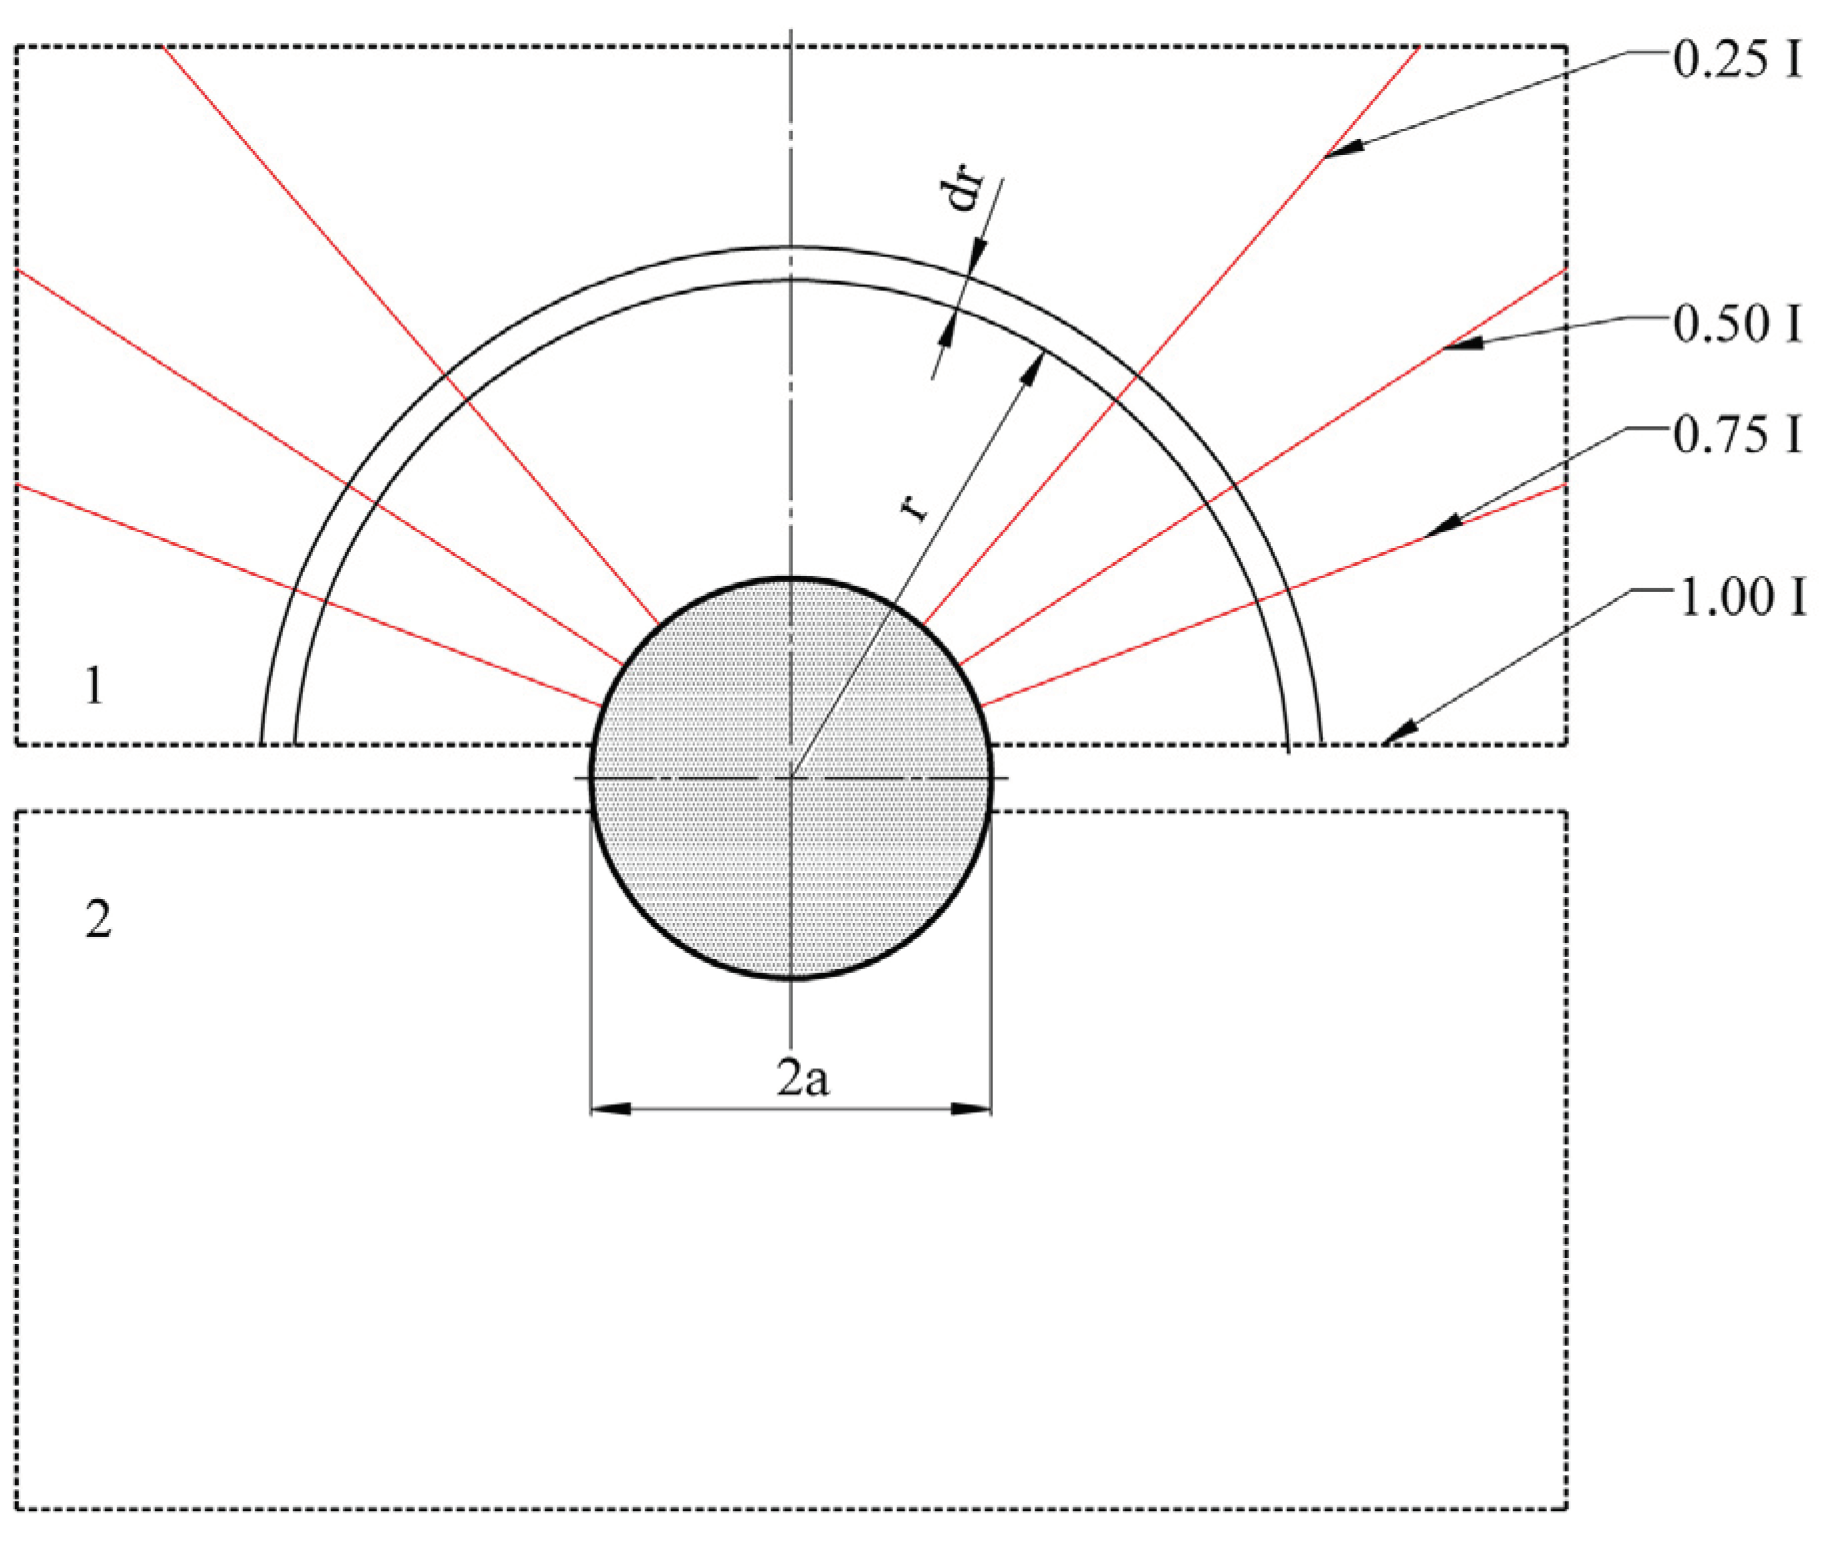
2.1. The Model of the Infinite Conductivity Sphere
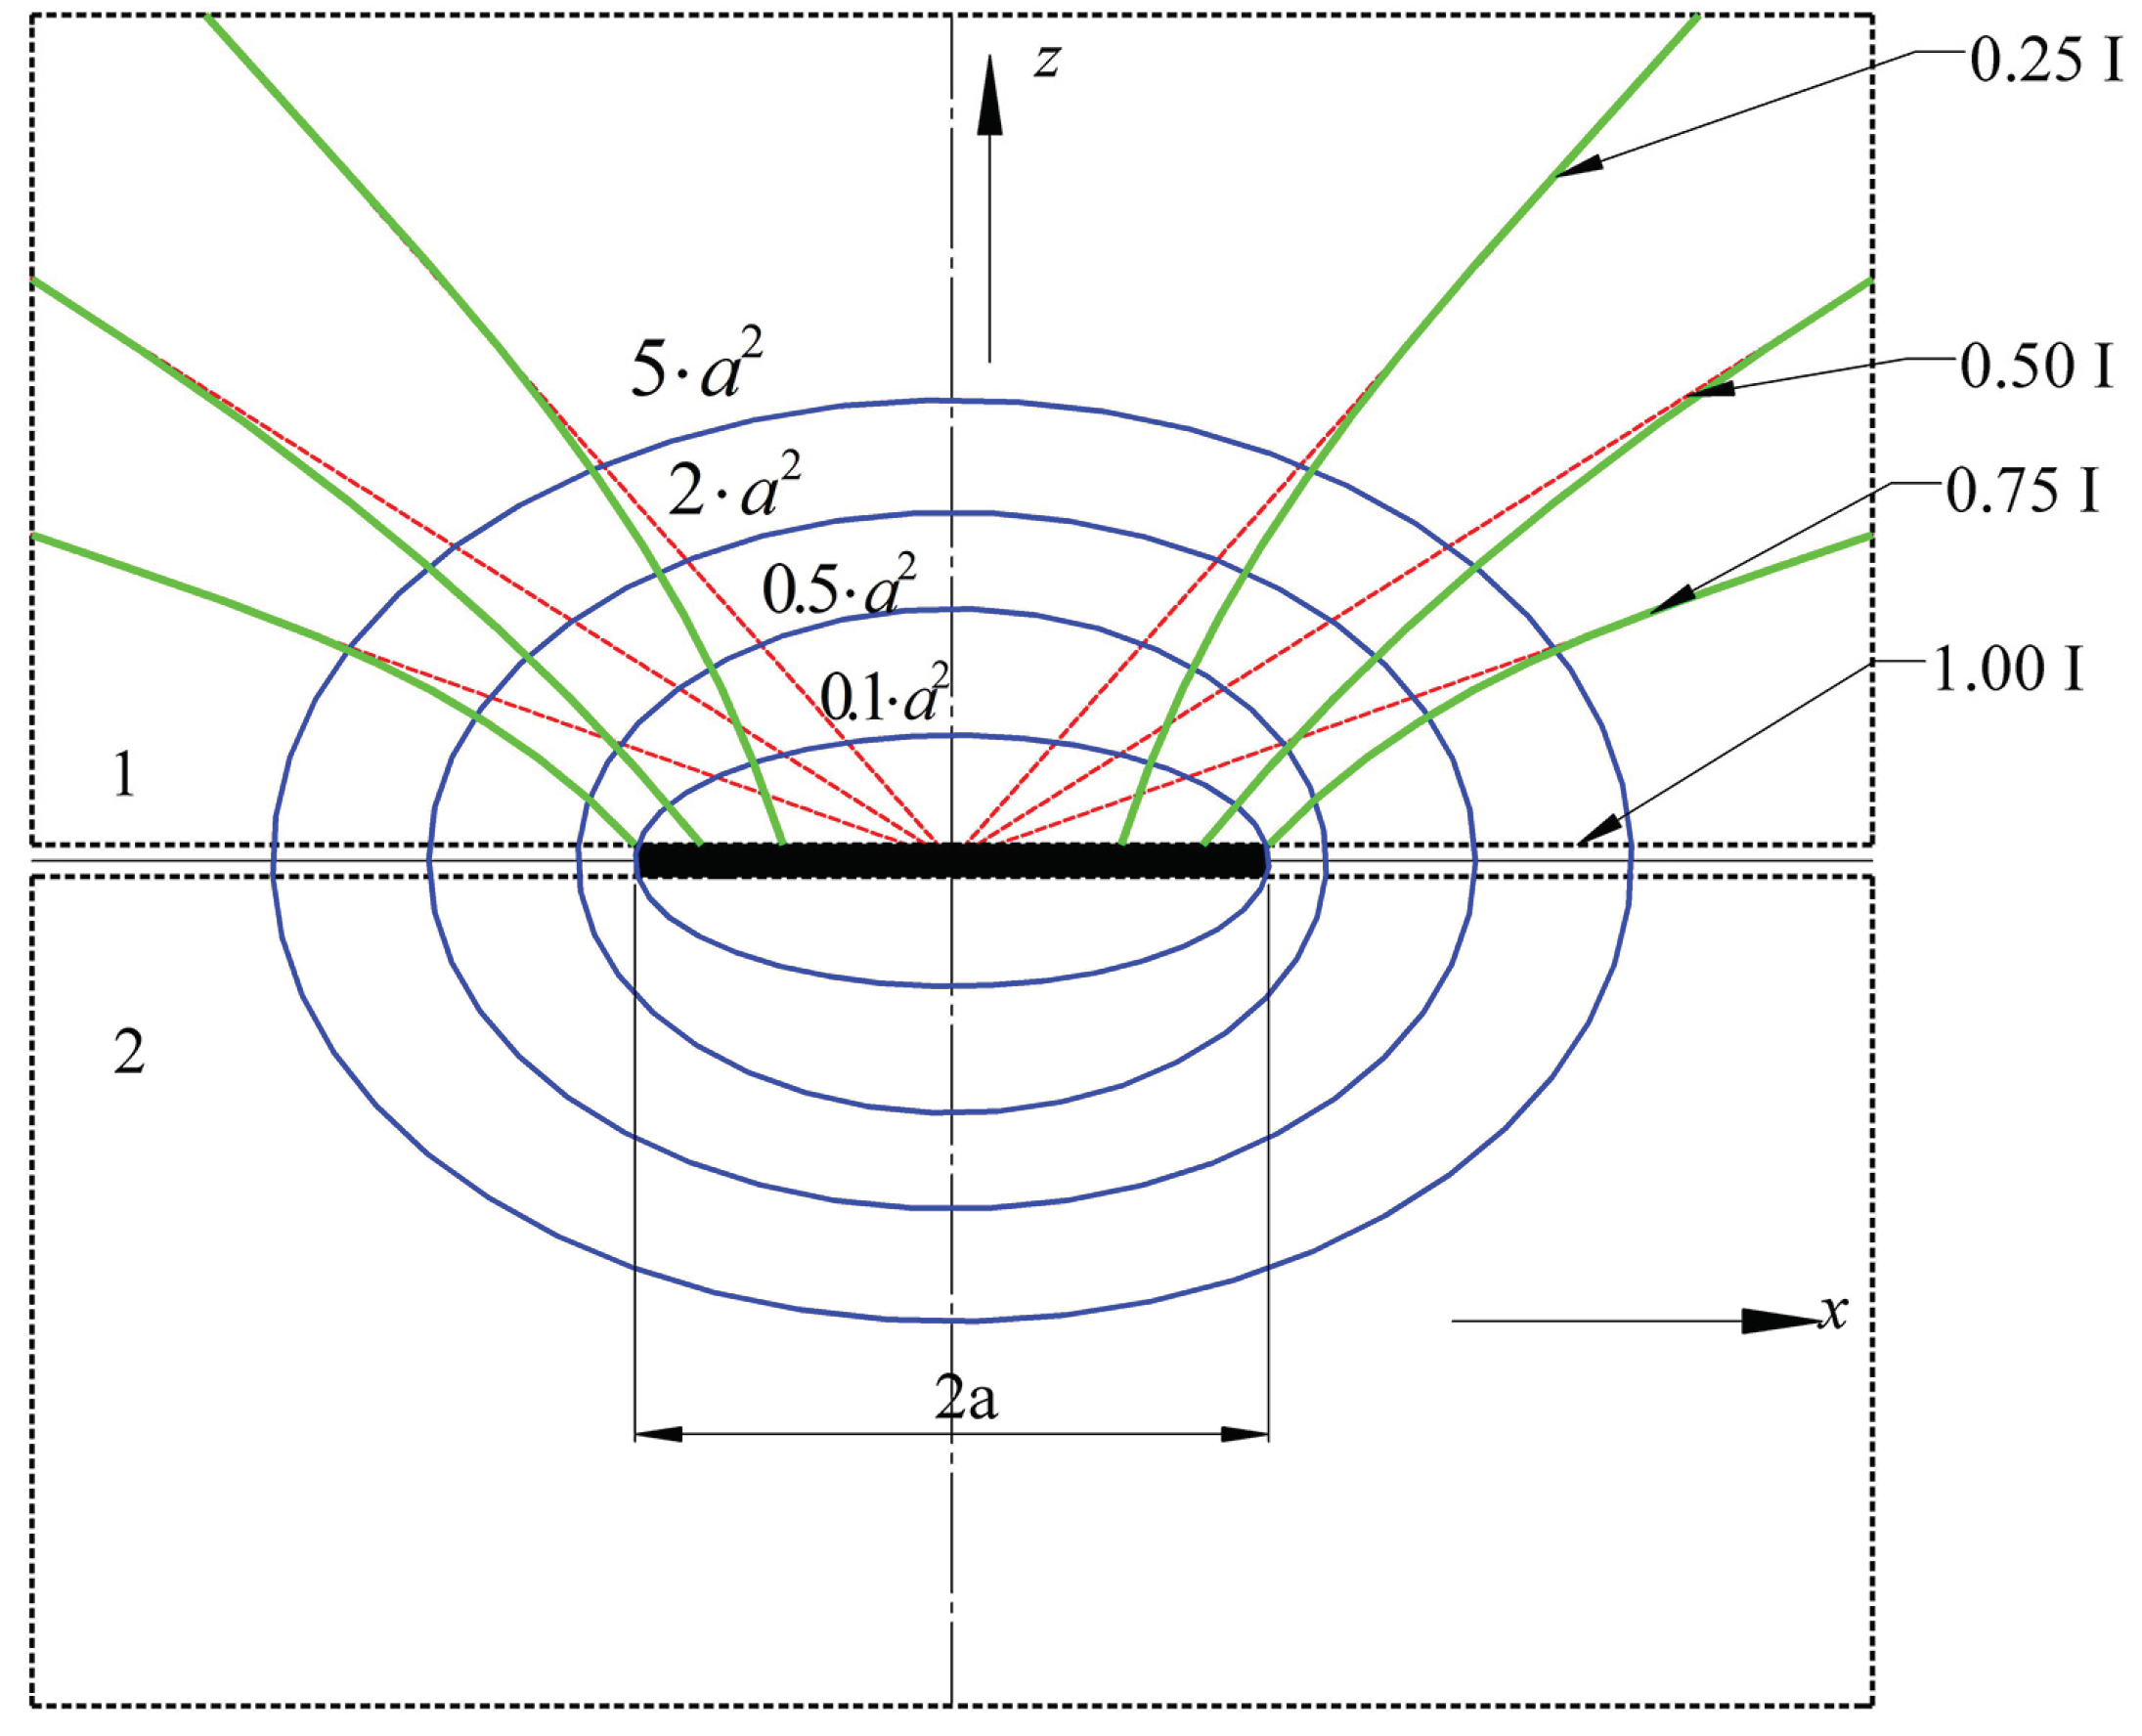
2.2. The Flattened Ellipsoid Model
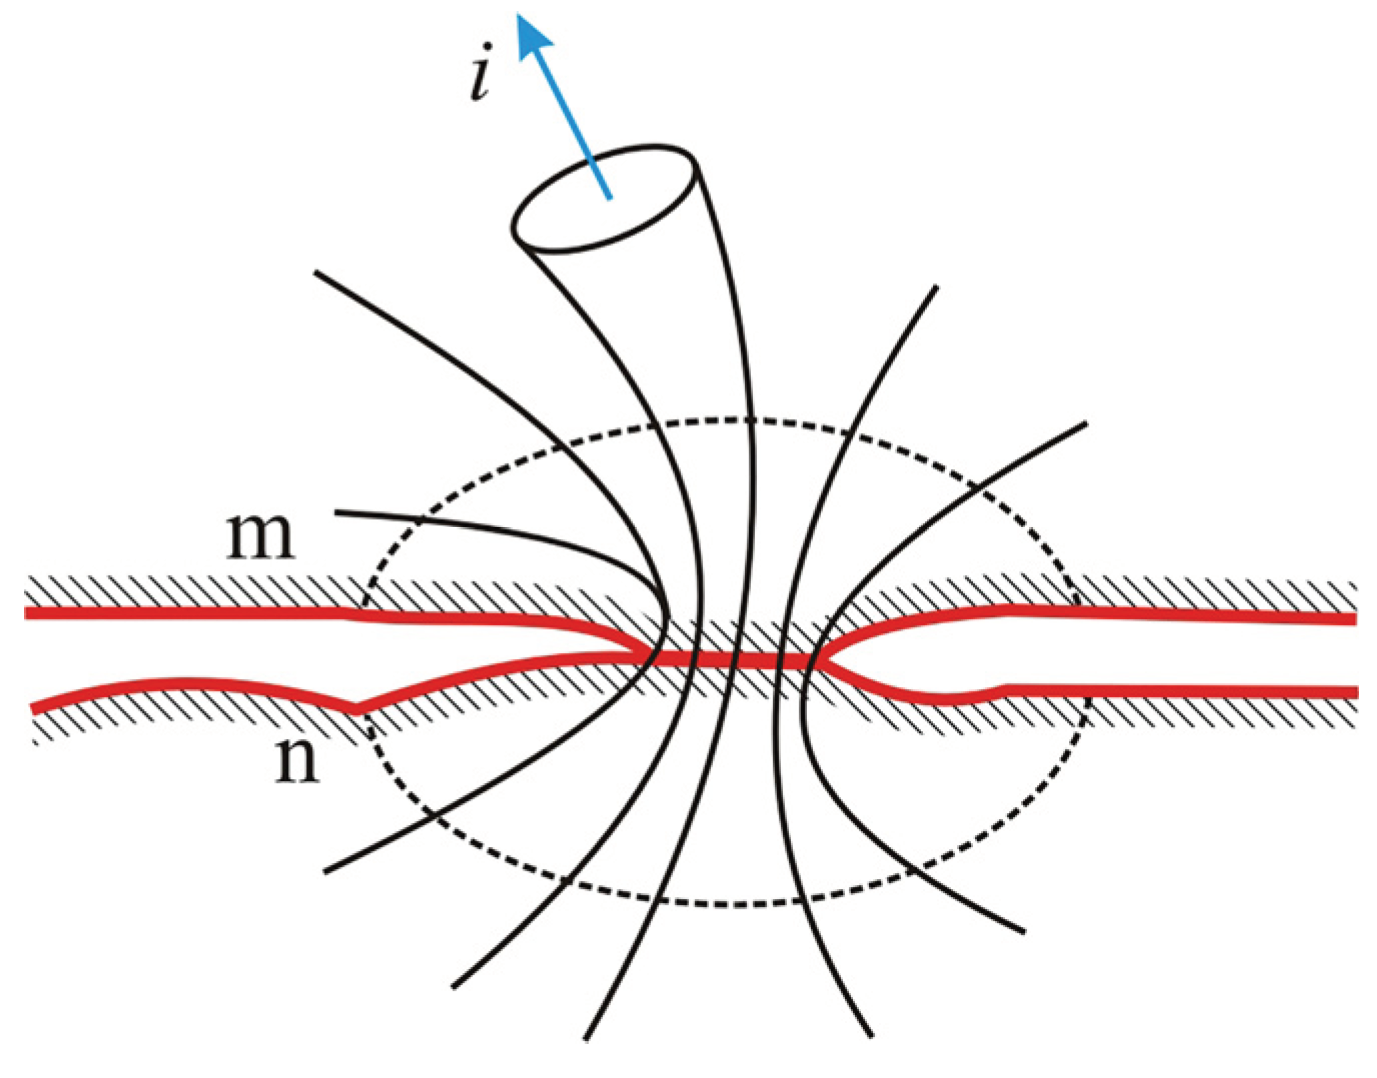
2.3. The Thermal Regime of Electrical Contacts
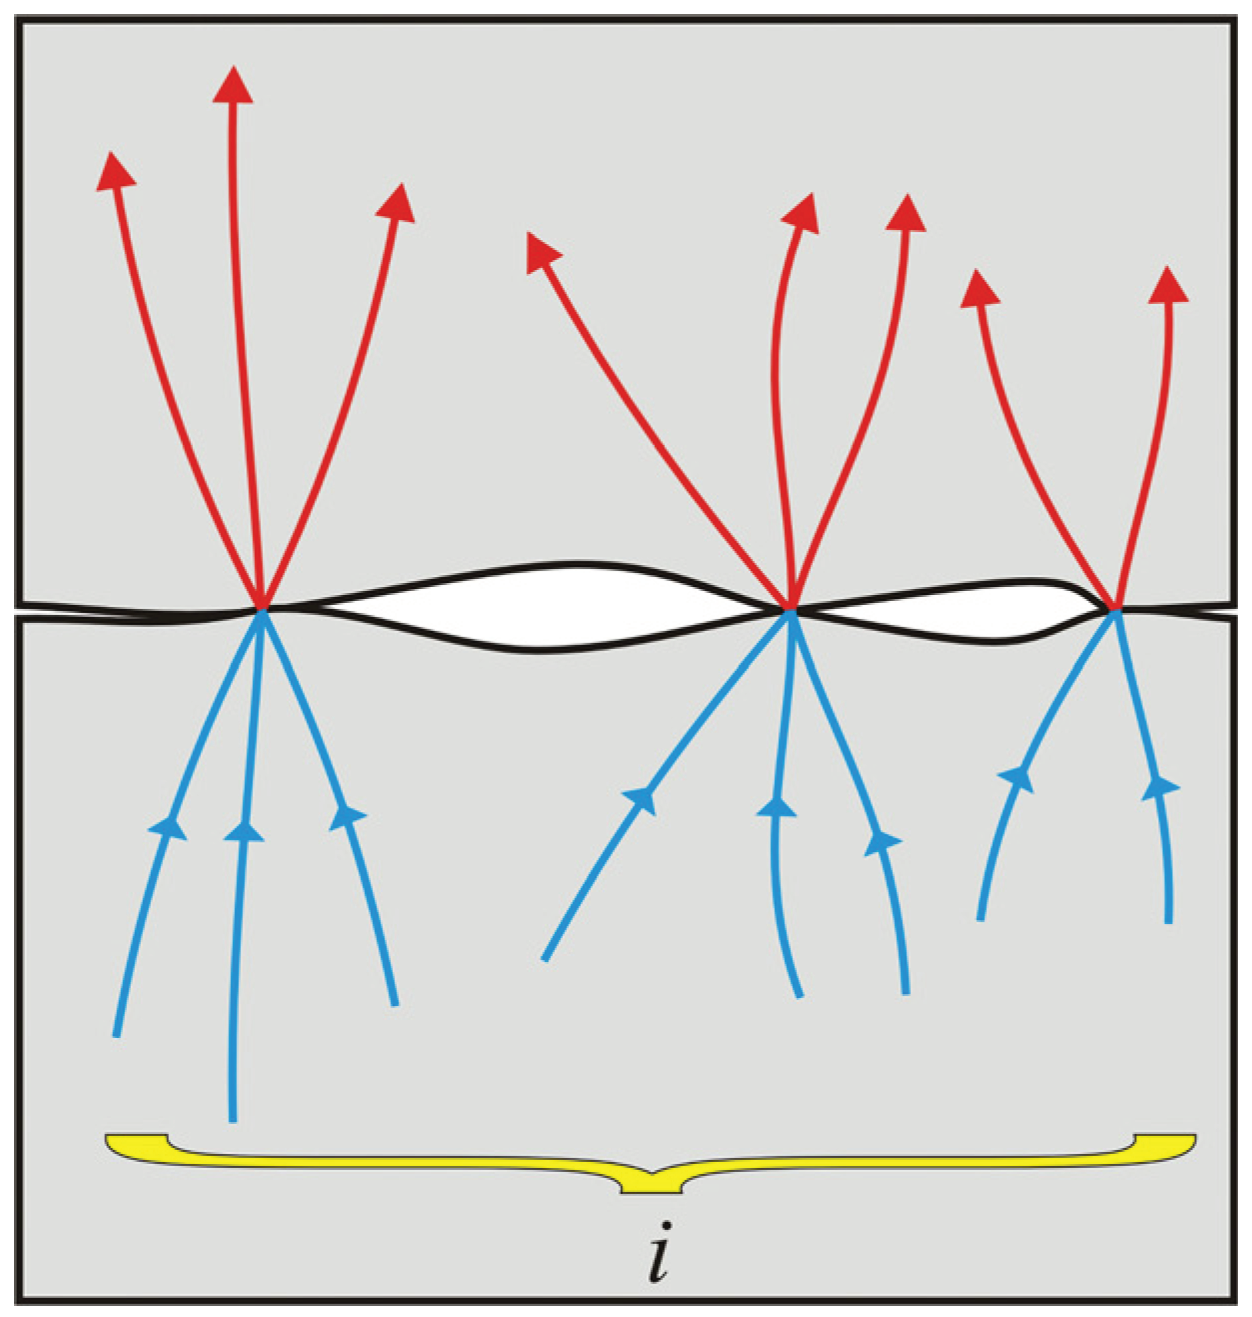
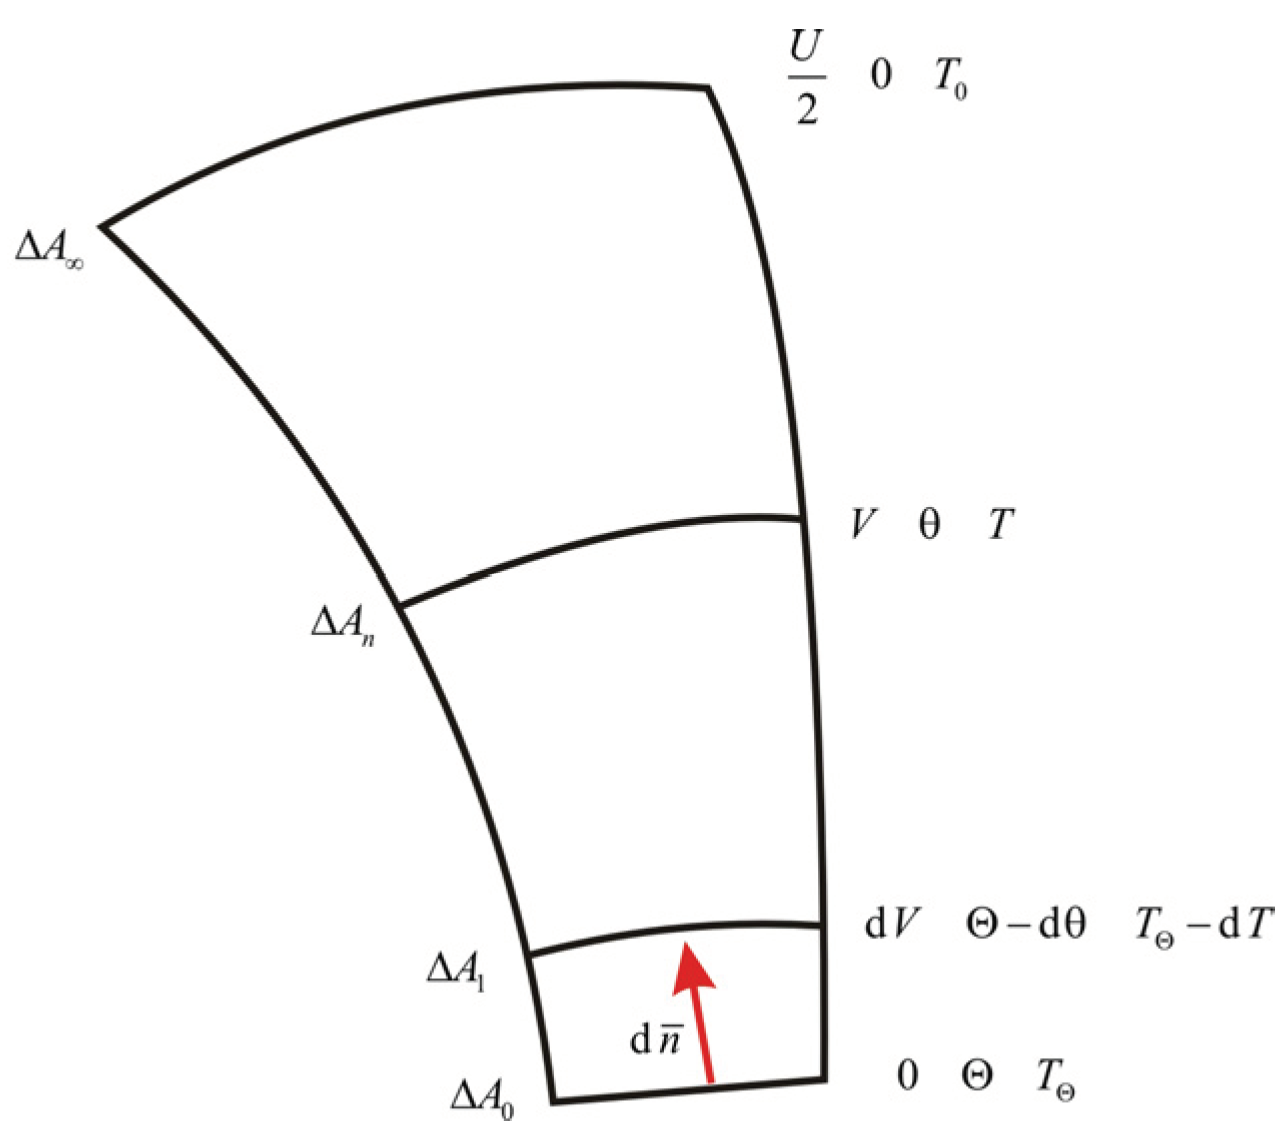
- − The thermal flux developed in a certain current tube is transmitted outwards only through that current tube. There is no heat transfer between adjacent points m and n in Figure 8, which are assumed to be at the same temperature;
- − The highest overtemperature is at ΔA0 surface, which also defines an isothermal surface, as a result of which the greatest striction is located in the contact zone;
- − The contact elements are made of the same homogeneous and isotropic material.
3. Modeling and Simulation of the Electrical Contacts Using Numerical Methods
3.1. Geometry of the Model
3.2. The Step-by-Step Simulation Setup for Comsol
4. Simulation Results and Discussion
4.1. Results of the Mechanical Simulation
4.2. Results of the Electro-Thermal Simulation
5. Conclusions
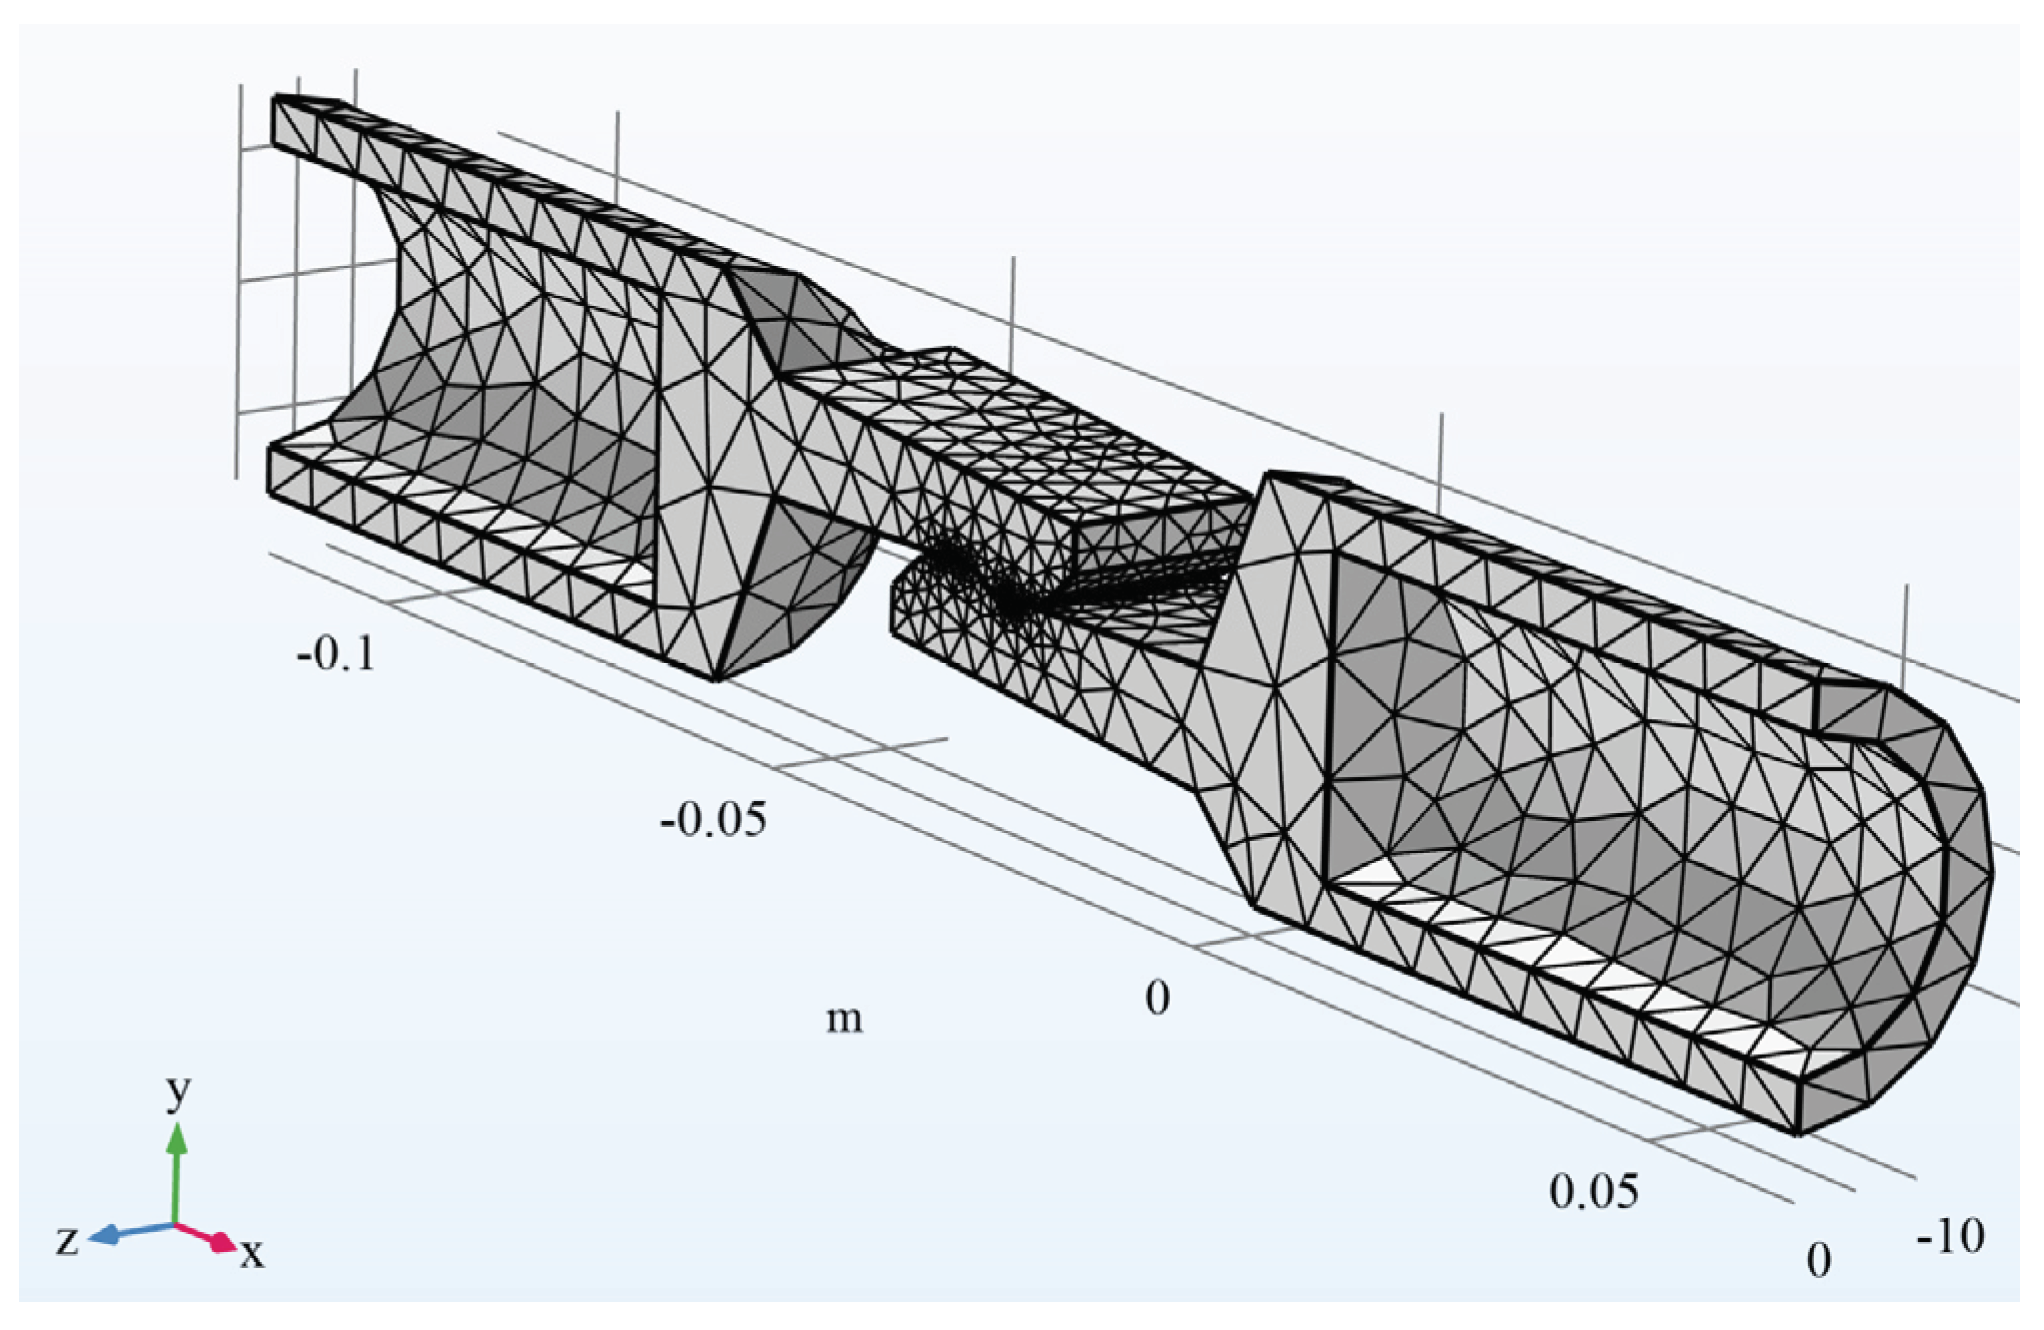
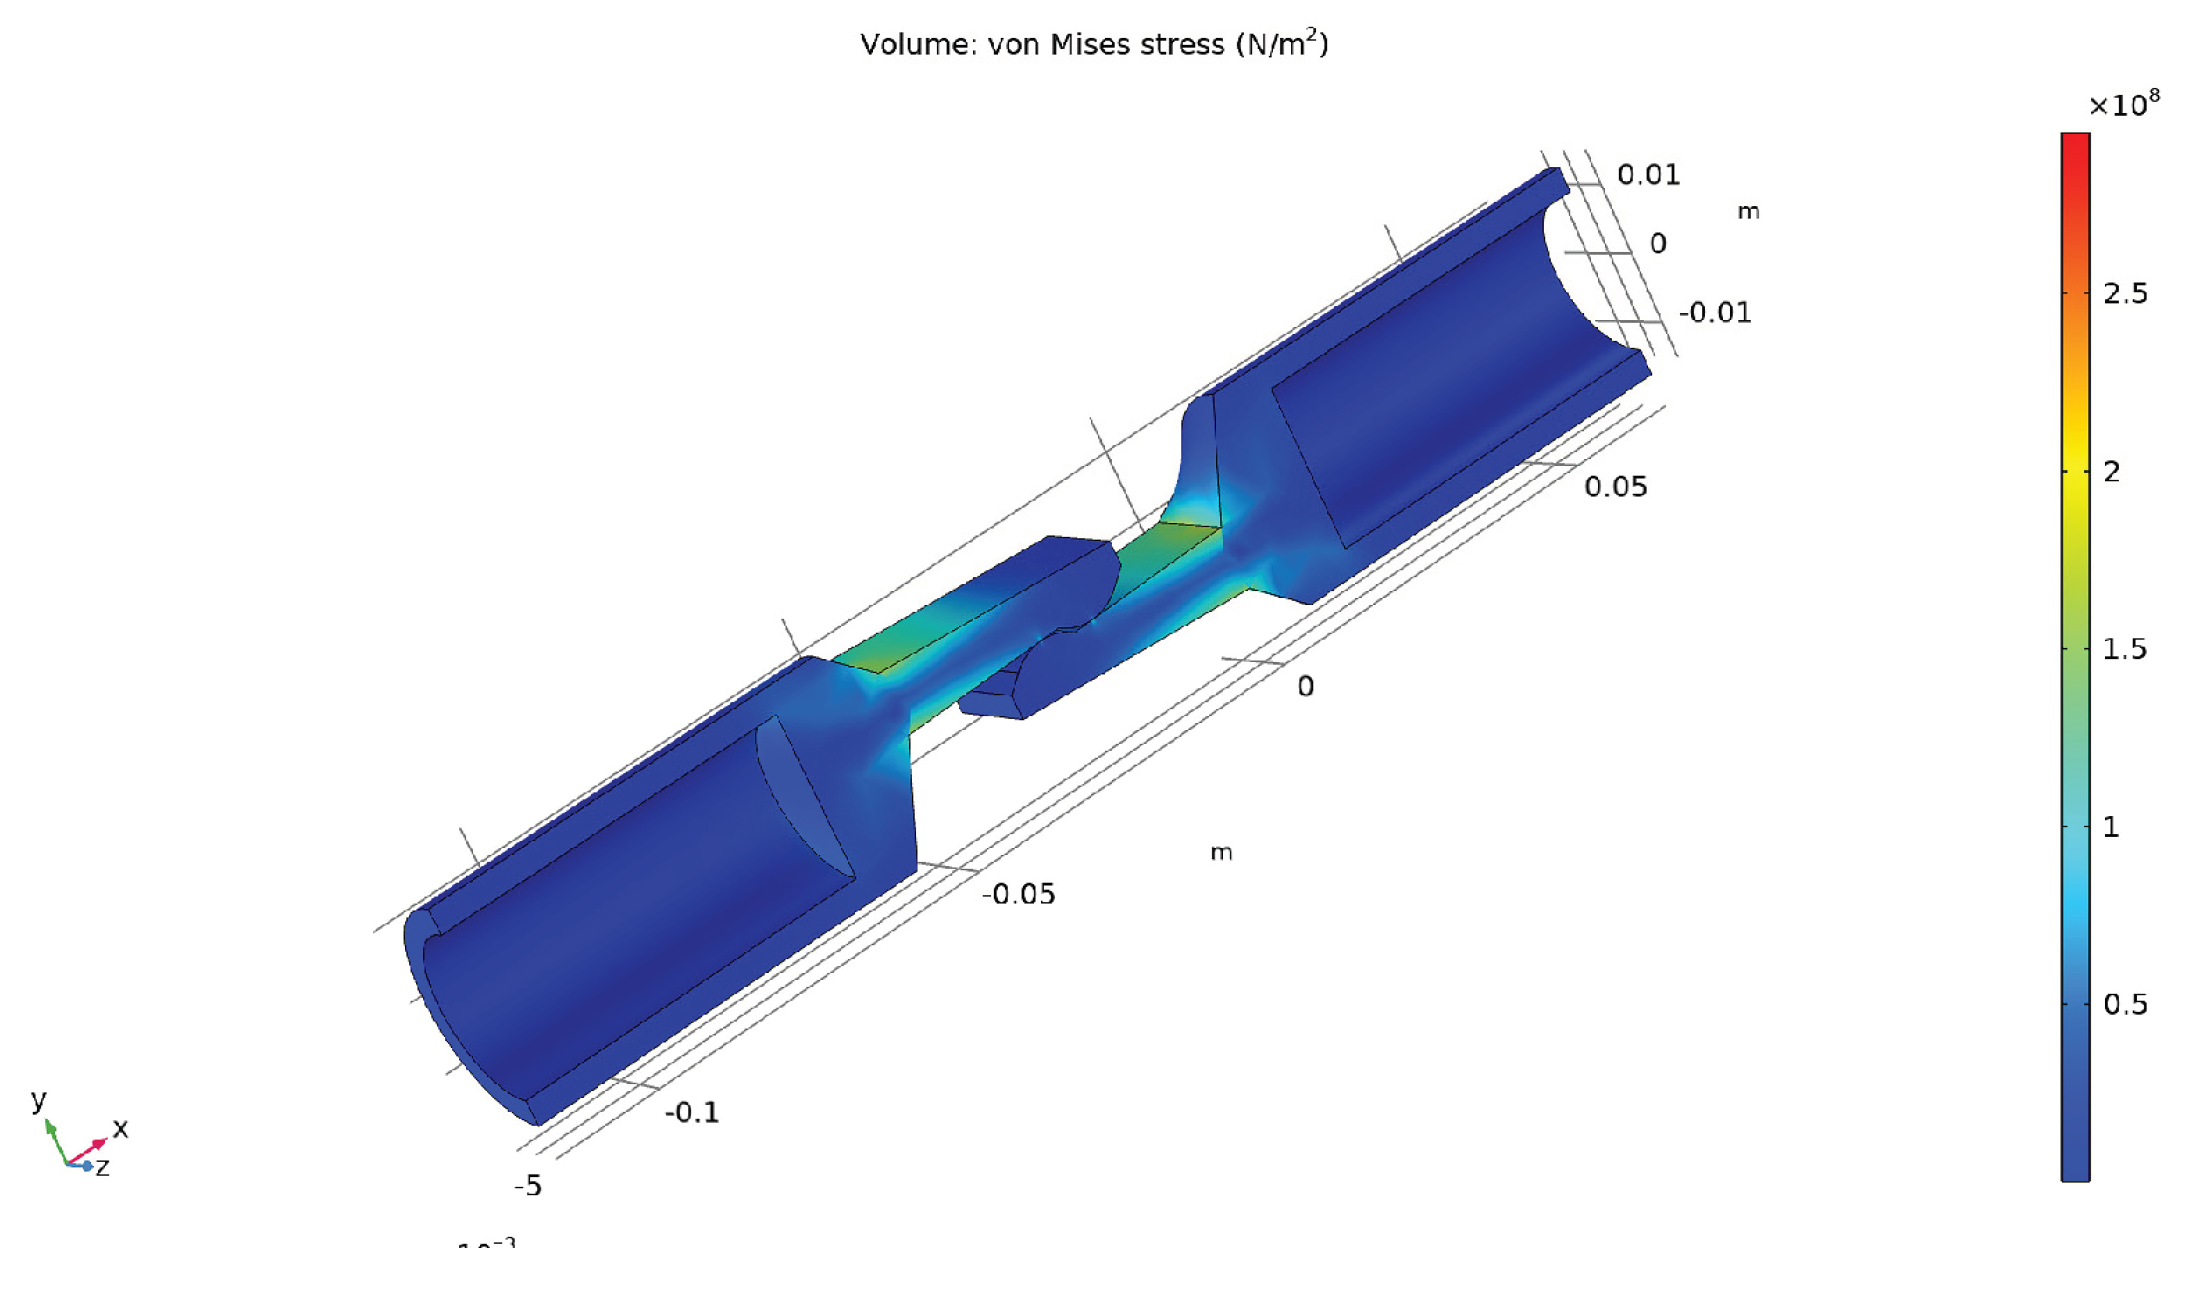
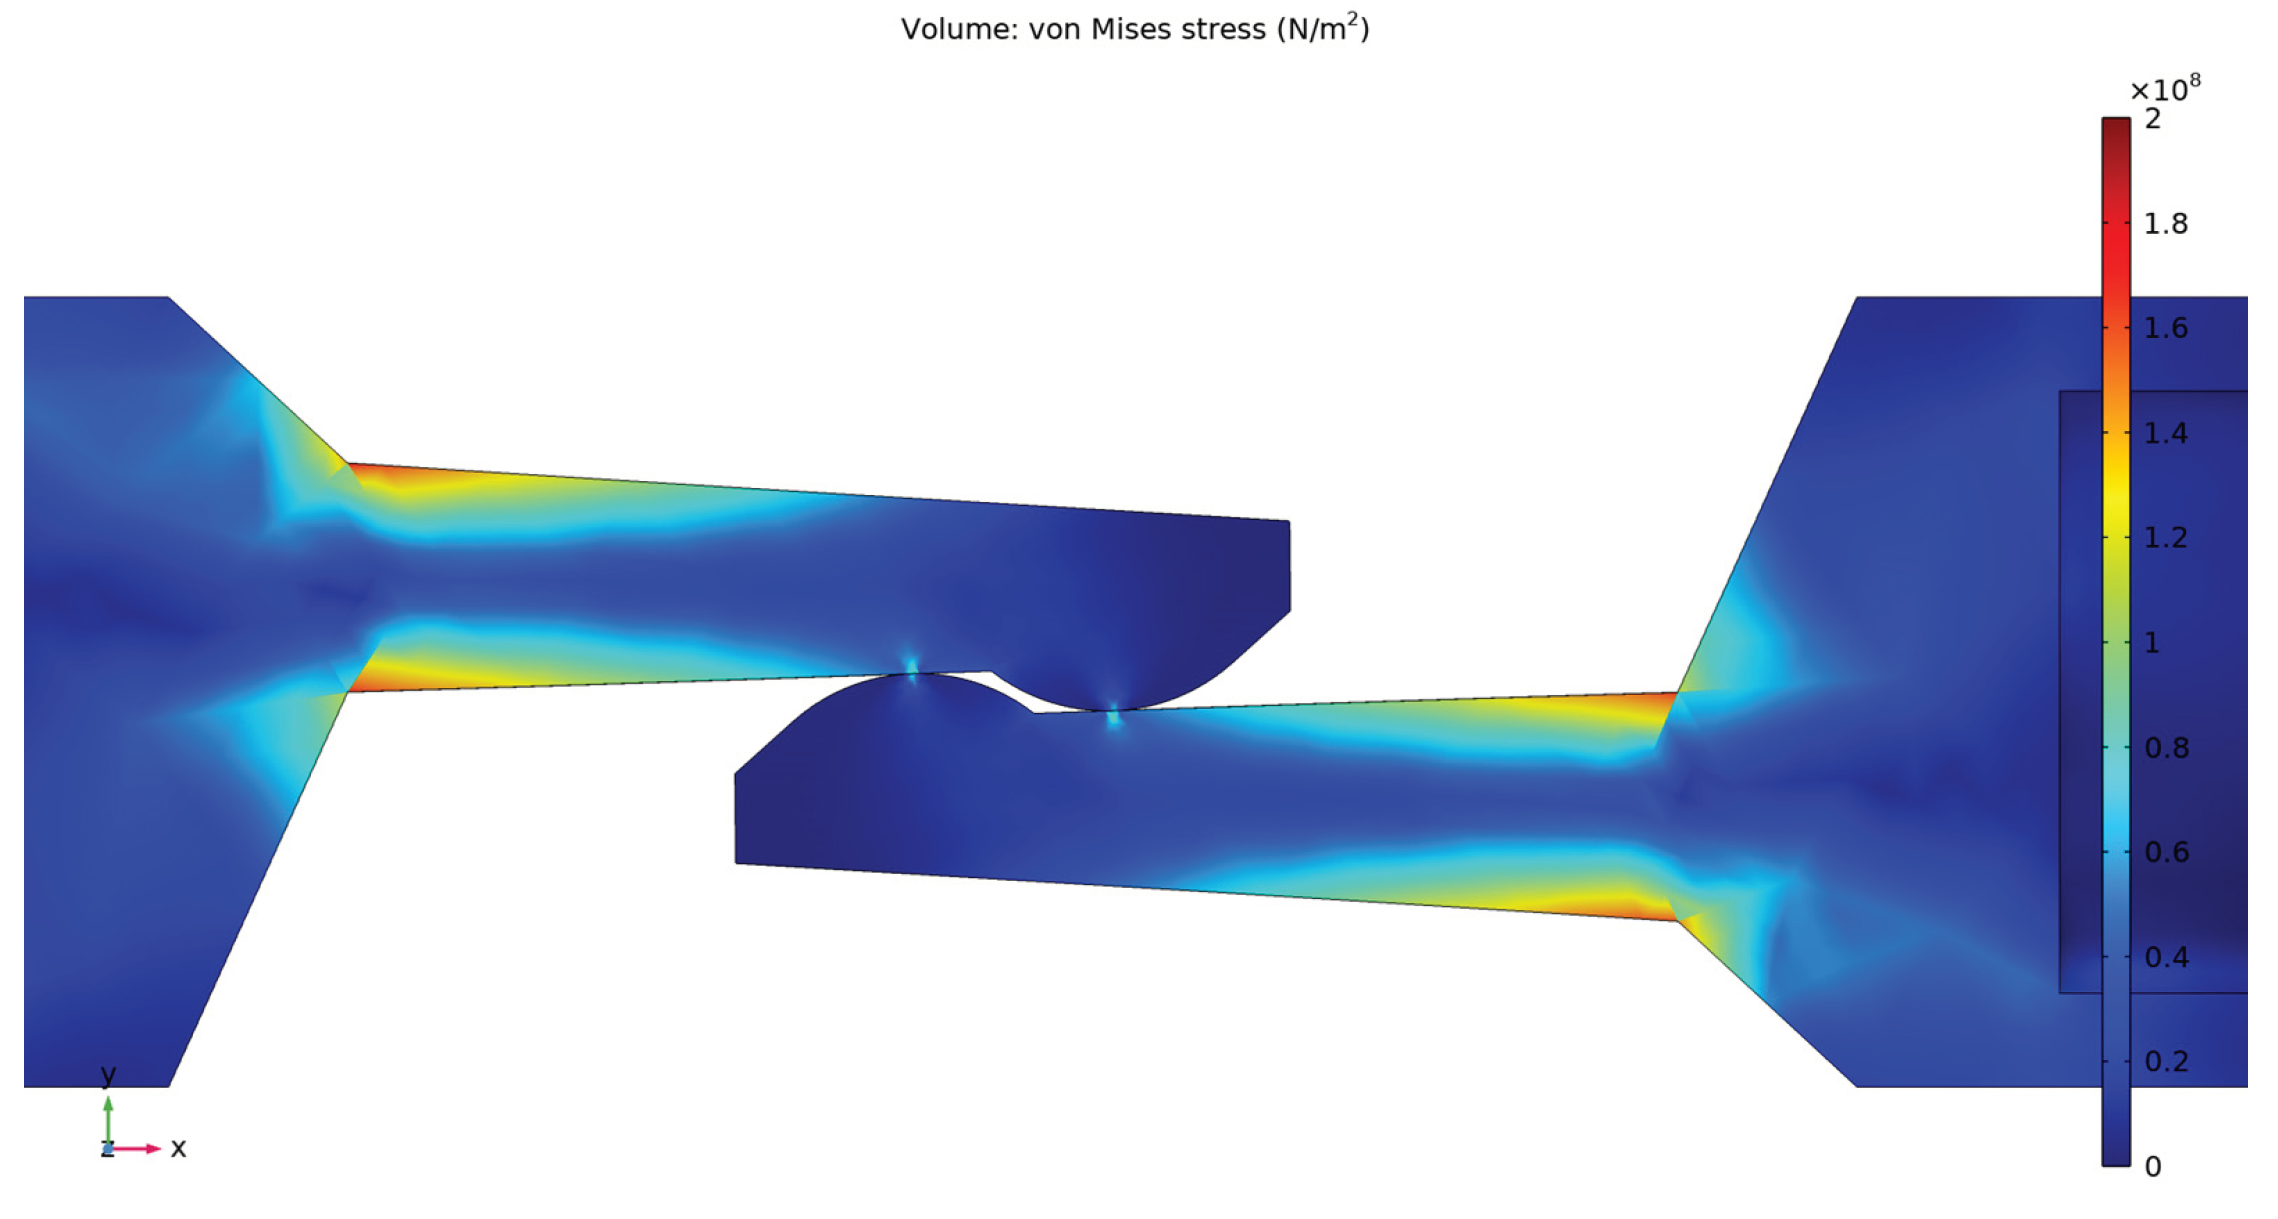
- − The von Misses stress has higher values in the current path area where the flat part intersects with the cylindrical shape for each contact element, and also in the area of the physical touching of the two contact elements;
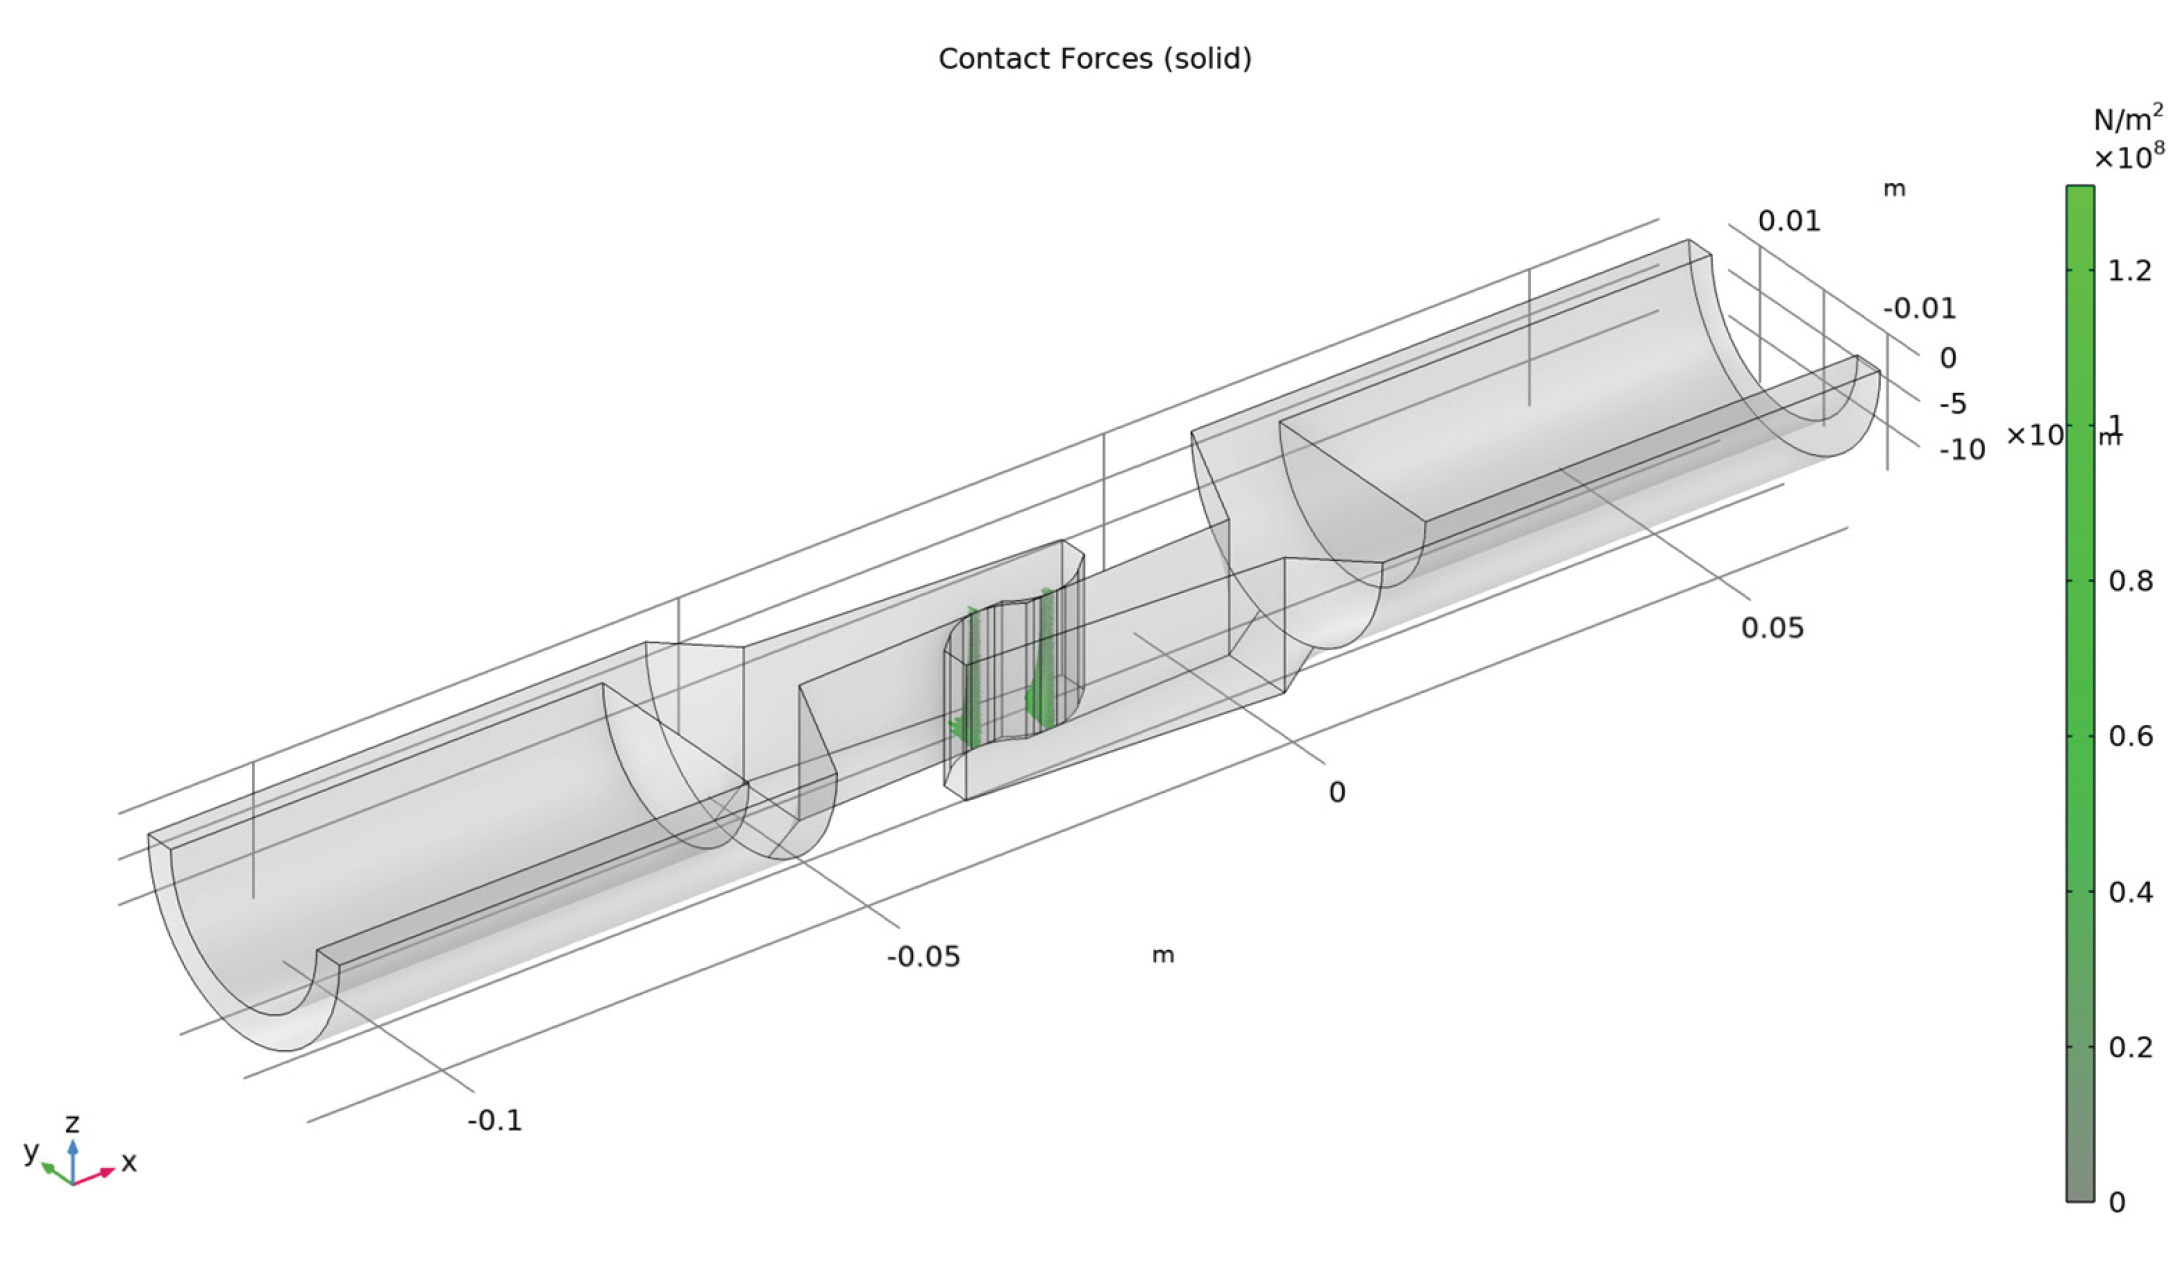
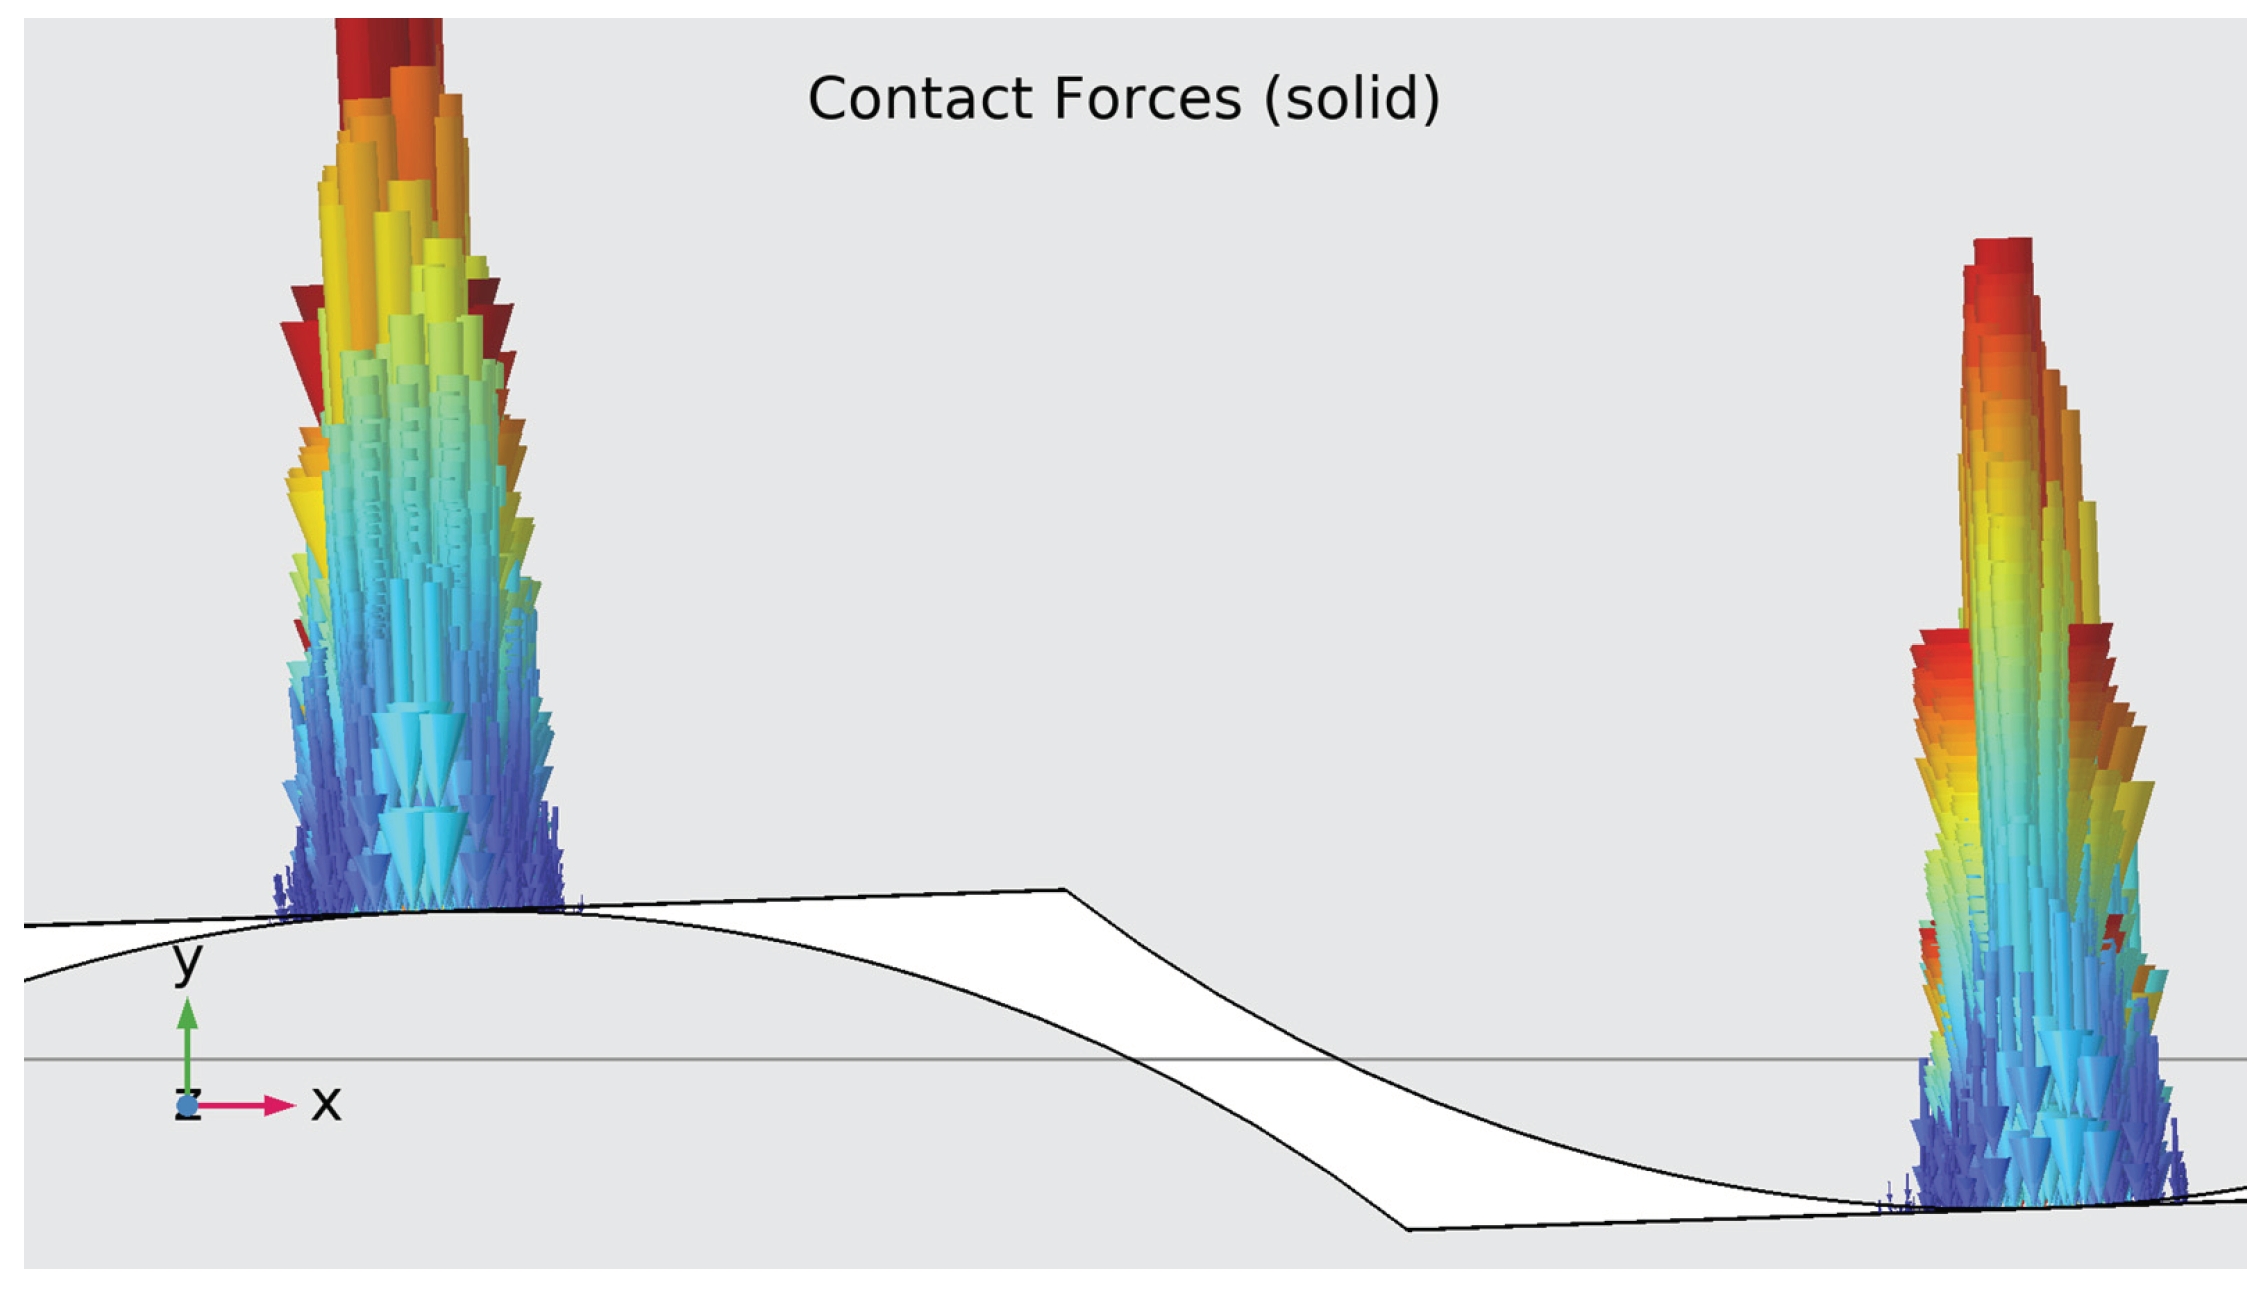
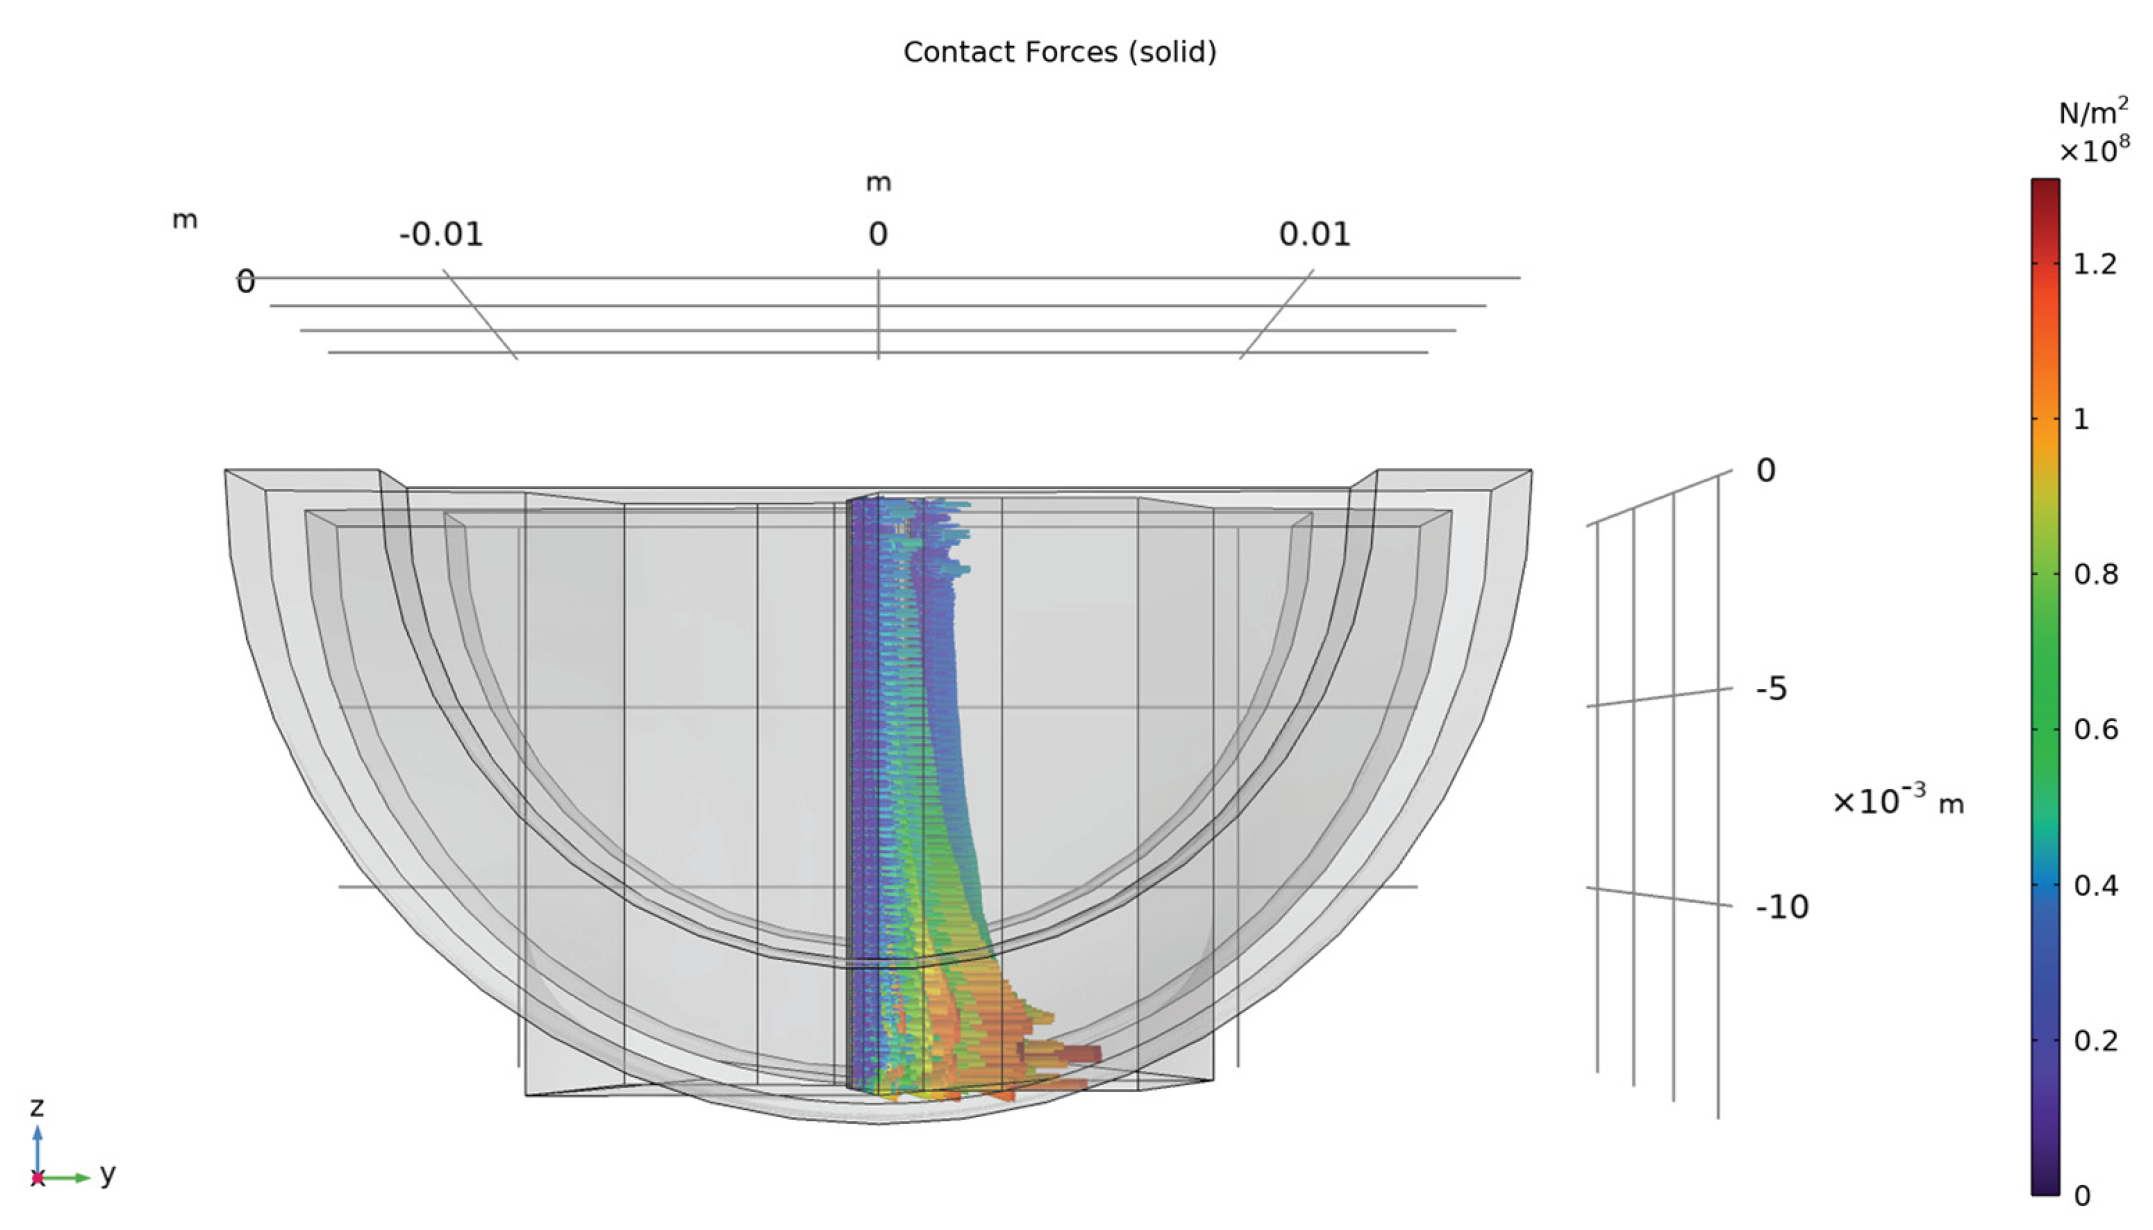
- − The contact forces have maximum value at the contact points;
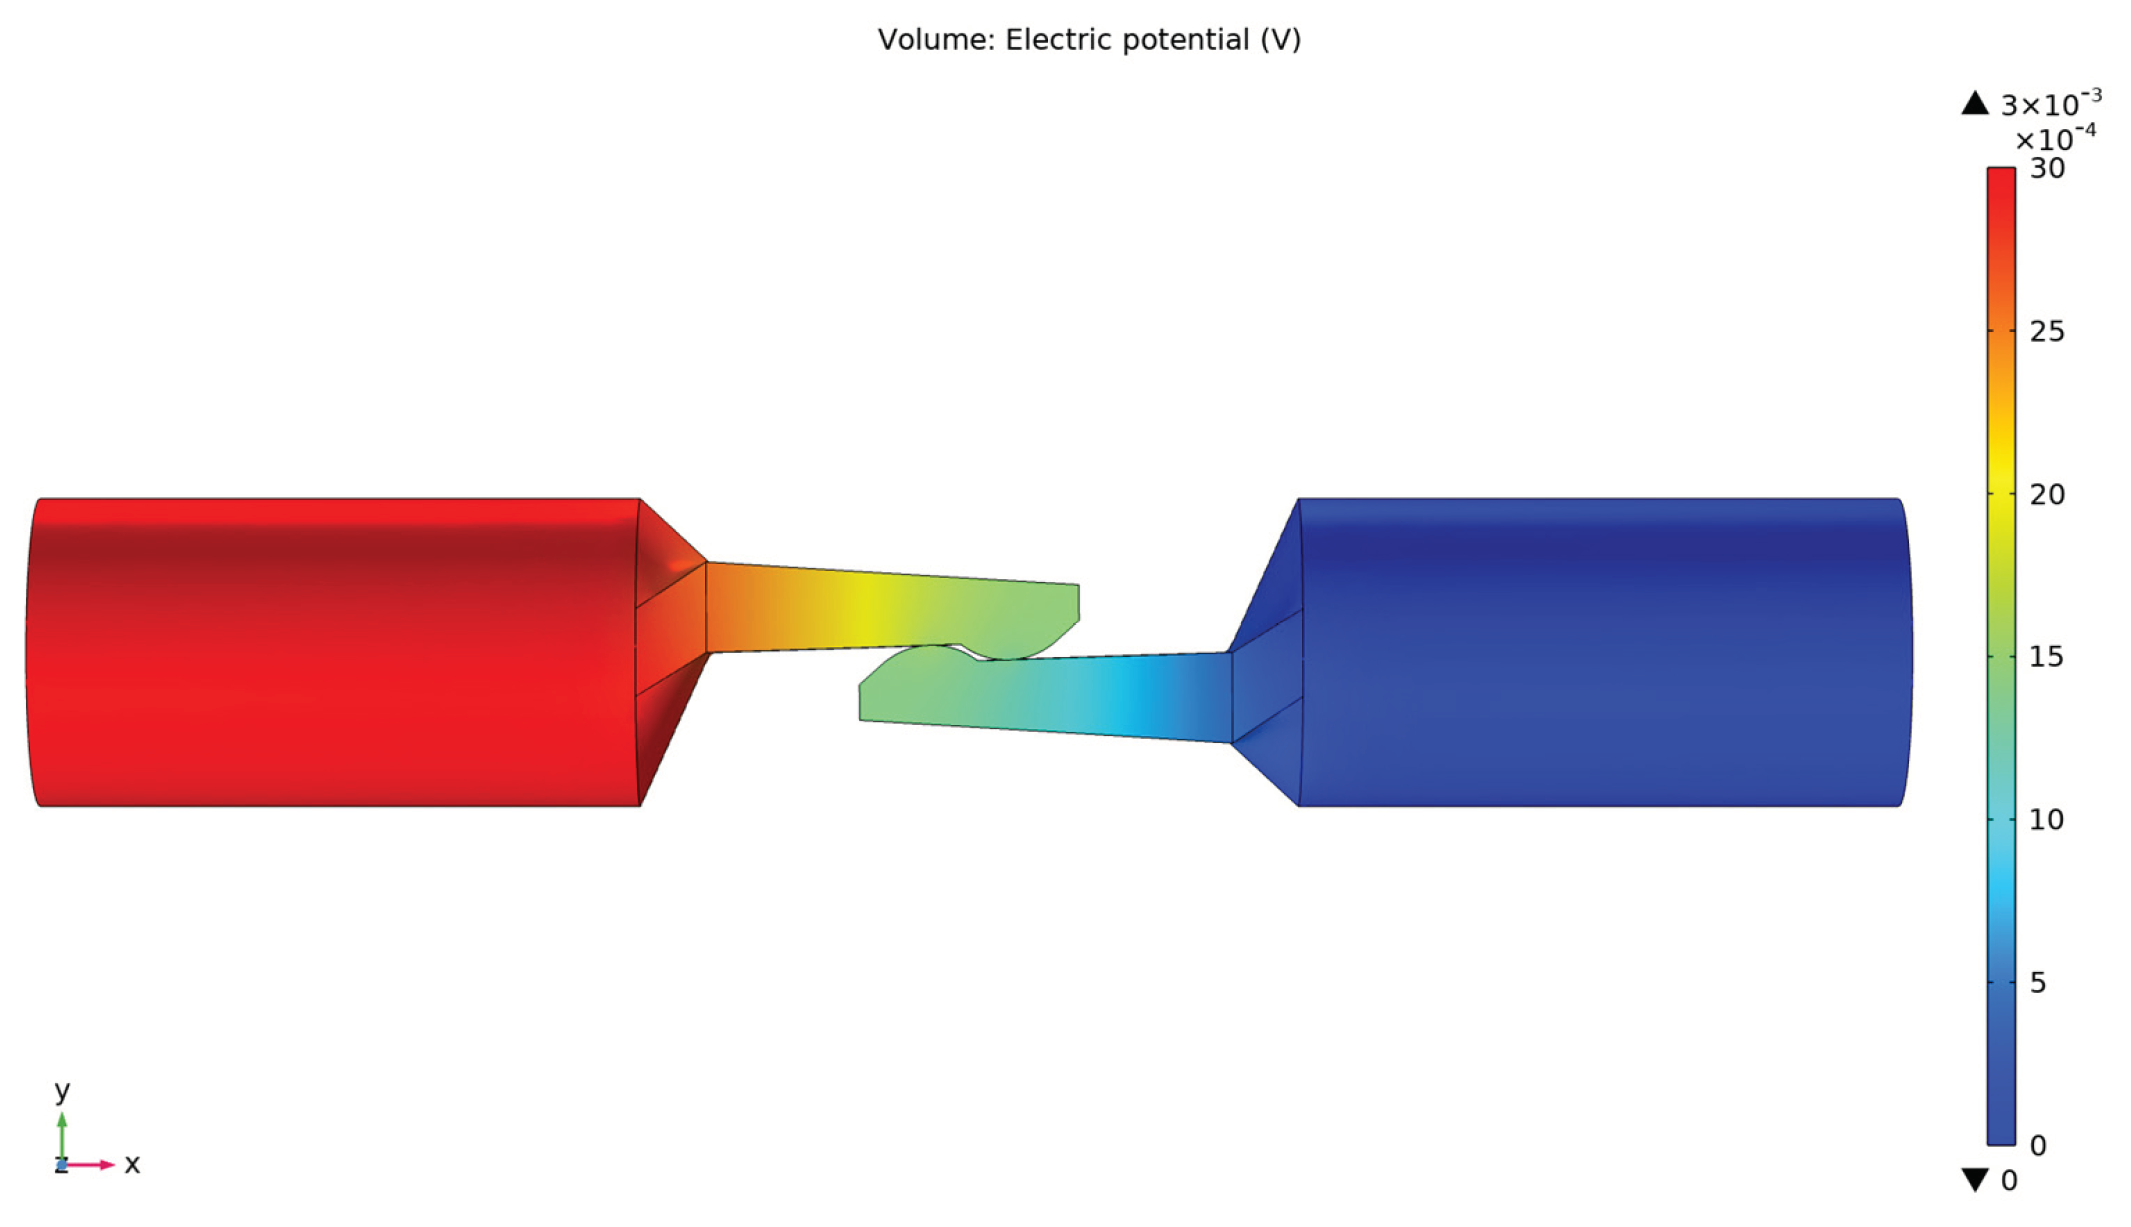
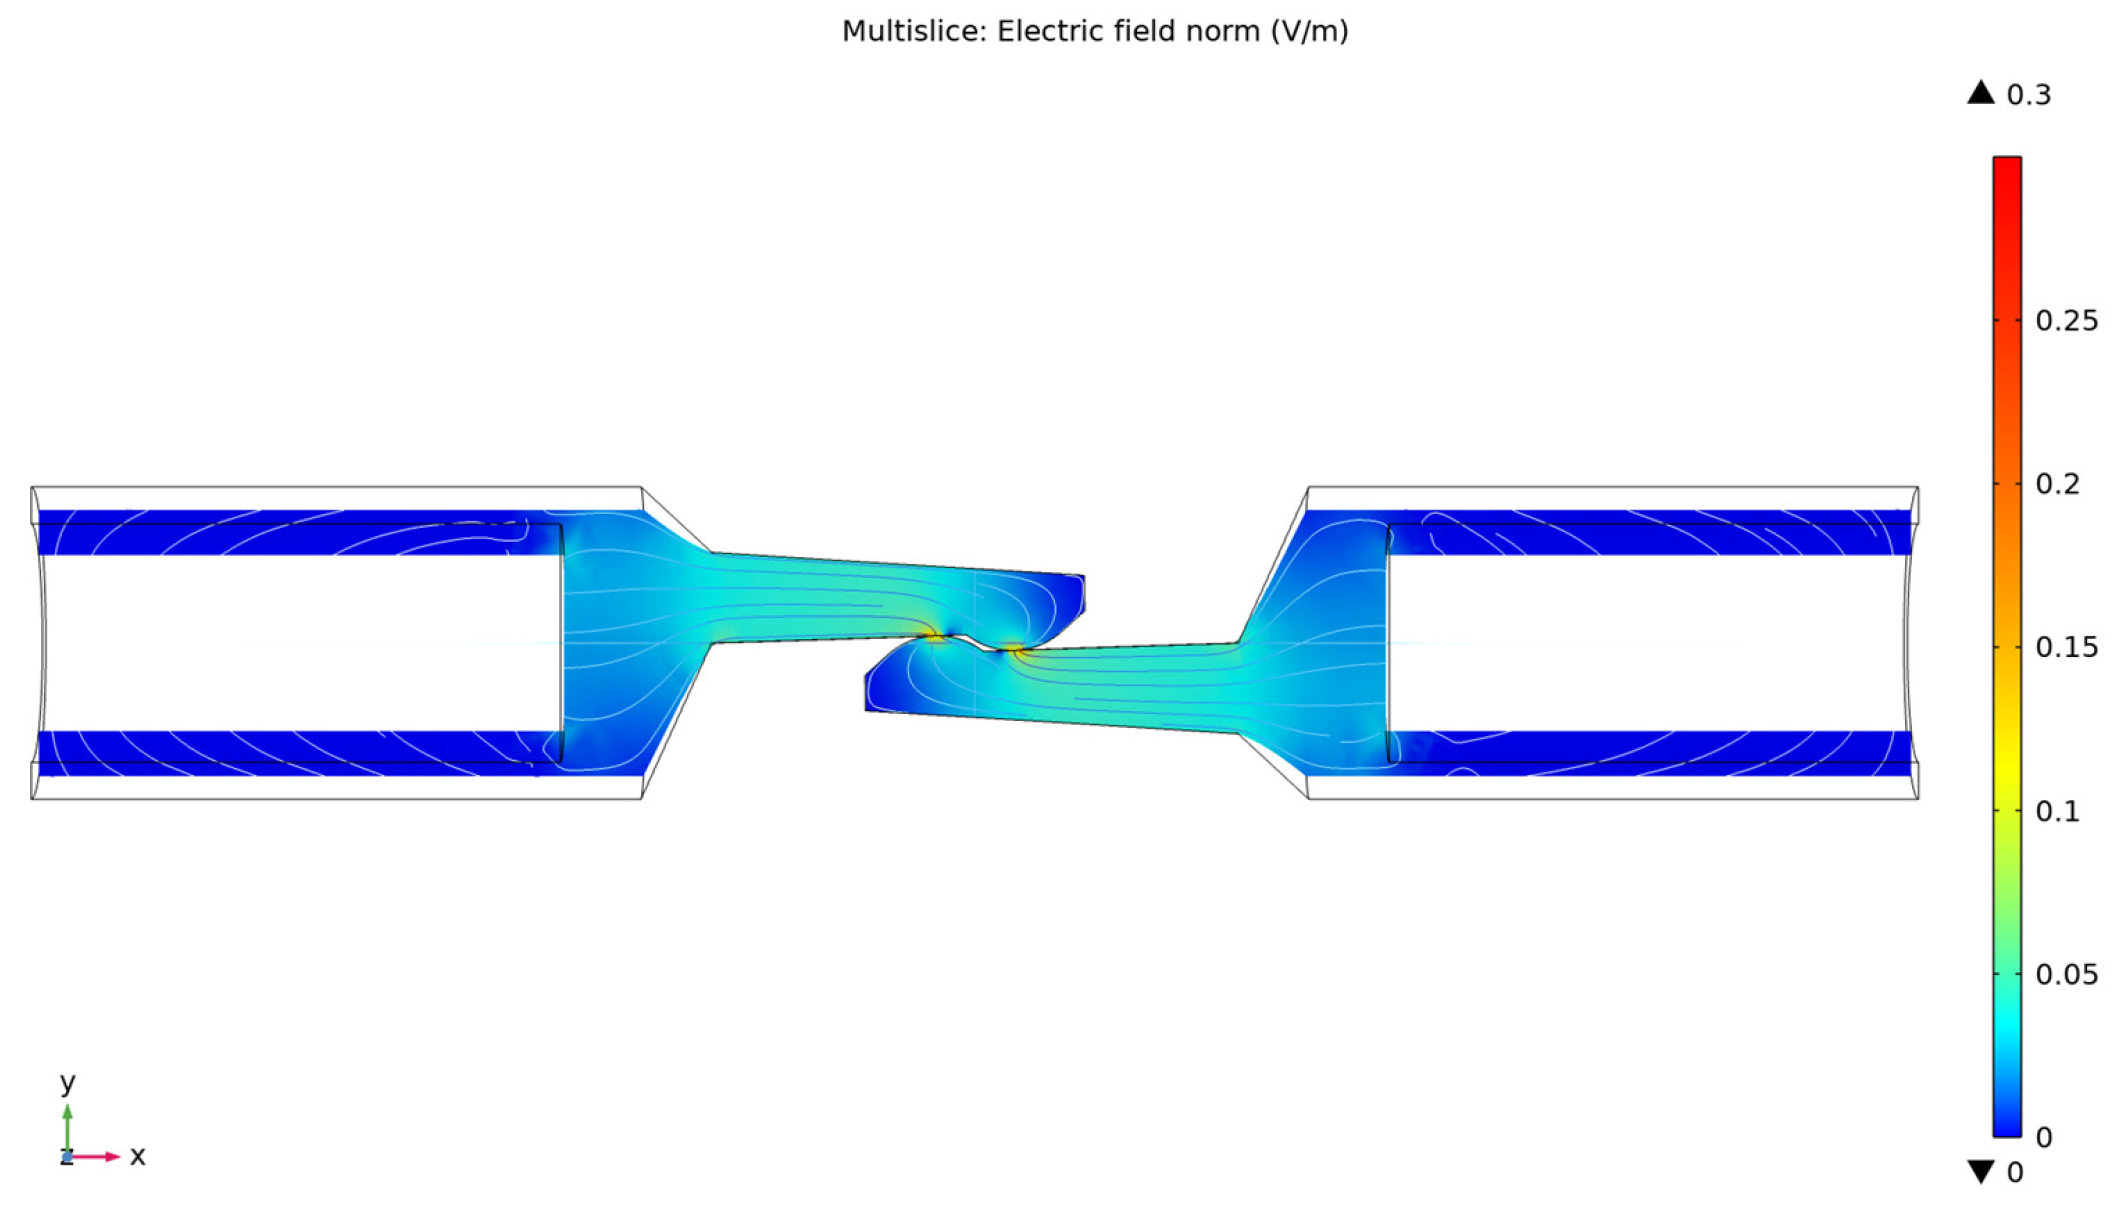
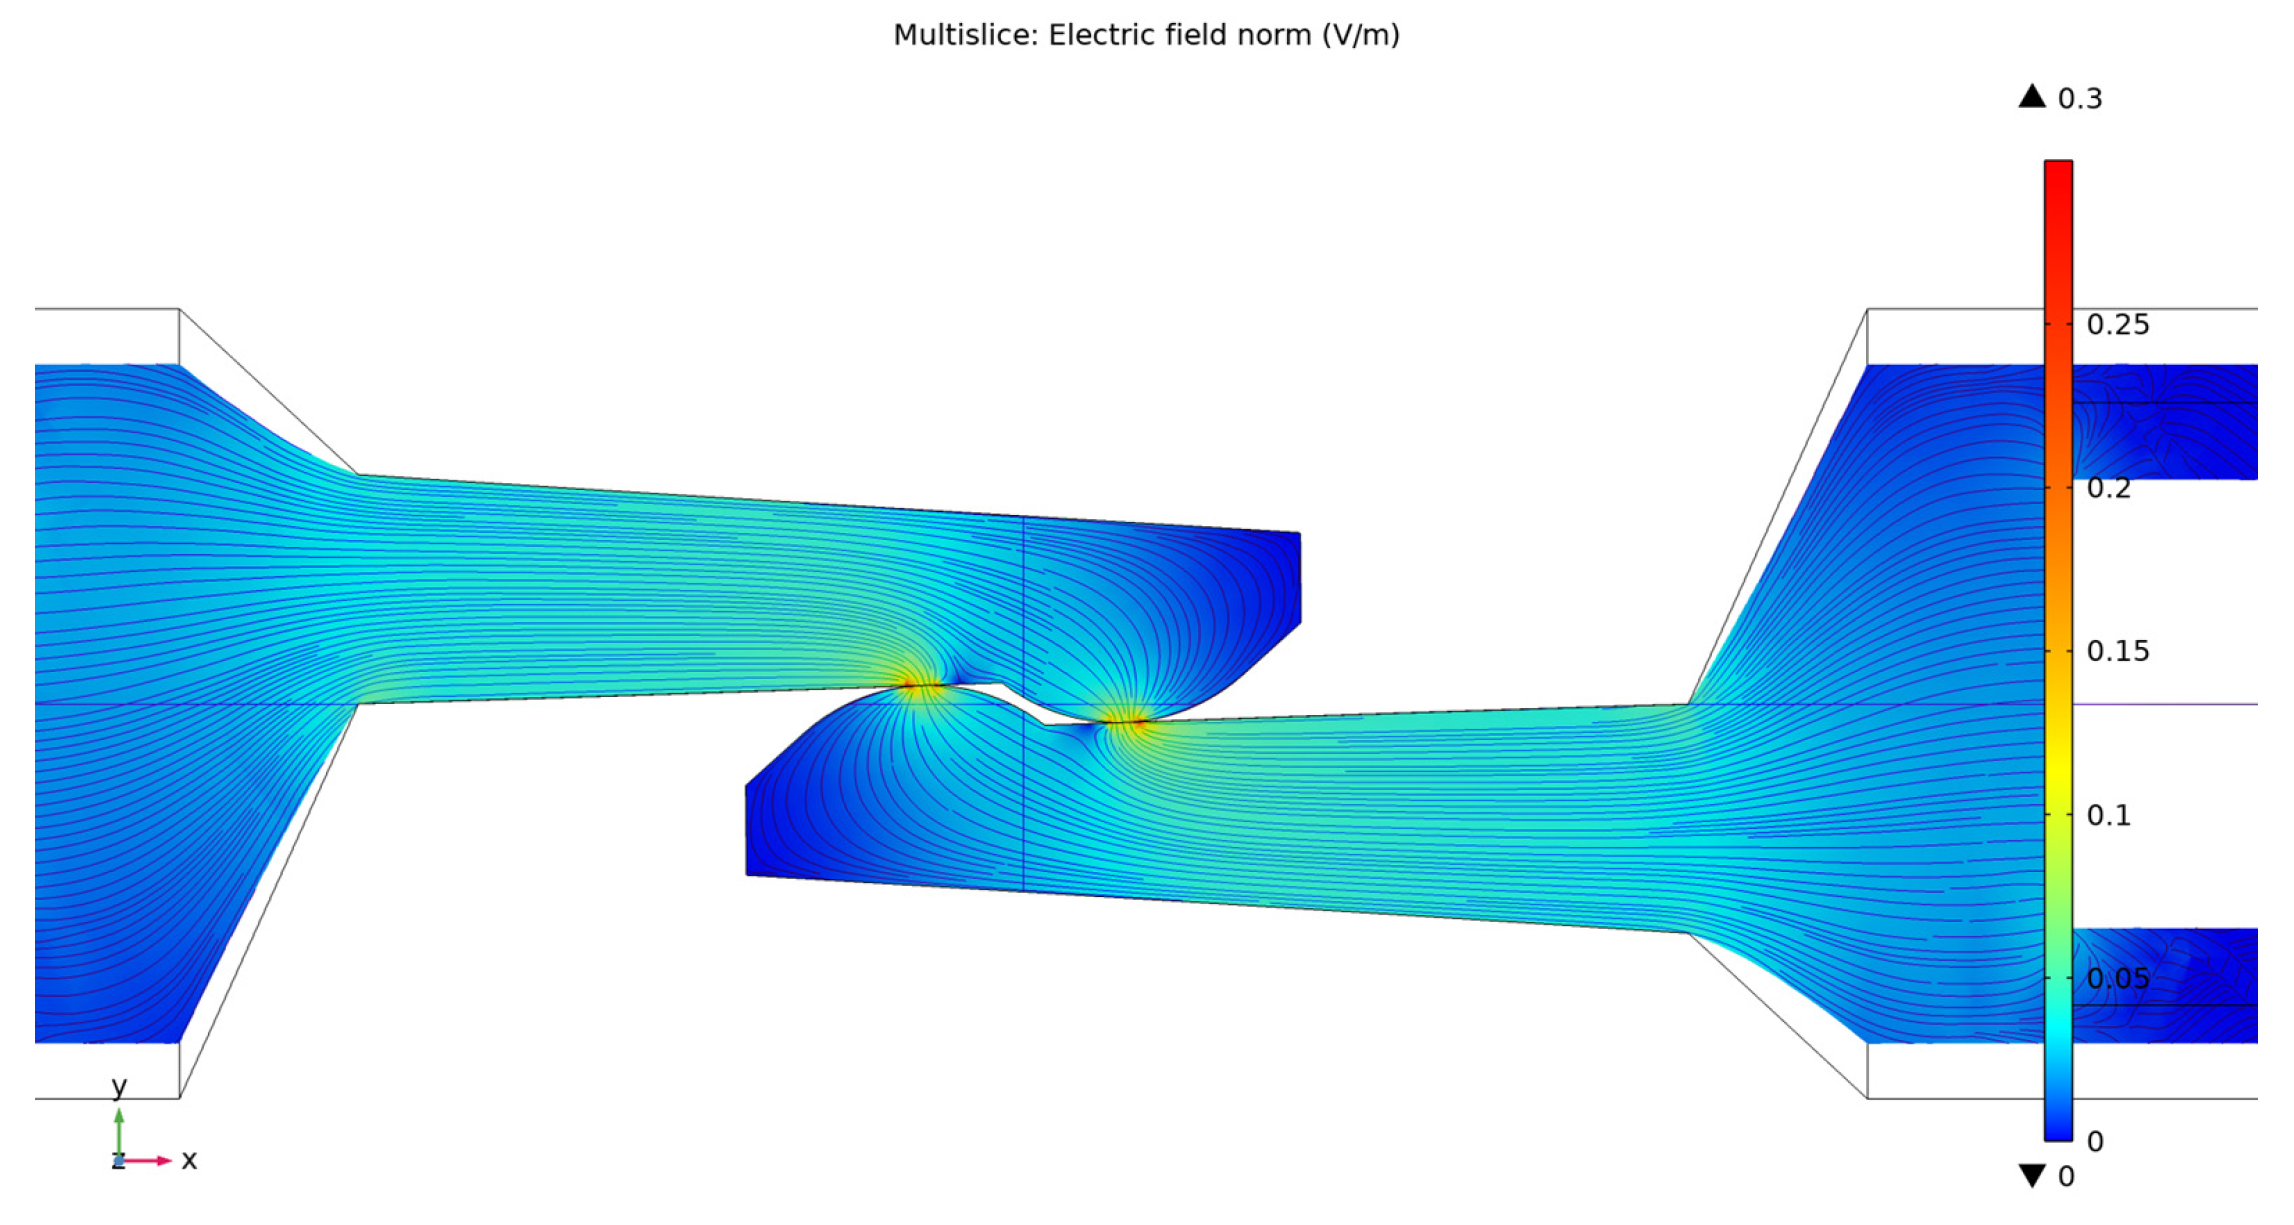
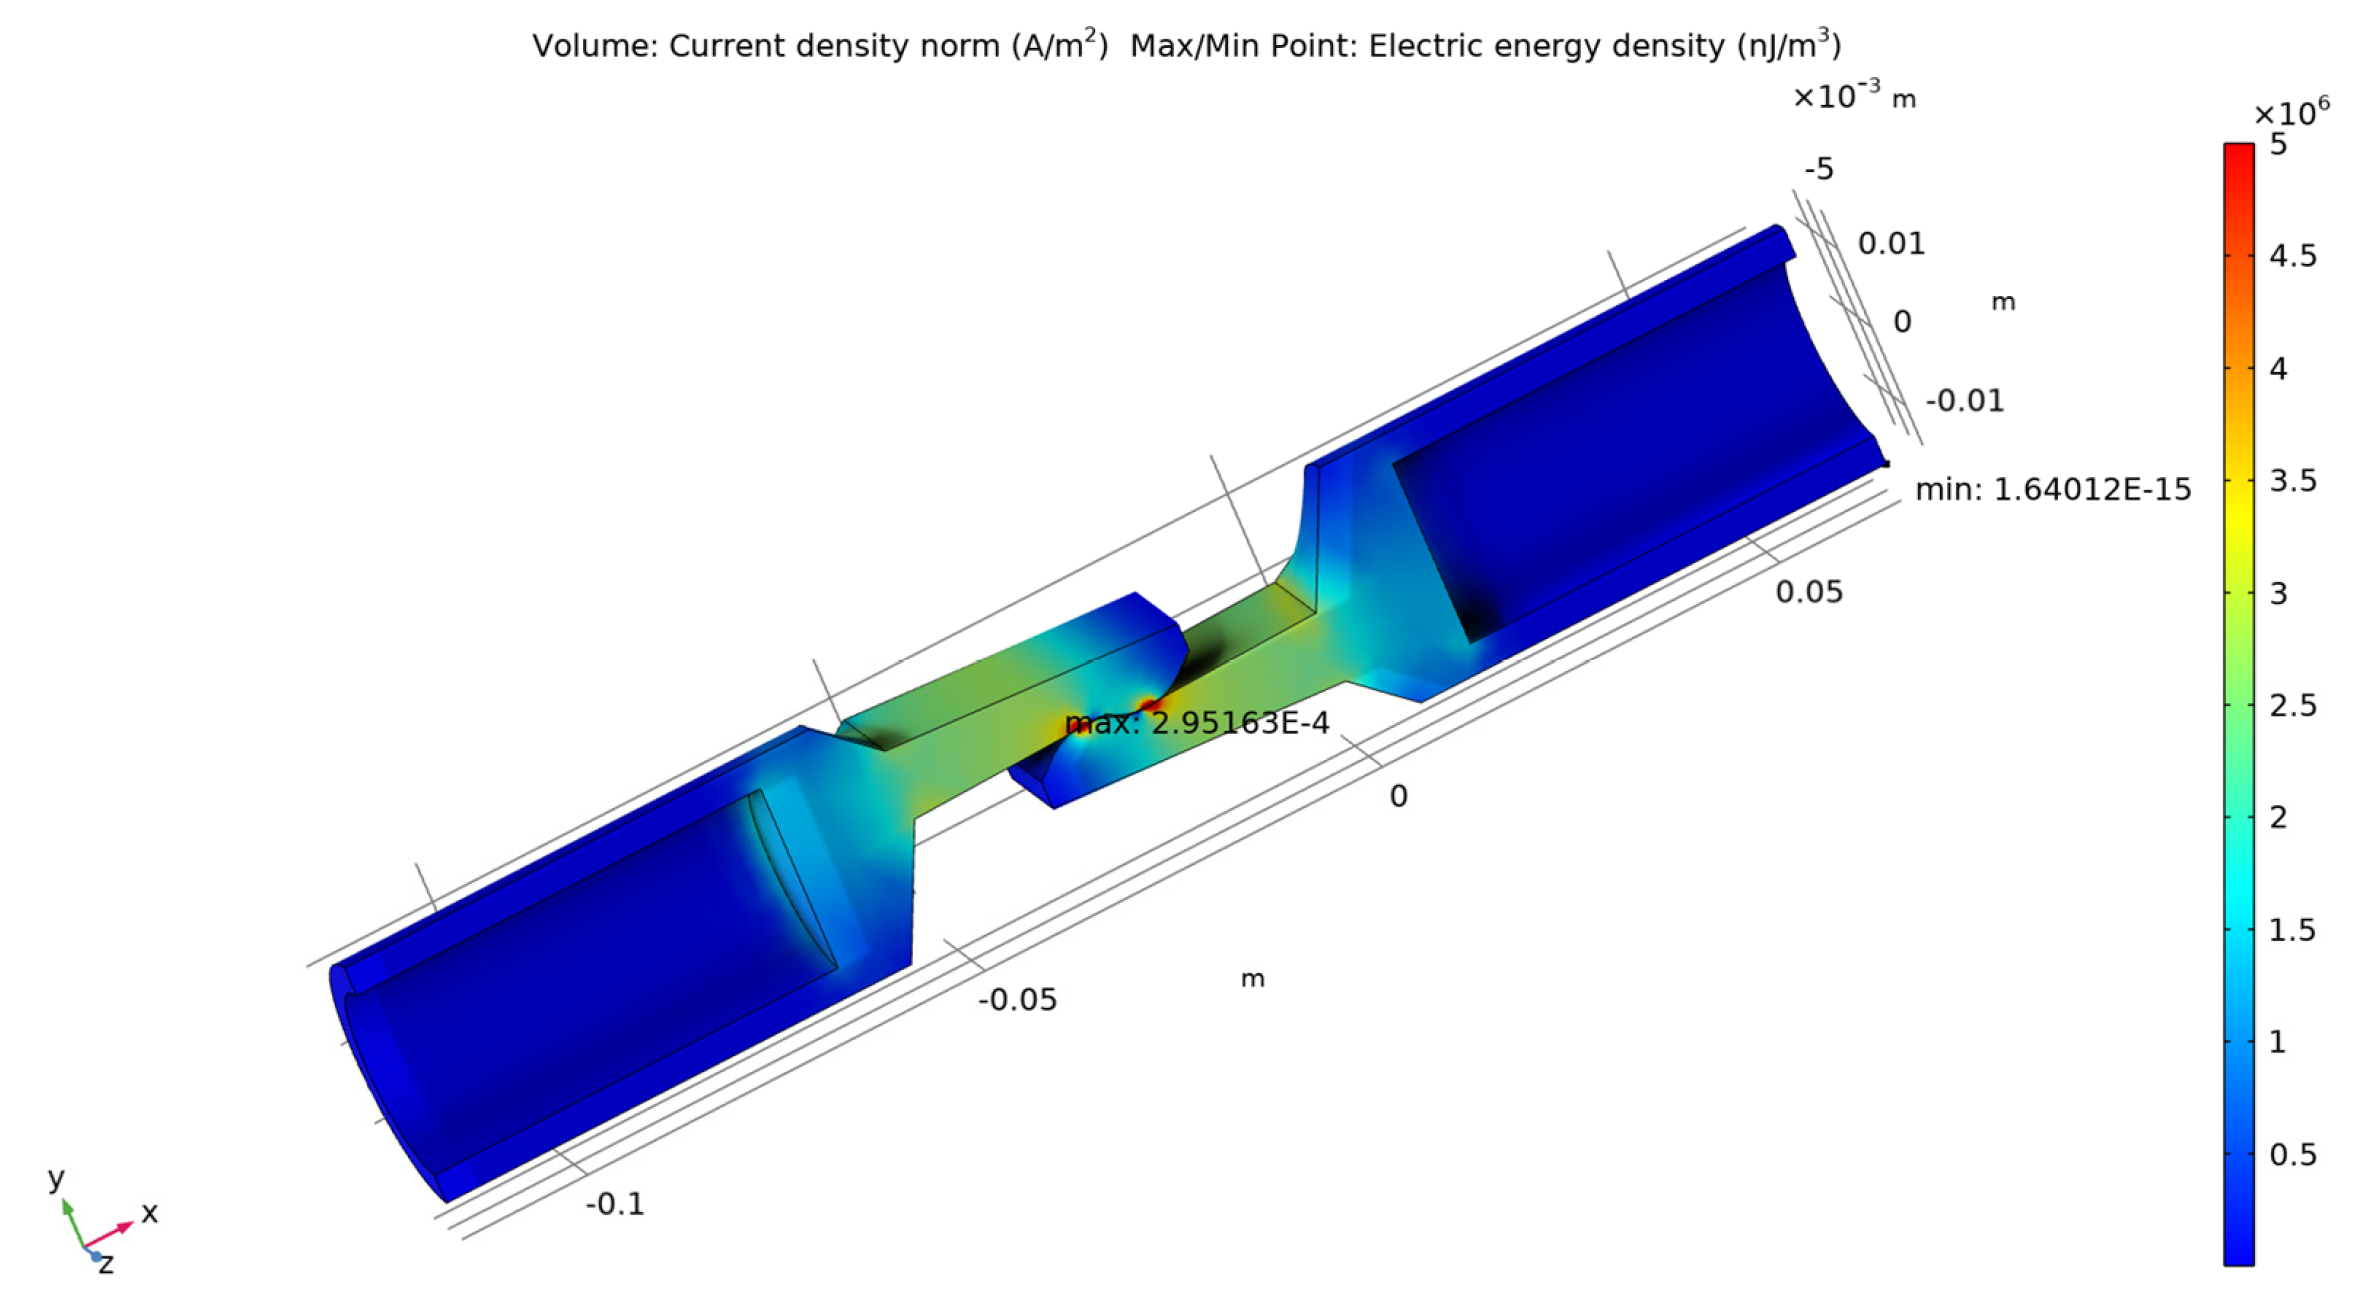
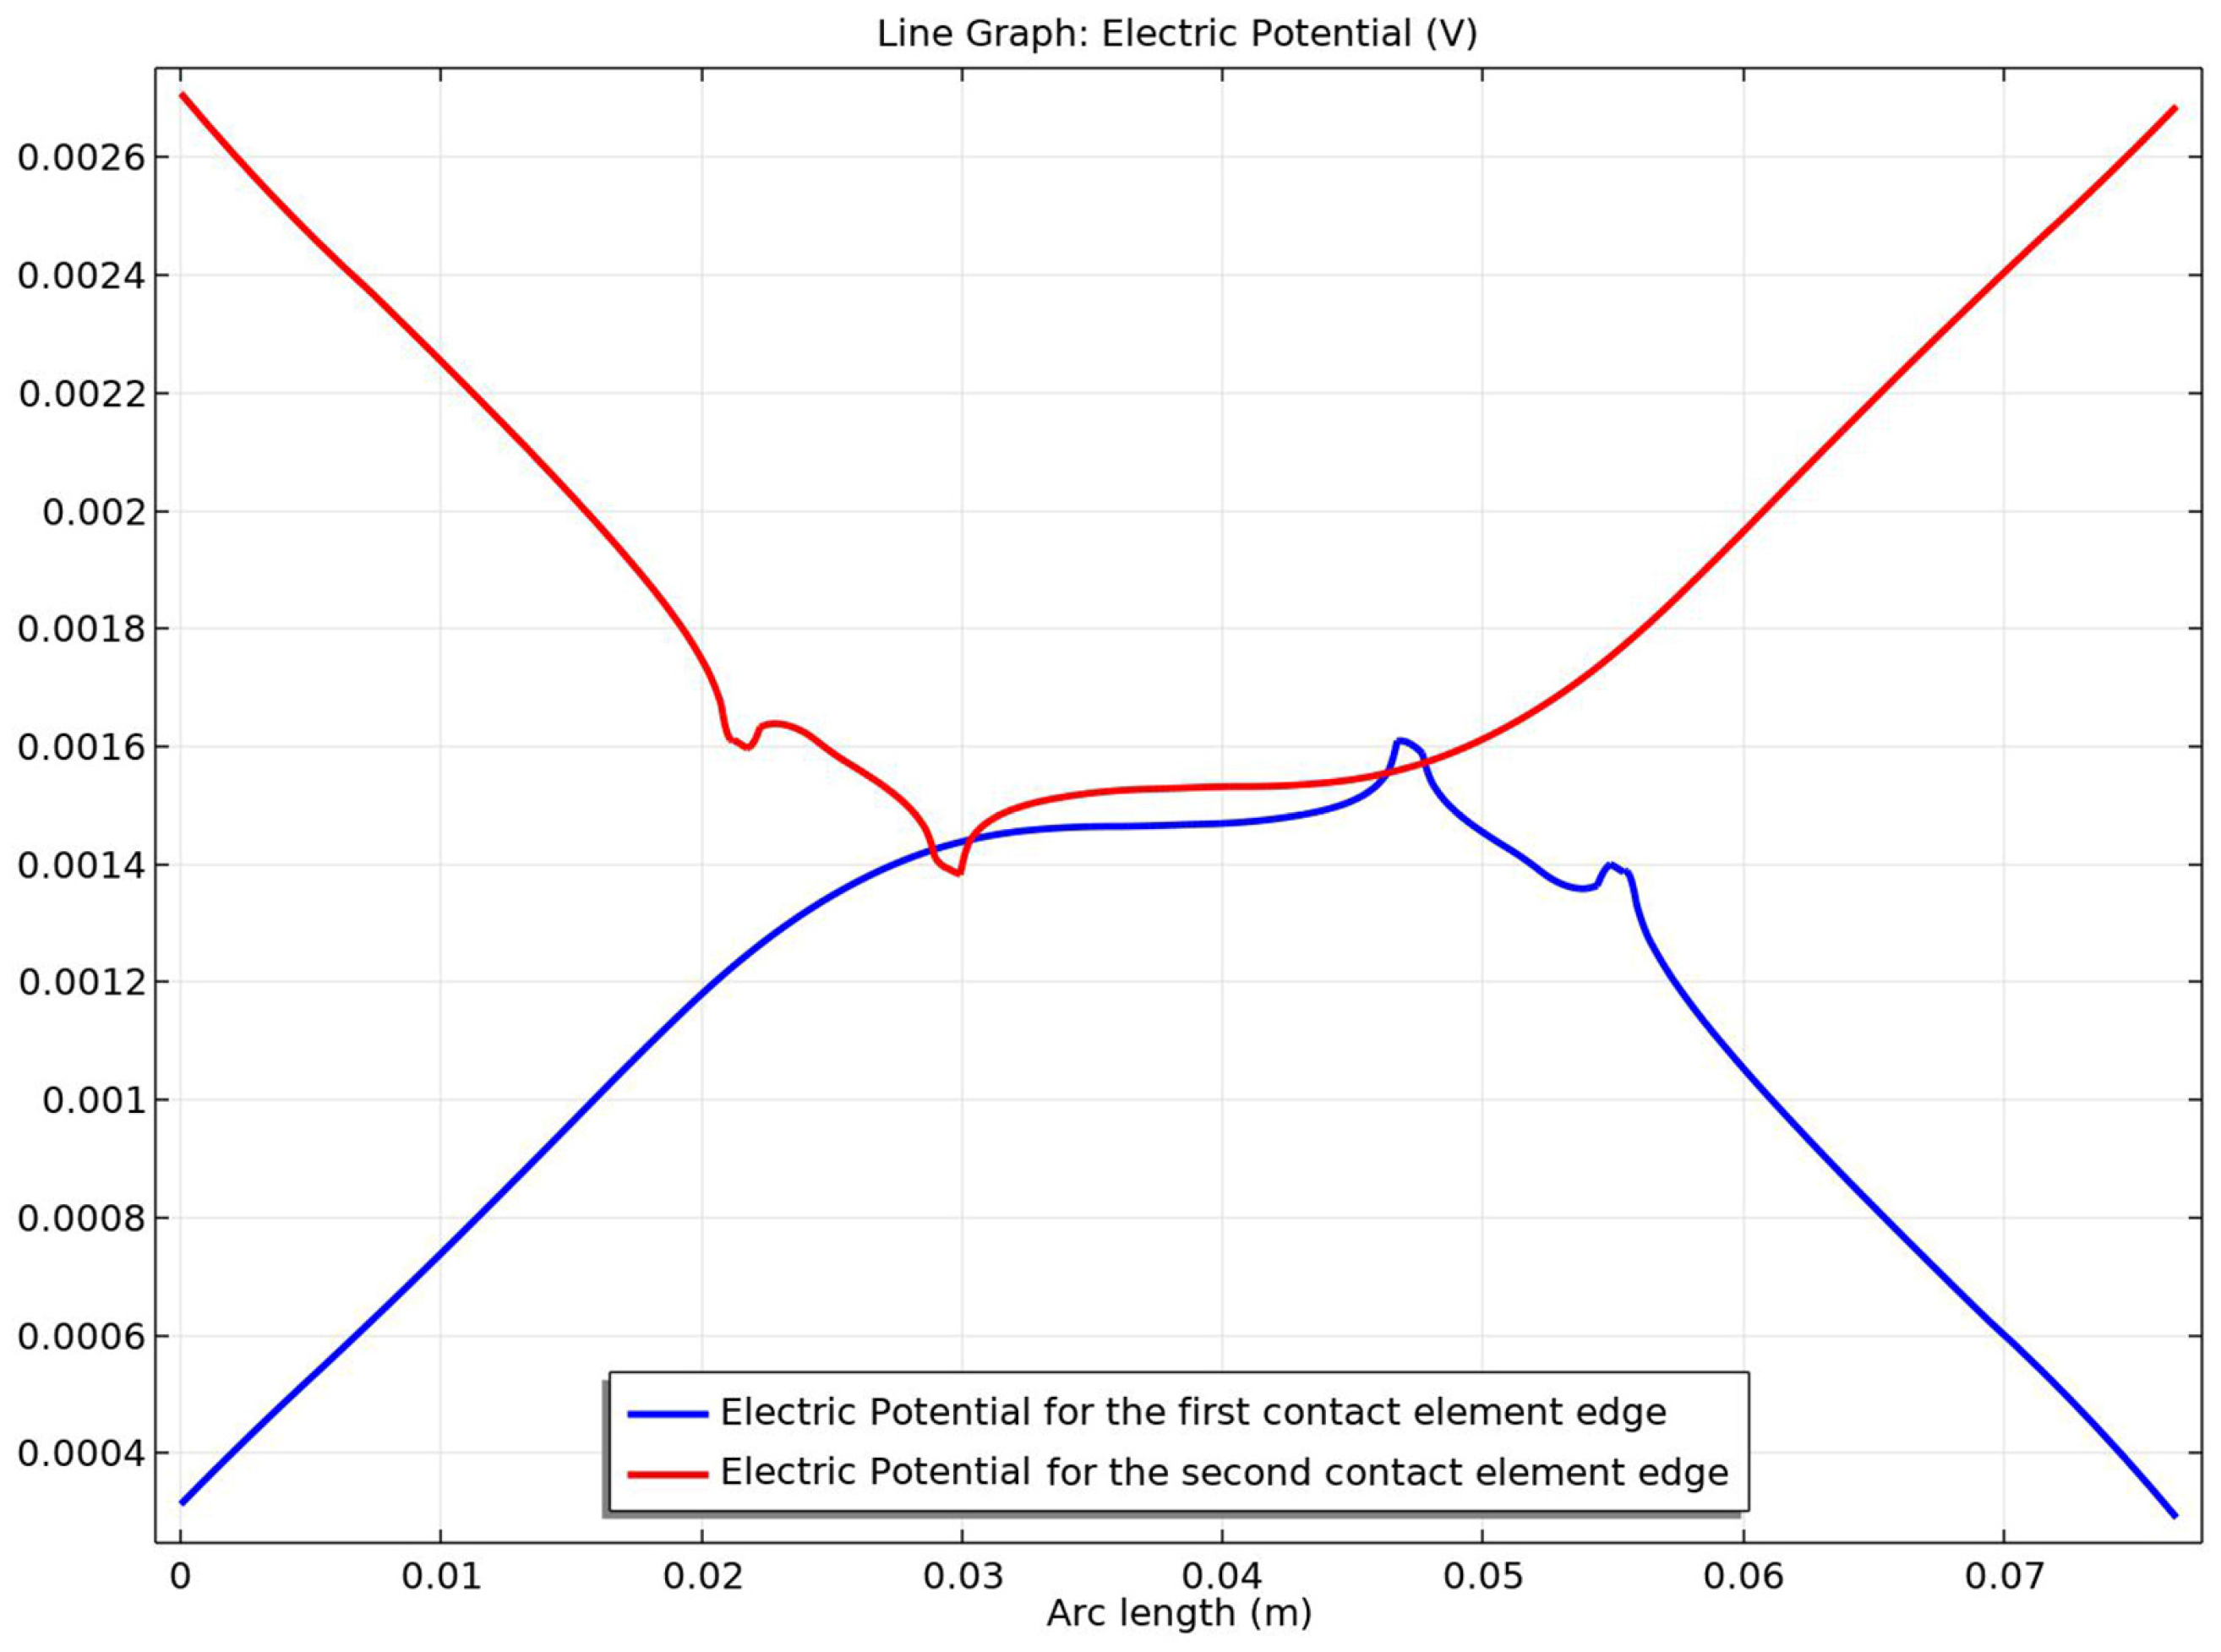
- − The electric field amplitude along the current path and the contact elements is maximum at the touching point, where the transverse surface has a minimum value;
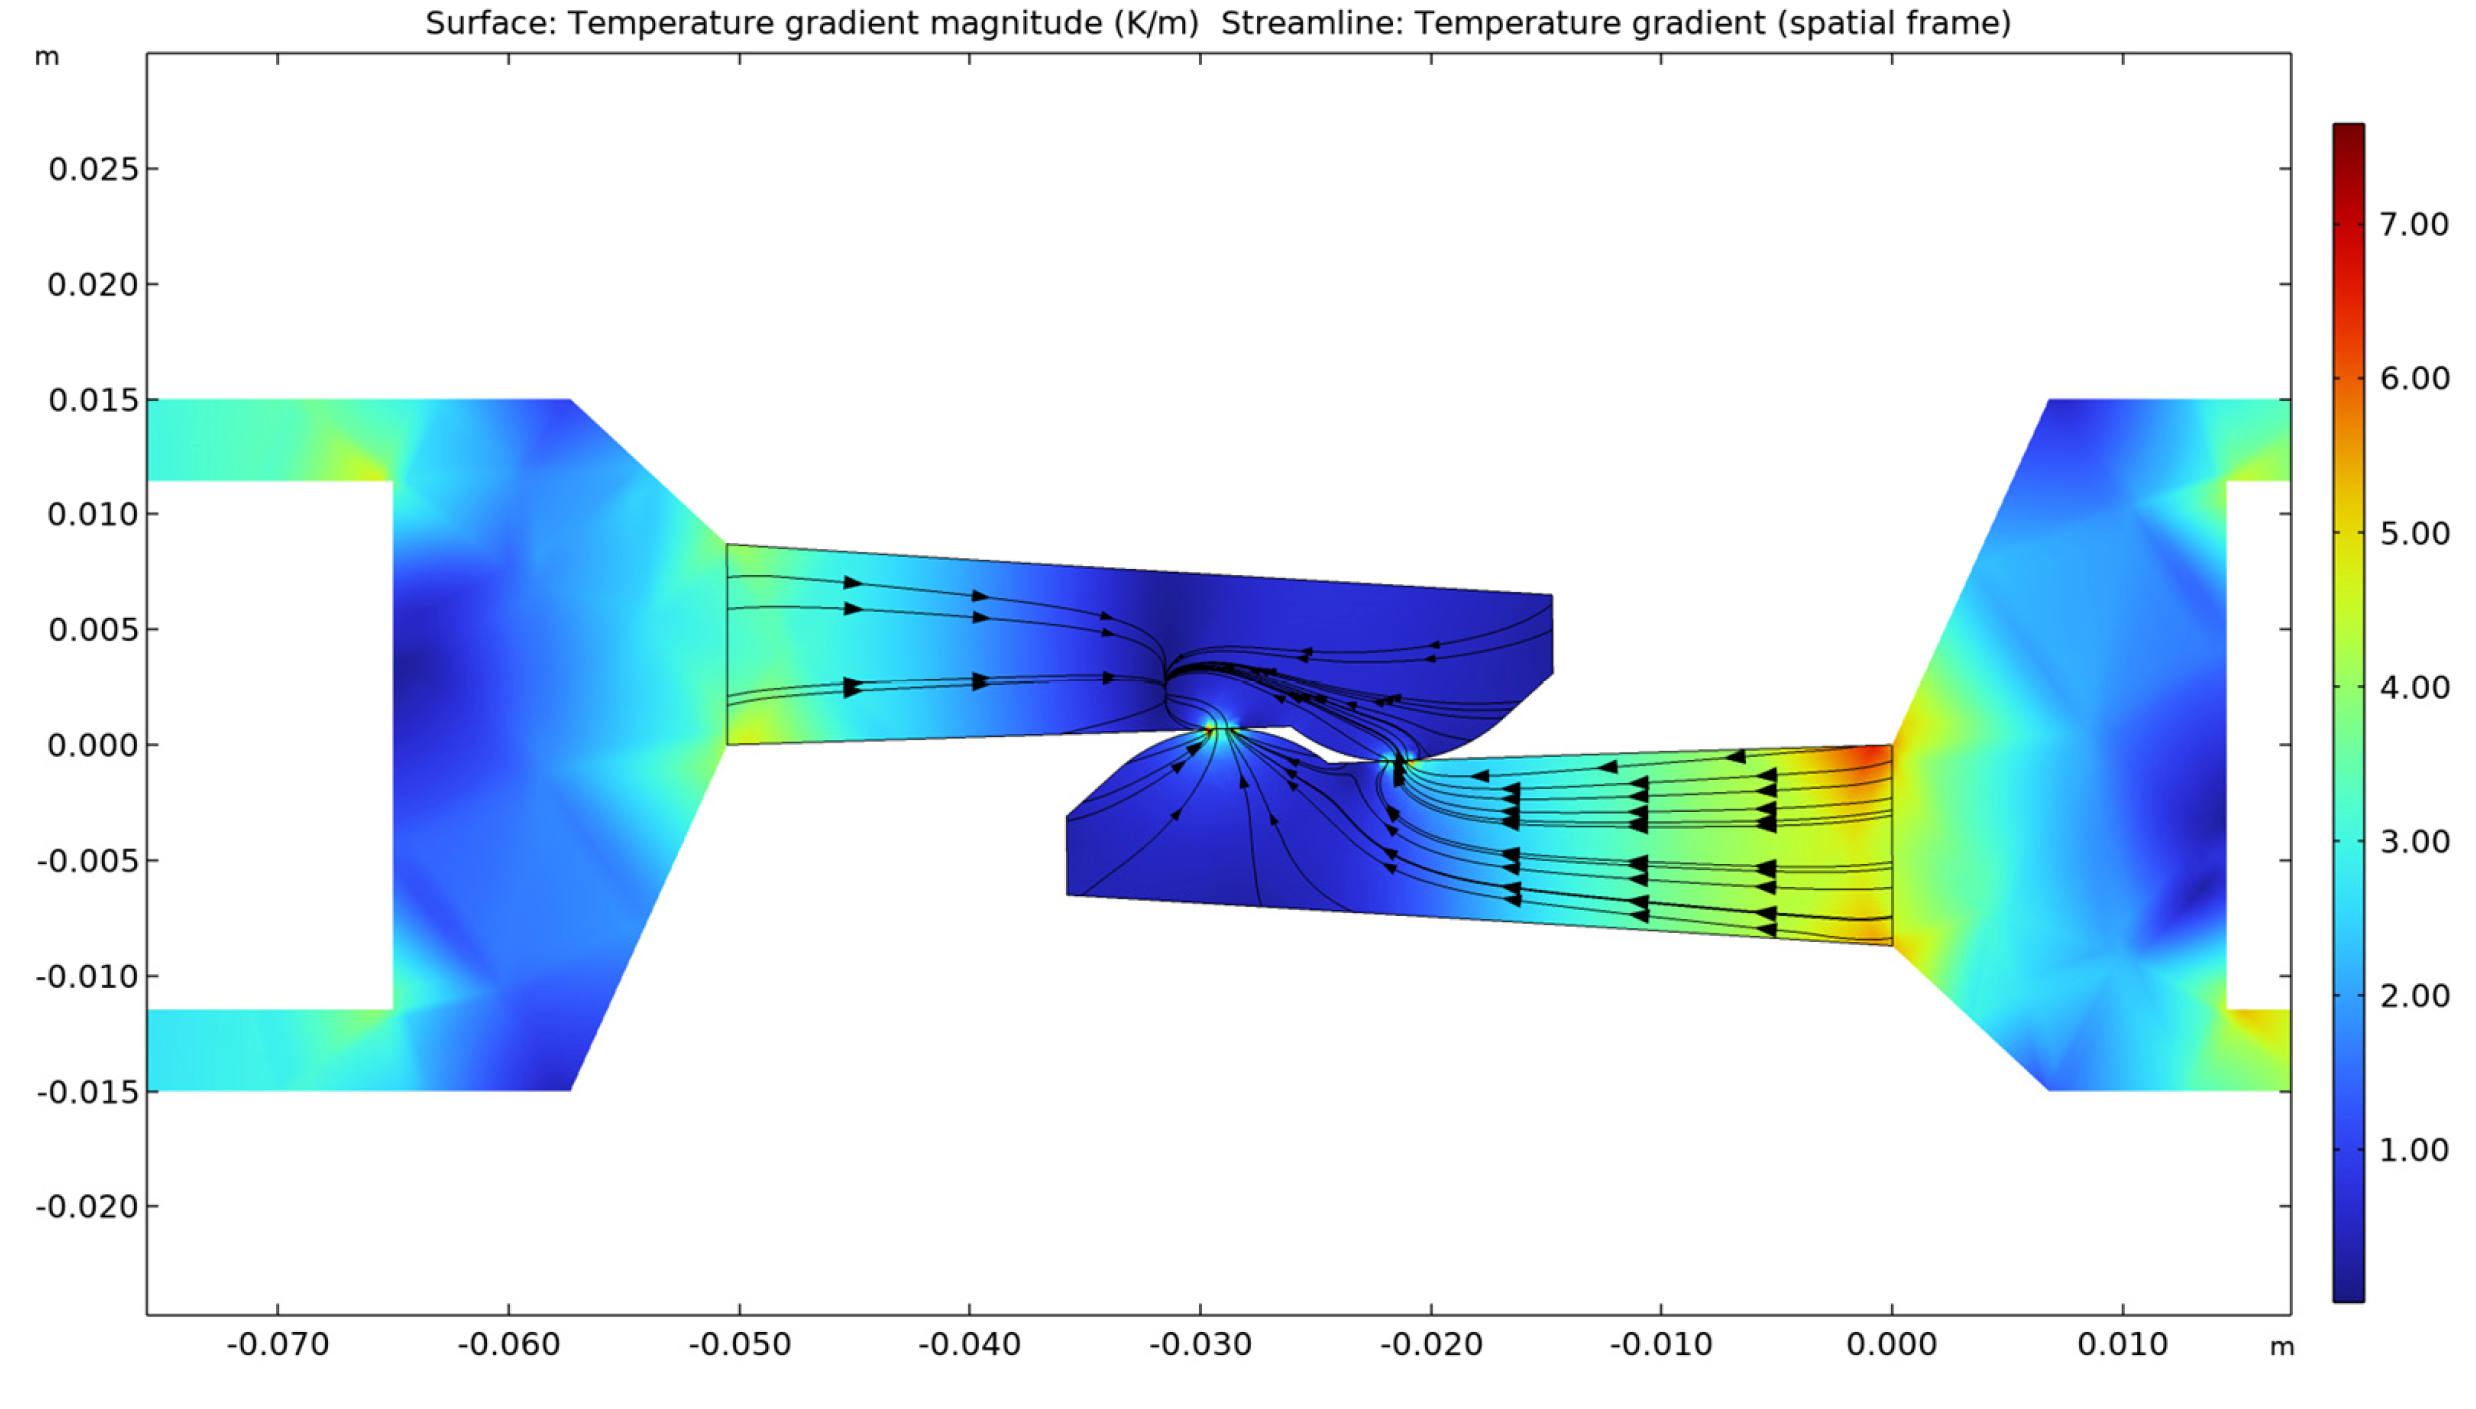
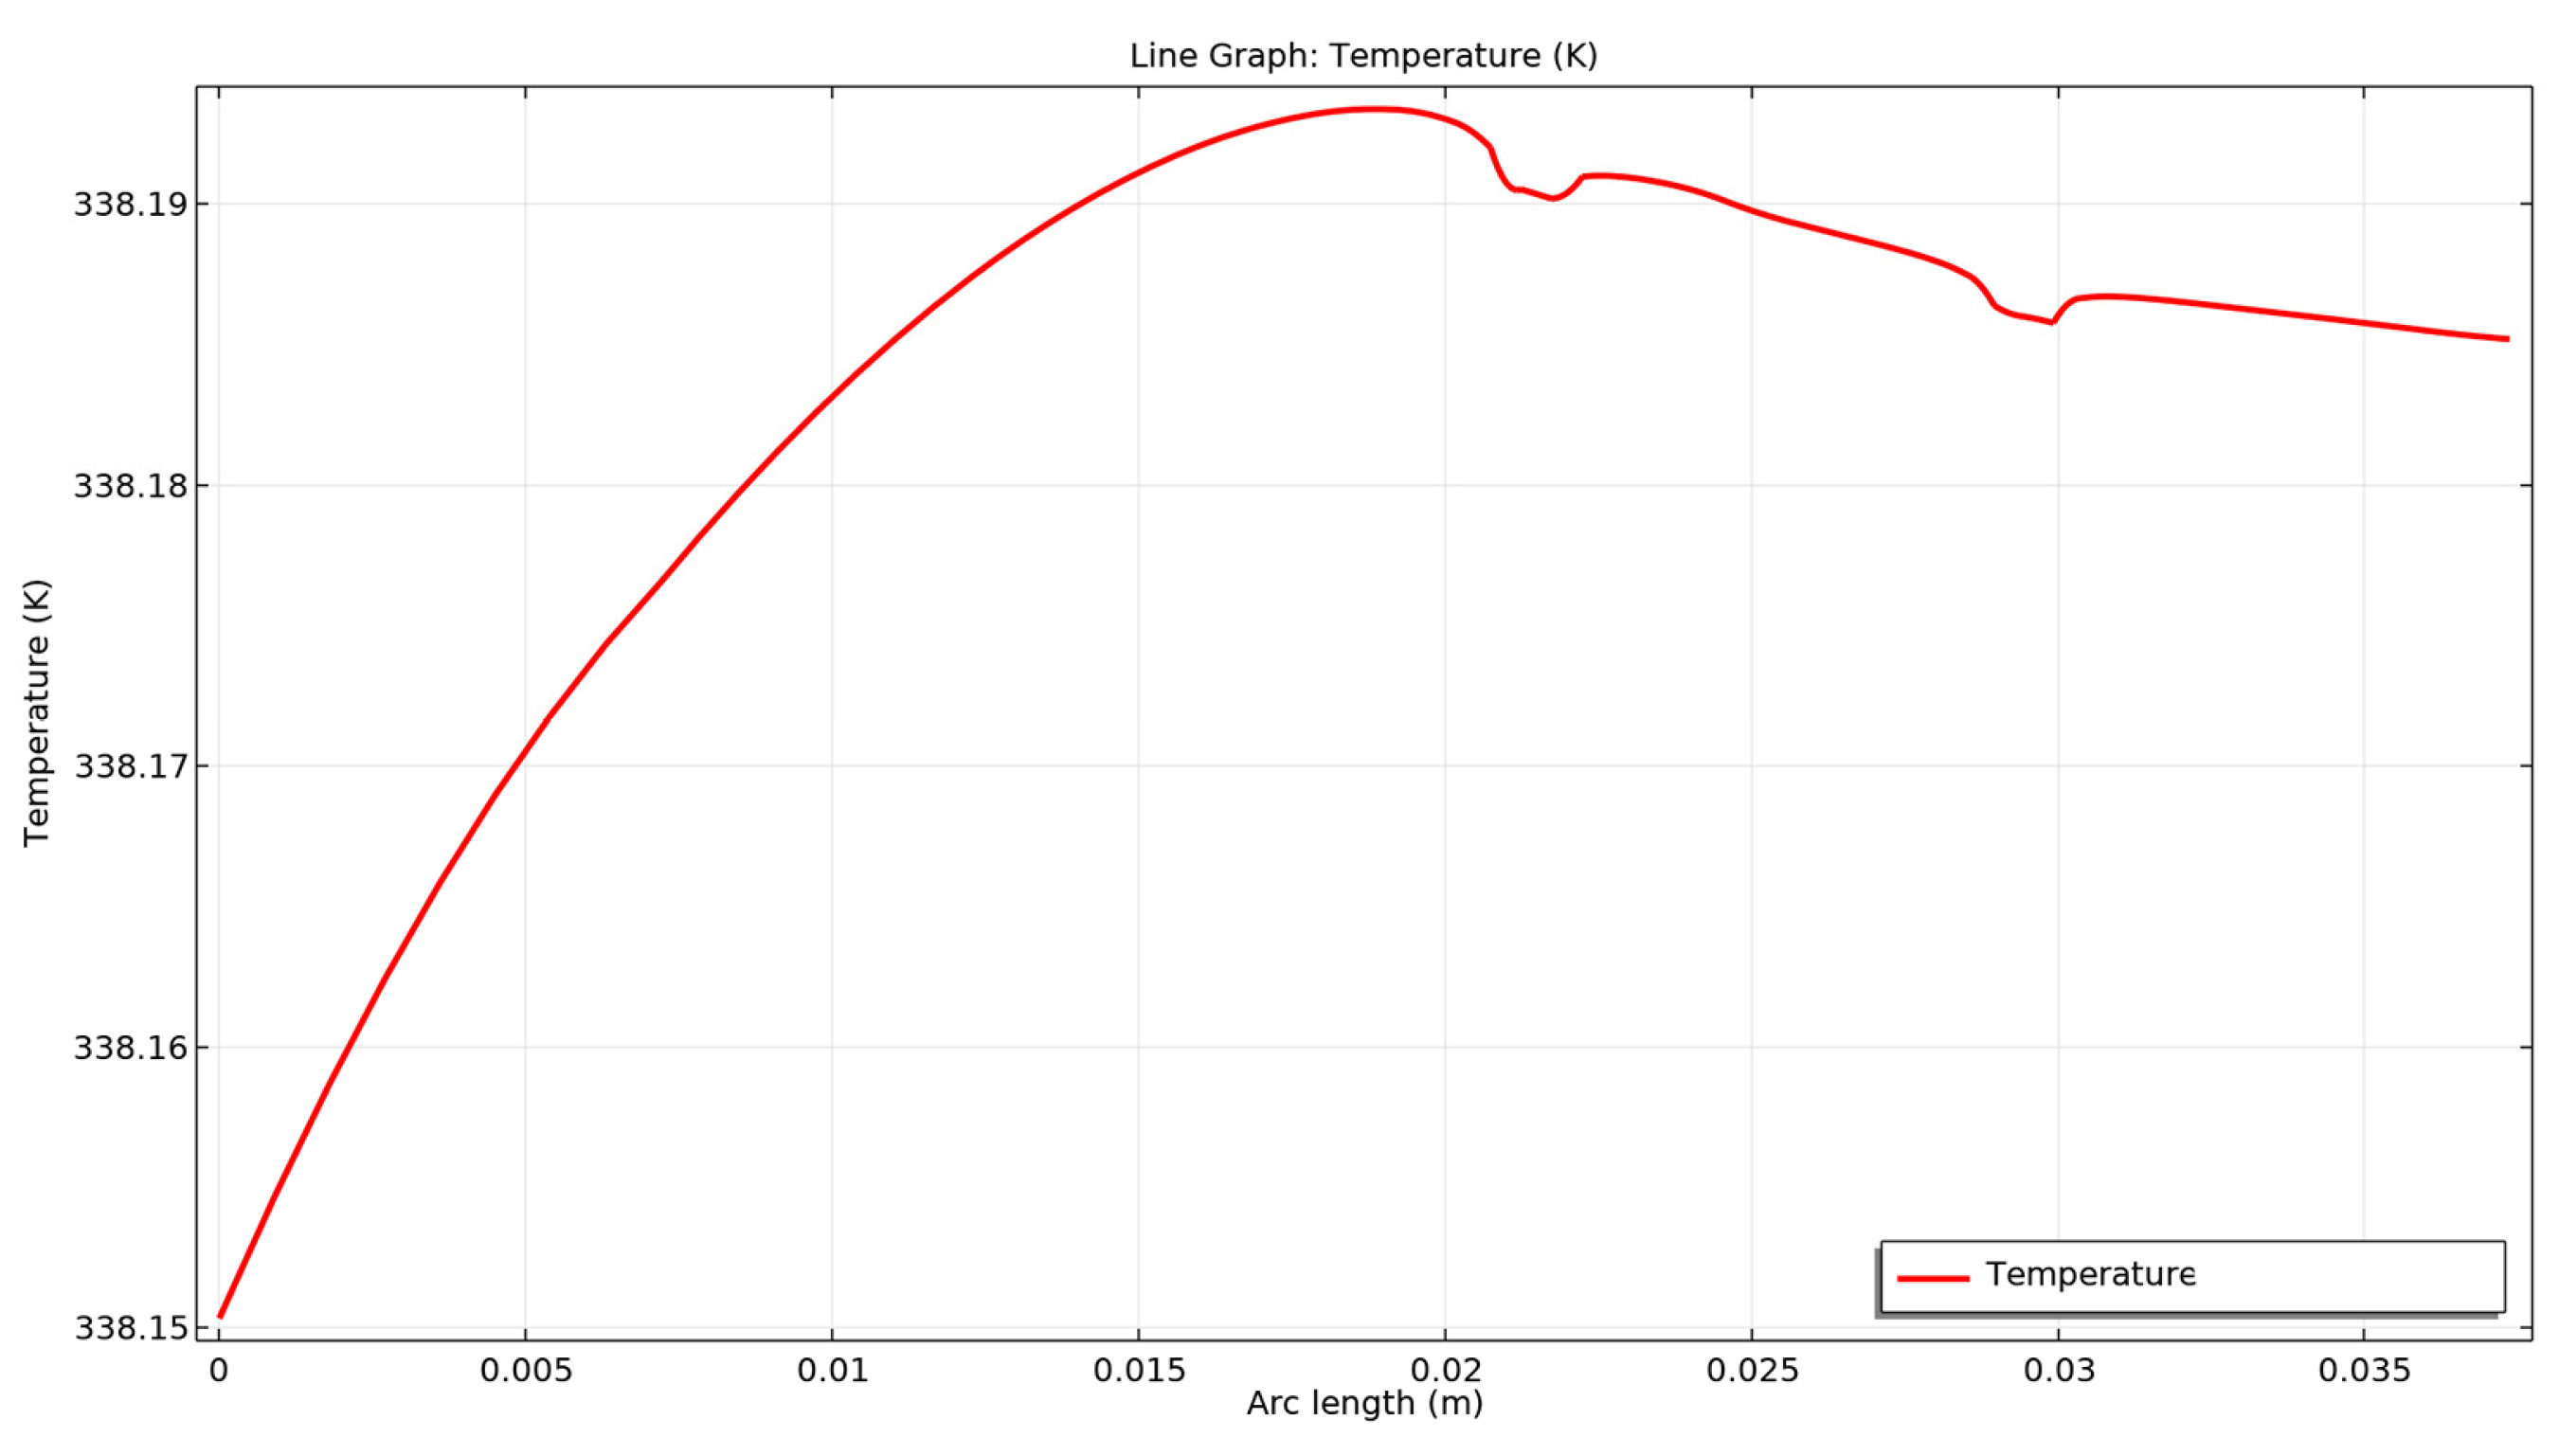
- − The temperature gradient along the contact proves that the highest temperature is in the touching area of the electrical contact. The gradient also shows it is higher in the direction from the zero potential contact elements towards the contact point. This supports the theoretical aspects presented in the Introduction section and shown in Figure 10.
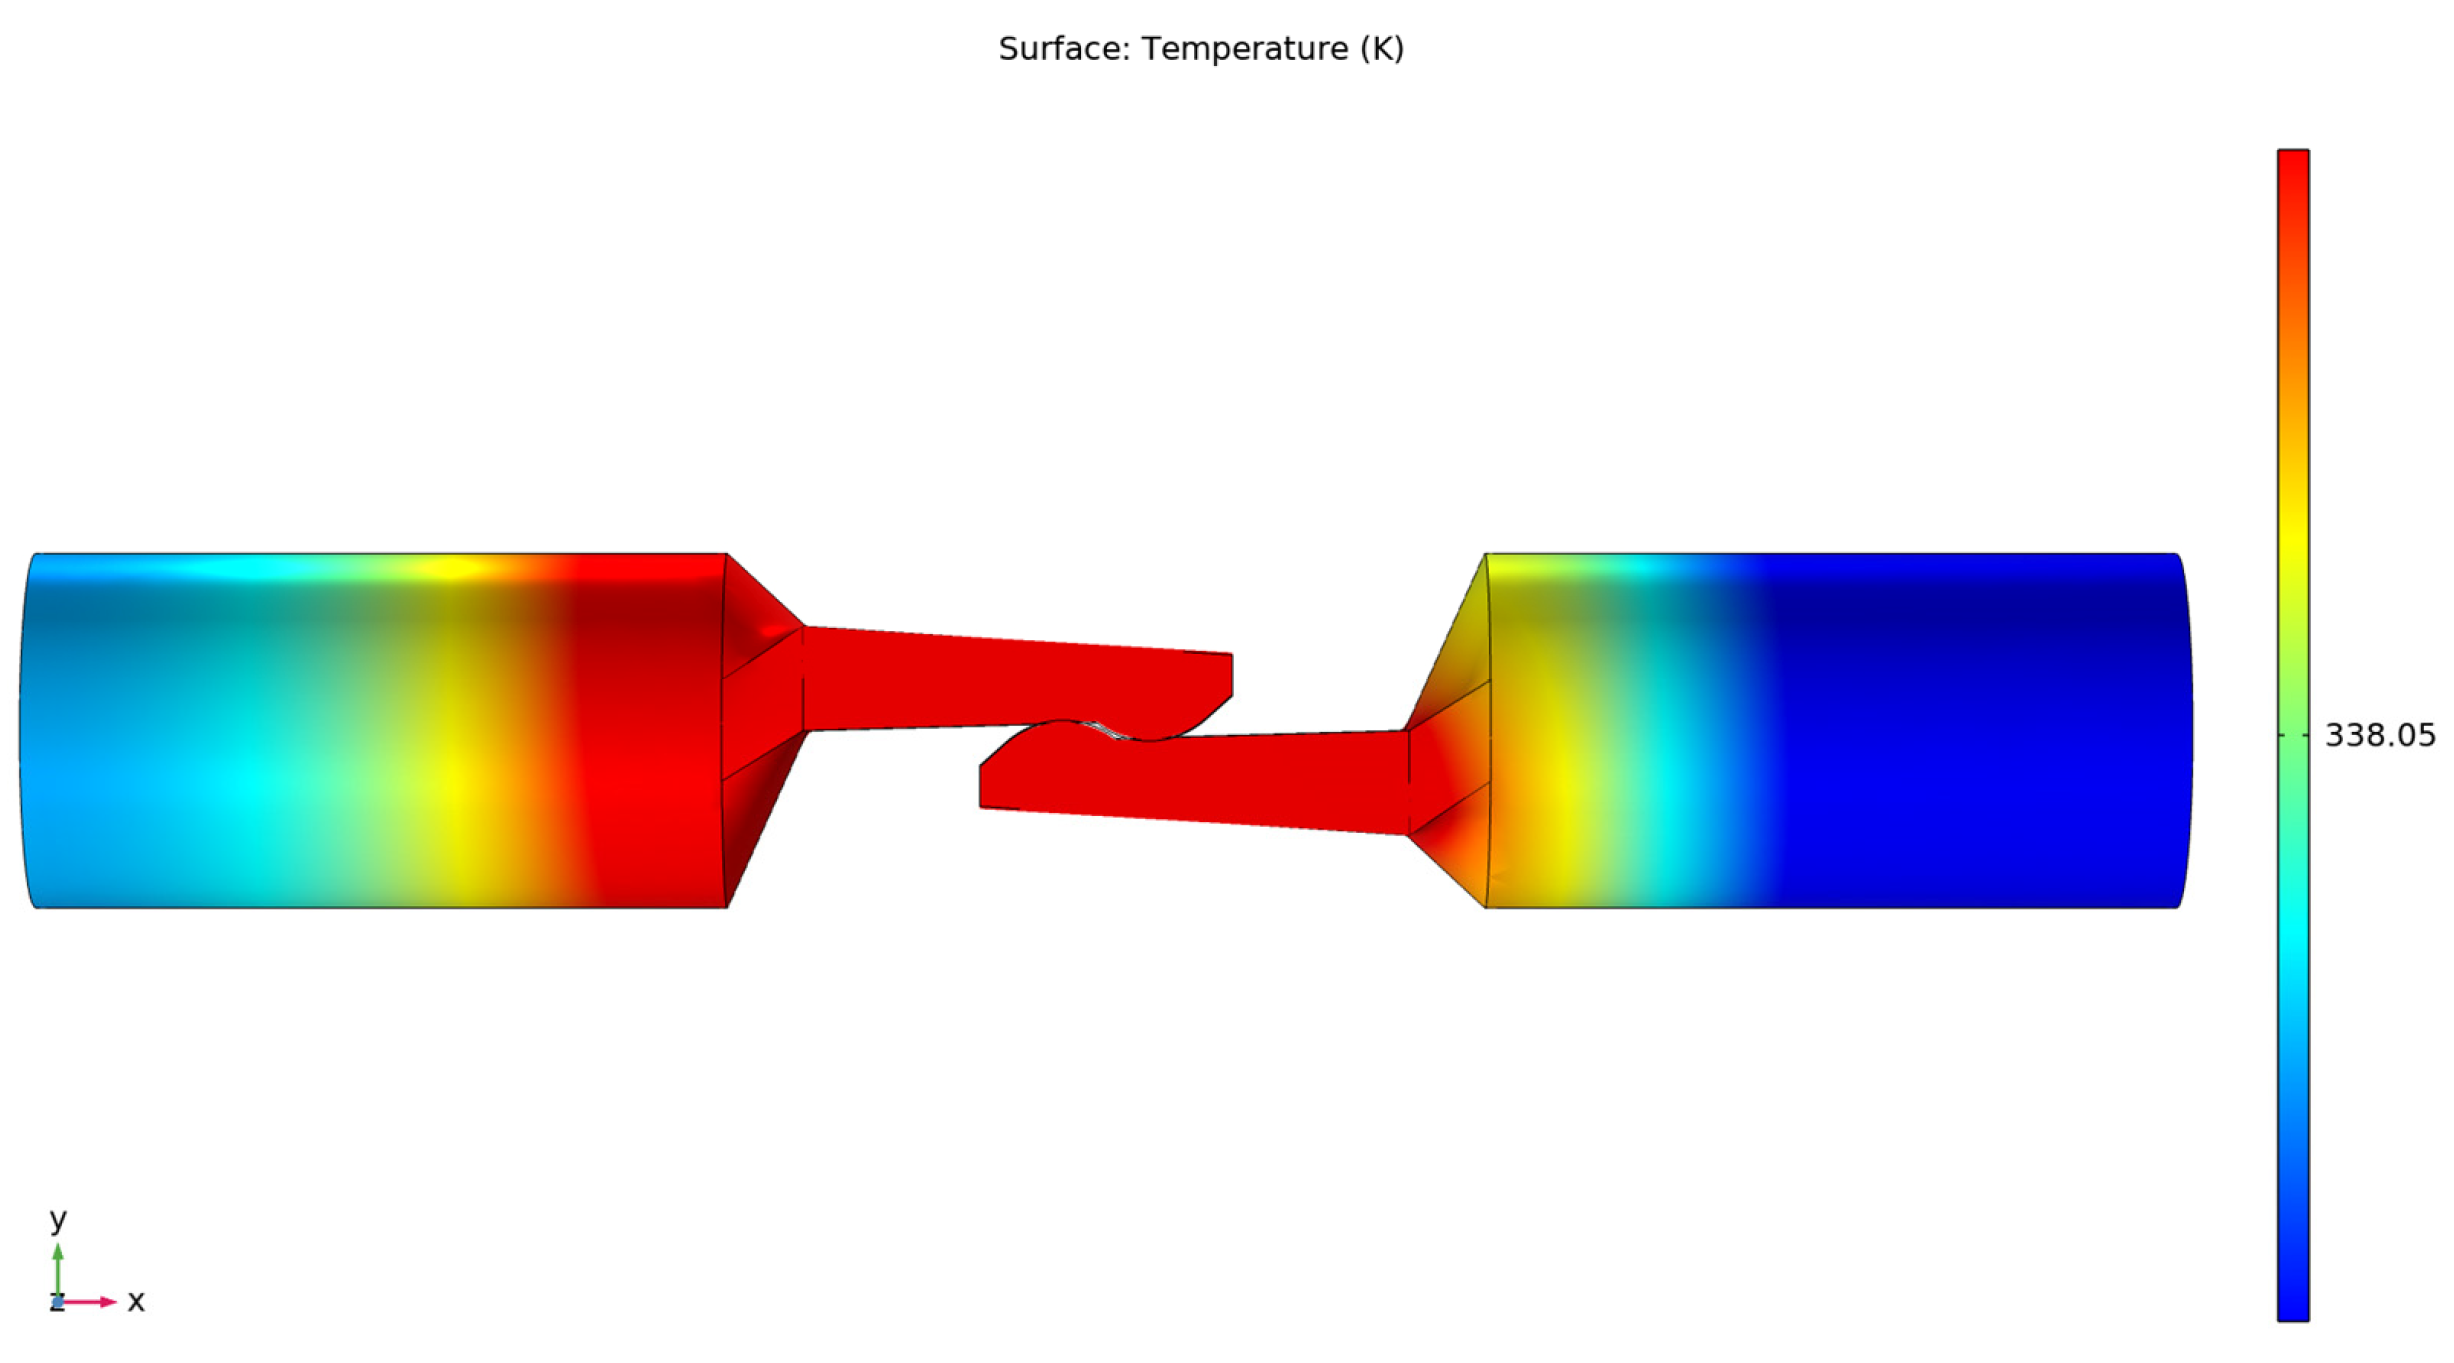
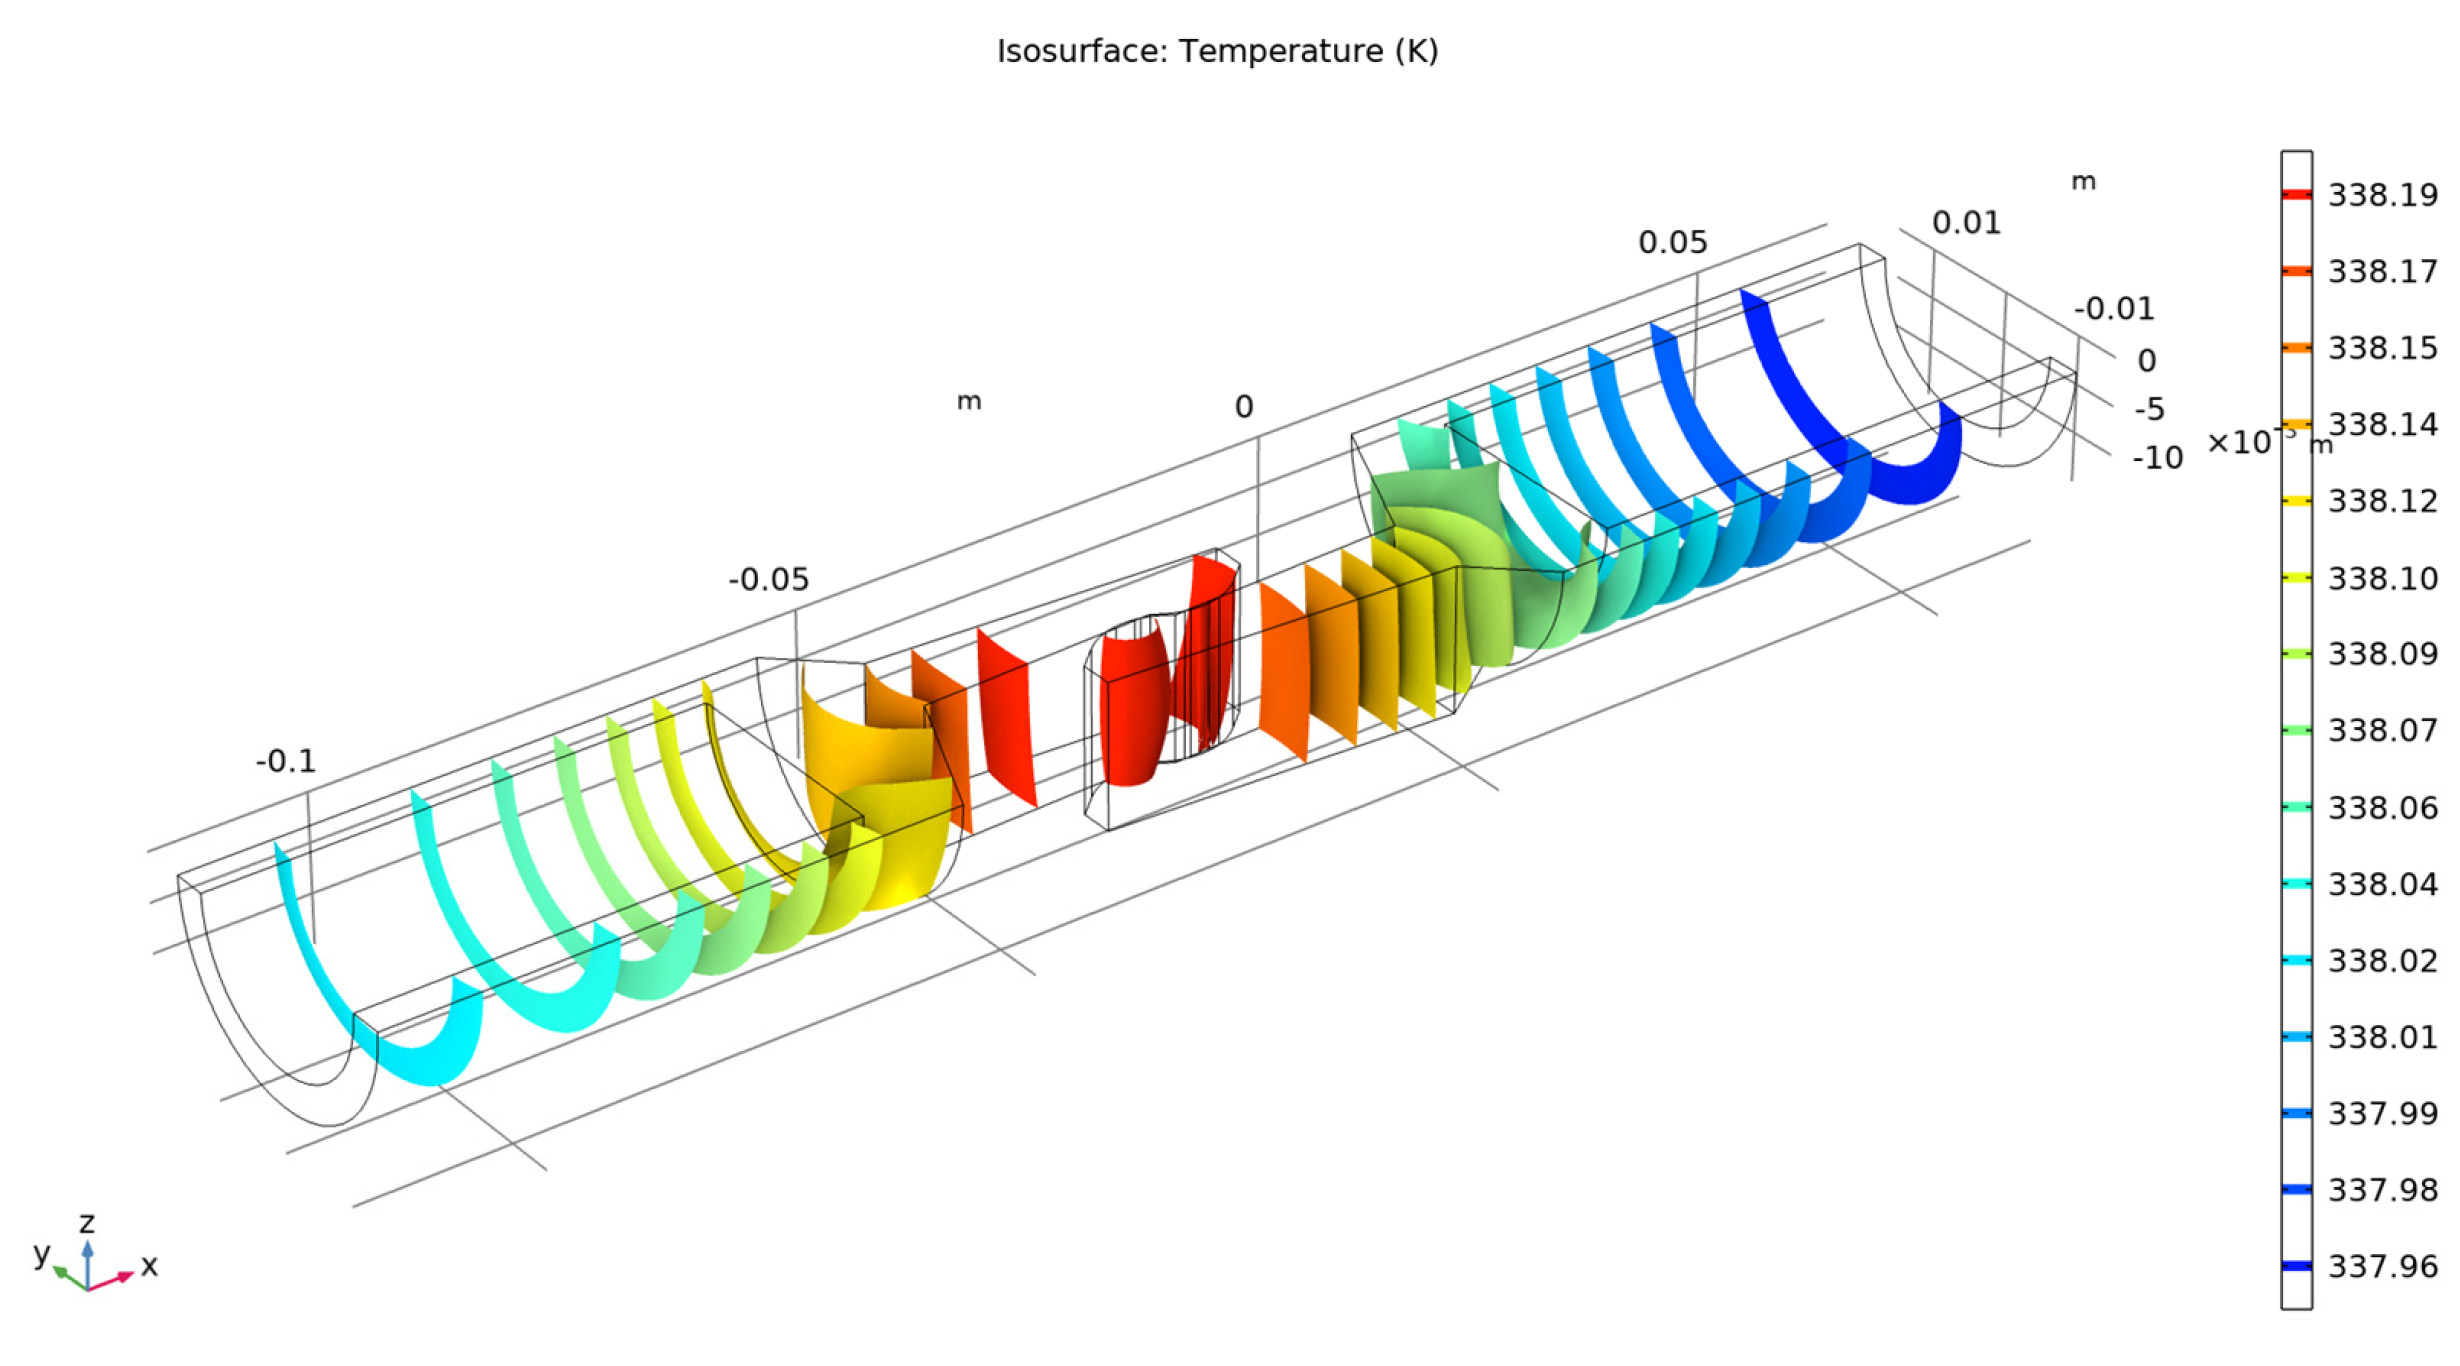
- − The variation of temperature in the current path and the contact elements was graphically represented by isothermal surfaces for 15 temperature levels;
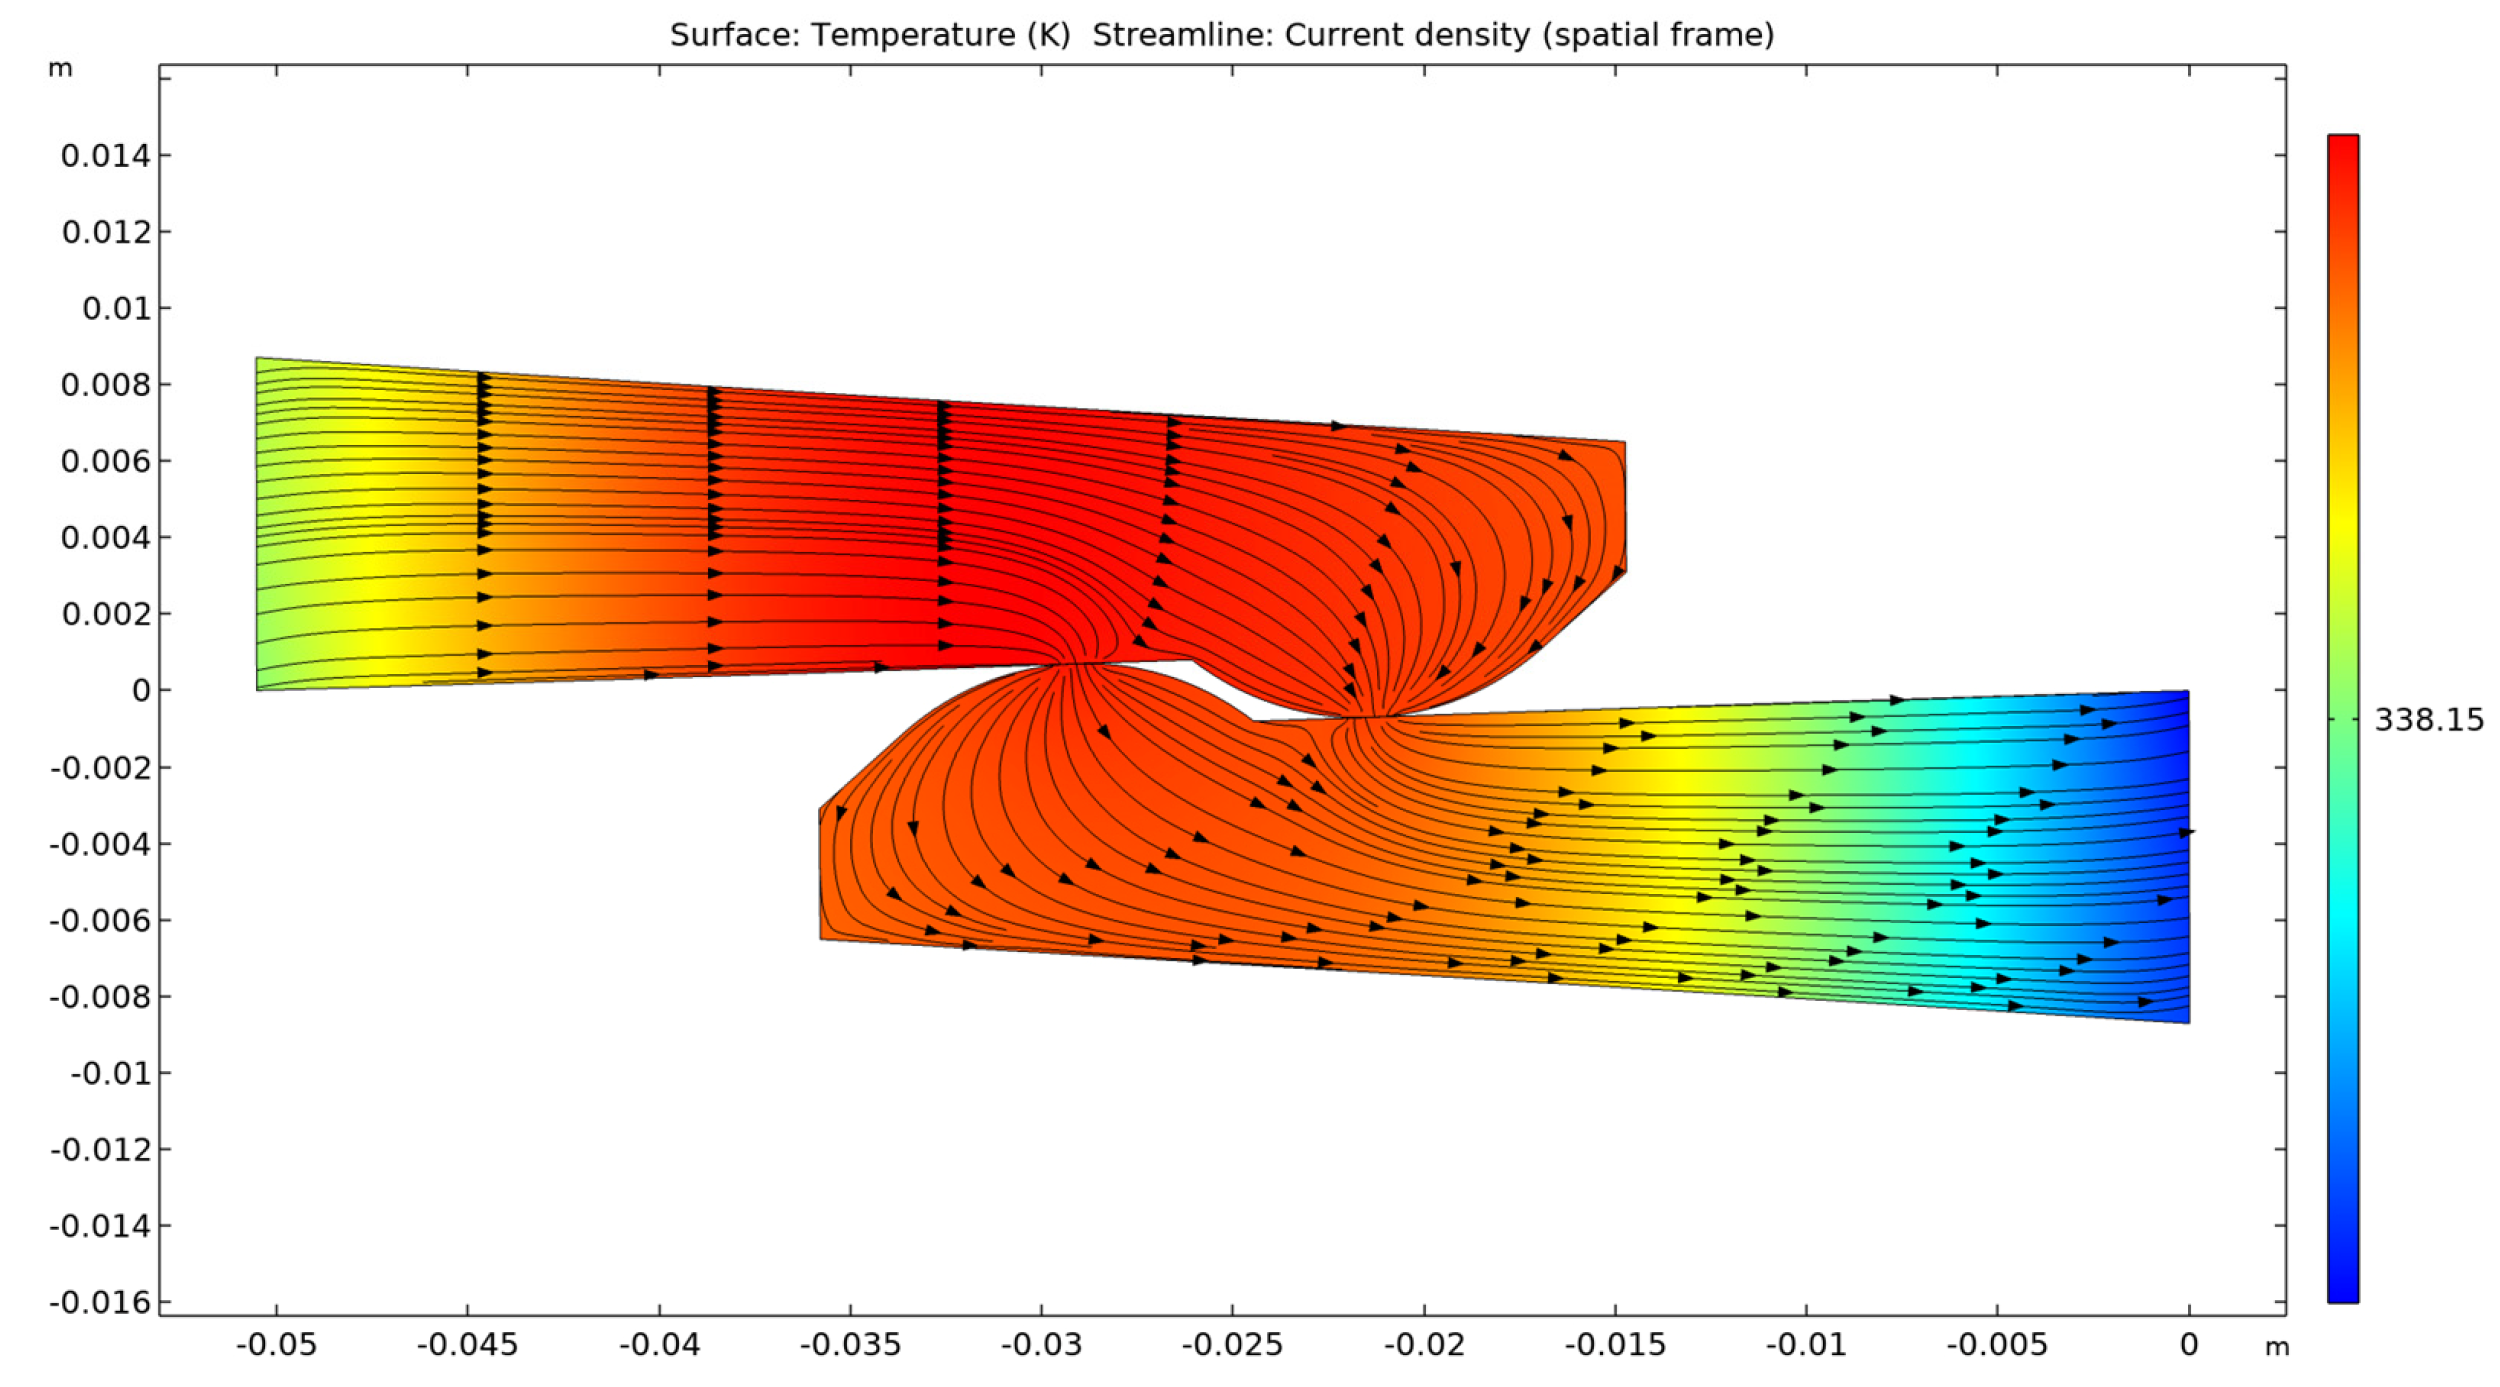
- − The dependence between the temperature variation of the two contact elements and the variation of the current density was shown using color legend, on a plane that passes through the axis of symmetry of the current path and is parallel to plane XY, and also using streamline representation;
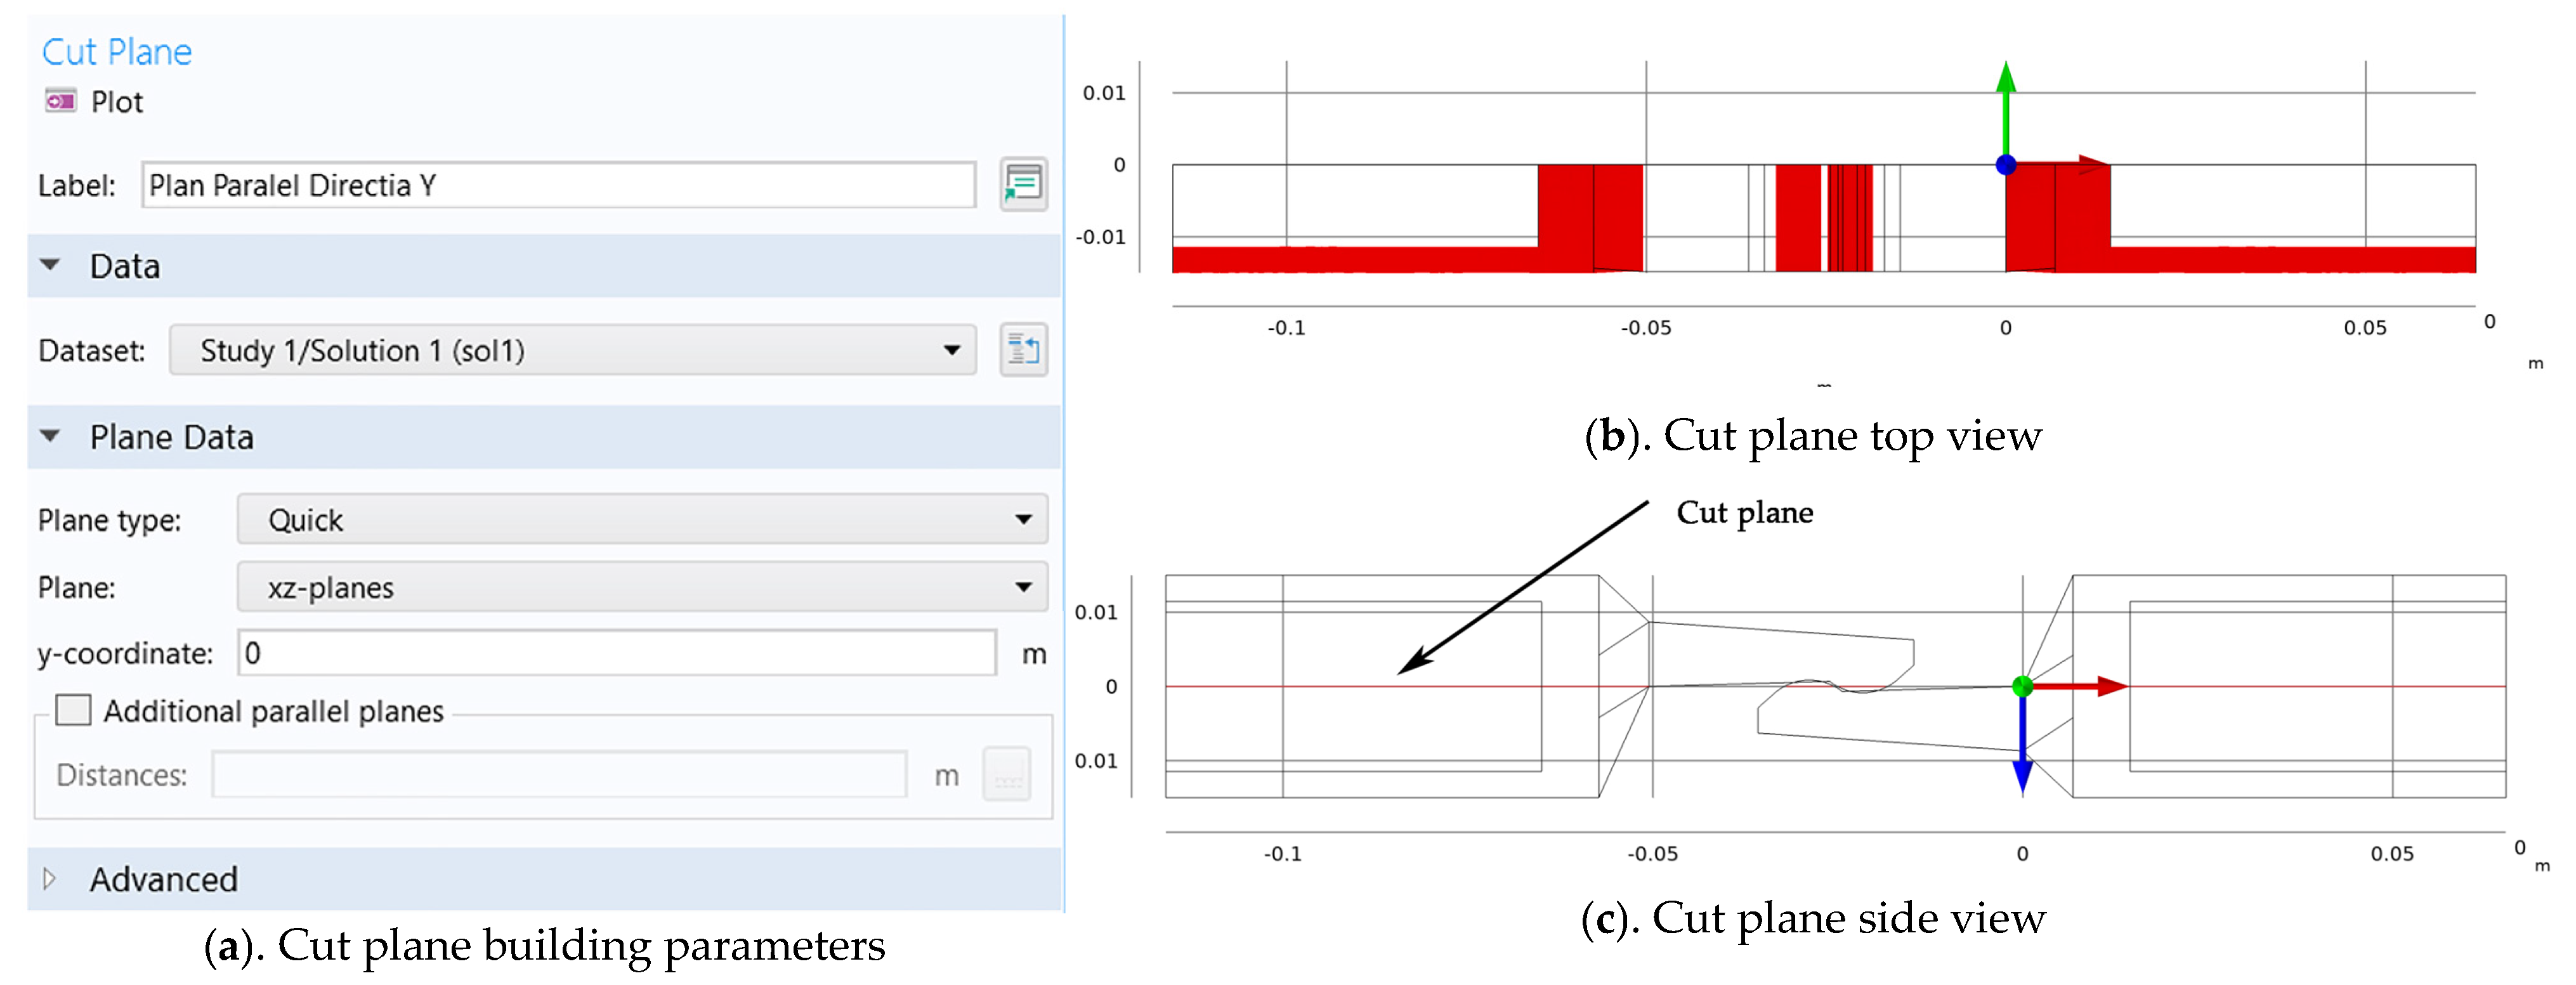
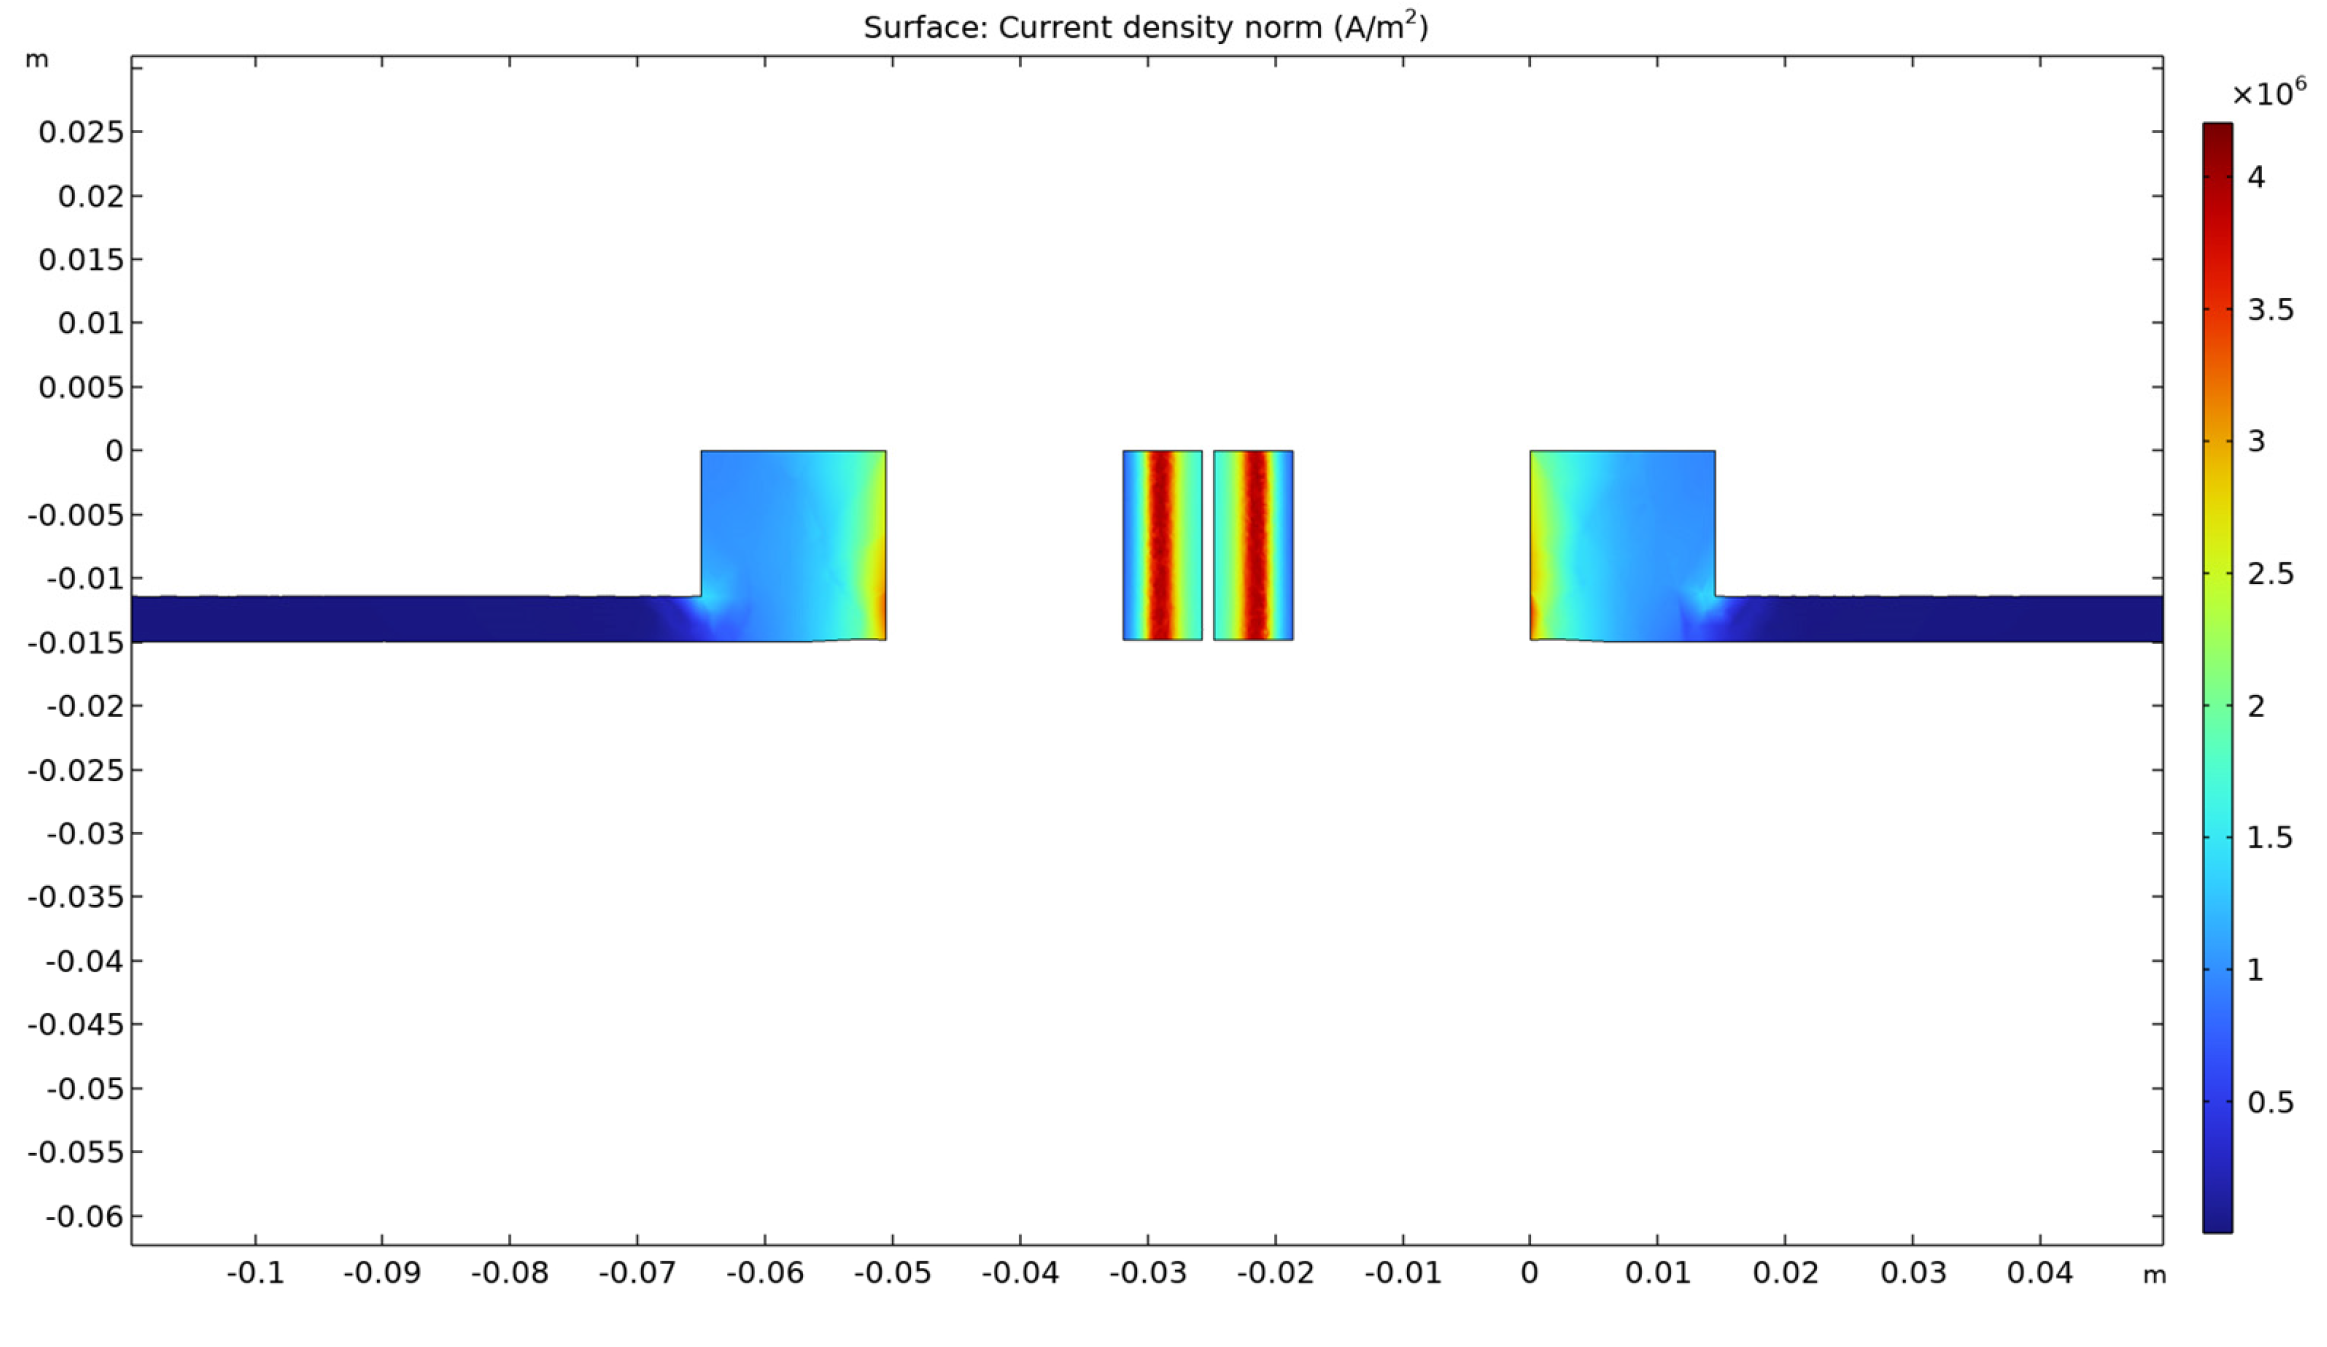
- − In order to have a more conclusive picture of the current density, we presented its variation on the surface of a horizontal longitudinal cut plane;
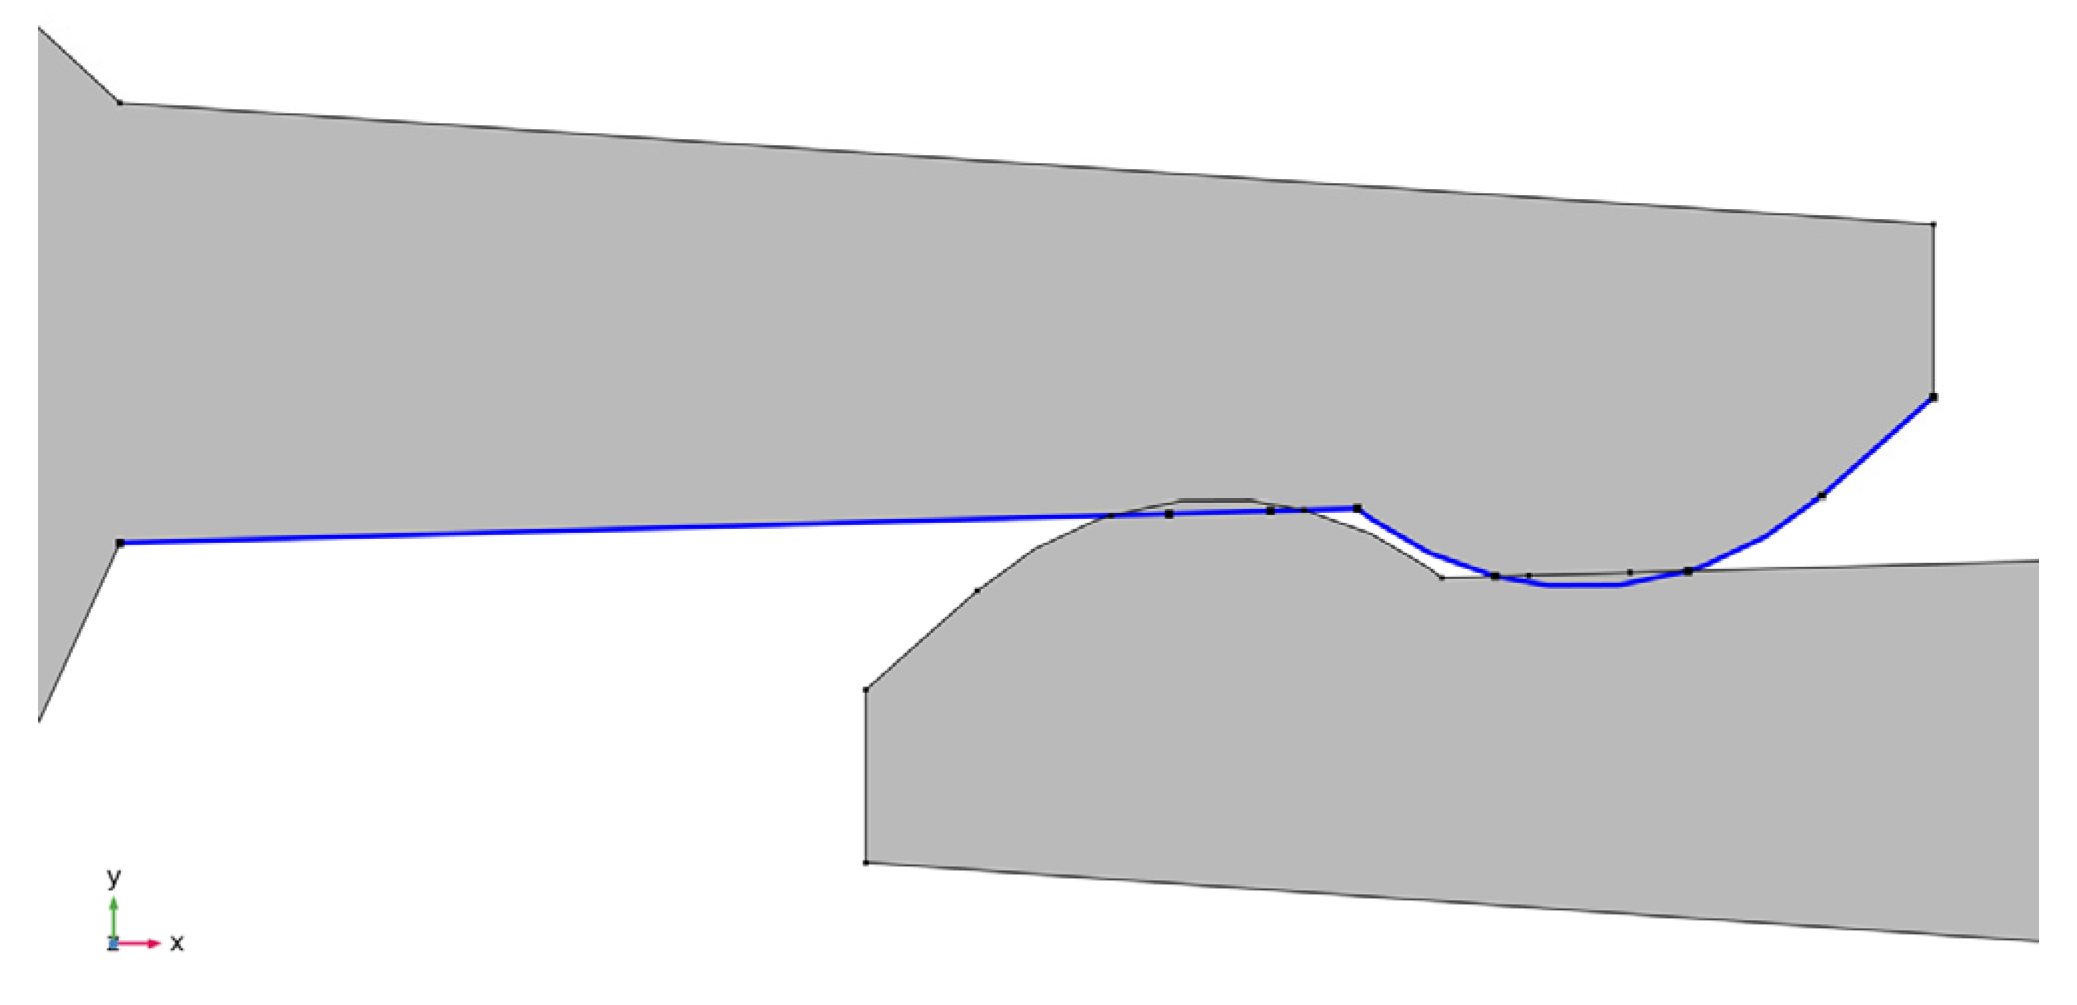
- − By drawing the temperature variation diagram along the edges of the contacts, it was observed that its maximum value is found at the touching points of the contact elements takes place;
- − The maximum contact temperature values were computed by simulation for contact voltages between 0 and 5 mV. Thus, the curve of variation of the increase in contact temperature relative to the contact temperature was plotted, finding this variation as parabolic
Author Contributions
Funding
Institutional Review Board Statement
Informed Consent Statement
Data Availability Statement
Conflicts of Interest
References
- Johnson, K.L. Contact mechanics. Cambridge University Press: Cambridge, UK, 1985. [CrossRef]
- Braunovic, M.; Myshkin, N.K.; Konchits, V. Electrical Contacts: Fundamentals, Applications and Technology; CRC Press: Boca Raton, US, 2006. [Google Scholar] [CrossRef]
- Popov, V.L. Contact Mechanics and Friction; Springer-Verlag: Germany, 2017. [Google Scholar] [CrossRef]
- Slade, P.G. Electrical Contacts: Principles and Applications, 2nd ed.; CRC Press: London, UK, 2017. [Google Scholar] [CrossRef]
- Barber, J.R. Contact Mechanics, 1st ed.; Springer: Berlin, Germany, 2018. [Google Scholar]
- Zhou, X. Electric Contact, Elements, and Systems. In Encyclopedia of Tribology, Wang, Q.J., Chung, Y.W., Eds. Springer: Boston, MA, USA, 2013. [CrossRef]
- Persson, B.N.J. On the Electric Contact Resistance. Tribology Letters 2022, 70, 88. [Google Scholar] [CrossRef]
- Müser, M.H.; Wang, A. Contact-patch-size distribution and limits of self-affinity in contacts between randomly rough surfaces. Lubricants 2018, 6, 85. [Google Scholar] [CrossRef]
- Prodanov, N.; Dapp, W.B.; Müser, M.H. On the contact area and mean gap of rough, elastic contacts: dimensional analysis, numerical corrections, and reference data. Tribology Letters 2014, 53, 433. [Google Scholar] [CrossRef]
- Qiu, D.; Peng, L.; Yi, P.; Lai, X. A micro contact model for electrical contact resistance prediction between roughness surface and carbon fiber paper. Int. J. Mech. Sci. 2017, 124, 37–47. [Google Scholar] [CrossRef]
- He, L.P.; Cai, Z.B.; Peng, J.F.; Deng, W.L.; Li, Y.; Yang, L.Y.; Zhu, M.H. Effects of oxidation layer and roughness on the fretting wear behavior of copper under electrical contact. Materials Research Express 2020, 6, 1265e3. [Google Scholar] [CrossRef]
- Zhang, C.; Ren, W.; Liao, X. On the Relationship between Contact Resistance and Load Force for Electrode Materials with Rough Surfaces. Materials 2022, 15, 5667. [Google Scholar] [CrossRef] [PubMed]
- Biele, L.; Schaaf, P.; Schmid, F. Influence of Contact Pressure on the Specific Electrical Contact Resistance of Copper. IEEE Transactions on Components, Packaging and Manufacturing Technology 2022, 12, 973–980. [Google Scholar] [CrossRef]
- Timsit, R.S. Electrical Contacts: Scientific Fundamentals. In Encyclopedia of Tribology, Wang, Q.J., Chung, Y.W., Eds. Springer: Boston, MA, USA, 2013. [CrossRef]
- Faltin, C. Exact solution of constriction resistance and temperature field within a homogeneous cylindrical body heated by an isothermal circular contact spot. International Communications in Heat and Mass Transfer 1985, 12, 677–86. [Google Scholar] [CrossRef]
- Negus, K.J.; Yovanovich, M.M.; Beck, J.V. On the nondimensionalization of constriction resistance for semi-infinite heat flux tubes. Journal of Heat Transfer 1989, 111, 804–7. [Google Scholar] [CrossRef]
- Yovanovich, M.M. Overall constriction resistance between contacting rough, wavy surfaces. International Journal of Heat and Mass Transfer 1969, 12, 1517–20. [Google Scholar] [CrossRef]
- Lambert MA, Fletcher LS. Thermal contact conductance of spherical rough metals. Journal of Heat Transfer 1997, 119, 684–90. [Google Scholar] [CrossRef]
- Lei, H.; Zhu, X.; Wang, H.; Chen, J.; Liu, Q.; Niu, C.; Wang, L.; Yang, F. Investigation on Mathematical Model of Electric Contact Based on Fractal Geometry. Lecture Notes in Electrical Engineering, 2021; 617–628. [Google Scholar] [CrossRef]
- Capelli, F.; Riba, J. -R.; Rupérez, E.; Sanllehí, J. A Genetic-Algorithm-Optimized Fractal Model to Predict the Constriction Resistance From Surface Roughness Measurements. IEEE Transactions on Instrumentation and Measurement 2017, 66, 2437–47. [Google Scholar] [CrossRef]
- Zou, M.; Yu, B.; Cai, J.; Xu, P. Fractal model for thermal contact conductance. Journal of Heat Transfer 2008, 130, 101301. [Google Scholar] [CrossRef]
- Talukder, S.; Yeo, C.-D.; Hong, Y.-K.; Choi, M.; Flicek, R.C.; Bishop, J.E. Analytical modeling and simulation of electrical contact resistance for elastic rough electrode surface contact including frictional temperature rise. AIP Advances 2022, 12(2), 025204. [Google Scholar] [CrossRef]
- Popescu, A.; Lazarescu, E.; Frigura-Iliasa, F.M.; Dolga, L.; Filipescu, H.E.; Andreea, A. Analytical Model for the Electrodynamical Forces inside Electrical Contacts of Commutation Devices. In 2019 20th International Scientific Conference on Electric Power Engineering (EPE), Kouty nad Desnou, Czech Republic, 2019, pp. 1-4. [CrossRef]
- Shah, S.G.; Krithivasan, V.; Jackson, R.L. An electro-mechanical contact analysis of a three-dimensional sinusoidal surface against a rigid flat. Wear 2011, 270, 270–914. [Google Scholar] [CrossRef]
- Blauth, M.; Berger, F.; Song, J. Analytical and Experimental Investigation of the Electrical-Thermal Behaviour of Electrical Contact Systems. British Journal of Applied Science & Technology 2014, 4, pp–18. [Google Scholar] [CrossRef]
- Dutta, S.; Vikram, G.N.V.R.; Bobji, M.S.; Mohan, S. Table top experimental setup for electrical contact resistance measurement during indentation. Measurement 2020, 152, p–107286. [Google Scholar] [CrossRef]
- Kogut, L.; Komvopoulos, K. Analysis of interfacial adhesion based on electrical contact resistance measurements. Journal of applied physics 2003, 94, 6386–6390. [Google Scholar] [CrossRef]
- Beloufa, A. Numerical and experimental optimization of mechanical stress, contact temperature and electrical contact resistance of power automotive connector. International Journal of Mechanics 2010, 4, 94–104. [Google Scholar]
- Zhang, S.; Zhao, X.; Ye, M.; He, Y. Theoretical and Experimental Study on Electrical Contact Resistance of Metal Bolt Joints. IEEE Transactions on Components, Packaging and Manufacturing Technology 2019, 9, 1301–1309. [Google Scholar] [CrossRef]
- Pradille, C.; Bay, F.; Mocellin, K. An Experimental Study to Determine Electrical Contact Resistance. In Proceedings of the 56th IEEE Holm Conference on Electrical Contacts, Charleston, SC, USA; 2010; pp. 1–5. [Google Scholar] [CrossRef]
- Wangwiwattana, S.; Yoshikazu, K. Joule Heating and Arc-Fault-Induced Electrical Fires for Commercial-Grade Copper and Brass in Low-Voltage Electrical Systems. Appl. Sci. 2022, 12, 4710. [Google Scholar] [CrossRef]
- Zavarise, G.; Wriggers, P.; Stein, E.; Schrefler, B.A. Real contact mechanisms and finite element formulation—a coupled thermomechanical approach. International Journal for Numerical Methods in Engineering 1992, 35, 767–785. [Google Scholar] [CrossRef]
- Wriggers, P.; Miehe, C. Contact constraints within coupled thermomechanical analysis-a finite element model. Computer Methods in Applied Mechanics and Engineering 1994, 113, 301–319. [Google Scholar] [CrossRef]
- Zienkiewicz, O.C.; Taylor, R.L. The finite element method, 4th ed., McGraw-Hill: London, UK, 1989.
- Agelet de Saracibar, C. Numerical analysis of coupled thermomechanical frictional contact problems. Computational model and applications. Archives of Computational Methods in Engineering 1998, 5, 243–301. [Google Scholar] [CrossRef]
- Weißenfels, C.; Wriggers, P. Numerical modeling of electrical contacts. Computational Mechanics 2010, 46, 301–314. [Google Scholar] [CrossRef]
- Renouf, M.; Fillot, N. Coupling electrical and mechanical effects in discrete element simulations. International Journal for Numerical Methods in Engineering 2007, 74, 238–254. [Google Scholar] [CrossRef]
- Bourbatache, K.; Guessasma, M.; Bellenger, E.; Bourny, V.; Tekaya, A. Discrete modelling of electrical transfer in multi-contact systems. Granular Matter 2012, 14, 1–10. [Google Scholar] [CrossRef]
- Zhang, J.; Zavaliangos, A. Discrete element simulation of transient thermo-electrical phenomena in particulate system. In: Granular Material-Based Technologies, MRS Proceedings, Boston, MA, USA, vol. 759, 2002.
- Fortin, J.; Millet, O.; De Saxcè, G. Numerical simulation of granular materials by an improved discrete element method. International Journal for Numerical Methods in Engineering 2004, 62, 639–663. [Google Scholar] [CrossRef]
- Gwinner, J.; Stephan, E.P. BEM for Contact Problems. In: Advanced Boundary Element Methods. Springer Series in Computational Mathematics; Springer, Cham, 2018; vol 52, pp. 389–449. [CrossRef]
- Frérot, L.; Bonnet, M.; Molinari, J.-F.; Anciaux, G. A Fourier-accelerated volume integral method for elastoplastic contact. Computer Methods in Applied Mechanics and Engineering 2019, 351, 951–976. [Google Scholar] [CrossRef]
- Xu, Y.; Jackson, R.L. Boundary element method (BEM) applied to the rough surface contact vs. BEM in computational mechanics. Friction 2018, 7, 359–371. [Google Scholar] [CrossRef]
- Szulborski, M.; Łapczyński, S.; Kolimas, Ł.; Zalewski, D. Transient Thermal Analysis of the Circuit Breaker Current Path with the Use of FEA Simulation. Energies 2021, 14, 2359. [Google Scholar] [CrossRef]
- Zhang, C.; Ren, W.; Wang, G.A. Finite Element Method to Investigate Electrical Contact Behaviors Considering Asperity Interactions. In 2020 IEEE 66th Holm Conference on Electrical Contacts and Intensive Course (HLM), San Antonio, TX, USA, 2020, pp. 98-104. [CrossRef]
- Riba, J.-R.; Mancini, A.-G.; Abomailek, C.; Capelli, F. A 3D-FEM-based model to predict the electrical constriction resistance of compressed contacts. Measurement 2018, 114, 44–50. [Google Scholar] [CrossRef]
- Li, Y.-H.; Shen, F.; Ke, L.-L. Multi-physics electrical contact analysis considering the electrical resistance and Joule heating. International Journal of Solids and Structures 2022, 256, 111975. [Google Scholar] [CrossRef]
- Shen, F.; Ke, L.-L. Numerical Study of Coupled Electrical-Thermal-Mechanical-Wear Behavior in Electrical Contacts. Metals 2021, 11, 955. [Google Scholar] [CrossRef]
- Gonzalo, S.R. Coupling of mechanical and electrical contact behavior of current carrying connections in finite element models. B.Sc. Thesis, Universidad de Valladolid. Escuela de Ingenierías Industriales, Valladolid, Spain, 2021. [Google Scholar]
- Angadi, S.V.; Jackson, R.L.; Pujar, V.V.; Tushar, M. A Comprehensive Review of the Finite Element Modeling of Electrical Connectors Including Their Contacts. IEEE Transactions on Components, Packaging and Manufacturing Technology 2020, 10, 836–844. [Google Scholar] [CrossRef]
- Kim, S.H. .; Lee, K.W. Numerical approach to joule heating analysis for electrical parts using MSC Marc. Journal of Mechanical Science and Technology 2015, 29, 2081–2087. [Google Scholar] [CrossRef]
- Lv, B.; Zhou, S.J.; Zhao, L.Y. . Technical research on optimization design of contacts of electrical connector. Journal of Zhejiang University-Science A 2007, 8, 506–510. [Google Scholar] [CrossRef]
- Duan, K.; Zhu, F.; Li, Y.; Tang, K.; Liu, S.; Chen, Y. Contact resistance investigation of electrical connector with different shrink range. In 2014 15th International Conference on Electronic Packaging Technology, Chengdu, China, 2014, pp. 1146–1149. [CrossRef]
- Liu, H.; Leray, D.; Pons, P.; Colin, S. Finite element multi-physics modeling for ohmic contact of microswitches. In 15th International Conference on Thermal, Mechanical and Mulit-Physics Simulation and Experiments in Microelectronics and Microsystems (EuroSimE), Ghent, Belgium, 2014, pp. 1-8. [CrossRef]
- Angadi, S.V.; Wilson, W.E.; Jackson, R.L.; Flowers, G.; Rickett, B. A Multi-Physics Finite Element Model of an Electrical Connector Considering Rough Surface Contact. In 2008 IEEE 54th Holm Conference on Electrical Contacts, Orlando, FL, USA 2008, pp. 168-177. [CrossRef]
- Luo, S.; Wang, B.; Jiang, J.; Li, J.; Zou, G.; Zeng, L. Numerical analysis on mechanical and fatigue behaviors of aviation electrical connector considering structural effect. International Journal of Numerical Modelling: Electronic Networks, Devices and Fields 2024, 37, p–e3183. [Google Scholar] [CrossRef]
- Ren, W.B.; Cui, L.; Zhai, G. Simulation of contacts inserted characteristics and contact resistance for electrical connector. Journal of Electromechanical Components 2012, 32, 40–48. [Google Scholar]
- Terhorst, M.; Ozhoga-Maslovskaja, O.; Trauth, D.; Shirobokov, A.; Mattfeld, P.; Solf, M.; Klocke, F. Electro-thermo-mechanical contact model for bulk metal forming under application of electrical resistance heating. The International Journal of Advanced Manufacturing Technology 2017, 89, 3601–3618. [Google Scholar] [CrossRef]
- Zhang, J.; Huang, L.; Chen, T.; Su, G. Simulation based analysis of electrical fire risks caused by poor electric contact between plug and receptacle. Fire Safety Journal 2021, 126, 103434. [Google Scholar] [CrossRef]
- Guo, F.; Gu, X.; Li, L.; Wang, Z.; Wang, T.; Jia, S. Effect of surface microparameters on contact temperature of sliding electrical contact. IEEE Transactions on Industrial Informatics 2021, 18, 5972–5981. [Google Scholar] [CrossRef]
- Zhang, C.; Zhao, Z.; Ren, W. Simulation and experimental investigation of contact spot temperature for electrical contact components. IOP Conference Series: Materials Science and Engineering 2021, 1207, 012021. [Google Scholar] [CrossRef]
- Andras, A.; Brînas, I.; Radu, S.M.; Popescu, F.D.; Popescu, V.; Budilica, D.I. Investigation of the Thermal Behaviour for the Disc-Pad Assembly of a Mine Hoist Brake Using COMSOL Multiphysics. Acta Tech. Napoc. Ser. Appl. Math. Mech. Eng. 2021, 64, 227–234. [Google Scholar]
- Popescu, F.D.; Radu, S.M.; Andraș, A.; Brînaș, I.; Budilică, D.I.; Popescu, V. Comparative Analysis of Mine Shaft Hoisting Systems’ Brake Temperature Using Finite Element Analysis (FEA). Materials 2022, 15, 3363. [Google Scholar] [CrossRef] [PubMed]
- Popescu, F.D.; Radu, S.M.; Andraş, A.; Brînaş, I.K. A Grafo-Numeric Method of Determination of the Operation Power of the Rotor of EsRc-1400 Bucket Wheel Excavator Using Computer Simulation in SolidWorks. MATEC Web Conf. 2019, 290, 04007. [Google Scholar] [CrossRef]
- Popescu, F.D.; Radu, S.M.; Andras, A.; Brinas, I.; Marita, M.-O.; Radu, M.A.; Brinas, C.L. Stability Assessment of the Dam of a Tailings Pond Using Computer Modeling—Case Study: Coroiești, Romania. Appl. Sci. 2024, 14, 268. [Google Scholar] [CrossRef]
- COMSOL. COMSOL Multiphysics 5.3. Reference Manual; COMSOL AB: Stockholm, Sweden, 2017. [Google Scholar]
- Zhai, C.; Hanaor, D.; Proust, G.; Gan, Y. Stress-dependent electrical contact resistance at fractal rough surfaces. Journal of Engineering Mechanics 2017, 143, B4015001. [Google Scholar] [CrossRef]
- Holm, R. Electric Contacts: Theory and Application; Springer Science & Business Media: New York, NY, USA, 2013. [Google Scholar]
- Hortopan, G. Aparate electrice. Principii și aplicații; Editura Didactică și Pedagogică: București, Romania, 1980. [Google Scholar]





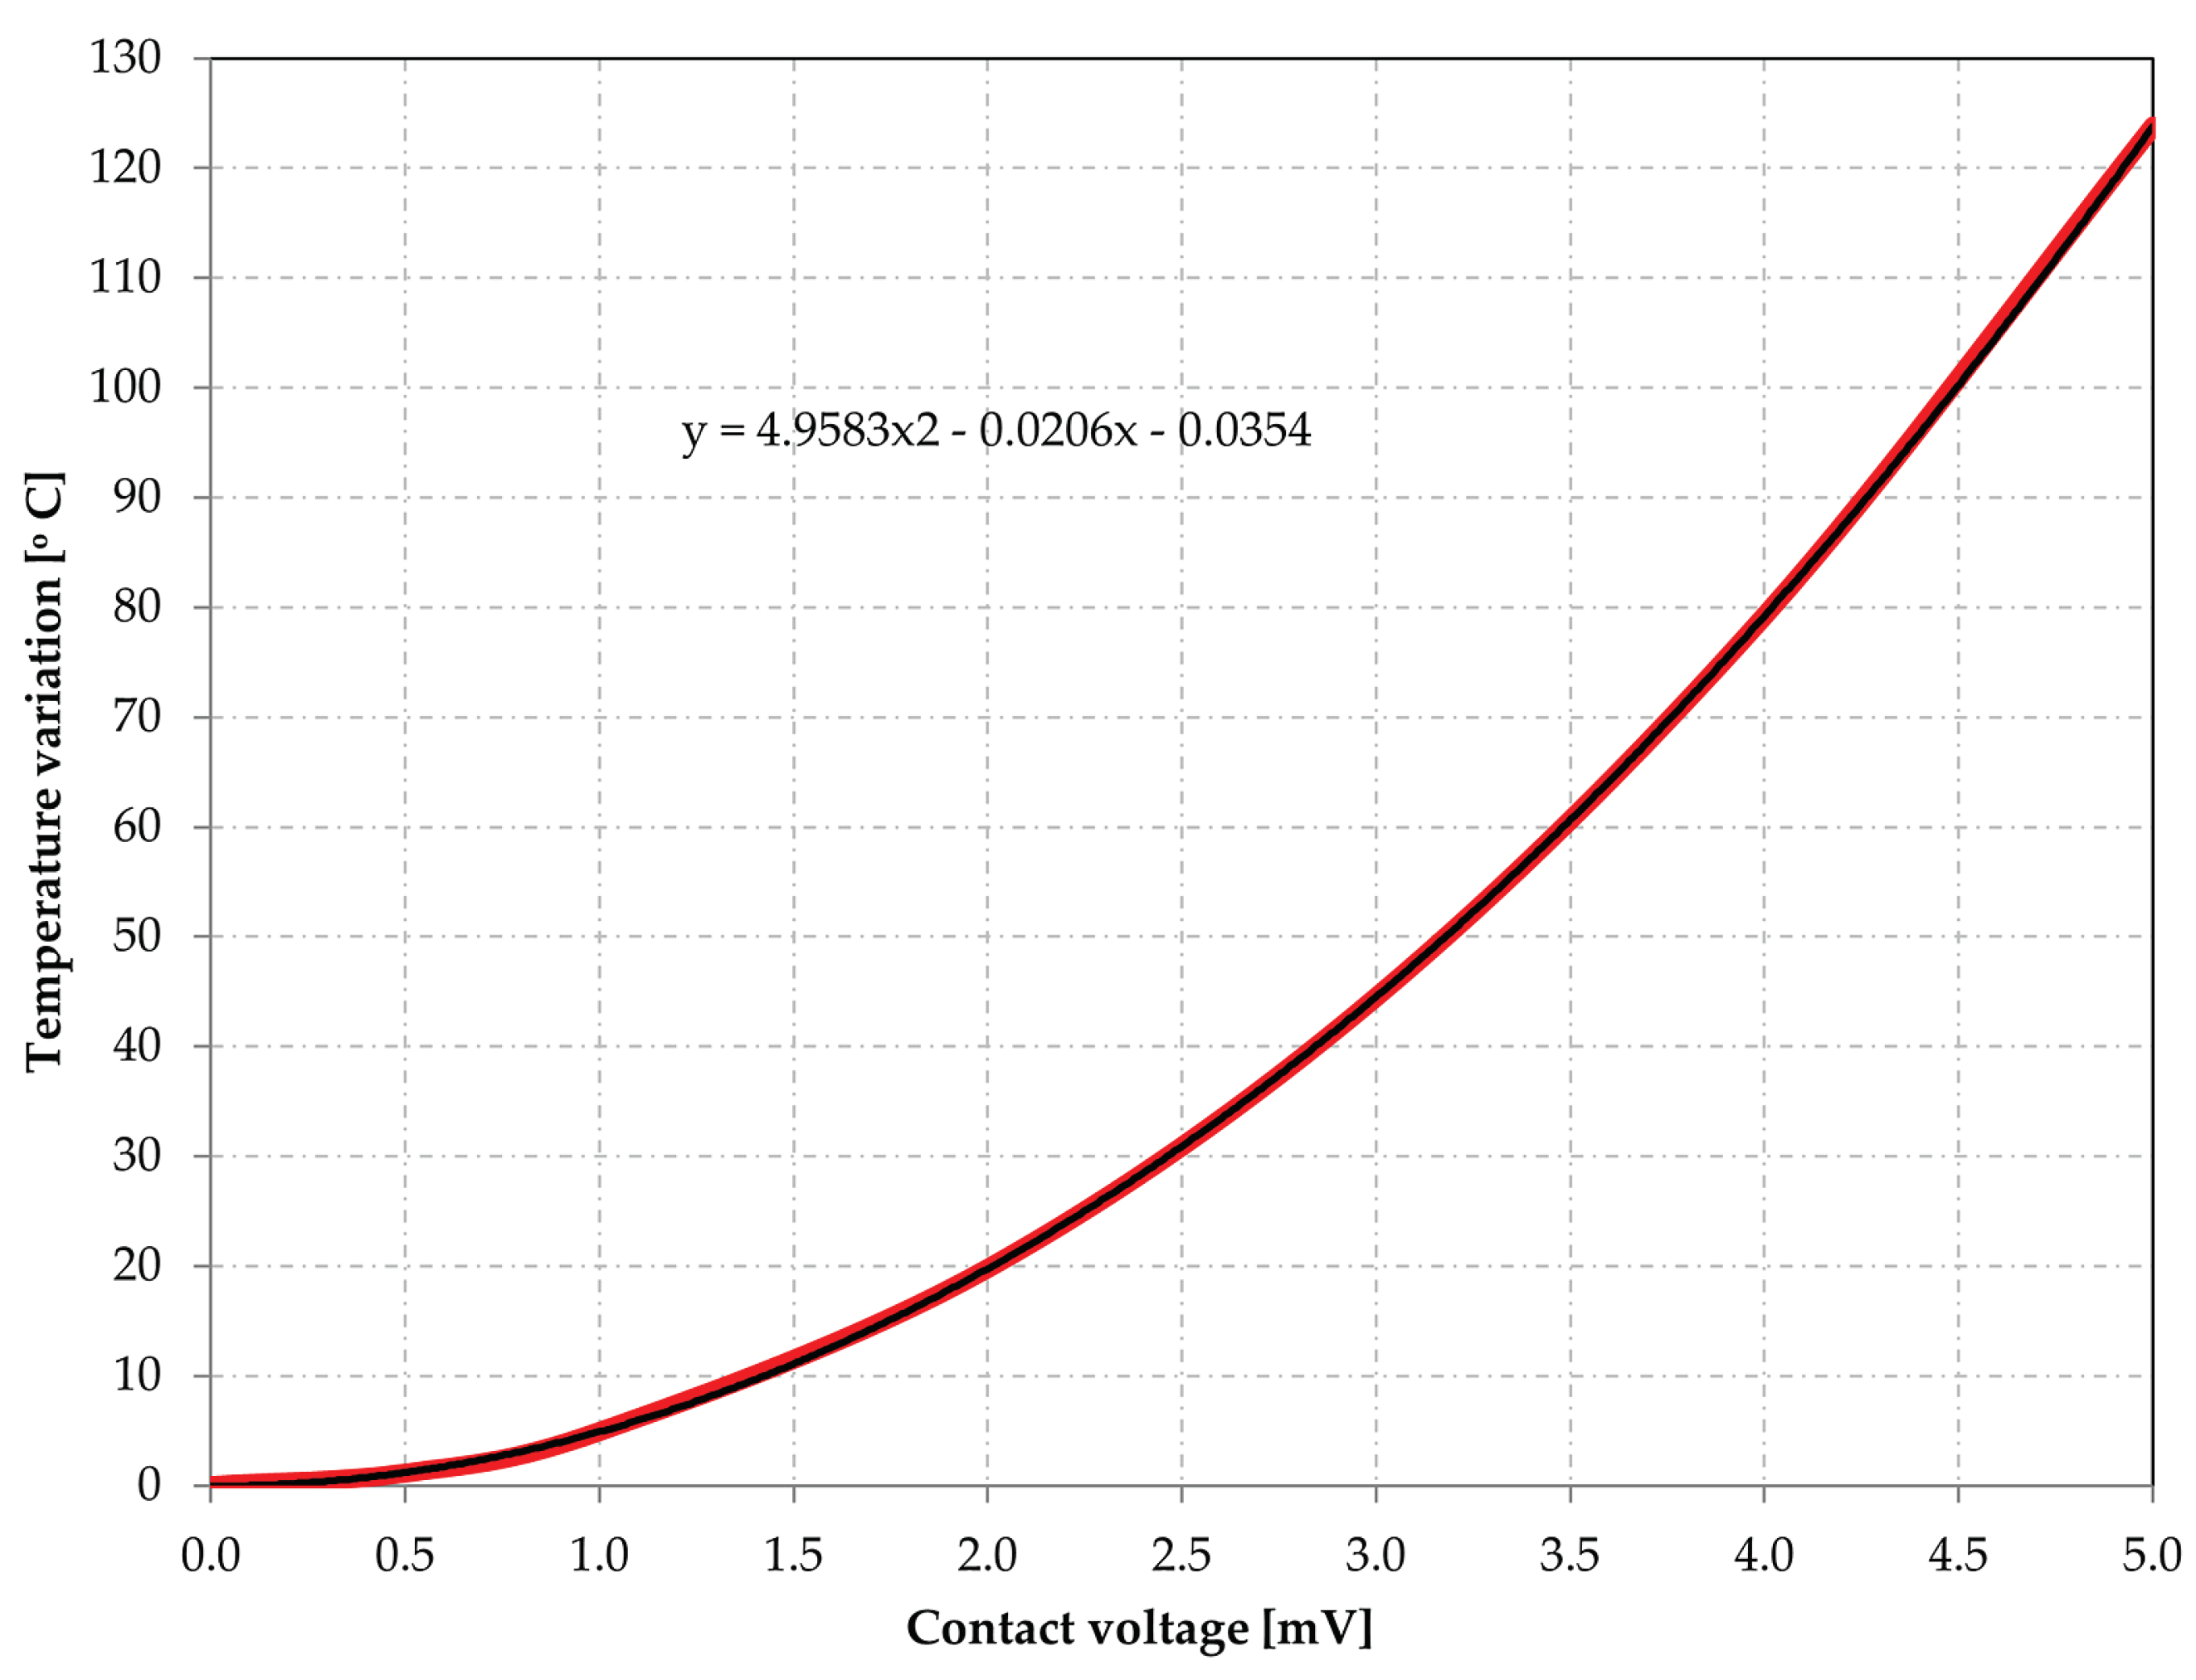
| Electric potential (contact voltage) difference [V] | Maximum contact temperature [K] |
Temperature increase [ΔT] |
|---|---|---|
| Ambient temperature T = 293.15 K | ||
| 0 | 293.15 | 0.00 |
| 0.50 | 294.28 | 1.13 |
| 1.00 | 298.07 | 4.92 |
| 2.00 | 312.93 | 19.78 |
| 3.00 | 337.65 | 44.50 |
| 4.00 | 372.39 | 79.25 |
| 5.00 | 416.96 | 123.81 |
Disclaimer/Publisher’s Note: The statements, opinions and data contained in all publications are solely those of the individual author(s) and contributor(s) and not of MDPI and/or the editor(s). MDPI and/or the editor(s) disclaim responsibility for any injury to people or property resulting from any ideas, methods, instructions or products referred to in the content. |
© 2024 by the authors. Licensee MDPI, Basel, Switzerland. This article is an open access article distributed under the terms and conditions of the Creative Commons Attribution (CC BY) license (http://creativecommons.org/licenses/by/4.0/).


