Submitted:
23 March 2024
Posted:
25 March 2024
You are already at the latest version
Abstract
Keywords:
1. Introduction
2. Materials and Methods
2.1. Alloys and Preparation
2.2. Materials Characterization
3. Results and Discussion
3.1. Effect of Oxygen Content on Microstructure of FGH96 Superalloy
3.2. Effect of Oxygen Content on Creep Property of FGH96 Superalloy
3.3. Creep Mechanism
4. Conclusions
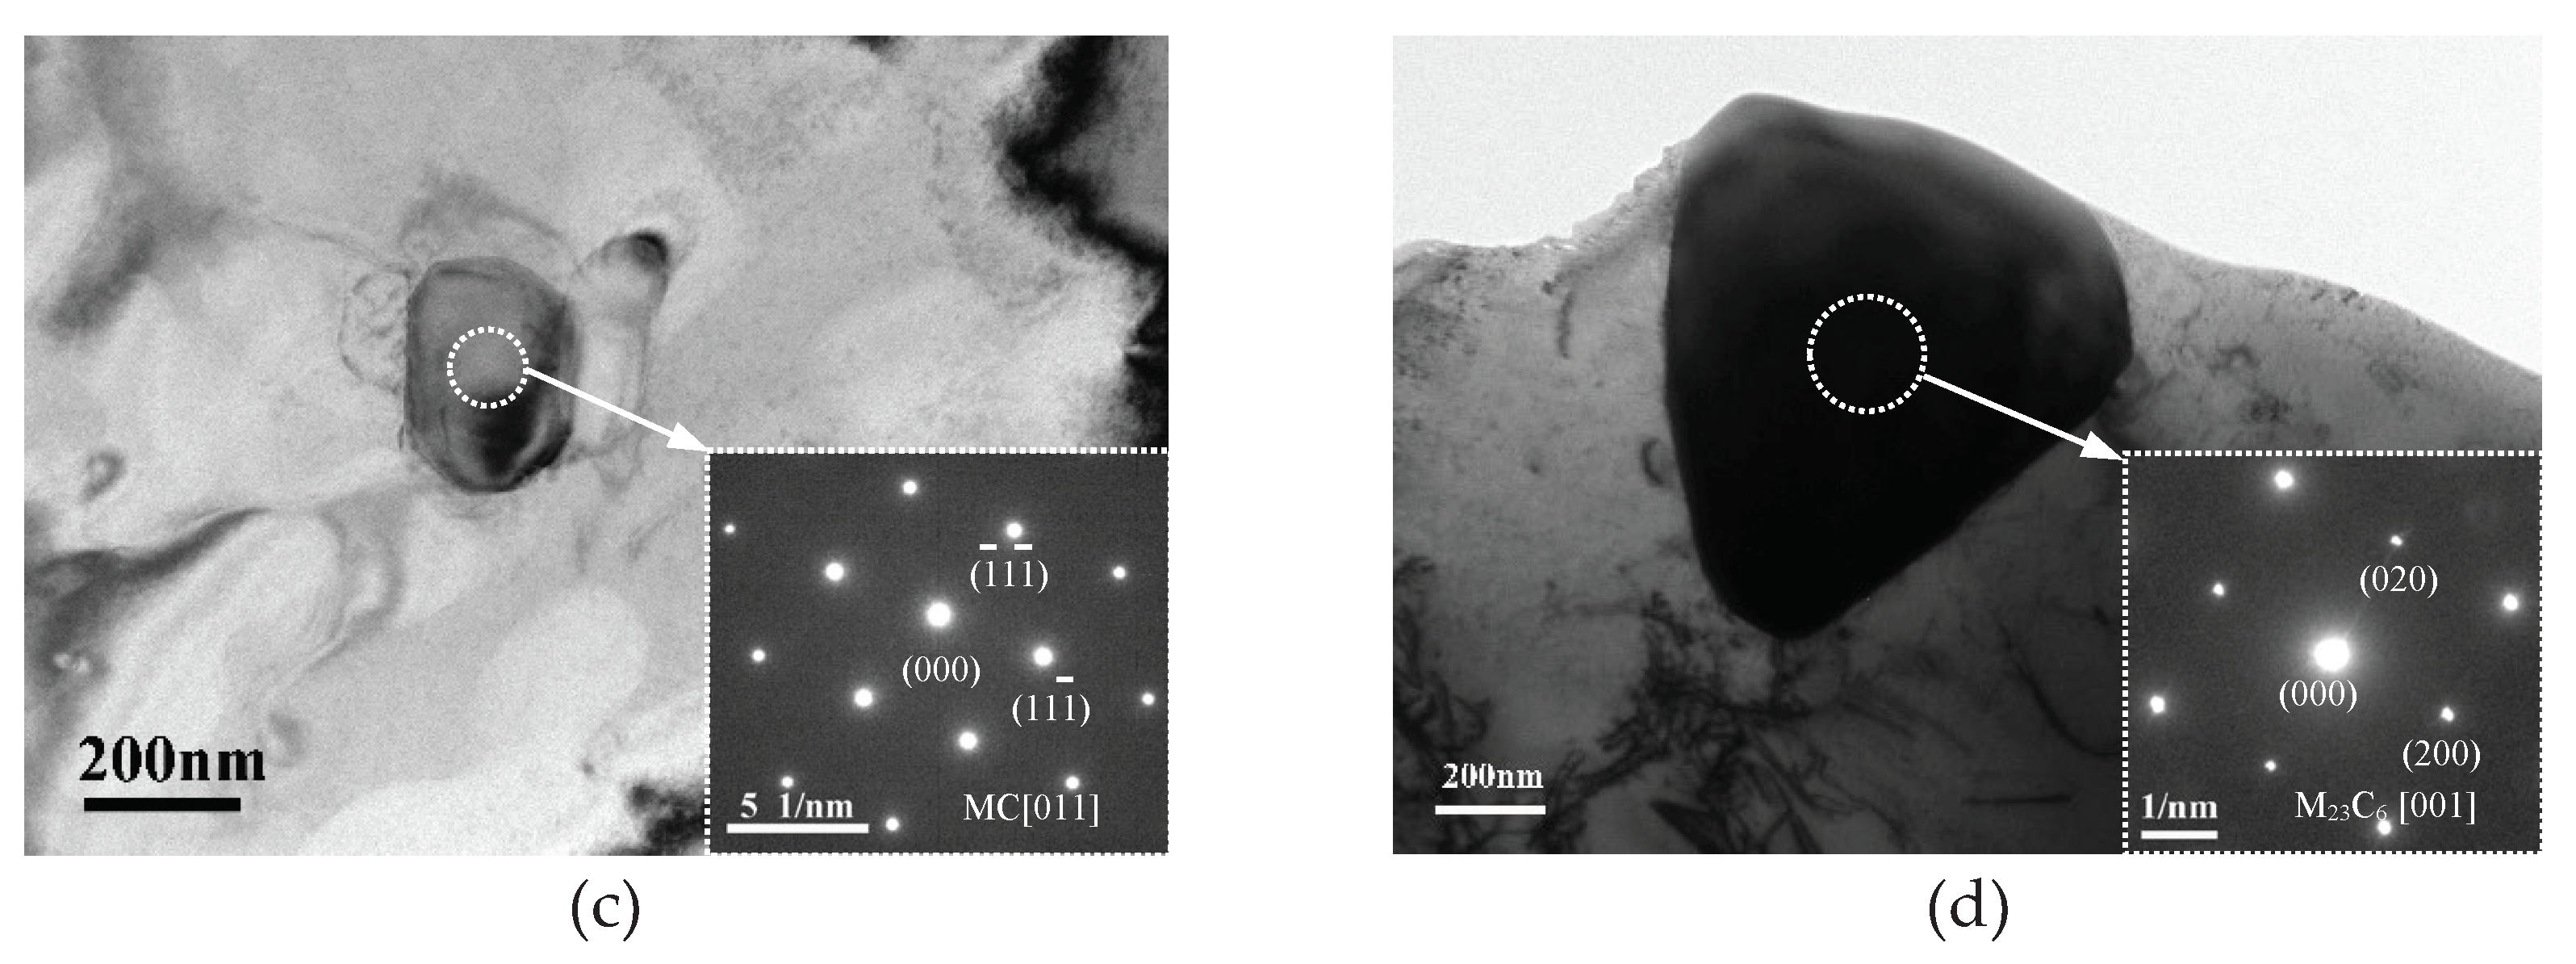
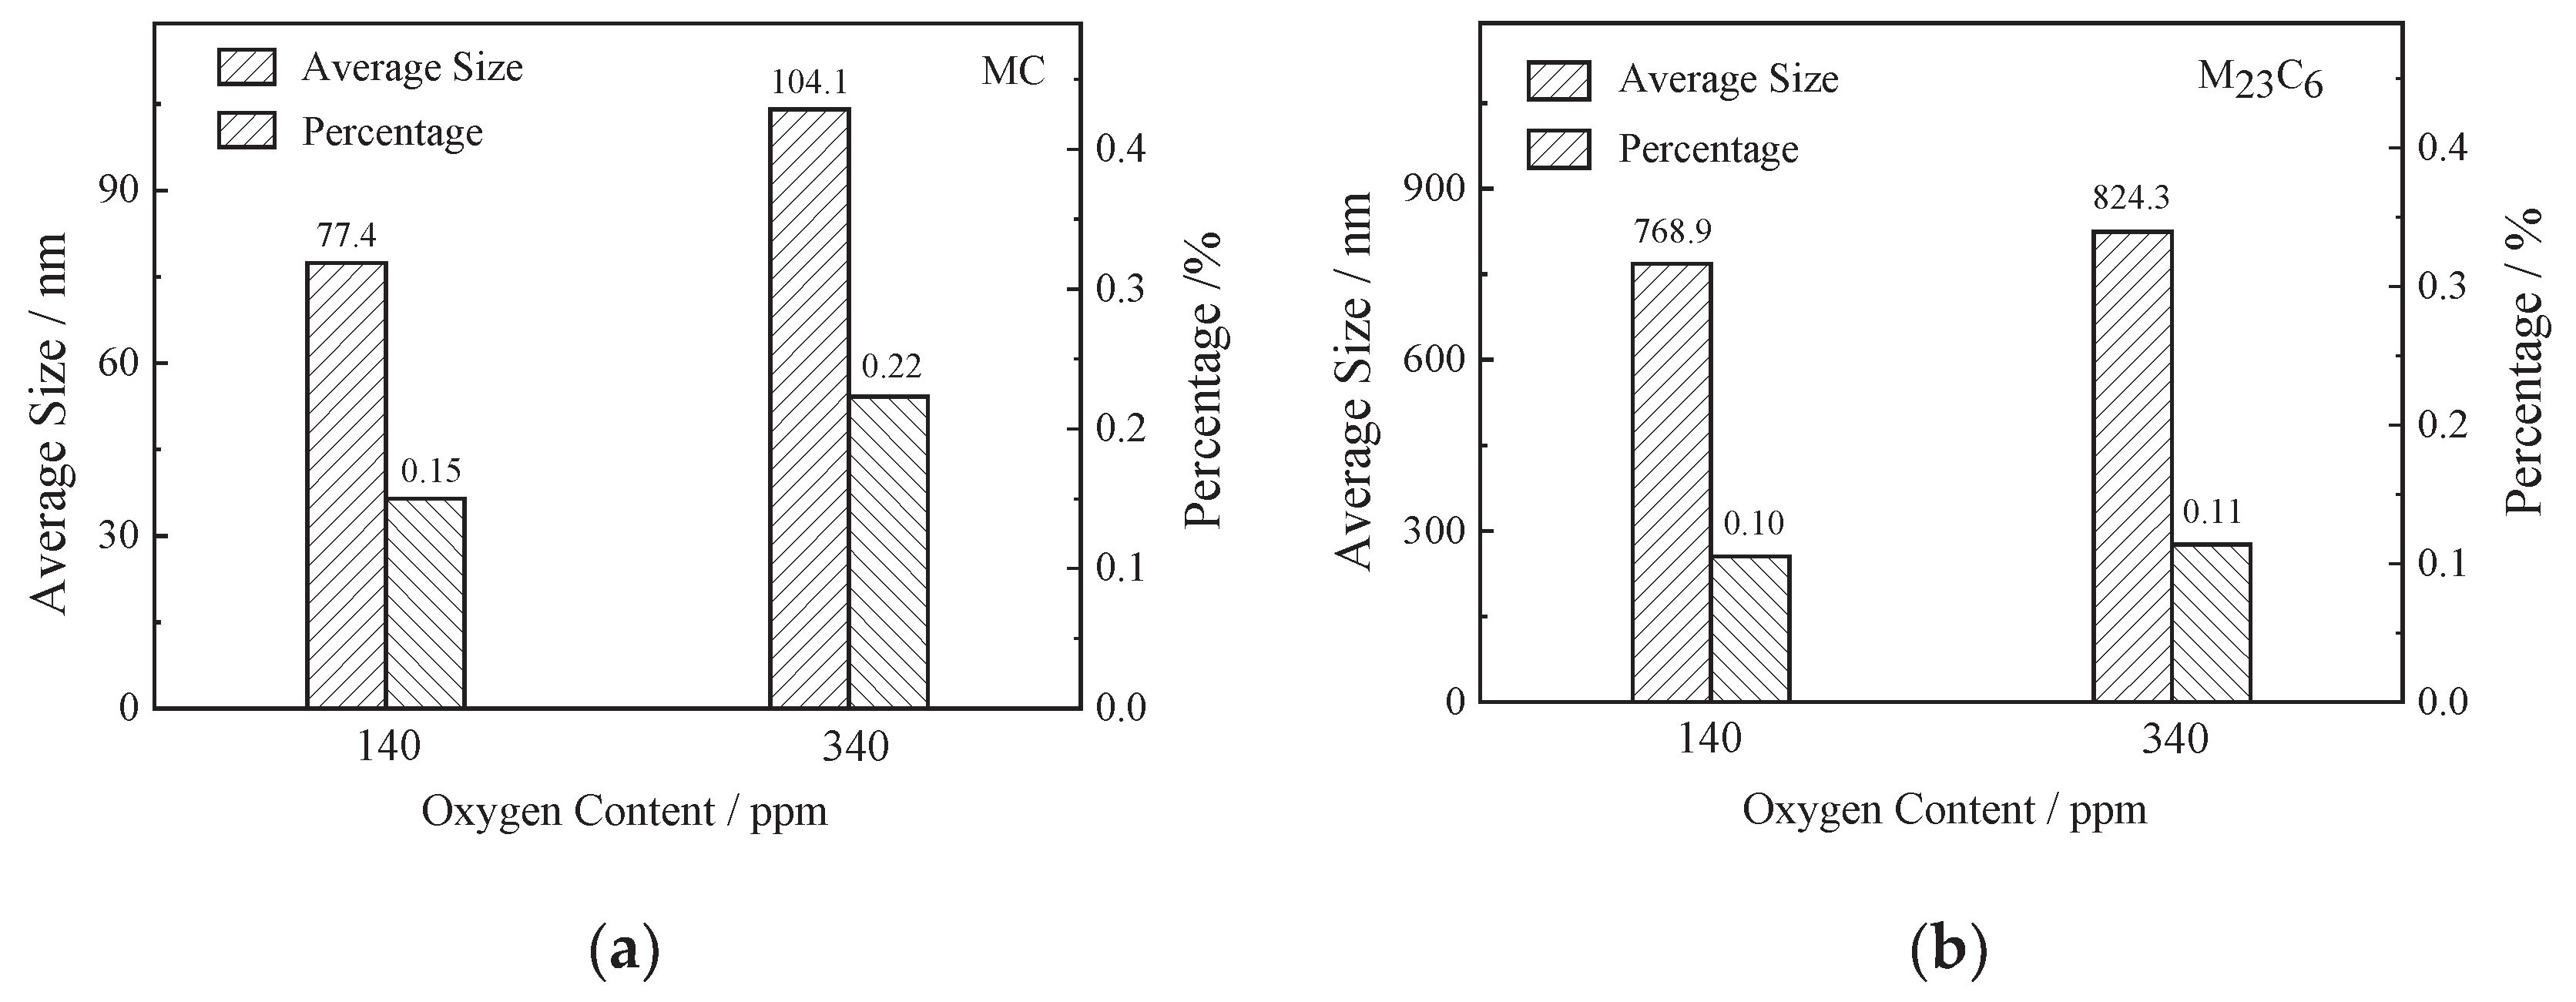
- Oxygen content increased from 135ppm to 341ppm, PPB grade rose from grade 2 to grade 3, and the size of γ’ phase on PPB enlarged from 1.07μm to 1.27μm, and MC carbide size grew from 77.4nm to 104.0nm and MC volume fraction increased from 0.15% to 0.22%.
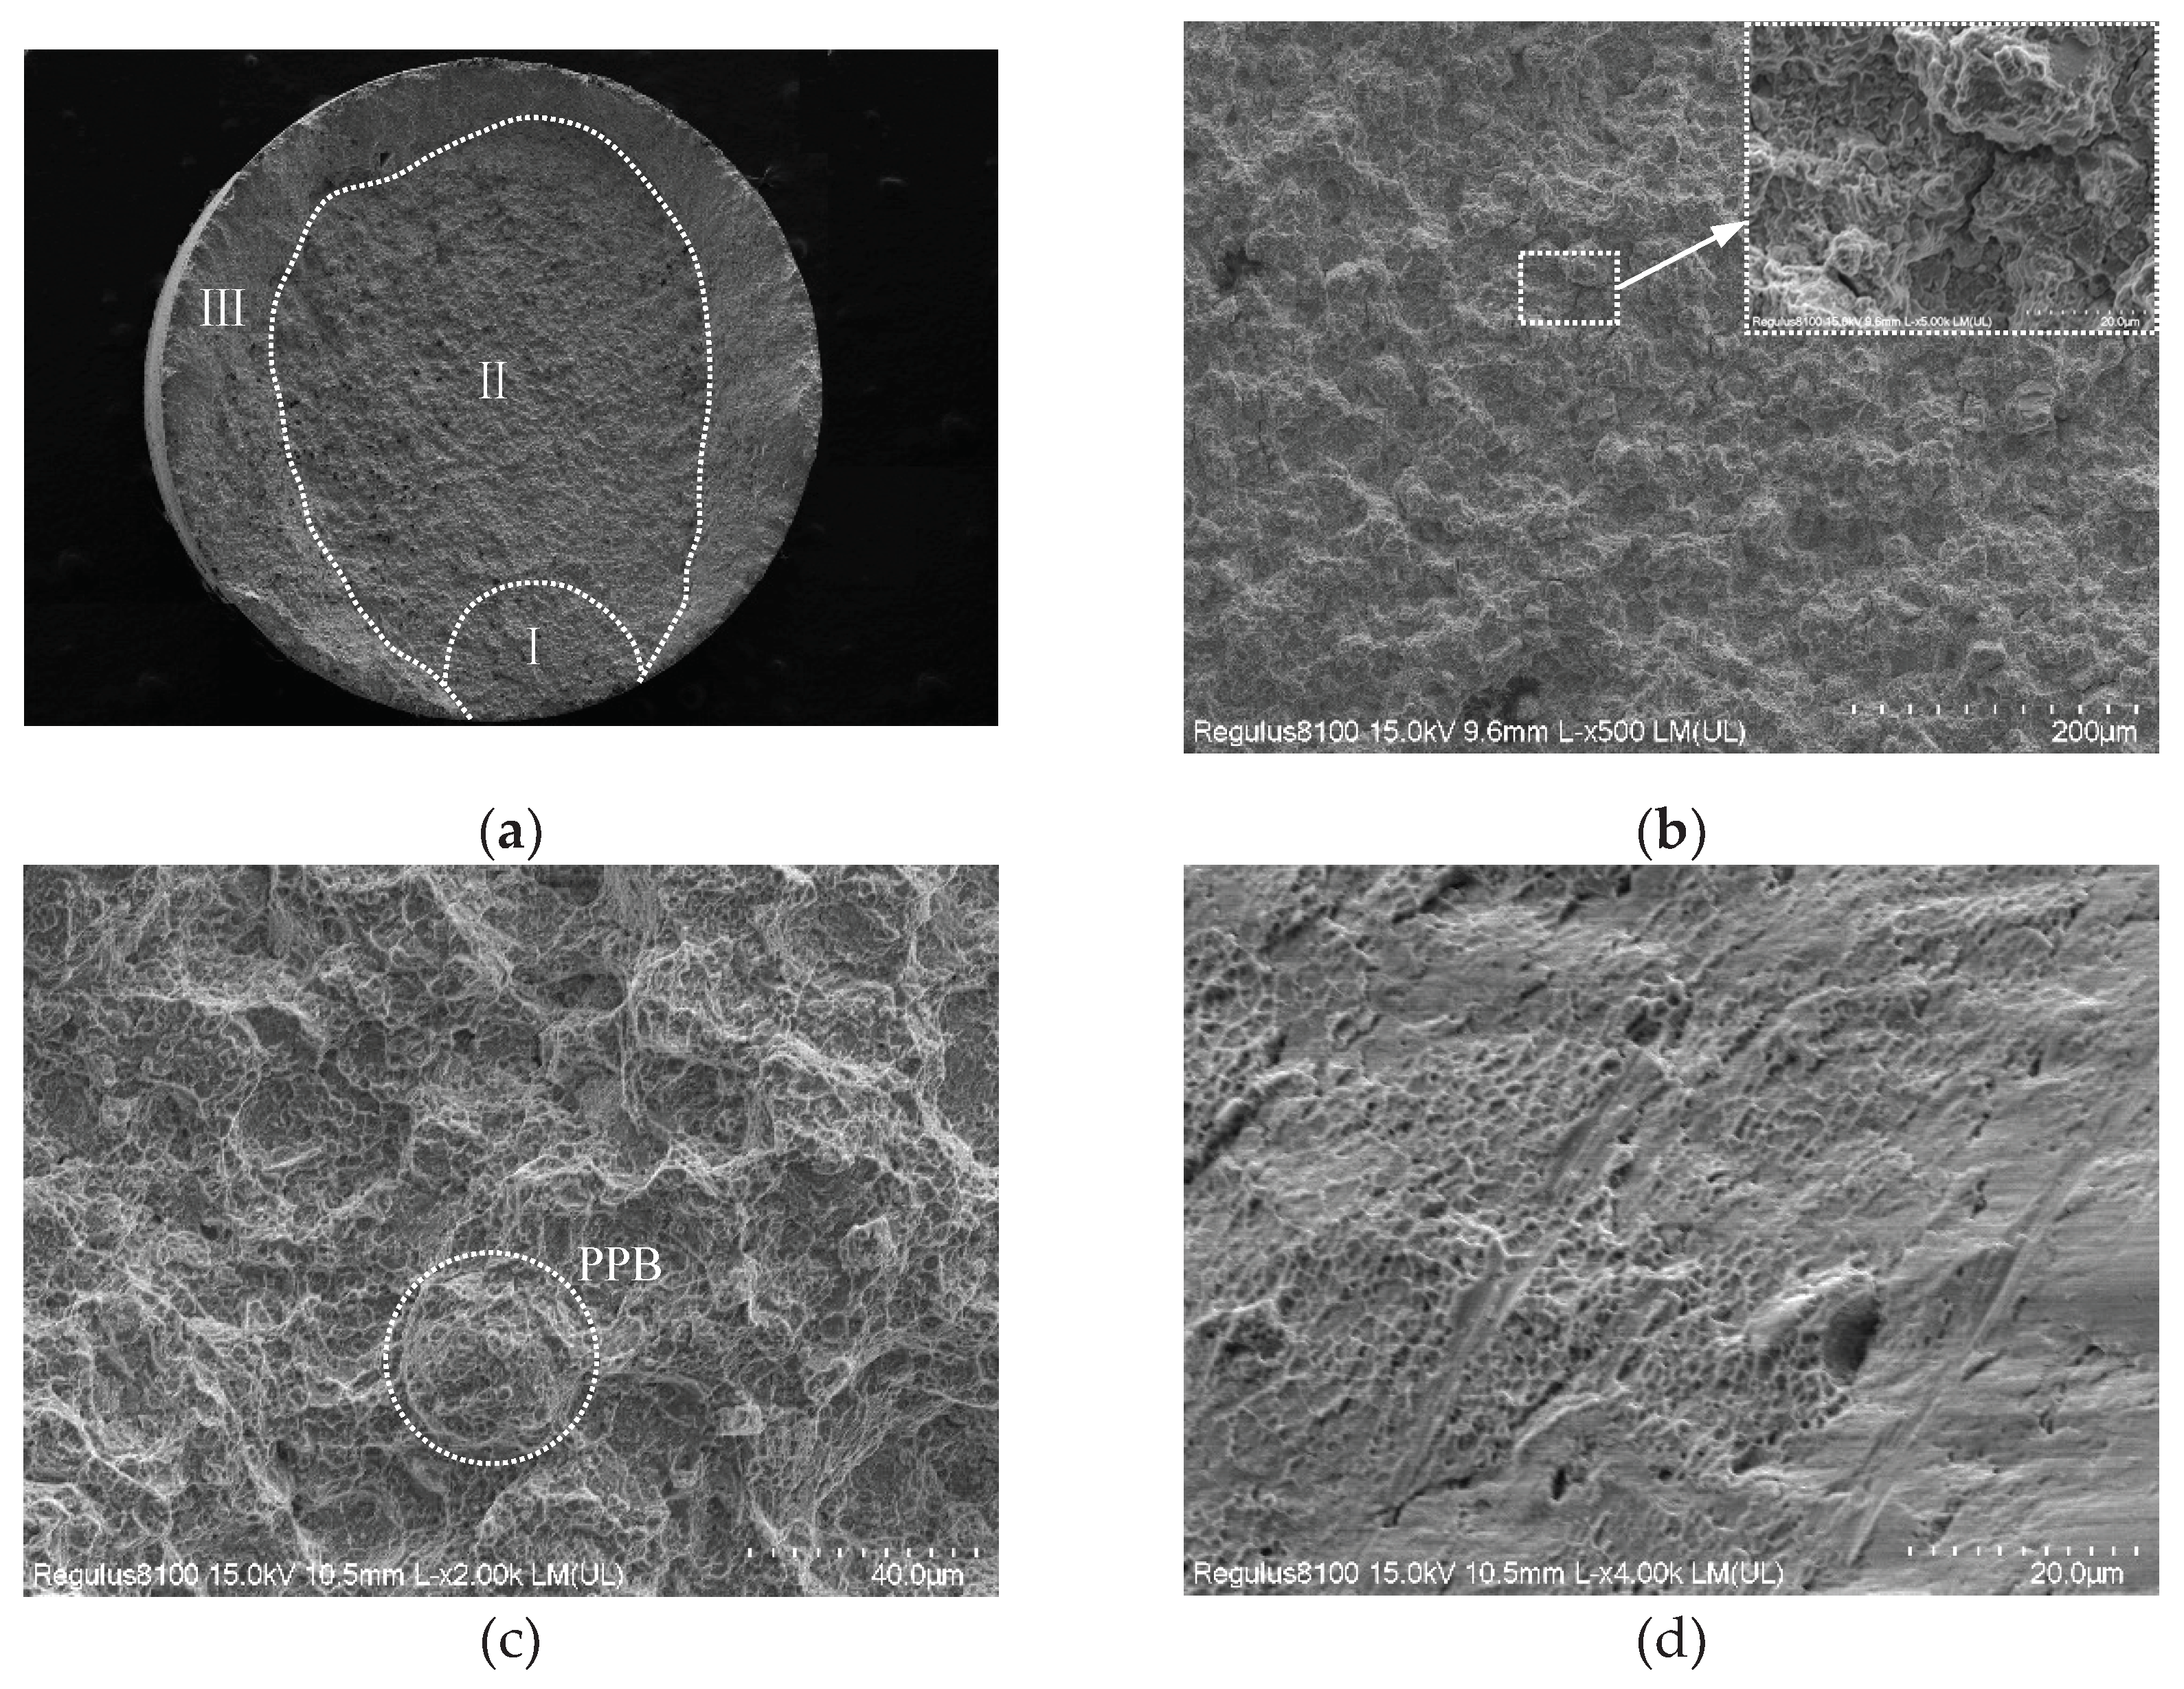
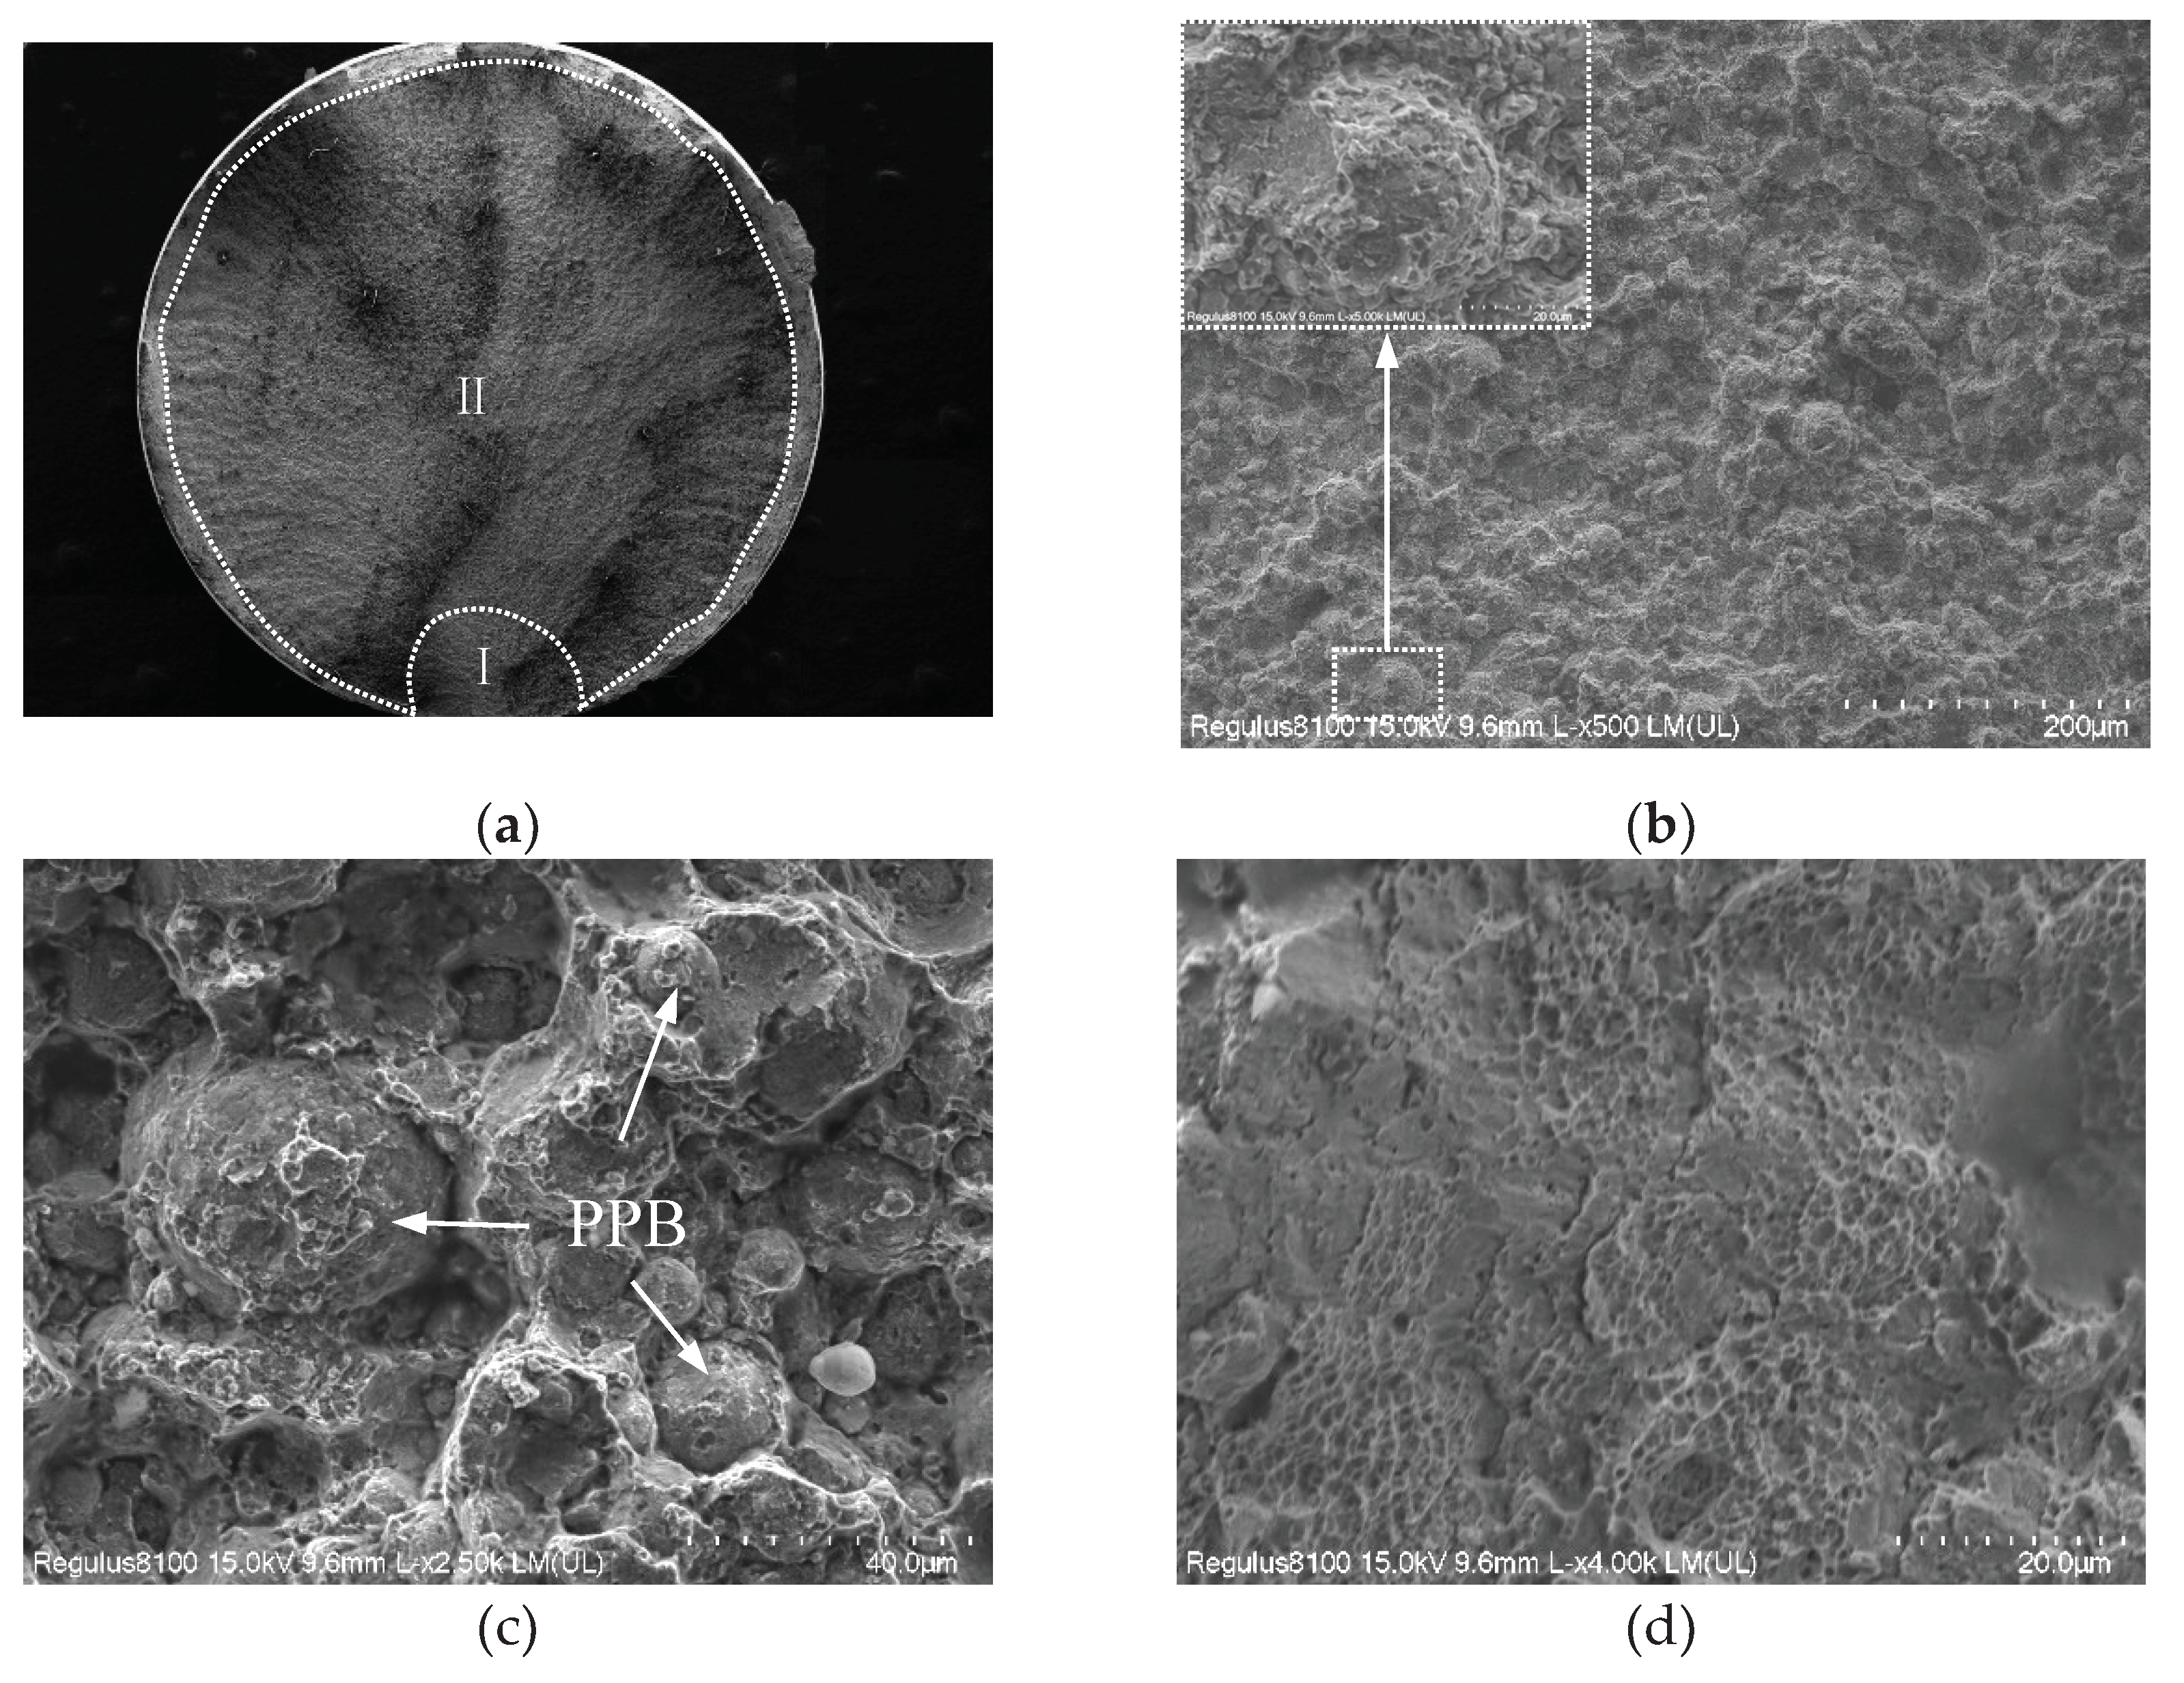
- Oxygen content increased from 135ppm to 341ppm, steady creep duration shortened from 43h to 21h, and steady creep rate accelerated from 4.34×10⁻³ h-1 to 1.87×10⁻² h-1, and creep rupture life decreased from 176h to 94h, and the creep rupture mode transferred from intergranular and trans-granular mixed fracture to along PPB fracture.
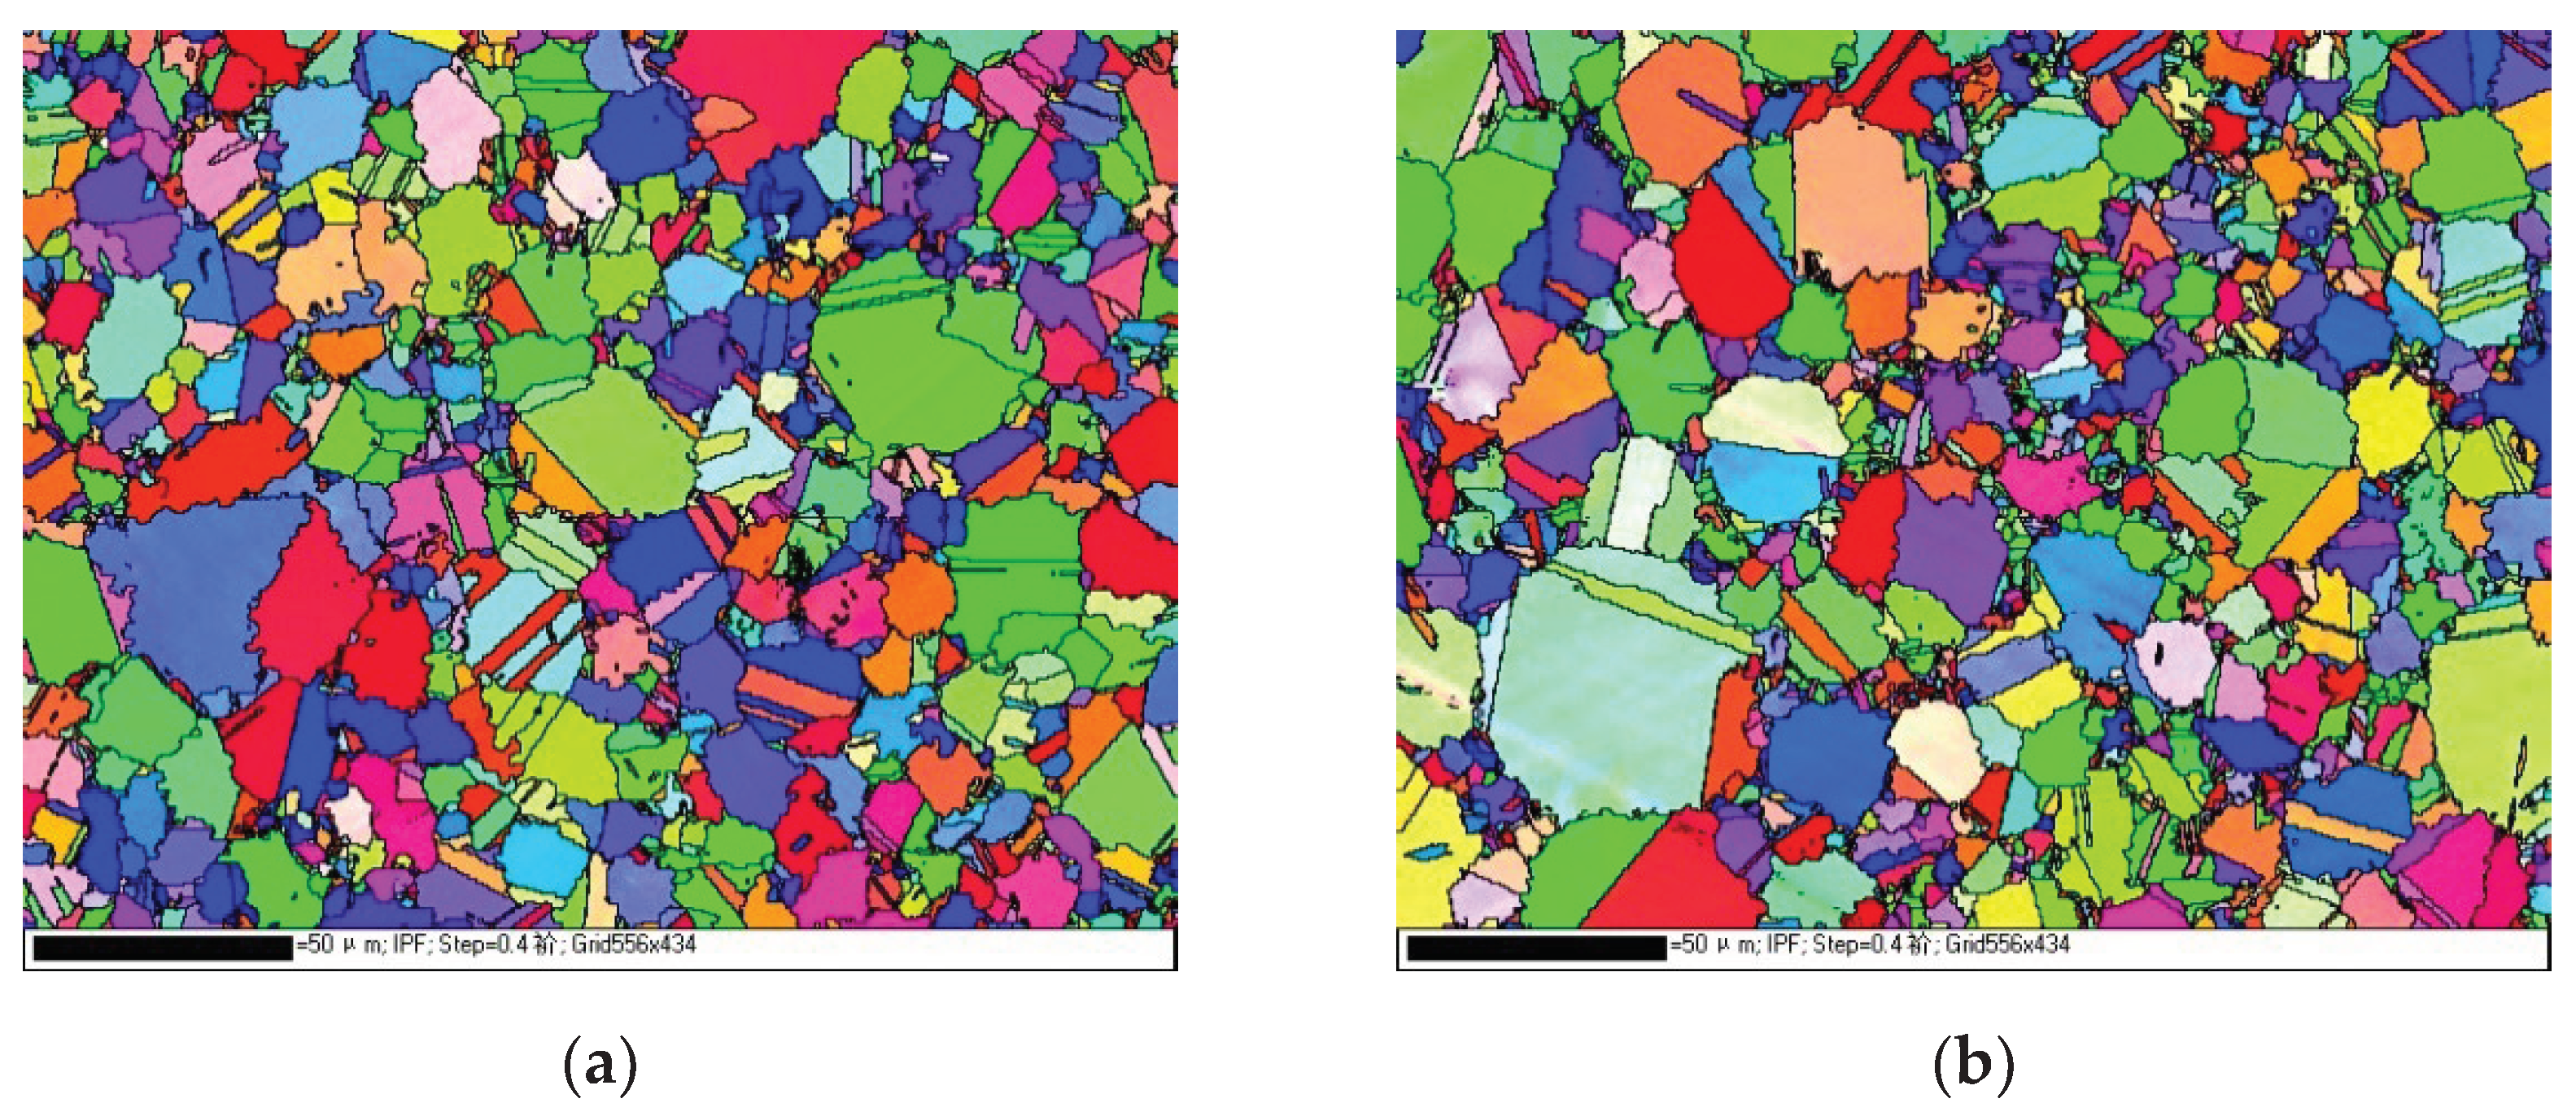
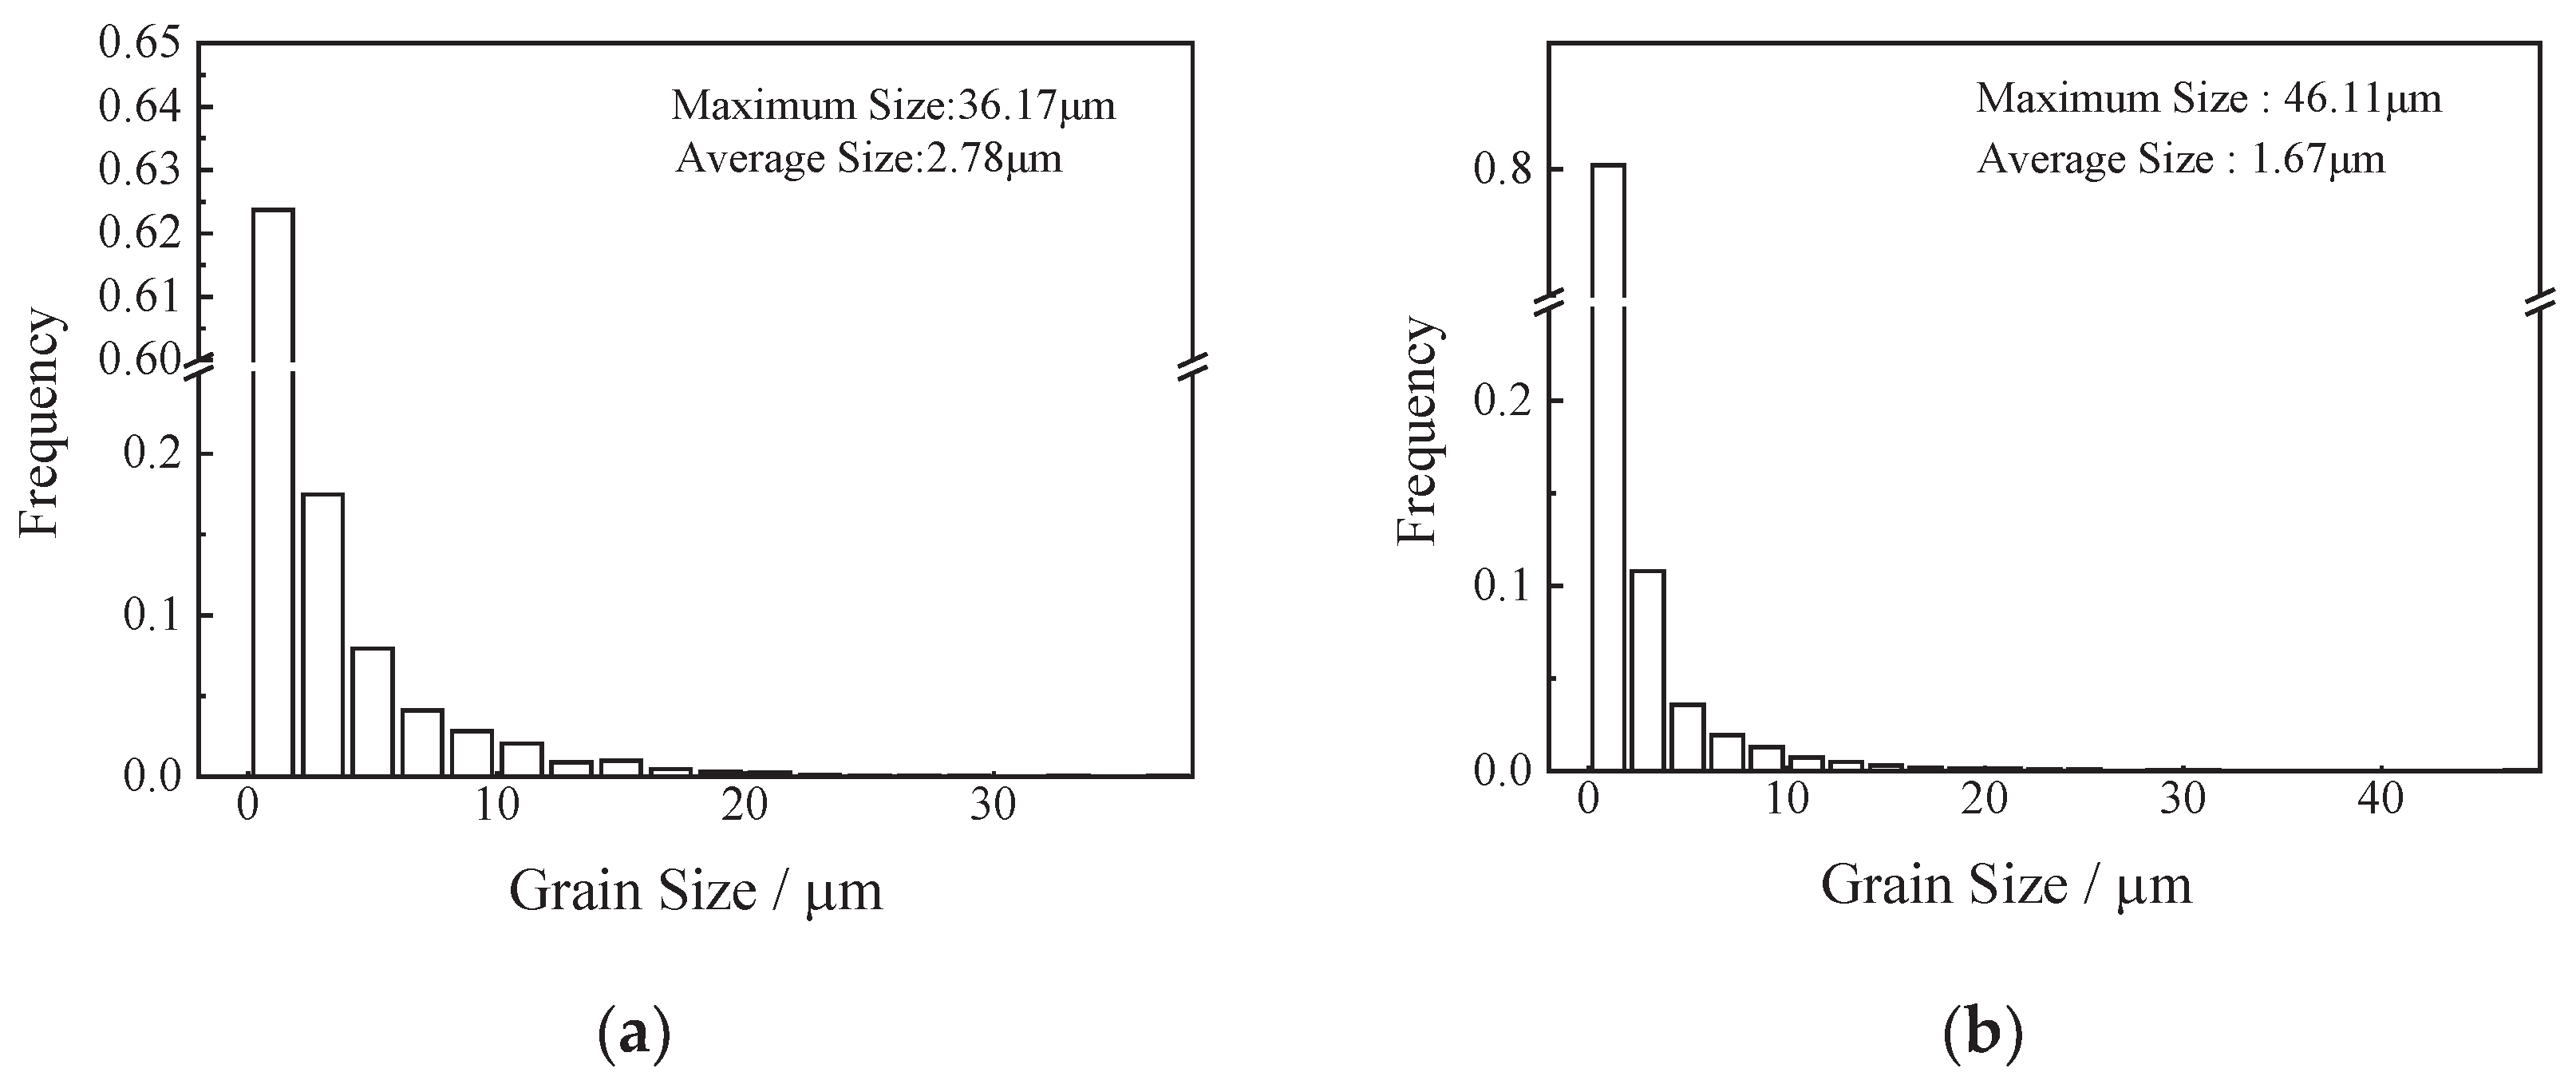
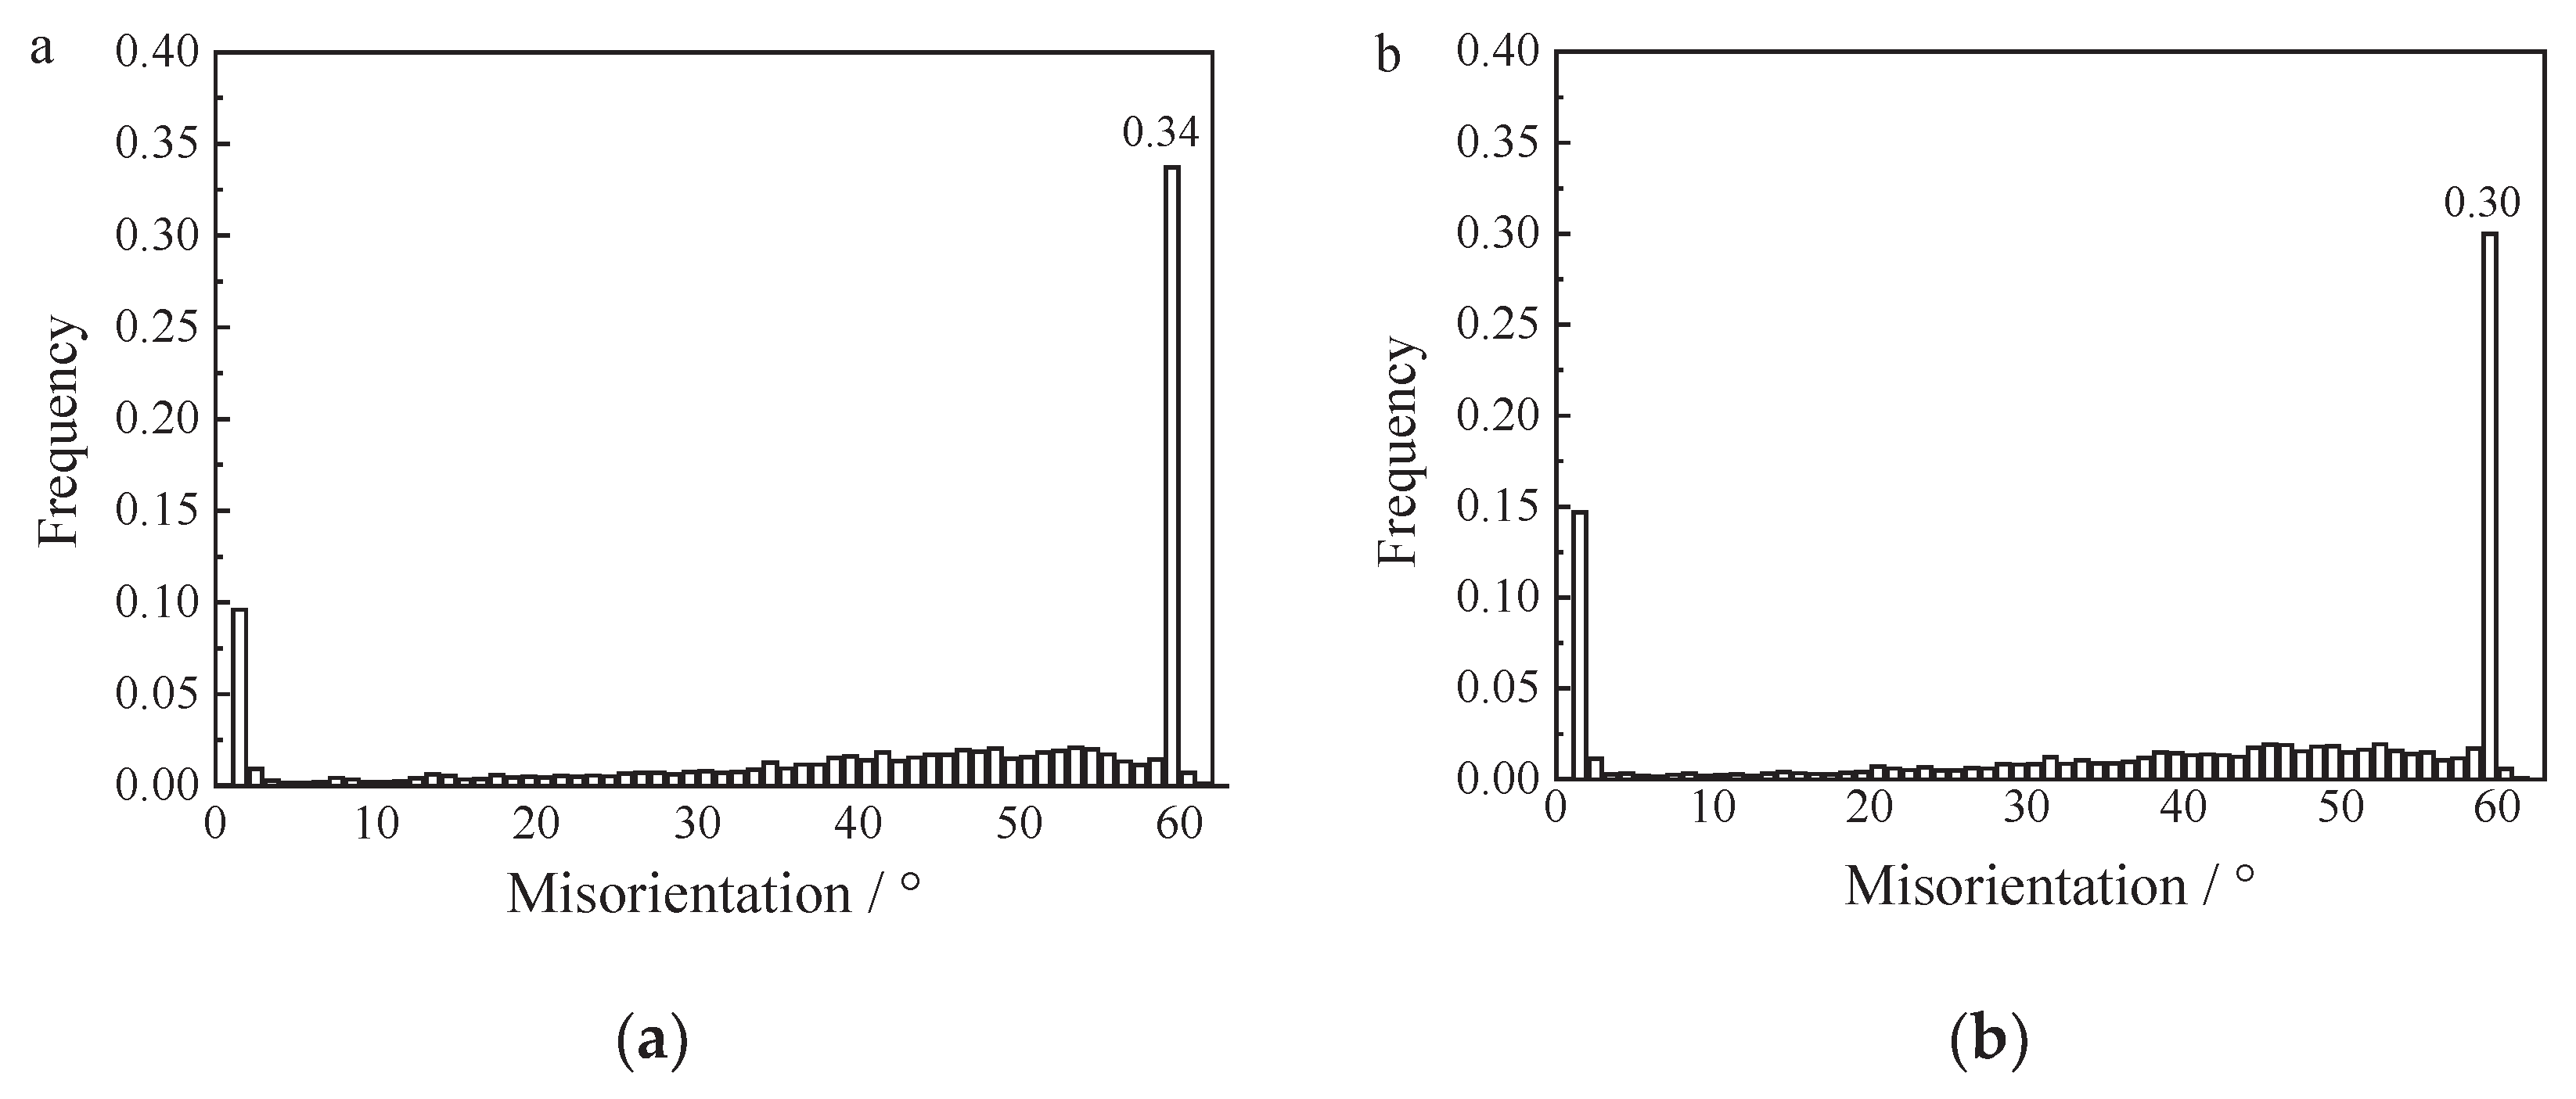
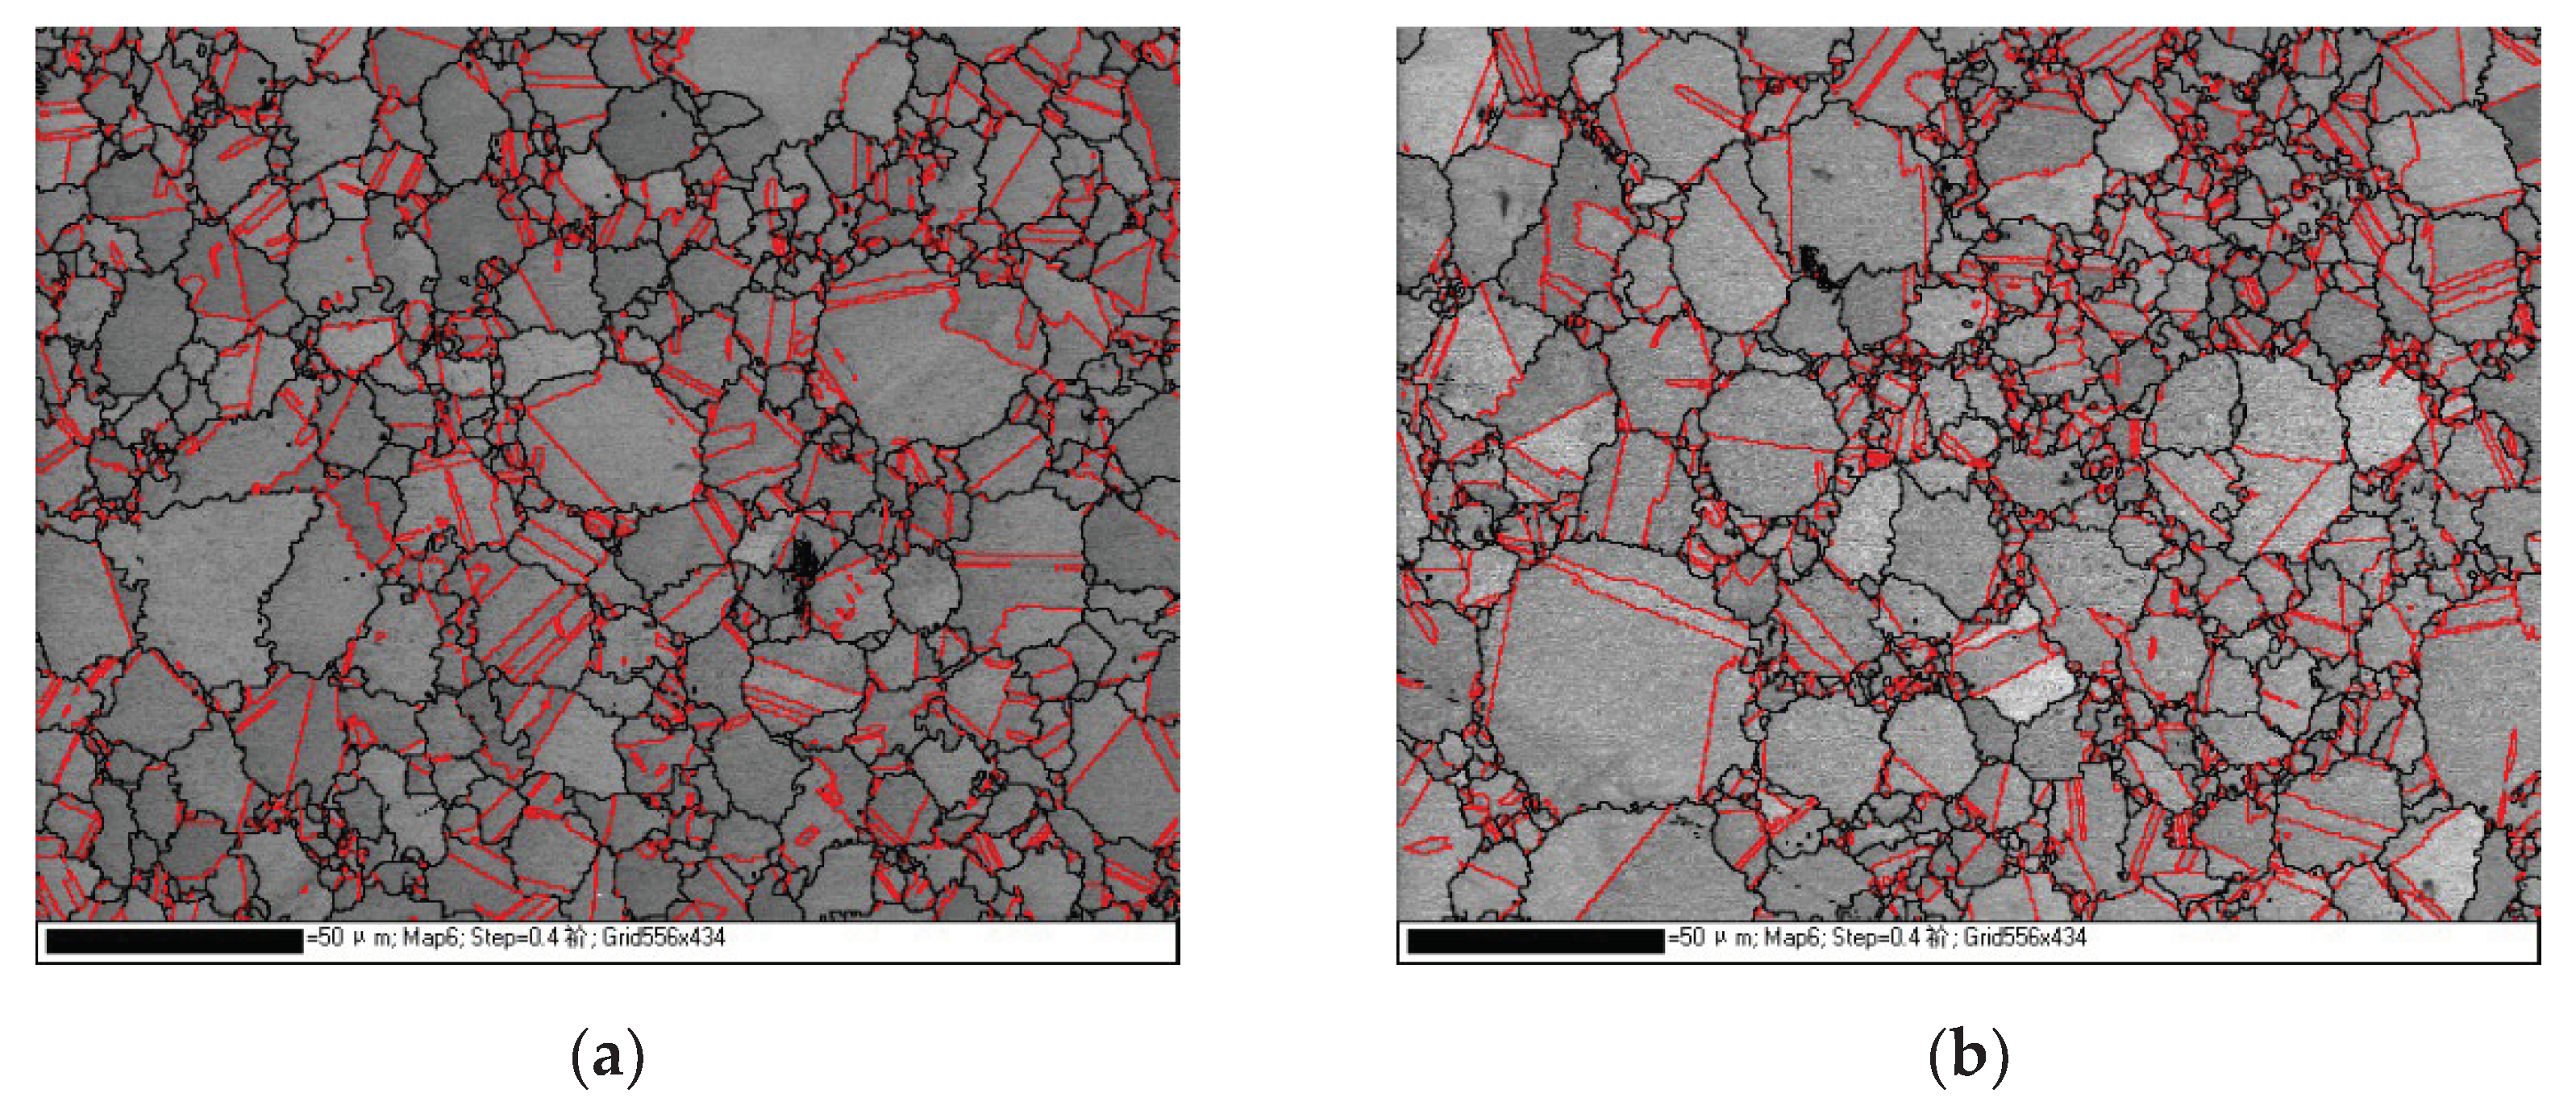
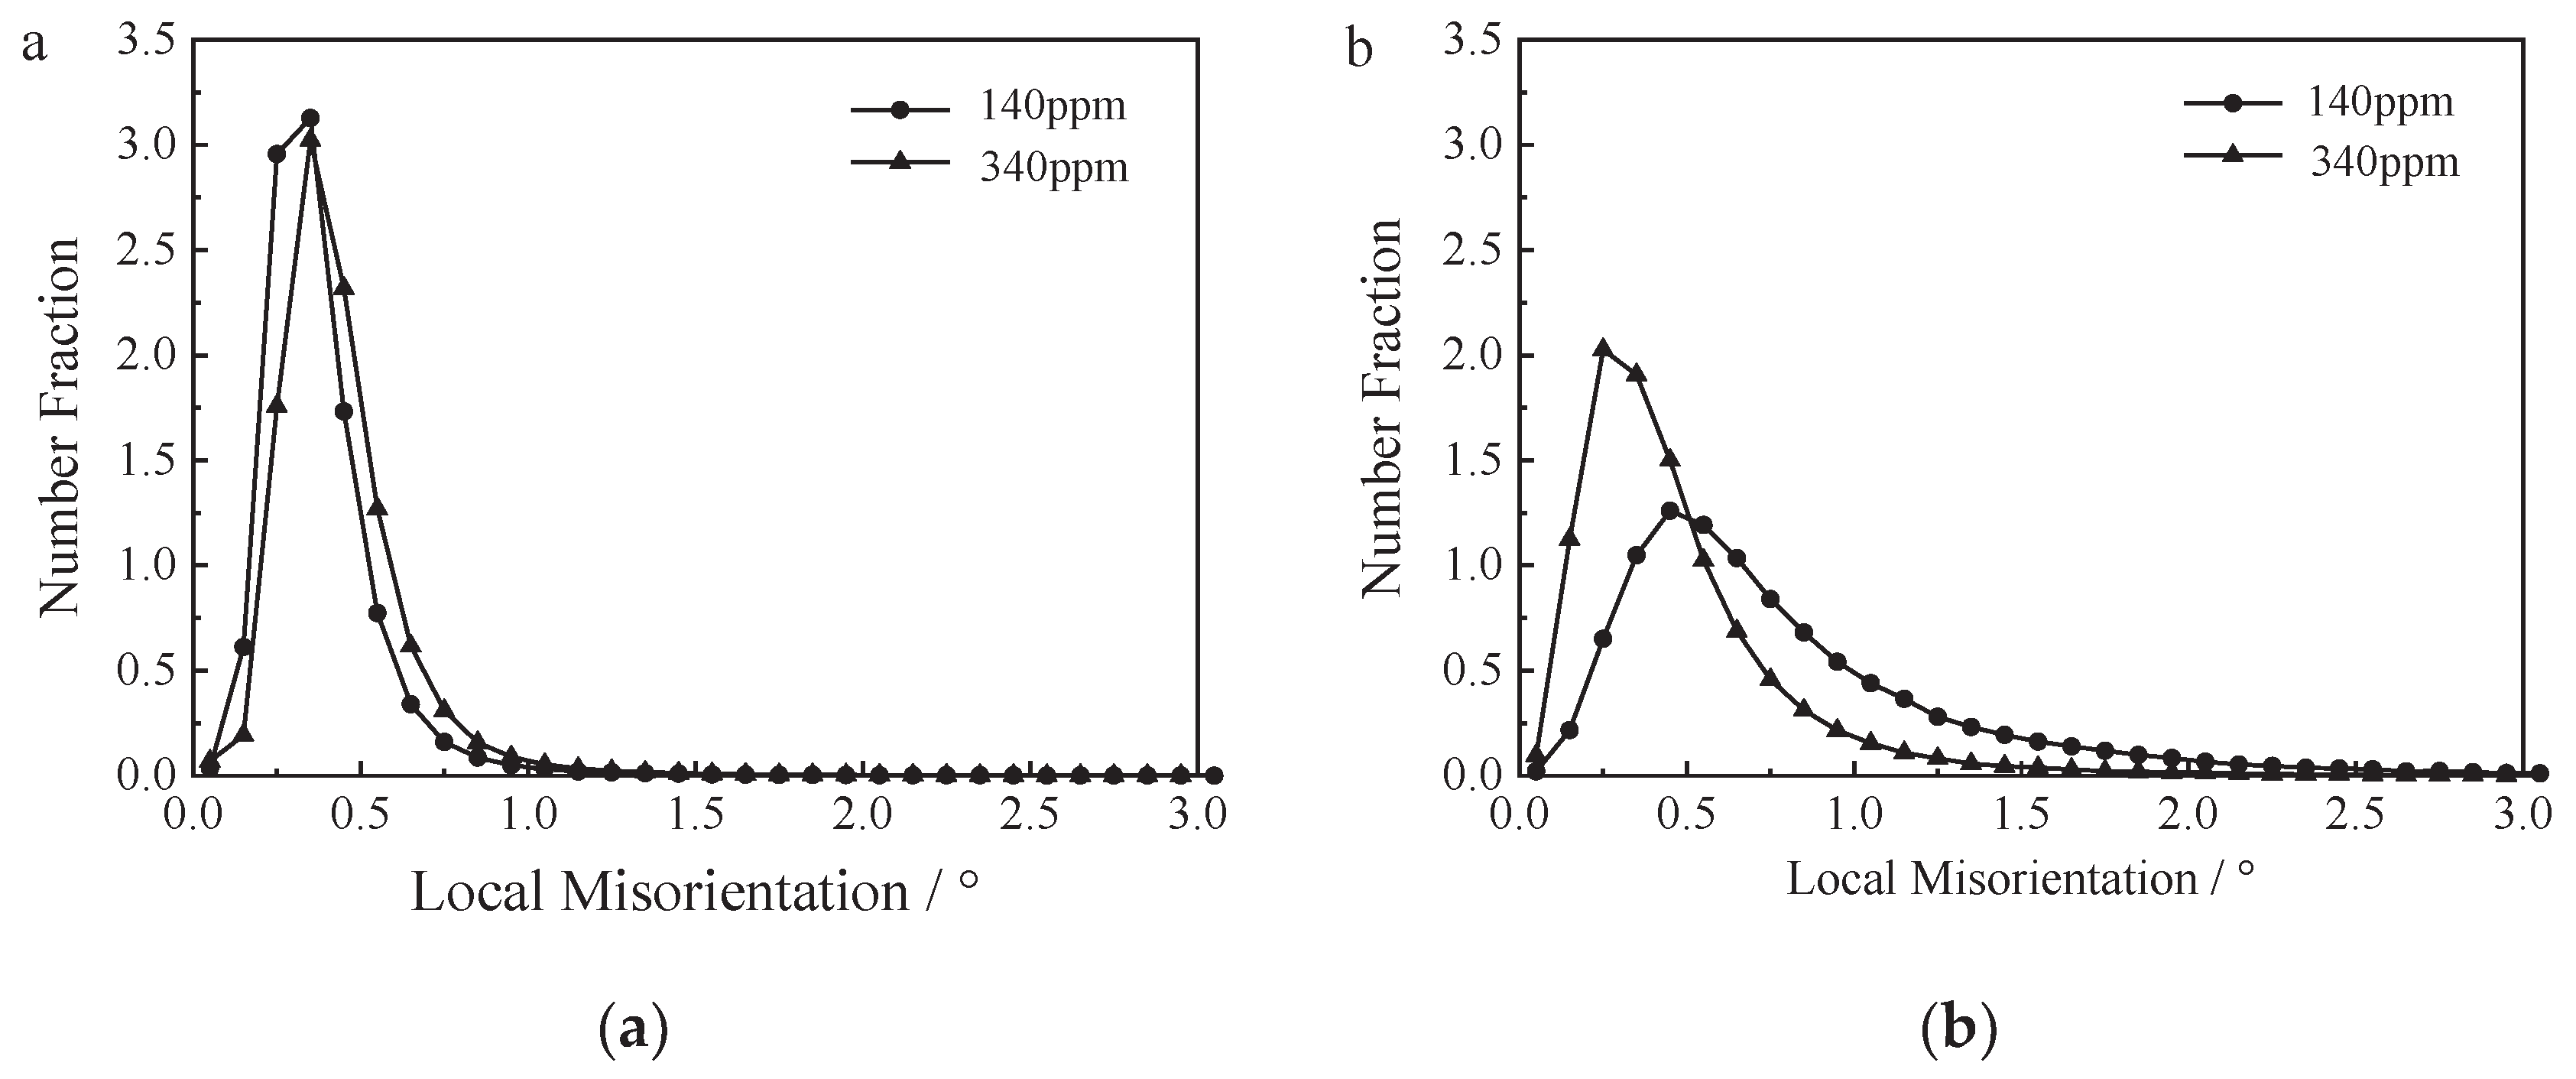
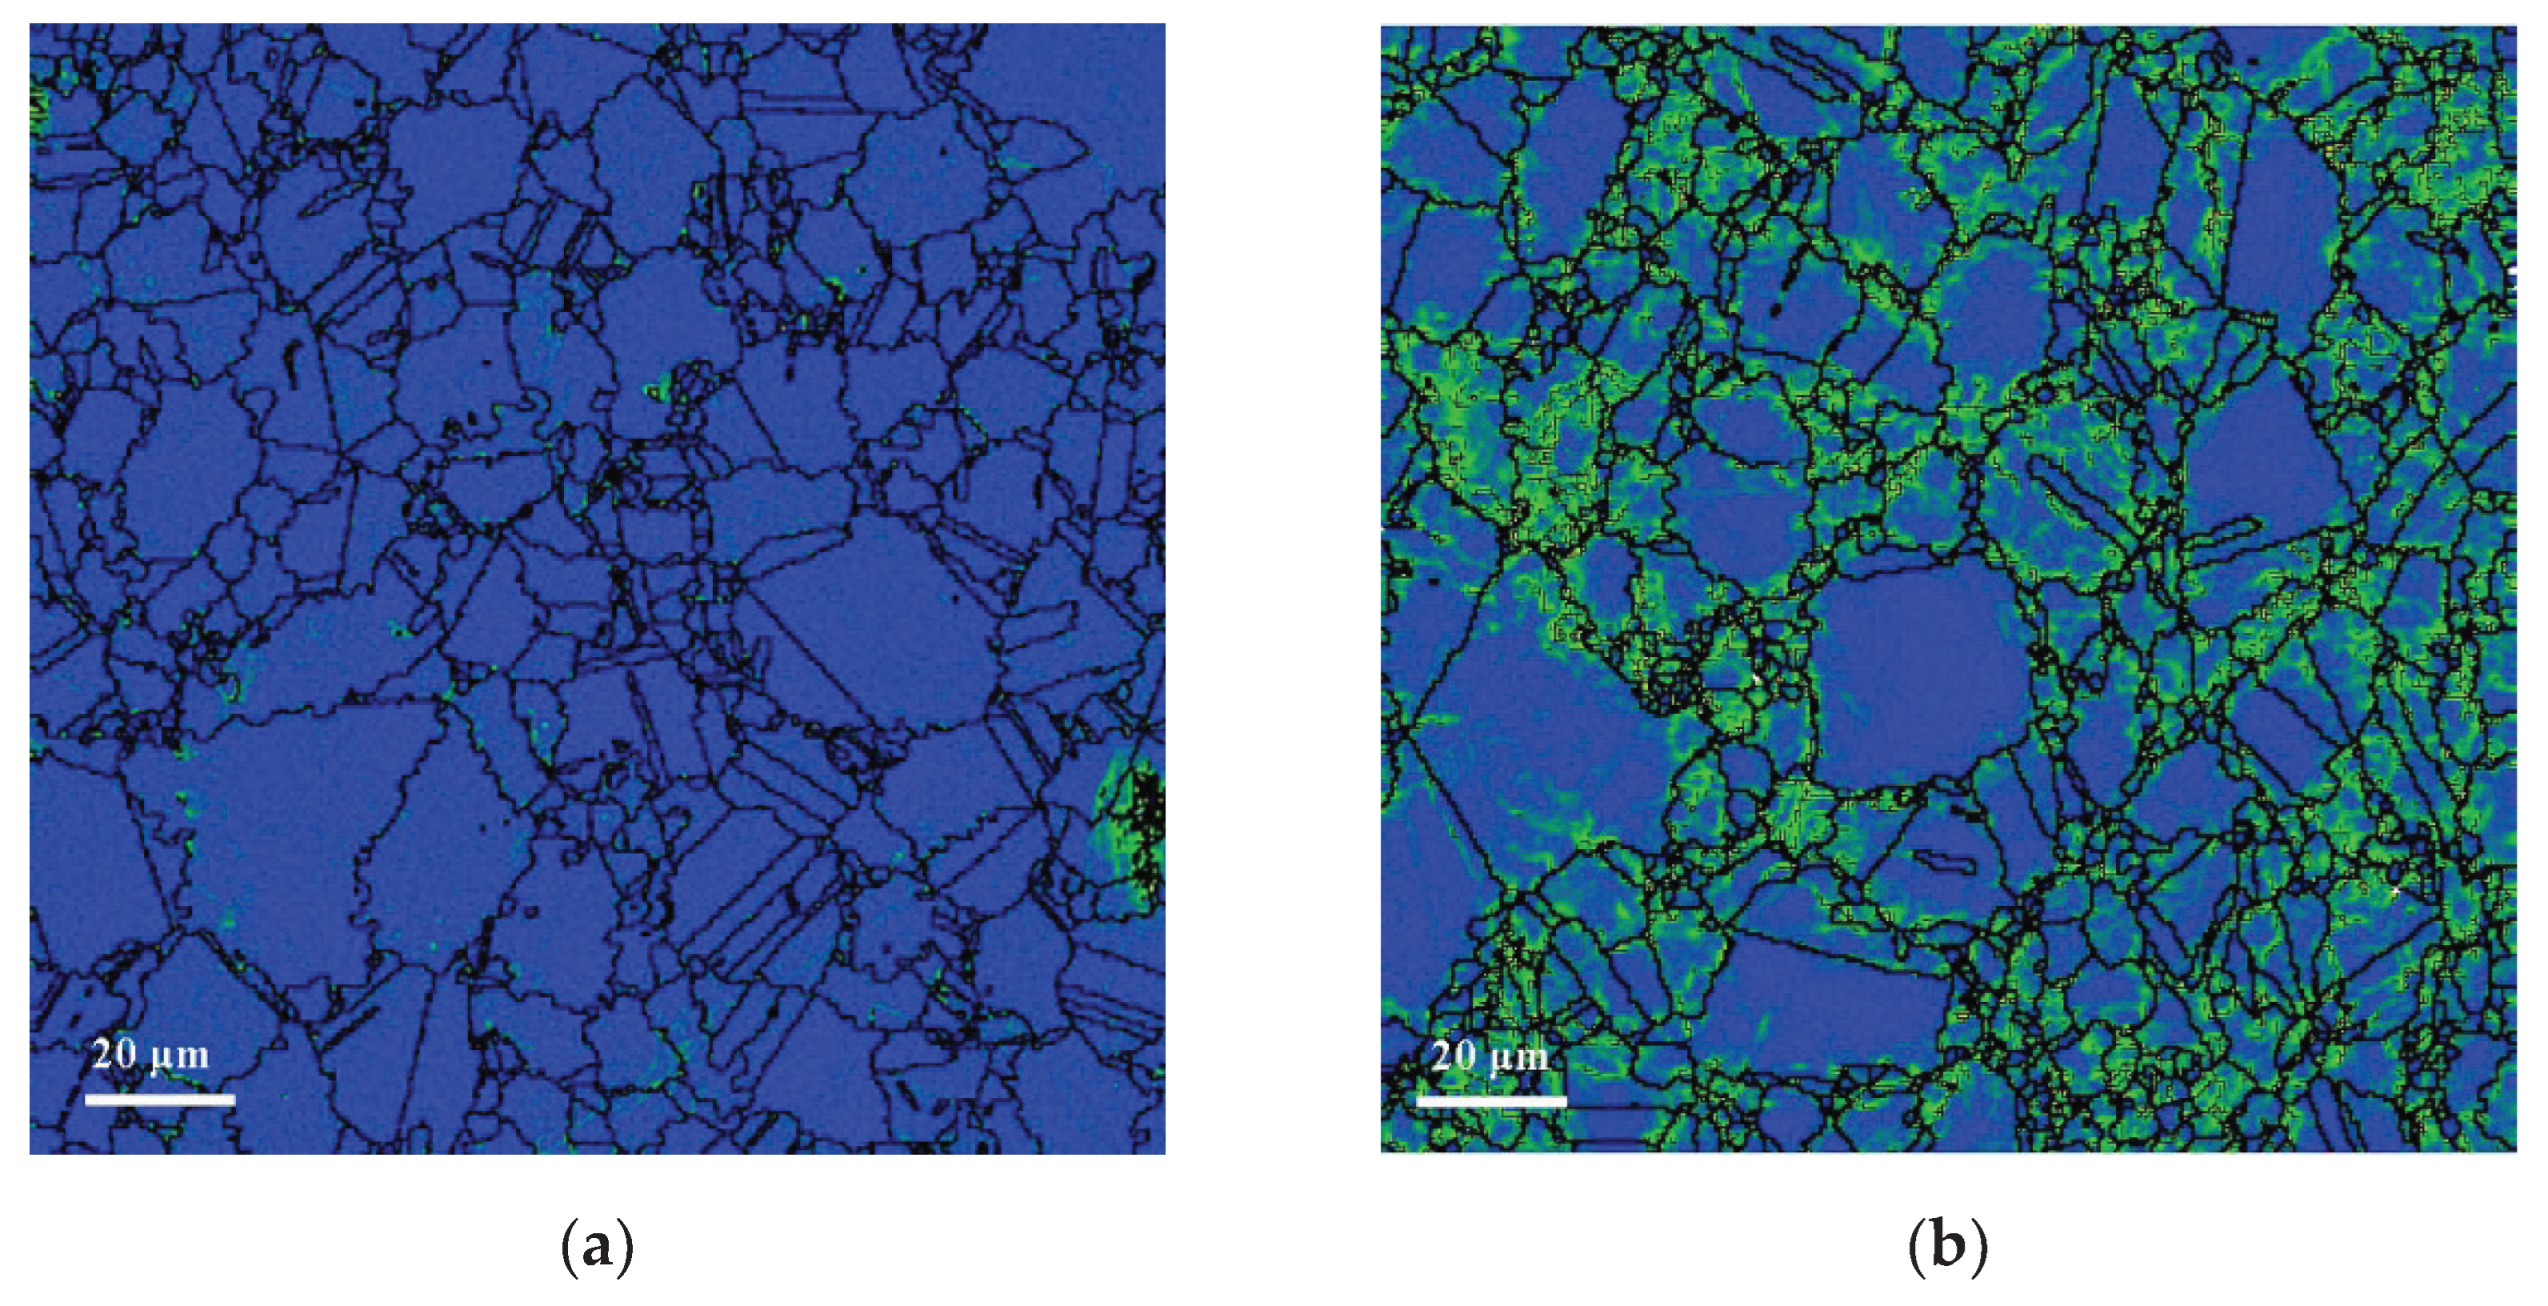
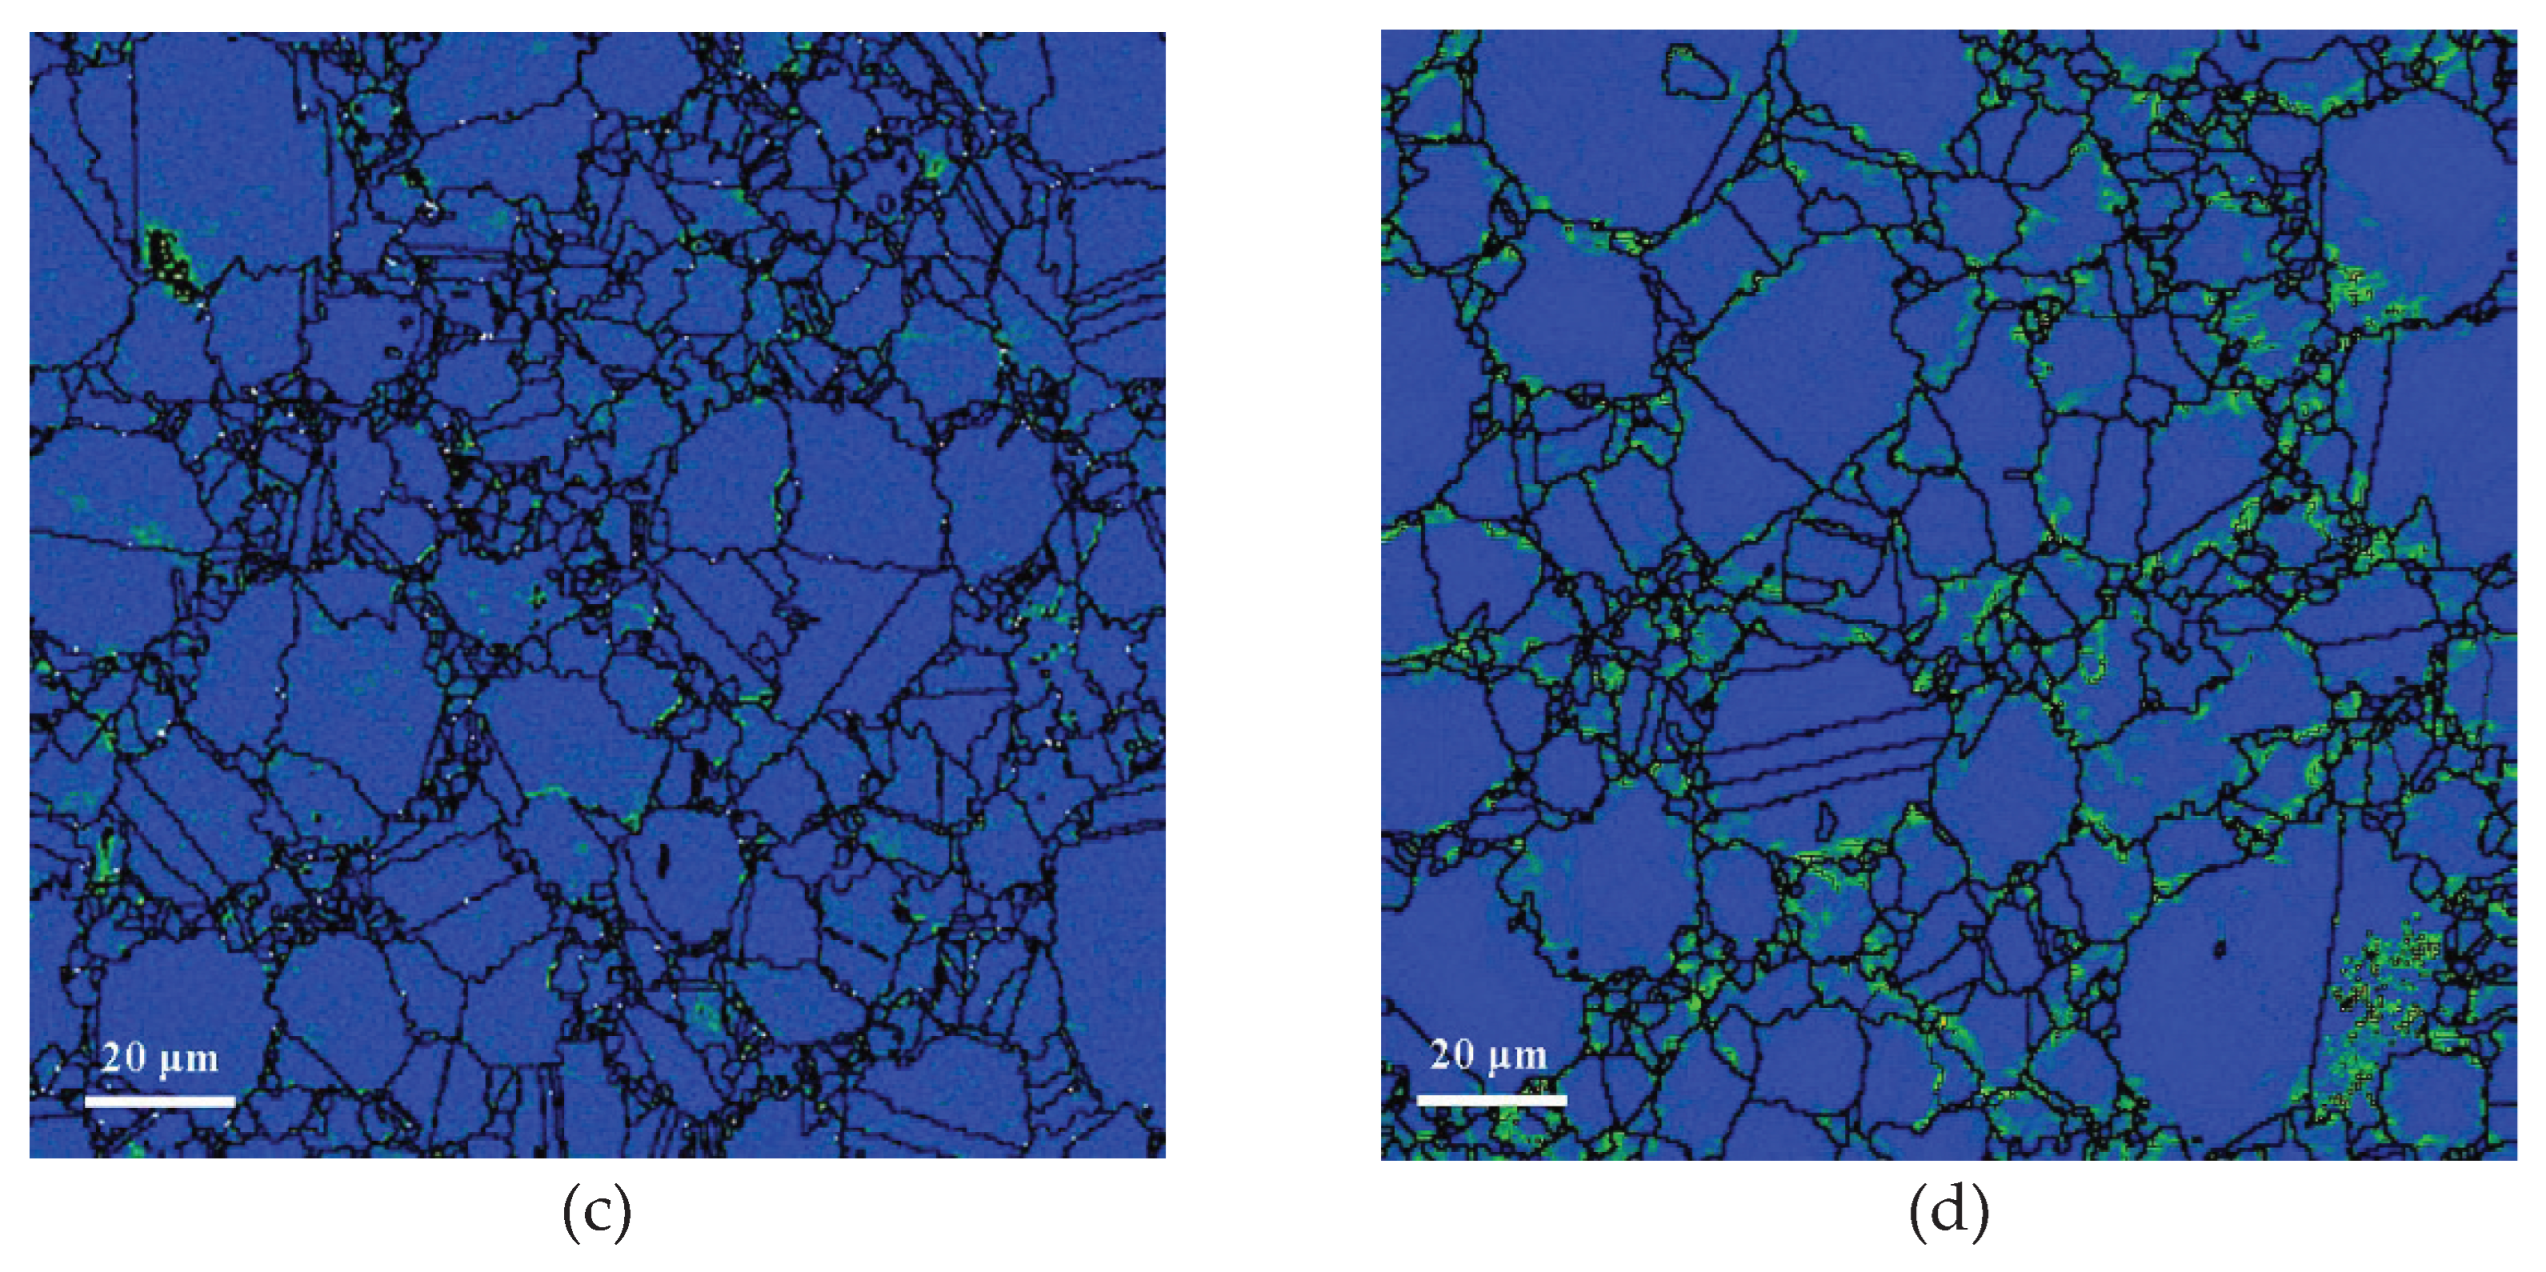
- FGH96 superalloy with 341ppm oxygen content has a wider grain size distribution and less ∑3 boundaries compare with lower oxygen content superalloy.
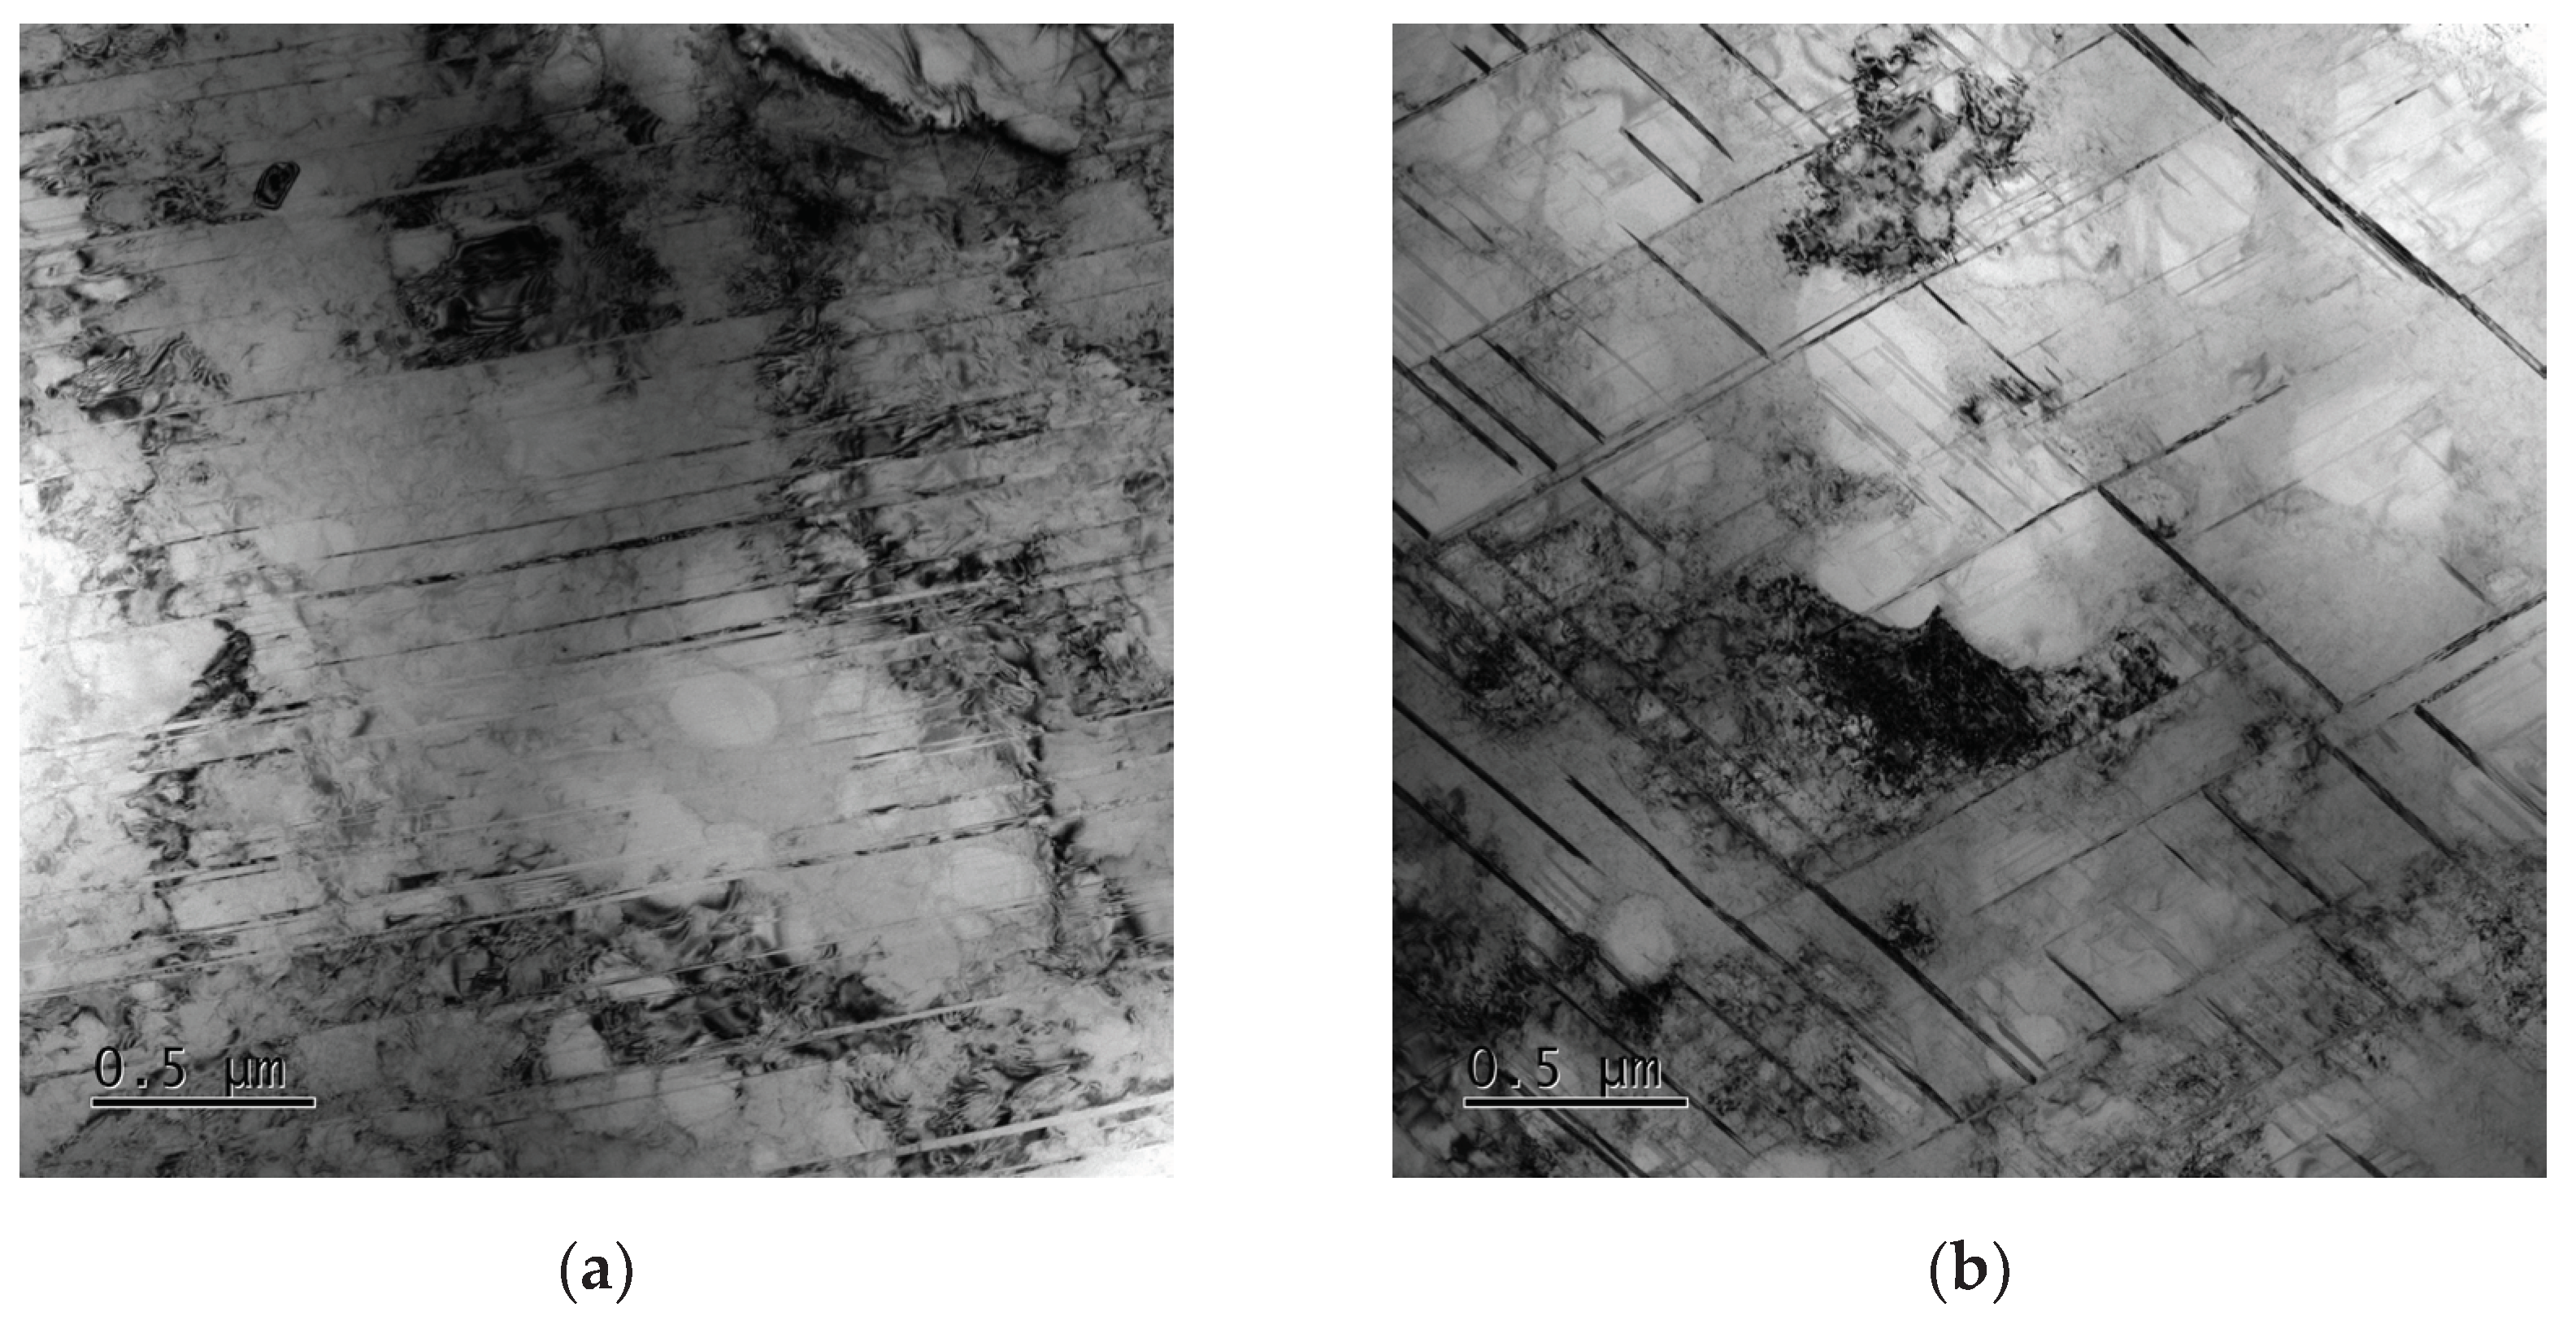
- Multiple directions of slip system motivate simultaneously and slip cross for the weaker resistance by less ∑3 boundaries in FGH96 superalloy with 341ppm oxygen content, so the specimen creeped faster and raptured earlier.
Acknowledgments
References
- Thuneman, T.; Raja, K.S.; Charit, I. Room Temperature Corrosion Behavior of Selective Laser Melting (SLM)-Processed Ni-Fe Superalloy (Inconel 718) in 3.5% NaCl Solution at Different pH Conditions: Role of Microstructures. 2024, 14, 89.
- Li, Y.; Zhang, Q.F.; You, X.G.; Qiang, J.B. Effect of Melt Superheating Treatment on the Microstructures and Purity of a Directionally Solidified Superalloy. Crystals 2023, 13, 1632. [Google Scholar] [CrossRef]
- Zhang, L.C.; Xu, W.Y.; Li, Z.; Zheng, L.; Liu, Y.F.; Zhang, G.Q. Characterization of particle shape of nickel-based superalloy powders using image processing techniques. Powder Technol. 2022, 395, 787–801. [Google Scholar] [CrossRef]
- Wang, X.Q.; Peng, Z.C.; Luo, X.J.; Hu, H.; Zou, J.W.; Wang, W.X. Effect of aging treatment on microstructure and properties of HEX+HIF FGH95 superalloys. J. Mater. Eng. 2020, 48, 120–126. [Google Scholar]
- Tan, L.M.; He, G.A.; Liu, F.; Li, Y.P.; Jiang, L. Effects of Temperature and Pressure of Hot Isostatic Pressing on the Grain Structure of Powder Metallurgy Superalloy. Mater. 2018, 11, 328–337. [Google Scholar] [CrossRef] [PubMed]
- Qiu, C.L.; Attallah, M.M.; Wu, X.H.; Andrews, P. Influence of hot isostatic pressing temperature on microstructure and tensile properties of a nickel-based superalloy powder. Mater. Sci. Eng. A 2013, 564, 176–185. [Google Scholar] [CrossRef]
- Ma, W.B.; Liu, G.Q.; Hu, B.F.; Jia, C. Formation of previous particle boundary of nickel base PM superalloy FGH96. Acta Metall. Sin. 2013, 49, 1248–1254. [Google Scholar] [CrossRef]
- Zhou, J.Y.; Liu, C.K.; Zhao, W.X.; Zheng, Z.; Zhong, Y. Prior Particle Boundary of PM FGH96 Superalloy and Its In-situ High-cycle Fatigue at Elevated Temperature. J. Aeron. Mater. 2017, 37, 83–89. [Google Scholar]
- Liu, H.S.; Zhang, L.; He, X.B.; Qu, X.H.; Zhu, H.M.; Zhang, G.Q. Effect of oxygen content and heat treatment on carbide precipitation behavior in PM Ni-base superalloys. Int. J. Min. Metall. Mater. 2012, 19, 827–835. [Google Scholar] [CrossRef]
- Zhang, L.; Liu, H.S.; He, X.B.; Din, R.; Qu, X.H.; Qin, M.H.; Li, Z.; Zhang, G.Q. Thermal evolution behavior of carbides and γ′ precipitates in FGH96 superalloy powder. Mater. Charact. 2012, 67, 52–64. [Google Scholar] [CrossRef]
- Zhang, Y.; Zhang, Y.W.; Sun, Z.K.; Huang, H. Influence of PPB on Fatigue Crack Growth Rate of PM Ni -Based Superalloy. Rare Metal Mat. Eng. 2019, 48, 3282–3288. [Google Scholar]
- Rao, G.A.; Srinivas, M.; Satma, D.S. Effect of oxygen content of powder on microstructure and mechanical properties of hot isotatically pressed superalloy Inconel 718. Mater. Sci. Eng. A 2006, 435, 84–99. [Google Scholar] [CrossRef]
- He, G.A.; Ding, H.H.; Liu, C.Z.; Liu, F.; Lan, H.; Jiang, L. Effects of powder characteristics on microstructure and deformation activation energy of nickel based superalloy. Chin. J. Nonferrous Met. 2016, 26, 37–49. [Google Scholar]
- MacDonald, J.E.; Khan, R.H.U.; Aristizabal, M.; Essa, K.E.A.; Lunt, M.J.; Attallah, M.M. Influence of powder characteristics on the microstructure and mechanical properties of HIPed CM247LC Ni superalloy. Mater. Des. 2019, 174, 107796. [Google Scholar] [CrossRef]
- Tian, T.; Hao, Z.B.; Ge, C.C.; Li, X.; Peng, S.; Jia, C. Effects of stress and temperature on creep behavior of a new third-generation powder metallurgy superalloy FGH100L. Mater. Sci. Eng. A 2020, 776, 139007. [Google Scholar] [CrossRef]
- Peng, Z.C.; Liu, P.Y.; Wang, X.Q.; Luo, X.J.; Liu, J.; Zou, J.W. Creep Behavior of FGH96 Superalloy at Different Service Conditions. Acta Metall. Sin. 2022, 58, 673–682. [Google Scholar]
- Xu, H.; Wang, Y.; Liu, D.L.; Zou, J.W. High temperature oxidation resistance of PM superalloys FGH4095 and FGH4096. J. Mater. Eng. 2023, 51, 122–131. [Google Scholar]
- Ingesten, N.G.; Warren, R.; Winberg, L. The Nature and Origin of Previous Particle Boundary Precipitates in P/M Superalloys. Springer Netherlands 1982, 1013–1027. [Google Scholar]
- Zhao, J.P. Study on Prior Particle Boundary (PPB) Precipitation in P/M Superalloy FGH96. Xi′an University of Architecture and Technology, 2010.
- Xu, W.Y.; Liu, Y.F.; Yuan, H.; Li, Z.; Zhang, G.Q. ; Surface Characterization of Nickel-Base Superalloy Powder: Proc. Chin. Mater. Conf. 2018. Springer: Berlin Germany, 2019; pp. 561-567.
- Peng, Z.C.; Zou, J.W.; Wang, X.Q. Microstructural characterization of dislocation movement during creep in powder metallurgy FGH96 superalloy. Mater. Today Commun. 2020, 25, 101361. [Google Scholar] [CrossRef]
- Peng, Z.C.; Zou, J.W.; Yang, J.; Tian, G.F.; Wang, X.Q. Influence of γ’ precipitate on deformation and fracture during creep in PM nickel-based superalloy. Prog. Nat. Sci. 2021, 31, 303–309. [Google Scholar] [CrossRef]
- Peng, Z.C.; Zou, J.W.; Wang, Y.; Zhou, L.; Tang, Y. Effects of solution temperatures on creep resistance in a powder metallurgy nickel-based superalloy. Mater. Today Commun. 2021, 28, 102573. [Google Scholar] [CrossRef]
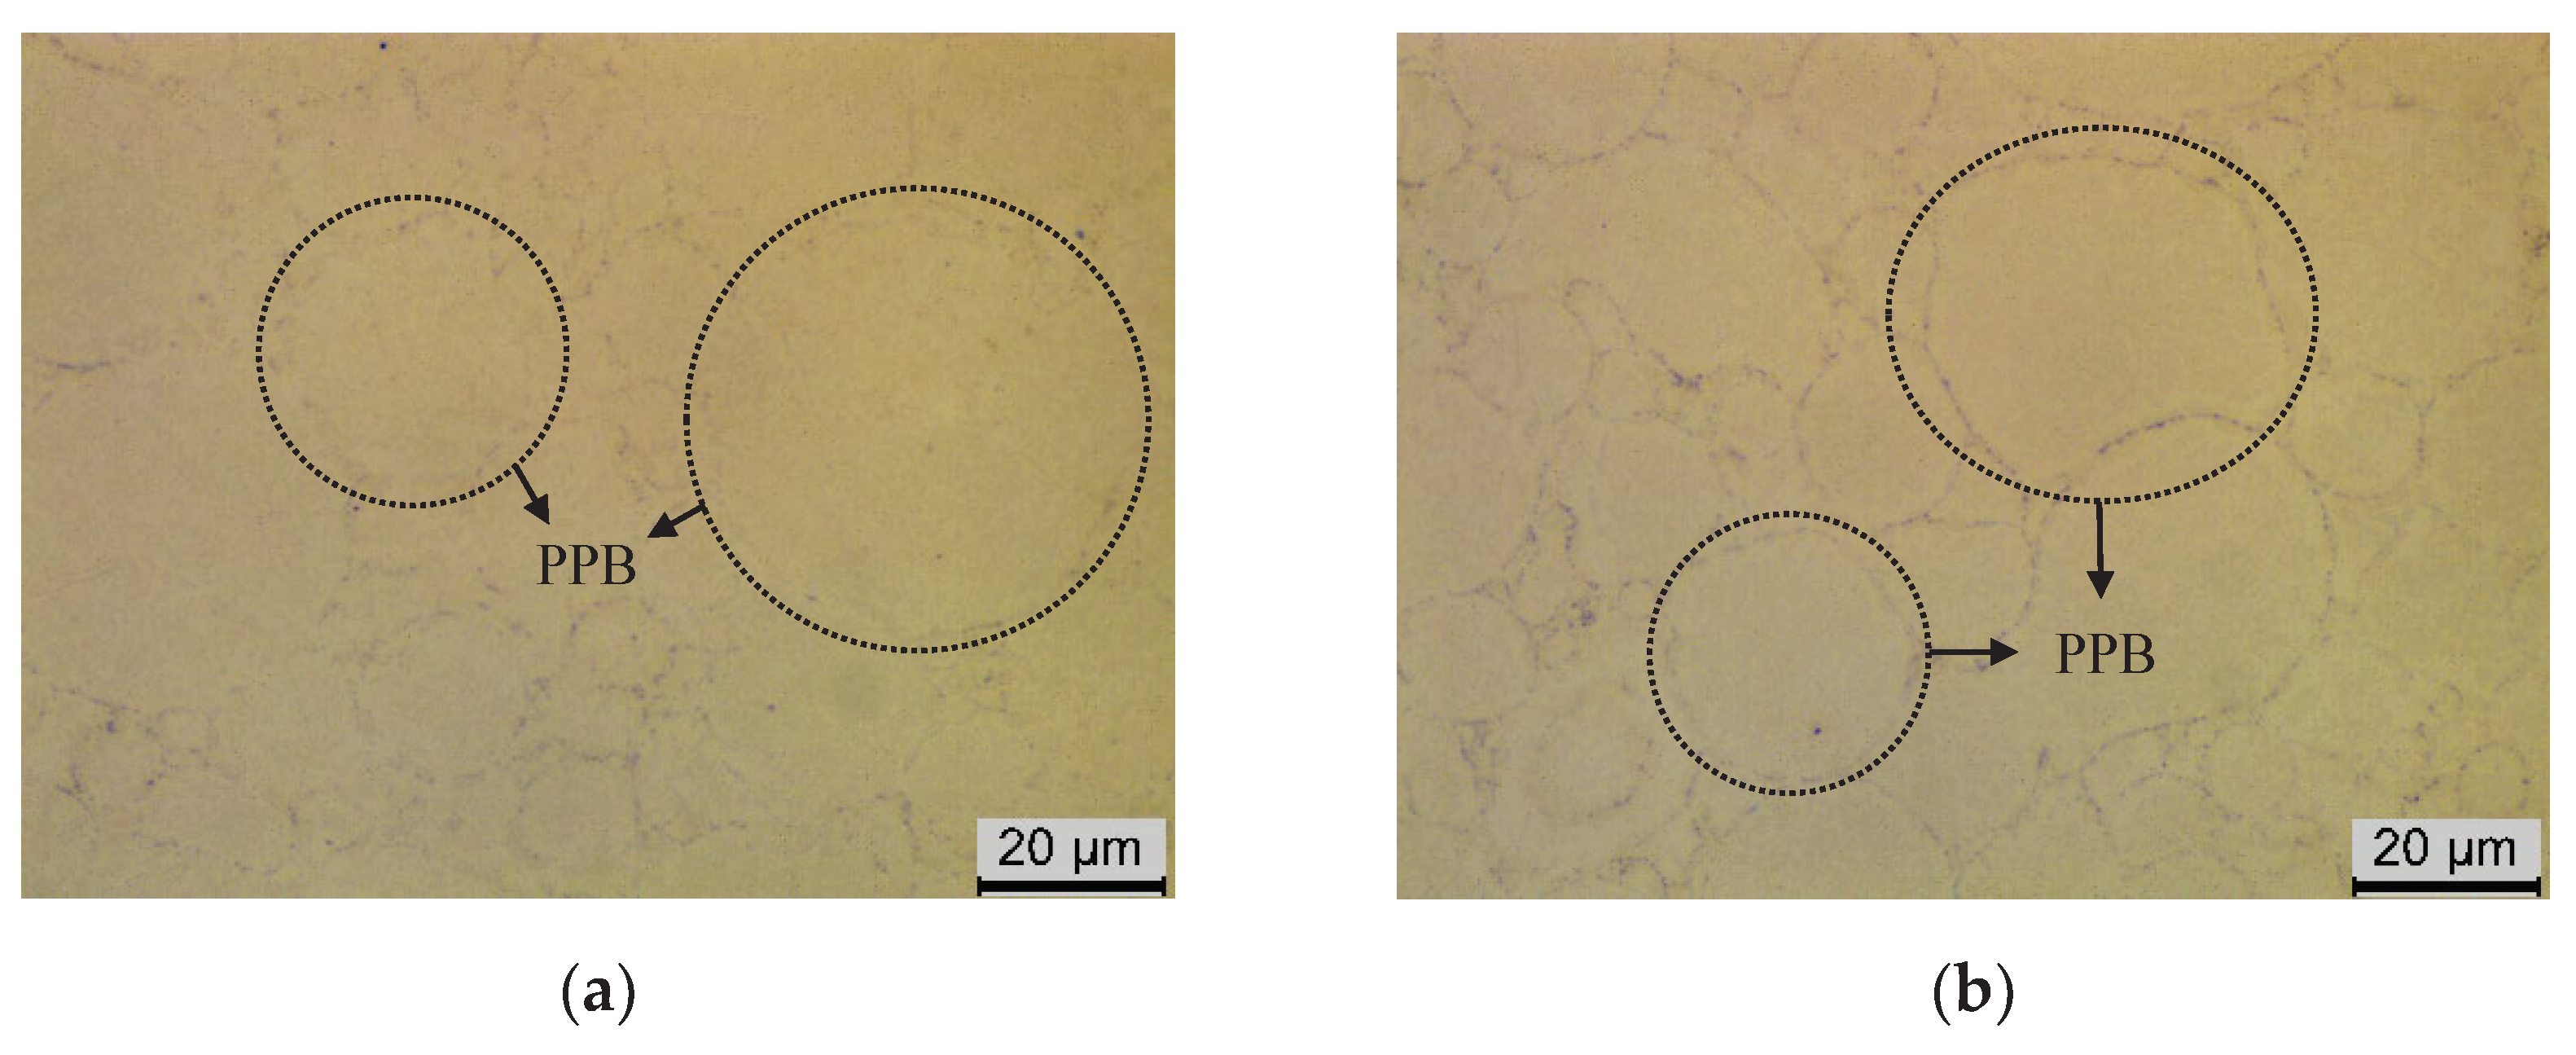
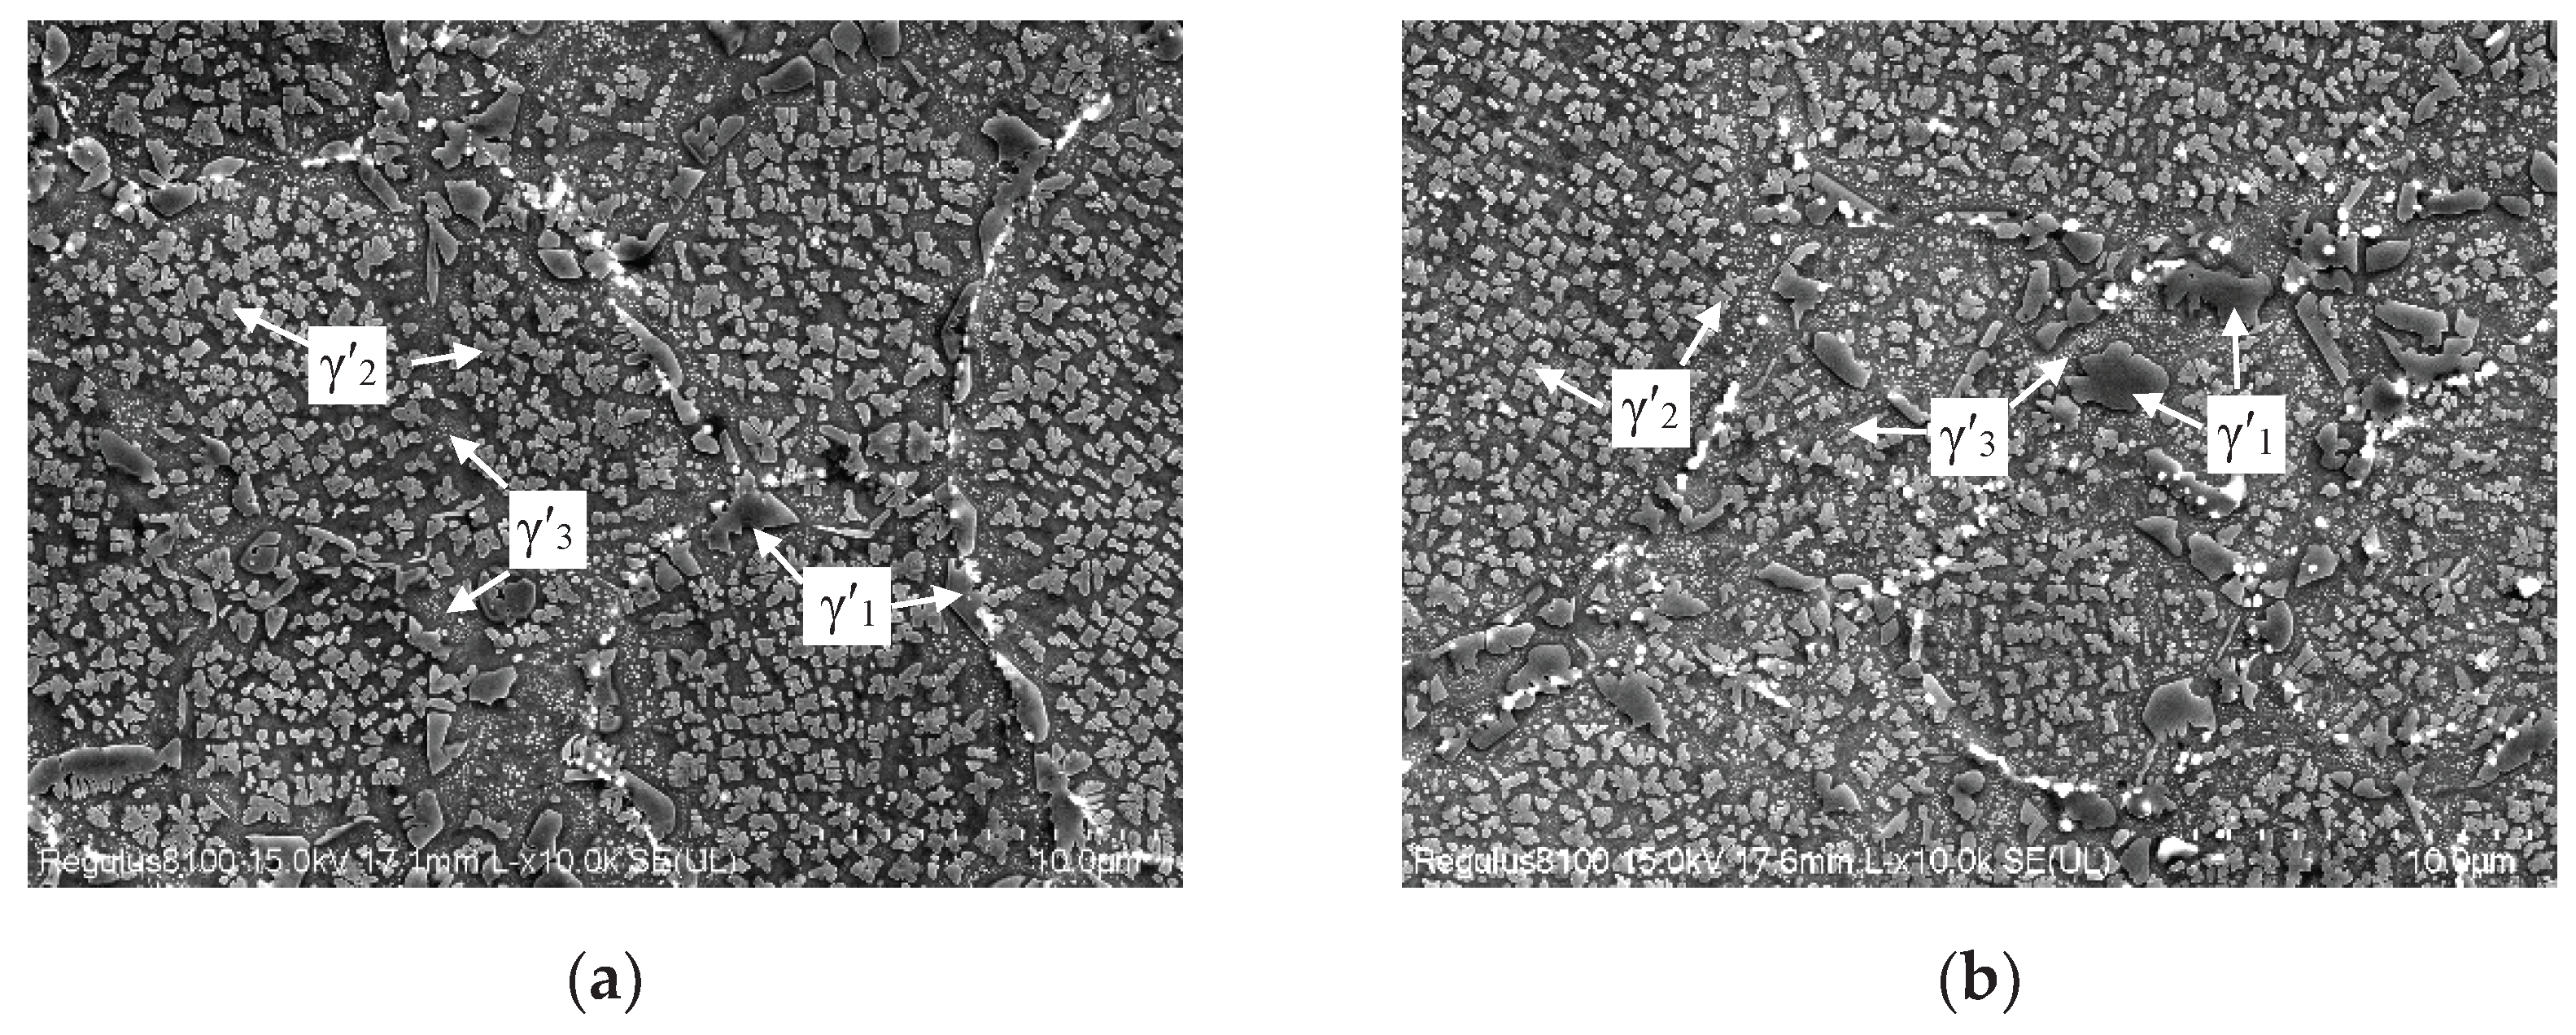
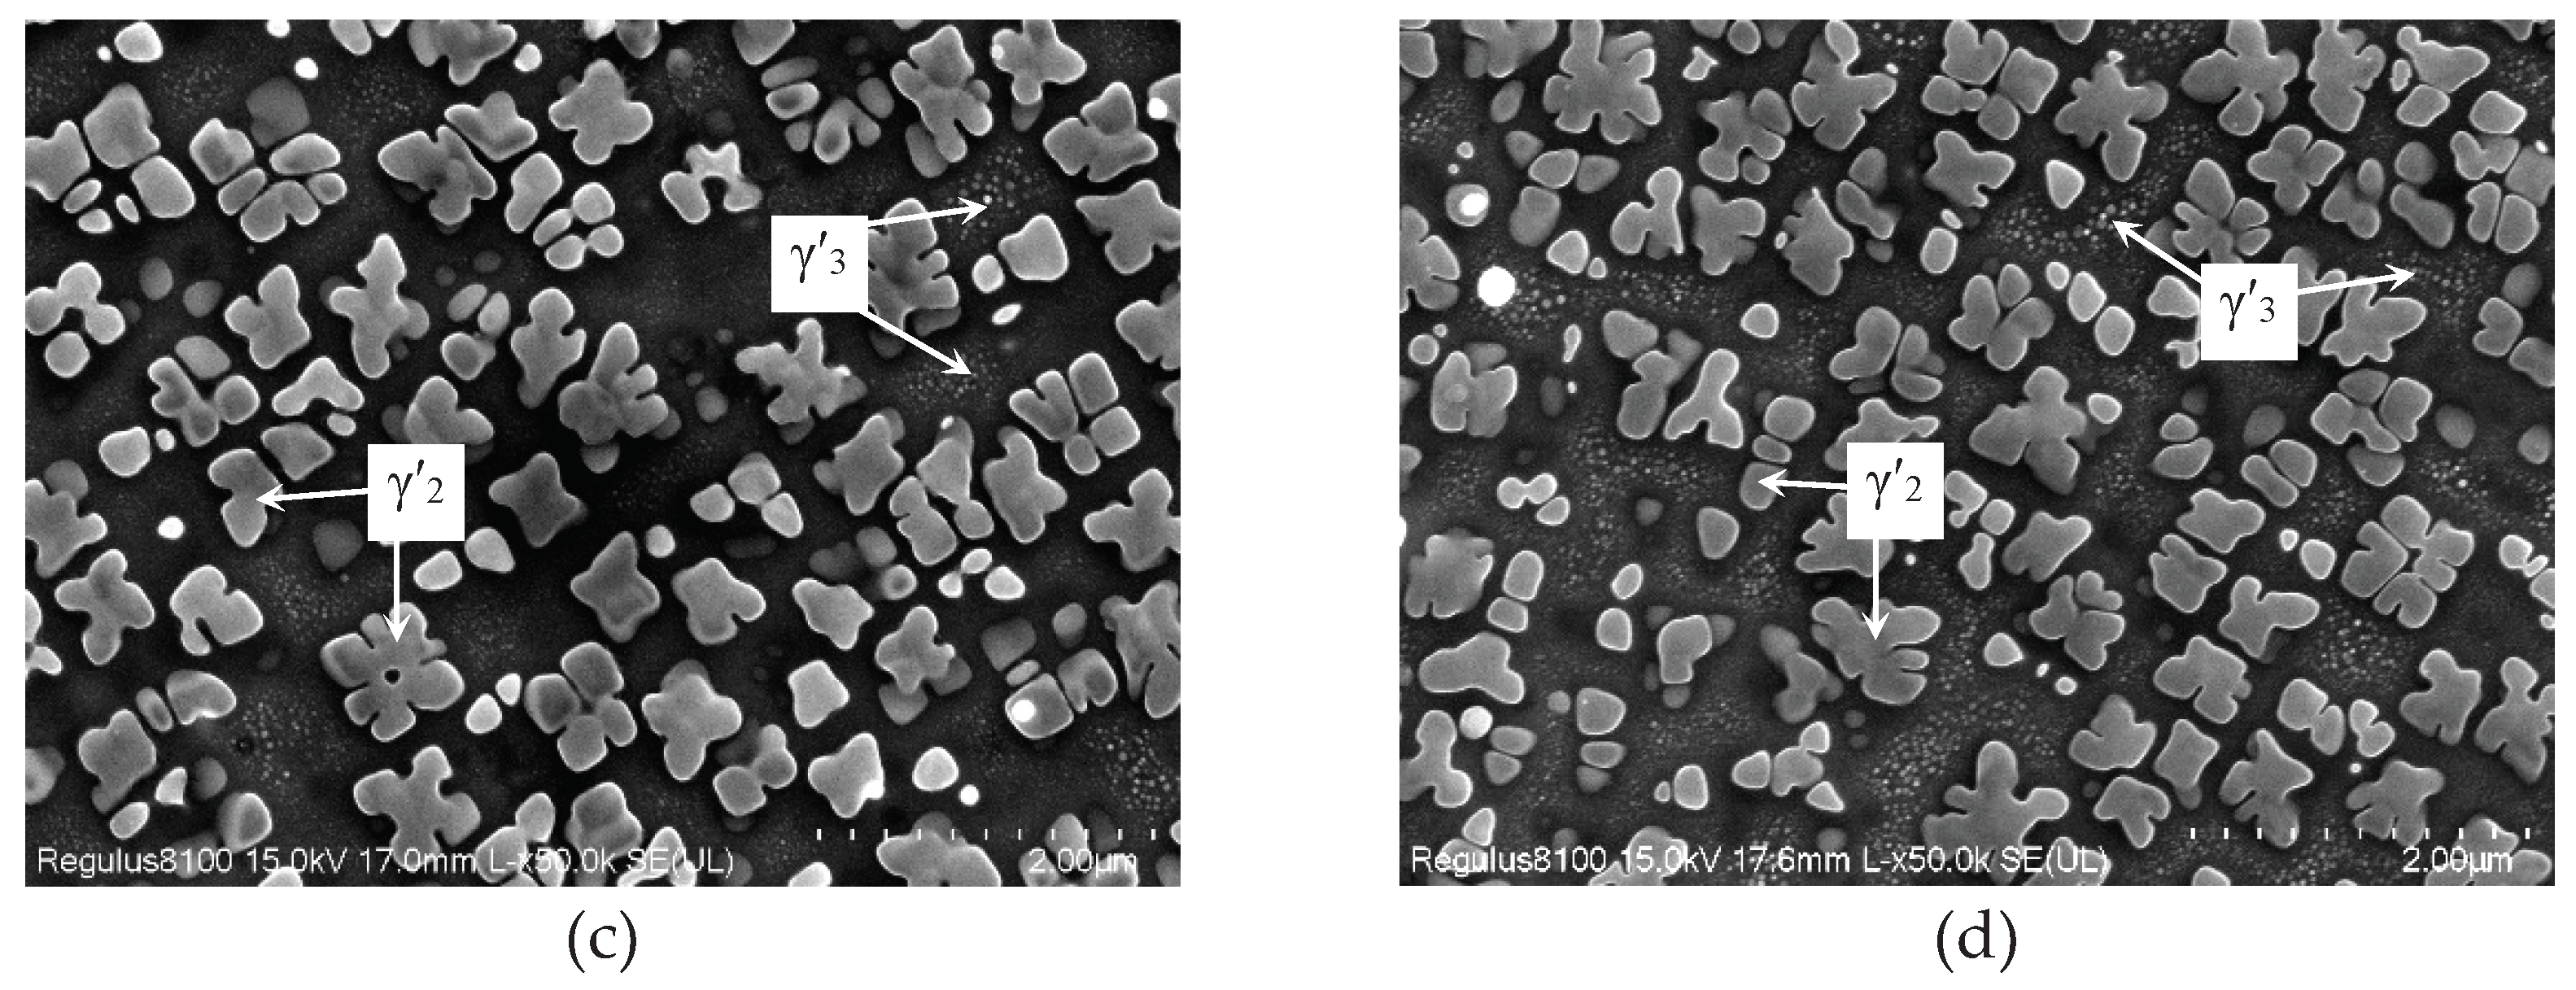
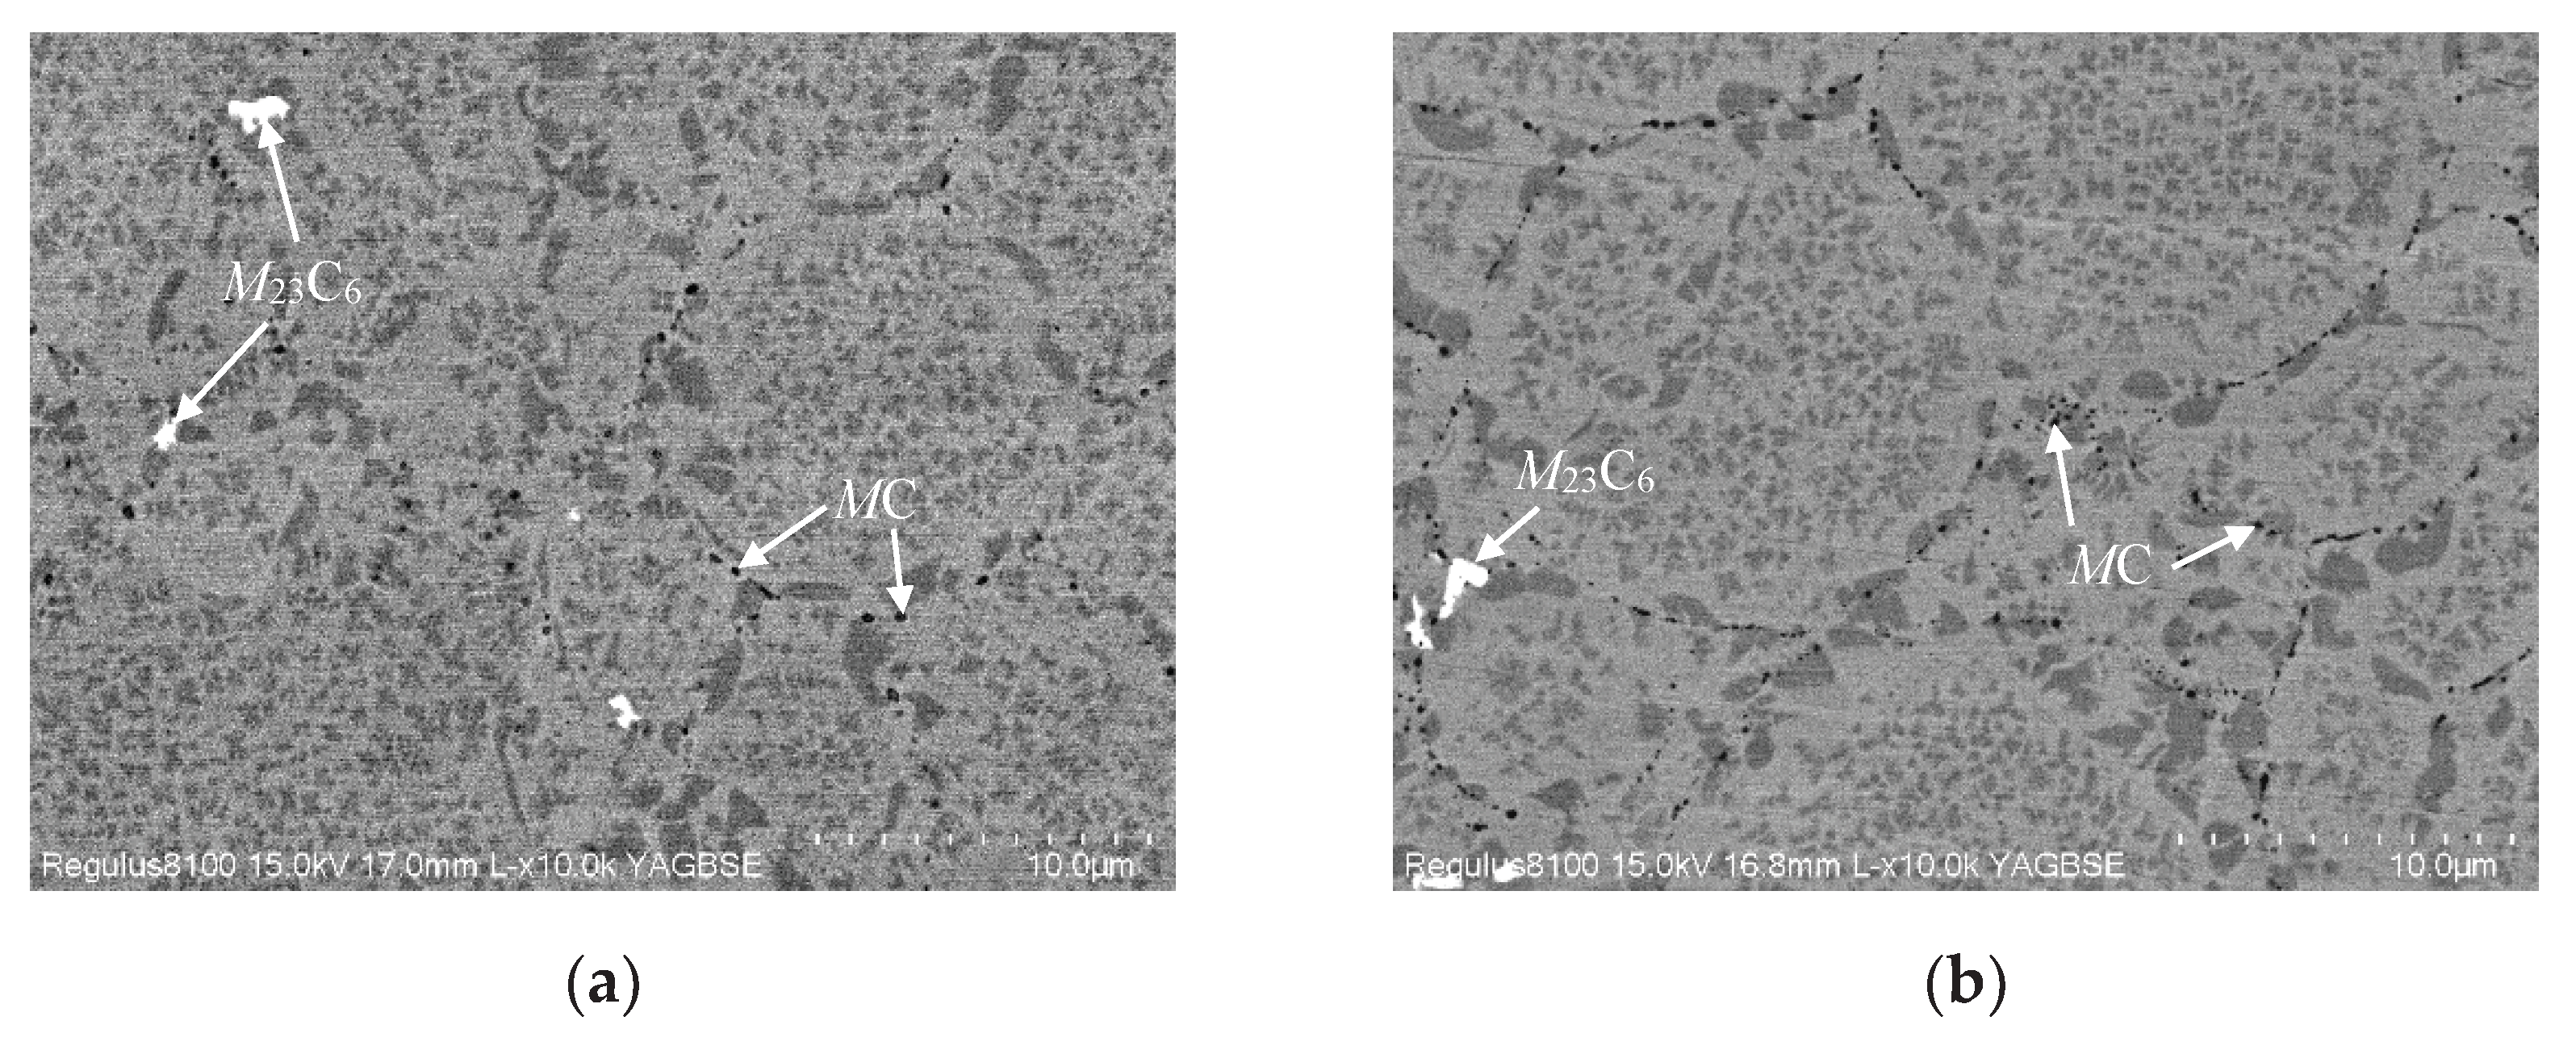

| State | Original | Preoxidized |
|---|---|---|
| Powder | 141 | 397 |
| HIPed | 135 | 341 |
| Oxygen content / ppm | γ′1 / μm | γ′2 / nm | γ′3 / nm |
| 135 | 1.07 | 325.4 | 22.6 |
| 341 | 1.27 | 320.7 | 24.8 |
Disclaimer/Publisher’s Note: The statements, opinions and data contained in all publications are solely those of the individual author(s) and contributor(s) and not of MDPI and/or the editor(s). MDPI and/or the editor(s) disclaim responsibility for any injury to people or property resulting from any ideas, methods, instructions or products referred to in the content. |
© 2024 by the authors. Licensee MDPI, Basel, Switzerland. This article is an open access article distributed under the terms and conditions of the Creative Commons Attribution (CC BY) license (http://creativecommons.org/licenses/by/4.0/).


