Preprint
Article

Experimental Investigation on Shear Behavior of Non-stirrup Uhpc Beams under Larger Shear Span-Depth Ratios

Altmetrics

Downloads

89

Views

31

Comments

0

A peer-reviewed article of this preprint also exists.

Submitted:

23 March 2024

Posted:

25 March 2024

You are already at the latest version

Alerts
Abstract
Due to the extraordinary mechanical properties of ultra-high-performance concrete (UHPC), the shear stirrups in UHPC beams could potentially be removed. The aim of this study is to determine the effect of beam height and steel fiber volume content on the shear behavior of non-stirrup UHPC beams under a larger shear span-depth ratio (up to 2.8). Eight beams were designed and fabricated, including six non-stirrup UHPC beams and two comparing stirrup-reinforced normal concrete (NC) beams. The experimental results demonstrated that the volume content of steel fiber could be a crucial factor affecting the ductility, cracking strength, and shear strength of non-stirrup UHPC beams and altering their failure modes. Additionally, the height of the beam had a considerable effect on its shear resistance. This study revealed that the French standard formulae were more accurate for the UHPC beams with larger shear span-depth ratios and PCI-2021 formulae greatly overestimate the shear capacity of UHPC beams with larger shear span-depth ratios. Xu’s formulae were more accurate for the steel fiber-reinforced UHPC beams with larger shear span-depth ratios.
Keywords: 
Subject: Engineering  -   Architecture, Building and Construction

1. Introduction

Ultra-high-performance concrete (UHPC) is a cementitious composite consisting of cement, mineral additions, fine aggregates, steel fibers, water reducer, and potable water. Given its extraordinary mechanical properties, superior workability, and durability, UHPC is considered one of the most promising engineering materials [1,2,3,4]. Additionally, UHPC exhibits excellent corrosion resistance and reliability due to its high compactness and self-healing ability [5,6]. Nowadays, it has been widely used in practical engineering, particularly in bridge engineering [7,8,9]. Prominent examples of its application include the first UHPC pedestrian bridge-Sherbrooke Quebec bridge, in Canada in 1997; the first PI-shaped UHPC bridge-Jakway Park Bridge in Buchanan County, Missouri, USA; the world’s first and the largest UHPC arch bridge-Peace Bridge in South Kore; the world’s first UHPC highway arch bridge -Wild Bridge in Austria; the Chinese first largest steel-UHPC truss foot bridge [10]. In addition, there is a significant body of research on the use of UHPC in bridge construction, covering various aspects such as waffle deck panels [11], segmental bridges [12,13], joints [14,15,16,17], connections [18,19] and steel-UHPC composite girders [20,21,22,23,24]. However, the innovation of material also results in high construction costs. To expand the application of UHPC in construction, cost-effective methods must be identified. In 2019, the first prestressed non-stirrup UHPC girder bridge was built in China, reducing its own weight down to about half that of conventional NC beams. The exclusion of stirrups enhances the fluidity of UHPC, resulting in improved mechanical properties, and providing a novel method to cut down the costs.
In normal concrete (NC) beam structures, dense stirrups are typically arranged to resist the shear forces. Generally, shear failure is more hazardous than flexure failure, as it can be catastrophic and often occurs without warning. The incorporation of steel fiber can significantly enhance the mechanical properties of the UHPC matrix [25,26]. Studies have shown that non-stirrup UHPC beams can withstand shear loads due to the ultra-high tensile strength and bridging action of steel fibers with a volume content at 2% in the UHPC mixture [27]. It can be inferred that replacing stirrups with steel fibers is a viable option. Abbas et al. [28] discovered that the addition of steel fibers can enhance the post-cracking shear performance of concrete beams. Amin et al. [29] demonstrated that steel fibers enable better crack distribution, and increasing the volume content of steel fibers can significantly enhance shear strength. But when the volume content of steel fibers exceeded a certain threshold, the mechanical properties of UHPC did not exhibit significant enhancements [30]. Furthermore, it is noteworthy that the UHPC beams, which incorporated less than 0.5% volume of steel fiber, were unable to withstand shear load as the NC beam reinforced with stirrups [31]. Although many researchers have studied the influence of the volume content of steel fibers on the shear behavior of non-stirrup UHPC beams, there are still many issues that require investigation.
In general, steel fibers serve a similar purpose to stirrups in reinforcing concrete structures. By utilizing the exceptional mechanical properties of UHPC, it is possible to remove the stirrups for creating slender, lighter, and more economical structural members. Currently, most of studies in the non-stirrup UHPC beam field focus on prestressing and thin-web I-sections [32,33,34,35]. Jiang et al. [32] conducted four-point bending tests to investigate the shear performance of externally prestressed UHPC beams without stirrups. The study found that the shear strength decreased as the shear span-depth ratios increased. Additionally, the study found that increasing the volume content of steel fibers resulted in higher cracking and shear strength. Lee et al. [33] discovered that the UHPC I-girders without stirrups exhibited good ductility, and the shear strength increasing gradually after initial cracking. The quantity and type of fibers used in reactive power concrete prestressed non-stirrup girders did not significantly influence the cracking load but had a significant impact on the failure load and the rate of crack propagation [34]. Shear cracks in I-section prestressed non-stirrup UHPC beams were distributed significantly through the web before the formation of the critical crack [35]. Moreover, various parameters that can influence the shear behavior of non-stirrup UHPC beams, such as shear span-depth ratio, reinforcement ratio, and the volume content of steel fibers, had been the subject of numerous experimental and numerical studies [36,37,38,39]. The shear behavior of non-stirrup UHPC beams depended not only on the tensile strength of UHPC but also on the prestressing force, fiber orientation, and shape of the cross-section [40]. On average, UHPC beams had a shear capacity approximately 3.5 times greater than their counterparts, and the reinforcement ratio had little influence on the shear capacity of UHPC beams [41].
Larger shear span-depth ratios typically lead to larger bridge spans, which can improve the bridge’s passability and reduce the number of piers required. This simplifies the construction process and reduces construction difficulty. However, a larger shear span-depth ratio can also cause fatal problems to the bridge, such as a remarkable reduction in its load-bearing capacity. This can significantly increase the difficulty of bridge design. External prestressing tendons can improve the shear strength of UHPC beams and make the cross section of components smaller and thinner [42]. However, for small and medium-span bridges, eliminating prestressing tendons is generally preferred due to the harsh environment, high cost, and difficulty in controlling the reverse arch.
In this study, non-stirrup UHPC beams were tested under a larger shear span-depth ratio at different steel fiber volume contents and beam heights to determine the shear behavior. Two NC beams were also used for comparison. None of the tested beams were prestressed. To verify the accuracy of the French standard formula [44], PCI formula [45], and Xu’s formula [46], the experimental results were compared with the calculated values.

2. Experimental Programs

2.1. Specimen Preparation

The aim of this research is to determine the effect of beam height and steel fiber volume content on the shear capacity of non-stirrup UHPC beams under a larger shear span-depth ratio (up to 2.8). Eight beams were designed and fabricated, including six non-stirrup UHPC beams and two comparing stirrup-reinforced normal concrete (NC) beams. The dimensions and the layouts of beams are shown in Figure 1. The length of all tested beams (l) was designed to be 2100 mm, with the shear span-to-effective depth ratio ( λ ) of 2.8, where λ was calculated as λ = a / h 0 , with a and h 0 represent the length of the shear span and the effective depth of the beam, respectively. The specific values of a and h 0 are listed in Table 1. Furthermore, the cross-sections of the tested beams were rectangular, with a beam breadth (b) of 200 mm, and two beam heights (h) of 350 mm and 400 mm. To ensure shear failure mode, ribbed reinforcements with a diameter of 32 mm and a yield strength ( f y ) of 419.2 MPa were used, along with double layers of longitudinal reinforcement were placed at the bottom of the tested beams. The NC beams employed double-leg stirrups utilized ribbed reinforcements with an 8 mm diameter arranged at 100 mm intervals. The thickness of the concrete cover was 20 mm.
As shown in Table 1, the experimental variables include concrete type, beam height, with stirrups or without stirrups, and steel fiber volume content. To clearly indicate the variables, the specimens were labelled as U-H*-S*-V* or N-H*-S*-V*. The letter “U” represents ultra-high-performance concrete, while “N” represents normal concrete. The beam height was represented by ‘H35’ and ‘H40’ for 350 mm and 400 mm, respectively. “S1” and “S0” indicated whether the beams were constructed with stirrups or without stirrups, respectively. Additionally, “V2.0”, “V1.5” and “V0” indicated the volume content of steel fibers of 2.0%, 1.5% and “0”, respectively. For instance, “U-H35-S0-V2.0” represented a 350 mm high UHPC beam without stirrups with a steel fiber volume content of 2.0%.

2.2. Test Setup and Instrumentation

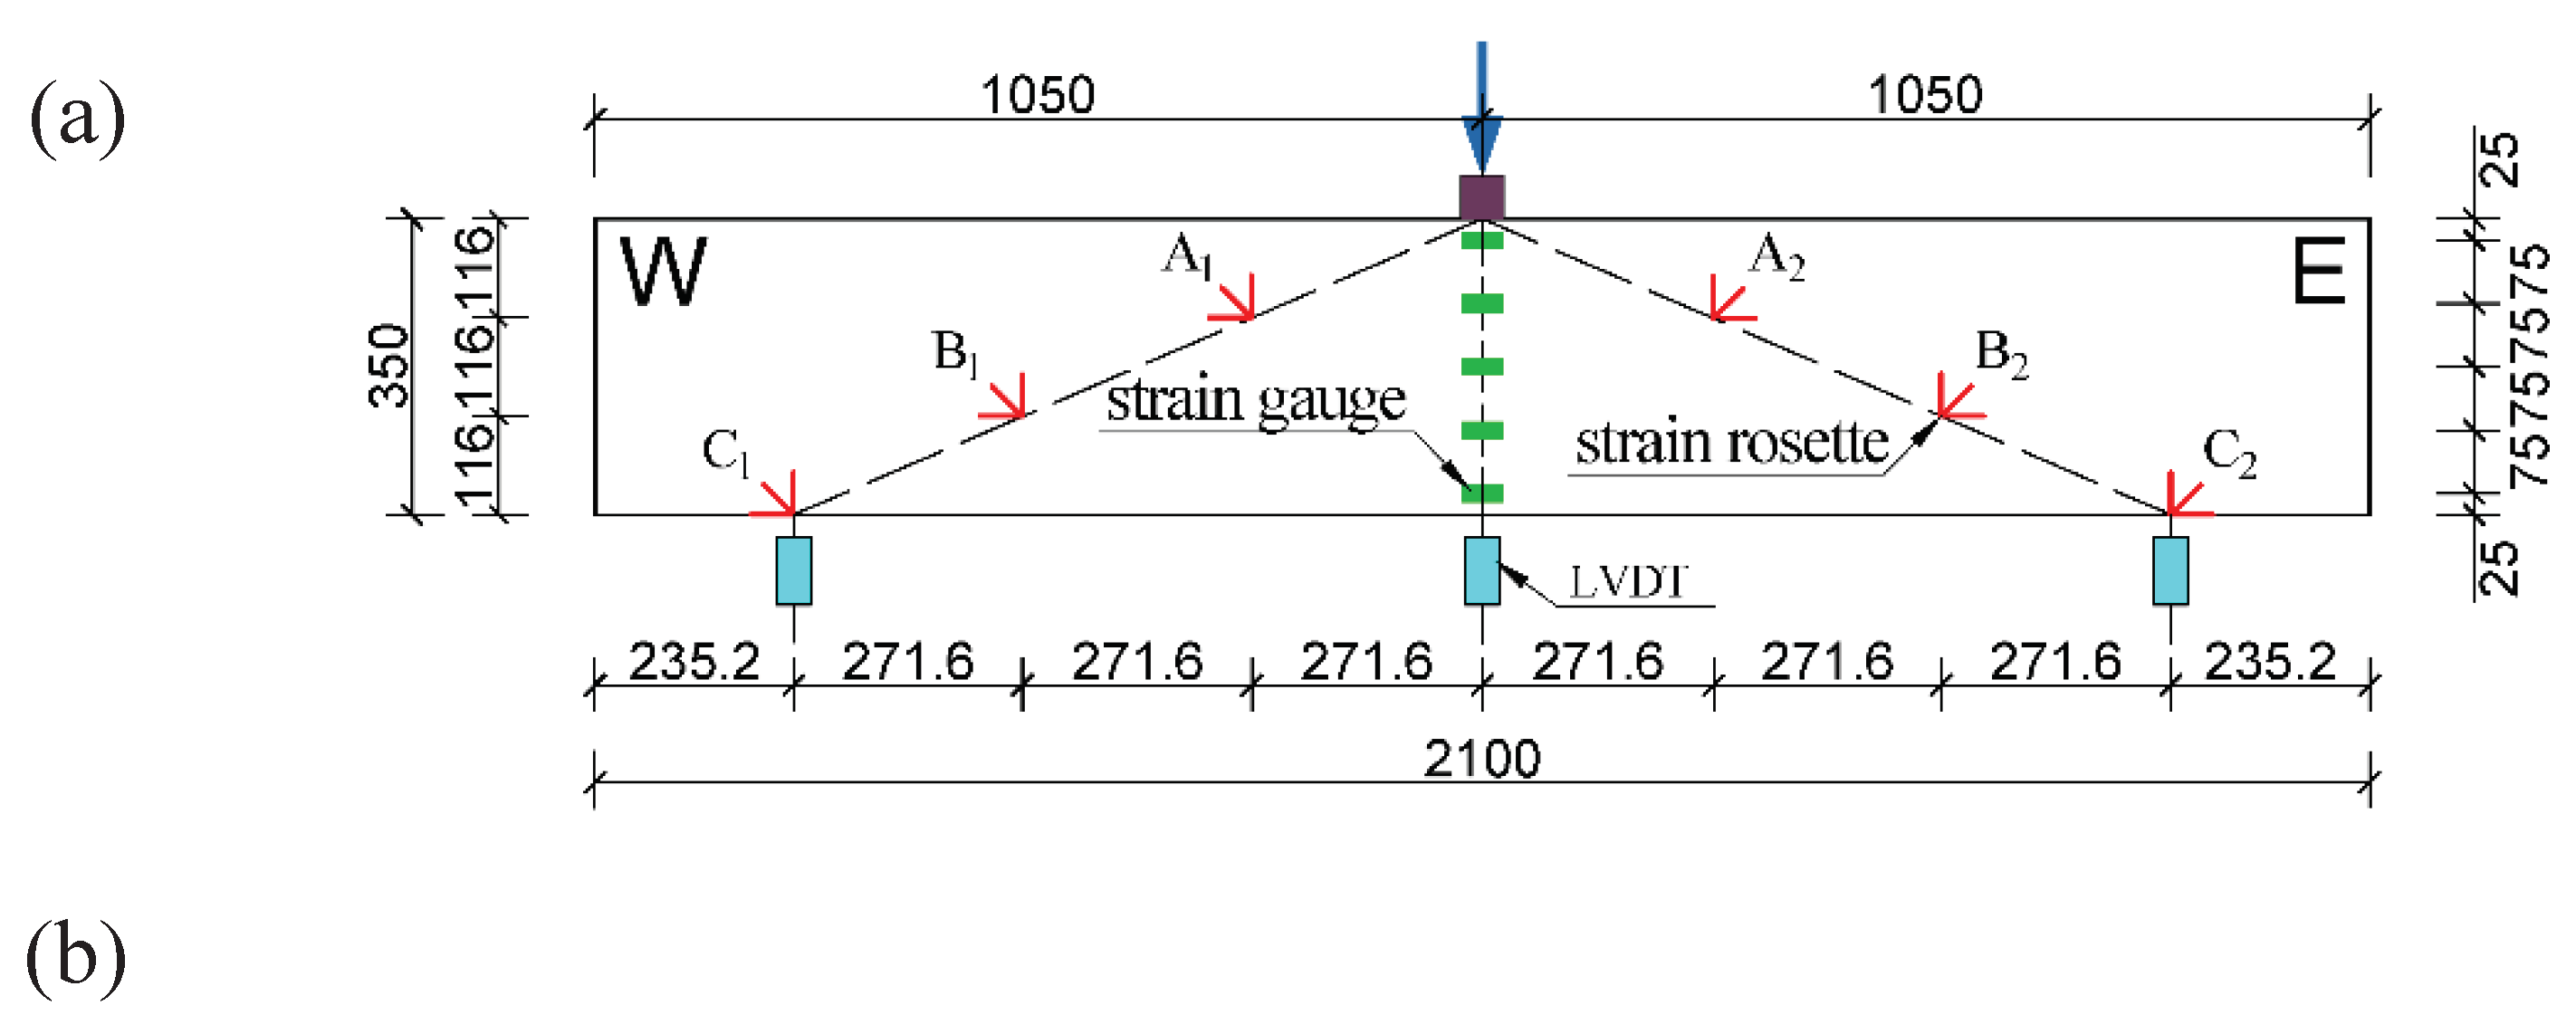
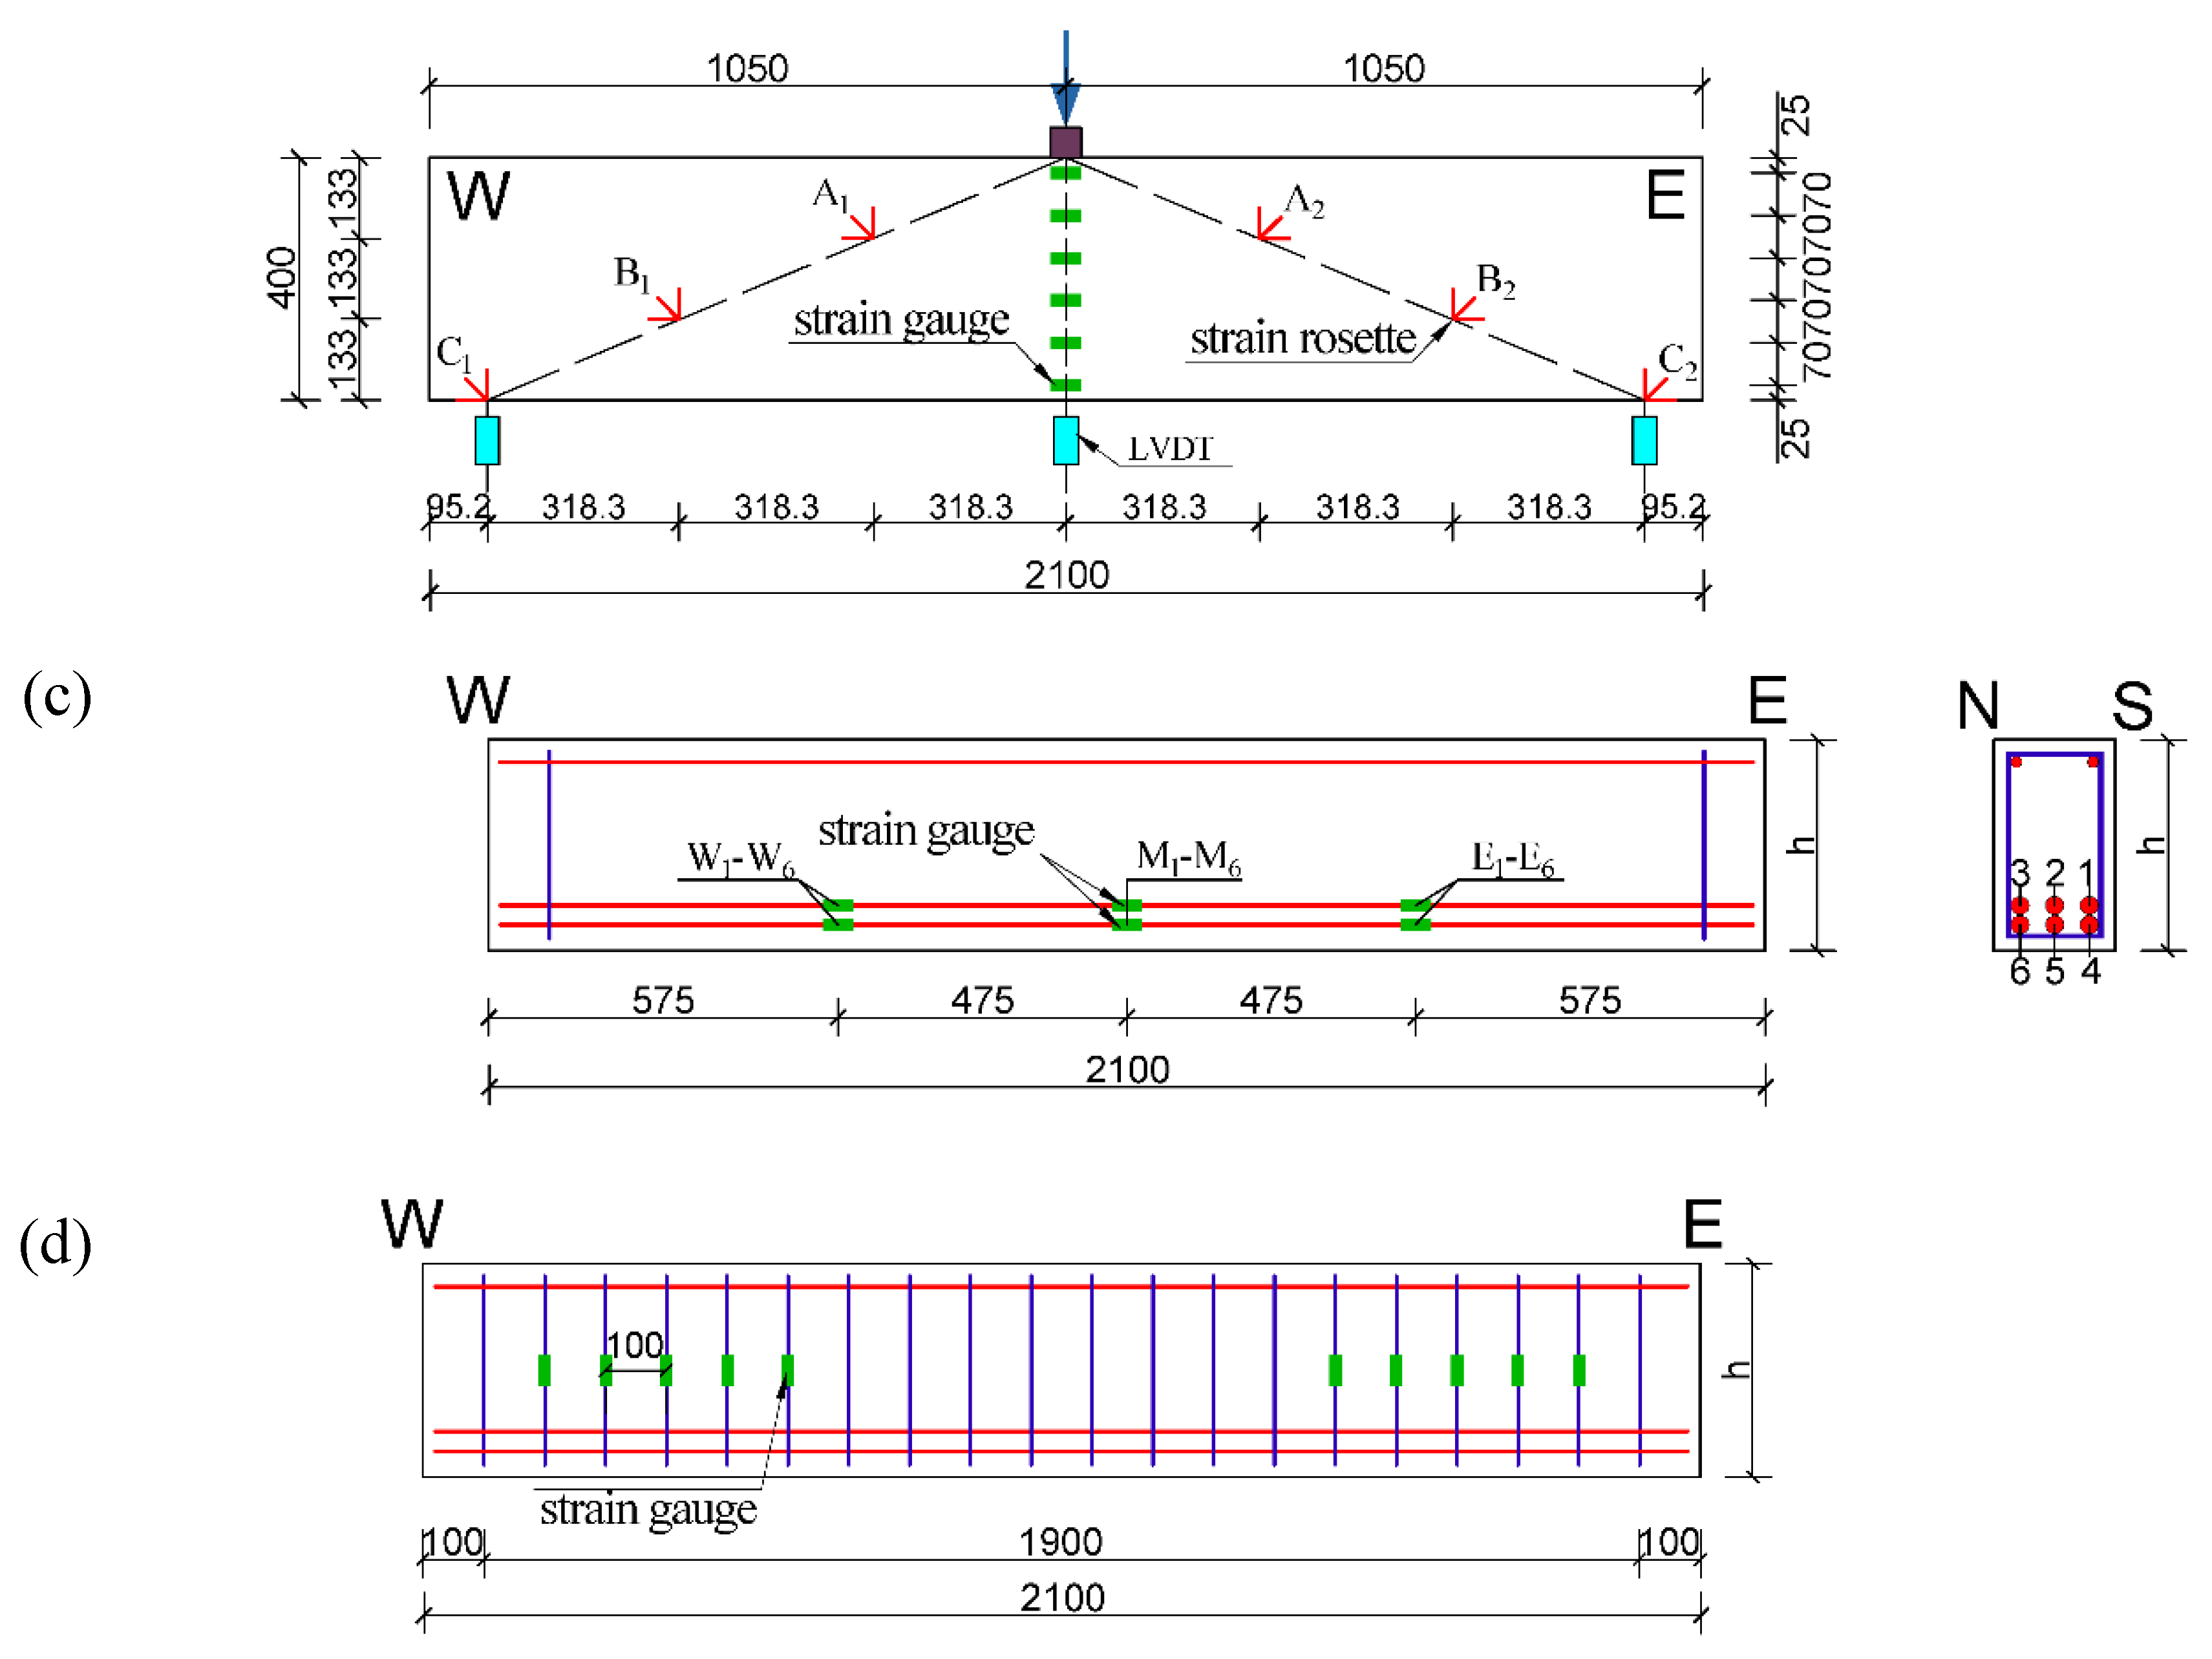
As shown in Figure 3, three-point loading tests were carried out on each specimen to evaluate the shear behavior of the non-stirrup UHPC beams. The specimens were subjected to vertical concentrated load using an electro-hydraulic servo machine with a capacity of 10,000kN. Each specimen was supported by two roller supports. Three Linear Vertical Displacement Transducers (LVDTs) were employed to monitor the deflections of the tested beams, which were positioned at the midspan of each beam and the locations of the roller supports, respectively. Figure 4 shows six groups of strain rosettes labelled A1 to C1 and A2 to C2 from top to bottom, were evenly spaced along the line extending from the loading point to the supports. Each strain rosette consisted of three strain gauges set at 0°, 45°, and 90°, which were adopted to measure the principal strains. The strains in the longitudinal reinforcements and stirrups were measured by the strain gauges attached to the steel rebars. At the gauge of the rebars, the steel rebars were sanded smooth to facilitate the application of the strain gauges. The strain gauges were also protected with waterproof adhesive and anti-collision block gine. Thereinto, the longitudinal reinforcements were labelled 1-3 and 4-6 from the south side to the north side of double layer reinforcements, respectively, as shown in Figure 4c. The letters “N” and “S” indicate north and south, respectively. The strain gauges attached to the longitudinal reinforcements were labelled W1-W6, M1-M6, and E1-E6 from the west side to the east side. The letters “W”, “M” and “E” indicate west, middle and east, respectively. All the data were collected using the JMTEST static collector, including load force, longitudinal reinforcement strain, stirrup strain, concrete strain, and beam deflection. The detail of the layout of the strains and LVDTs can be seen in Figure 4.
The loading protocol comprises two phases: force-controlled phases and displacement-controlled phases. Before the shear diagonal cracks emerged, the loading was force controlled with an internal force of 50 kN. After that, the displacement-controlled phase was carried out at a loading rate of 0.1 mm/min. When the load was reduced to 60% of the maximum load after peaks, the test was terminated.

2.3. Material Properties

The UHPC mixture used in this study was provided by Zhonglu Dura International Engineering Co. Ltd., which was the same as the mixture used by Feng et al. [42]. The mechanical properties of the UHPC mixtures were tested, including cubic compressive strength, axial compressive strength, splitting tensile strength, flexural tensile strength.
According to French Standard NF P18-710 [44], the tested value of post-cracking strength is given by:
σ f 1 = 1 w * 0 w * σ f ( w ) d w
The post cracking strength considering a fiber orientation factor ( K ) is calculated by:
σ f 2 = σ f 1 K
The post-cracking strength for design is obtained from:
σ f 3 = σ f 1 K γ c f
where the post-cracking stress σ f ( w ) is determined based on the crack opening w . The study chose a maximum crack width ( w * ) of 0.3 mm, a fiber orientation factor of 1.25 ( K ), and a partial safety factor ( γ c f ) of 1.3, based on the recommended values of the French standard NF P 18-470 [44].
As per the PCI report [45], the post-cracking residual strength f r r is taken as the first peak cracking value, which is determined by:
f r r = 0.375 f f u
where f f u is flexural tensile strength.
In accordance with Xu’s formula [46], the axial compressive strength f c was determined from 300 mm × 100 mm × 100 mm prisms. The additional information on the properties of the UHPC used are listed in Table 2. As listed in Table 2, it is noteworthy that the ultimate flexural strength ( f f u ) were affected by unknown reasons, which lead to the f f u of UHPC-2.0 was lower than the f f u of UHPC-1.5.
Table 3 presents the test results for the mechanical properties of the stirrups and longitudinal reinforcements. The evaluation was conducted using an electro-hydraulic servo machine.

3. Experimental Results and Observation

3.1. Crack Patterns and Shear Failure Modes

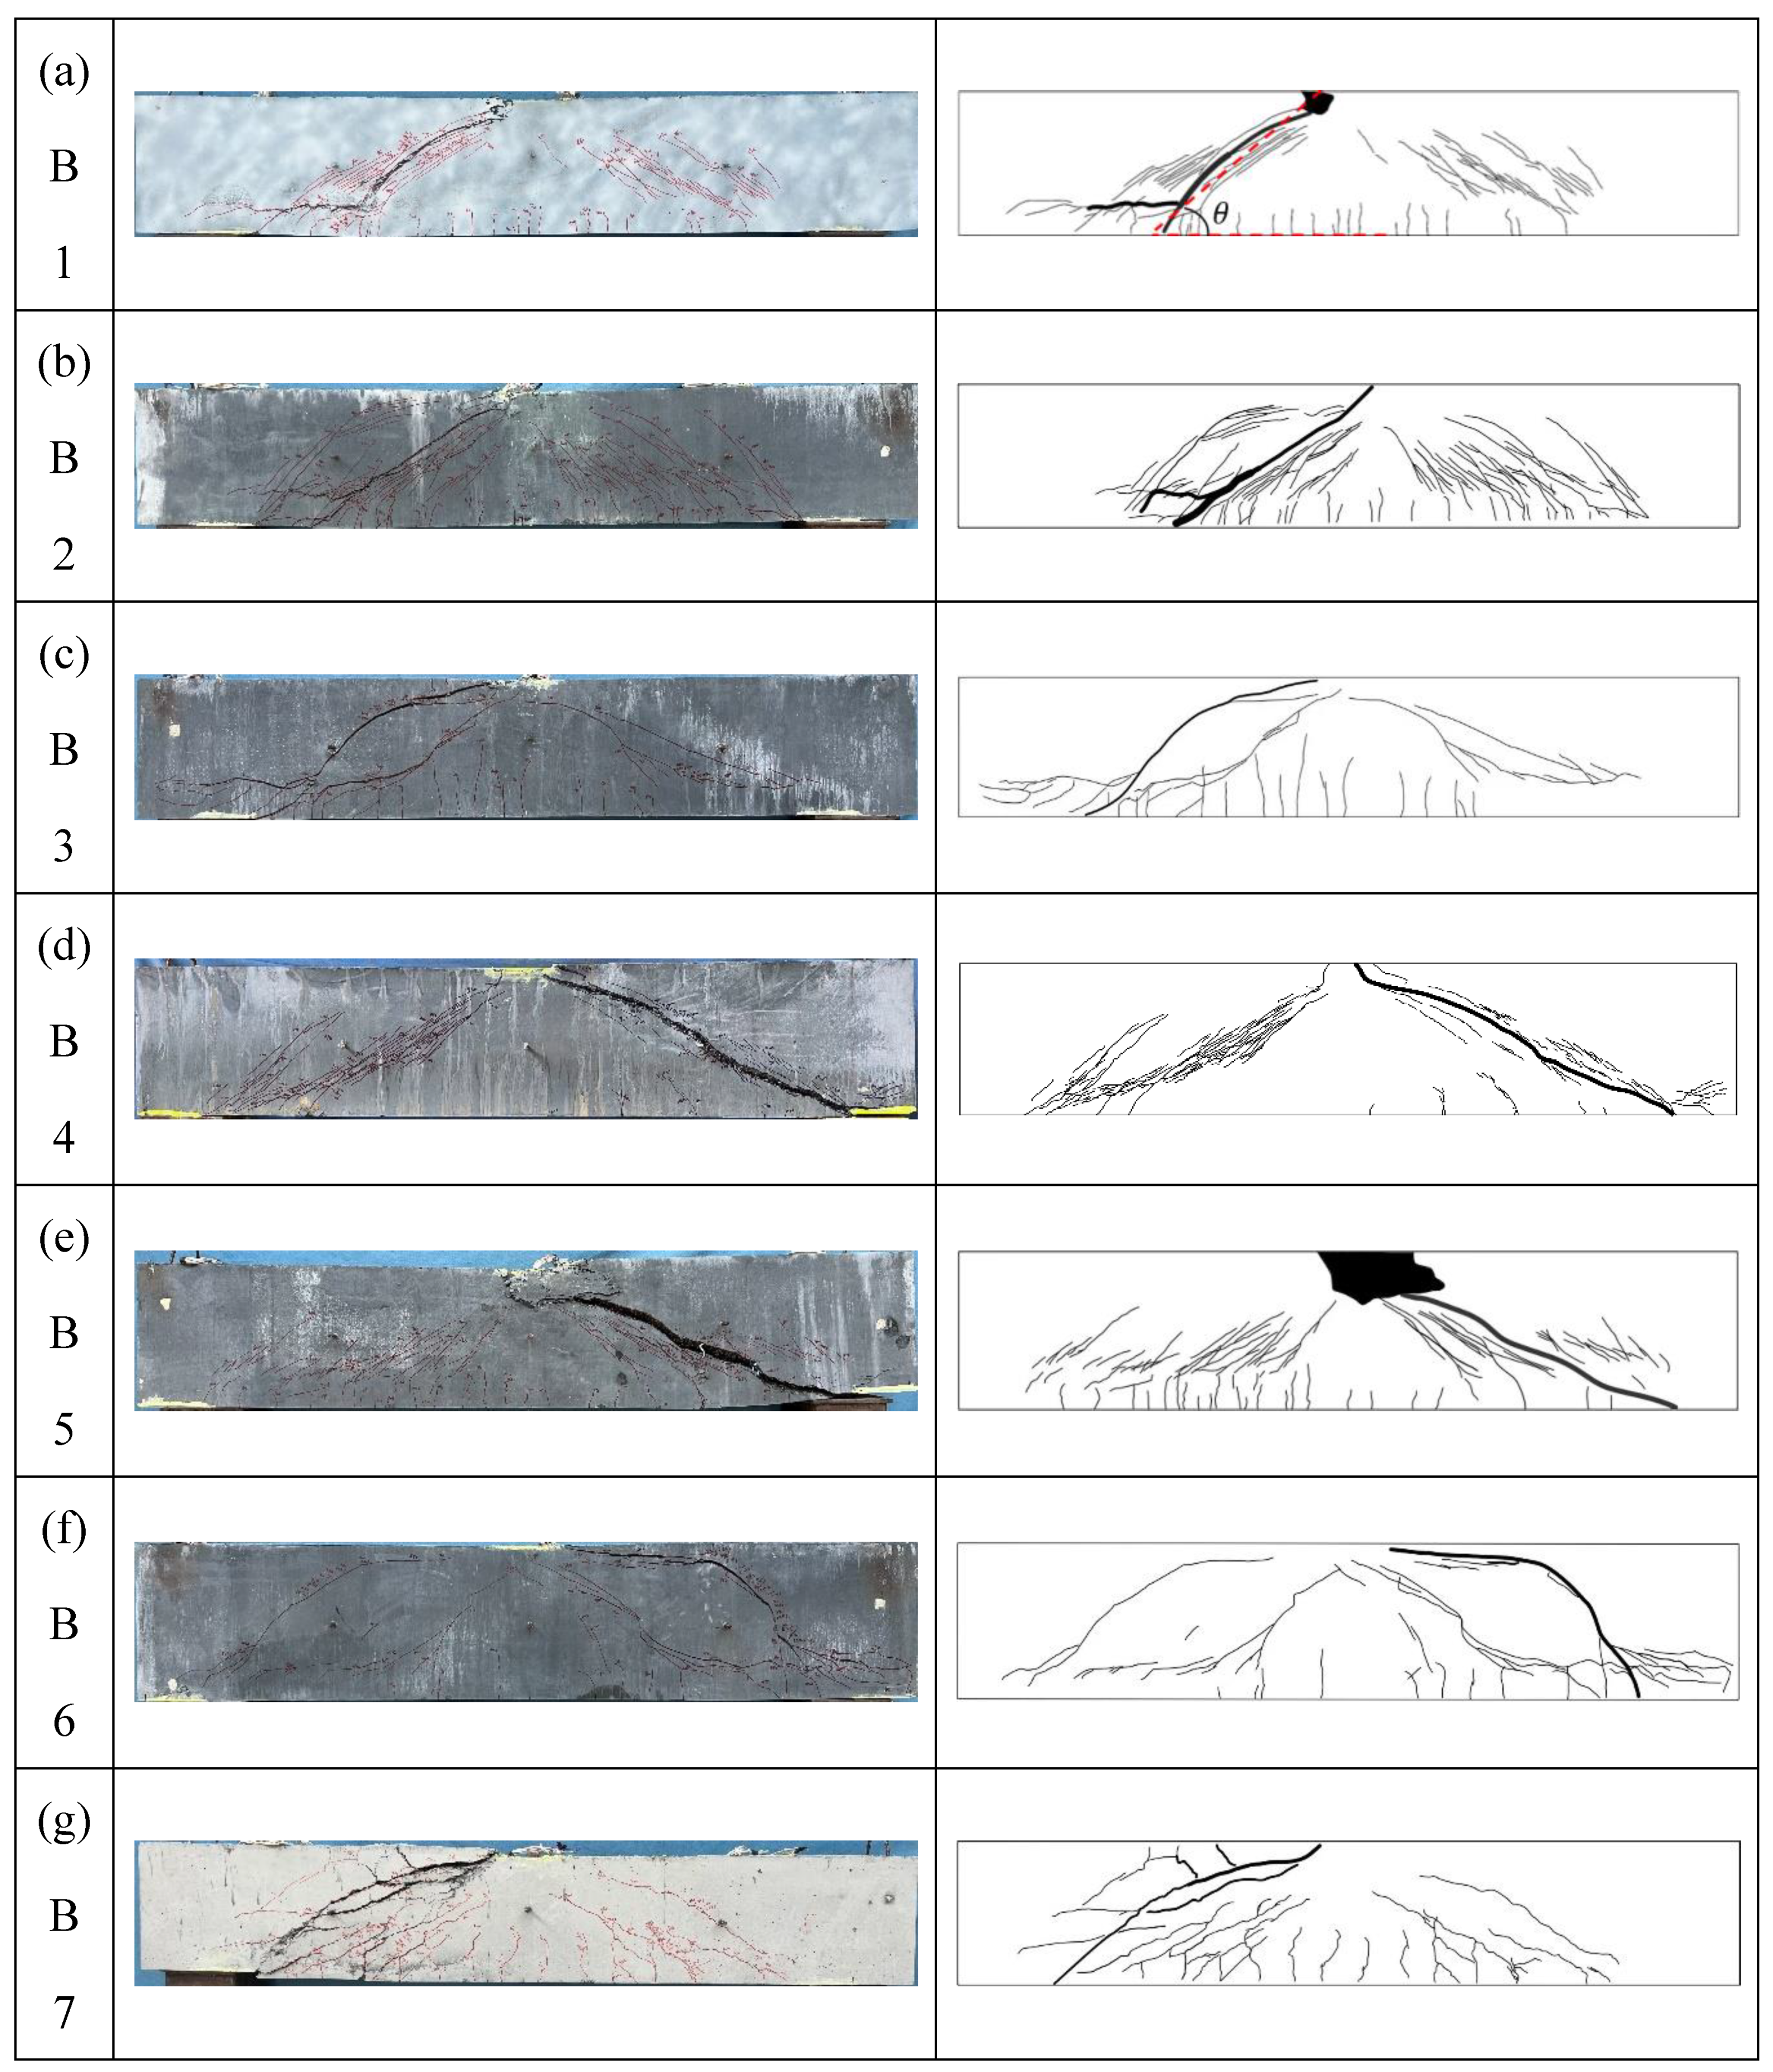
All of the tested beams exhibited shear failures, namely diagonal tension failure (DT), shear compression failure (SC), and diagonal compression failure (DC), which are known as the typical types of shear failures, as shown in Figure 5. The failure modes and crack patterns of all tested beams are depicted in Figure 6. The critical cracks were visually represented by thick block lines, while the areas of severe concrete damage were expressed as black bolded areas. For the stirrup-reinforced NC beams, DC failure occurred. For non-stirrup UHPC beams without steel fibers, there were DT failure. And for non-stirrup UHPC beams with steel fibers, SC failure emerged.
Specimens B1, B2, B4 and B5 exhibited typical shear compression failure patterns. At the beginning of loading, flexural cracks appeared at the bottom of the tested beams. As the load approached approximately 35-55% of the ultimate load, the number of flexural cracks stopped increasing, and the existing flexural cracks gradually extended towards the loading point. Diagonal cracks emerged when the load reached approximately 31-61%. Under increasing load, new diagonal cracks appeared and eventually a critical diagonal crack developed, which extended towards the loading point. When the ultimate load was reached, the concrete near to the loading point was crushed.
For specimens B3 (Figure 6c) and B6 (Figure 6f), as soon as the diagonal cracks appeared in the shear span, the crack width rapidly increased and soon developed into critical diagonal cracks. Eventually, the two beams suddenly lost their load-bearing capacity and split in two, with flat failure surfaces and no concrete crushing. Therefore, it can be concluded that diagonal tension failure occurred at B3 and B6.
For specimens B7 (Figure 6g) and B8 (Figure 6h), few cracks were observed until the load reached 40% of the ultimate load. As the load increased, several parallel diagonal cracks appeared, dividing the web of the beams into several inclined compression columns. After reaching the ultimate load, the tested beams were suddenly damaged. It can be concluded that the shear failure mode of B7 and B8 was diagonal compression damage.
It is specially noted that beams B1, B2, B4 and B5 exhibited flexural failure due to the longitudinal rebar yielding, concomitantly emerged shear compression failure.

3.2. Load-Displacement Relationships

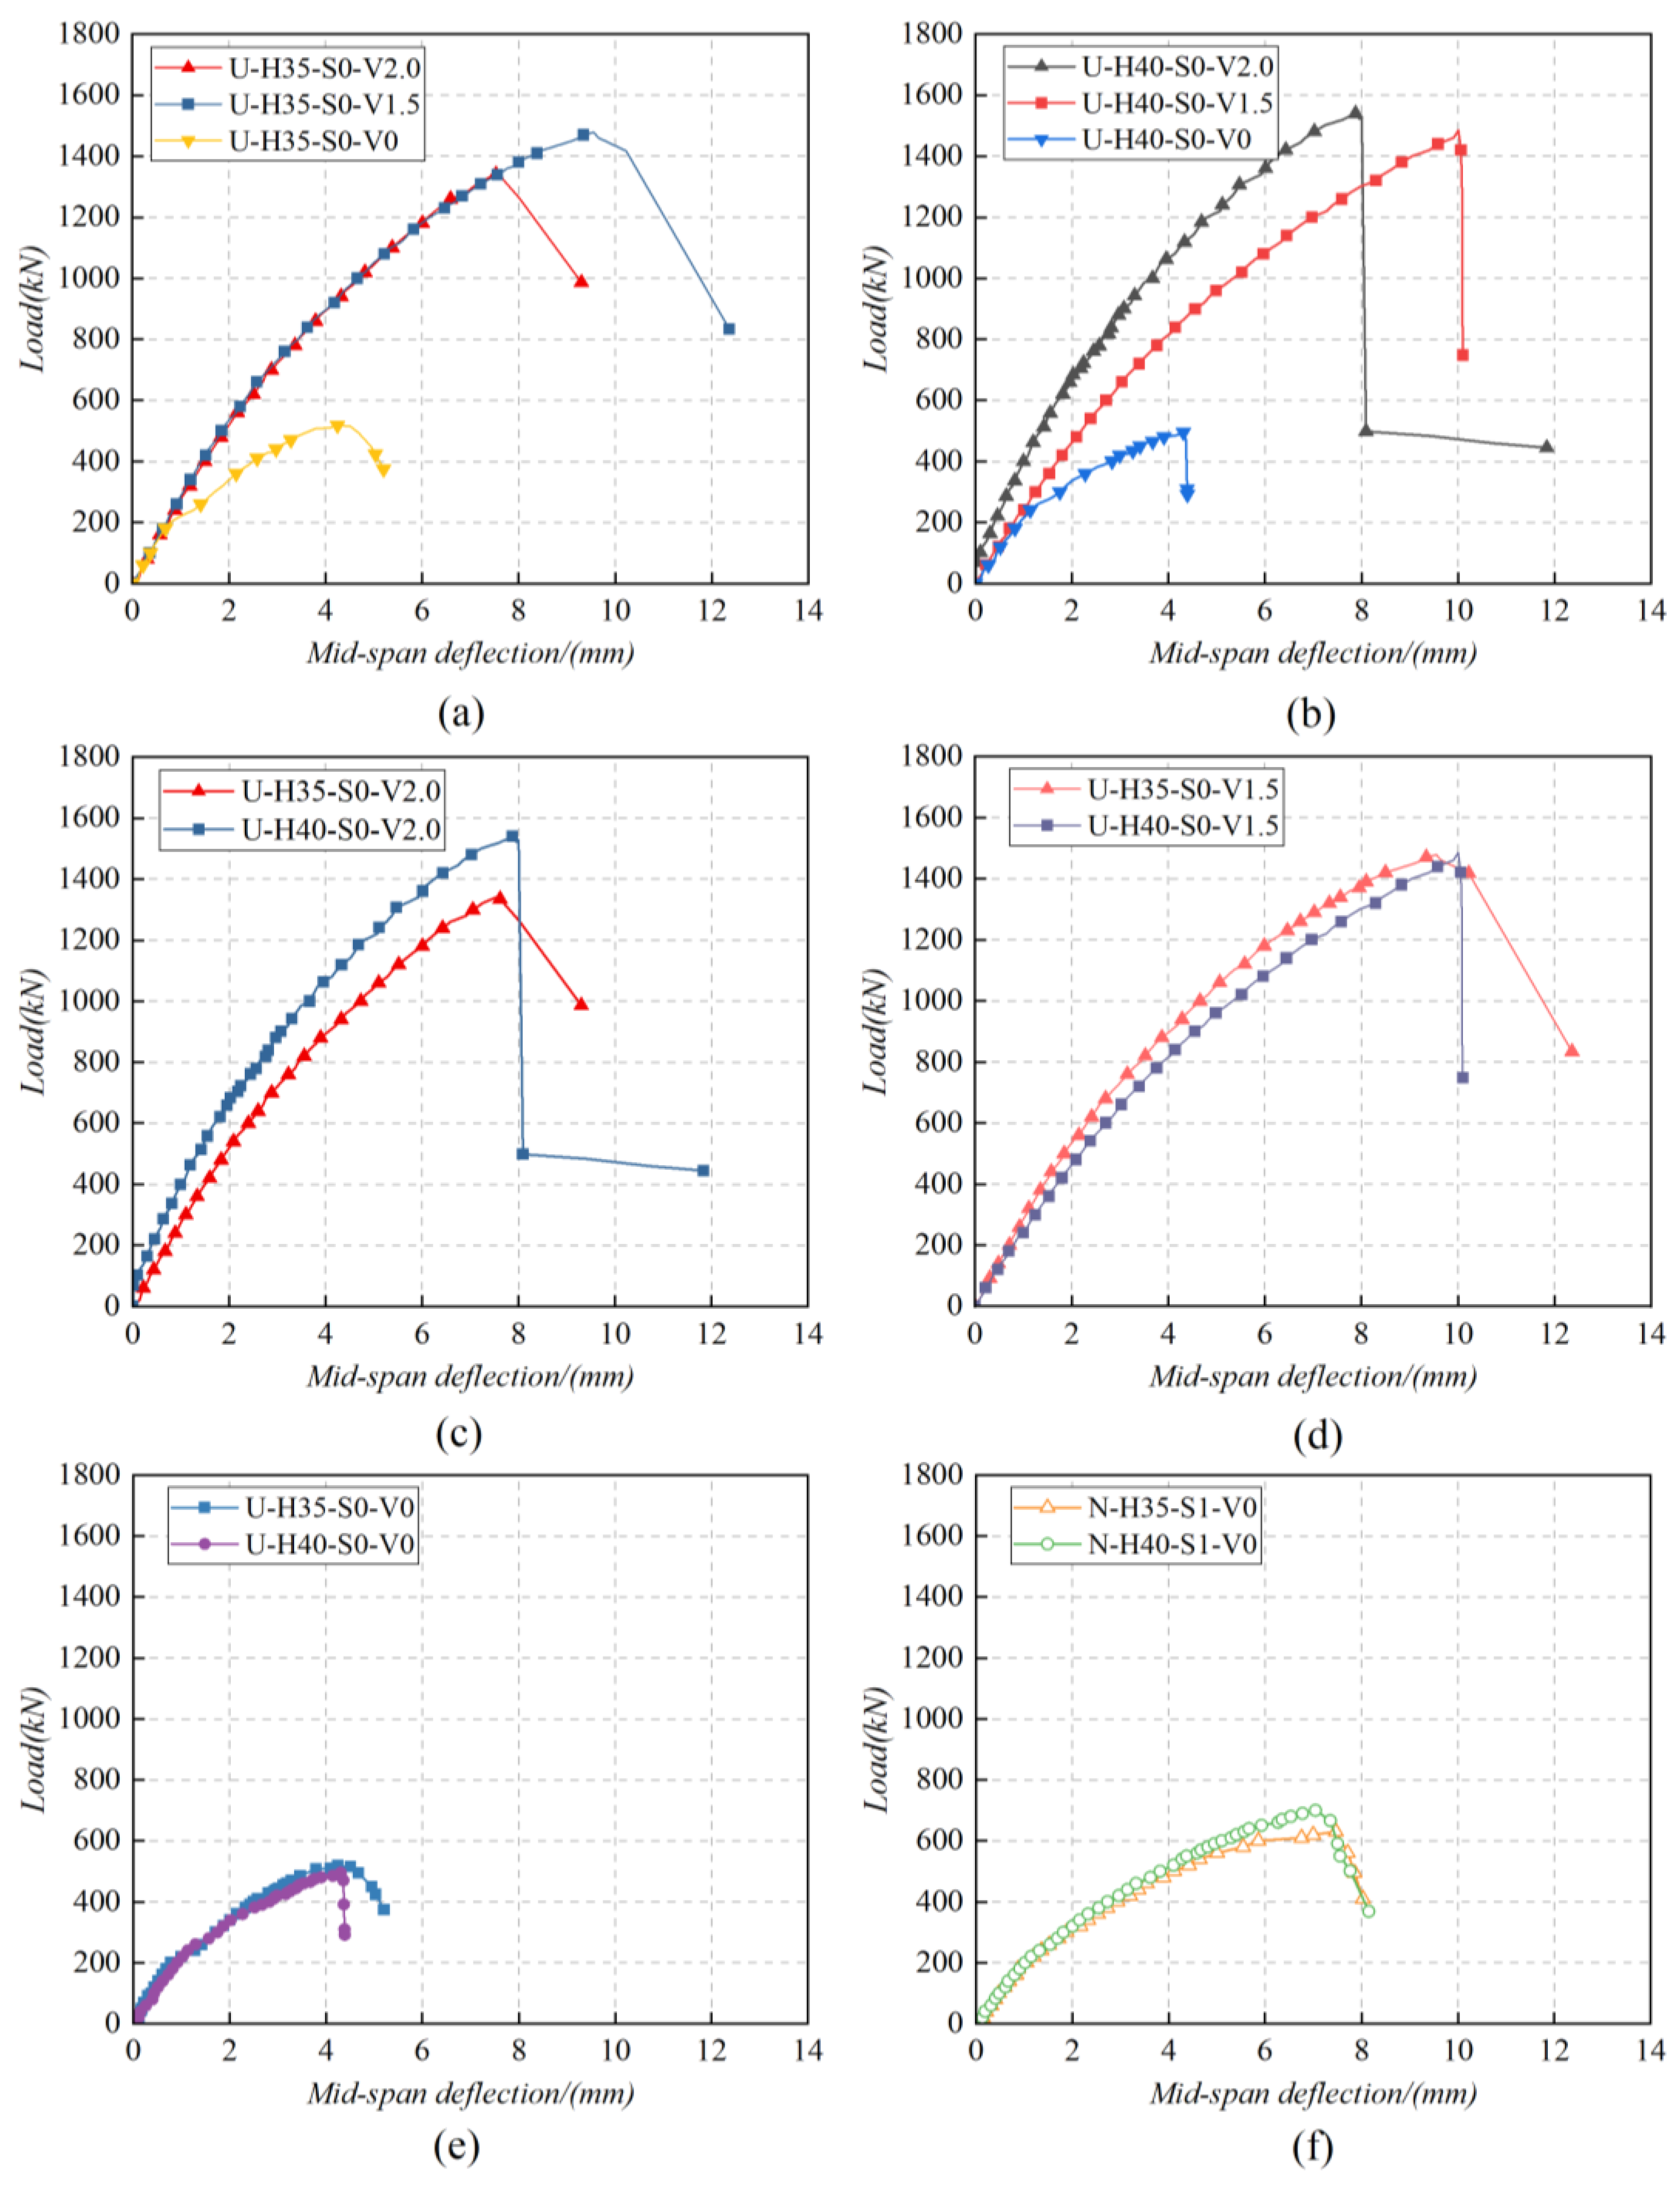
Figure 7 displays the load-mid span deflection curves for all of the tested beams, presenting the results for specimens with different beam heights and steel fiber volume contents. As depicted in Figure 7, the load-midspan deflection curves of the specimens all exhibited a non-linear growth initially, followed by a sudden drop after reaching the ultimate load. No significant yielding phase was observed. It is important to note that the midspan deflections of the ultimate load ( Δ u ) for U-H35-S0-V2.0 and U-H40-S0-V2.0 beams were reduced by 21.2% and 21.3%, respectively, compared to U-H35-S0-V1.5 and U-H40-S0-V1.5 beams, as shown in Figure 7a-b. These results suggest that the ductility of non-stirrup UHPC beams can be improved by appropriately reducing the volume content of steel fibers.

3.3. Strain Response

3.3.1. Strain Response of Longitudinal Reinforcements

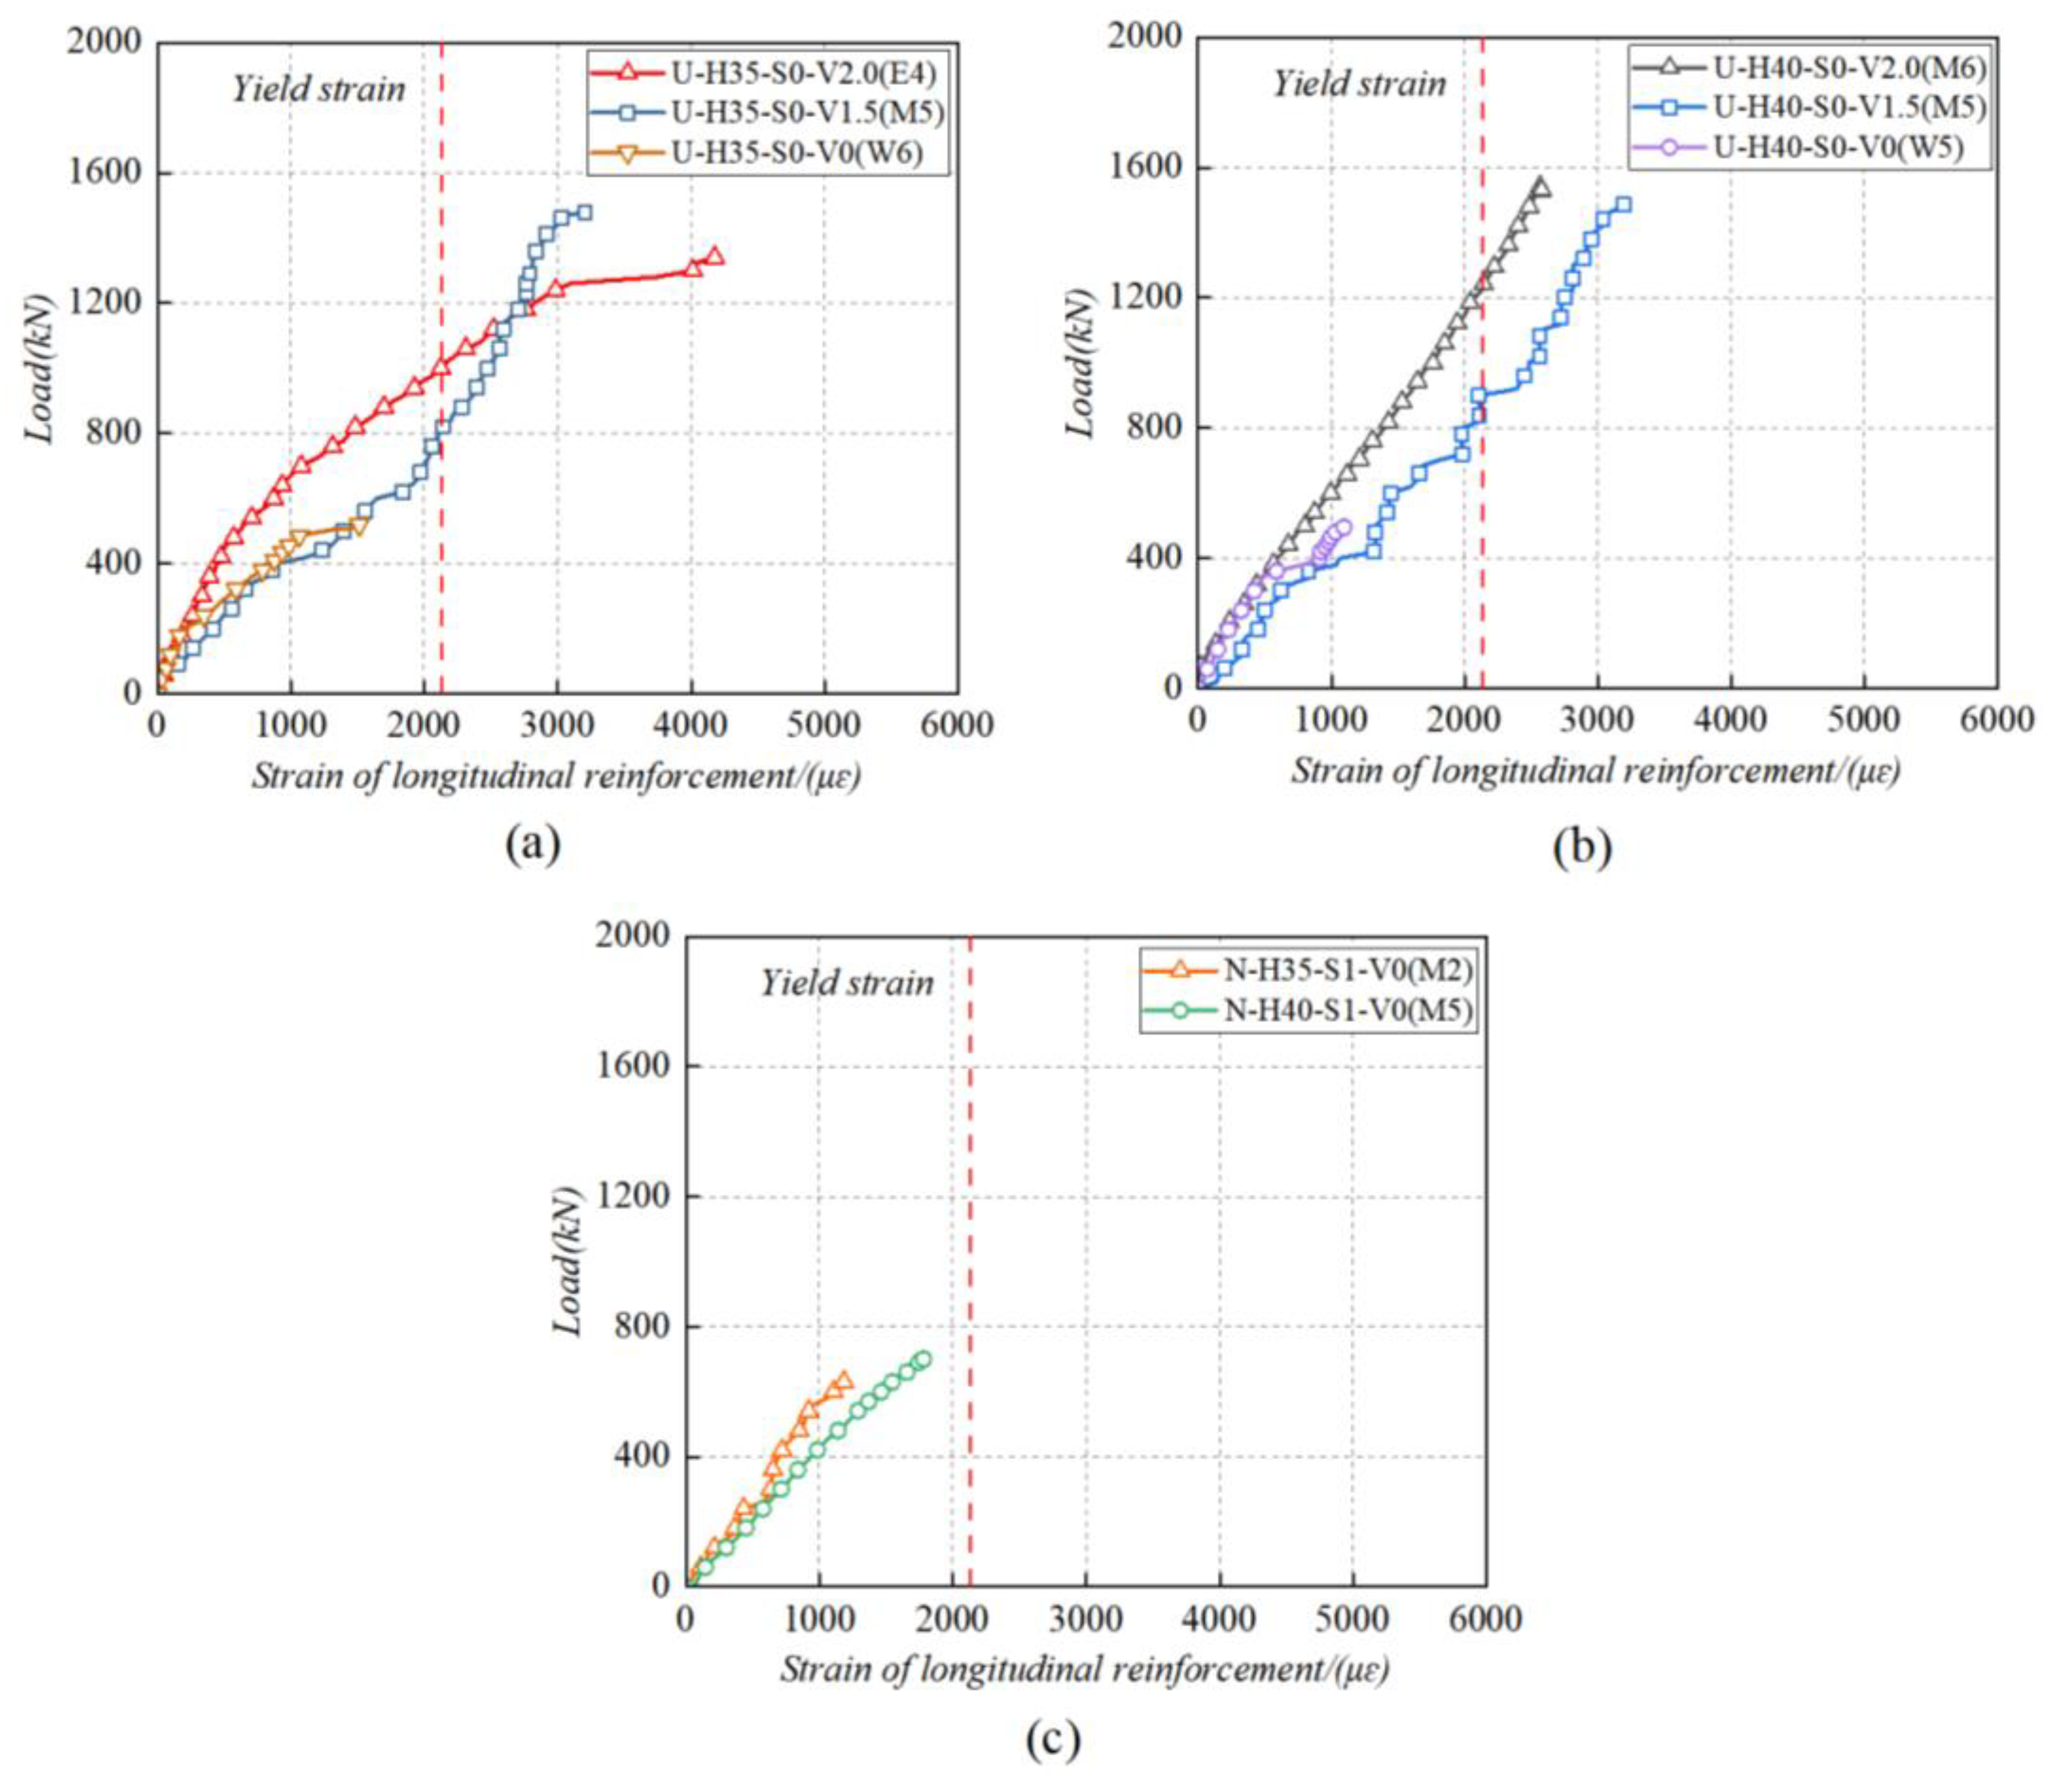
The load-strain relationships of the longitudinal reinforcement for U-H35-S0-V*, U-H40-S0-V* and N-H*-S1-V0 beams are demonstrated in Figure 8a-c. Some of the strain gauges adhered to the longitudinal reinforcements were inadvertently damaged at the start of the tests due to their susceptibility to damage in the concrete. In these cases, a suitable strain gauge was selected from the pre-embedded strain gauges to evaluate the strains of the longitudinal reinforcements. The details were presented in the label of Figure 8. The yield strength and elastic modulus of reinforcement were assumed as 419.2 MPa and 2.0 × 10⁵ MPa. Therefore, the yield strain of the longitudinal reinforcements was approximately 2096 µε, which was also marked as vertical dashed line.
Figure 8 (a-b) show that the longitudinal reinforcement strains for B1 and B2 as well as B4 and B5 reached the yield strain before the ultimate load was reached. However, the longitudinal reinforcement strains for B3 and B6 were far from yielding when reaching the ultimate load, indicating that the lack of steel fibers caused them to quickly fail far from the bending failure after diagonal cracks emerged. It is important to note that as the load increased, the longitudinal reinforcement strains of beams B1, B2, B4 and B5 significantly exceeded the yielded strain, indicating that these beams may have experienced flexural failure. This could be the reason for the abnormal load-bearing capacity of beams B1, B2, B4 and B5 compared to their normal shear capacity. In Figure 8c, the longitudinal reinforcements for B7 and B8 also hadn’t yielded when the ultimate load was reached. For beams U-H35-S0-V2.0 and U-H40-S0-V2.0 beams, the loads at which the longitudinal reinforcements yielded increased by up to 22.0% and 37.9%, respectively, compared to beams U-H35-S0-V1.5 and U-H40-S0-V1.5. From these findings, it can be inferred that the incorporation of steel fibers had definitely improved the strength of UHPC and that steel fibers could carry the load synergistically with longitudinal reinforcements. In addition, increasing the volume content of steel fiber within a certain range is conducive to enhancing the load-bearing capacity.

3.3.2. Strain Response of Stirrups

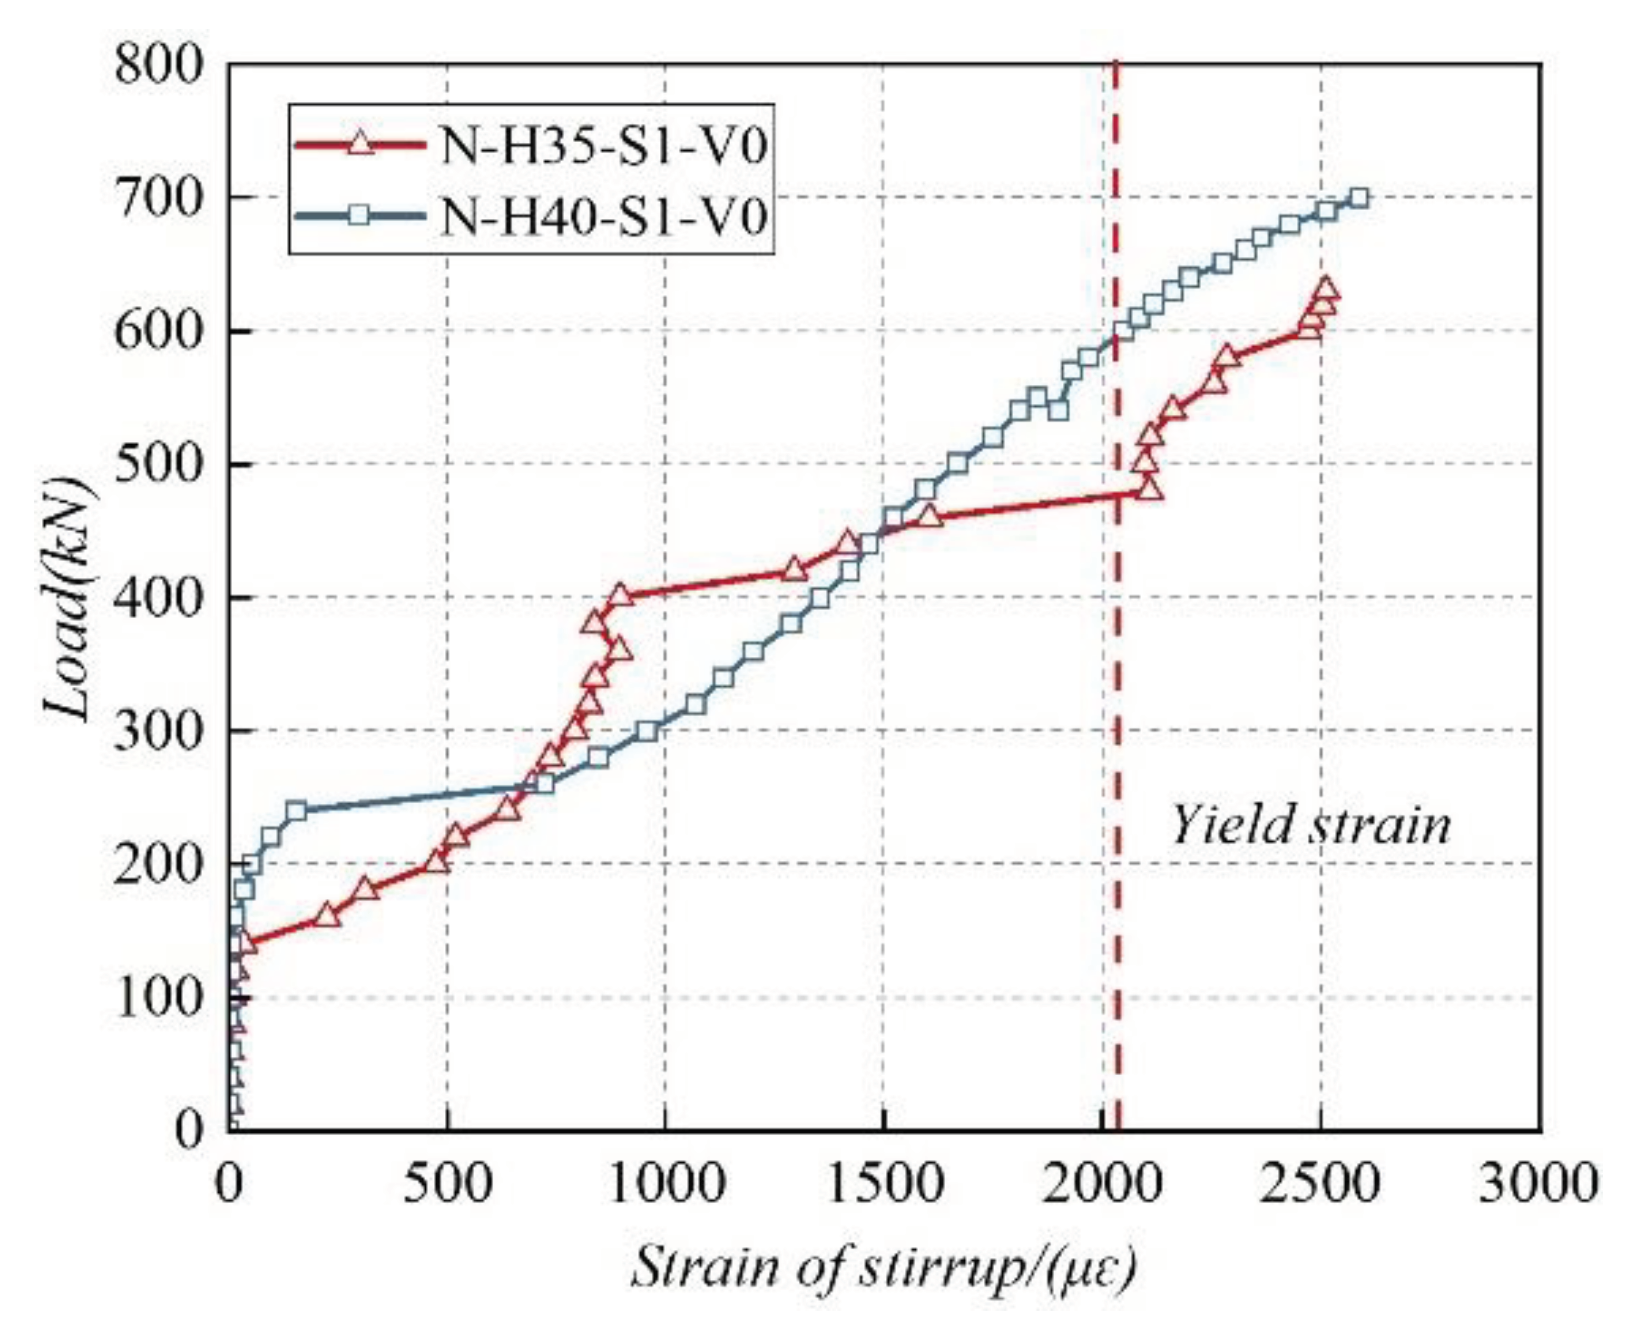
The load-strain relationships of the stirrups for beams N-H35-S1-V0 (B7) and N-H40-S1-V0 (B8) are shown in Figure 9. The yield strength and elastic modulus of stirrup were assumed as 412 MPa and 2.0 × 10⁵ MPa. Therefore, the yield strain of the longitudinal reinforcements was approximately 2060 µε, which was also marked as vertical dashed line. As can be seen, the strain of the stirrups in B7 and B8 had increased slightly with the increase in load before the diagonal cracks emerged. As soon as the diagonal cracks passed through the shear-bending section, the strain of the stirrups showed a turning point and as the load improved, the strain of the stirrups gradually increased and finally exceeded the yield strain. The experimental results presented in Figure 9 suggest that the stirrups experienced minimal stress prior to the onset of the diagonal cracks. After the diagonal cracks traversed the shear-bending section, the concrete in the section lost much of its tensile strength, and the stirrups took over the responsibility of carrying the tensile stress, which was the reason why the strain of the stirrups surged after the appearance of the diagonal cracks. Furthermore, it is evident that the stirrups in both B7 and B8 yielded before the beams reached their ultimate loads. This suggests that the stirrups were fully utilized in resisting the shear force.

3.3.3. Strain Response of Concrete Diagonal Sections

The principal tensile strains ε t and principal compression strains ε c were calculated by Equation (1), where ε x , ε 45 ° and ε y , and were the strains of strain gauges set at 0 ° , 45 ° , and 90 ° . The positive calculation results indicate the principal tensile strain, and vice versa for the principal compressive strain.
ε t ε c = ε x + ε y 2 ± ε x ε y 2 2 + ε x + ε y 2 ε 45 ° 2
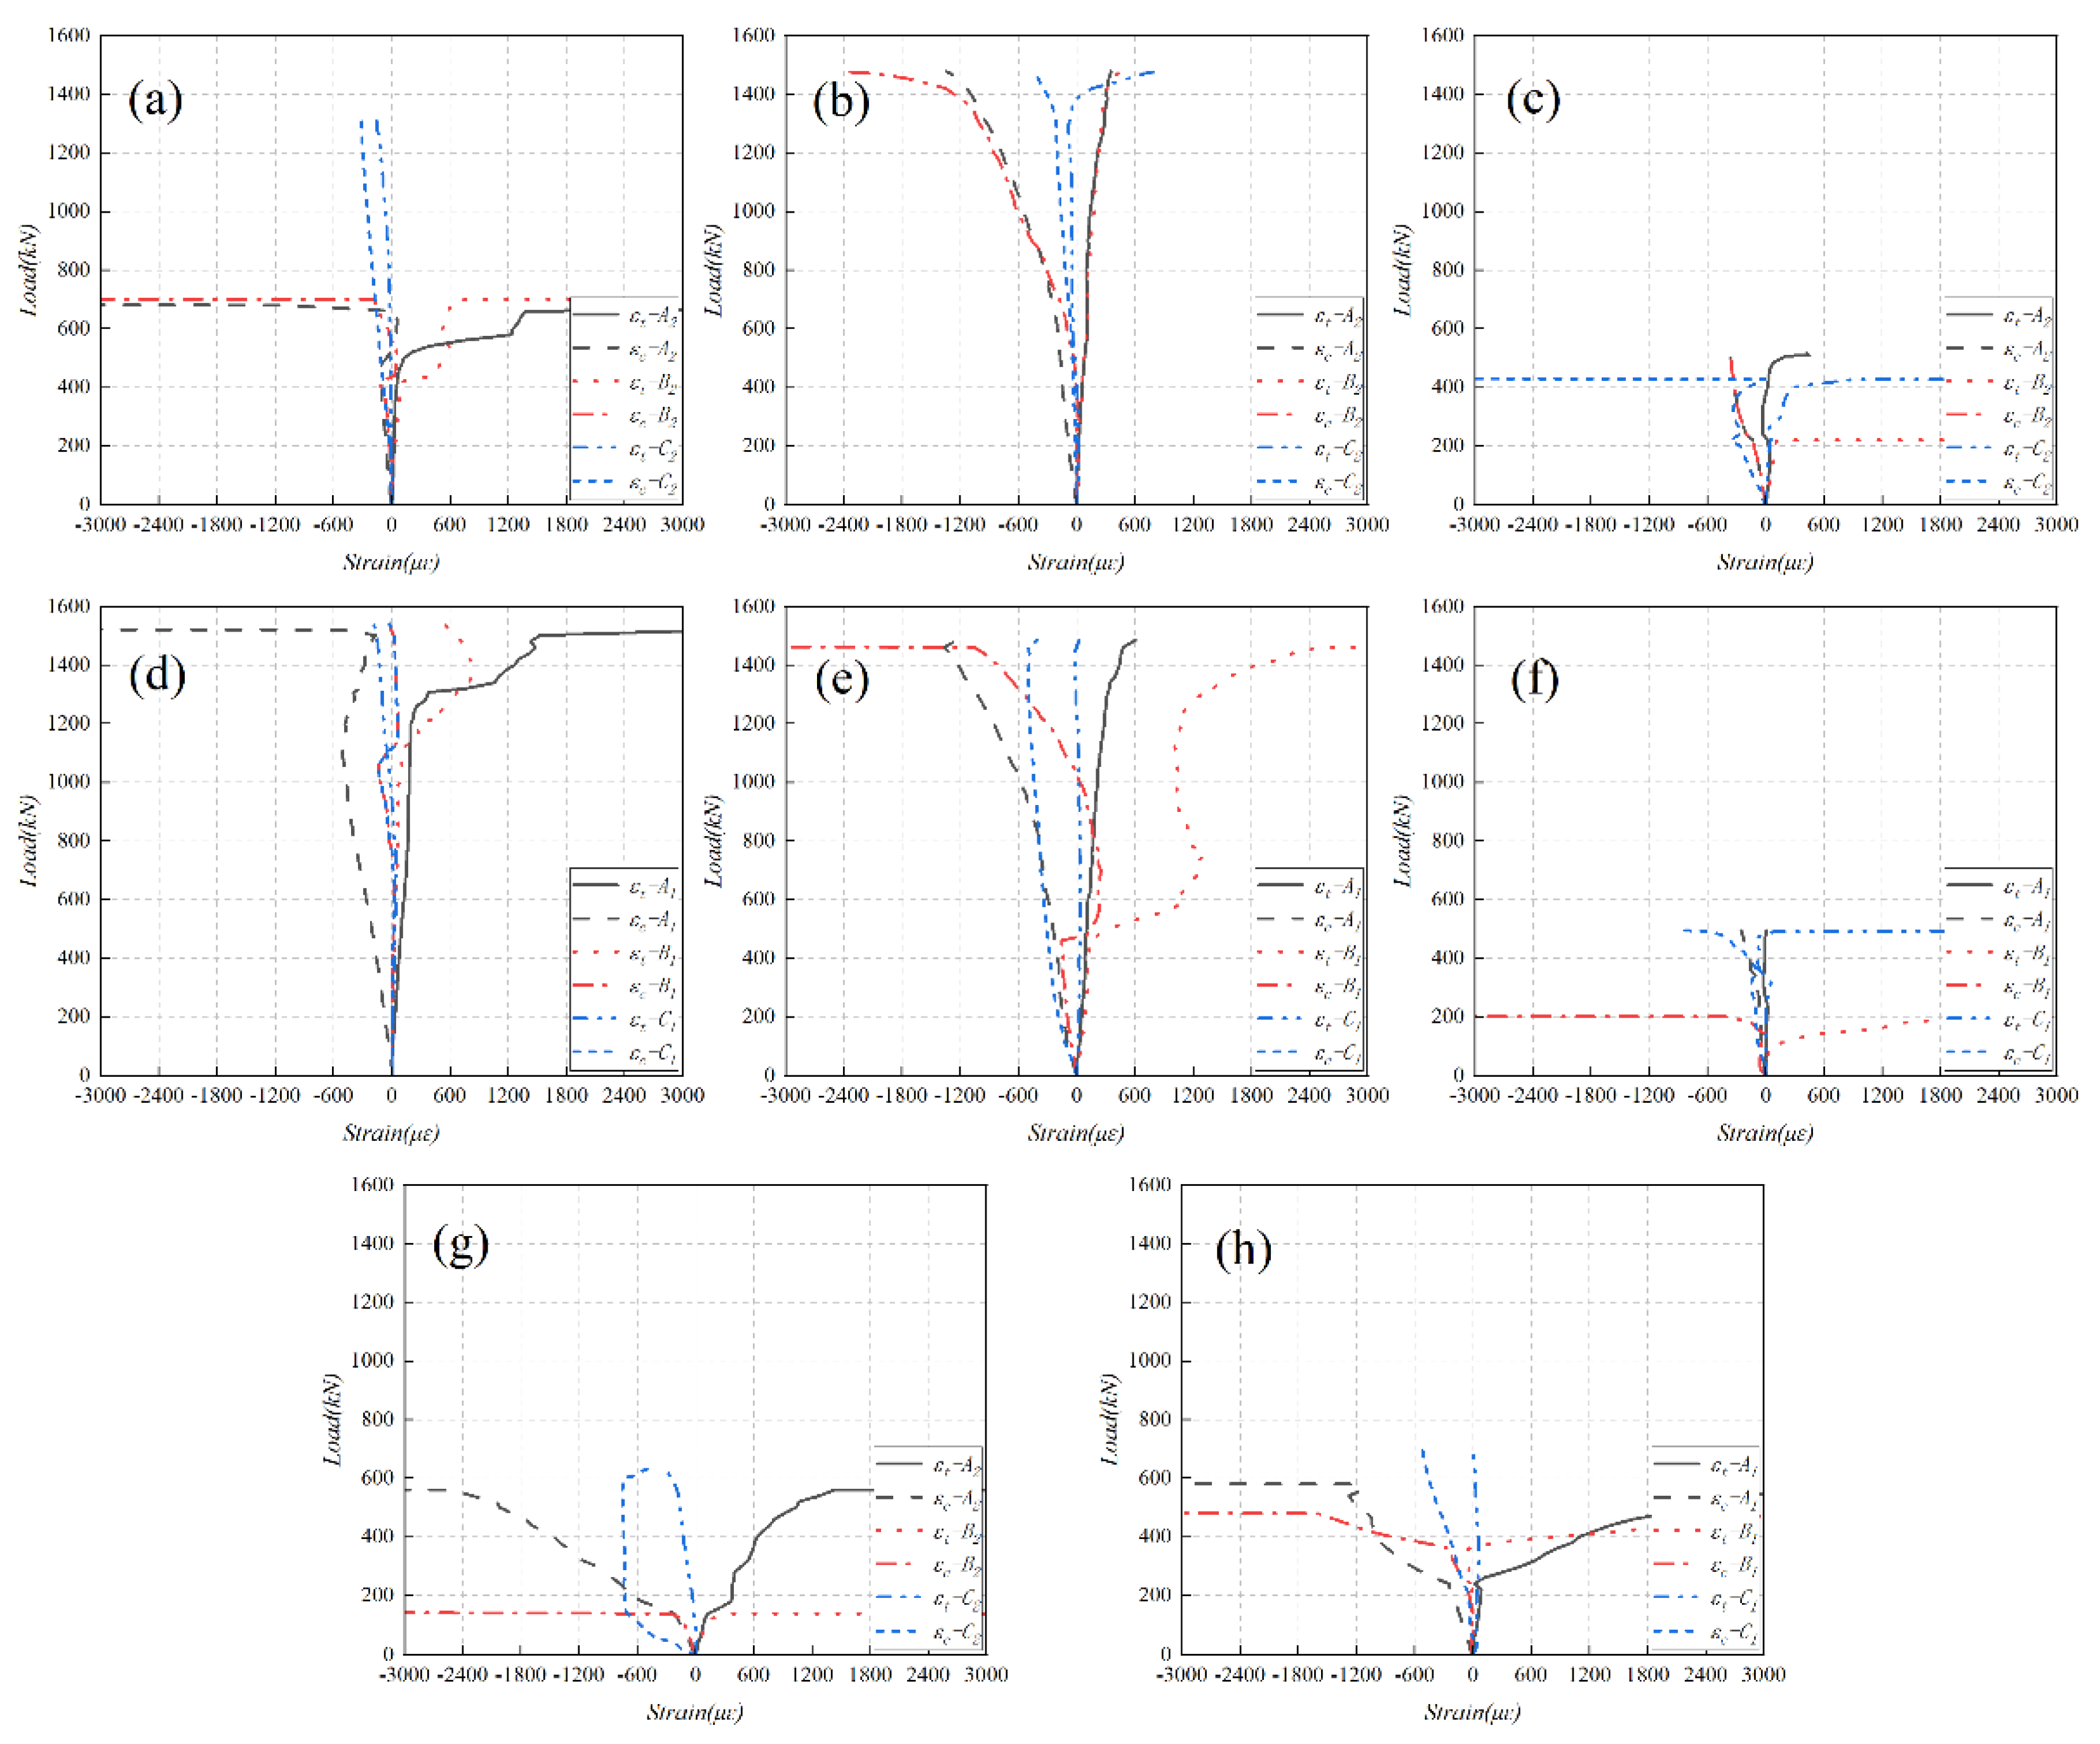
Figure 10 shows the load-principal strain relationships for all the tested beams at different measurement points on the diagonal section on the failure side. As shown in Figure 10, before the diagonal cracks passed through these strain rosettes, the principal strains in the shear-bending section increased linearly with the improvement of load. Generally, once the diagonal cracks appeared on the web section of the beams, the principal tensile strains exhibited sudden increase. Due to the development of diagonal cracks, the stresses in the shear-bending section were redistributed, resulting in irregular variations of the principal strains. It is important to note that the principal tensile strains from the section of strain rosettes A*to B* showed more significant changes than the section of strain rosettes C*. This indicates that the concrete of the web section of the tested beams experienced more significant tensile stresses than the concrete near the support. Figure 10g-h shows that the principal strains of the normal concrete beams had more pronounced variations than those of the UHPC beams. This suggests that the excellent tensile property of UHPC can effectively prevent the concrete cracking.

3.4. Post-Cracking Shear Resistance

The post-cracking shear resistances (PCSR) of the tested beams are determined by Equation (2), which indicates the load-bearing capacity of the tested beams after the onset of the first shear diagonal crack.
P S C R = V u V c i V u × 100 %
Table 4 lists the calculated values of all the tested beams. The average value of PSCR for U-H*-S0-V2.0 beams, U-H*-S0-V1.5 beams, U-H*-S0-V0 beams, and N-H*-S1-V0 beams were 56.5%, 64.5%, 44.5%, and 58.5%, respectively.

4. Discussion and Analysis of Experimental Results

4.1. Failure Modes and Crack Patterns

4.1.1. Effect of Beam Height on Failure Modes and Crack Patterns

Table 4 lists the initial diagonal crack load ( P c i ) and the corresponding cracking strength ( v c i ). Increasing the beam height (h) could effectively improve the diagonal cracking strength ( v c i ). As the h increased from 350 mm to 400 mm, the v c i could be increased by up to 16.7% (U-H*-S0-V2.0), 30.4% (U-H*-S0-V1.5), 14.5% (U-H*-S0-V0) and 11.9% (N-H*-S1-V0). However, it should be noted that the ultimate shear strength τ u of non-stirrup UHPC beams decreased by 2.0% (U-H*-S0-V2.0), 16.6% (U-H*-S0-V1.5), and 22.9% (U-H*-S0-V0), as the h increased from 350 mm to 400 mm.

4.1.2. Effect of Steel Fibers on Failure Modes and Crack Patterns

As shown in Figure 6a-f, the volume content of steel fibers can influence the failure modes of UHPC beams. For example, by comparing the B1, B2 and B3, as well as the B4, B5 and B6 with the same beam height, respectively, due to the lack of the bridging action of steel fibers, specimens B3 and B6 quickly lost their load-bearing capacity and failed suddenly. However, the steel fiber reinforced specimens B1, B2, B4 and B5 retained their excellent ductility. The test results confirmed the role of steel fibers in improving the shear resistance of non-stirrup UHPC beams, which is in accordance with the experimental results of Li et al. [43].
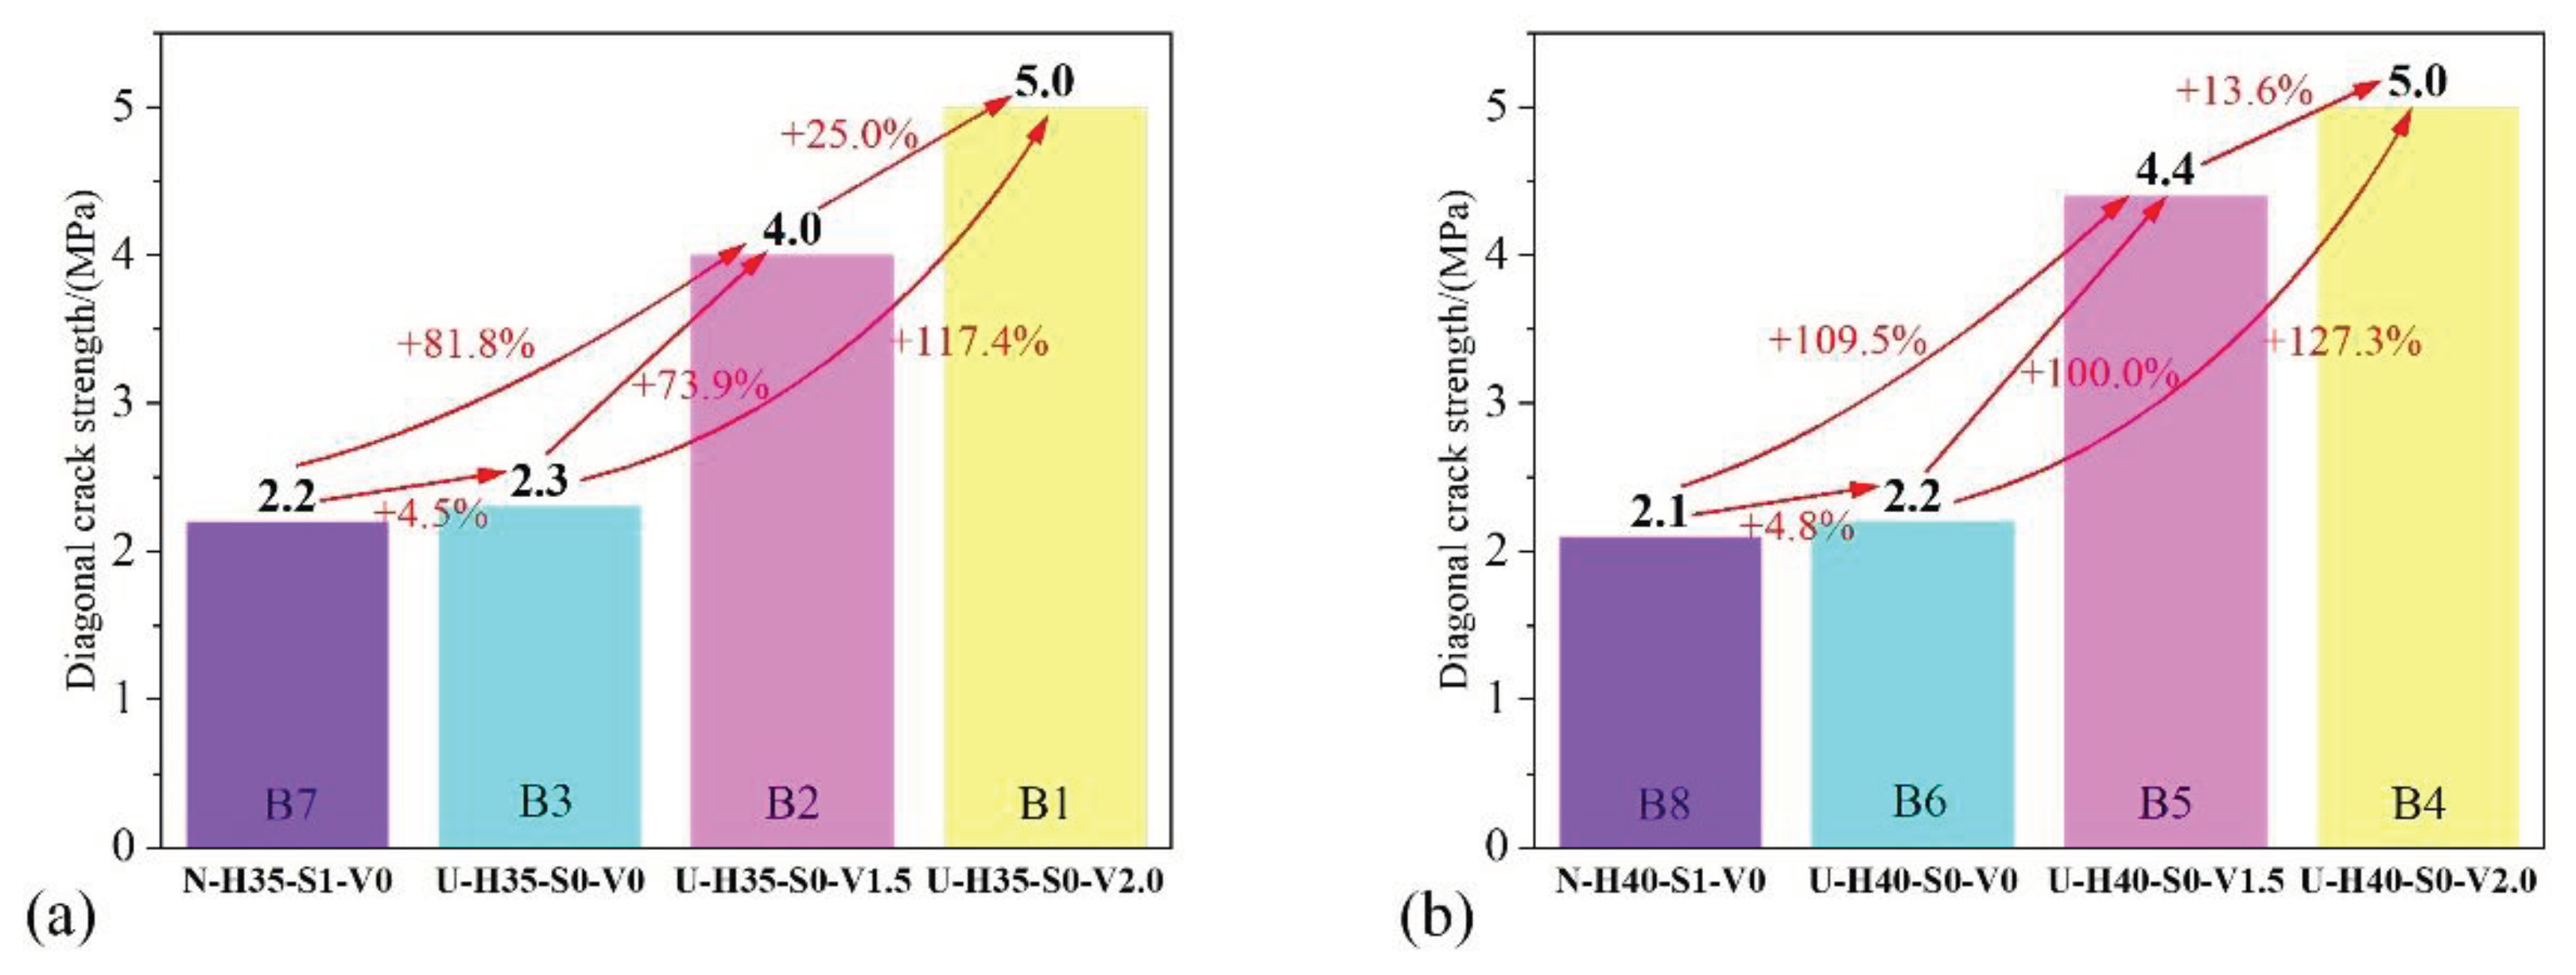
Table 4 shows a positive correlation between the volume content of steel fiber and diagonal crack strength. In U-H35-S0-V1.5(2.0) and U-H40-S0-V1.5(2.0) beams, the diagonal crack strength could be increased by up to 81.8%, 127.3%, 109.5% and 138.1% respectively, compared to N-H35-S1-V0 and N-H40-S1-V0 beams. Compared to U-H35-S1-V0 and U-H40-S1-V0 beams, the incorporation of steel fibers significantly improved the diagonal cracking strength by 73.9%, 117.4%, 100.0%, and 127.3%, respectively. In U-H35-S0-V2.0 and U-H40-S0-V2.0 beams, the diagonal crack strength was increased by up to 25.0% and 13.6%, respectively, compared to U-H35-S0-V1.5 and U-H40-S0-V1.5 beams. The details of the effect of steel fibers on the diagonal cracking strength are shown in Figure 11. From the results, it can be inferred that the incorporation of steel fiber is conducive to delaying the appearance of diagonal cracks, and increasing the volume content of steel fiber within a certain range is beneficial to improving the diagonal cracking strength.

4.2. Post-Cracking Shear Resistance

The calculated values of PSCR listed in Table 4 suggest that U-H*-S0-V2.0 (1.5) beams performed comparable PSCR as N-H*-S1-V0 beams. Additionally, in U-H*-S0-V2.0 beams, the PSCR reduced by 8% compared to U-H*-S0-V1.5 beams. In U-H*-S0-V0 beams, the PSCR reduced by 14% compared to N-H*-S1-V0 beams. This indicates that U-H*-S0-V0 beams cannot achieve comparable PSCR to N-H*-S1-V0 beams. In U-H35-S0-V* beams, the PSCR increased by 13.5% compared to U-H40-S0-V* beams. Basing on the results presented above, it can be concluded that the incorporation of steel fibers provides the non-stirrup UHPC beams with comparable PSCR to the NC beams. By reducing the volume content of steel fibers to a certain extent, the PSCR of the non-stirrup UHPC beams can be increased to a certain extent. In addition, the PSCR increases as the beam height is reduced.

5. Shear Design Recommendations for UHPC Beams

5.1. French Standard Formulae

According to the French standard NF P 18-710-2016 [44], the shear capacity of UHPC beams is determined by three constitutive factors, namely the contributions of the UHPC matrix   V c , the stirrups V s , and the steel fibres V f . Accordingly, the expression for is the shear capacity V u 1 :
V u 1 = V c + V S + V f
The shear load capacity is partly determined by the properties of the UHPC matrix V c , which can be described as
V c = 0.21 γ c f γ E k 1 f c u b h 0
where the comprehensive safety factor γ c f γ E is set at 1.0 here. The prestressing improvement factor k 1 is equal to 1.0 as no prestressing was applied to the tested beams in this study. The variables f c u , b , and h 0 represent the cubic compressive strength, web thickness, and effective depth of UHPC, respectively.
The shear load capacity by stirrups V s is calculated using the following equation:
V s = A s v s z f y s cot θ
where A s v represents the cross-sectional area of the stirrups used, s represents the spacing of the stirrups, z is calculated as   z = 0.9 h 0 to determine the lever arm of internal forces, f y s represents the yielding strength of the stirrup, and θ represents the angle between the beam axis and the critical shear diagonal crack with the values listed in Table 4. It is assumed that non-stirrup UHPC beams have zero shear contribution from stirrups.
The equation for calculating the contribution of steel fibers ( V f ) is as follows:
V f = A b σ f 1 cot θ
where A b represents the effective cross-sectional area of the beam and takes the value of b z in this paper. σ f 1   represents the post-cracking strength with values listed in Table 4.

5.2. PCI-2021 Formulae

According to the PCI-2021 report [45], the shear load capacity of UHPC beams can be divided into three resistive mechanisms: the tensile strength of UHPC V c f , the contribution of effective prestressing force V p   acting in the direction of applied shear, and the resistance offered by shear reinforcement V s . Thus, the shear load capacity V u 2 can be calculated as follows:
V u 2 = V c f + V s + V p
V c f = 4 f r r 3 b z cot θ
V s = A s v f y s z cot θ s
θ = 29 ° + 3500 ε s
where the values for longitudinal strain ε s confinement are limited to under 0.40 × 10 3 compressive stress and 6.0 × 10 3 under tensile stress, which, respectively, correspond to an angle of 27.6 ° and 50.0 ° . To ensure the consistency with reality, θ = 40 ° is taken in this paper. The residual tensile strength ( f r r ) is listed in Table 3. In this paper, the test UHPC beam did not have any prestressing tendons or stirrups, therefore V p and V s were taken as zero.

5.3. Xu’s Formulae

Xu’s formulae [46] provide empirical equations for the shear load capacity of UHPC beams, taking into account the influence of prestressing force, steel fibers, and shear span-to-depth ratio. Therefore, the shear load capacity V u 3 of UHPC beams can be determined using these equations:
V u 3 = V c + V s + V f
V c = k 2 ( 2 λ 0.7 0.8 ) f c b h 0
V s = ( 0.18 + 0.35 λ ) ρ s f y s b h 0
V f = ( 0.99 0.12 λ ) λ f t b h 0
f t = 0.0353 f c
where ρ s is stirrup ratio. When λ < 1.5 , λ is set to 1.5, and when λ > 3.0 ,   λ is set to 3.0. The variable k 2   represents the prestressing enhancement factor. For UHPC beams that are not prestressed, k 2 equals 1.0, whereas for prestressed UHPC beams, its value is 1.25. Due to the absence of stirrup reinforcement in UHPC beams, it is assumed that the corresponding shear contribution from the stirrups is negligible.

5.4. Comparison of Calculated Values

Table 6 presents the calculated values of shear capacity V u 1 (French Standard formulae), V u 2 (PCI-2021 formulae), and V u 3 (Xu’s formulae), along with the corresponding ratios V u 1 / V u , t e s t , V u 2 / V u , t e s t , and V u 3 / V u , t e s t of the calculated shear capacity to the experimental shear capacity. The calculated values of shear capacity displayed in Table 5 are all in units of kN.
For the French standard formulae, the ratio V u 1 / V u , t e s t ranged from 0.51 to 1.44, with a mean of 0.91, an STDEV of 0.30, and a coefficient of variation of 0.33. Comparison with Li et al.’s [40] experimental findings suggests that the formulae were more accurate for the UHPC beams with larger shear span-depth ratios.
The ratios of V u 2 / V u , t e s t for the PCI-2021 formulae ranged from 1.25 to 1.77, with an average of 1.47, an STDEV of 0.17, and a coefficient of variation of 0.12. It is discovered that the calculated values of the PCI-2021 formulae were about 1.5 times the tested results. This demonstrates that the PCI-2021 formulae greatly overestimate the shear capacity of UHPC beams with larger shear span-depth ratios. Additionally, this phenomenon was more apparent when the beam height is 400mm.
For the Xu’s formulae, the ratio V u 3 / V u , t e s t ranged from 0.33 to 1.14, with an average of 0.81, an STDEV of 0.31, and a coefficient of variation of 0.39. It is found that the Xu’s formulae significantly underestimate the shear capacity of non steel fiber-reinforced UHPC beams. Comparison with Li et al.’s [40] experimental findings indicates that Xu’s formulae are more accurate for the UHPC beams with larger shear span-depth ratios. Moreover, they are more accurate for predicting the shear capacity of steel fiber-reinforced UHPC beams rather than non steel fiber-reinforced UHPC beams.
The comparison of calculated values obtained from the three formulae demonstrates that the French standard formulae are more accurate for the UHPC beams with larger shear span-depth ratios. PCI-2021 formulae greatly overestimate the shear capacity of UHPC beams with larger shear span-depth ratios. Xu’s formulae are more accurate for the steel fiber-reinforced UHPC beams with larger shear span-depth ratios. In summary, French standard formulae are the most suitable formulae for predicting the shear capacity of UHPC beams in this paper.

6. Conclusions

The shear behavior of both non-stirrup UHPC beams and stirrup-reinforced NC beams under larger shear span-depth ratios, subjected to a three-point loading, was investigated in this study, and the following conclusions can be drawn:
(1)
The failure modes of all eight tested beams were shear failures. For stirrup-reinforced NC beams, specimens N-H35-S1-V0 and N-H40-S1-V0 all failed by diagonal compression. For non-stirrup UHPC beams, specimens U-H35-S0-V2.0 (1.5) and U-H40-S0-V2.0 (1.5) exhibited typical shear compression failure mode, while specimens U-H35-S0-V0 and U-H40-S0-V0 failed in diagonal tensile mode. Steel fibers are a crucial factor that affects the failure mode of non-stirrup UHPC beams. They can effectively enhance the crack resistance of the beam.
(2)
As the beam height increased from 350 mm to 400 mm, the diagonal cracking strength v c i could be increased by up to 16.7% (U-H*-S0-V2.0), 30.4% (U-H*-S0-V1.5), 14.5% (U-H*-S0-V0) and 11.9% (N-H*-S1-V0). Increasing the beam height can effectively improve the diagonal cracking strength. The incorporation of steel fiber is conducive to delaying the appearance of diagonal cracks, and increasing the volume content of steel fiber within a certain range is beneficial to improving the diagonal cracking strength.
(3)
The midspan deflections of the ultimate load ( Δ u ) for U-H35-S0-V2.0 and U-H40-S0-V2.0 beams were reduced by 21.2% and 21.3%, respectively, compared to U-H35-S0-V1.5 and U-H40-S0-V1.5 beams. These results suggest that the ductility of non-stirrup UHPC beams can be improve by appropriately reducing the volume content of steel fibers.
(4)
The longitudinal reinforcements in U-H35-S0-V2.0 (1.5) and U-H40-S0-V2.0 (1.5) beams were fully utilized in resisting the shear force, which had yielded before the beams reaching their ultimate shear strength. The stirrups in N-H35-S1-V0 and N-H40-S1-V0 beams yielded before the beams reaching their ultimate shear strength, which suggests that the stirrups were fully utilized in bearing shear force. The concrete of the web section of the tested beams experienced more significant tensile stresses than the concrete near the support. The principal strains of the normal concrete beams had more pronounced variations than those of the UHPC beams
(5)
The ultimate shear strength τ u of non-stirrup UHPC beams decreased by 2.0% (U-H*-S0-V2.0), 16.6% (U-H*-S0-V1.5), and 22.9% (U-H*-S0-V0), as the beam height increased from 350 mm to 400 mm.
(6)
The PSCR increases as the beam height is reduced. By reducing the volume content of steel fibers to a certain extent, the PSCR of the non-stirrup UHPC beams can be increased to a certain extent.
(7)
The French standard formulae were more accurate for the UHPC beams with larger shear span-depth ratios. PCI-2021 formulae greatly overestimate the shear capacity of UHPC beams with larger shear span-depth ratios. Xu’s formulae are more accurate for the steel fiber-reinforced UHPC beams with larger shear span-depth ratios. French standard formulae are the most suitable formulae for predicting the shear capacity of UHPC beams in this paper.

Patents

Not applicable.

Supplementary Materials

Not applicable.

Author Contributions

Conceptualization, H.J. and Y.T.; methodology, L.Z., J.X. and H.J.; software, L.Z. and B.D.; validation, L.Z., B.D. and H.J.; formal analysis, L.Z. and B.H.; investigation, H.J., L.Z. and B.H.; resources, H.J.; data curation, L.Z.; writing—original draft preparation, L.Z. and B.D.; writing—review and editing, L.Z. and H.J.; visualization, L.Z; supervision, J.F. and H.J.; project administration, H.J.; funding acquisition, H.J. All authors have read and agreed to the published version of the manuscript.

Funding

This research was funded by the National Natural Science Foundation of China with the grant number of 51778150 and 52208156.

Data Availability Statement

Not applicable.

Acknowledgments

Funding for the research presented in this paper was provided by the National Natural Science Foundation of China (51778150), and the authors would like to acknowledge their generous support.

Conflicts of Interest

The authors declare no conflict of interest.

References

  1. Wille K, Naaman A E, Parra-Montesinos G J. Ultra-High Performance Concrete with Compressive Strength Exceeding 150 MPa (22 ksi): A Simpler Way. ACI materials journal, 2011, 108.
  2. Habel, K.; Viviani, M.; Denarié, E.; Brühwiler, E. Development of the mechanical properties of an Ultra-High Performance Fiber Reinforced Concrete (UHPFRC). Cem. Concr. Res. 2006, 36, 1362–1370. [Google Scholar] [CrossRef]
  3. Meng, Q.; Wu, C.; Li, J.; Liu, Z.; Wu, P.; Yang, Y.; Wang, Z. Steel/basalt rebar reinforced Ultra-High Performance Concrete components against methane-air explosion loads. Compos. Part B: Eng. 2020, 198, 108215. [Google Scholar] [CrossRef]
  4. Fang, H.; Gu, M.; Zhang, S.; Jiang, H.; Fang, Z.; Hu, J. Effects of Steel Fiber and Specimen Geometric Dimensions on the Mechanical Properties of Ultra-High-Performance Concrete. Materials 2022, 15, 3027. [Google Scholar] [CrossRef] [PubMed]
  5. Cuenca, E.; Postolachi, V.; Ferrara, L. Cellulose nanofibers to improve the mechanical and durability performance of self-healing Ultra-High Performance Concretes exposed to aggressive waters. Constr. Build. Mater. 2023, 374. [Google Scholar] [CrossRef]
  6. Lee M G, Wang Y C, Chiu C T. A preliminary study of reactive powder concrete as a new repair material. Construction and building materials, 2007, 21, 182–189.
  7. Zhou, M.; Lu, W.; Song, J.; Lee, G.C. Application of Ultra-High Performance Concrete in bridge engineering. Constr. Build. Mater. 2018, 186, 1256–1267. [Google Scholar] [CrossRef]
  8. Xue, J.; Briseghella, B.; Huang, F.; Nuti, C.; Tabatabai, H.; Chen, B. Review of ultra-high performance concrete and its application in bridge engineering. Constr. Build. Mater. 2020, 260, 119844. [Google Scholar] [CrossRef]
  9. Zhu, Y.; Zhang, Y.; Hussein, H.H.; Chen, G. Flexural strengthening of reinforced concrete beams or slabs using ultra-high performance concrete (UHPC): A state of the art review. Eng. Struct. 2020, 205. [Google Scholar] [CrossRef]
  10. Zhipeng C ,Zhengwei L ,Shaowei D , et al. Experimental study on interfacial shear behavior of PBL shear connector deeply embedded in UHPC. Case Stud. Constr. Mater. 2023, 18. [CrossRef]
  11. Aaleti S, Petersen B, Sritharan S. Design guide for precast UHPC waffle deck panel system, including connections[R]. United States. Federal Highway Administration, 2013.
  12. Voo Y L, Foster S J, Voo C C. Ultrahigh-performance concrete segmental bridge technology: Toward sustainable bridge construction. Journal of Bridge Engineering, 2015, 20, B5014001.
  13. Hu, Z.; Xu, Z.; Zhang, S.; Jiang, H.; Chen, Y.; Xiao, J. Experimental Study on Shear Behavior of Precast High-Strength Concrete Segmental Beams with External Tendons and Dry Joints. Buildings 2022, 12, 134. [Google Scholar] [CrossRef]
  14. Feng, J.; Fang, S.; Chen, M.; Fang, Z.; Liang, W. Effect of joint width on shear behaviour of wet joints using reactive powder concrete with confining stress. Eng. Struct. 2023, 293. [Google Scholar] [CrossRef]
  15. Feng, J. , Fang S. , Chen M., Fang Z., Liang W. Effect of joint width on shear behaviour of wet joints using reactive powder concrete with confining stress. Engineering Structures 2023, 293, 116566. [Google Scholar]
  16. Jiang, H.; Huang, C.; Mei, G.; Gao, X.; Tian, Y.; Sun, X. Experimental and numerical investigations on direct shear performance of UHPC dry joints. Eng. Struct. 2023, 283. [Google Scholar] [CrossRef]
  17. Chen M, De Corte W, Jiang H, et al. Experimental study on direct-shear behaviour of narrow joints in socket connections for precast pier-to-pile footing systems[C]//Structures. Elsevier, 2024, 61, 106006.
  18. Jiang, H.; Dong, X.; Fang, Z.; Xiao, J.; Chen, Y. Experimental Study on Shear Behavior of a UHPC Connection Between Adjacent Precast Prestressed Concrete Voided Beams. J. Bridg. Eng. 2020, 25, 04020106. [Google Scholar] [CrossRef]
  19. Jiang H, Hu Z, Feng J, et al. Flexural behavior of UHPC-filled longitudinal connections with non-contacting lap-spliced reinforcements for narrow joint width[C]//Structures. Elsevier, 2022, 39, 620–636.
  20. Fang Z, Wu J, Zhao G, et al. Shear performance and design recommendations of single embedded nut bolted shear connectors in prefabricated steel–UHPC composite beams. Steel Compos. Struct, 2024, 50, 319–336.
  21. Fang, Z.; Wu, J.; Xu, X.; Ma, Y.; Fang, S.; Zhao, G.; Jiang, H. Grouped rubber-sleeved studs–UHPC pocket connections in prefabricated steel–UHPC composite beams: Shear performance under monotonic and cyclic loadings. Eng. Struct. 2024, 305. [Google Scholar] [CrossRef]
  22. Fang, Z.; Fang, H.; Huang, J.; Jiang, H.; Chen, G. Static behavior of grouped stud shear connectors in steel–precast UHPC composite structures containing thin full-depth slabs. Eng. Struct. 2021, 252, 113484. [Google Scholar] [CrossRef]
  23. Fang Z, Fang H, Li P, et al. Interfacial shear and flexural performances of steel–precast UHPC composite beams: Full-depth slabs with studs vs. demountable slabs with bolts. Engineering Structures, 2022, 260, 114230.
  24. Fang, Z.; Liang, W.; Fang, H.; Jiang, H.; Wang, S. Experimental investigation on shear behavior of high-strength friction-grip bolt shear connectors in steel-precast UHPC composite structures subjected to static loading. Eng. Struct. 2021, 244, 112777. [Google Scholar] [CrossRef]
  25. Cai Z W, Yu J T, Duan X Z, et al. Enhancing the strain-hardening performance of ultra-high performance concrete by tailoring matrix toughness and fiber parameters. Construction and Building Materials, 2023, 395, 132335.
  26. Yu R, Fan D Q, Sun M J, et al. Effects of steel fibre content and 3D network on performance of ultra-high performance concrete. J. Chin. Ceram. Soc, 2021, 49, 2313–2321.
  27. Qi, J.; Ma, Z.J.; Wang, J. Shear Strength of UHPFRC Beams: Mesoscale Fiber-Matrix Discrete Model. J. Struct. Eng. 2017, 143. [Google Scholar] [CrossRef]
  28. Abbas Y M, Iqbal Khan M. Influence of fiber properties on shear failure of steel fiber reinforced beams without web reinforcement: ANN modeling. Latin American Journal of Solids and Structures, 2016, 13, 1483–1498.
  29. Amin, A.; Gilbert, R.I. Instantaneous Crack Width Calculation for Steel Fiber-Reinforced Concrete Flexural Members. ACI Struct. J. 2018, 115, 535–543. [Google Scholar] [CrossRef]
  30. Meng, W.; Khayat, K.H. Effect of Hybrid Fibers on Fresh Properties, Mechanical Properties, and Autogenous Shrinkage of Cost-Effective UHPC. J. Mater. Civ. Eng. 2018, 30, 04018030. [Google Scholar] [CrossRef]
  31. Ding, Y.; You, Z.; Jalali, S. The composite effect of steel fibres and stirrups on the shear behaviour of beams using self-consolidating concrete. Eng. Struct. 2011, 33, 107–117. [Google Scholar] [CrossRef]
  32. Jiang H, Hu Z, Cao Z, et al. Experimental and numerical study on shear performance of externally prestressed precast UHPC segmental beams without stirrups[C]//Structures. Elsevier, 2022, 46, 1134–1153.
  33. Lee J W, Joh C, Choi E S, et al. Estimation of Shear Behavior of Ultra High Performance Concrete I Girder without Shear Stirrups. Key Engineering Materials, 2013, 525, 557–560.
  34. Voo, Y.L.; Foster, S.J.; Gilbert, R.I. Shear Strength of Fiber Reinforced Reactive Powder Concrete Prestressed Girders without Stirrups. J. Adv. Concr. Technol. 2006, 4, 123–132. [Google Scholar] [CrossRef]
  35. Voo Y L, Poon W K, Foster S J. Shear strength of steel fiber-reinforced ultrahigh-performance concrete beams without stirrups. Journal of structural engineering, 2010, 136, 1393–1400.
  36. Yang I H, Joh C, Lee J W, et al. An experimental study on shear behavior of steel fiber-reinforced ultra high performance concrete beams. KSCE Journal of Civil and Environmental Engineering Research, 2012, 32, 55–64.
  37. Ahmad, S.; Bahij, S.; Al-Osta, M.A.; Adekunle, S.K.; Al-Dulaijan, S.U. Shear Behavior of Ultra-High-Performance Concrete (UHPC) Beams Reinforced with High-Strength Steel Bars. ACI Struct. J. 2019, 116, 3–14. [Google Scholar] [CrossRef]
  38. El-Sayed, A.K.; El-Salakawy, E.F.; Benmokrane, B. Shear strength of fibre-reinforced polymer reinforced concrete deep beams without web reinforcement. Can. J. Civ. Eng. 2012, 39, 546–555. [Google Scholar] [CrossRef]
  39. Zagon, R.; Matthys, S.; Kiss, Z. Shear behaviour of SFR-UHPC I-shaped beams. Constr. Build. Mater. 2016, 124, 258–268. [Google Scholar] [CrossRef]
  40. Baby F, Marchand P, Toutlemonde F. Shear behavior of ultrahigh performance fiber-reinforced concrete beams. I: Experimental investigation. Journal of structural engineering, 2014, 140, 04013111.
  41. Pourbaba, M.; Joghataie, A.; Mirmiran, A. Shear behavior of ultra-high performance concrete. Constr. Build. Mater. 2018, 183, 554–564. [Google Scholar] [CrossRef]
  42. Feng, J.; Li, P.; Wu, J.; Jiang, H.; Tian, Y.; Sun, X. Shear behavior of externally prestressed UHPC beams without stirrups. Case Stud. Constr. Mater. 2023, 18. [Google Scholar] [CrossRef]
  43. Li, P.; Cheng, Q.; Chen, N.; Tian, Y.; Fang, J.; Jiang, H. Experimental Study on Shear Behavior of Non-Stirrup Ultra-High Performance Concrete Beams. Materials 2023, 16, 4177. [Google Scholar] [CrossRef] [PubMed]
  44. NF P18–710; National Addition to Eurocode 2—Design of Concrete Structures: Specific Rules for Ultra-High Performance Fibre-Reinforced Concrete (UHPFRC). French Standardization Association: Paris, France, 2016.
  45. Tadros, M.; Lawler, J.; El-Khier, M.A.; Gee, D.; Kurt, A.; Lucier, G.; Wagner, E. Implementation of Ultra-High-Performance Concrete in Long-Span Precast Pretensioned Elements for Concrete Buildings and Bridges; Precast/Prestressed Concrete Institute (PCI): Chicago, IL, USA, 2021. [Google Scholar]
  46. Xu, H.B.; Deng, Z.C.; Chen, C.S.; Chen, X.W. Experimental study on shear strength of ultra-high performance fiber reinforced concrete beams. China Civ. Eng. J. 2014, 47, 91–97. [Google Scholar]
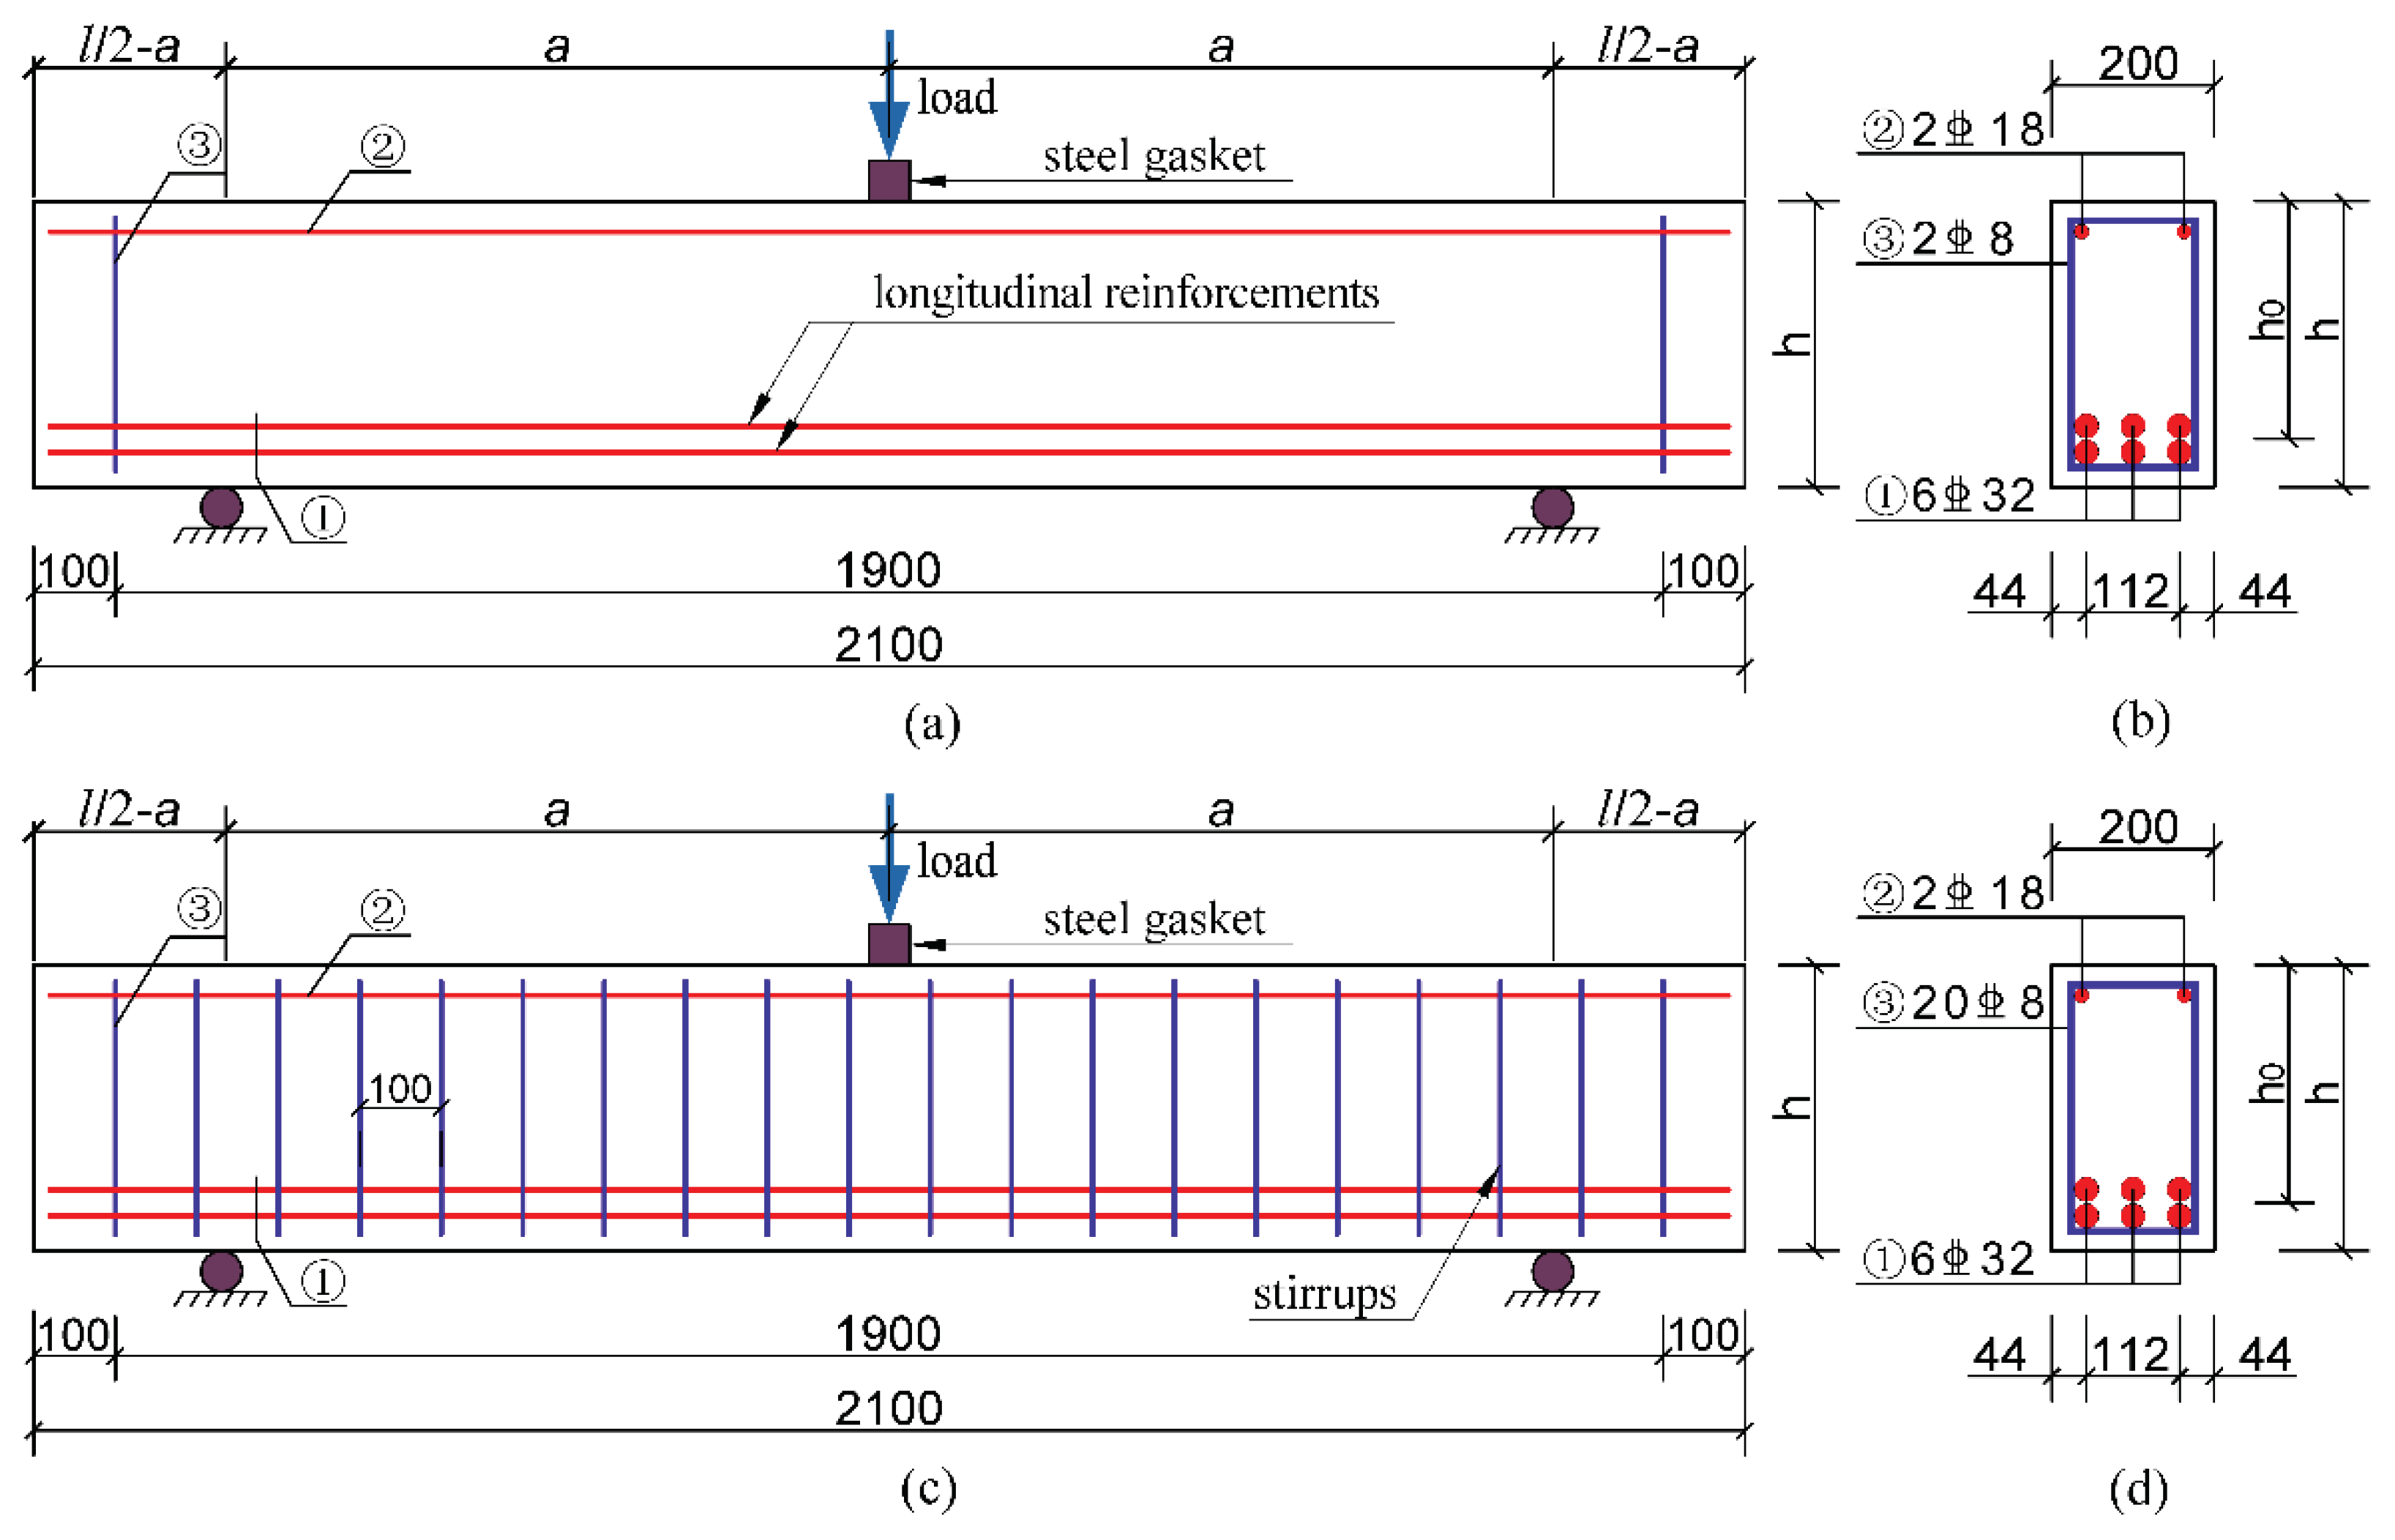
Figure 1. Dimensions and layouts of tested beams (unit: mm). (a) non-stirrup UHPC beams; (b) side elevation of (a); (c) stirrup-reinforced NC beams; (d) side elevation of (c). Note: ①6C32 indicated six HRB400 ribbed reinforcements with a 32 mm diameter, ②2C18 indicated two HRB400 ribbed reinforcements with an 18 mm diameter, ③2C8 indicated two HRB400 double-leg stirrups ribbed reinforcements with an 8 mm diameter, ③20C8 indicated twenty HRB400 double-leg stirrups ribbed reinforcements with an 8 mm diameter.
Preprints 102101 g001
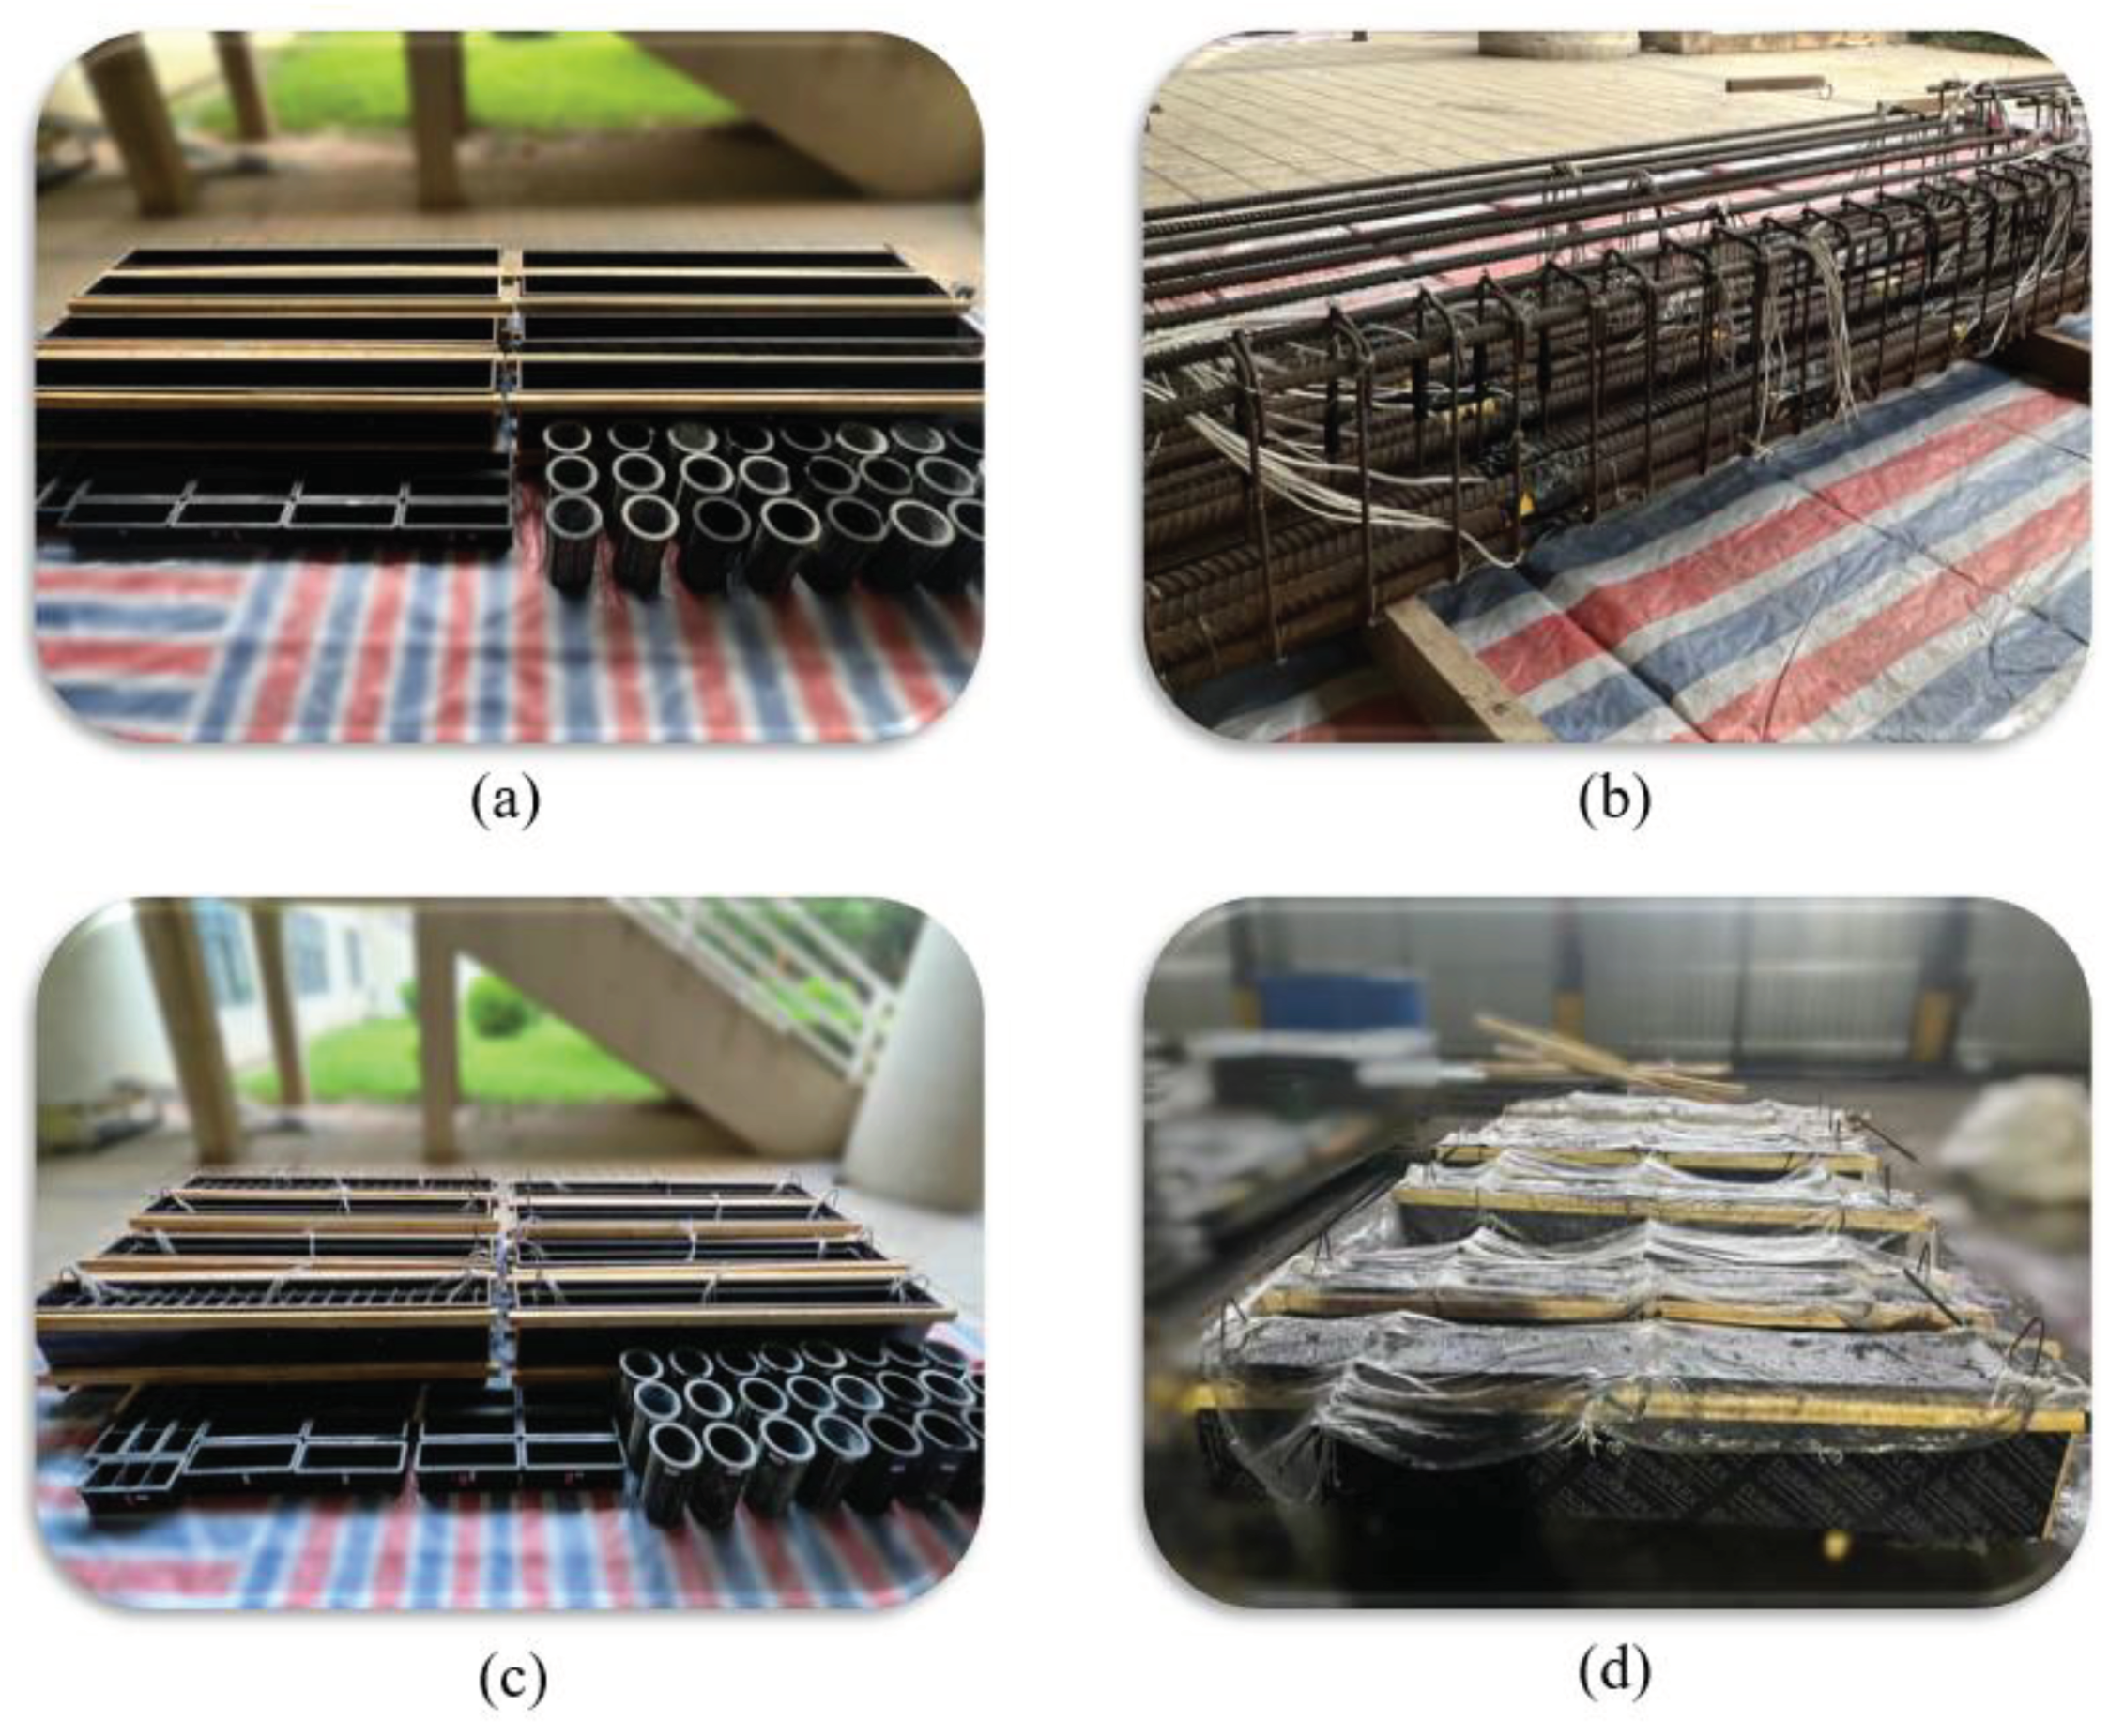
Figure 2. Construction of the specimens. (a) Formwork fabricating; (b) Steel bar tying; (c) Reinforcement cages laying; (d) Tested beams casting.
Preprints 102101 g002
Figure 3. Experimental setup and instrumentation.
Preprints 102101 g003
Figure 4. Layout of measuring points. (a) External measuring points of the 350 mm high tested beams; (b) External measuring points of the 400 mm high tested beams; (c) Strain gauges of the longitudinal reinforcements; (d) Strain gauges of the stirrups.
Preprints 102101 g004aPreprints 102101 g004b
Figure 5. Types of shear failure. (a) Diagonal tension failure; (b) Shear compression failure; (c) Diagonal compression failure.
Preprints 102101 g005
Figure 6. Crack pattern of each tested beam. (a) B1; (b) B2; (c) B3; (d) B4; (e) B5; (f) B6; (g) B7; (h) B8.
Preprints 102101 g006aPreprints 102101 g006b
Figure 7. Load-midspan deflection curves. (a) Effect of volume content of steel fiber on 350 mm high UHPC beams without stirrups reinforced; (b) Effect of volume content of steel fiber on 400 mm high UHPC beams without stirrups reinforced; (c) Effect of beam height at the volume content of steel fiber of 2%; (d) Effect of beam height at the volume content of steel fiber of 1.5%; (e) Effect of beam height at the volume content of steel fiber of 0%; (f) Effect of beam height of stirrup-reinforced NC beams.
Preprints 102101 g007
Figure 8. Load-strain curves of longitudinal reinforcements. (a) U-H35-S0-V* beams; (b) U-H40-S0-V* beams; (c) N-H*-S1-V0 beams.
Preprints 102101 g008
Figure 9. Load-strain curves of stirrups.
Preprints 102101 g009
Figure 10. Load-principal stress relationship for concrete diagonal section. (a) B1; (b) B2; (c) B3; (d) B4; (e) B5; (f) B6; (g) B7; (h) B8.
Preprints 102101 g010
Figure 11. Effect of steel fibers on diagonal cracking strength. (a) Effect of steel fibers on diagonal cracking strength of 350 mm high beams; (b) Effect of steel fibers on diagonal cracking strength of 400 mm high beams.
Preprints 102101 g011
Table 1. Specimen nomenclature and experimental parameters.
NO. Specimens Concrete Type h/(mm) Stirrup
Ratio
Volume Content of Steel Fiber h0/(mm) a/(mm) λ
B1 U-H35-S0-V2.0 UHPC 350 0 2.0% 291 814.8 2.8
B2 U-H35-S0-V1.5 UHPC 350 0 1.5% 291 814.8 2.8
B3 U-H35-S0-V0 UHPC 350 0 0 291 814.8 2.8
B4 U-H40-S0-V2.0 UHPC 400 0 2.0% 341 954.8 2.8
B5 U-H40-S0-V1.5 UHPC 400 0 1.5% 341 954.8 2.8
B6 U-H40-S0-V0 UHPC 400 0 0 341 954.8 2.8
B7 N-H35-S1-V0 C40 350 0.584% 0 291 814.8 2.8
B8 N-H40-S1-V0 C40 400 0.599% 0 341 954.8 2.8
Table 2. Basic mechanical properties of UHPC materials.
Concrete Type Volume Content of Steel Fiber f c u (MPa) f c (Mpa) f t (Mpa) σ f 1 (Mpa) σ f 2 (Mpa) σ f 3 (Mpa) f f u (Mpa) f r r (Mpa)
UHPC-0 0% 118.5 94.7 5.57 3.10 2.48 1.94 10.5 3.9
UHPC-1.5 1.5% 174.9 162.0 12.60 8.94 7.15 5.50 36.0 13.5
UHPC-2.0 2.0% 164.0 147.2 12.58 5.62 5.00 3.46 28.8 10.8
C40 0% 43.3 38.4 / / / / / /
Notes: f c u = Cubic compressive strength; f c   = Axial compressive strength; f t = Splitting tensile strength; σ f 1   = Tested post-cracking strength; σ f 2   = Post cracking strength considering a fiber orientation factor (k) of 1.25; σ f 3 = Post-cracking strength for design; f f u = Flexural tensile strength; f r r = Post-cracking residual strength. σ f 1 , σ f 2 , σ f 3 were the inferred value according to f f u .
Table 3. Mechanical properties of reinforcing steel.
Specimens Reinforcing Steel Type Diameter (mm) Yield Strength (Mpa) Ultimate Strength (Mpa)
Stirrups HRB400 8 412.0 621.1
Longitudinal
reinforcements
HRB400 32 419.2 631.9
Table 4. Experimental results of all tested beams.
NO. P c r
(kN)
σ c r
(MPa)
P c i
(kN)
v c i
(MPa)
P u
(kN)
V u
(kN)
τ u
(MPa)
Δ u
(mm)
P f a i l u r e
(kN)
Δ f a i l u r e
(mm)
P y
(kN)
Δ y
(mm)
μ Δ θ PSCR FailurePattern
B1 80 8.0 581 5.0 1340 670 11.5 7.53 986 9.30 1280 6.90 1.35 35 ° 57% SC-FF
B2 260 25.9 460 4.0 1478 739 12.7 9.56 834 12.36 1390 8.10 1.53 37 ° 69% SC-FF
B3 65 6.5 262 2.3 519 259.5 4.5 4.25 375 5.21 507 3.79 1.37 42 ° 50% DT
B4 400 35.8 678 5.0 1540 770 11.3 7.88 498 8.09 1319 5.64 1.43 31 ° 56% SC-FF
B5 100 9.0 600 4.4 1485 742.5 10.9 10.01 748 10.10 1380 8.84 1.14 32 ° 60% SC-FF
B6 75 6.7 300 2.2 495 247.5 3.6 4.31 292 4.39 480 3.91 1.12 45 ° 39% DT
B7 60 6.0 260 2.2 630 315 5.4 7.47 410 8.03 600 5.86 1.37 56 ° 59% DC
B8 40 3.6 291 2.1 700 350 5.1 7.05 368 8.15 690 6.75 1.21 57 ° 58% DC
Notes: P c r   = Load of initial flexural crack; Flexural cracking strength ( σ c r )   is calculated by σ c r = M c r b h 2 / 6 ; M c r = bending moment of initial flexural crack = P c r · a 2 ; P c i = Load of initial diagonal crack; Diagonal cracking strength ( v c i ) is calculated by v c i = P c i / 2 b h 0 ; P u = Ultimate load; V u = Peak shear load = P u / 2 ; The ultimate shear strength ( τ u ) is given by: τ u = V u / b h 0 . Thereinto, b is web thickness and h 0 is effective depth of the beam; Δ u = Midspan deflection of ultimate load; PCSR denotes the post diagonal cracking shear resistance, which is calculated by P S C R = V u V c i V u × 100 % , where V c i = P c i / 2 ; P f a i l u r e = Failure load, which indicates the load for the beam to incur significant damage; Δ f a i l u r e = Midspan deflection of failure load; P y = Yield load; Δ y = Midspan deflection of yield load; The ductility coefficients ( μ Δ ) is given by: μ Δ = Δ f a i l u r e / Δ y . θ represents the angle between the beam axis and the critical shear diagonal crack. FF indicates flexural failure.
Table 6. Comparison between experimental results and calculated values.
Experimental
Results
French Standard Formulae PCI-2021 Formulae Xu’s Formulae
NO. V u , t e s t V c V s V f V u 1 V u 1 / V u , t e s t V c f V s V u 2 V u 2 / V u , t e s t V c V s V f V u 3 V u 3 / V u , t e s t
B1 670 156.5 0 420.4 576.9 0.86 898.9 0 898.9 1.34 107.5 0 553.0 660.6 0.99
B2 739 161.6 0 621.4 783.1 1.06 1123.6 0 1123.6 1.52 112.9 0 609.5 722.3 0.98
B3 259.5 133.0 0 0 133.0 0.51 324.6 0 324.6 1.25 86.3 0 0 86.3 0.33
B4 770 183.4 0 574.1 757.5 0.98 1053.4 0 1053.4 1.37 126.0 0 648.1 774.1 1.01
B5 742.5 189.4 0 878.2 1067.6 1.44 1316.7 0 1316.7 1.77 132.3 0 714.2 846.5 1.14
B6 247.5 155.9 0 0 155.9 0.63 380.4 0 380.4 1.54 101.1 0 0 101.1 0.41
Average: 0.91 Average: 1.47 Average: 0.81
STDEV: 0.30 STDEV: 0.17 STDEV: 0.31
CV: 0.33 CV: 0.12 CV: 0.39
Disclaimer/Publisher’s Note: The statements, opinions and data contained in all publications are solely those of the individual author(s) and contributor(s) and not of MDPI and/or the editor(s). MDPI and/or the editor(s) disclaim responsibility for any injury to people or property resulting from any ideas, methods, instructions or products referred to in the content.
Copyright: This open access article is published under a Creative Commons CC BY 4.0 license, which permit the free download, distribution, and reuse, provided that the author and preprint are cited in any reuse.
Prerpints.org logo

Preprints.org is a free preprint server supported by MDPI in Basel, Switzerland.

Subscribe

© 2024 MDPI (Basel, Switzerland) unless otherwise stated