The following section first describes significant influencers of residential electricity consumption. Subsequently, the techno-economic results of fitting PUE into community consumption patterns are provided.
3.1. Influencers of Electricity Consumption
We observe the time-dependent evolution and variation of electricity consumption patterns (subsection 3.1.1) and time-independent variation of consumption patterns based on socio-economic characteristics (subsection 3.1.2).
3.1.1. Time-Dependent Influences of Electricity Consumption
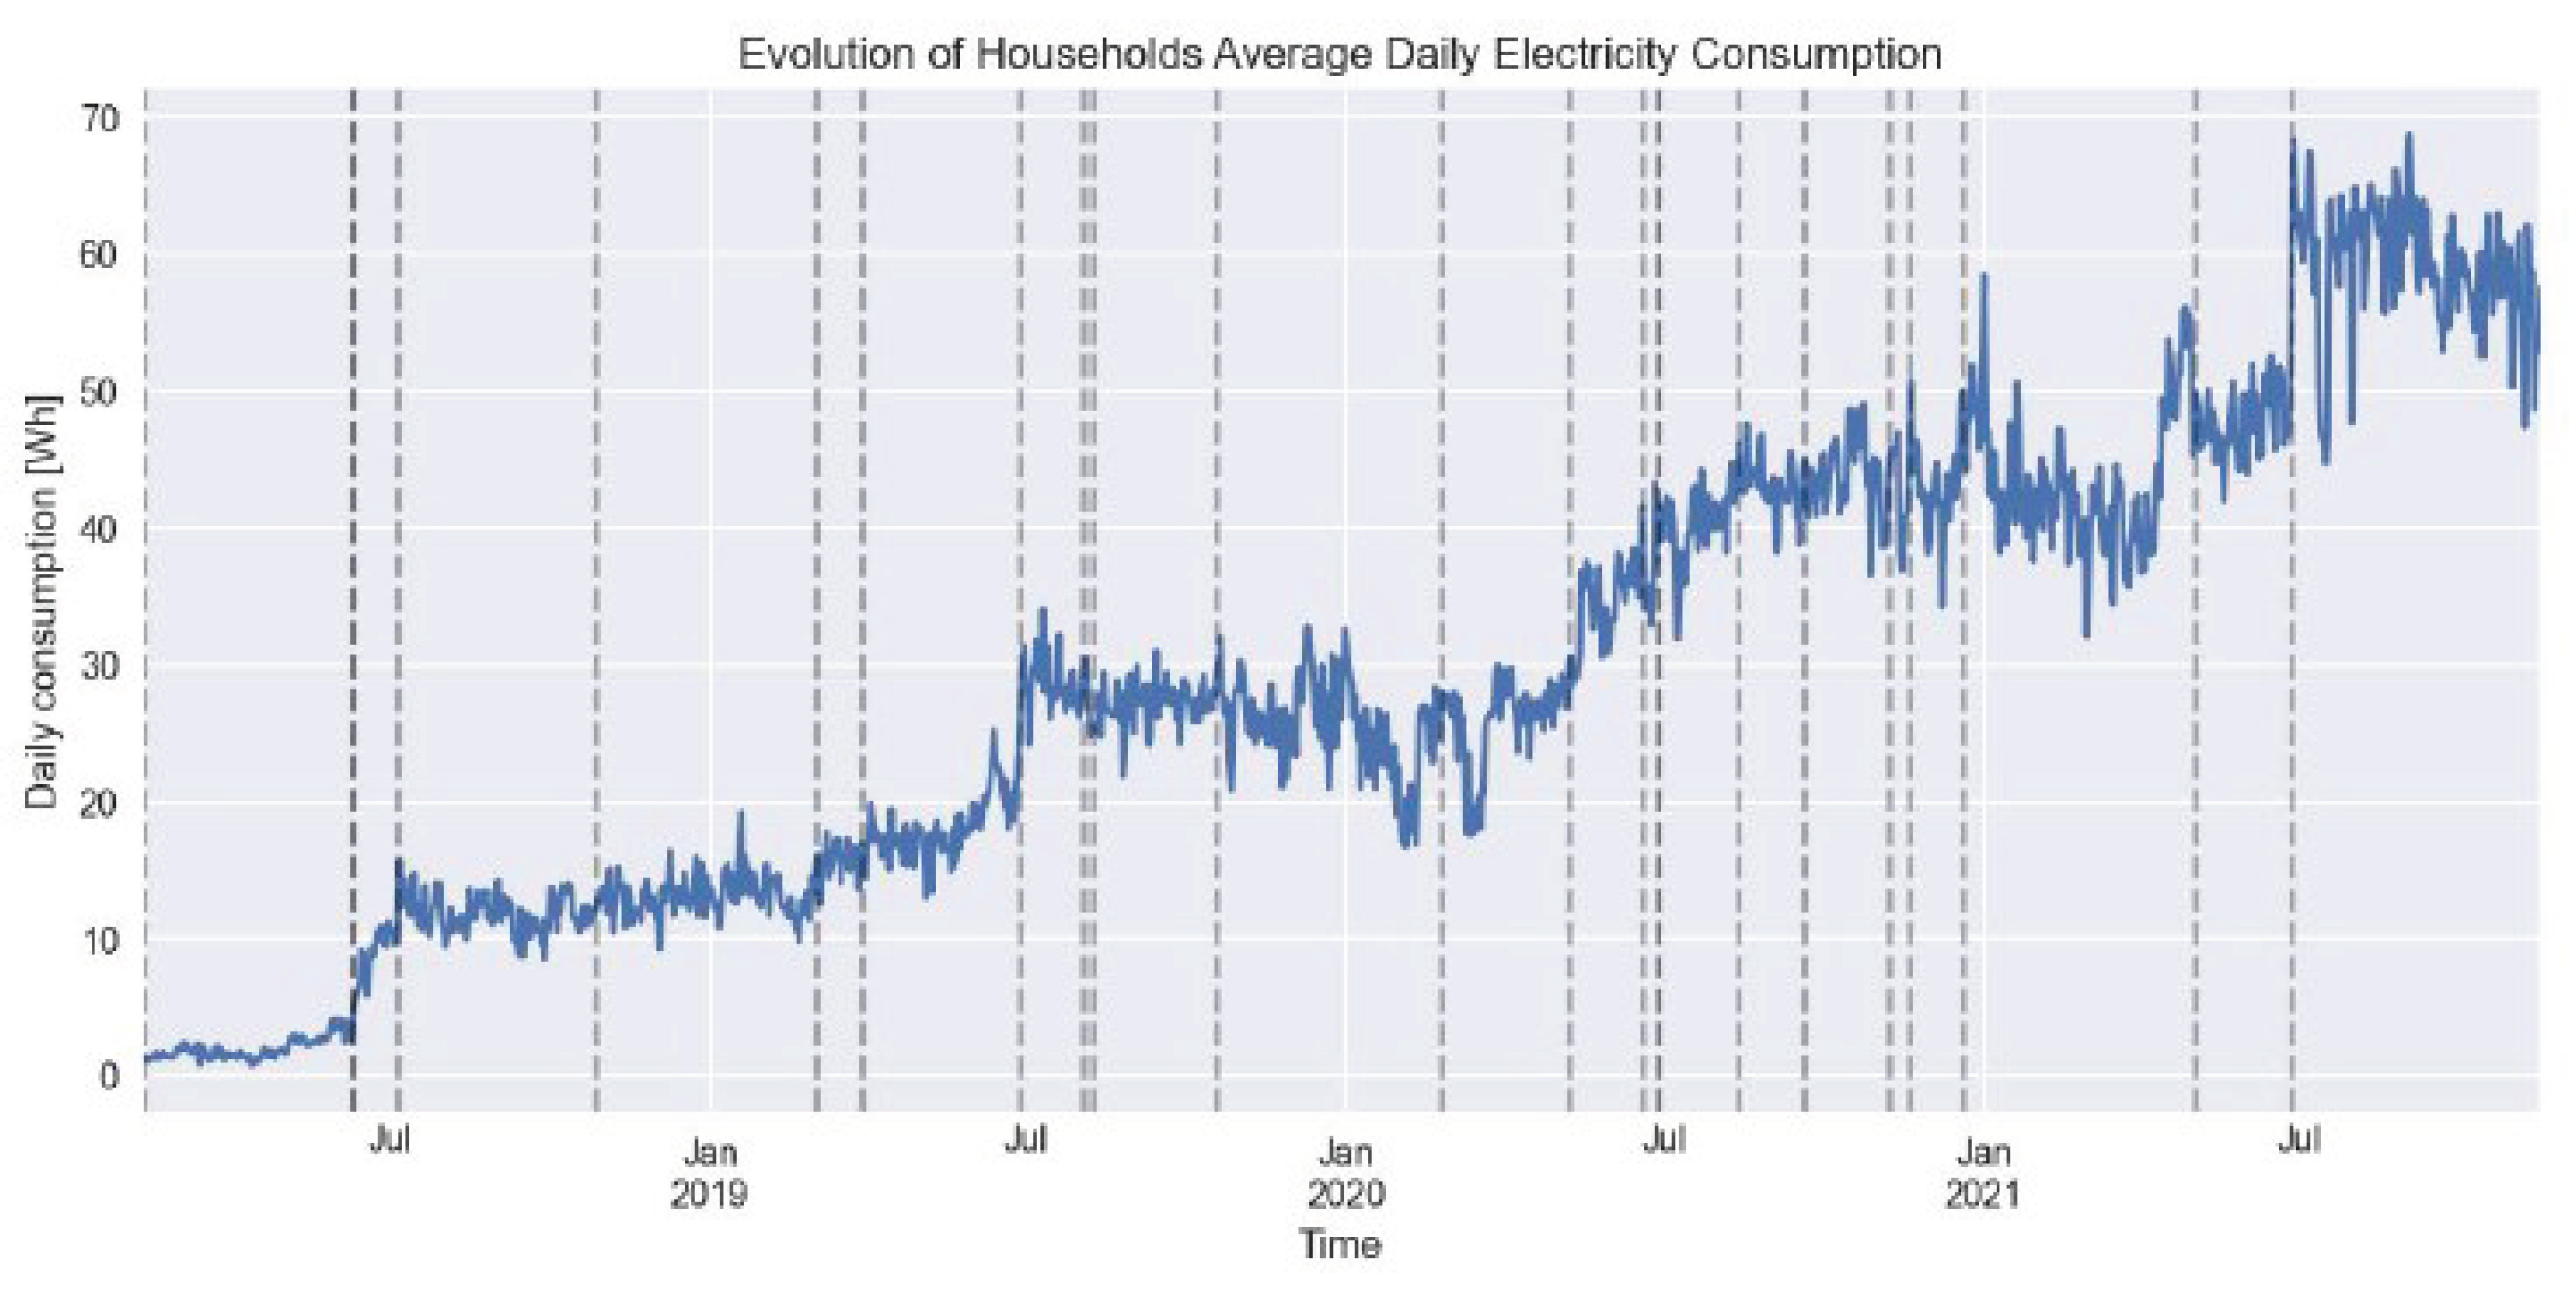
We study the evolution of electricity consumption across 107 residential electricity users over three years (earliest data log: 10.02.2018; latest data log: 01.12.2021). It is important to note that the applied payment scheme foresees optional (daily, weekly, or monthly) prepayments, in which the user can choose between different credit options reflecting daily power and energy limits. When exceeding the daily energy limit, the user is remotely cut off and connected again when credits are left the next day. When exceeding the power limits, the user is cut off only shortly and reconnected if the power load is reduced. Hence, the studied electricity consumption patterns can be constrained by the tariff chosen and credit management of the household and may not reflect an unconstrained evolution.
Table 3 presents the evolution of the average energy and power consumption per capita. Whereas the maximum average power demand per household remained more stable over the years, the average daily energy demand increased significantly. While a granular analysis confirms that the average energy demand of connected households increases over time, we also observed that more recently connected households tend to have higher average energy demands than clients connected several years ago (see also
Figure A4 of the Appendix). This is explained by an increasing set of available DC appliances offered to local residents, and higher share of high consuming public lights integrated in the nanogrids.
Table 3.
Evolution of the daily average energy consumption and peak power load per household.
Table 3.
Evolution of the daily average energy consumption and peak power load per household.
| Year |
Average daily household electricity consumption [Wh] |
Annual change of average daily electricity consumption [%] |
Average daily maximum household power demand [W] |
Annual change of maximum average power consumption [%] |
| 2018 |
8.16 |
- |
2.26 |
- |
| 2019 |
21.88 |
168.27 |
2.25 |
-0.75 |
| 2020 |
35.47 |
62.11 |
2.27 |
0.92 |
| 2021 |
50.62 |
42.72 |
2.99 |
32.11 |
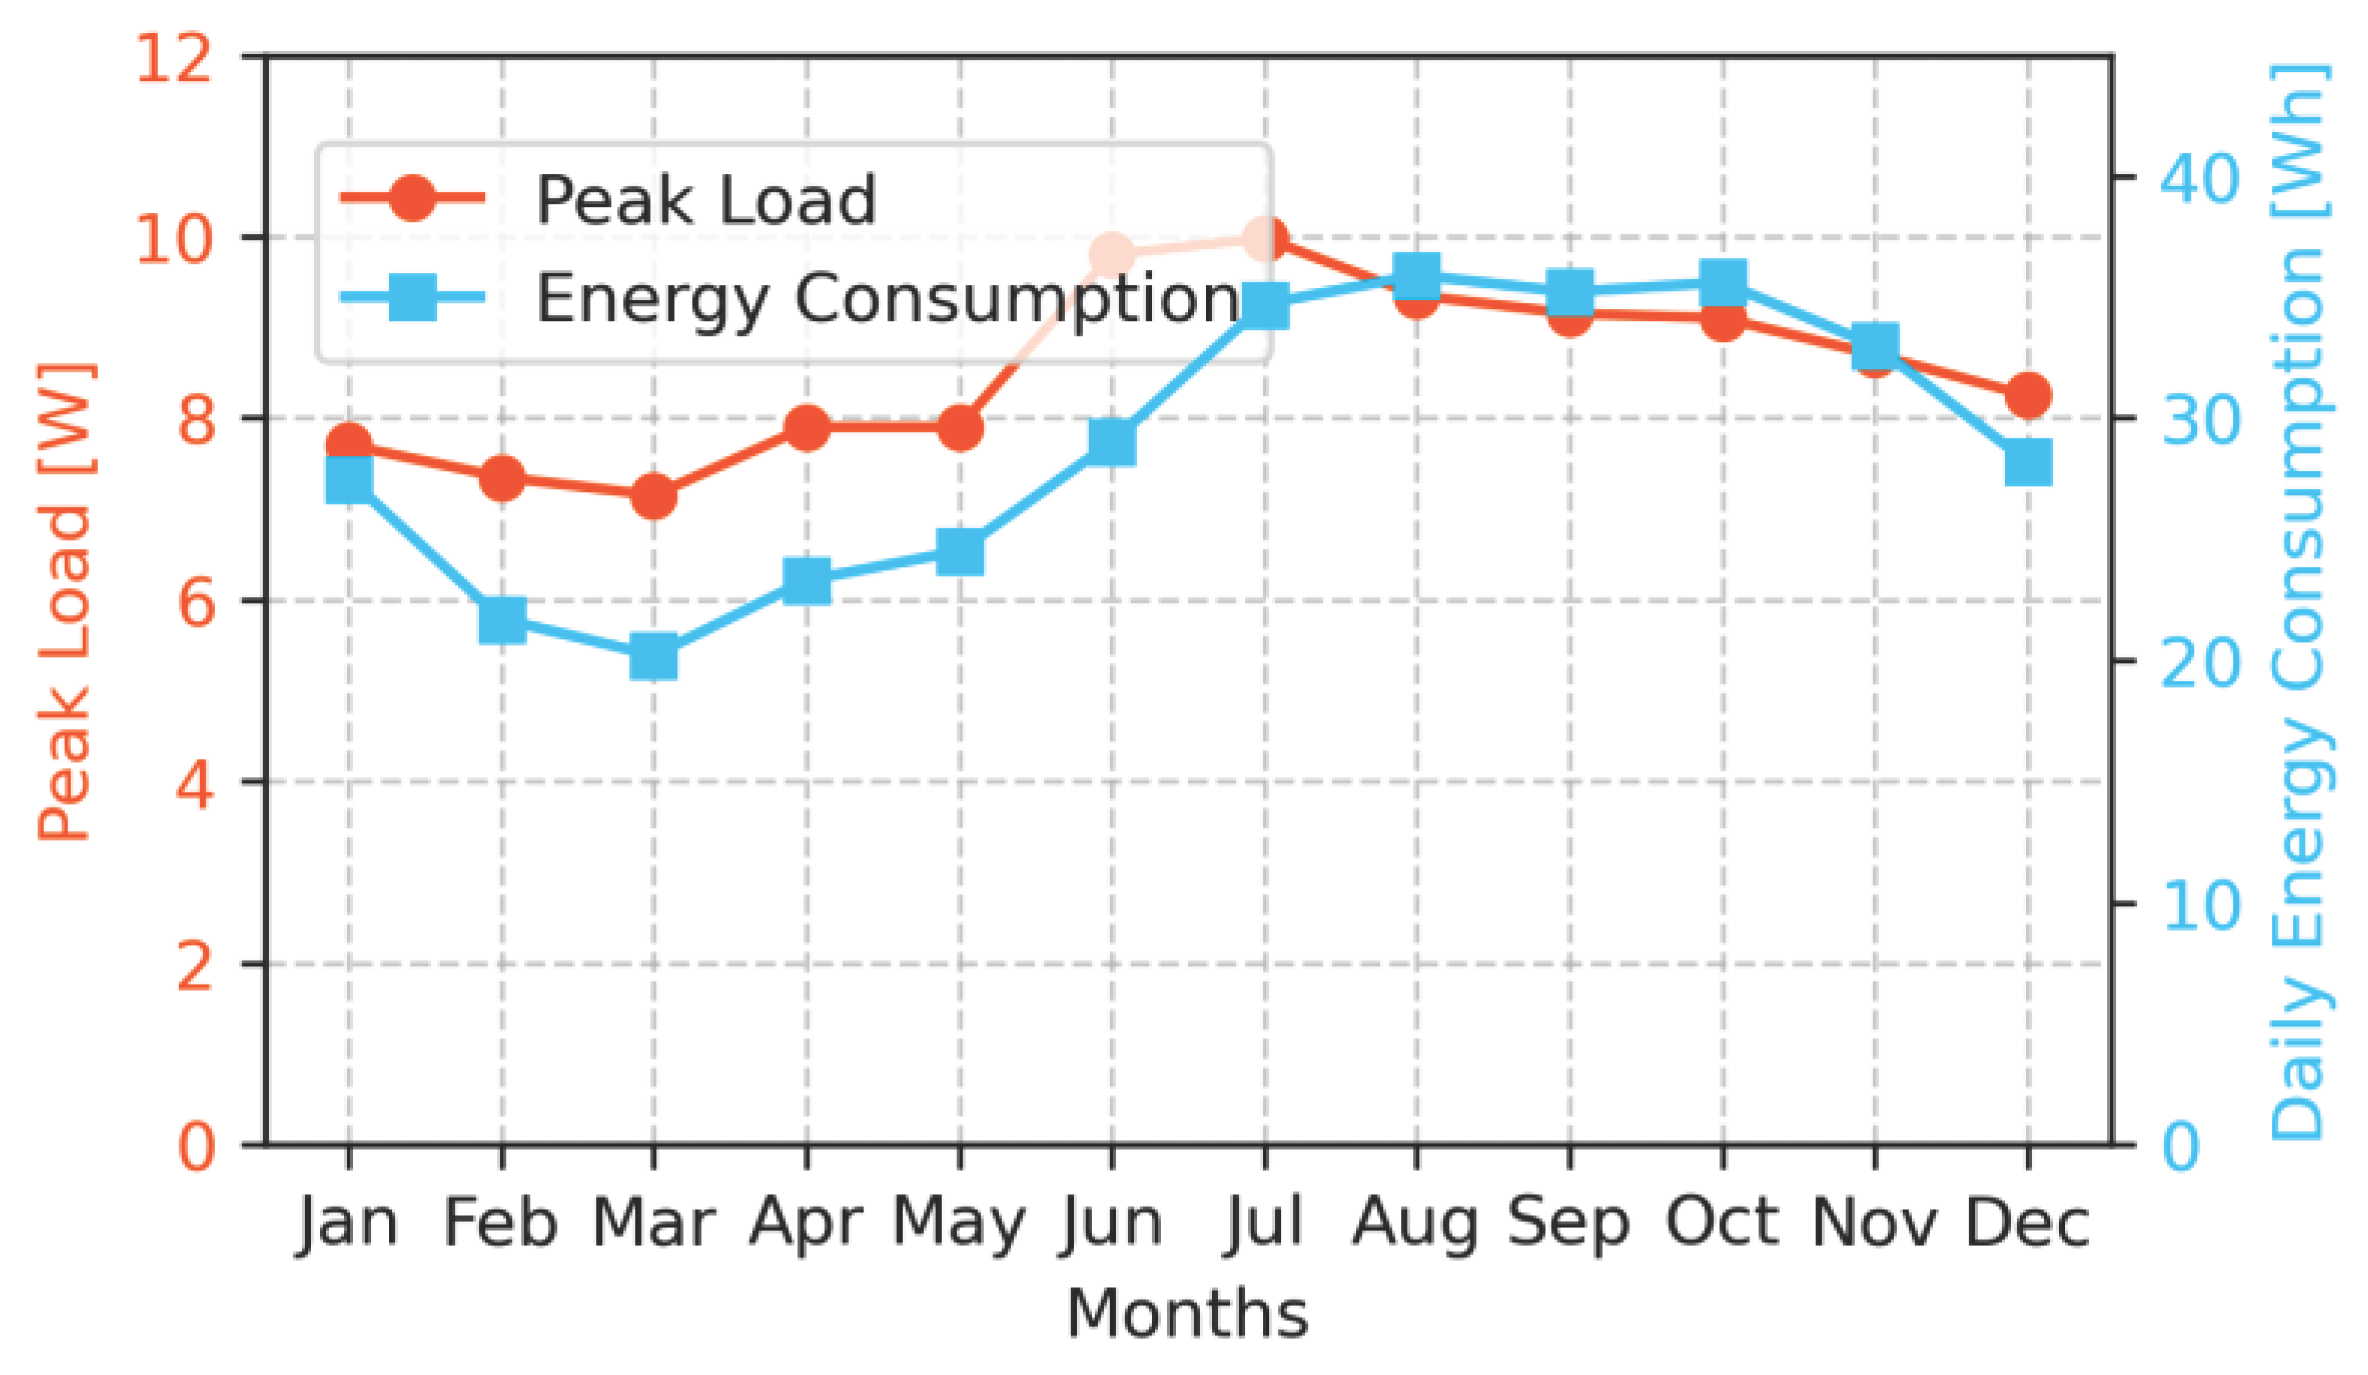
Studying the average monthly energy consumption and peak load per household reveals a seasonal variation of electricity consumption, see Figure 4. Both significantly increase after the rainy season (January – April). This is explained by the seasonality of crops, potentially increased liquidity of the households during these months, and less hours of sunshine.
Figure 4.
Seasonal variation of the average maximum peak power demand per household and average daily electricity consumption.
Figure 4.
Seasonal variation of the average maximum peak power demand per household and average daily electricity consumption.
3.1.2. Socio-Economic Predictors of Electricity Consumption
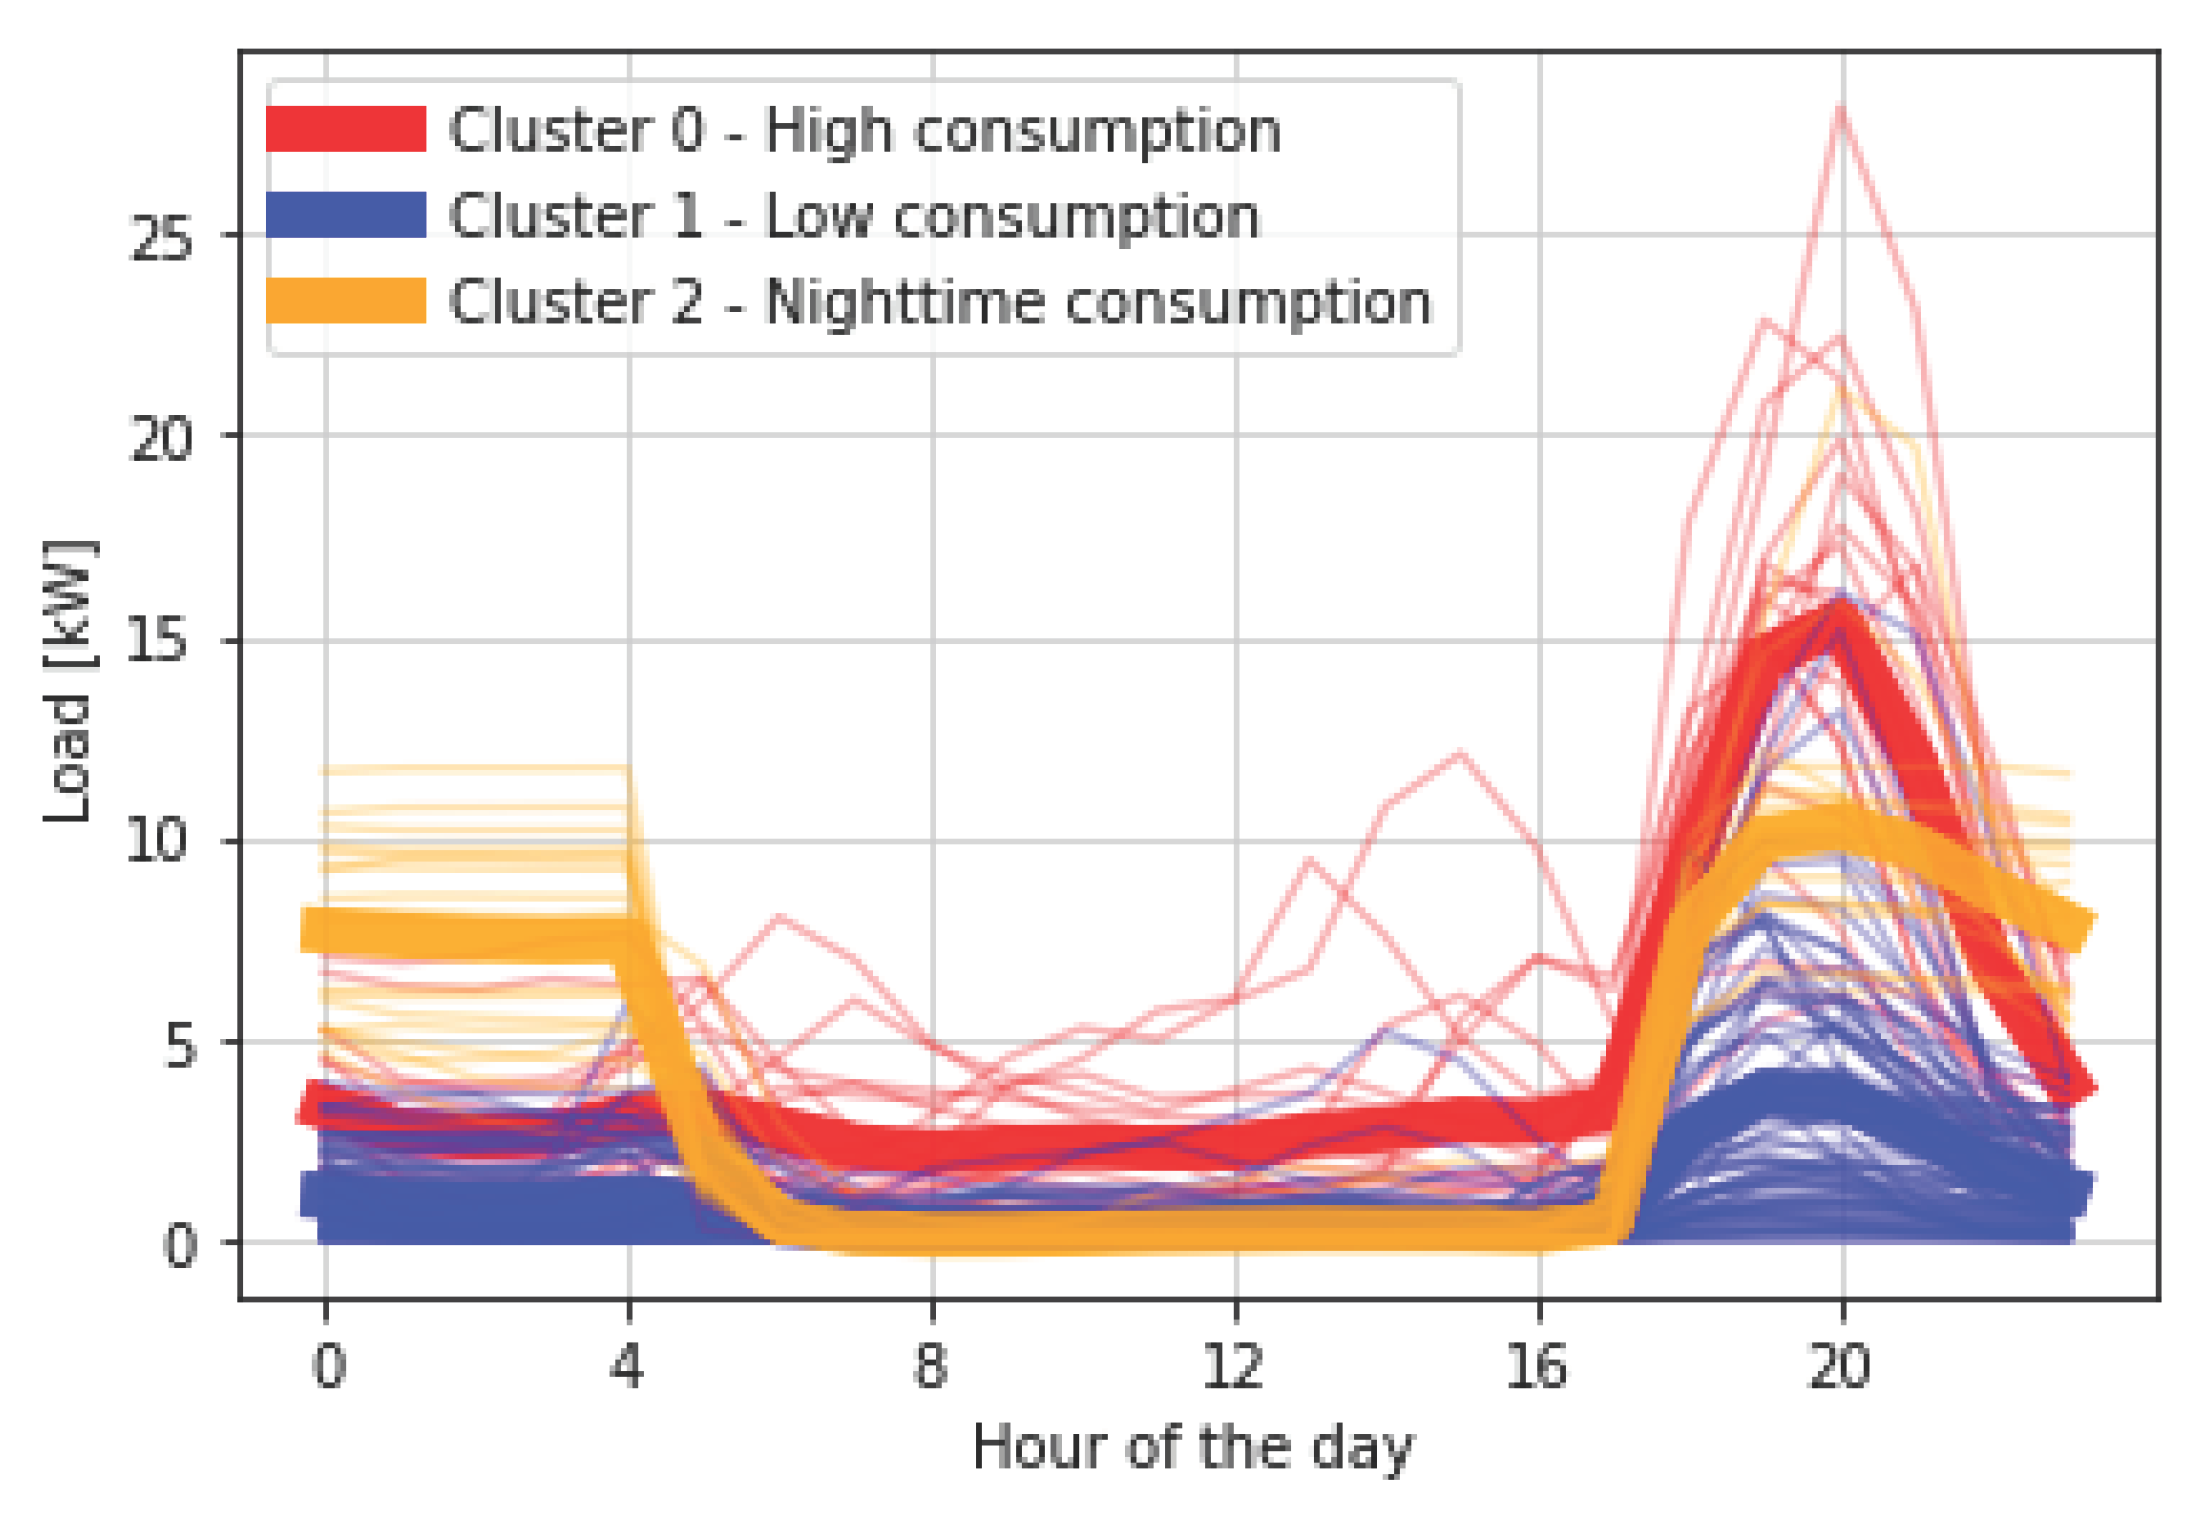
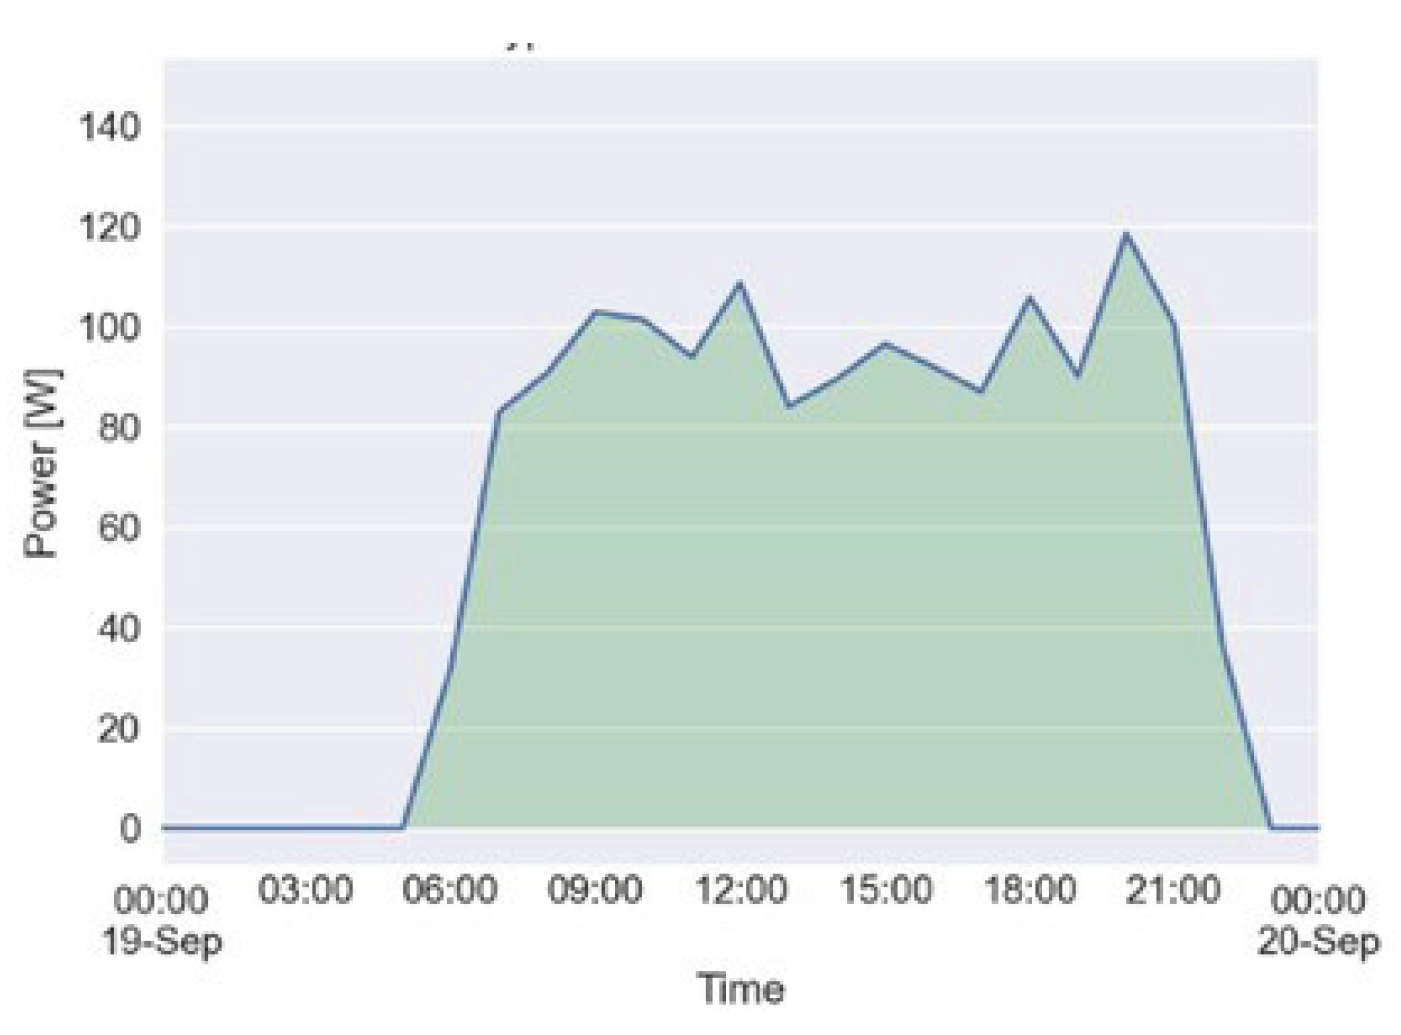
Based on the cluster analysis (see Section 2.1), we identify three distinct representative annual electricity residential consumption profiles (silhouette score s = 0.53). Figure 5 illustrates the average daily load profile of each household of the sample group within the distinct clusters, with the aggregated average load profile of all households belonging to a cluster highlighted in bold. Cluster 0, including 17% of the residential sample group, exhibits a significant evening peak demand, peaking at 15W around 8 pm, accompanied by a baseload demand of approximately 3 W throughout the rest of the day. Due to its comparatively high demand (ca. 40 Wh per day), we label the profile as “high-consumption”. The majority (66%) of residentials belong to Cluster 1 – “low-consumption” – in which we observe minimal daytime consumption, with a low night demand of around 1 W and a small evening peak of about 4 W. Cluster 2 – “nighttime consumption”- (17%) displays a moderate-sized evening peak of 10 W, a night consumption around 8 W, and no daytime consumption. Within these profiles, two extremes emerge: a low-demand consumer in Cluster 1, characterized by a consumption not exceeding 4 W and consistently lower than other groups, and a high-demand consumer in Cluster 0, with an evening peak demand four times higher than the low demand consumer and twice that of Cluster 2. Throughout the day, the high demand profile maintains the highest overall demand, dominated by a nearly constant medium baseload at 3 W.
Figure 5.
Representative daily electricity consumption profile of each household in a cluster and the average cluster profile, highlighted in bold.
Figure 5.
Representative daily electricity consumption profile of each household in a cluster and the average cluster profile, highlighted in bold.
Based on the series of Chi-square and Fisher tests, we detect a significant correlation between socioeconomic characteristics and cluster membership of residents in the community. Table 4 presents the socio-economic and demographic variables detected as significant to predict a distinct cluster membership (for an overview of the statistical analysis results, see Table A2. of the Appendix). Based on the results, we can characterize the distinct clusters and use the variables to predict a particular energy consumption pattern. For instance, a high share of “Eco” tariffs within the sample group significantly predicts a Cluster 1 membership – expressing a low load consumption load profile. Similarly, the public lighting tariff predicts the membership to a high consumption Cluster 2. While predicting energy consumption behavior based on tariffs is trivial, we find other more complex correlations. For instance, we see a high share of residents working as traders, which significantly correlates with an electricity consumption profile as reflected in Cluster 0, with a high peak during the evening. Most of the samples included in the low-consumption profile (Cluster 1) instead are stated they are farmers (47%). Cluster 0 households also report the highest number of LED bulbs (2.2). In addition, the presence of a phone charger (83%) and 12V plugs (56%) correlate with the membership in Cluster 0. LED spot ownership, however, predicts the membership to Cluster 2.
Table 4.
Socio-economic correlation with cluster groups. EC = Expected count, C = Count. Statistically significant at p-value confidence level = 0.05. * Statistically significant at p-value confidence level = 0.1.
Table 4.
Socio-economic correlation with cluster groups. EC = Expected count, C = Count. Statistically significant at p-value confidence level = 0.05. * Statistically significant at p-value confidence level = 0.1.
| Variables |
|
Cluster 0 |
Cluster 1 |
Cluster 2 |
Chi2 |
df |
Fisher Exact |
p-value |
Cramer´s V |
| |
|
C |
EC |
C |
EC |
C |
EC |
|
|
|
|
|
| Tariff Groups |
| Eco |
Yes |
0 |
5.7 |
33 |
22.6 |
1 |
5.7 |
21.172 |
2 |
|
<0,001 |
0.445 |
| No |
18 |
12.3 |
38 |
48.4 |
17 |
12.3 |
| Eclairage Plus |
Yes |
9 |
4.7 |
17 |
18.6 |
2 |
4.7 |
7.585 |
2 |
6.98 |
0.025 |
0.275 |
| No |
9 |
13.3 |
54 |
52.4 |
16 |
13.3 |
| Multimedia |
Yes |
7 |
2 |
4 |
8 |
1 |
2.2 |
16.654 |
2 |
12.37 |
0.001 |
0.395 |
| No |
11 |
16 |
67 |
63 |
17 |
16 |
| Public Lighting |
Yes |
0 |
2 |
1 |
8 |
11 |
2 |
54.137 |
2 |
37.199 |
<0,001 |
0.711 |
| No |
18 |
16 |
70 |
63 |
7 |
16 |
| Tariff Switch |
Yes |
11 |
5 |
17 |
19.9 |
2 |
5 |
12.9 |
2 |
|
0.002 |
0.347 |
| No |
7 |
13 |
52 |
51.1 |
16 |
13 |
| Appliances Ownership |
| Led Bulb |
Yes |
16 |
14.1 |
61 |
55.7 |
7 |
14.1 |
20.201 |
2 |
16.635 |
<0,001 |
0.435 |
| No |
2 |
3.9 |
10 |
15.3 |
11 |
3.9 |
| Led Spot |
Yes |
0 |
2 |
1 |
8 |
11 |
2 |
54.137 |
2 |
37.199 |
<0,001 |
0.711 |
| No |
18 |
16 |
70 |
63 |
7 |
16 |
| USB Phone Charger |
Yes |
15 |
8.9 |
31 |
35.2 |
7 |
8.9 |
10.021 |
2 |
10.199 |
0.006 |
0.306 |
| No |
3 |
9.1 |
40 |
35.8 |
11 |
9.1 |
| 12V Plug |
Yes |
10 |
5.7 |
21 |
22.6 |
3 |
5.7 |
6.749 |
2 |
|
0.034 |
0.251 |
| No |
8 |
12.3 |
50 |
48.4 |
15 |
12.3 |
| LED Bulb Quantity |
0 |
2 |
3.9 |
10 |
15.3 |
11 |
3.9 |
40.883 |
12 |
35.687 |
<0,001 |
0.437 |
| 1 |
6 |
7.9 |
40 |
31.2 |
1 |
7.9 |
| 2 |
4 |
4 |
14 |
15.9 |
6 |
4 |
| 3 |
3 |
1.2 |
4 |
4.6 |
0 |
1.2 |
| 4 |
1 |
0.7 |
3 |
2.7 |
0 |
0.7 |
| 5 |
1 |
0.2 |
0 |
0.7 |
0 |
0.2 |
| 8 |
1 |
0.2 |
0 |
0.7 |
0 |
0.2 |
| Demographic variables |
| Number of children* |
0 |
1 |
2.9 |
13 |
10.9 |
1 |
1.3 |
16.175 |
8 |
13.283 |
0.065 |
0.31 |
| 1 |
8 |
4.6 |
16 |
17.4 |
0 |
2 |
| 2 |
3 |
4.4 |
19 |
16.7 |
1 |
1.9 |
| 3 |
3 |
3.6 |
11 |
13.8 |
5 |
1.6 |
| 4 |
1 |
0.6 |
2 |
2.2 |
0 |
0.3 |
| Job Groups |
| Trader |
Yes |
9 |
5.4 |
17 |
14.8 |
0 |
5.8 |
13.263 |
2 |
|
0.001 |
0.429 |
| No |
6 |
9.6 |
24 |
26.2 |
16 |
10.2 |
| Employee* |
Yes |
4 |
1.7 |
4 |
4.6 |
0 |
1.8 |
5.751 |
2 |
4.959 |
0.056 |
0.283 |
| No |
11 |
13.3 |
37 |
36.4 |
16 |
14.2 |
| Public Lighting |
Yes |
0 |
2.5 |
1 |
6.8 |
11 |
2.7 |
40.226 |
2 |
31.89 |
<0,001 |
0.747 |
| No |
15 |
12.5 |
40 |
34.2 |
5 |
13.3 |
3.2. Techno-Economic Evaluation of PUE
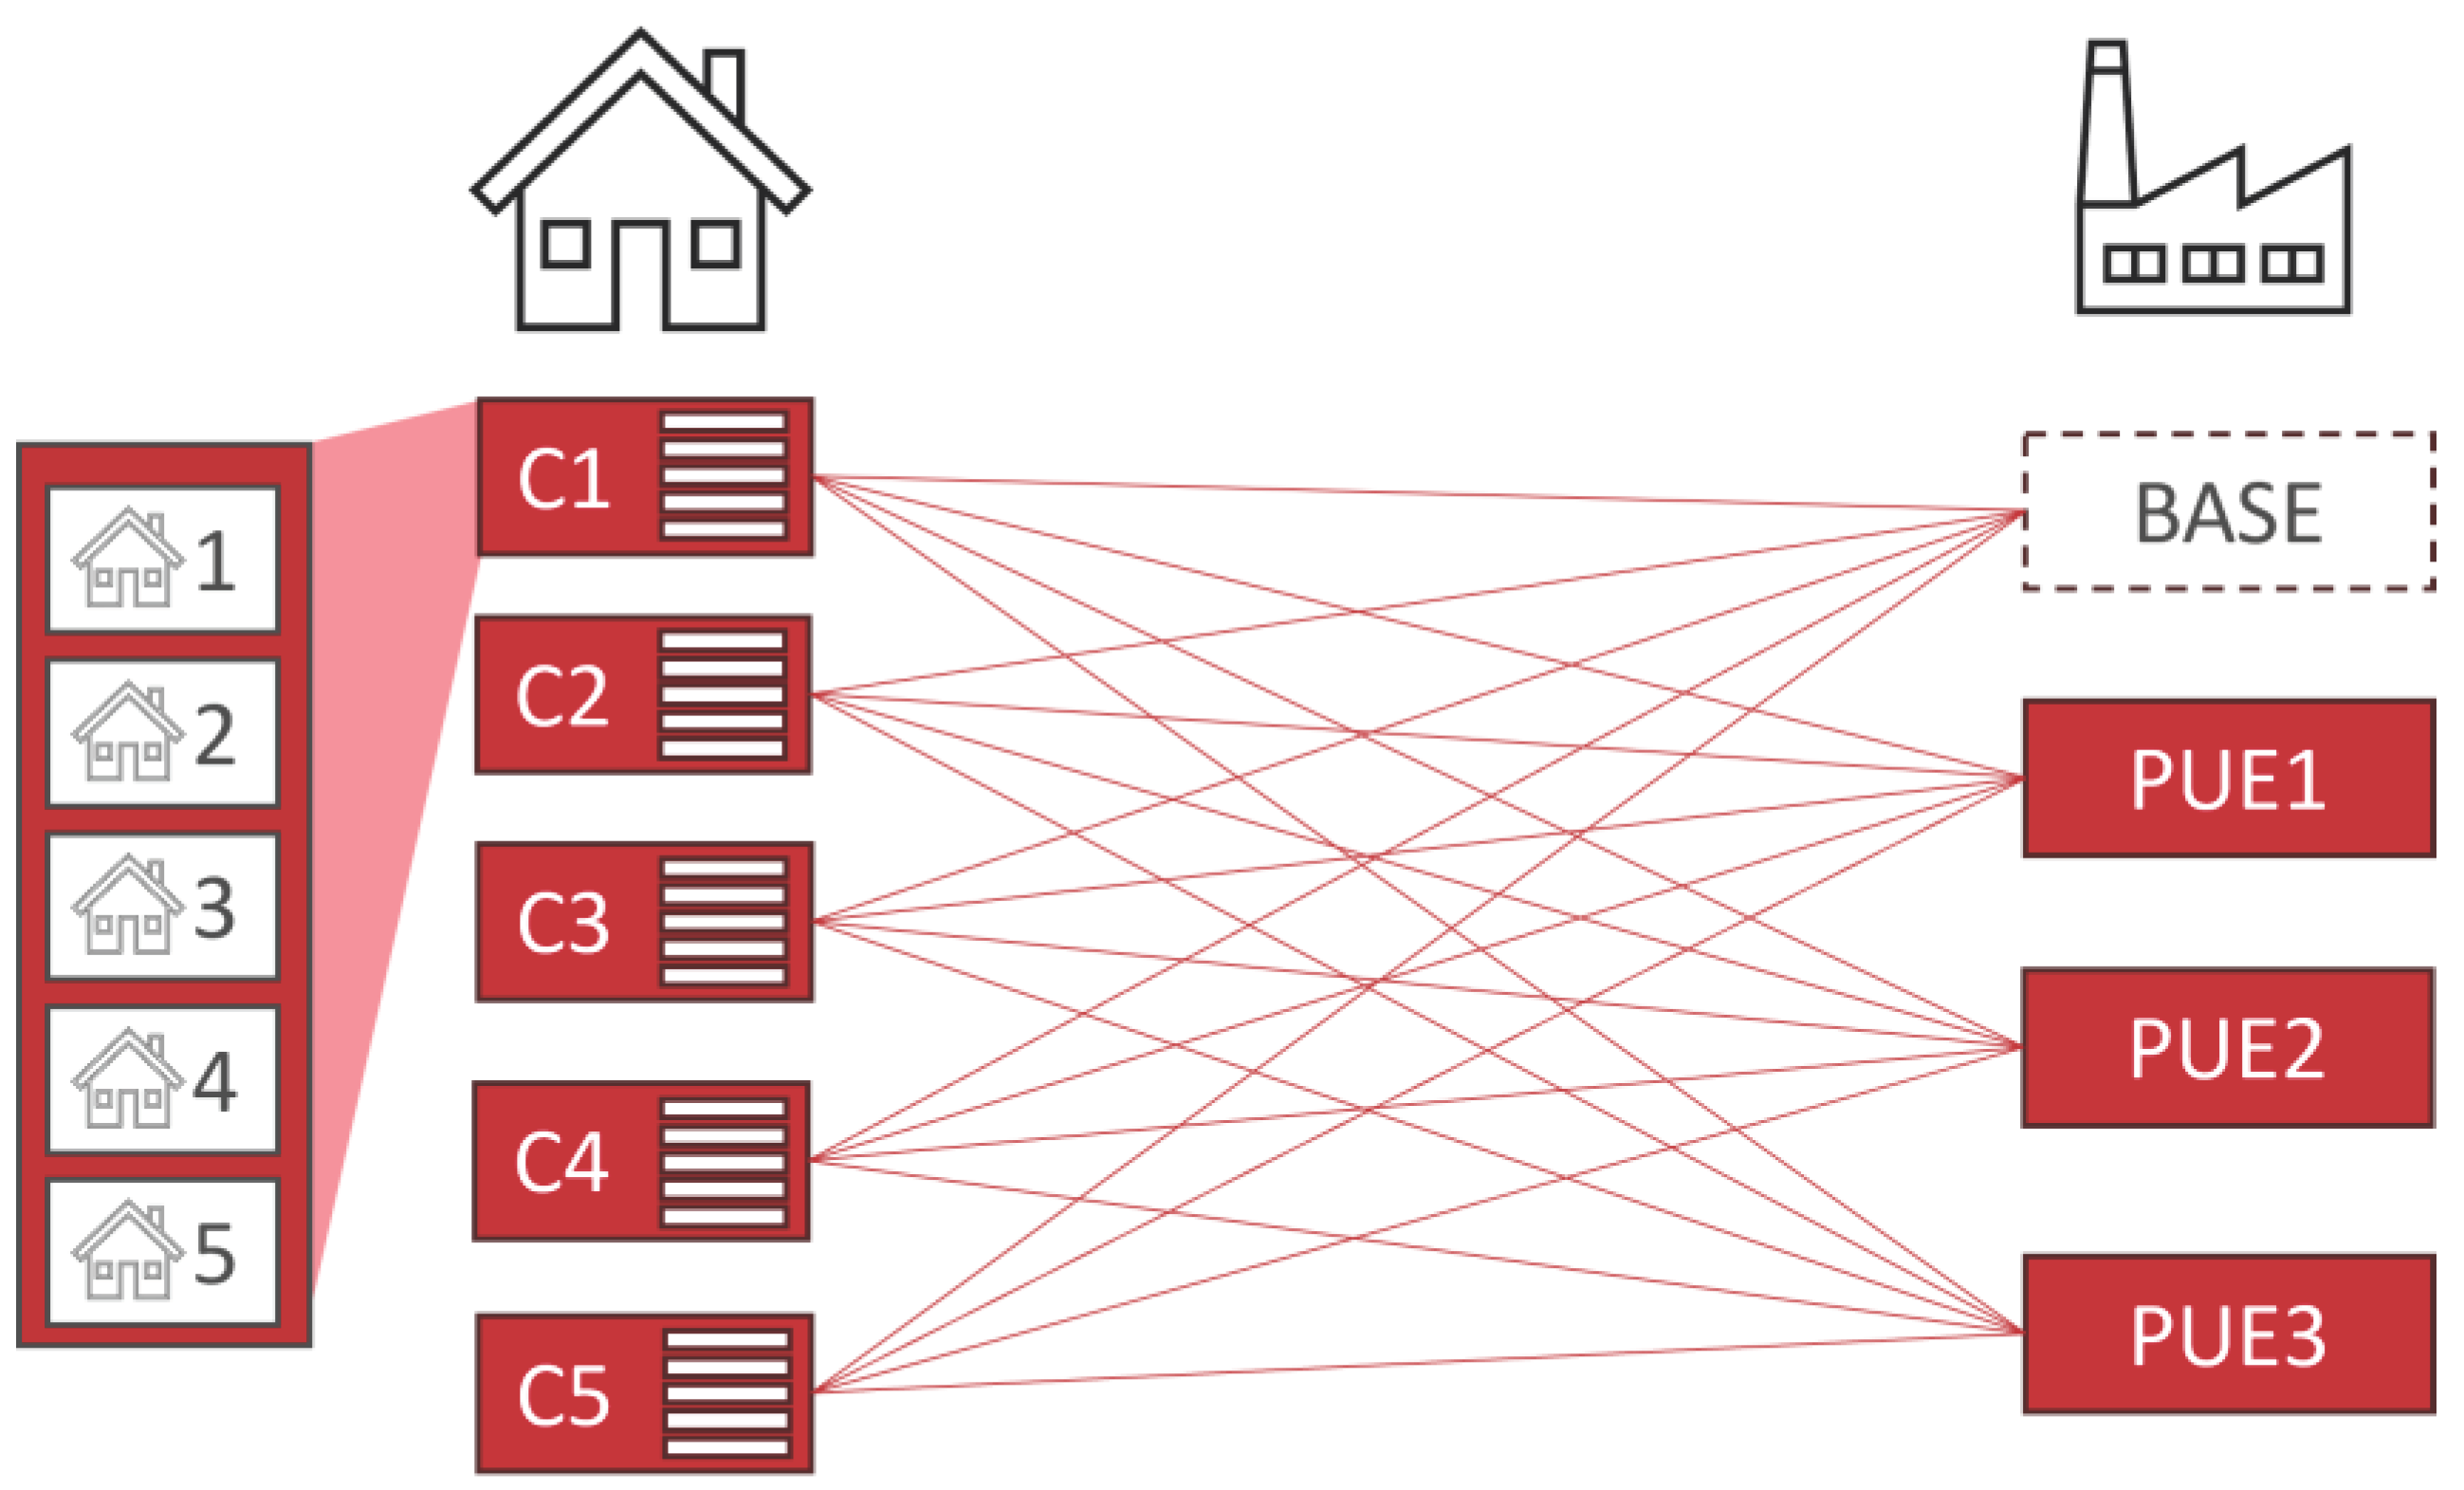
According to the findings of the statistical analysis in the previous section, we establish scenarios to compare the integration of PUE in residential energy systems with different compositions of residential consumption patterns as explained in Subsection 2.1.3. Hence, we match four PUE integration scenarios with five distinct residential load profile sets, each composing five households posing the average daily load profile of a certain cluster (see Figure 5). With this, we can derive valuable information on the fit of a PUE in specific residential energy systems, reflecting residents' distinct socioeconomic and demographic characteristics.
The residential load profile sets are labeled as
- •
“Representative demand”: five residential loads, including three Cluster 1 loads (“low-consumption”) as the most common cluster, one Cluster 0 load (“high-consumption), and one Cluster 2 load (“nighttime consumption”). This set reflects the overall percentage distribution of all samples. Annual residential demand: 101 kWh.
- •
“Low demand”: five residential loads of Cluster 1 (“low-consumption”). Annual residential demand: 43 kWh.
- •
“High demand”: five residential loads of Cluster 0 (“high consumption”). Annual residential demand: 202 kWh.
- •
“Low demand with nighttime load”: four residential loads of Cluster 1 (“low-consumption”) and one load with Cluster 2 profile representing a nighttime load (public lighting). Annual residential demand: 70 kWh.
- •
“High demand with nighttime load”: four residential loads of Cluster 0 (“high consumption”) and one load with Cluster 2 profile representing a nighttime load (public lighting). Annual residential demand: 196 kWh.
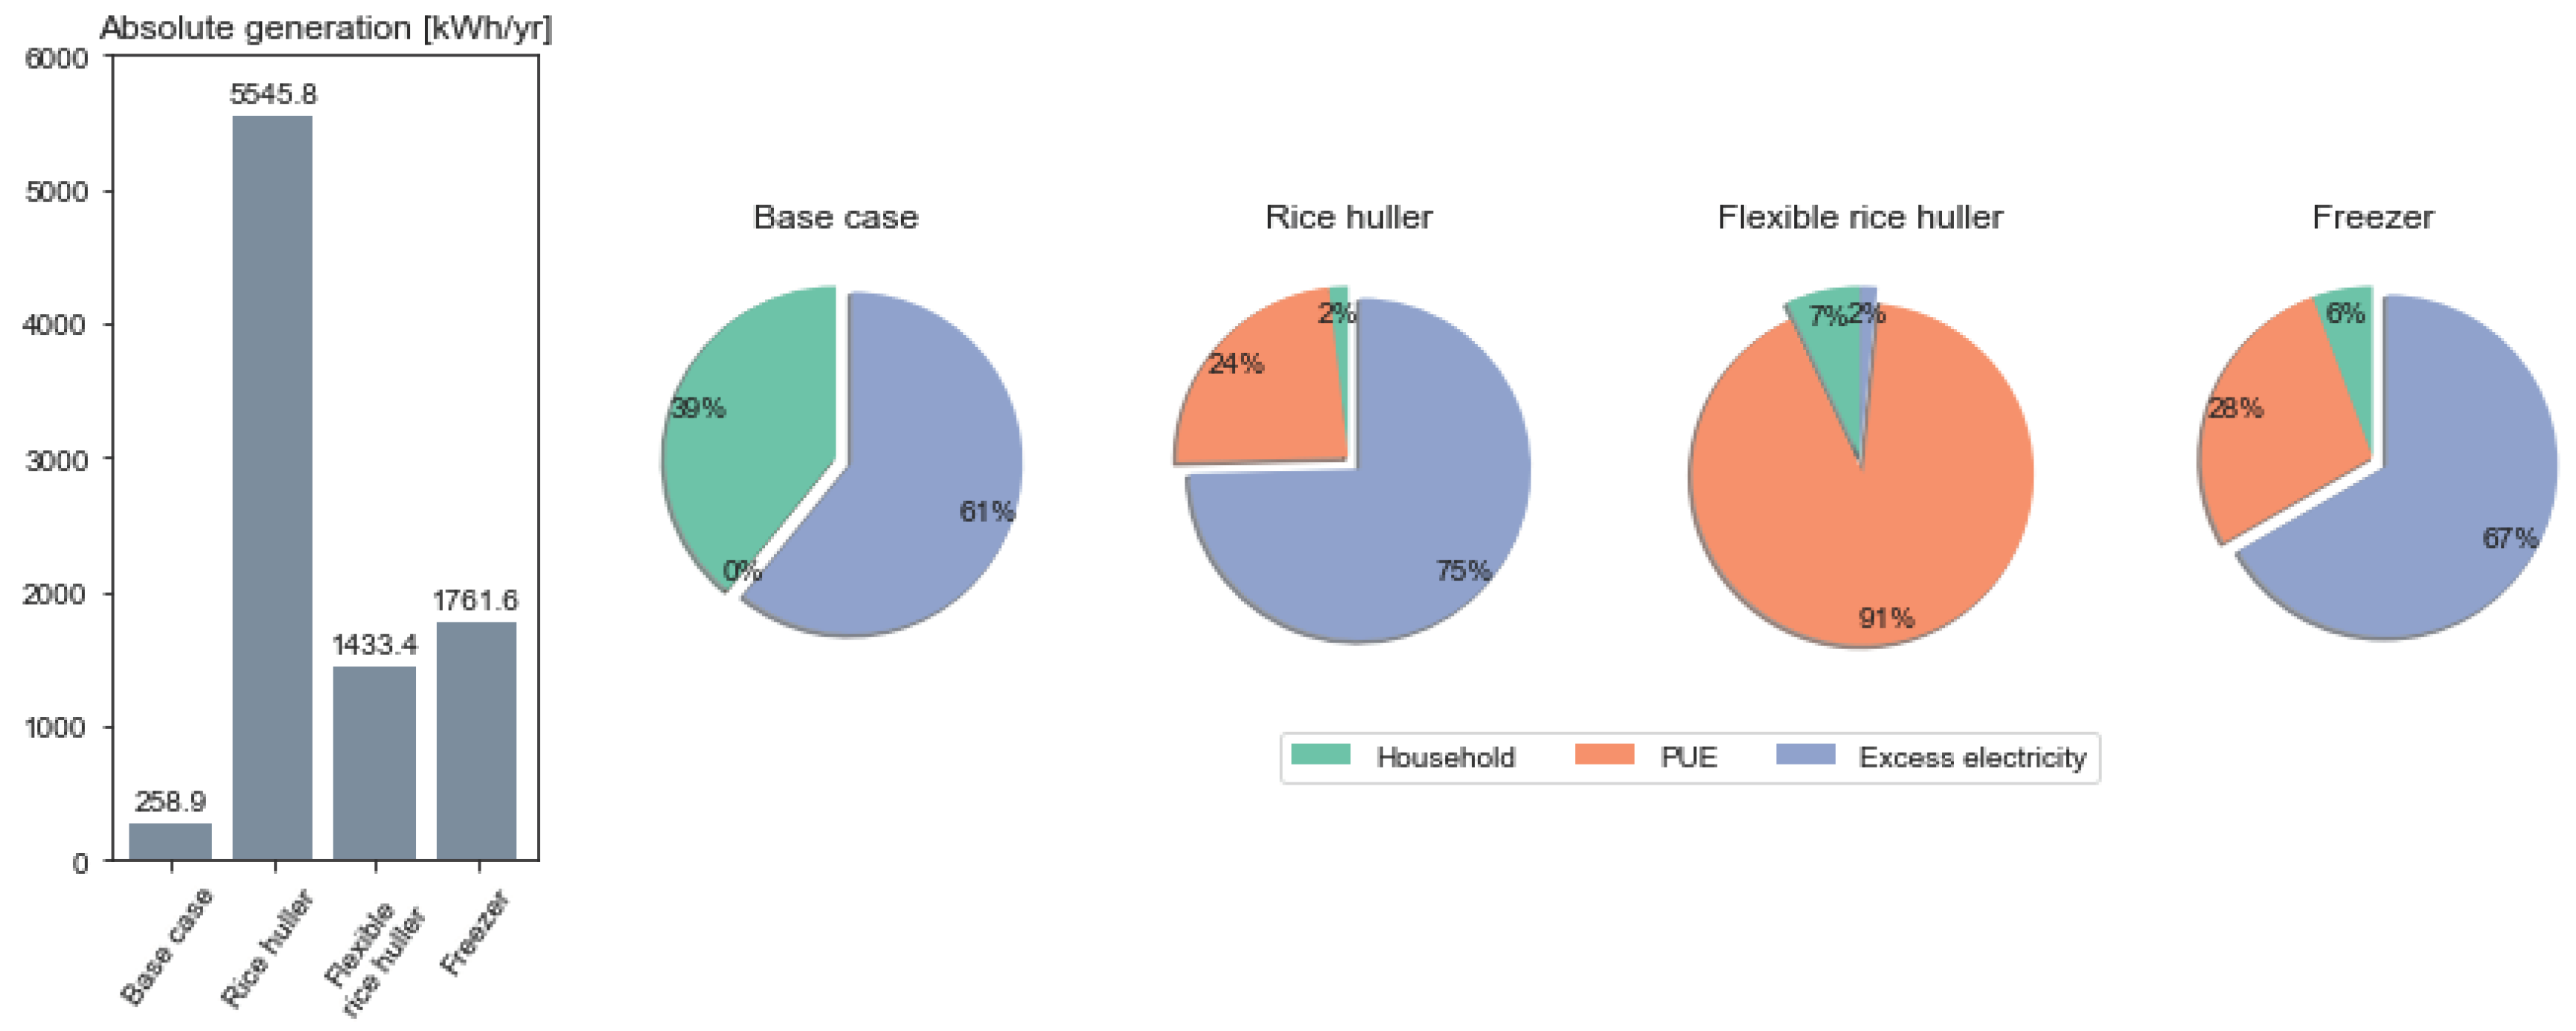
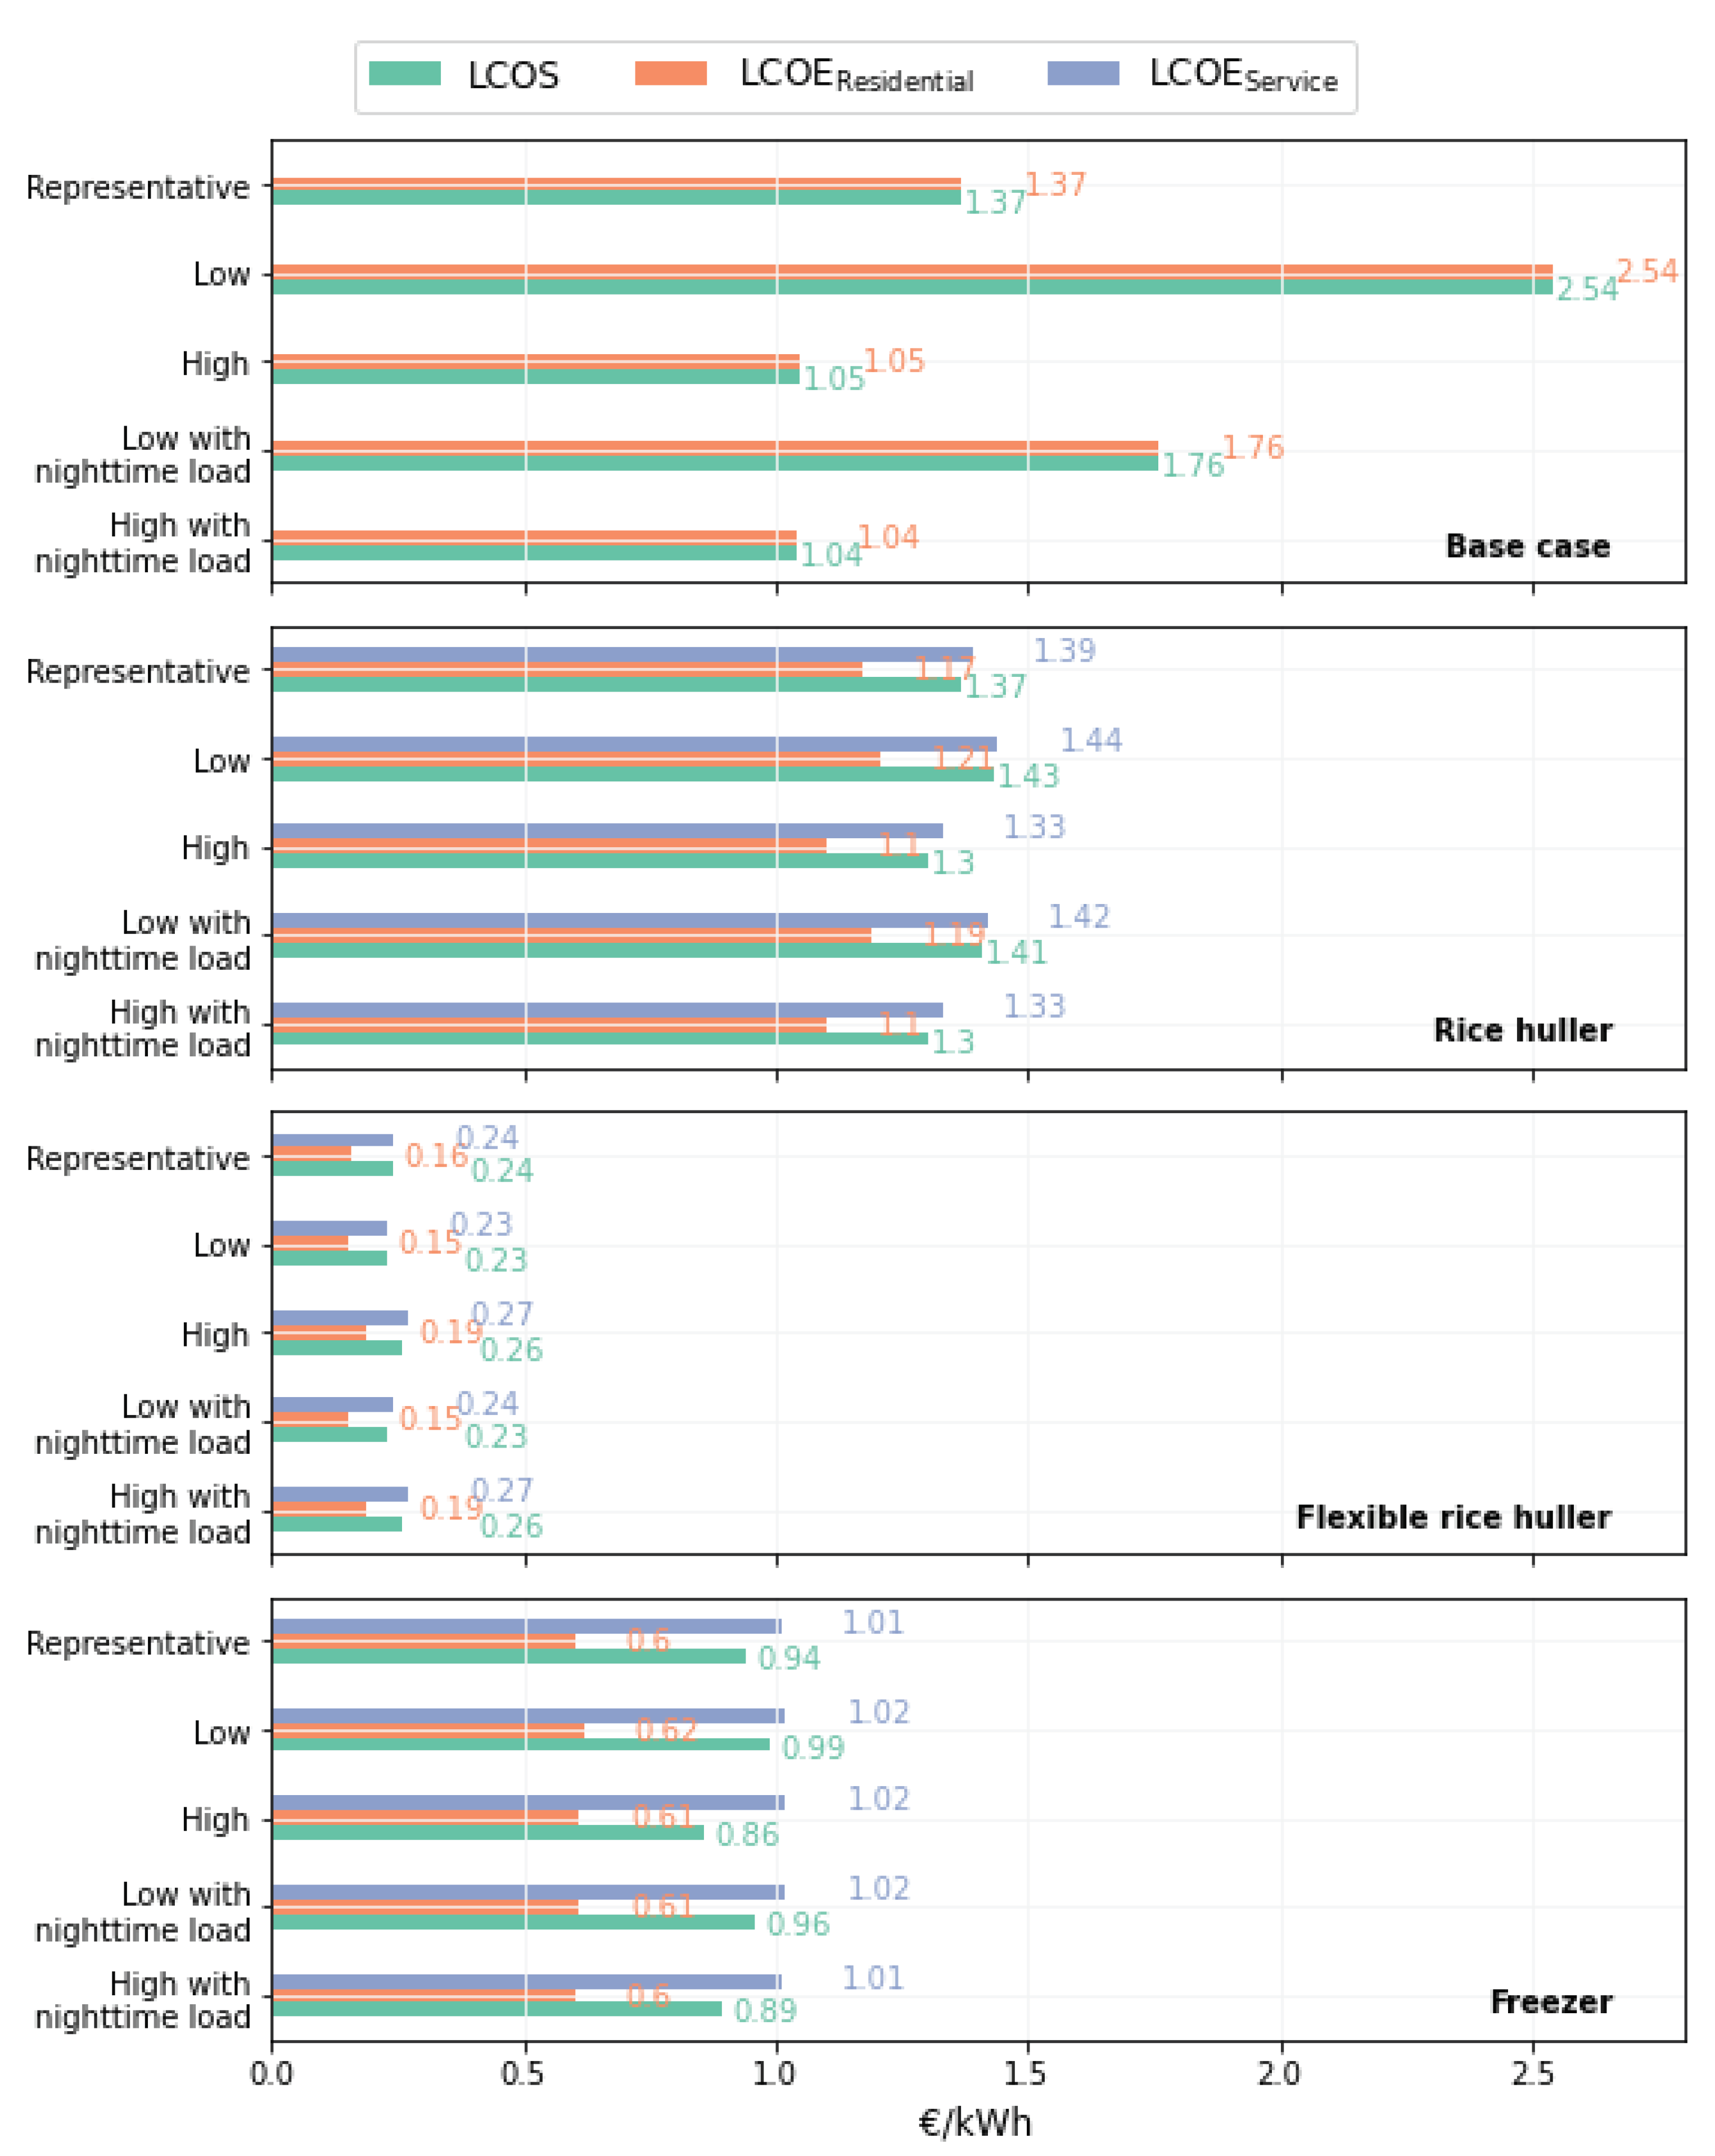
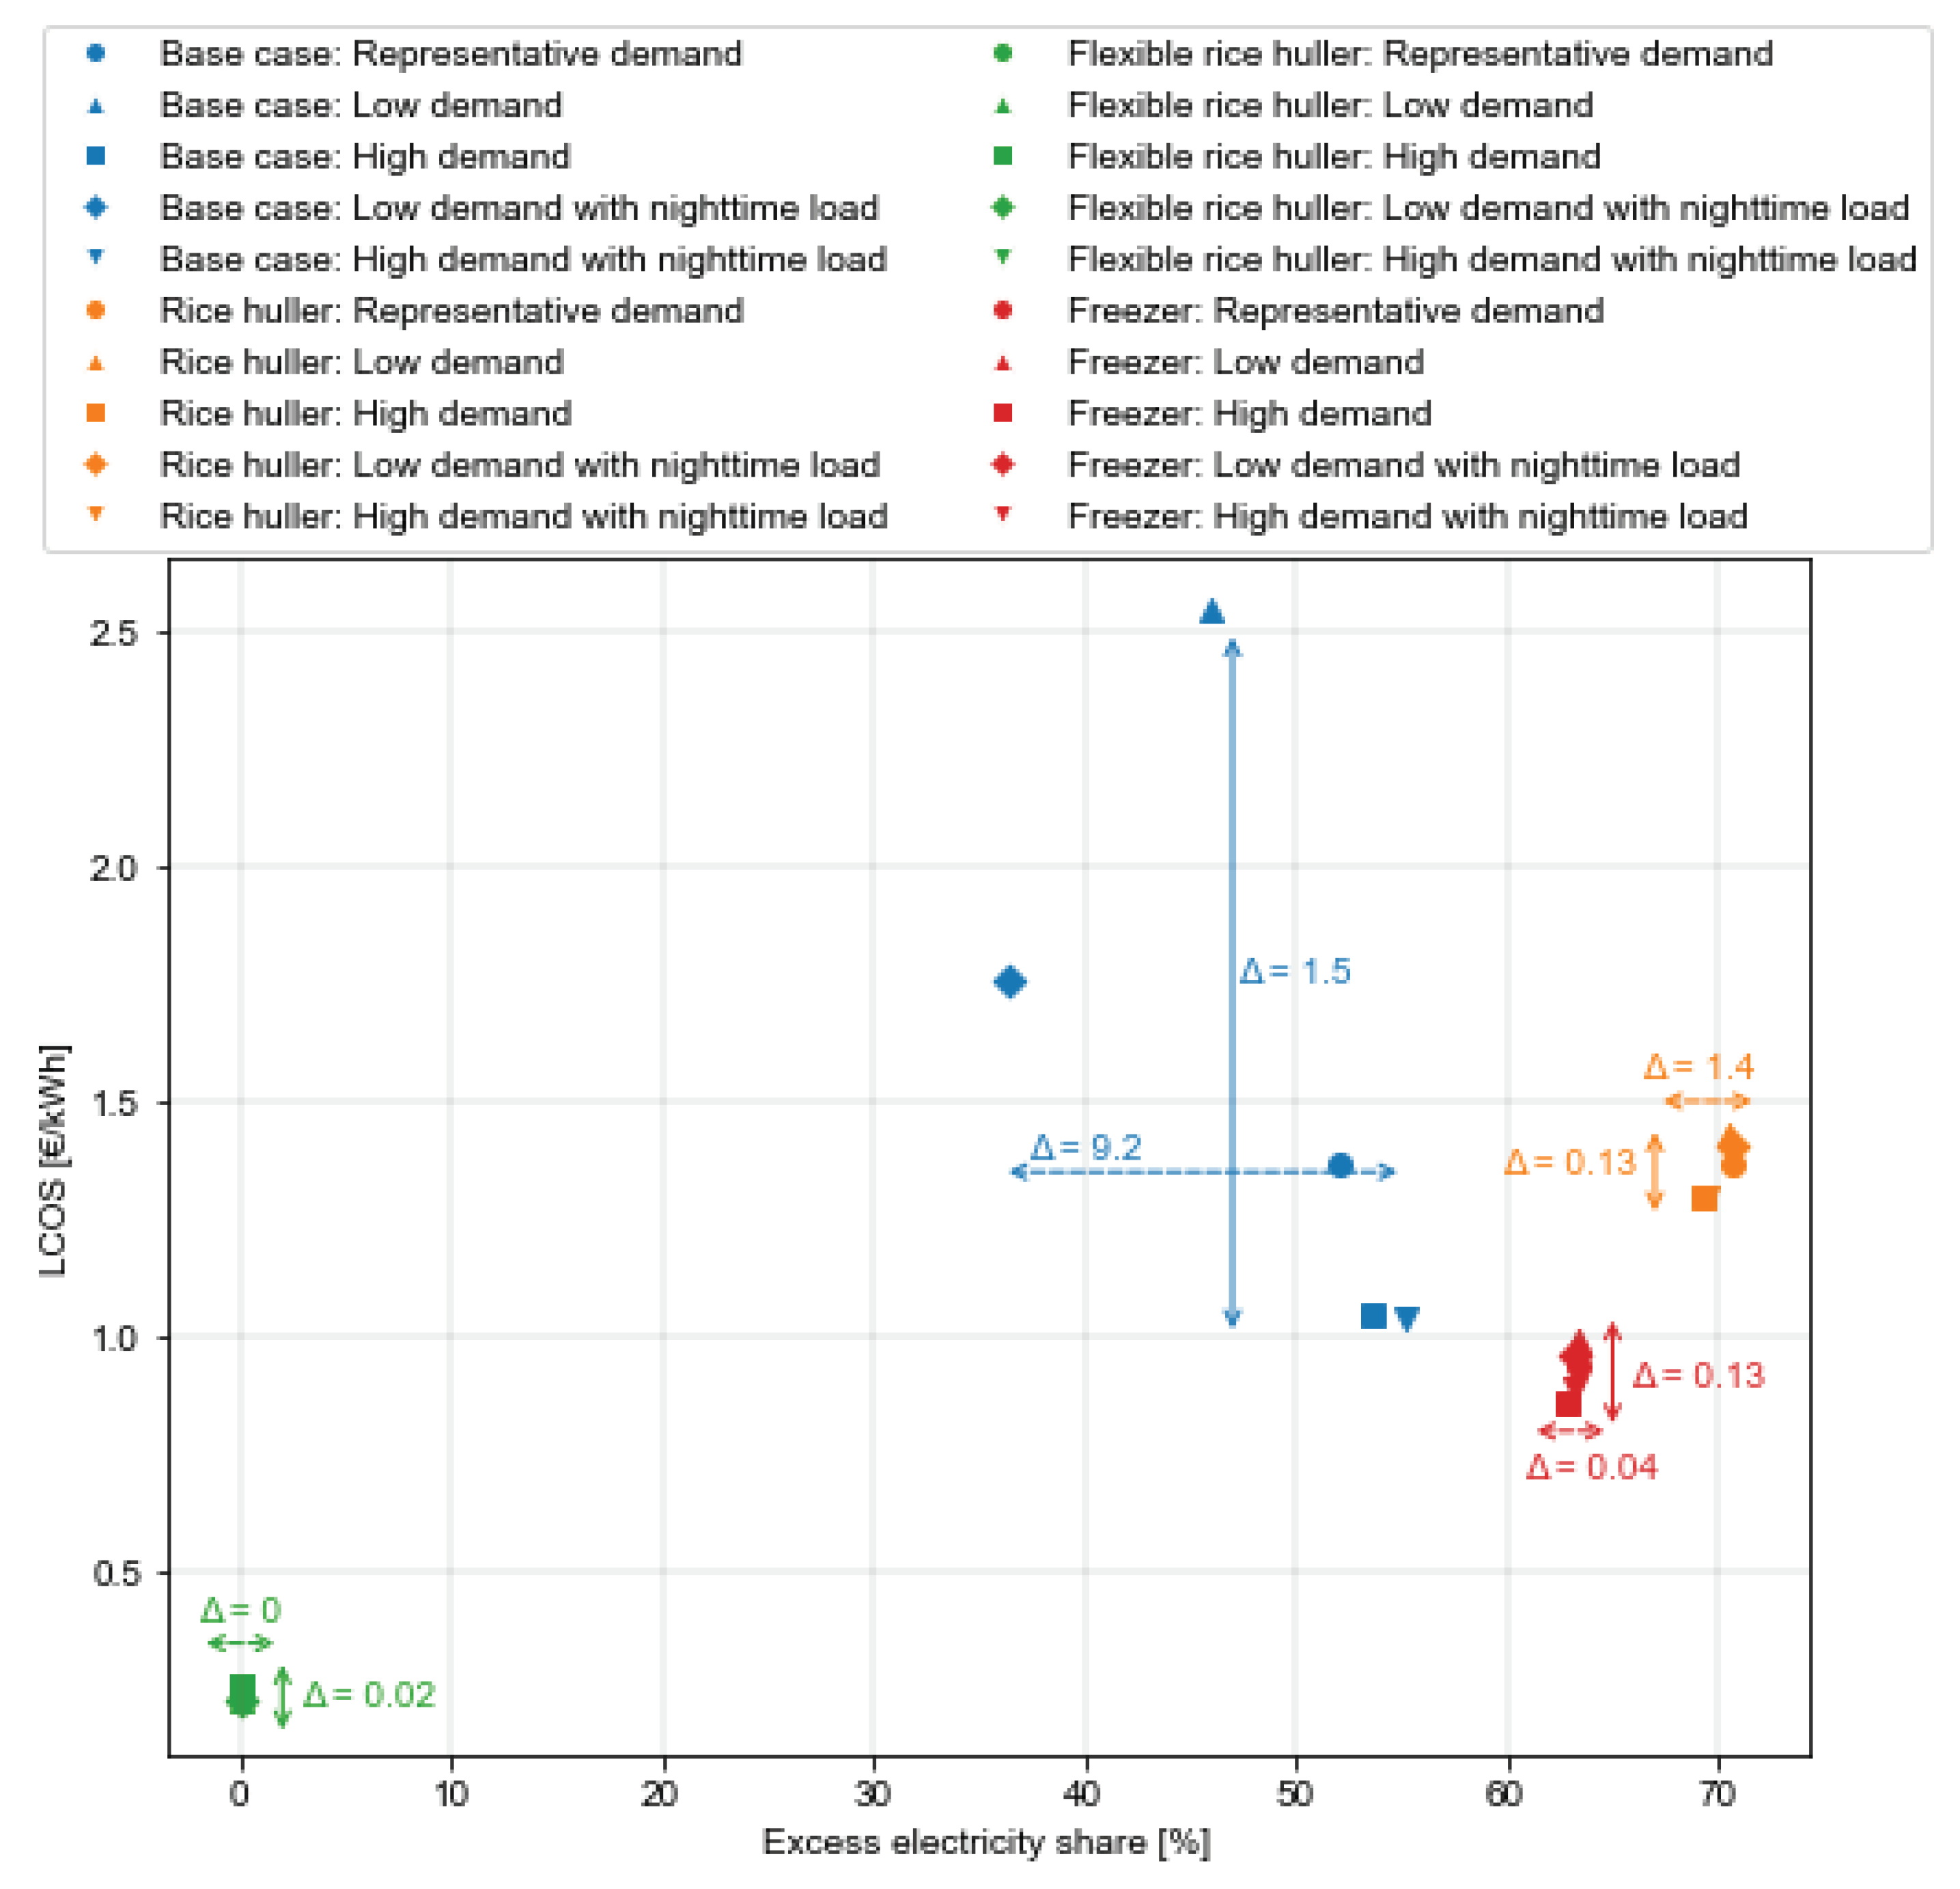
We evaluate the integration of PUE within the different compositing residential energy systems on technical metrics in Figure 6 - taking the example of a representative residential electricity consumption patterns (see Table A3 of the Appendix for all scenarios and compositions) and economic metrics in Figure 7.
Figure 6.
Annual energy generation (kWh/yr) (left) and share of energy consumption of residential loads, PUE loads, and excess generation across the different PUE integration scenarios for the example of the representative demand residential load profile set.
Figure 6.
Annual energy generation (kWh/yr) (left) and share of energy consumption of residential loads, PUE loads, and excess generation across the different PUE integration scenarios for the example of the representative demand residential load profile set.
For interpreting the economic results illustrated in Figure 7 we may compare
i) the difference of within one PUE integration scenario across the different residential load profile sets to understand the suitability of the specific PUE for different communities
ii) the difference of across different PUE integration scenarios within one specific residential load profile set to understand the best fitting PUE for the respective socio-economic character of the community
iii) the distribution of , and within each combination of PUE integration and residential cluster composition to understand the share of costs associated with supplying electricity to the residential users or the PUE appliance.
Below, we highlight some of the key results derivable from Figure 7 per PUE integration scenario:
Figure 7.
Economic results of the PUE integration scenarios across the different residential load composition sets.
Figure 7.
Economic results of the PUE integration scenarios across the different residential load composition sets.
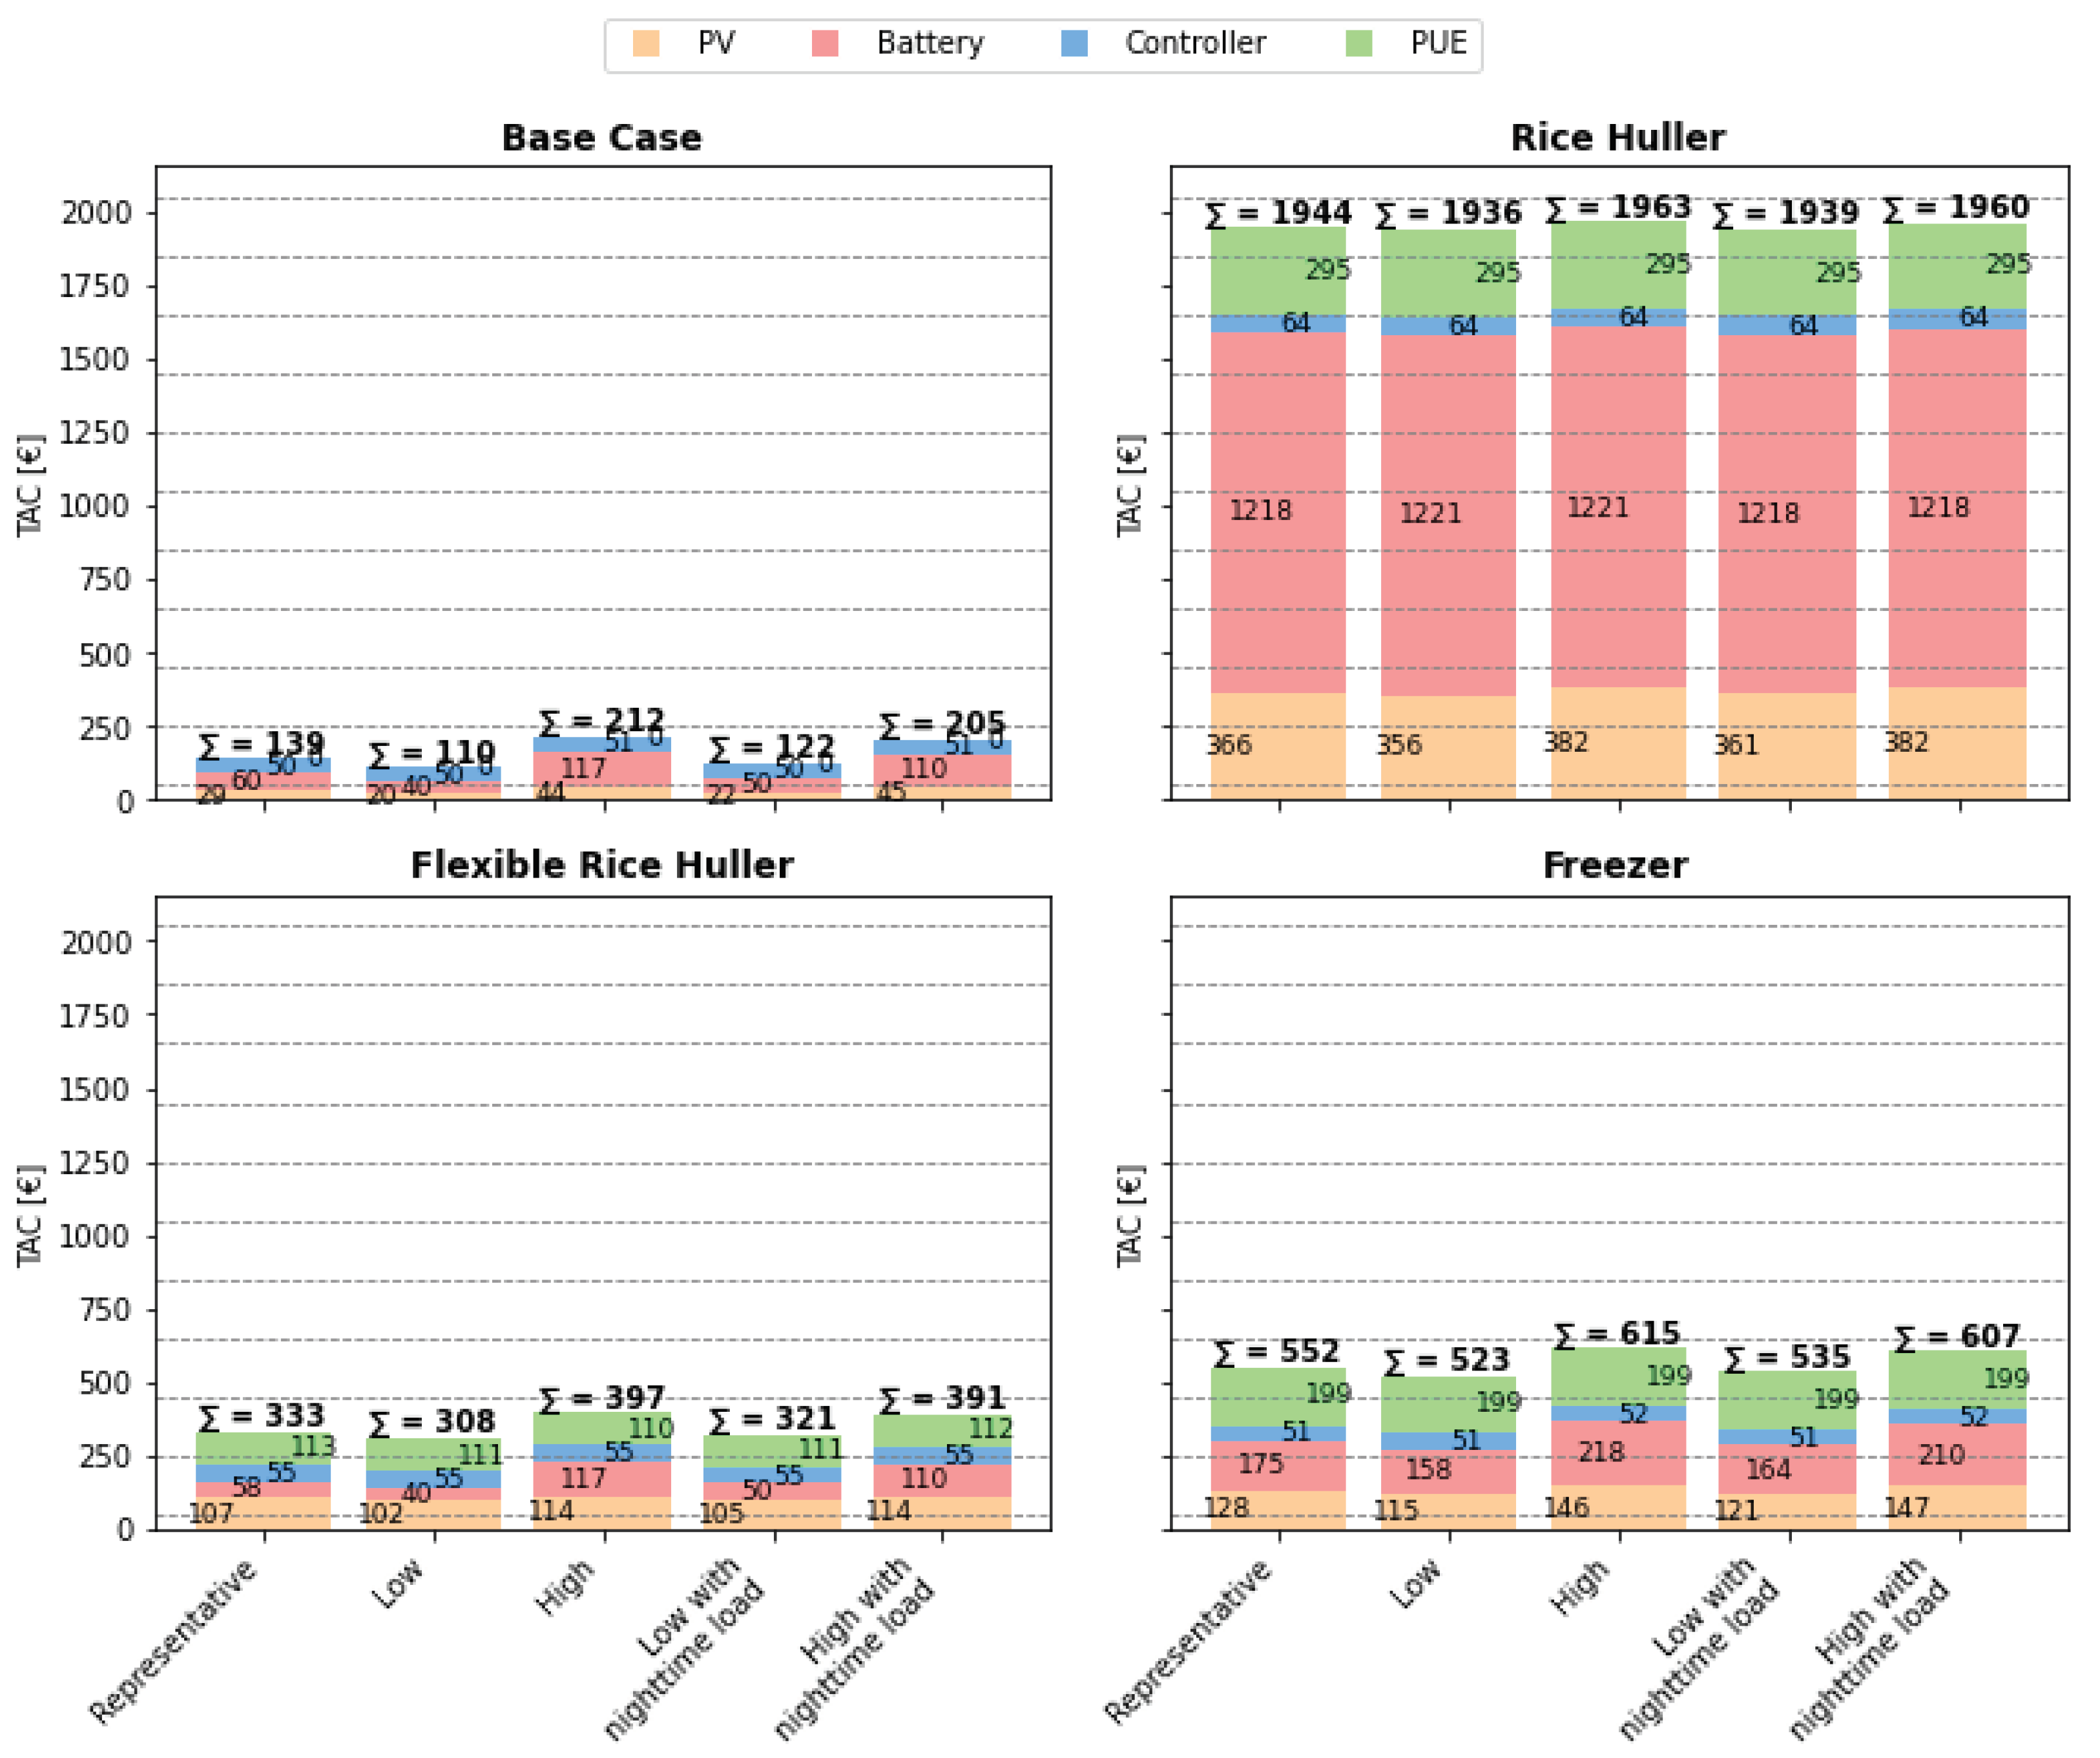
Scenario: Base case residential nanogrid: Supplying only residential loads, the optimized energy system considering a representative demand residential load profile set consists of 160 Wp PV and 560 Wh battery storage. The costs of the system are dominated by battery storage (43% of the TAC); see Figure 8. Considering a low demand profile set characteristic for a community significantly consisting of residents subscribing for the “Eco tariff” and characterized by owning only a few appliances (light bulbs) with a high share of farmers results in lower total system costs (110 €/yr. vs. 205 €/yr.). However, the relative costs of supplying electricity compared to an opposed high demand consumption expected in communities with a significantly increased share of traders, many change-in-tariffs towards multimedia tariff, and many LED bulbs identified are higher. This tendency can increase when considering public lighting as a nighttime load (high demand with nighttime load) to be included in the residential energy system with relatively high demand.
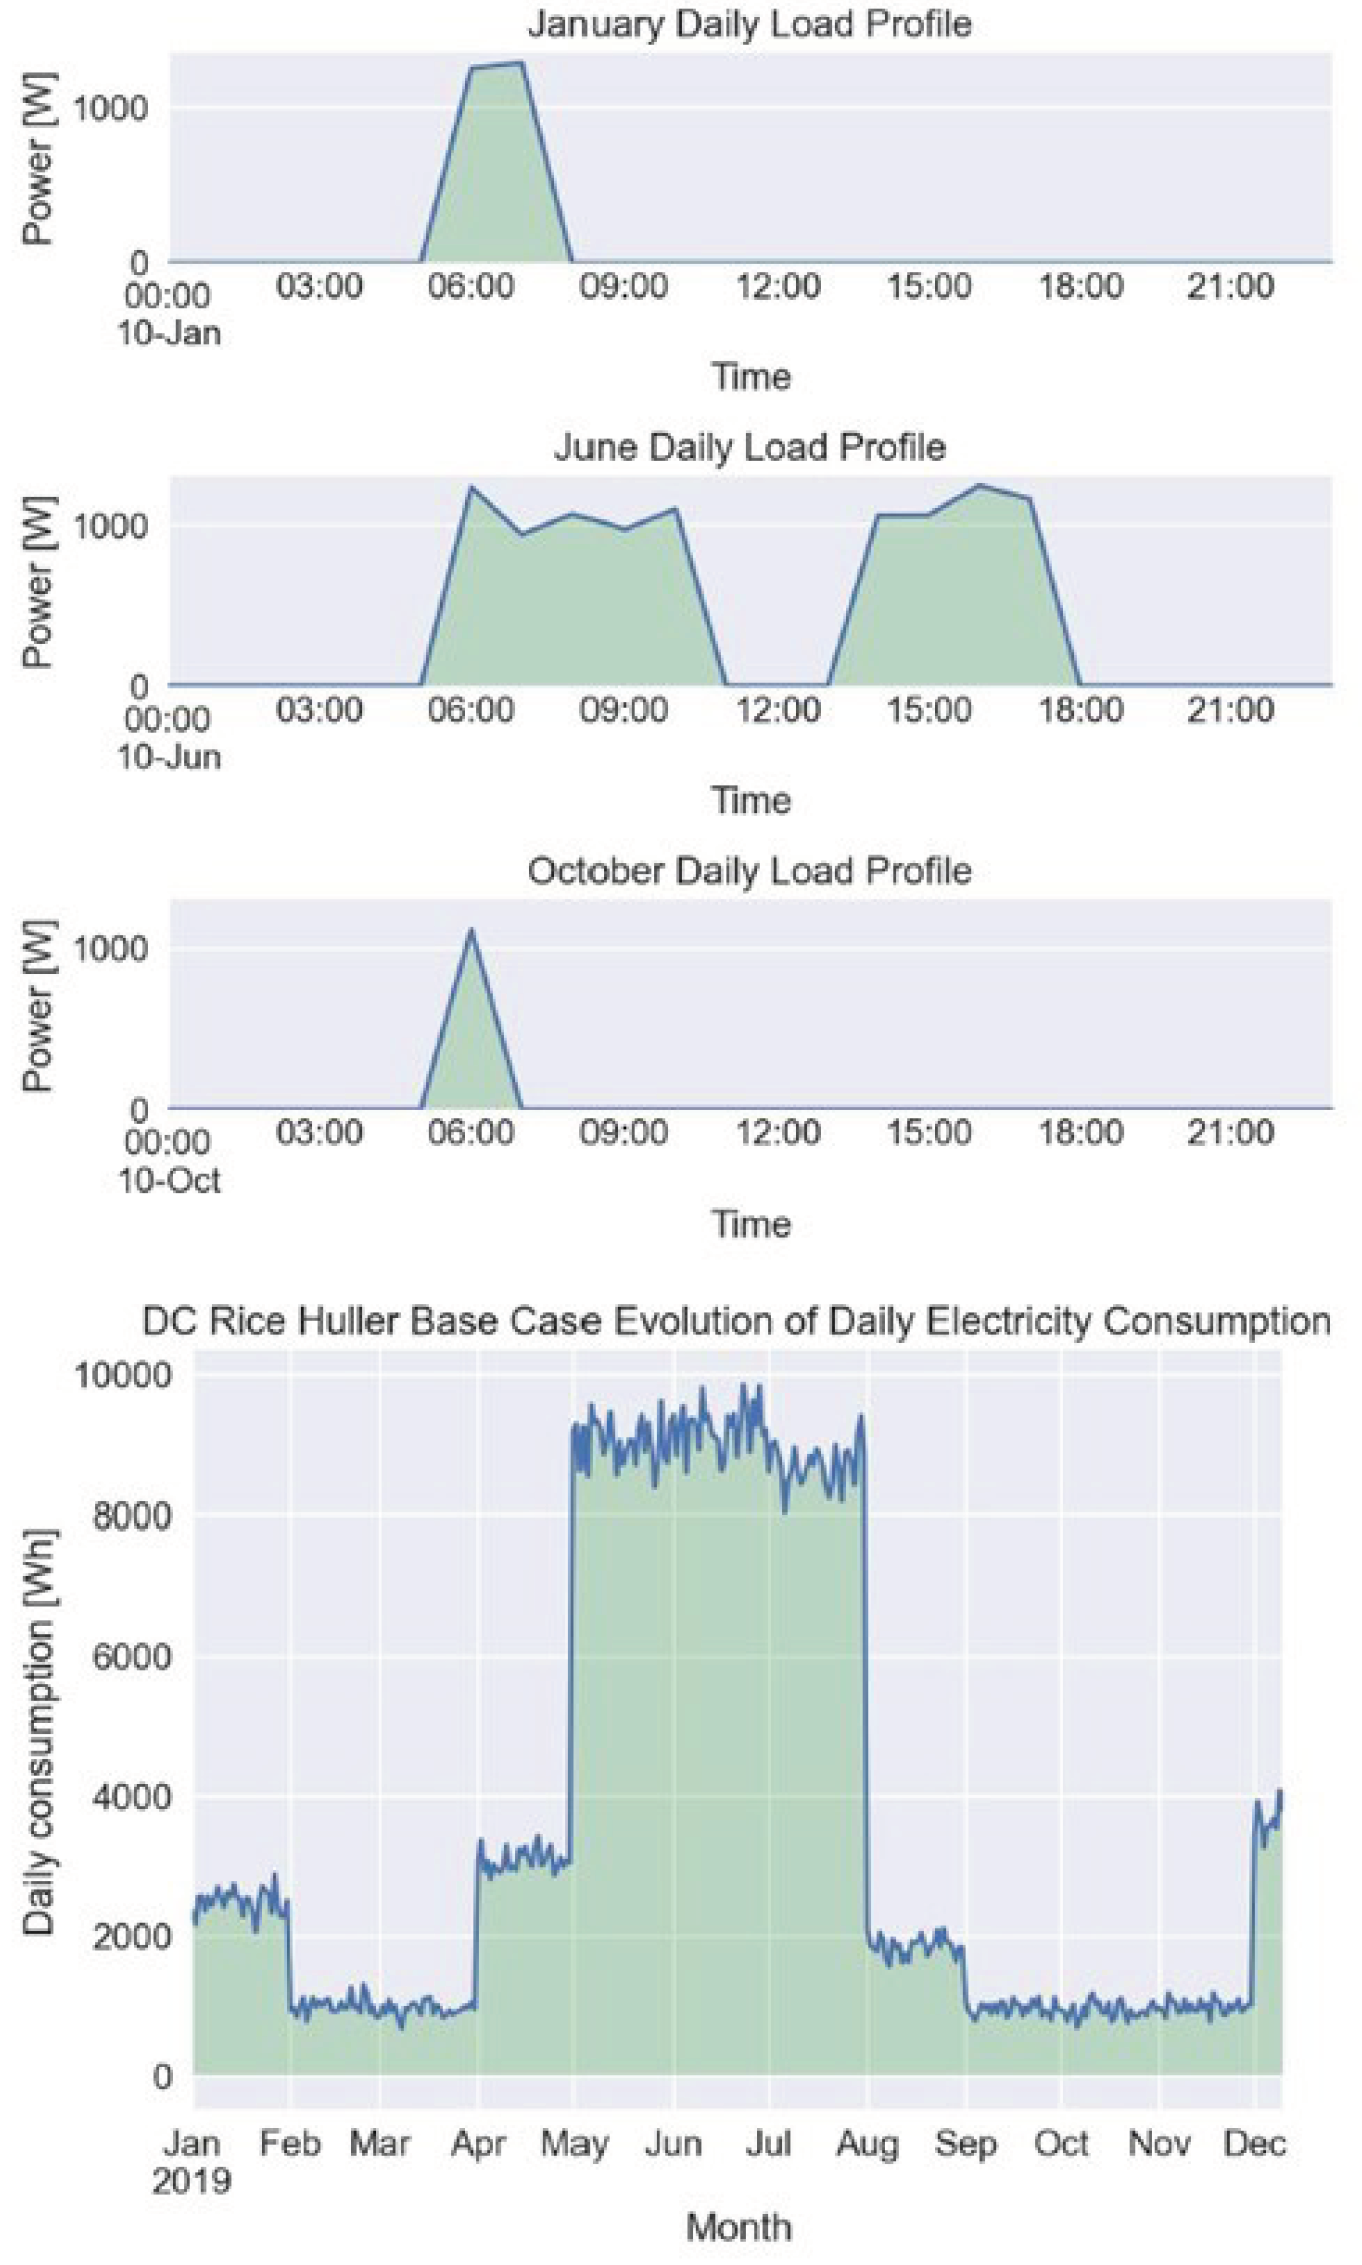
Scenario: Integrated rice huller: Integrating a DC rice huller following current consumption patterns of fossil alternatives into a residential energy system increases the TAC of the system by ten times (
high demand residential load profile set) or up to 20 time (
low demand residential load profile set). The costs of the rice huller – with an optimized capacity of 1.57 kW
el – account for 15% of the total system costs. However, with the PUE load dominating the share of energy consumed in the nanogrid (sixfold the residential consumption in a
high demand residential load composition set, see
Table A3), it also dominates the system costs. Hence, the benefits of integrating the rice huller towards reducing the
depend on the residential load composition set, reflecting a different socio-economic and demographic community composition. With the rice huller relatively increasing the costs of electricity production (as seen by the
exceeding the
under any residential load composition set), we observe increasing
when including a rice huller in a
high demand load profile composition set – while we observe beneficial effects to the
when increasing the utilization of
low demand residential load compositions. With splitting the costs across residential and PUE via energy shares (see
Section 2.1), the
may decrease by 1.35 €/kWh (see a related discussion on cost distribution in Section 4). However, we must therefore carefully note that the integration of PUE can actually result in higher cost for residential electricity consumption (based on the applied calculation of electricity cost), if the two load profiles conflict.
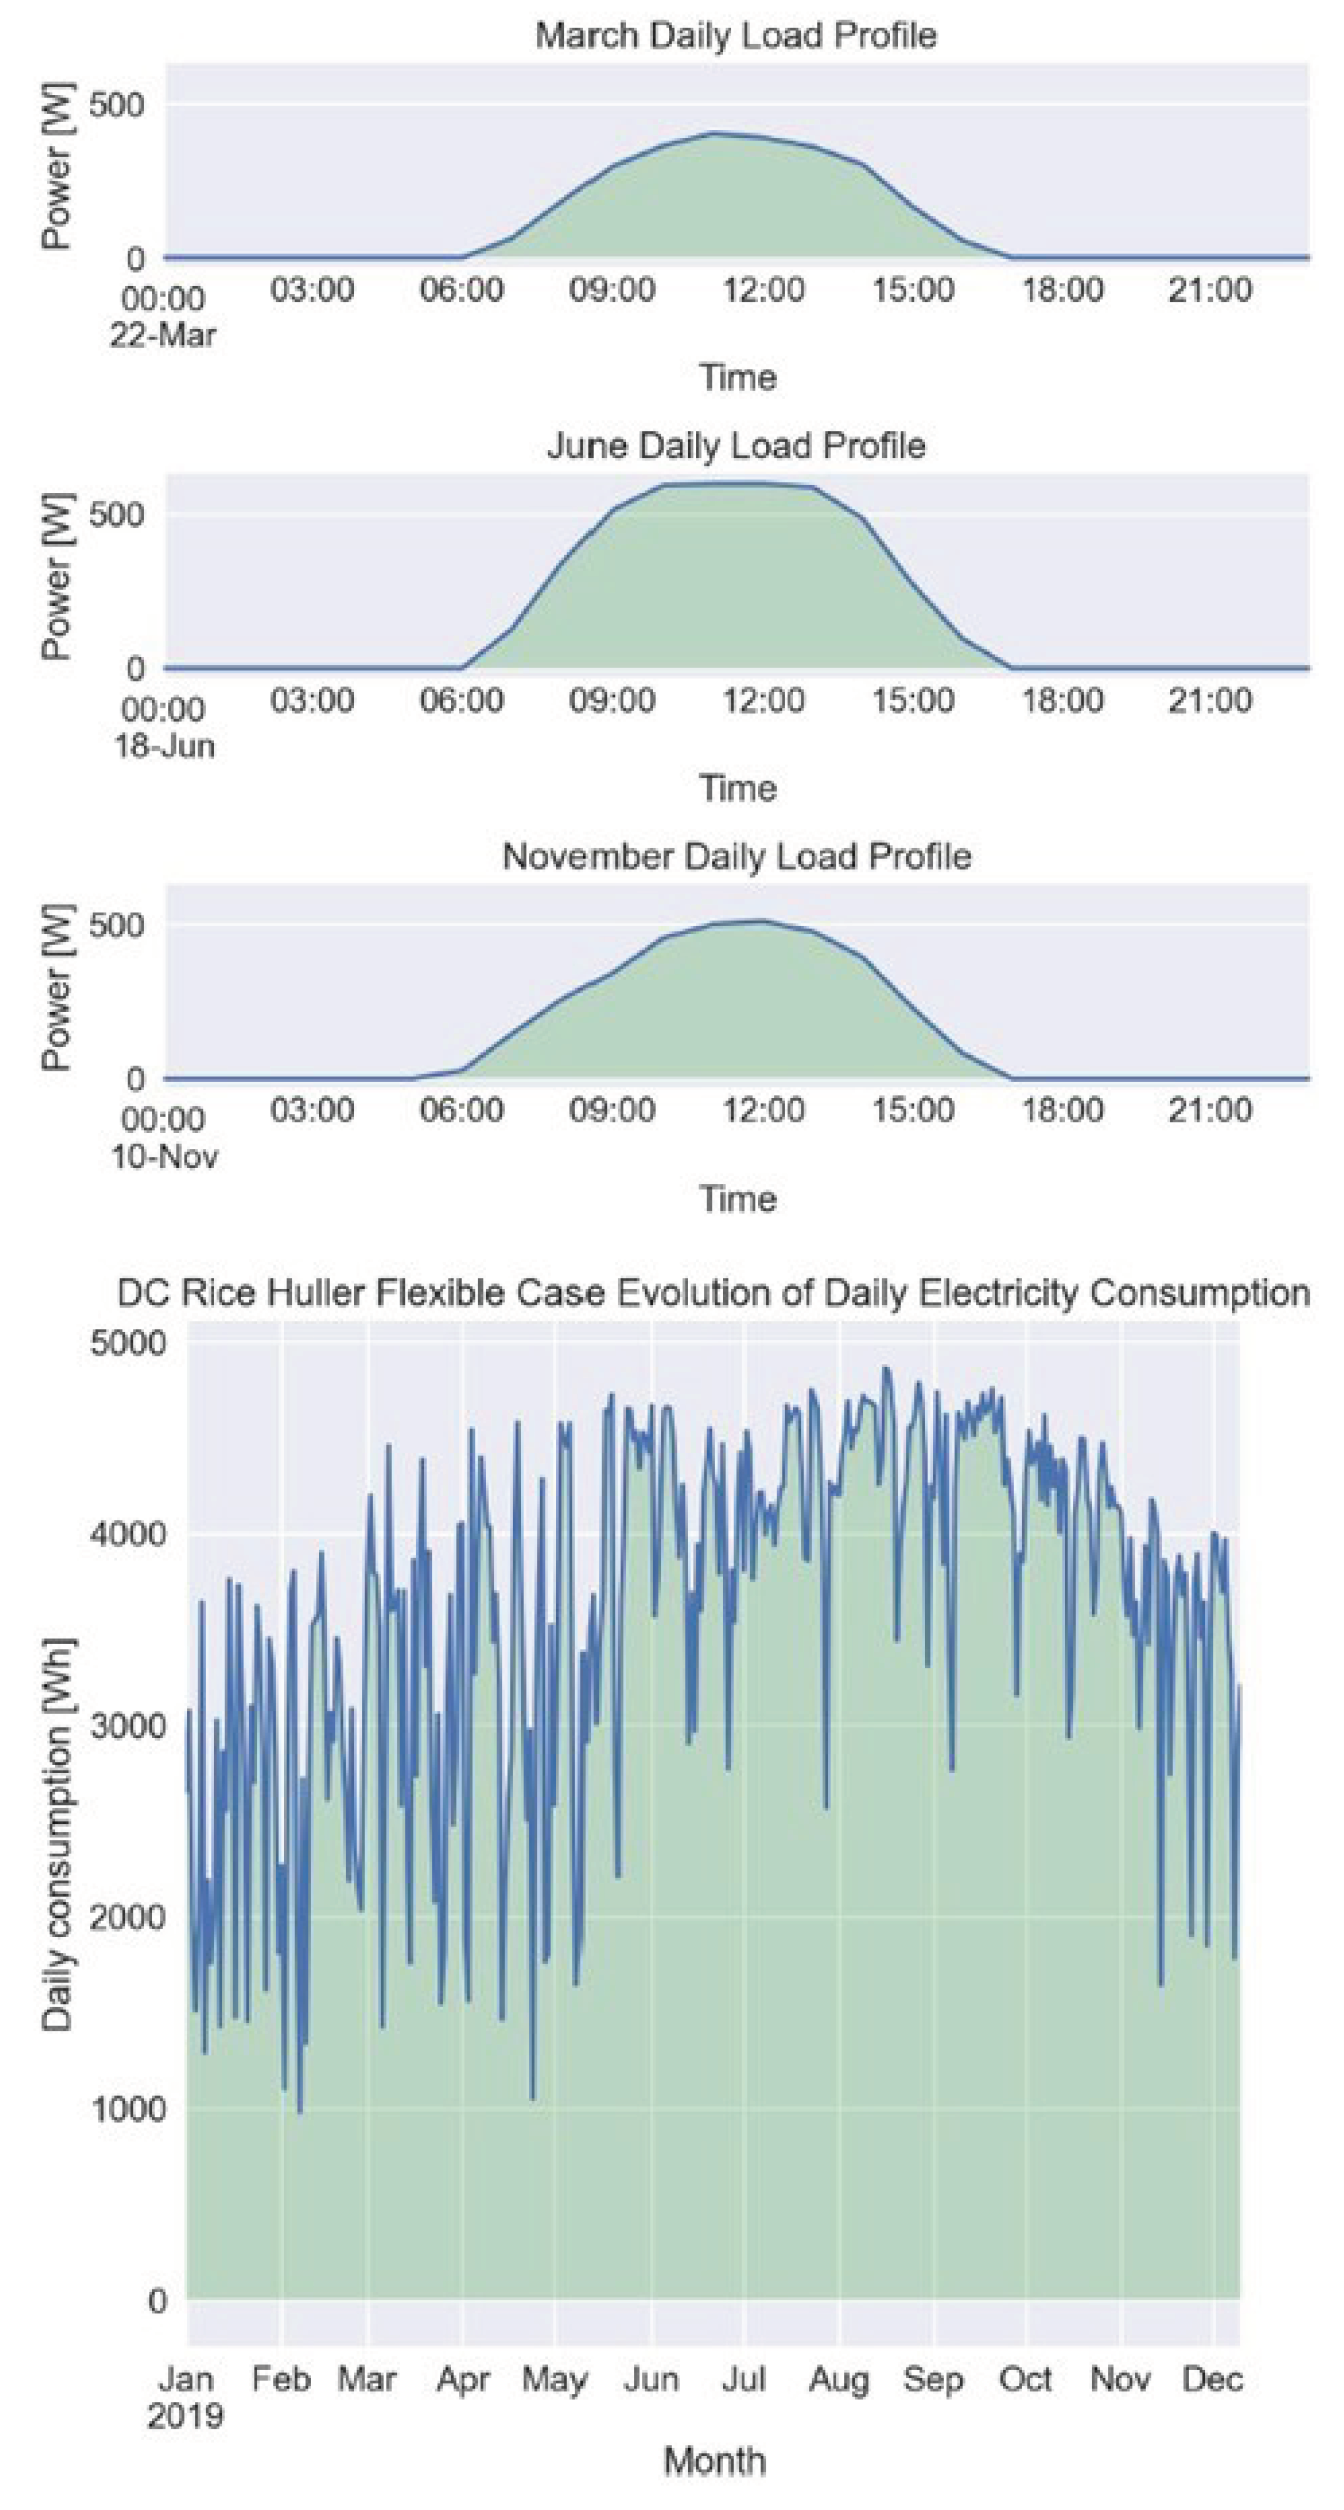
Scenario: Integrated flexible rice huller: Assuming the DC rice huller to have total ‘operational freedom’ and only requiring a minimum throughput within one year is an unrealistic extreme (assuming abundant rice resources, and ubiquitous storage opportunities). However, some increased flexibility in the operation – ergo, some changes in the usage patterns of the asset users compared to current usage patterns of fossil counterparts – can arguably be expected to a certain degree to facilitate operational constraints imposed by the DC system (see Section 4 for a related discussion). Comparing the results with the ones of the constrained rice huller scenario shows the significant cost reduction achievable when increasing the flexibility of PUEs, which is unlocked by shifting the load of the PUE towards the peak PV irradiation hours with least conflicting residential loads; thus, avoiding costly energy storage (see
Figure A2 for a representative load profile). The required power of the PUE asset is reduced to 0.6 kW
el (compared to 1.57 kW
el). Further, the additional amount of PV and battery to be installed is reduced compared to a residential system to satisfy the PUE load. While for example, in a
representative demand residential household composition set, the optimal size and associated share of TAC of the PV and battery exclusively feeding residential loads are 160 Wp and 0.56 kWh, the size and costs (see
Figure 8) increase to 3.43 kWp (20% of the TAC), and 13.28 kWh (60% of the TAC) respectively when integrating a DC rice huller following the load profile of fossil alternatives currently used (
scenario: integrated rice huller). However, when maximizing the flexibility of the huller (
scenario: integrated flexible rice huller), the required PV size increases to ca. 900 Wp compared to the residential system, while the battery size remains the same compared to feeding only residential loads. Hence, significant battery costs can be saved when increasing the flexibility of the PUE to be operated at peak irradiation times. Consequentially, with the amount of energy consumed in the nanogrid being dominated by the rice huller (see
Table A3), achieving low costs of supplying the rice huller with electricity due to its operation harnessing excess electricity of the residential grid only, the
can be reduced to less than 0.3€/kWh. Significantly, by smoothening the load curve in low-demand consumption scenarios, increasing the total system utilization, and reducing the excess electricity share (see
Table A3), the cost-efficiency measures are improved compared to a
high demand residential load profile set (see
Figure 7).
Scenario: Integrated freezer: Integrating a freezer into the energy system quadruples the TAC of the nanogrid when considering a low demand residential load composition set of the community (552 €/yr. vs. 139€/yr.) and triples the costs assuming a high demand residential community set (607 €/yr. vs. 205€/yr.) (see Figure 8). There is only a slight variance in the , suggesting that the applicable consumption composition has little impact on the cost of electricity provision for households. The comparison of the base case residential nanogrid only feeding residential loads and the integrated freezer scenarios reveals that through the integration of the freezer, the can be reduced substantially. For the low demand residential load composition set, the are reduced by 75% and for the high demand consumption composition the are reduced by 43%. Compared to the integrated rice huller, the PV and battery optimized capacity and share of costs of the TAC are 1.1 kWp (23% of TAC) and 1.84 kWh (31% of TAC) – the latter of which is a sixth of the capacity required to satisfy the rice huller. Notably, the freezer device (150 W) constitutes a third of the TAC (198€/yr), see Figure 8.
Figure 8.
Share of energy system asset costs of total annualized costs for the different residential load profile sets and PUE integration scenarios.
Figure 8.
Share of energy system asset costs of total annualized costs for the different residential load profile sets and PUE integration scenarios.
