Preprint
Article

Using Optical Sensor Applied to Rapid Soil Test Kit for NH4+ and NO3- in Soil

Altmetrics

Downloads

98

Views

65

Comments

0

Submitted:

24 March 2024

Posted:

26 March 2024

You are already at the latest version

Alerts
Abstract
This study aims to construct simple devices to ascertain the concentrations of ammonium (NH4+) and nitrate (NO3-). The device structure comprises a visible and near-infrared absorption meas-urement room, along with an RGB (red, green, and blue) absorption measurement room, con-stituting the two measuring rooms. Both the measurement rooms are equipped with light sources and detectors configured to operate in opposed or thru-beam modes. A tiny processor is utilized for processing the measurements, with an algorithm implemented within its memory. During the algorithm development phase, ranges for measuring the quantity of nutrients were categorized using a discriminant analysis approach. Thirty percent of the soil sample data were utilized as verification data, while the remaining 70 percent served as training data. Nutrient content values from reliable measuring instruments were incorporated into all datasets. Discriminant analysis was employed to classify the amount of NH4+ into five ranges based on the test results. When tested with soil samples, the accuracy was 66.13% compared to the reference value of a reliable measuring device. Similarly, NO3- was classified into four ranges with an accuracy of 81% com-pared to the reference value of a reliable measuring device.
Keywords: 
Subject: Computer Science and Mathematics  -   Artificial Intelligence and Machine Learning

1. Introduction

Soil health tests have been developed to assess and identify soil limitations [1]. A soil quality test kit is an on-farm instrument designed to monitor changes in soil quality [2]. According to [3], using a scientifically developed and rigorously tested soil sampling protocol will reduce variability in measured soil Olsen P, pH, and other soil test nutrient levels over time in hilly terrain. This, in turn, will allow more accurate recommendations for fertilizer nutrient requirements. The results from the soil test kit can be utilized to build a sustainable soil management strategy as well as a future research agenda for farms.
Nutrient management technologies are crucial for precise soil fertility and for enabling efficient agricultural production [4]. However, the labor-intensive process of acquiring and processing soil samples is costly [4]. On-the-go vehicle-based sensing systems can efficiently characterize soil macronutrient variability, enhancing management efficiency [5].
Ammonium and nitrate are the primary forms of nitrogen that plants can utilize [6]. Their conversion is driven by ammonia-oxidizing bacteria and archaea, which also play a role in plant defense [7]. Besides nitrate (NO3-), ammonium (NH4+) stands out as a significant source of nitrogen for plant nutrition [8]. The total nitrogen budget in agricultural soils can be enhanced, and maize growth can be enhanced by small additions of ammonium to low nitrate levels [9]. Many agricultural soils contain millimolar quantities of NH4+, which serve as essential nitrogen sources for plant development [10]. Approximately 60% of worldwide N2O emissions originate from agricultural soils, primarily due to synthetic nitrogen-containing fertilizers [11]. The predominant substrates in these soils are nitrate, which contributes 62%, and ammonium, which contributes 34%, respectively [12].
A low-cost soil health test has been developed to provide an integrated assessment of the physical, biological, and chemical aspects of soil, facilitating better soil management. Acting as an excellent screening tool for point-scale assessment of soil quality, a soil quality test kit offers accurate and precise results across various soil conditions [13]. This tool proves useful for comparing relative differences in surface soil parameters on farms [2]. Comprising two instruments, the soil test kit assists farmers and field employees in assessing soil quality [14]. This low-cost soil health test aims to enhance soil management by integrating assessments of the physical, biological, and chemical characteristics of soils [1].
Light-emitting diodes (LEDs) find extensive use in chemical sensors [15] owing to their miniaturization and energy-saving properties [15]. Renowned for their brightness, compactness, and longevity, LEDs are ideal for online chemical detection [16]. Moreover, LEDs can enhance production in non-chlorophyll-based plant cultivation [16]. Optical sensors have been developed to accurately detect soil nutrients [17,18] and facilitate agricultural and food analysis processes [18,19].
Effective spectral variable selection is crucial for improving multivariate models in spectrum modeling analysis. Various techniques such as preprocessed spectra, wavelet transforms, partial least squares, and an Extreme Learning Machine have been employed to identify sensitive wavelengths, resulting in models with superior performance [20].
The objective of this project was to determine the concentrations of NH4 and NO3 to build a basic device. The device construction consists of: two measuring rooms are an RGB (red, green, and blue) absorption measurement room and a visible and near-infrared absorption measurement room.

2. Materials and Methods

2.1. Conception Framework of MJU Soil Tester

The measurement chamber must be capable of shielding itself entirely from external environmental interference, particularly light, due to the sensor’s sensitivity to ambient light. To achieve this, a lightweight chamber design was employed. Within the measurement chamber, three main sections (Figure 1) were positioned. The MJU soil tester comprises important components, with two inner measurement chambers utilized (Figure 1). The first chamber housed a compartment for storing the sample solution, while the second part accommodated the light sources, namely visible (VIS) and near-infrared (NIR) light, with the last part housing the detection sensor (Figure 1). To cater the unique properties of soil nutrients (i.e., NH4+ and NO3-) across various concentrations of soil nutrient solutions, the light source (e.g., LED) could be adjusted accordingly for different nutrients and their concentrations. The MJU soil tester utilized a three-color (RGB) transmission mode sensor, referred to as Thru Bream, which served both as the light source and the light detector components of the device. Positioned on opposite sides of the light source, a 32-bit microcontroller operated the three-color transmission mode sensor, serving as the data-processing part.
The algorithmic components were integrated into a small 32-bit processor capable of receiving readable light. Using this algorithm, we processed the nutrients present in each type of soil. The reading of light intensity was transformed and processed by a predictive equation installed in a 32-bit microcontroller, which then determined the NH4+ (or NO3-) content using preset calibration formulas and showed the NH4+ (or NO3-) concentration on a TFT LCD touch screen in ppm units (Figure 1). In addition, it was designed to allow users to operate it by selecting commands displayed on this type of screen. The final component was a low-noise power supply that maintained a constant voltage.

2.2. LED Light Source and Sensor Detector

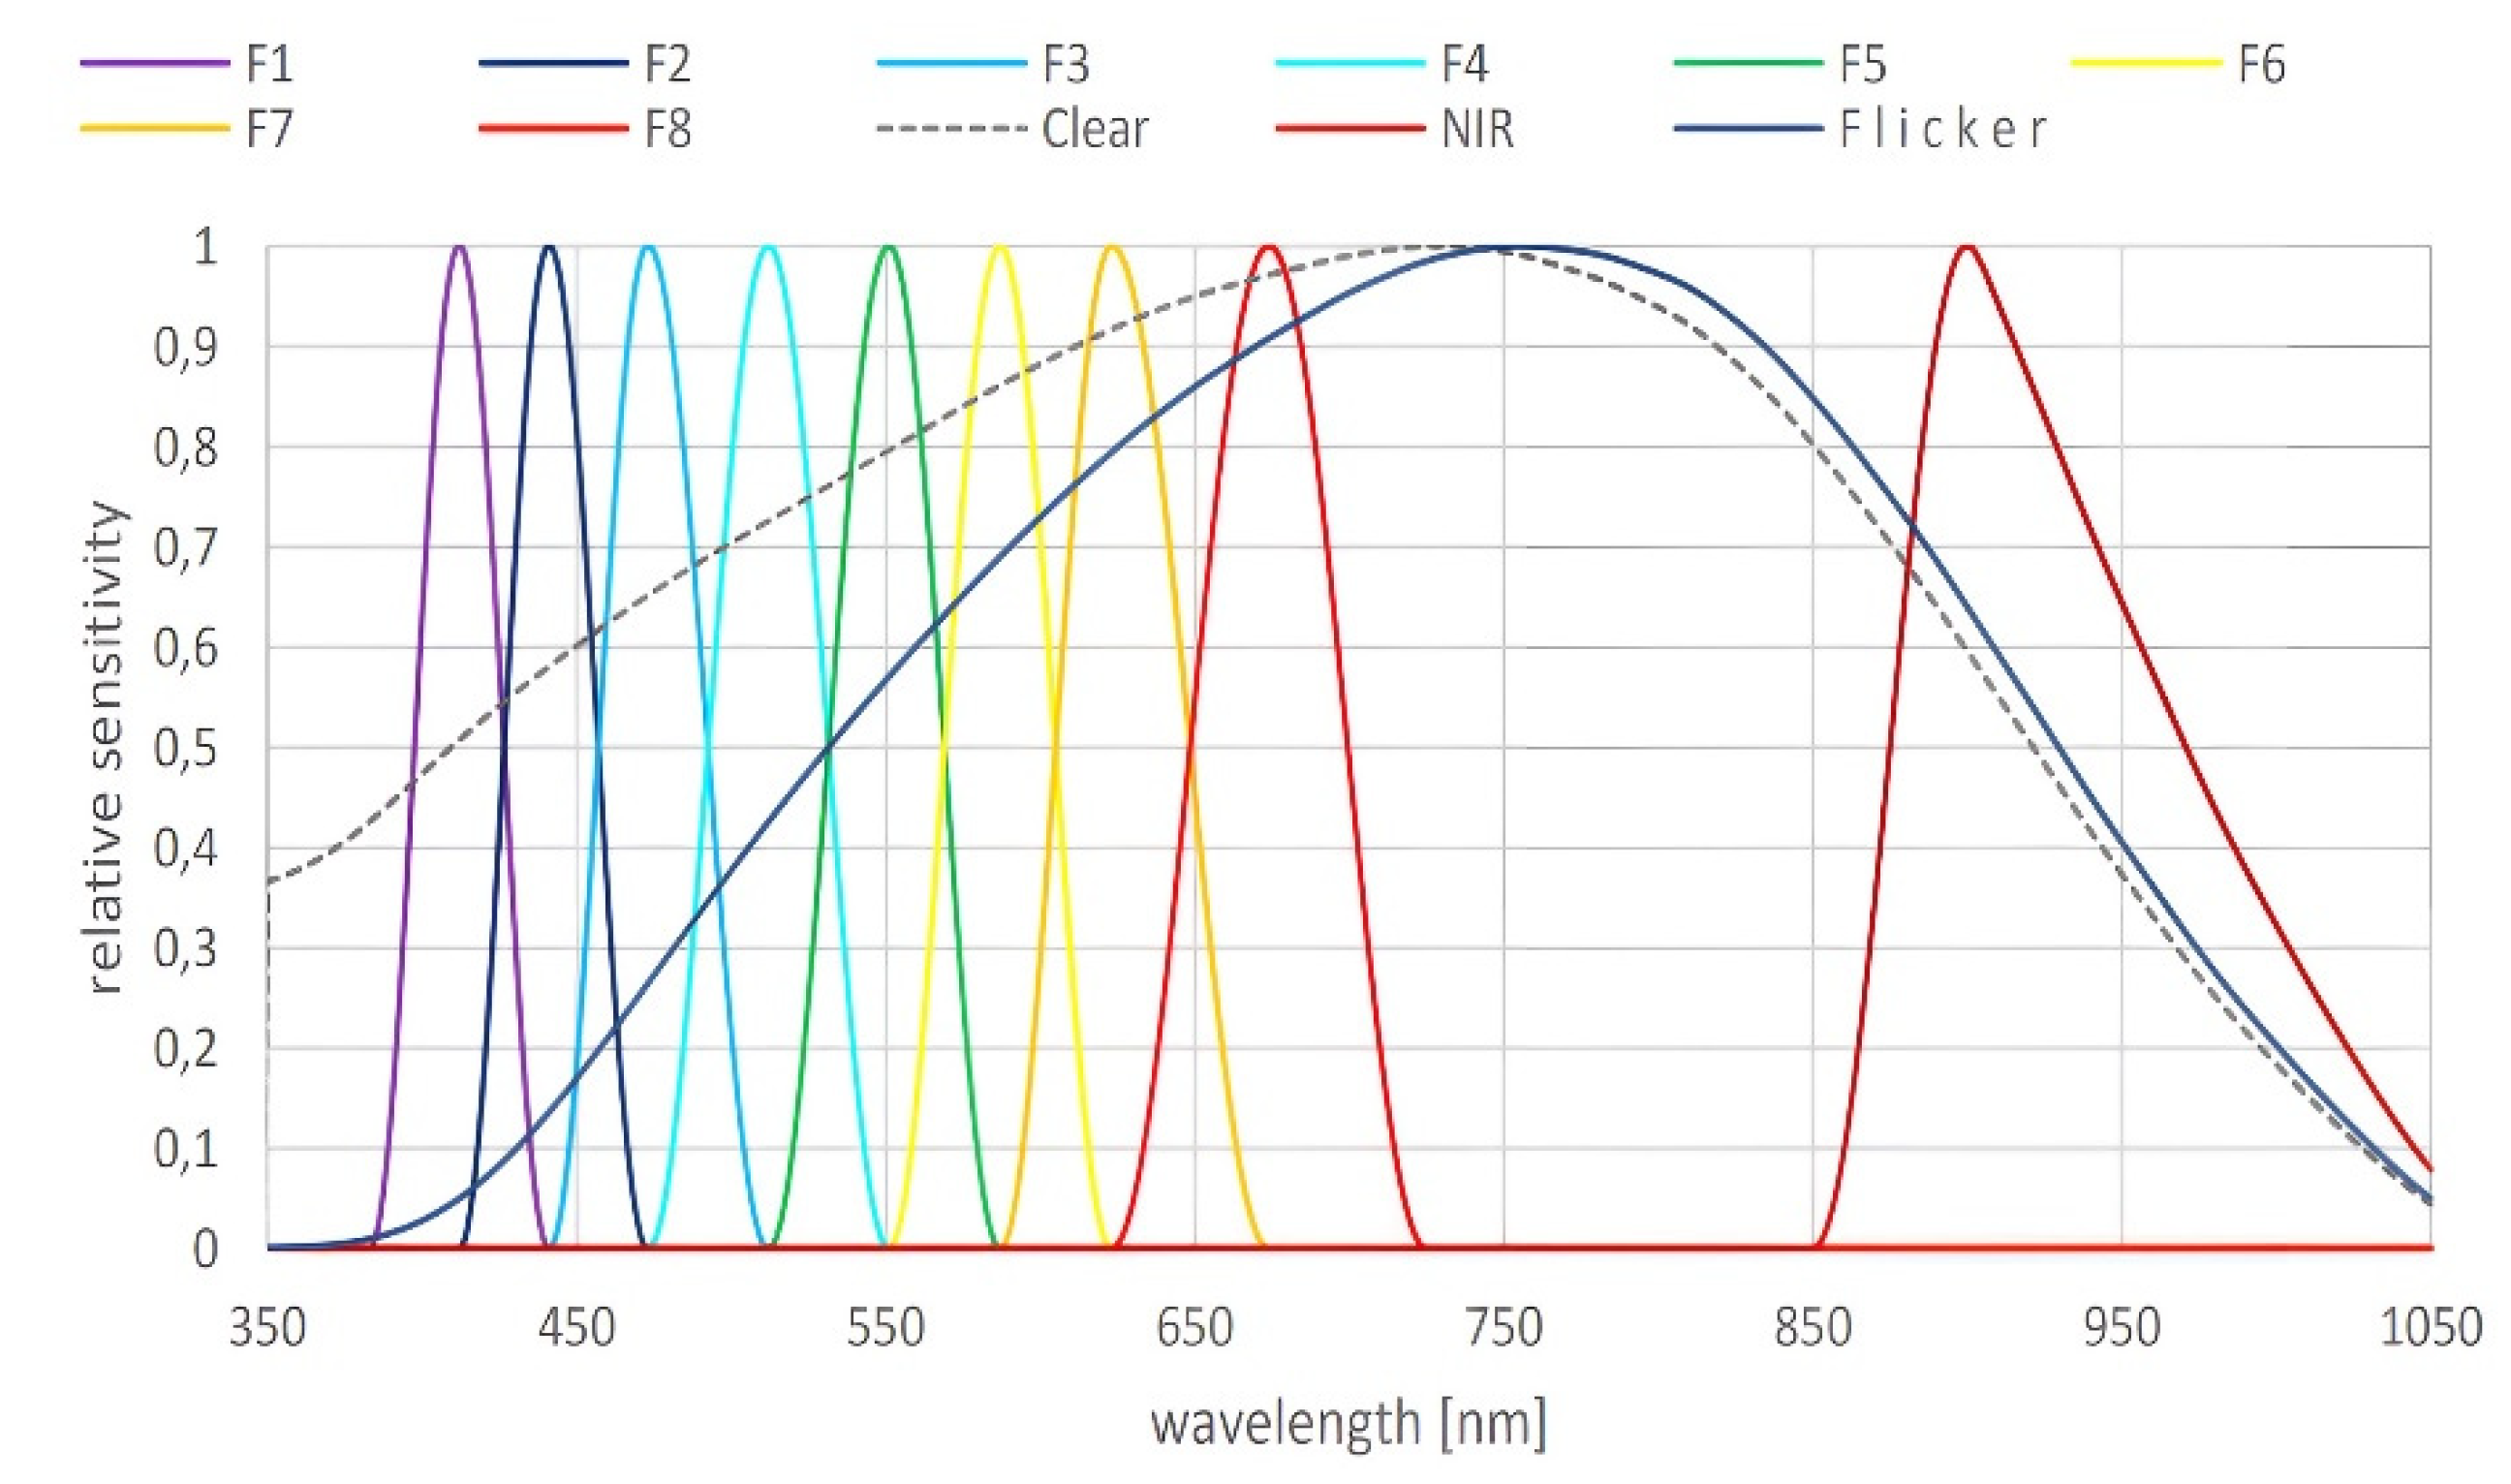
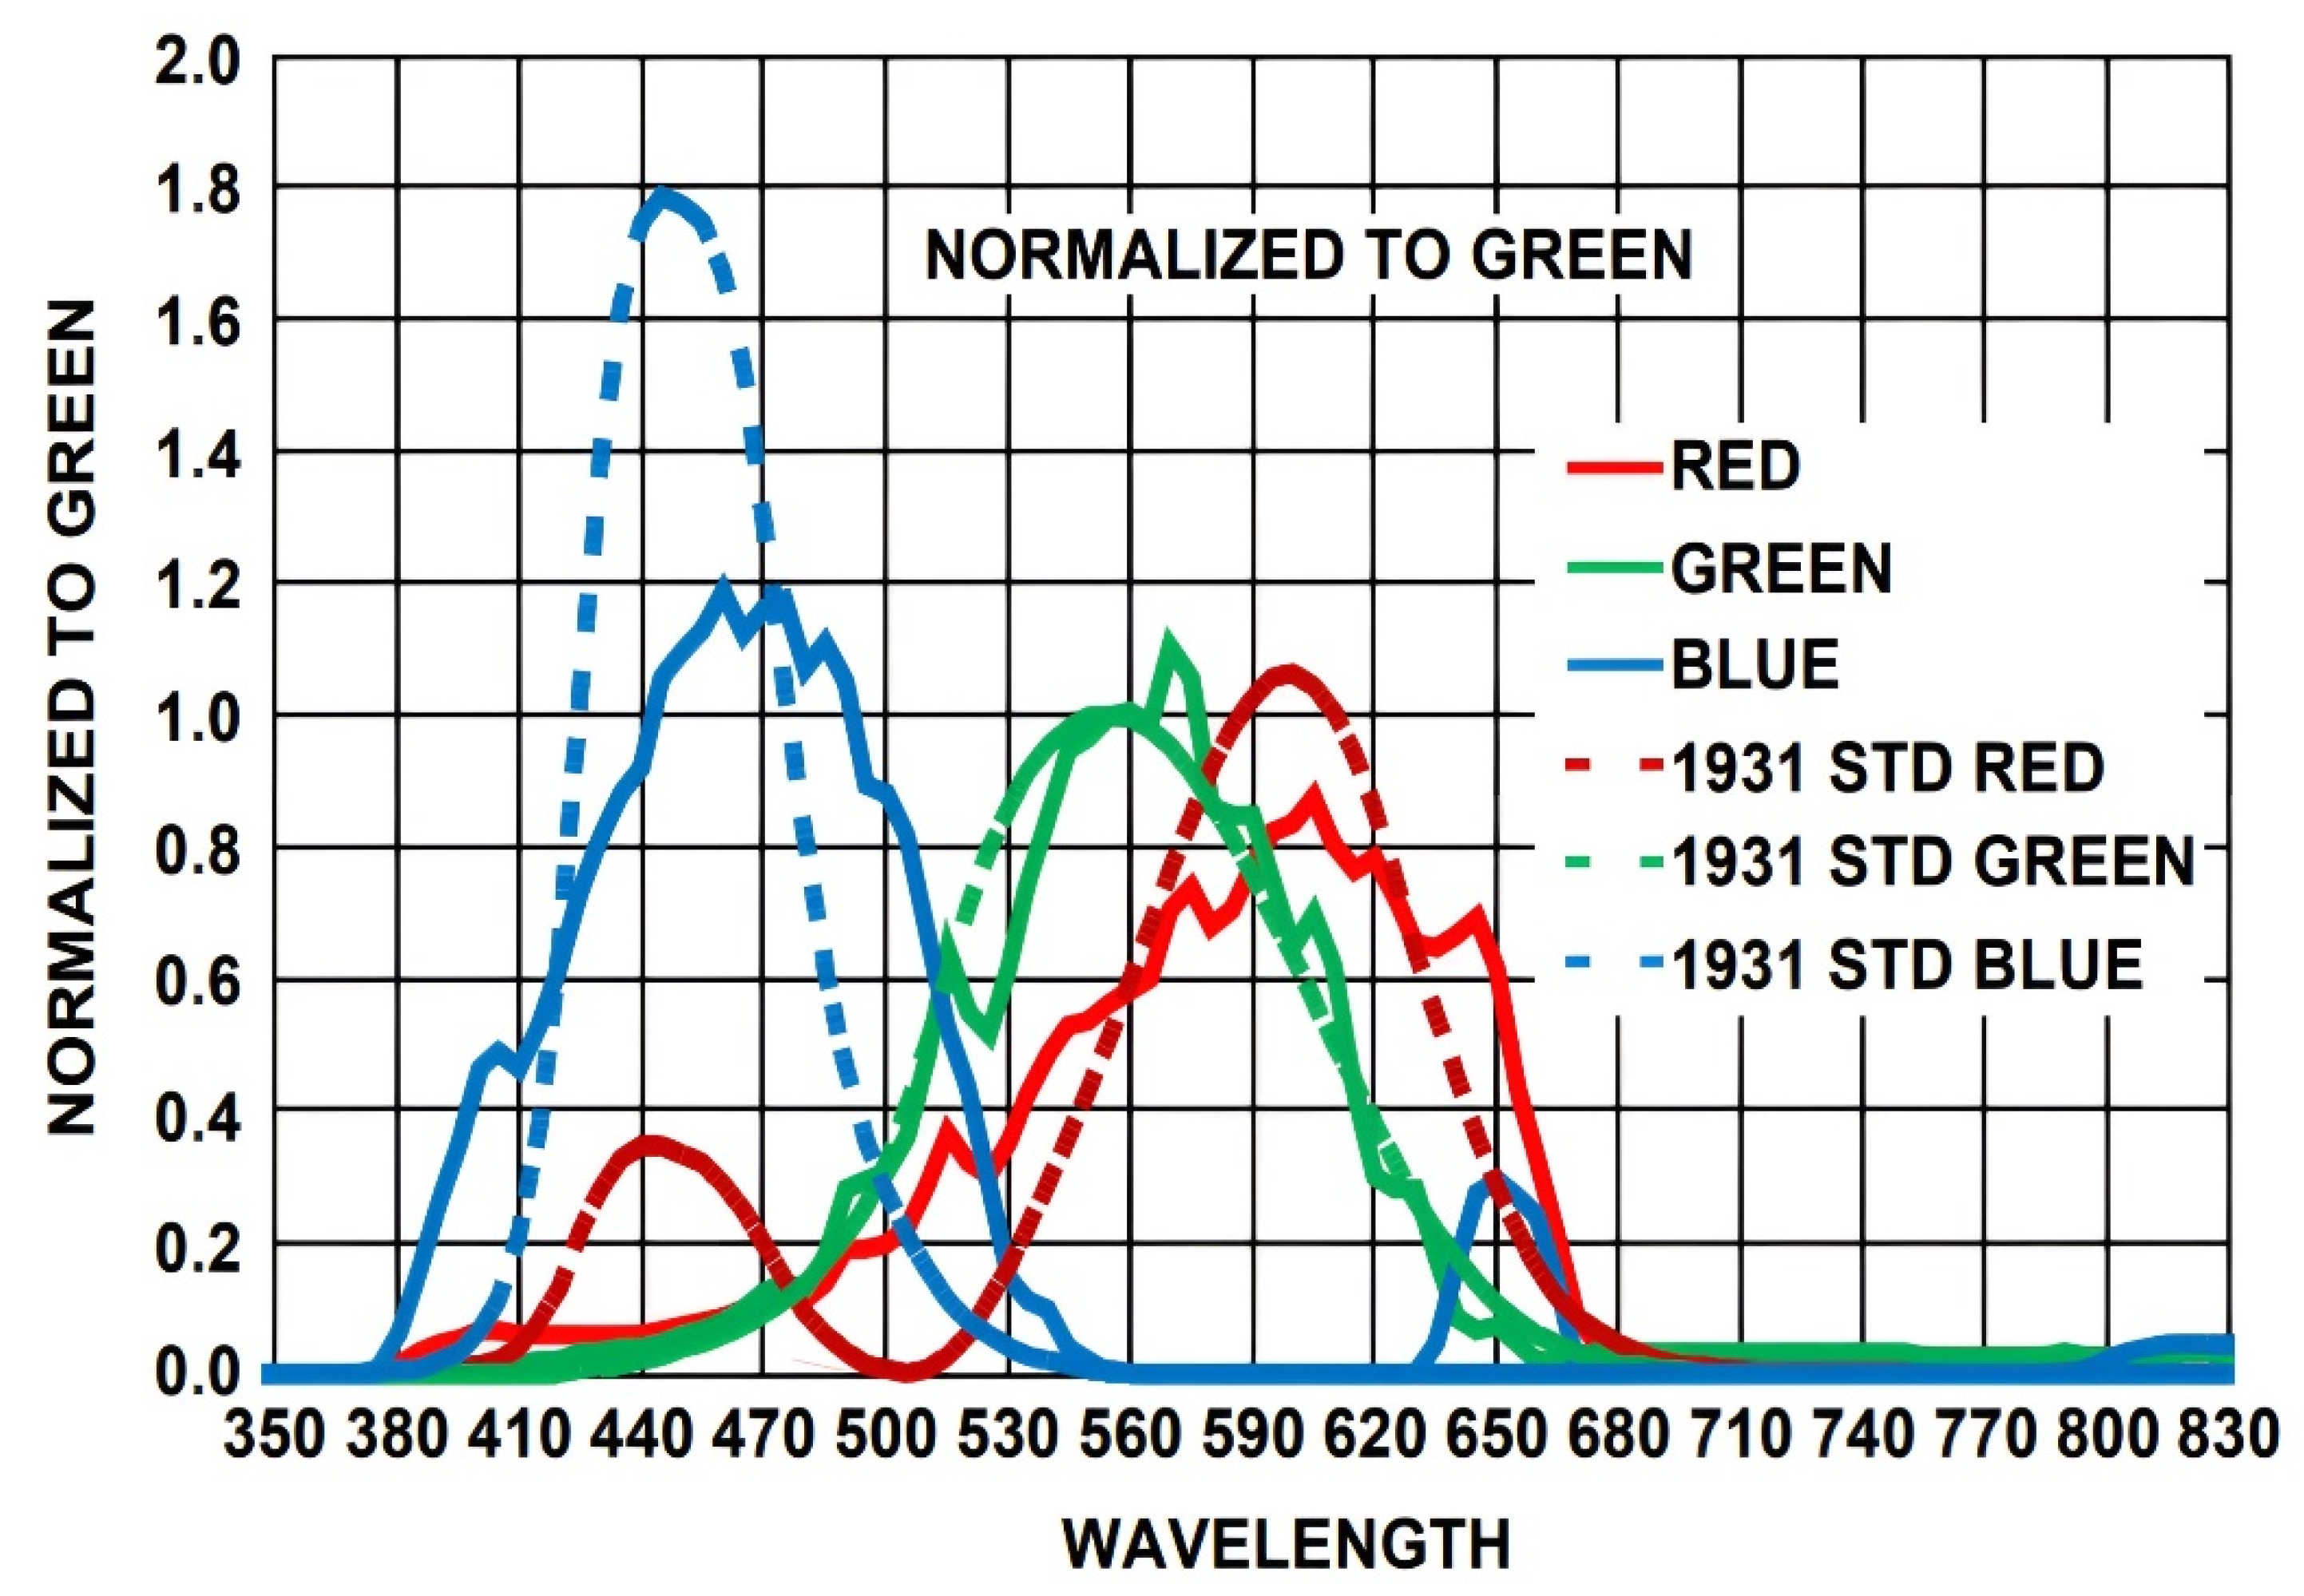
The AS7341 detector is a spectral LED that emits both visible and near-infrared (NIR) light within a single device. This type of sensor responds to various wavelengths (Figure 2 and Figure 3). The visible light spectrum encompasses wavelengths of 415, 445, 480, 515, 555, 590, and 630 nm, while the near-infrared spectrum ranges from 850 to 1000 nm. Data transfer to the processing unit is facilitated through the I2C protocol. Another LED detector, the ISL29125 color sensor, exhibits spectral responses where the red color corresponds to the range between 500 and 650 nanometers, the green color between 470 and 600 nanometers, and the blue color between 400 and 520 nanometers (Figure 4).
Therefore, there is a necessity to develop optical measurement equipment comprising two main components: The light detector or sensor (AS7341) measures the absorbance of the sample solution. It is equipped with a light source, or LED, emitting visible (VIS) and near-infrared (NIR) light, serving as the main light sources. Both parts are housed within a light-shielded measurement chamber. The measured values are transmitted to the microprocessor. (Microcontroller) size 32 bit via I2C bus.

2.3. External Construction of MJU Soil Tester Device

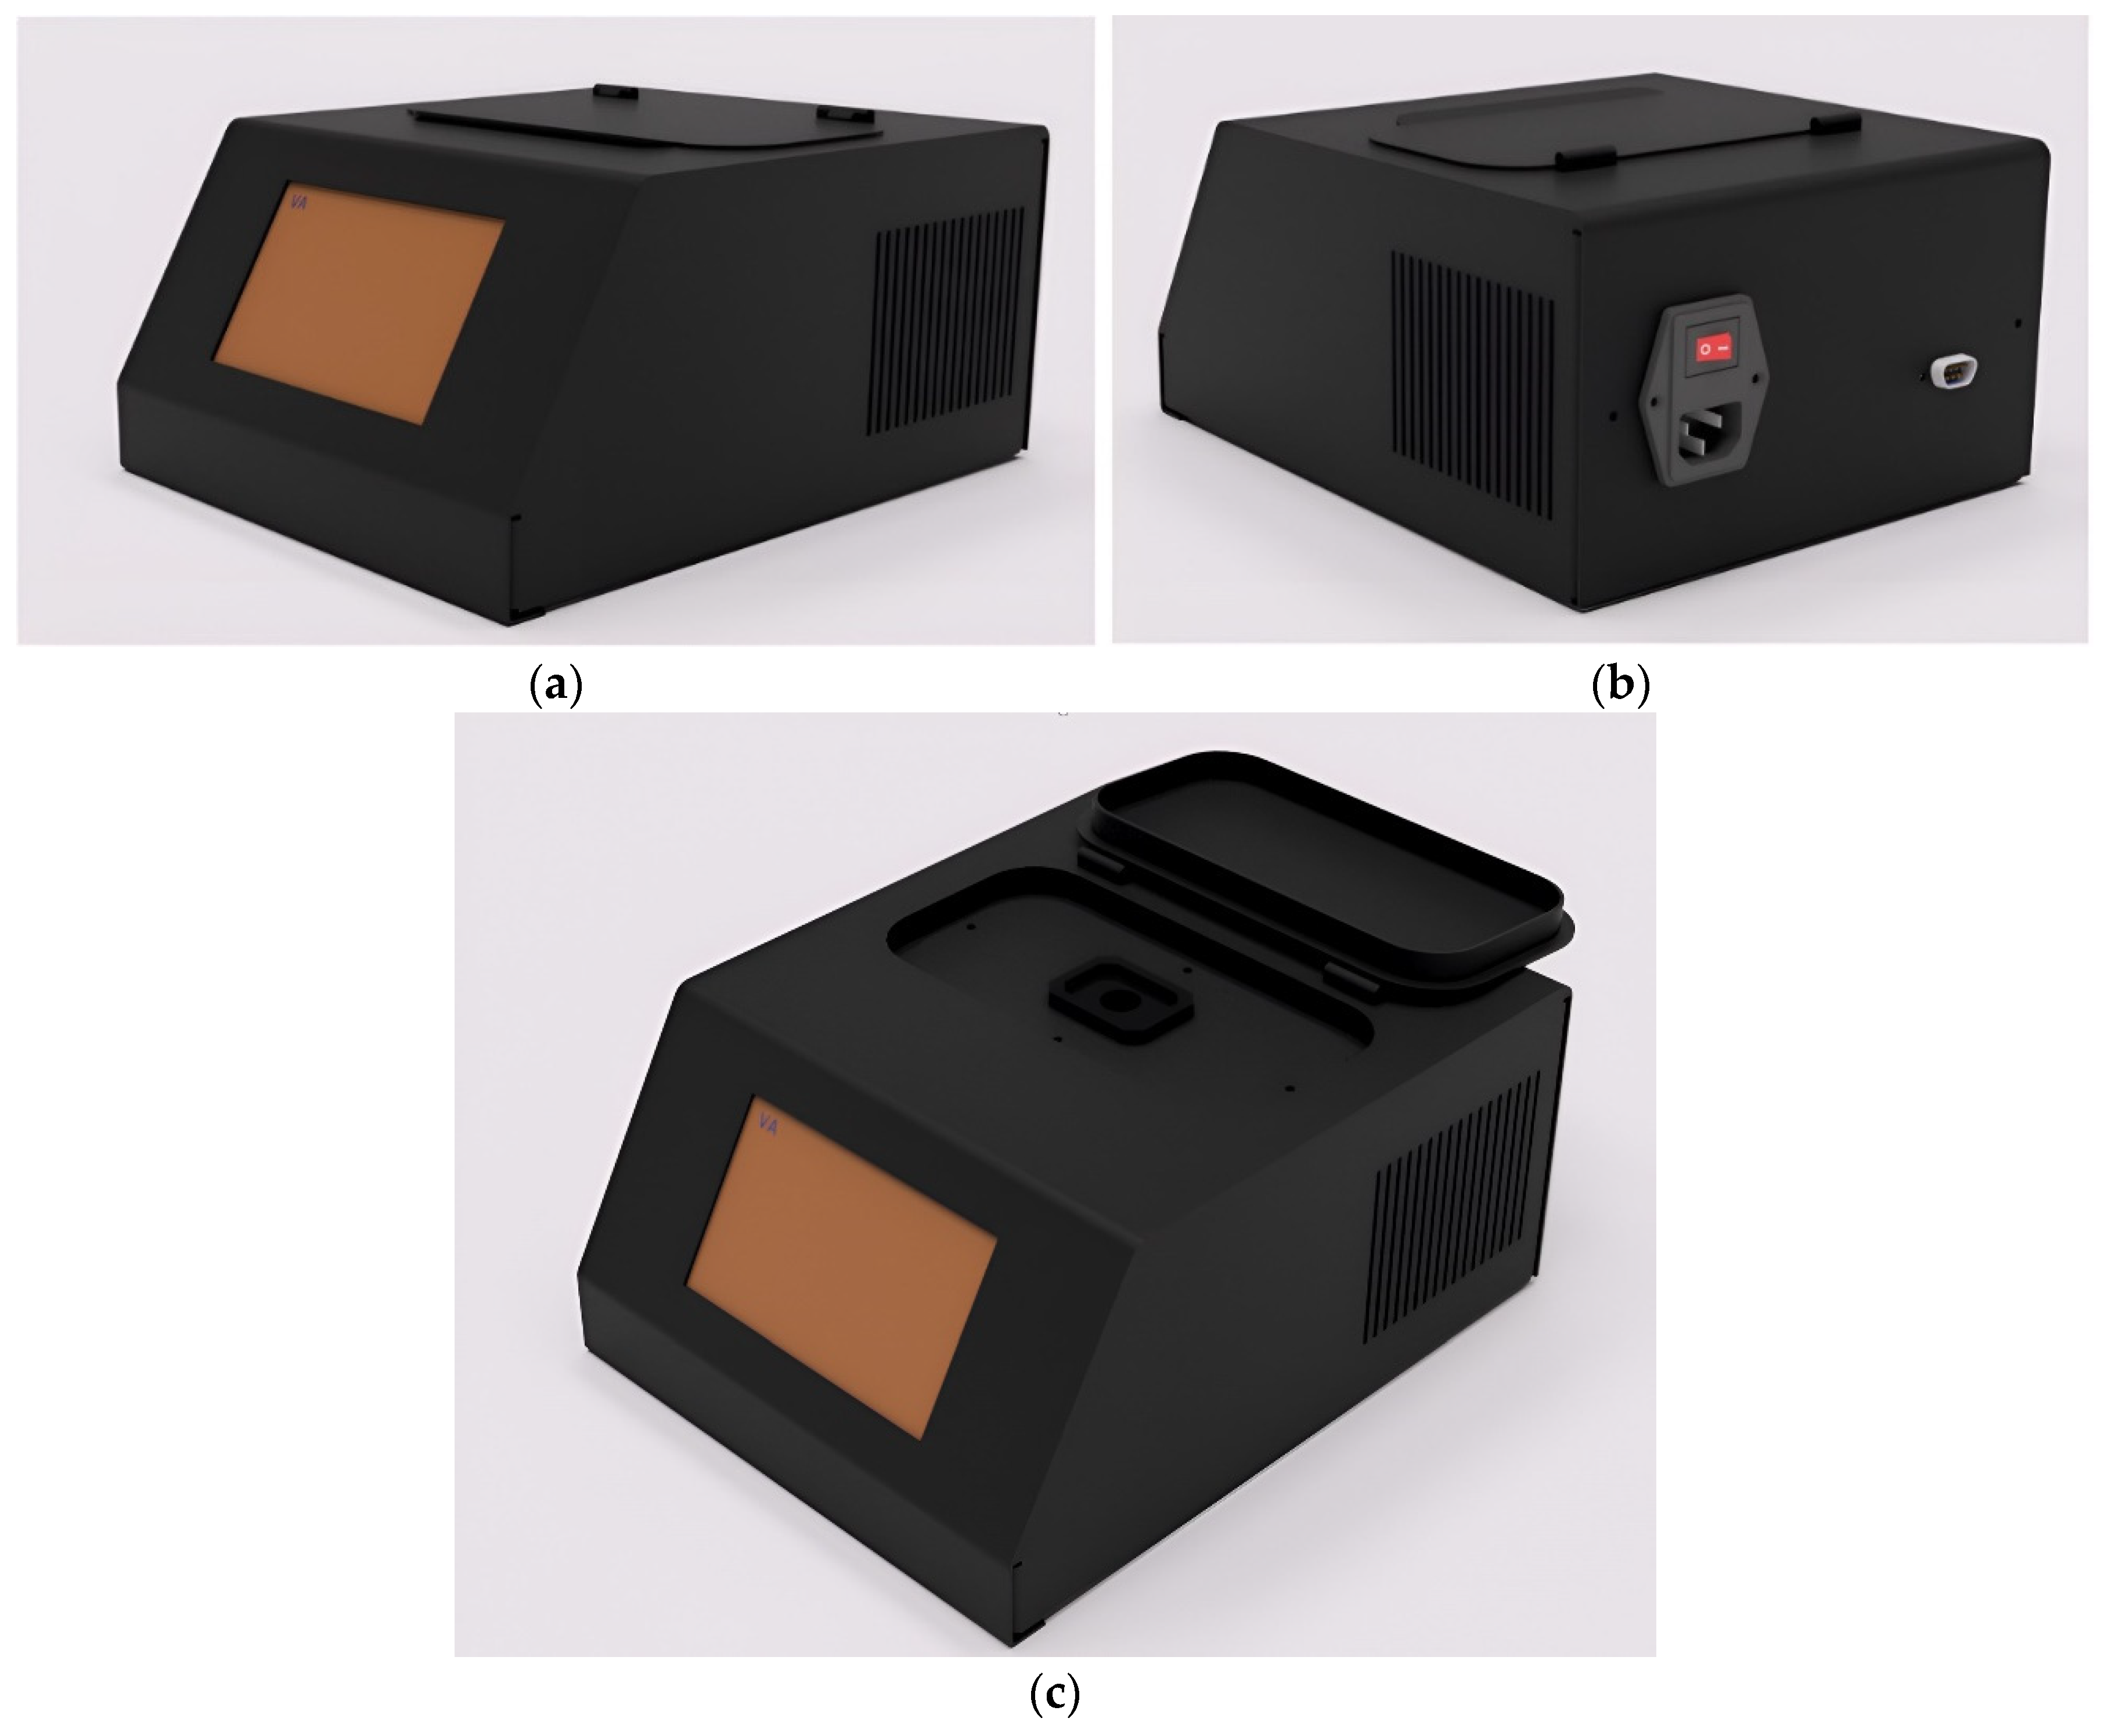
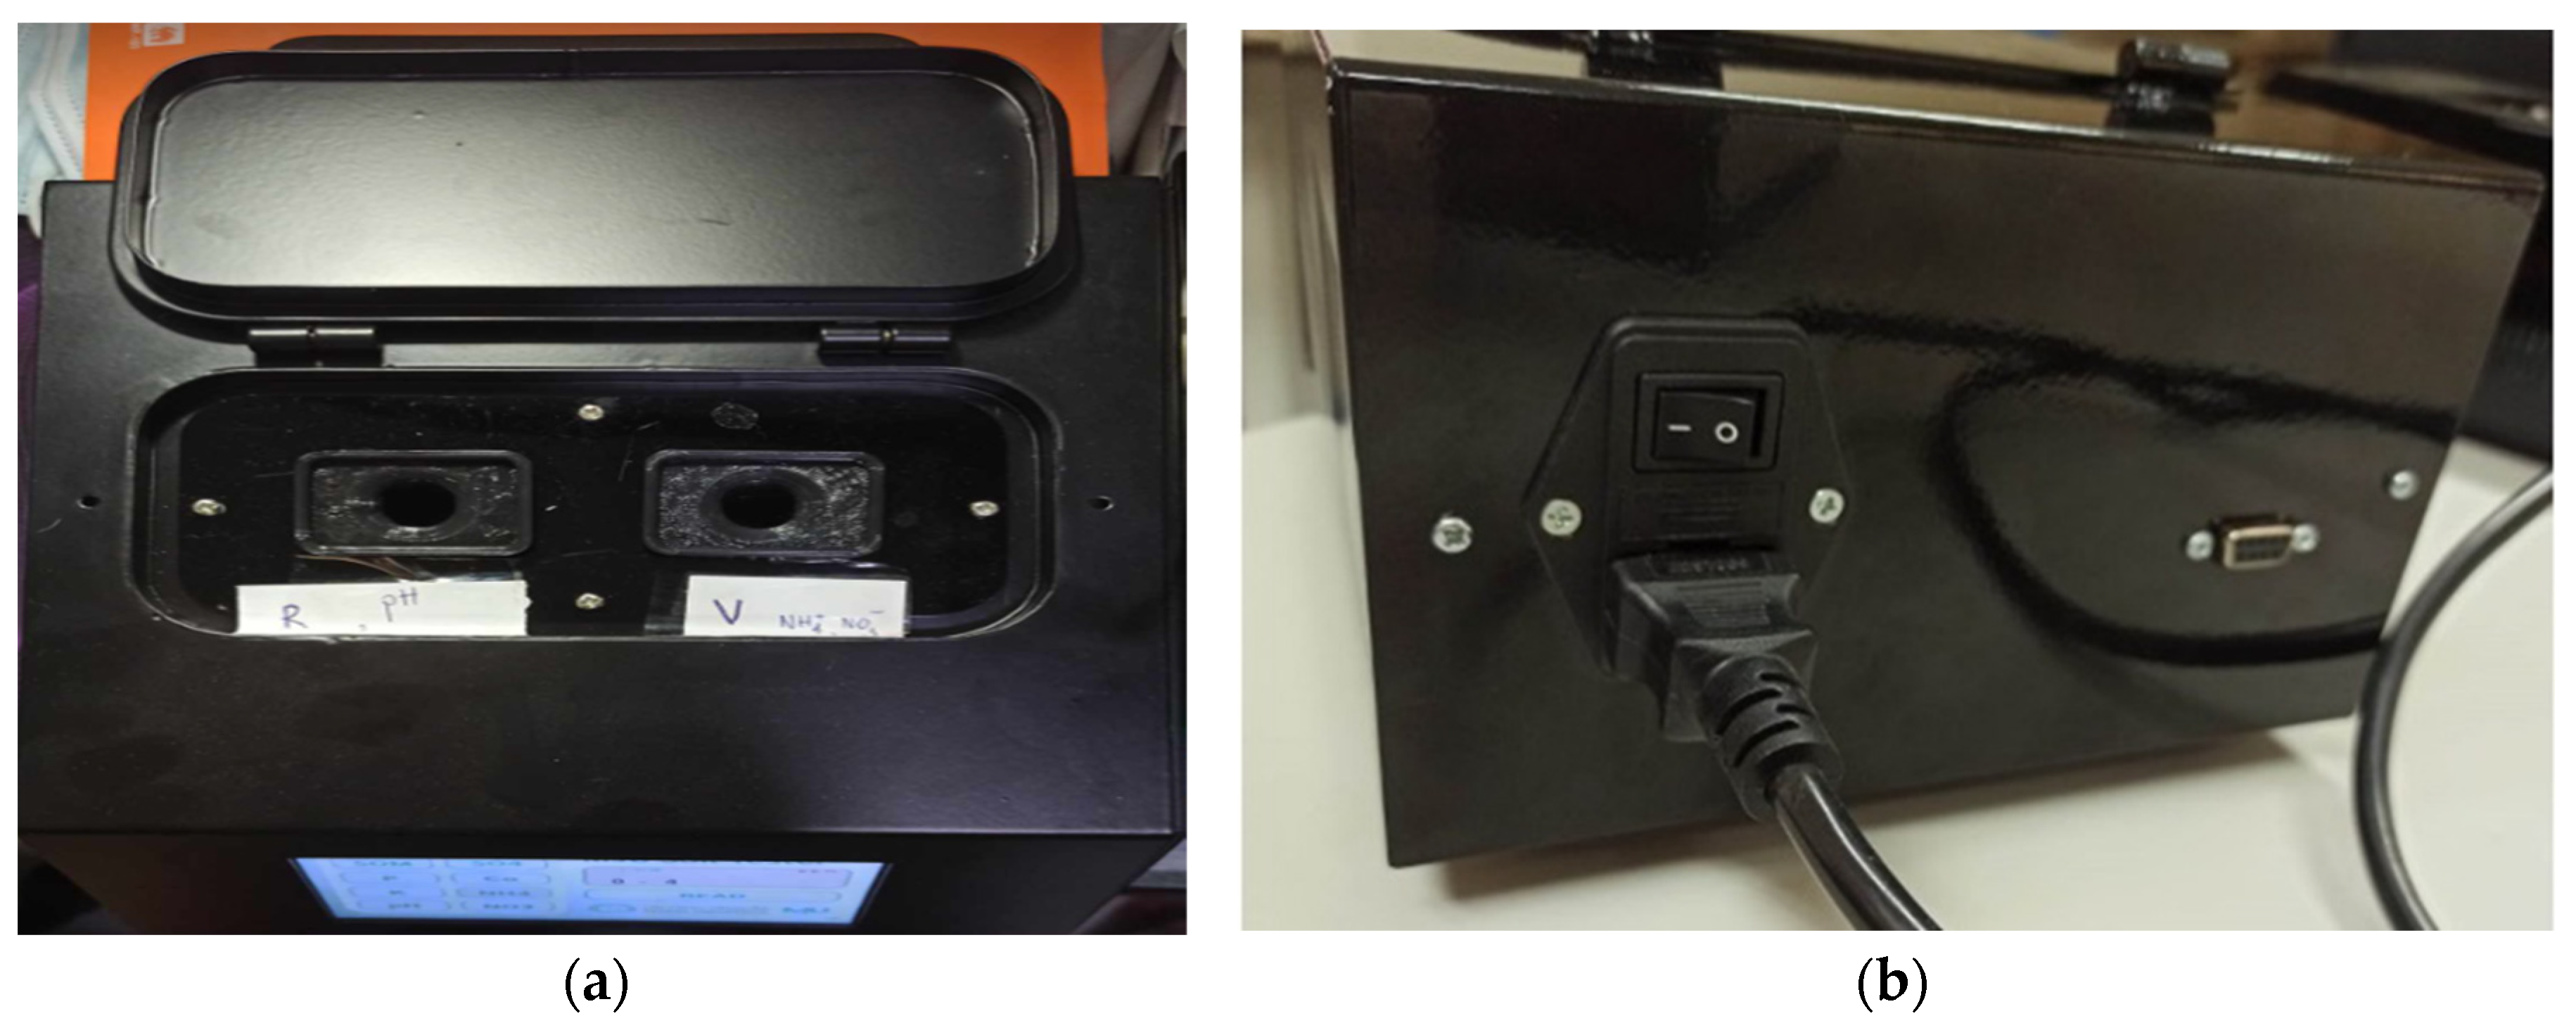
This device is seen from the front, featuring a 5-inch TFT touchscreen display (see Figure 5(A)). When observed from the back, the power connectors, switches (for turning on and off), and communication ports are visible (Figure 5B). In the top view, the internal chamber of the device and the sample solution container are apparent (Figure 5C). The measurement chamber must effectively shield itself from external environmental interference, particularly light, as the sensor is light-sensitive and prone to interference from ambient light. Hence, a lightweight chamber design was employed.

2.4. User Interface on Touchscreen

Display is illustrated (Figure 6), comprising the following components. On the left side of the screen, a menu is provided for selecting the type of nutrient to be tested, which can be chosen by touching the menu options displayed on the screen. On the right side, the measurement results and the “READ” command are displayed to initiate the reading of any selected nutrient values.

2.5. Algorithm Development

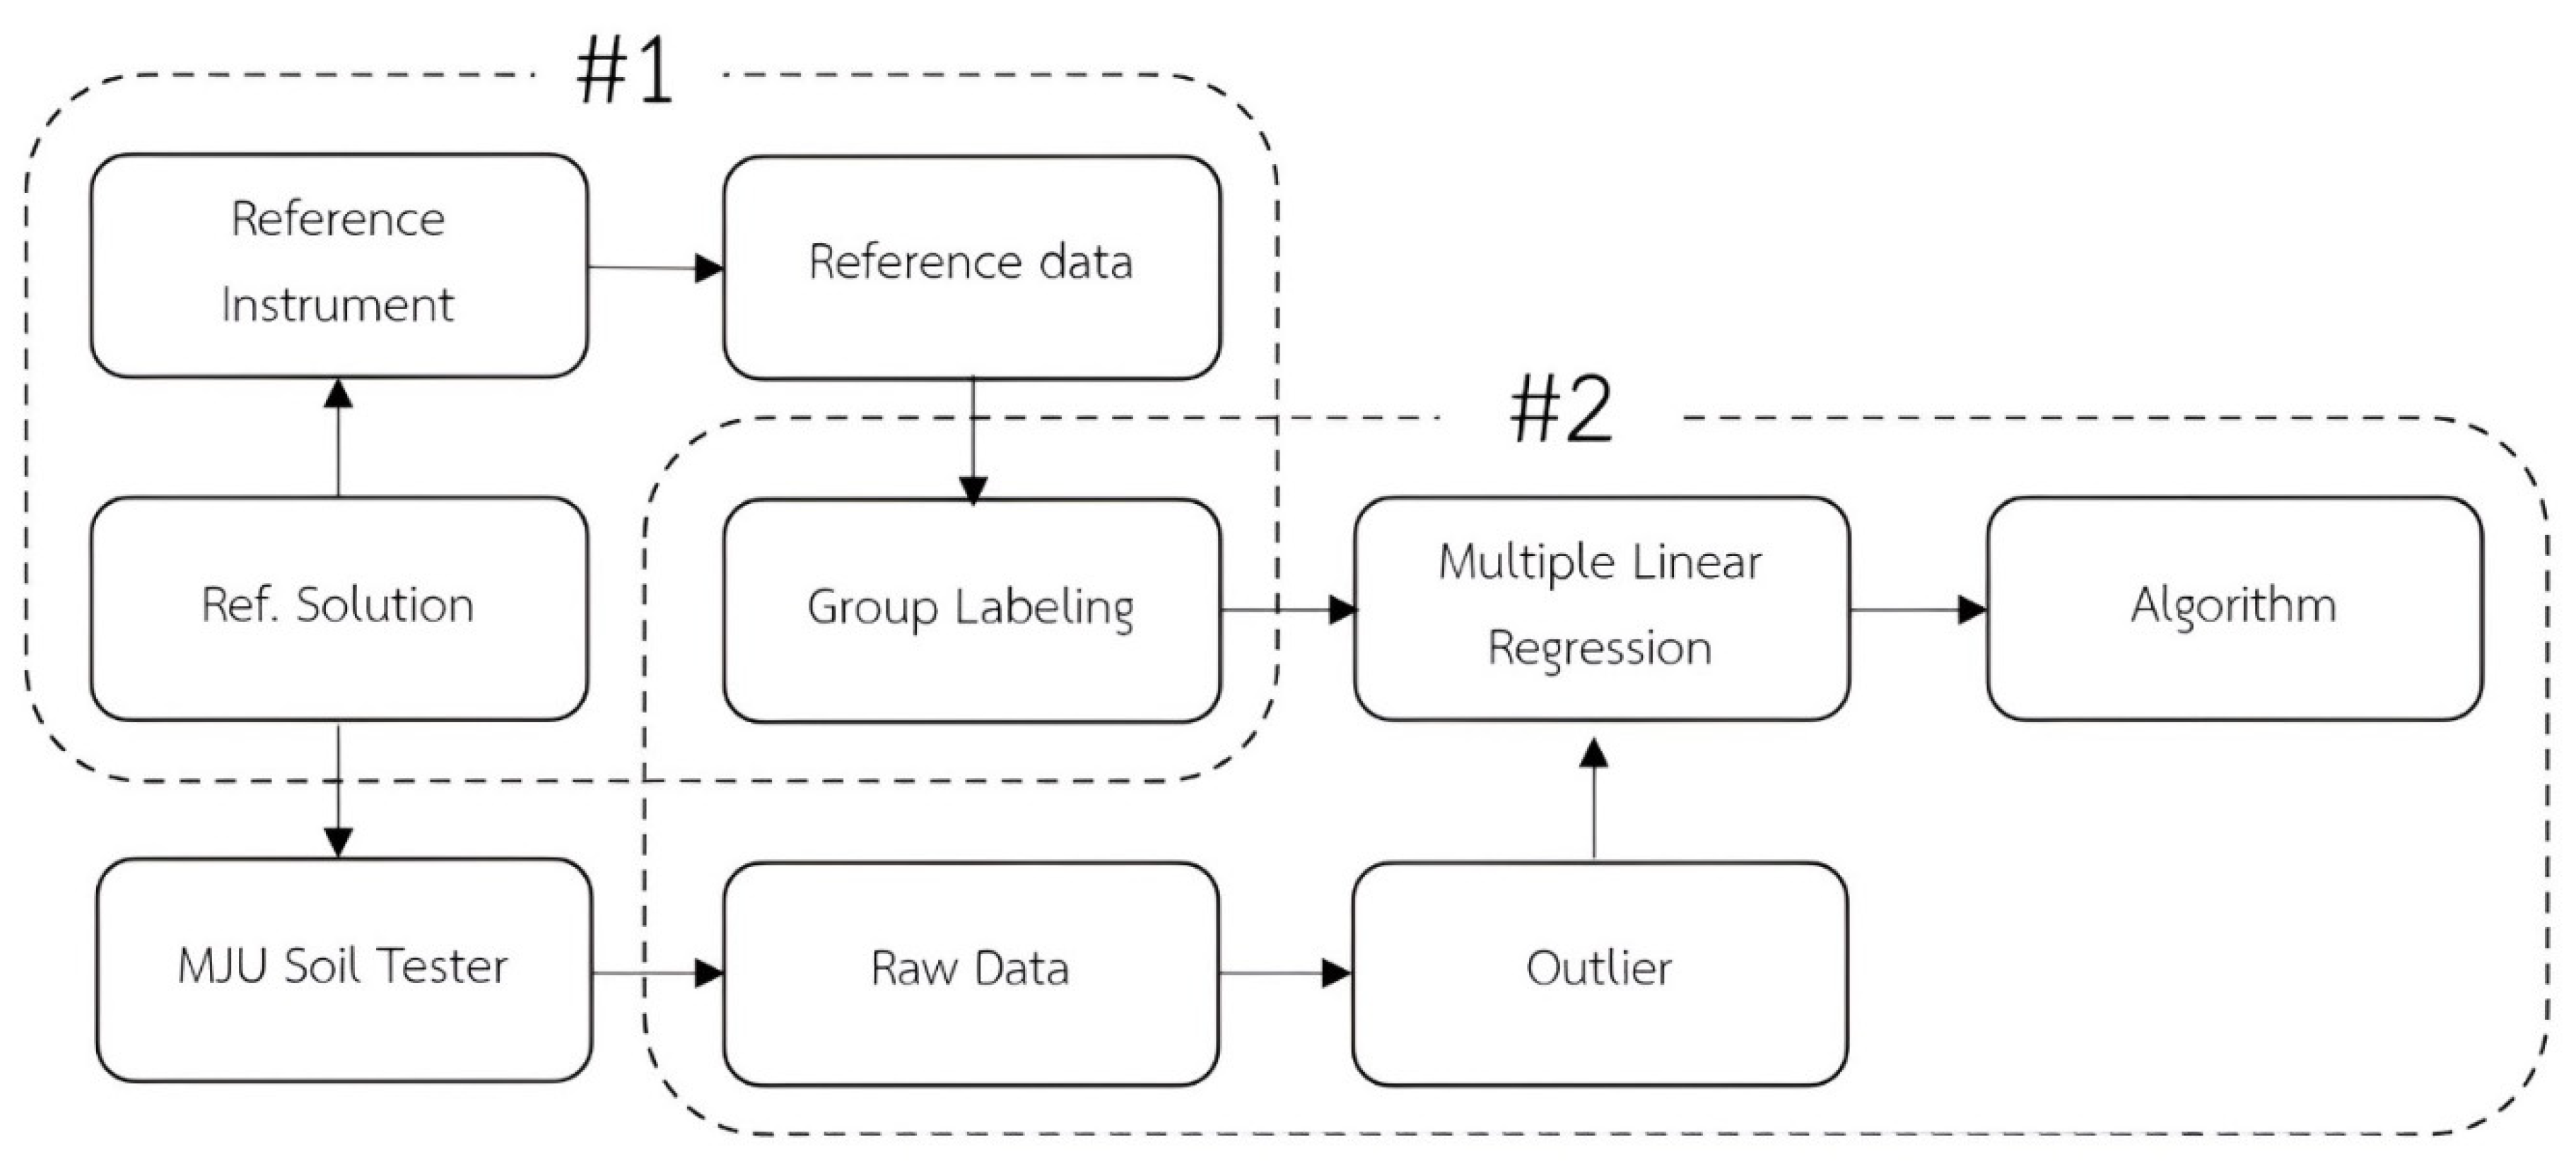
For the calibration equation, the absorbance value obtained from the MJU soil tester sensor was concurrently obtained from a reference standard instrument. Discriminant analysis was employed in this case to establish the calibration equations. Due to the discernible patterns in the distribution of absorbed data by the MJU soil tester sensor, the resulting calibrated equation was used in the testing step. Creating algorithms for software involves figuring out how much NH4 + and NO3 - in the soil solution previously prepared and extracted using appropriate chemical reagents and techniques. Known amounts of NH4 + and NO3 - in the soil solution were generated and estimated beforehand using analytical-grade chemical reagents. Summary of the steps for creating equipment and developing measurement algorithms:
This section comprises two main steps: 1. Calibration: This step involves comparing the absorbance values obtained from the sensor with those obtained from a reference instrument, typically expensive laboratory measuring equipment. Discriminant analysis is used in this process, aiding in the creation of calibration equations. This is necessitated by the distribution of data obtained from both the sensor and the reference instrument, with participants grouped accordingly. The resulting equation is subsequently employed in the subsequent testing phase. 2. Validation: In this step, samples with known actual results are obtained and evaluated to confirm the accuracy of the developed calibration equations.
The fundamental principle underlying the development of these algorithms entails dividing the data into two groups in a 70:30 ratio, with 70% constituting the ‘training set’ and the remaining 30% designated as the ‘test set.’ These datasets are gathered from soil samples sourced from different cultivated soils and analyzed using standard procedures, with data labeled accordingly to create a comprehensive database. The calibration equation is formulated through two steps.
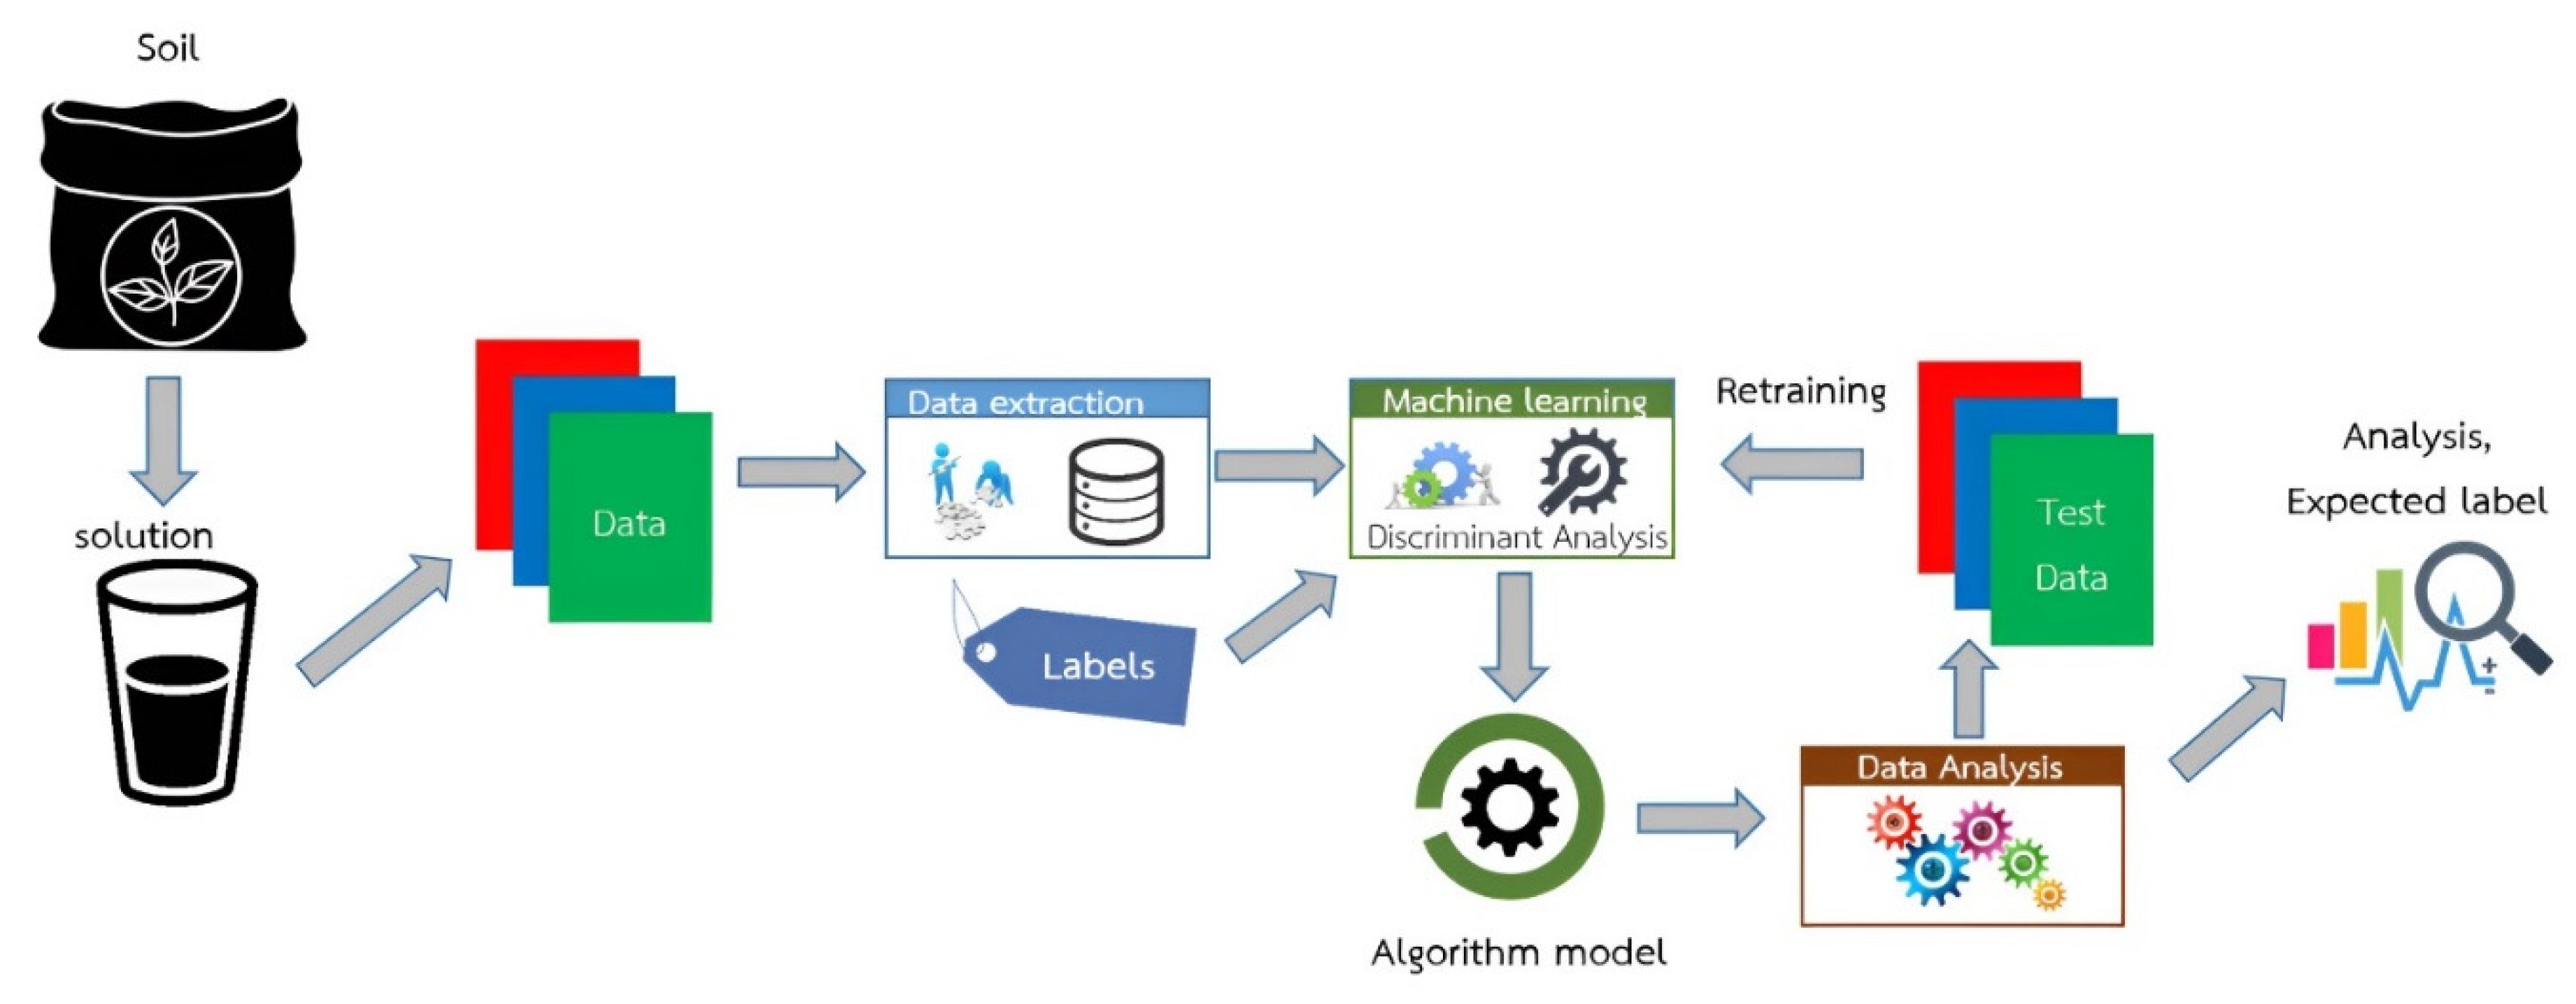
In the first step, comprising 70% of the data, the training set is created. Soil solution samples are measured using an MJU soil tester and compared with routine reference databases or values obtained from standard reference instruments. The collected data is then used to create a calibration equation using multiple linear regression (MLR). Subsequently, this calibration equation is transformed into an algorithm installed on the microcontroller or processing unit of the MJU soil tester. The second part of the soil solution data, which constitutes 30%, is used to create the test set for evaluating the performance of the developed MJU soil tester device. The test data aid in assessing and predicting the accuracy of the MJU device results. Some data may be reintroduced into the training set to refine the calibration equation, resulting in enhanced accuracy. The concept of software development is illustrated (Figure 6).
Validation of the calibration equation involves testing soil samples whose NH4 + and NO3 - concentrations are already known through standard methods. The calibration equation derived from the previous step is applied to evaluate the accuracy of the developed calibration equations. The development of calibration equations for quantifying soil nutrients involves using soil samples collected from agricultural fields during surveys. These soil samples are used in developing calibration equations, with 70% of the samples allocated for this purpose. Each soil sample is divided into two parts: the first part is analyzed using routine reference instruments to determine NH4 + and NO3 - concentrations, serving as reference values for future comparisons.

2.6. Soil Sampling for Soil Sample

The selection of the type of soil for intensive cultivation from northern Thailand. NH4 and NO3 analysis from soil sample by routine standard method. The second part subjected chemical processes to separate and filter the liquid portion. NH4 + and NO3 - concentrations are then measured using standard protocols with spectrophotometers at 520 and 420 nm, respectively [21]. K2SO4 (for NH4 +), KCl (for NO3 -), and an air-dried subsample are subjected to 120 cycles per minute in a reciprocal shaker for 60 min. The supernatant is filtered using Whatman No. 42 filter paper. A spectrophotometer (Cecil, Germany) and all reagents are employed for colorimetric measurement of NH4+ and NO3 - concentrations in each soil extract, as shown in the equation development procedure Figure 10.
The concentration of NH4 + and NO3 - data collected using the MJU soil tester device are compared with reference values from the reference instrument to identify any anomalies. Subsequently, the assessed data are utilized to develop preliminary mathematical equations for installation in the processing unit using MLR.
Regression approach, for each type of nutrient in soil (Figure 7).

2.7. Testing of MJU Soil Tester

The ammonium and nitrate solution samples collected from agricultural fields exhibit concentrations ranging from 0.44 to 24.36 ppm and 1.03 to 51.68 ppm, respectively (Figure 8a,b). The MJU soil tester adjusts the light intensity using digital-to-analog converters to obtain suitable values for each solution.

3. Results

3.1. Structure and Components of MJU Soil Tester Houseware

The front structure of the equipment, as depicted in (Figure 9a,b), consists of a 5-inch touchscreen display. This display provides various details, including a menu for selecting nutrients for testing, a box for displaying concentration values, a menu for reading values, and an option for clearing values. On the back of the MJU soil tester (Figure 9b), slots are available for connecting to the AC220V power source, a power switch, and plug ports for data upload. At the top part of the equipment (Figure 9a,b), slots are provided for inserting the test tubes, along with a cover.

3.2. Establish Celibate Equation for Ammonium (NH4)
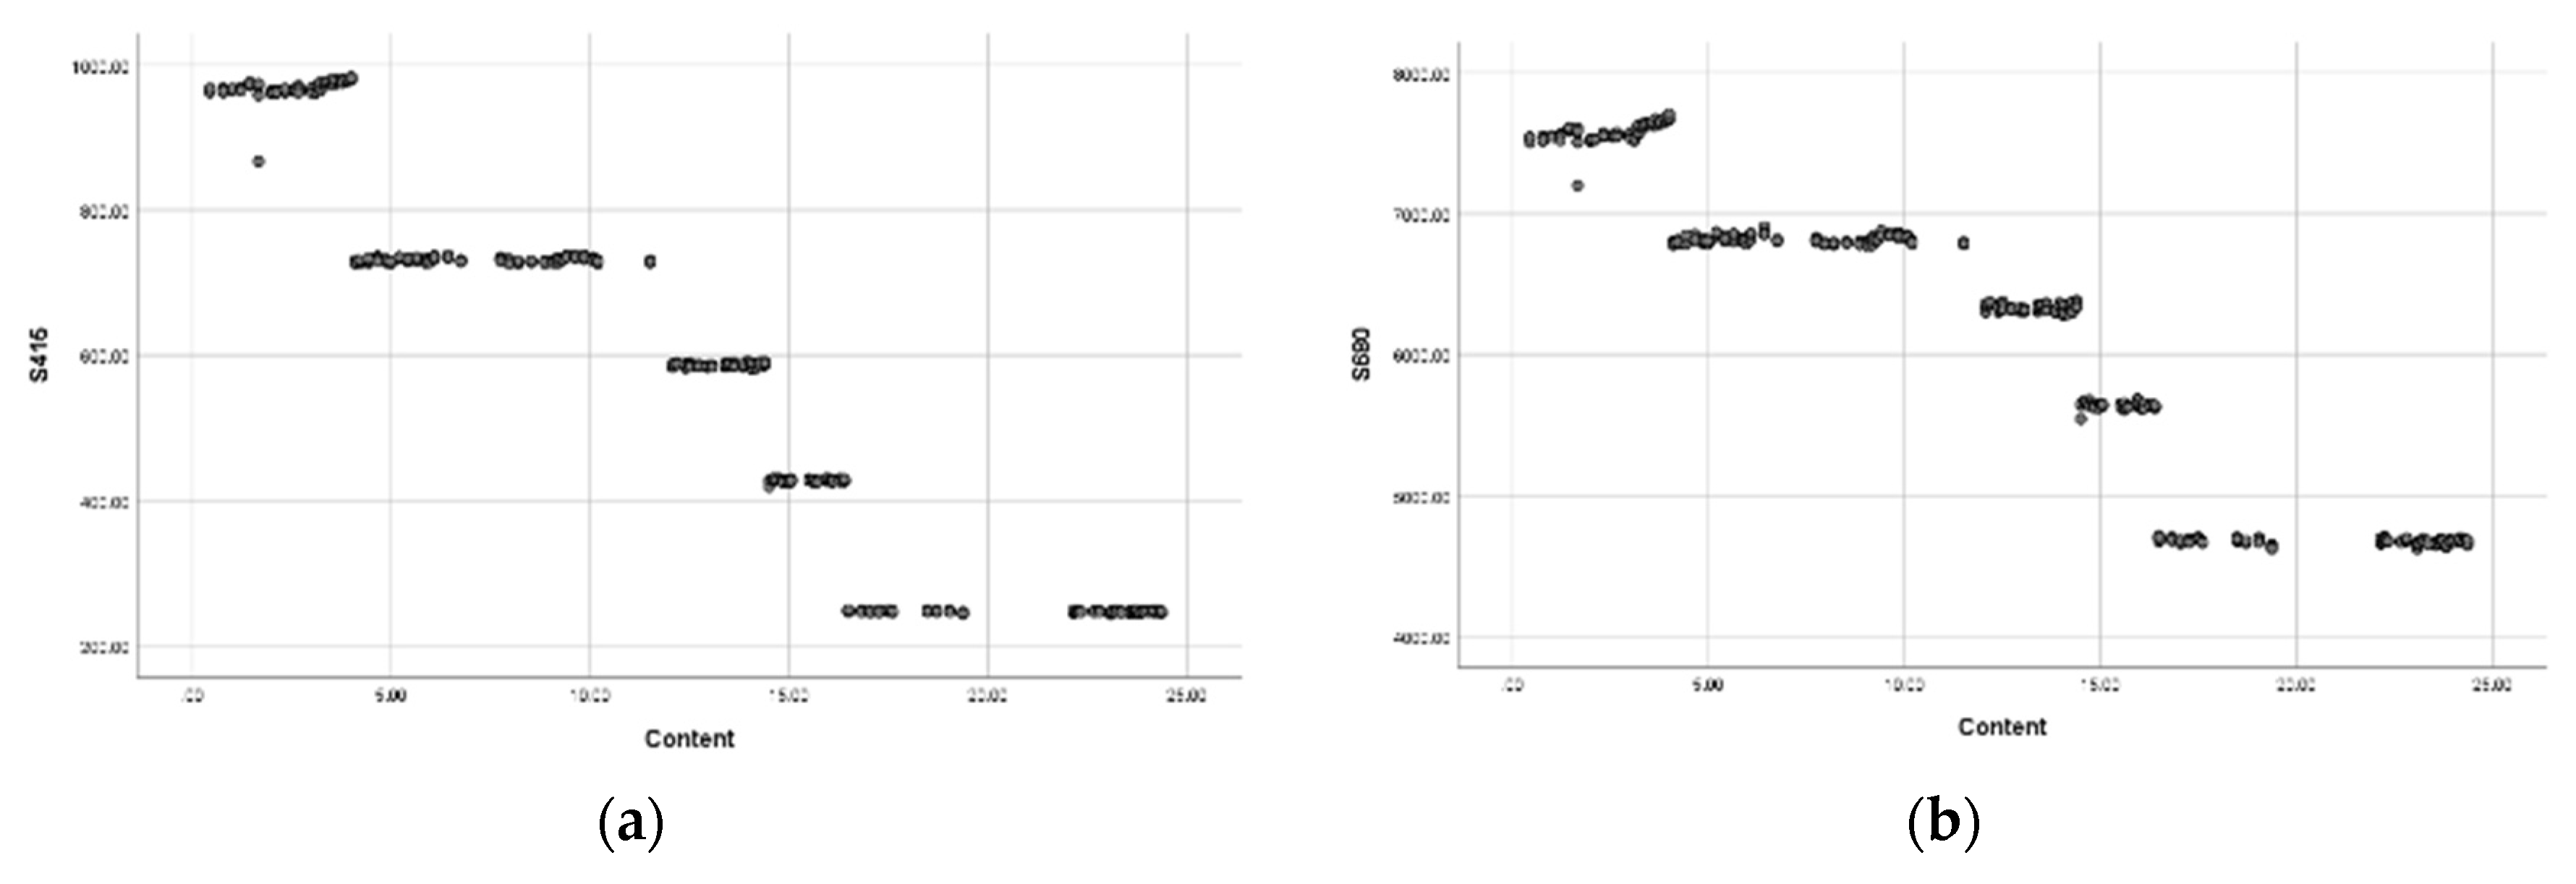
The relationship between absorption values and different NH4+ concentrations within the spectral ranges of (a) 415 and (b) 680 nm exhibits a cluster-like pattern. These relationships can be roughly categorized into five distinct groups. The NH4+ calibrated equation exhibits a cluster-like relationship based on the absorbed nutrient concentrations (Figure 10 a,b, and Table 2). The clustering-calibrated equation was employed due to the limitations of the sensor detector used by the MJU soil tester in discerning fine-grained differences in NH4+ concentrations.
Figure 10. Relationship between average absorption values of ammonium (NH4+). Wavelength at 415 nm and (b) Wavelength at 680 nm.
Preprints 102131 g010
The discriminant analysis technique showed that the estimated NH4+ levels in the soil dataset could be used to develop calibration equations for the clustered data. The dataset was divided into five groups for prediction using SPSS software, with the grouping as follows:
Group 1: Nutrient levels ranging from 0.44-3.99 ppm
Group 2: Nutrient levels ranging from 4.10-11.51 ppm
Group 3: Nutrient levels ranging from 12.07-14.39 ppm
Group 4: Nutrient levels ranging from 14.50-16.49 ppm
Group 5: Nutrient levels ranging from 16.82-24.36 ppm
The group-discrimination calibrated equation shown (Table 1), indicates that four functions are available for predicting the probability of data grouping. However, considering their respective importance, only the first function is necessary to formulate the prediction equation, which can account for up to 95.2% of shared data variance.
Table 1. Group discriminant functions (CDFs) for ammonium (NH4+).
Function Eigenvalue % of Variance Cumulative % Canonical Correlation
1 53157.851a 95.2 95.2 1.000
2 2417.922a 4.3 99.5 1.000
3 219.119a .4 99.9 .998
4 54.845a .1 100.0 .991
The discriminant function for predicting the group means of NH4+ concentration (Table 2) based on various light wavelengths (Sxxx) and the classification coefficients for the ammonium (NH4+) concentration (Table 2) can be expressed as prediction equations, as shown in Equation 1:
Group means = (-0.048 x S415) - (0.059 x S445) - (0.026 x S480) + (0.037 x S515) - (0.051 x S555) + (0.019 x S590) + (0.078 x S630) - (0.081 x S680) + 1.507 (Equation 1)
where Sxxx represents any specific wavelength range.
Table 2. Discriminant function coefficients for predicting group means of ammonium (NH4 +).
Function
1 2 3 4
S415 -.048 -.282 -.243 -.117
S445 -.059 .020 -.089 .205
S480 -.026 -.241 .284 .032
S515 .037 .148 -.116 -.110
S555 -.051 .202 .078 -.119
S590 .019 -.059 -.034 .013
S630 .078 -.063 .002 .076
S680 -.081 -.018 -.020 -.007
(Constant) 1.507 -36.104 -19.740 15.526
The average group values for the data to be classified (Table 3). When the prediction equation (Equation 1) is used and yields an average value for a group, it indicates a high likelihood that the data or concentration level of the substance falls into that group. For example, if the prediction equation results in an average value of 370, there is a high probability that the data belongs to Group 1, corresponding to a concentration level of 0.44-3.99 ppm.
A cross-validation experiment was conducted to evaluate the prediction performance of the classification equation for ammonium (NH4+) (see Table 4). This validation process adhered to the Leave-One-Out Cross-Validation (LOOCV) approach, wherein one sample was excluded from the dataset each time for testing, while the remainder of the data served as the training set. This iterative process was repeated for each sample, demonstrating that the classification equation accurately and e and effective for predicting and classifying the data in all cases (Table 4).

3.3. Establish Predictive Equations for Nitrate (NO3-)

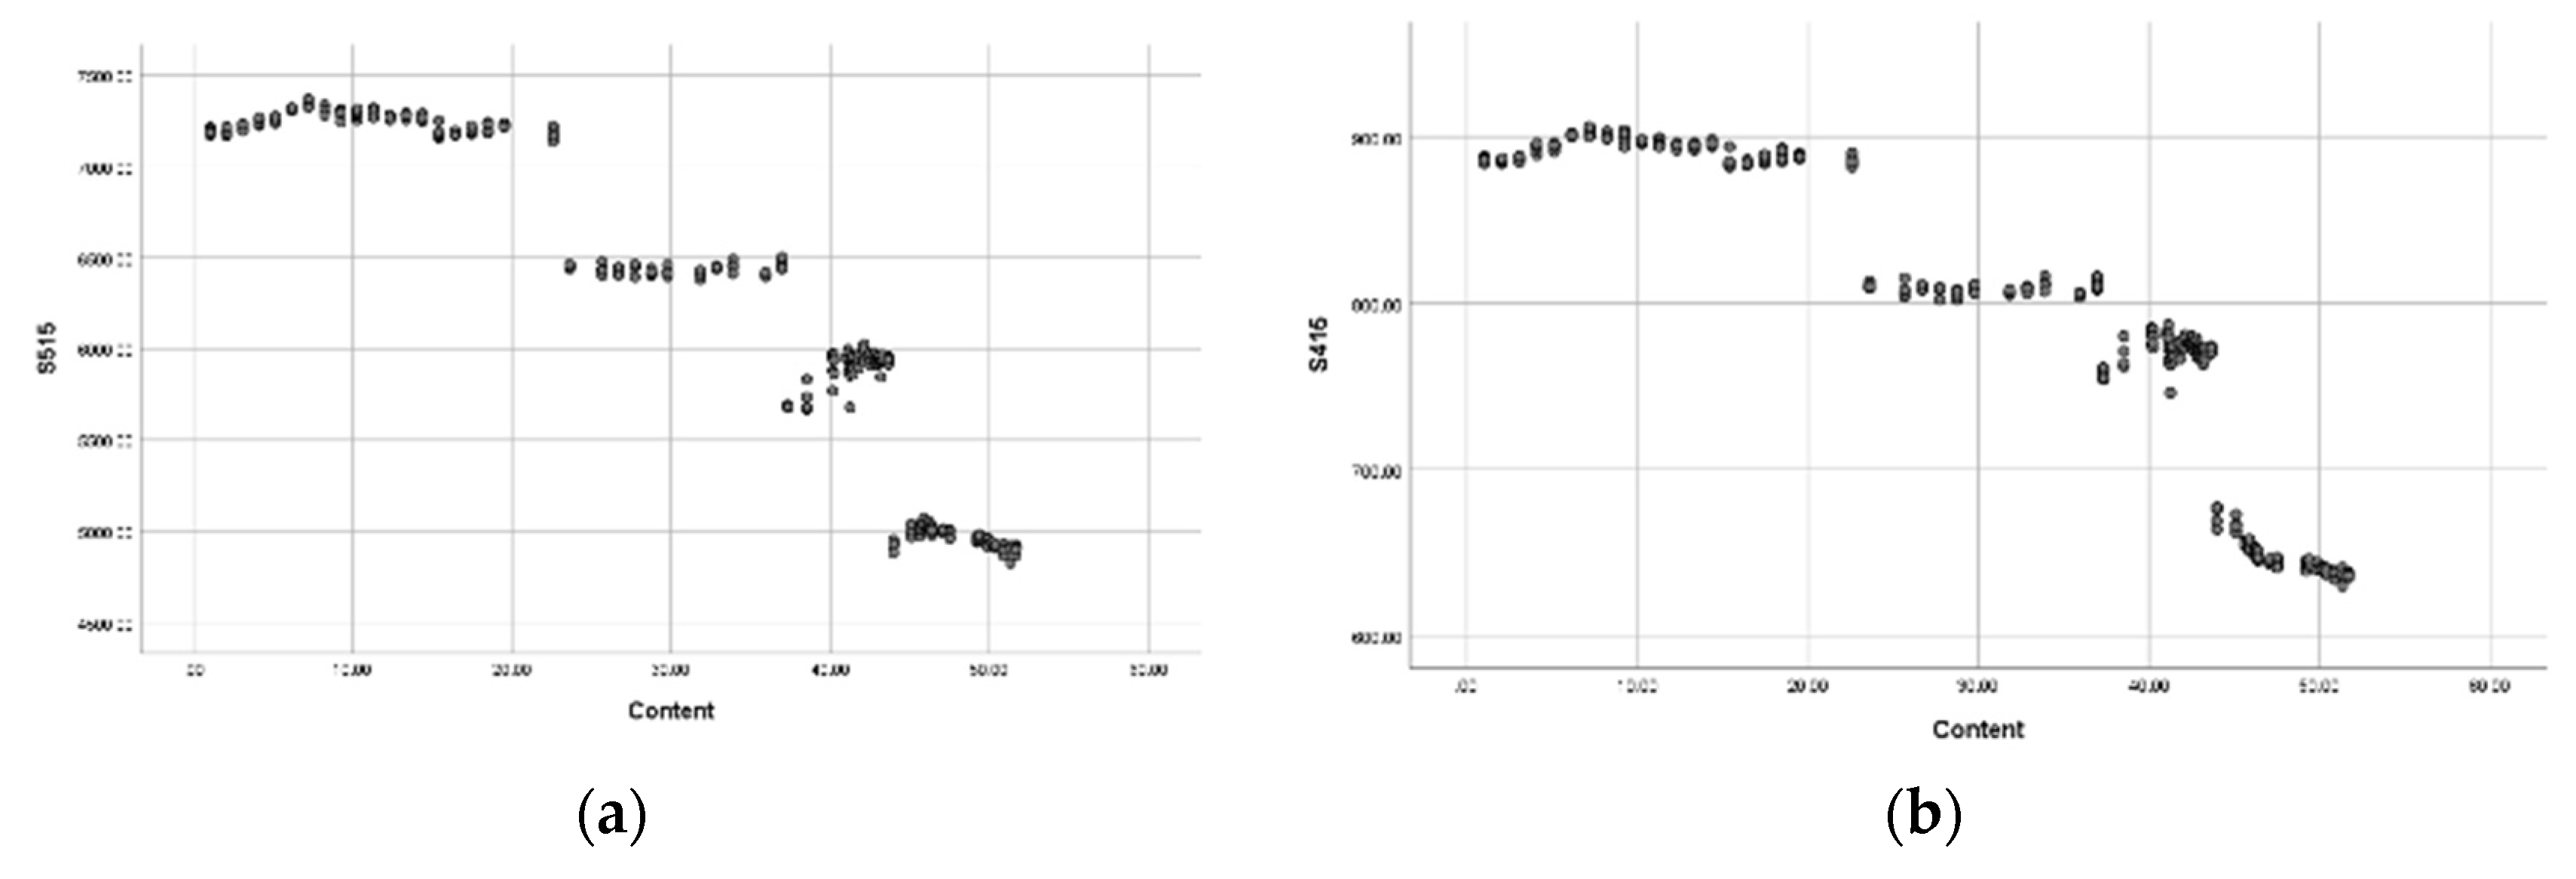
The results showed a relationship between absorption values and various nutrient concentration levels, which manifested as clusters, similar to the ammonium (NH4+) analysis. Due to the limited discrimination capability of the measuring instrument, fine-grained differentiation was not feasible. As illustrated in Figure 11, the trend of clustering was observed both at 415 nm (a) and 680 nm (b), and roughly categorized into four groups.
Comparative analysis and equation development of nitrate revealed a similar relationship between absorption values and nutrient concentration levels, forming clusters similar to the analysis of ammonium. However, fine-grained differentiation was hindered by instrumental limitations.
To predict or estimate the quantities of nutrients in the soil from a given dataset, Discriminant Analysis was chosen as the technique capable of creating equations to predict data in cluster forms. The methodology and results are outlined as follows:
The dataset was divided into four groups for creating predictive equations using the statistical software SPSS. The grouping was conducted as follows:
Group 1: Nutrient levels between 1.03-22.58 ppm.
Group 2: Nutrient levels between 23.61-36.9 ppm.
Group 3: Nutrient levels between 37.32-43.64 ppm.
Group 4: Nutrient levels between 43.97-51.68 ppm.
According to the discriminant function analysis shown in Table 5, three functions were available for predicting the probabilities of classifying the dataset. However, considering their relative importance, only the first function was necessary to create a prediction equation. This is because it could explain the percentage of shared information in the data up to 99.6%.
In summary, Discriminant Analysis was employed to predict NO3 - levels in the soil using a dataset divided into four groups. The analysis revealed three functions for predicting probabilities, with the first function being the most important, explaining up to 99.6% of the shared information in the data (Table 5).
The discriminant function coefficients for predicting the nitrate (NO3 -) concentration groups based on various wavelengths are presented as (Table 6). These coefficients are expressed in Equation 2:
Group means = (0.198 x S415) - (0.12 x S480) + (0.015 x S515) + (0.013 x S555) - 29.245 (2)
where Sxxx represents any specific wavelength.
The average values of the data groups are presented in Table 7. If the prediction equation yields a mean value close to 10.0, it suggests that the data is likely to belong to Group 3. This inference signifies that the concentration of the substance being tested falls within the range of 37.32-43.64 ppm, based on the predictive equation.

3.4. Cross-Validation for Group Classification of Ammonium (NH4+)

The results of the LOOCV to assess the predictive performance of the group classification equation for ammonium (NH4+) concentration levels are provided. The accuracy of the group prediction was verified through the LOOCV process, wherein one data point was excluded as a test set, while the remaining data points were utilized as the training set. This iterative process was repeated for all data points, and the results demonstrated that the classification equation accurately predicted the group for each data point (Table 8).

3.5. Accuracy and Errors of MJU Soil Tester from Soil Samples

This result involved testing the prediction equation for soil samples from agricultural areas using MJU soil testers. Predictive equations were integrated to assess the accuracy of predicting the intensity levels in the soil samples. The predicted soil NH4 + concentration testing equipment used in this study can classify two categories of nutrient concentration levels in the soil as follows:
Ammonium (NH4+) has nutrient concentration levels divided into five categories based on intensity levels from a reference soil solution:
Concentration levels between 1.33-86.45 ppm belong to Group 1.
Concentration levels between 89.11-155.61 ppm belong to Group 2.
Concentration levels between 156.94-252.69 ppm belong to Group 3.
Concentration levels between 256.64-469.48 ppm belong to Group 4.
Concentration levels between 478.79-605.13 ppm belong to Group 5.
The results of testing the equipment for measuring ammonium (NH4+) levels in the soil samples are presented in Table 9. The accuracy in classifying groups based on the nutrient concentrations in the soil showed an accuracy rate of 66.13% (see Table 9). Therefore, there were some inaccuracies in this prediction equation (33.87%) that arose from the boundary lines used to classify the soil data groups. This can lead to some predictions straying into adjacent groups due to the uncertainty in the obtained equation values.
For testing, the predicted equation for nitrate (NO3 -) categorized soil NO3 - levels into four groups based on the concentration of NO3 - in the reference soil samples:
1.) Concentration levels between 1.03-55.87 ppm belong to Group 1.
2.) Concentration levels between 60.95-71.11 ppm belong to Group 2.
3.) Concentration levels between 76.19-152.37 ppm belong to Group 3.
4.) Concentration levels between 157.45 - 304.84 ppm belong to Group 4.
The results of testing the equipment for measuring nitrate (NO3 -) levels in the soil samples are presented in Table 10. The accuracy of classifying the groups based on soil nutrient levels was 81%. Some prediction errors were partly due to the estimation of values for certain sample groups that fell within the boundaries of the data group transitions, causing the data to occasionally fall into adjacent groups (Table 10).

4. Discussion

The precision of the sensor device significance affects the light intensity readings, which can lead to inaccuracies in the measurement process. This study highlighted the precision of the optical sensor, serving both as a light source and a light detector. A three-color (RGB) gearbox mode sensor, known as Thru Bream, was employed by the MJU soil tester. It revealed that the capacity of light intensity readings and the performance of the light source could be affected by changes in color absorption particularly at high concentrations of NH4+ and NO3 -. Such variations could introduce inaccuracies in the measurement process. High-Q and ultra-high-Q optical sensors are being developed to address fundamental challenges in measurement science, particularly in chemical or biomolecular measurement capabilities [22]. Optical microcavities are being explored to enhance sensitivity by operating at non-Hermitian spectral degeneracy, resulting in larger frequency splitting for small perturbations [23]. Additionally, low-cost optical reflectivity sensors capable of detecting objects or surface variations at distances up to 20 m have been developed [24]. Innovations such as ZnO NW-in-fiber hybrids aim to enhance the capacity of light sources and detection in optical sensors [25]. Fiber-coupled multipass cells, as seen in the CO-LITES sensor, reduce optical interference and enhance system robustness [26,27]. Whispering-gallery mode microresonators are also being leveraged to improve light-matter interactions, rendering them ideal for photonic sensors [28]. Furthermore, combining surface plasmon and Fano resonances has shown promise in enhancing the sensing sensitivity, figure of merit, band number, and polarization sensitivity of optical refractive index sensors [27,29]. In conclusion, the precision of the sensor device, particularly the optical sensor employed as both a light source and a light detector, plays a crucial role in ensuring accurate measurements. The improved capacity of light source and detection. The MJU soil tester and showed that the capacity of light intensity readings and of the light source that we used would be affected by the capacity for adsorption of changes in color, such as at high concentrations of NH4 +and NO3 -, which would be affected by inaccuracies in the measurement process.
The discriminant analysis technique showed that soil NH4+ estimated can create calibration equations for cluster data. The dataset was divided into five groups using SPSS. The first function explained up to 95.2% of the shared data variance, indicating its effectiveness in predicting NH4+ levels. Similarly, discriminant analysis was utilized for NO3-, dividing the dataset into four groups and revealing three probabilities. The first function explained up to 99.6% of the shared information, highlighting its suitability for the MJU soil tester. However, embedded software is essential as it influences photo capacitance disagreement and detection performances noted by previous studies [30]. According to [31], a suggested method for modifying logarithmic histograms improves picture contrast worldwide while maintaining a natural look and perceptual quality. Additionally, for low-light imaging applications, a linear-logarithmic counter in a high-dynamic-range image sensor enables user-programmable sensitivity modification [32]. Furthermore, a logarithmic pixel design, achieved by utilizing a low-voltage photodiode bias to reduce dark current, enhances dynamic range and dark responsiveness [33]. In intelligent sensor networks, employing the maximum logarithm message transmission technique preserves precision and efficiency, while simultaneously reducing the complexity of multinode detection. According to [34], an image sensor can function akin to an artificial neural network, swiftly detecting and processing optical images, thereby facilitating rapid categorization and recording of images [35]. Moreover, it is crucial to maintain a sufficiently high and consistent number of reference soil samples for each concentration level across the groups. Discrepancies in sample numbers across groups could introduce bias into equations developed for larger groups. Discrepancies were noted between the reference solutions used to formulate predicted equations and the solutions obtained from soil samples, which varied in purity. Such variations could affect light absorption in specific spectral regions. Categorization of reference soil samples based on NH4 +and NO3 - concentration levels for the MJU soil tester must be precise to avoid overlapping individual groups or having adjacent groups with closely related concentration values. Ensure that the NH4 +and NO3 - concentrations in reference soil groups, which were calculated for certain regions, do not inadvertently fall into neighboring groups. To enhance the accuracy of soil tests, optimizing sample preparation and calibration analysis using techniques such as pressed pellets with a wax binder [36] and techniques like liquid-liquid extraction, solid-phase extraction, headspace extraction, and derivatization can be employed [37]. Ensuring the purity of soil samples is imperative. Utilizing a portable soil tester, which involves soil sampling and extraction steps for sample preparation, has been endorsed for the MJU soil tester to reduce errors and improve accuracy.

5. Conclusions

The MJU soil tester boasts a thru-beam light system integrated into its front structure, offering detailed insights into soil NH4 and NO3 testing. Equipped with a power switch, data upload ports, and test tube insertion slots, it ensures user-friendly operation. The LOOCV approach, coupled with discriminant analysis, was utilized to predict soil NH4+ and NO3- levels, with the first function explaining up to 95.2% and 99.6% of the variance, respectively. Soil NH4 + and NO3 - concentrations were categorized into four groups based on their levels in the reference samples, yielding accuracies of 66.13% and 81%, respectively. However, occasional prediction errors were noted due to data group transitions, and the clustering-calibrated equation is due to sensor detector limitations.

6. Patents

The MJU soil tester is patents number xxxxxxx.

Author Contributions

Conceptualization, S. A. and C. J.; methodology, S. A., C. J., and C. C.; software, C. J.; validation, S. A. and C. J.; formal analysis, C. J.; investigation, S. A.; resources, S. A. and C. J.; data curation, S. A. and C. J.; writing—original draft preparation, S. A. and C. J.; writing—review and editing, S. A., C. J., and C. C.; visualization, C. J and C. C; supervision, S. A.; project administration, S. A. All authors have read and agreed to the published version of the manuscript.

Funding

This research was funded by Agricultural Research Development Agency (Public Organization) (ARDA), grant number PR6605030280.

Acknowledgments

Maejo University and Chaing Mai University provided the publication procedures.

References

  1. Abawi, G.S.; Gugino, B.K.; Idowu, O.J.; Moebius-Clune, B.N.; Schindelbeck, R.R.; Wolfe, D.W.; van Es, H.M. Use of an integrative soil health test for evaluation of soil management impacts. Renewable Agriculture and Food Systems 2009, 24, 214-224. [CrossRef]
  2. Seybold, C.A.; Hubbs, M.D.; Tyler, D.D. On-Farm Tests Indicate Effects of Long-Term Tillage Systems on Soil Quality. Journal of Sustainable Agriculture 2002, 19, 61-73. [CrossRef]
  3. Morton, J.; Baird, D.; Manning, M. A soil sampling protocol to minimise the spatial variability in soil test values in New Zealand hill country. New Zealand Journal of Agricultural Research 2000, 43, 367-375. [CrossRef]
  4. Lincy, C.T.; Lenin, F.A.; Jalbin, J. Deep residual network for soil nutrient assessment using optical sensors. Journal of Plant Nutrition and Soil Science 2023, n/a. [CrossRef]
  5. Kim, H.-J.; Sudduth, K.A.; Hummel, J.W. Soil macronutrient sensing for precision agriculture. Journal of Environmental Monitoring 2009, 11, 1810-1824. [CrossRef]
  6. Amoo, A.; Babalola, O. Ammonia-oxidizing microorganisms: Key players in the promotion of plant growth. Journal of soil science and plant nutrition 2017, 17, 935-947. [CrossRef]
  7. Singh, N.; Singh, P.; Pathak, P.K.; Gupta, K.J. Using Different Forms of Nitrogen to Study Hypersensitive Response Elicited by Avirulent Pseudomonas syringae. In Nitrogen Metabolism in Plants: Methods and Protocols, Gupta, K.J., Ed.; Springer New York: New York, NY, 2020; pp. 79-92.
  8. von Wirén, N.; Gojon, A.; Chaillou, S.; Raper, D. Mechanisms and Regulation of Ammonium Uptake in Higher Plants. In Plant Nitrogen, Lea, P.J., Morot-Gaudry, J.-F., Eds.; Springer Berlin Heidelberg: Berlin, Heidelberg, 2001; pp. 61-77.
  9. George, J.; Holtham, L.; Sabermanesh, K.; Heuer, S.; Tester, M.; Plett, D.; Garnett, T. Small amounts of ammonium (NH$ _4^+ $) can increase growth of maize (Zea mays). Journal of Plant Nutrition and Soil Science 2016, 179, 717-725. [CrossRef]
  10. Britto, D.T.; Glass, A.D.M.; Kronzucker, H.J.; Siddiqi, M.Y. Cytosolic Concentrations and Transmembrane Fluxes of NH4 +/NH3. An Evaluation of Recent Proposals. Plant Physiology 2001, 125, 523-526. [CrossRef]
  11. Torres, M.J.; Simon, J.; Rowley, G.; Bedmar, E.J.; Richardson, D.J.; Gates, A.J.; Delgado, M.J. Chapter Seven - Nitrous Oxide Metabolism in Nitrate-Reducing Bacteria: Physiology and Regulatory Mechanisms. In Advances in Microbial Physiology, Poole, R.K., Ed.; Academic Press: 2016; Volume 68, pp. 353-432.
  12. Ambus, P.; Zechmeister-Boltenstern, S.; Butterbach-Bahl, K. Sources of nitrous oxide emitted from European forest soils. Biogeosciences 2006, 3, 135-145. [CrossRef]
  13. Liebig, M.A.; Doran, J.W.; Gardner, J.C. Evaluation of a Field Test Kit for Measuring selected Soil Quality Indicators. Agronomy Journal 1996, 88, 683-686. [CrossRef]
  14. Ditzler, C.; Tugel, A. Soil Quality Field Tools. Agronomy Journal - AGRON J 2002, 94. [CrossRef]
  15. Yeh, P.; Yeh, N.; Lee, C.-H.; Ding, T.-J. Applications of LEDs in optical sensors and chemical sensing device for detection of biochemicals, heavy metals, and environmental nutrients. Renewable and Sustainable Energy Reviews 2017, 75, 461-468. [CrossRef]
  16. Yeh, N.; Ding, T.J.; Yeh, P. Light-emitting diodes׳ light qualities and their corresponding scientific applications. Renewable and Sustainable Energy Reviews 2015, 51, 55-61. [CrossRef]
  17. Lapsiwala, P. Optical sensor for analysis of amonia, iron and manganese nutrients. International Journal of Engineering and Technology(UAE) 2018, 7, 288-291. [CrossRef]
  18. Mohd Yusof, K.; Isaak, S.; Che Abd Rashid, N.; Ngajikin, N.H. NPK DETECTION SPECTROSCOPY ON NON-AGRICULTURE SOIL. Jurnal Teknologi 2016, 78. [CrossRef]
  19. Yokota, M.; Okada, T.; Yamaguchi, I. An optical sensor for analysis of soil nutrients by using LED light sources. Measurement Science and Technology 2007, 18, 2197. [CrossRef]
  20. Zhang, C.; Kong, W.; Liu, F.; He, Y. Measurement of aspartic acid in oilseed rape leaves under herbicide stress using near infrared spectroscopy and chemometrics. Heliyon 2016, 2, e00064. [CrossRef]
  21. Keeney, D.R.; Nelson, D.W. Nitrogen—Inorganic Forms. In Methods of Soil Analysis; Agronomy Monographs; 1983; pp. 643-698.
  22. Luchansky, M.S.; Bailey, R.C. High-Q Optical Sensors for Chemical and Biological Analysis. Analytical Chemistry 2012, 84, 793-821. [CrossRef]
  23. Chen, W.; Kaya Özdemir, Ş.; Zhao, G.; Wiersig, J.; Yang, L. Exceptional points enhance sensing in an optical microcavity. Nature 2017, 548, 192-196. [CrossRef]
  24. Cavedo, F.; Esmaili, P.; Norgia, M. Remote Reflectivity Sensor for Industrial Applications. Sensors 2021, 21. [CrossRef]
  25. Portone, A.; Borrego-Varillas, R.; Ganzer, L.; Di Corato, R.; Qualtieri, A.; Persano, L.; Camposeo, A.; Cerullo, G.; Pisignano, D. Conformable Nanowire-in-Nanofiber Hybrids for Low-Threshold Optical Gain in the Ultraviolet. ACS Nano 2020, 14, 8093-8102. [CrossRef]
  26. Prosa, M.; Benvenuti, E.; Kallweit, D.; Pellacani, P.; Toerker, M.; Bolognesi, M.; Lopez-Sanchez, L.; Ragona, V.; Marabelli, F.; Toffanin, S. Organic Light-Emitting Transistors in a Smart-Integrated System for Plasmonic-Based Sensing. Advanced Functional Materials 2021, 31, 2104927. [CrossRef]
  27. Liu, X.; Ma, Y. Sensitive carbon monoxide detection based on light-induced thermoelastic spectroscopy with a fiber-coupled multipass cell [Invited]. Chinese Optics Letters 2022, 20, 031201. [CrossRef]
  28. Jiang, X.; Qavi, A.J.; Huang, S.H.; Yang, L. Whispering-Gallery Sensors. Matter 2020, 3, 371-392. [CrossRef]
  29. Shen, Z.; Du, M. High-performance refractive index sensing system based on multiple Fano resonances in polarization-insensitive metasurface with nanorings. Opt. Express 2021, 29, 28287-28296. [CrossRef]
  30. Fay, C.D.; Nattestad, A. LED PEDD Discharge Photometry: Effects of Software Driven Measurements for Sensing Applications. Sensors 2022, 22. [CrossRef]
  31. Bhandari, A.K. A logarithmic law based histogram modification scheme for naturalness image contrast enhancement. Journal of Ambient Intelligence and Humanized Computing 2020, 11, 1605-1627. [CrossRef]
  32. Priyadarshini, N.; Sarkar, M. A High Dynamic Range CMOS Image Sensor using Programmable Linear-Logarithmic Counter for Low Light Imaging Applications. In Proceedings of the 2020 IEEE International Symposium on Circuits and Systems (ISCAS), 12-14 Oct 2020, 2020; pp. 1-5. [CrossRef]
  33. Brunetti, A.M.; Choubey, B. A Low Dark Current 160 dB Logarithmic Pixel with Low Voltage Photodiode Biasing. Electronics 2021, 10. [CrossRef]
  34. Zhang, G.; Gu, Z.; Zhao, Q.; Ren, J.; Han, S.; Lu, W. A Multi-Node Detection Algorithm Based on Serial and Threshold in Intelligent Sensor Networks. Sensors 2020, 20. [CrossRef]
  35. Mennel, L.; Symonowicz, J.; Wachter, S.; Polyushkin, D.K.; Molina-Mendoza, A.J.; Mueller, T. Ultrafast machine vision with 2D material neural network image sensors. Nature 2020, 579, 62-66. [CrossRef]
  36. Croffie, M.E.T.; Williams, P.N.; Fenton, O.; Fenelon, A.; Metzger, K.; Daly, K. Optimising Sample Preparation and Calibrations in EDXRF for Quantitative Soil Analysis. Agronomy 2020, 10. [CrossRef]
  37. Moldoveanu, S.; David, V. Chapter 12 - Comments on Sample Preparation in Chromatography for Different Types of Materials. In Modern Sample Preparation for Chromatography, Moldoveanu, S., David, V., Eds.; Elsevier: Amsterdam, 2015; pp. 411-446.
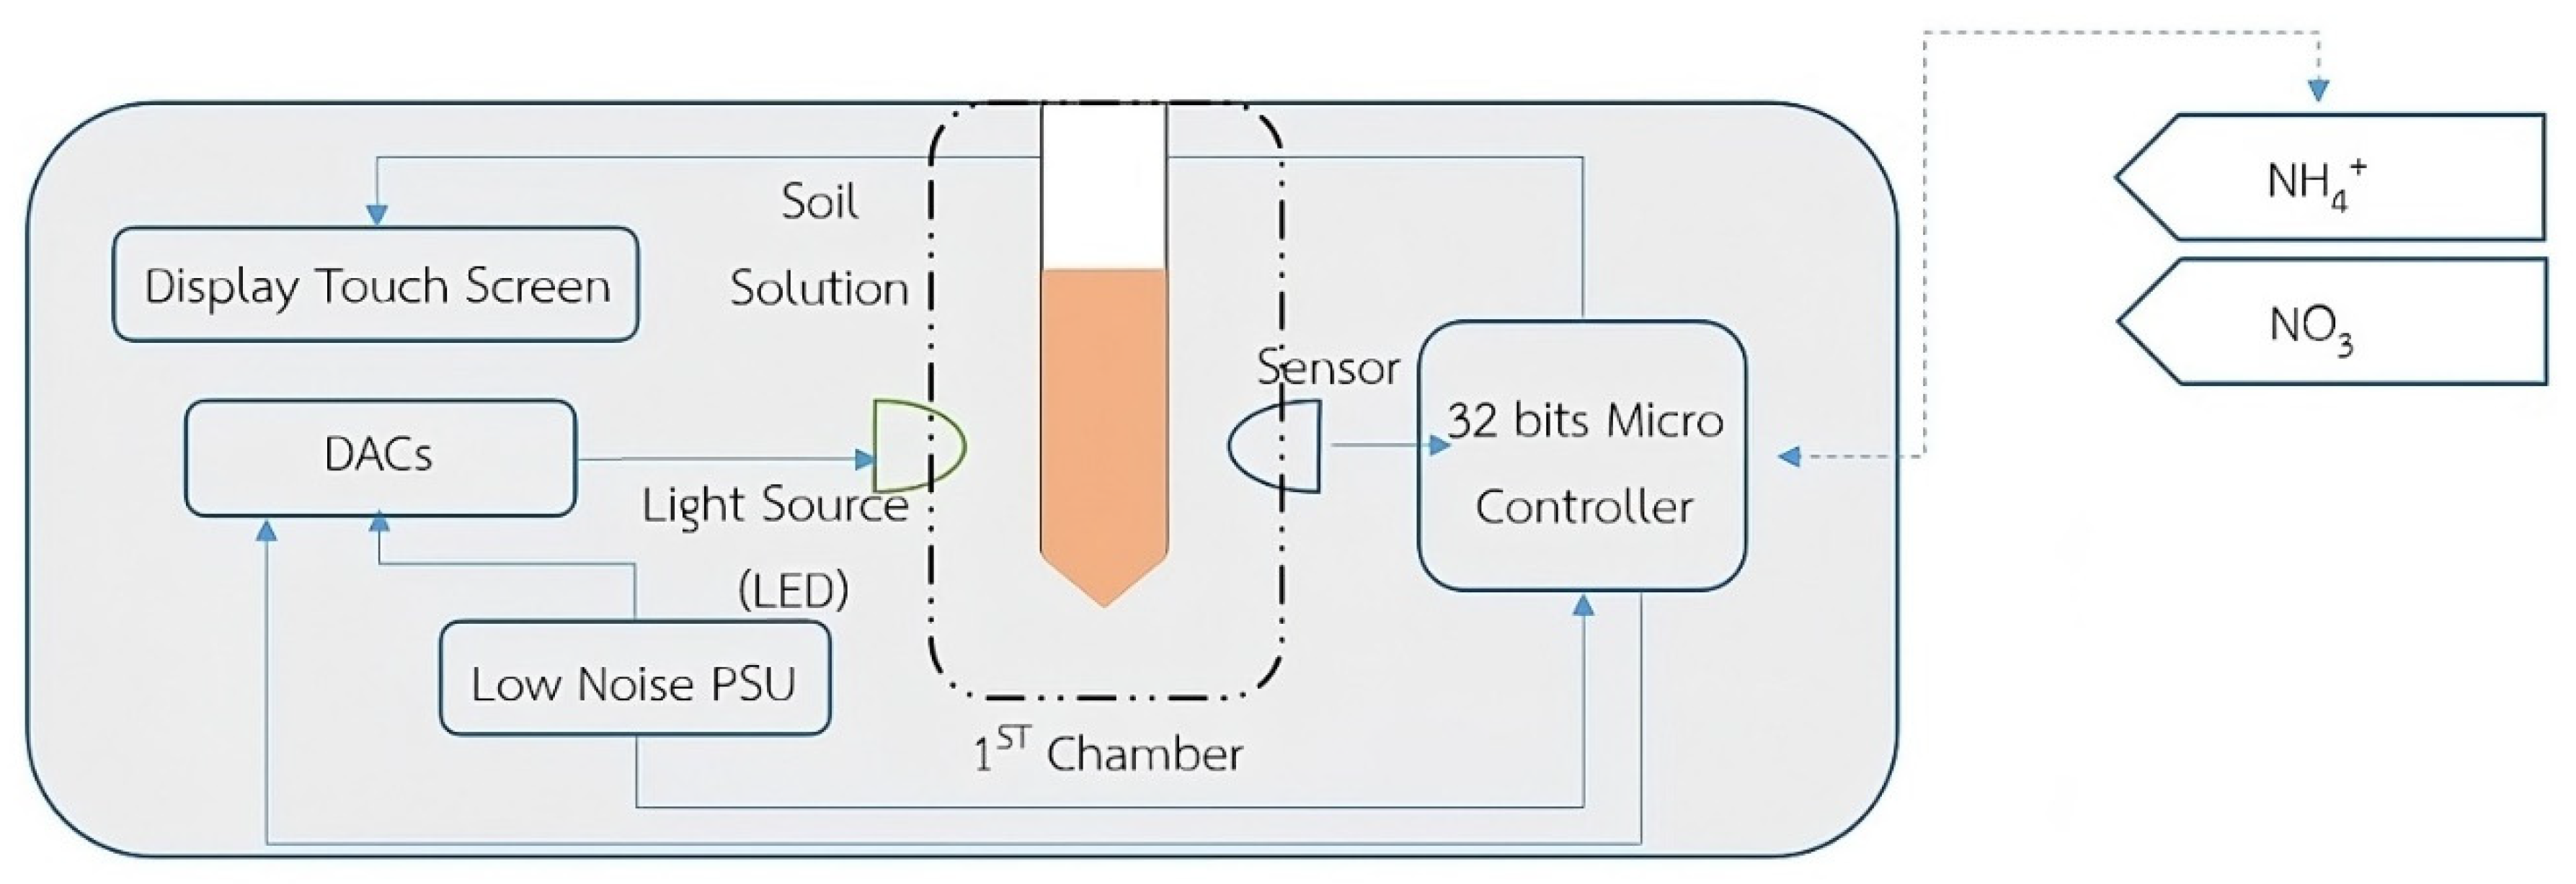
Figure 1. Conceptual framework of soil tester design.
Preprints 102131 g001
Figure 2. . Spectral wave range of light sensor detector.
Preprints 102131 g002
Figure 3. Spectral response of red, green, and blue (RGB) color sensor.
Preprints 102131 g003
Figure 4. Prototype of soil tester device: (a) front view of device. (b) rear view of device (c) Sample solution container and testing chamber at top view.
Preprints 102131 g004
Figure 5. Touchscreen user interface display prototype.
Preprints 102131 g005
Figure 6. Analysis of NH4 + and NO3 - in soil sample data with machine learning techniques.
Preprints 102131 g006
Figure 7. Illustrates steps in developing algorithm for MJU soil tester.
Preprints 102131 g007
Figure 8. (a) Testing ammonium (NH4+) with MJU soil tester. (b) Testing nitrate (NO3-) with MJU soil tester.
Preprints 102131 g008
Figure 9. (a) Top view of MJU soil tester. (b) Rear View of Top view of MJU soil tester.
Preprints 102131 g009
Figure 11. Relationship between average absorption energy values of nitrate (NO3 -) at (a) 515 nm and (b) 415 nm light wavelengths.
Preprints 102131 g011
Table 3. Group means for classification of ammonium (NH4).
Group Function
1 2 3 4
1.00 376.221 -51.416 7.433 -3.190
2.00 105.310 40.947 -10.562 8.717
3.00 -46.107 57.960 -7.391 -14.077
4.00 -182.240 32.644 34.424 3.001
5.00 -263.740 -54.924 -7.556 .615
Table 4. Results of prediction testing for classification of ammonium (NH4+) groups.
Group Predicted Group Membership Total
1.00 2.00 3.00 4.00 5.00
Cross-validated Count 1.00 103 0 0 0 0 103
2.00 0 141 0 0 0 141
3.00 0 0 85 0 0 85
4.00 0 0 0 70 0 70
5.00 0 0 0 0 140 140
% 1.00 100.0 .0 .0 .0 .0 100.0
2.00 .0 100.0 .0 .0 .0 100.0
3.00 .0 .0 100.0 .0 .0 100.0
4.00 .0 .0 .0 100.0 .0 100.0
5.00 .0 .0 .0 .0 100.0 100.0
Table 5. Discriminant functions (CDFs) of nitrate (NO3 -).
Function Eigenvalue % of Variance Cumulative % Canonical Correlation
1 5686.972a 99.6 99.6 1.000
2 17.653a .3 99.9 .973
3 4.491a .1 100.0 .904
Table 6. Discriminant function coefficients for nitrate (NO3 -) group classification.
Function
1 2 3
S415 .198 .015 .026
S480 -.120 -.021 .013
S515 .015 .021 -.020
S555 .013 .002 .013
(Constant) -29.245 -101.595 -62.687
Table 7. Mean values of group classification for nitrate (NO3 -).
Group Function
1 2 3
1.00 -88.279 1.881 1.775
2.00 8.222 5.715 -3.718
3.00 -8.922 -6.097 -1.206
4.00 115.291 .960 1.770
Table 8. Results of prediction testing for group classification of nitrate (NO3 -).
Group Predicted Group Membership Total
1.00 2.00 3.00 4.00
Cross-validated Count 1.00 100 0 0 0 100
2.00 0 55 0 0 55
3.00 0 0 95 0 95
4.00 0 0 0 80 80
% 1.00 100.0 .0 .0 .0 100.0
2.00 .0 100.0 .0 .0 100.0
3.00 .0 .0 100.0 .0 100.0
4.00 .0 .0 .0 100.0 100.0
Table 9. Testing of prediction equation of ammonium (NH4+) in soil sample.
Group Predicted Group Membership Total
1.00 2.00 3.00 4.00 5.00
Cross-validated Count 1.00 37 0 0 0 0 330/499
2.00 97 249 61 11 0
3.00 0 0 34 0 0
4.00 0 0 0 10 0
5.00 0 0 0 0 0
% 1.00 27.61 0.00 0.00 0.00 0.00 66.13/100
2.00 72.39 100.00 64.21 52.38 0.00
3.00 0.00 0.00 35.79 0.00 0.00
4.00 0.00 0.00 0.00 47.62 0.00
5.00 0.00 0.00 0.00 0.00 0.00
Table 10. Testing predictive equation of nitrate (NO3-).
Group Predicted Group Membership Total
1.00 2.00 3.00 4.00
Cross-validated Count 1.00 340 5 25 20 405/500
2.00 0 15 20 10
3.00 5 10 30 0
4.00 0 0 0 20
% 1.00 98.55 16.67 33.33 40.00 81/100
2.00 0.00 50.00 26.67 20.00
3.00 1.45 33.33 40.00 0.00
4.00 0.00 0.00 0.00 40.00
Disclaimer/Publisher’s Note: The statements, opinions and data contained in all publications are solely those of the individual author(s) and contributor(s) and not of MDPI and/or the editor(s). MDPI and/or the editor(s) disclaim responsibility for any injury to people or property resulting from any ideas, methods, instructions or products referred to in the content.
Copyright: This open access article is published under a Creative Commons CC BY 4.0 license, which permit the free download, distribution, and reuse, provided that the author and preprint are cited in any reuse.
Prerpints.org logo

Preprints.org is a free preprint server supported by MDPI in Basel, Switzerland.

Subscribe

© 2024 MDPI (Basel, Switzerland) unless otherwise stated