Preprint
Article

Intake of Special Amino Acids Mixture Leads to Blunted Murine Colon Cancer Growth In Vitro and In Vivo

Altmetrics

Downloads

106

Views

42

Comments

0

A peer-reviewed article of this preprint also exists.

Submitted:

25 March 2024

Posted:

26 March 2024

You are already at the latest version

Alerts
Abstract
Cancer cells require substantial amounts of energy and substrates for their metabolic hyperactivity, enabling the synthesis of new cells at the expense of healthy ones. Preliminary in vitro data suggest that a mix of free essential amino acids (EAA-mix) can promote cancer cell apoptosis by enhancing autophagy. This study aimed to confirm, both in vitro and in vivo, whether EAA intake could influence the development of colon cancer in mice. We investigated changes in cancer proliferation in CT26 cells treated with EAA-mix, and in mice fed with EAA rich modified diets (EAARD) as compared to those on a standard laboratory diet (StD). CT26 cells were injected subcutaneously (s.c.) or intraperitoneally (i.p.). After 21 days, tumors were removed and measured. In vitro data corroborated that EAA-mix impairs cancer growth by inducing autophagy and apoptosis. In vivo data revealed that mice on StD developed significantly larger (s.c.) and more numerous (i.p.) cancers than those on EAARD. EAA administration appears to influence cancer cell survival with notable anti-proliferative properties.
Keywords: 
Subject: Biology and Life Sciences  -   Life Sciences

1. Introduction

Colon cancer ranks globally as the third most common cancer type and the third-leading cause of cancer death. It has an estimated 5-year relative survival rate of 64% [1]. Hence, any intervention that improves survival rates for colon cancer patients can have significant implications.
Tumor growth, driven by the duplication of mutated cells, requires high biosynthetic activity. This, in turn, demands an adequate supply of both nutrients and energy. We have postulated a possible energy-dependent relationship balancing the high-energy consuming process of syntheses and autophagy (AUT) [2]. Protein synthesis consumes a large amount of ATP, generating AMP that subsequently activates AMP-kinase (AMPK). AMPK activation would then suppress mTORCs (mammalian target of rapamycin components) dependent syntheses and trigger the AUT machinery, promoting ATP and non-essential amino acids (NEAA) refueling in a continuous synchrony [2,3].
Tumor cells exhibit profound alterations in amino acid (AA) metabolism, which sustains protein anabolism and energy production for proliferation support. As a result, colon cancer cells release diffusible molecules in the bloodstream that stimulate protein and lipid depletion, mainly in the skeletal muscle, giving rise to cachexia. Therefore, EAA supplementation may improve the nutritional status of cancer patients by counteracting cachexia and enhancing the effectiveness of chemotherapy treatments by minimizing collateral damage [4].
We have previously explored the safety and benefits of food supplementation with a specific free AA mixture rich in EAA (EAA-mix) under various experimental conditions [5,6,7,8,9,10,11,12,13,14]. Some reports have discussed how reducing certain NEAAs (serine and glycine) and consequently increasing EAAs may impact cancer in animal settings [15,16]. However, it was not openly acknowledged in Methods that by subtracting some NEAAs such as serine and glycine from tested formulations, EAA percentages would naturally increase [17], as discussed elsewhere [18].
We have previously demonstrated that altering the EAA/NEAA ratios in diets significantly influences mice survival [19]. Moreover, we have shown in vitro that an EAA-mix containing all free EAA in stoichiometric ratio inhibits tumor cell proliferation and survival by inducing both AUT and apoptosis in duplicating cancer cells [7,20]. Therefore, we investigated whether changes in EAA/NEAA ratios in diet also affect in vivo cancer development.
Given that the EAA-mix of the special diet also contained serine for specific biological reasons, this study challenges previous data and opinions about the role of EAA and serine in cancer development [16,18].
We initially conducted an in vitro study and subsequently an in vivo study, both via subcutaneous (s.c.) and intraperitoneal (i.p.) injection, using murine colon tumor cells (CT26). In the in vitro study, our primary objective was to assess the effects of the EAA-mix in inducing the death of CT26 cells. In the in vivo studies, our primary objective was to evaluate the difference in tumor development (final volume) between animals fed a standard laboratory diet (StD) and those fed a special EAA-rich diet (EAARD) as the exclusive nitrogen source.

2. Materials and Methods

In Vitro Experiments

Cell cultures. The mouse CT26 colon carcinoma cell line (kindly provided by Prof. Paola Costelli and Prof. Fabio Penna) was cultured in a humidified incubator at 37°C with 5% CO2. The cells were maintained in high-glucose DMEM (Euroclone, Milan, Italy) supplemented with 100 mg/mL penicillin/streptomycin (Sigma Aldrich, Milan, Italy) and 10% FBS (Euroclone, Milan, Italy).
Preparation of AA solution. Cells were treated with a solution of EAA-mix or NEAA-mix (Table 1) dissolved in complete medium (DMEM supplemented with 100 mg/mL penicillin/streptomycin and 10% FBS). AA were dissolved at 1% (w/v) concentration in the medium, then the solution was vortexed and sonicated at 50°C for 30 min to reach complete solubility. Cells were incubated with medium containing 1% or 0.5% AA-mix concentration. Control cells were treated with complete growth medium.
Neutral red assay. Cell viability was measured by neutral red assay. Cells (2x10³) were seeded in triplicates in 96-well plates and left growth in complete medium for 24 hours. Then, cells were incubated with a medium supplemented with EAA-mix or NEAA-mix at 0.5 or 1% concentration. After 48 and 72 hours, medium was replaced with DMEM supplemented with 5% FBS and 40 μg/mL neutral red dye and plates were incubated at 37°C for 2 hours. Then, cells were PBS-washed and incubated with a de-staining solution (50% ethanol in deionized water with 1% acetic glacial acid). Plates were shaken until complete dye extraction was achieved and then absorbance was measured by reading the plate at 540 nm emission wavelengths.
Immunofluorescence analysis. Cells were cultured onto 12 mm glass coverslips in 24-well plates (2x10⁴) and left growth in complete medium for 24 hours. Then, cells were incubated with a medium supplemented with EAA-mix or NEAA at 0.5 or 1% concentration. After 24 and 48 hours, cells were fixed with paraformaldehyde (PFA) solution (3% PFA in PBS) for 20 min at 4°C, permeabilized with 0.1% Triton X-100 in PBS for 10 min at room temperature (RT) and then blocked with a bovine serum albumin (BSA) solution (1% BSA in PBS with 0.1% sodium azide) for 30 min at RT. Cells were incubated with primary antibody anti-LC3β (code: sc-376404; Santa Cruz Biotechnology, Dallas, USA) for 3 hours at RT, washed and then incubated with secondary antibody for 45 min at RT, protected from light. Nuclei were counterstained with Hoechst dye for 30 sec at RT and samples were mounted on slides using Mowiol mounting media. Images were acquired by using a fluorescent Axio observer microscope by using Axio observer fluorescent microscope equipped with Apotome (Carl Zeiss, Oberkochen, Germany) using Zen software (Carl Zeiss, Oberkochen, Germany).
Flow cytometric analysis. Cell apoptosis was assessed using an Annexin V/Propidium Iodide (PI) apoptosis-detection kit (ImmunostepBiotec, Salamanca, Spain), according to the manufacturer’s instructions. Cells (5 x 10⁴) were seeded in duplicates into 6-well plates and left growth in complete medium for 24 hours. Then, cells were incubated with a medium supplemented with EAA at 1% concentration. After 48, 72 and 96 hours, cells were collected into flow cytometry tubes, PBS washed, resuspended in binding buffer and double stained with Annexin-V-FITC/PI. Doxorubicin was used as positive control. Cytofluorimetric analysis was performed using a MACSQuant Analyzer. Cell debris, doublets, and aggregates were excluded from the analysis, and 20,000 events per sample were analyzed.

In Vivo Experiments

The experimental protocol was approved and conducted in accordance with laws of the Italian Ministry of Health and complied with the “The National Animal Protection Guidelines”. The Ethical Committee for animal experiments of the University of Brescia (OPBA) and the Italian Ministry of Health had approved the procedures (decree n. 539/2021-PR).

Diets

Standard laboratory rodent food (Mucedola srl, Milan, Italy) was used as the reference standard diet (StD). Special EAA-mix rich diet (EAARD) (Dottori Piccioni s.r.l., Gessate, Milano-Italy) matched the same total macronutrients, micronutrients and calories contents. The primary difference between the diets was the source and type of nitrogen. In StD, the nitrogen source was represented by unspecified vegetal and animal (fish) proteins. As with all food proteins, the EAA to NEAA ratio (EAA/NEAA) should be considered < or <<0,9. From whole protein mix, it is impossible to obtain the exact percentage in EAA and NEAA. On the contrary, EAARD provided nitrogen as free AA, where the EAA are in excess (84%) compared to NEAA (16%) (EAA/NEAA = 6.14), as previously described [19]. The composition of the pellets is summarized in Table 1.
Animals. Fifty BALB/c male mice, aged 5 weeks (Envigo), were individually housed in filter cages and kept on a 12/12-h light/dark cycle. After 7 days of ad libitum access to StD and water, the mice were randomized into two groups. The first group (n = 25) continued with the StD, while the second group (n = 25) was switched to the EAARD. Every three days, body weight (b.w.), food and water consumption were measured.
After 15 days, 10 StD-fed mice and 10 EAARD-fed mice were injected subcutaneously (s.c.) at the right hip with 1x10⁵ CT26 cells (ATCC code CRL-2638™) strain Balb/c, in 100μl of physiological solution. An additional 30 mice (15 StD and 15 EAARD-fed) were intraperitoneally (i.p.) injected with 1x10⁶ CT26 cells.
Daily monitoring was performed, and if necessary, animals were euthanized early based on veterinary advice and Ethics Committee Criteria. At 21 days post-injection, all injected animals were sacrificed. S.c. tumors, rpWAT, BAT, and triceps of surae were isolated, measured, and weighed. Similarly, visible i.p. tumors with a diameter greater than 1 mm located on the mesentery and/or on the parietal peritoneum were measured and weighed.Tumor volume (mm3) was calculated as:
Vol = [(max diameter x smallest diameter2)/2].
All tumors were stored appropriately for histological and molecular analysis.
Histology and immunohistochemistry. Tumor samples were embedded in paraffin using an automatic includer (Donatello-2, Diapath s.p.a, Martinengo, BG, Italy). Histopathological analysis was conducted under eosin and hematoxylin (E/H) staining [21,22]. Collagen production was evaluated with a picrosirius stain (Sirius-red), as described [23,24,25]
Tumor sections were incubated overnight with primary polyclonal anti-Ki-67 (28074-1-AP), anti-CD31 (28083-1-AP), anti-GRP78 (11587-1-AP); recombinant anti-iNOS (80517-1-RR) all from Proteintech (Rosemont, IL USA) and anti-active Caspase-3 (NB100-56113) from Novus Biologicals (Centennial, USA). The sections were processed according to the manufacturer’s protocol and visualized with IHC Prep & Detect Kit for Rabbit Primary Antibody (PK10017, Proteintech). The IHC negative control was performed by omitting the primary antibody in the presence of iso-type-matched IgGs. The staining intensity was evaluated using an Olympus BX50 microscope equipped with an image analysis program (Image Pro-Plus 4.5.1, Immagini e Computer, Milano, Italy). The IOD was calculated for arbitrary areas by measuring 30 fields for each sample using a 20x lens.
Statistics. Data are expressed as mean ± SD. Statistical analysis was performed by two sample Welch t-test (https://www.statskingdom.com/) to compare the results of experimental groups. A value of p<0.05 was considered statistically significant.

3. Results

3.1. In Vitro Experiments

The neutral red viability assay demonstrated that the EAA-mix significantly reduced CT26 cell viability in both a dose and time-dependent manner. Notably, after 72 hours, there was a 60% decrease in cell survival. Interestingly, the administration of NEAA did not have any significant effect on cancer cell viability (Figure 1).
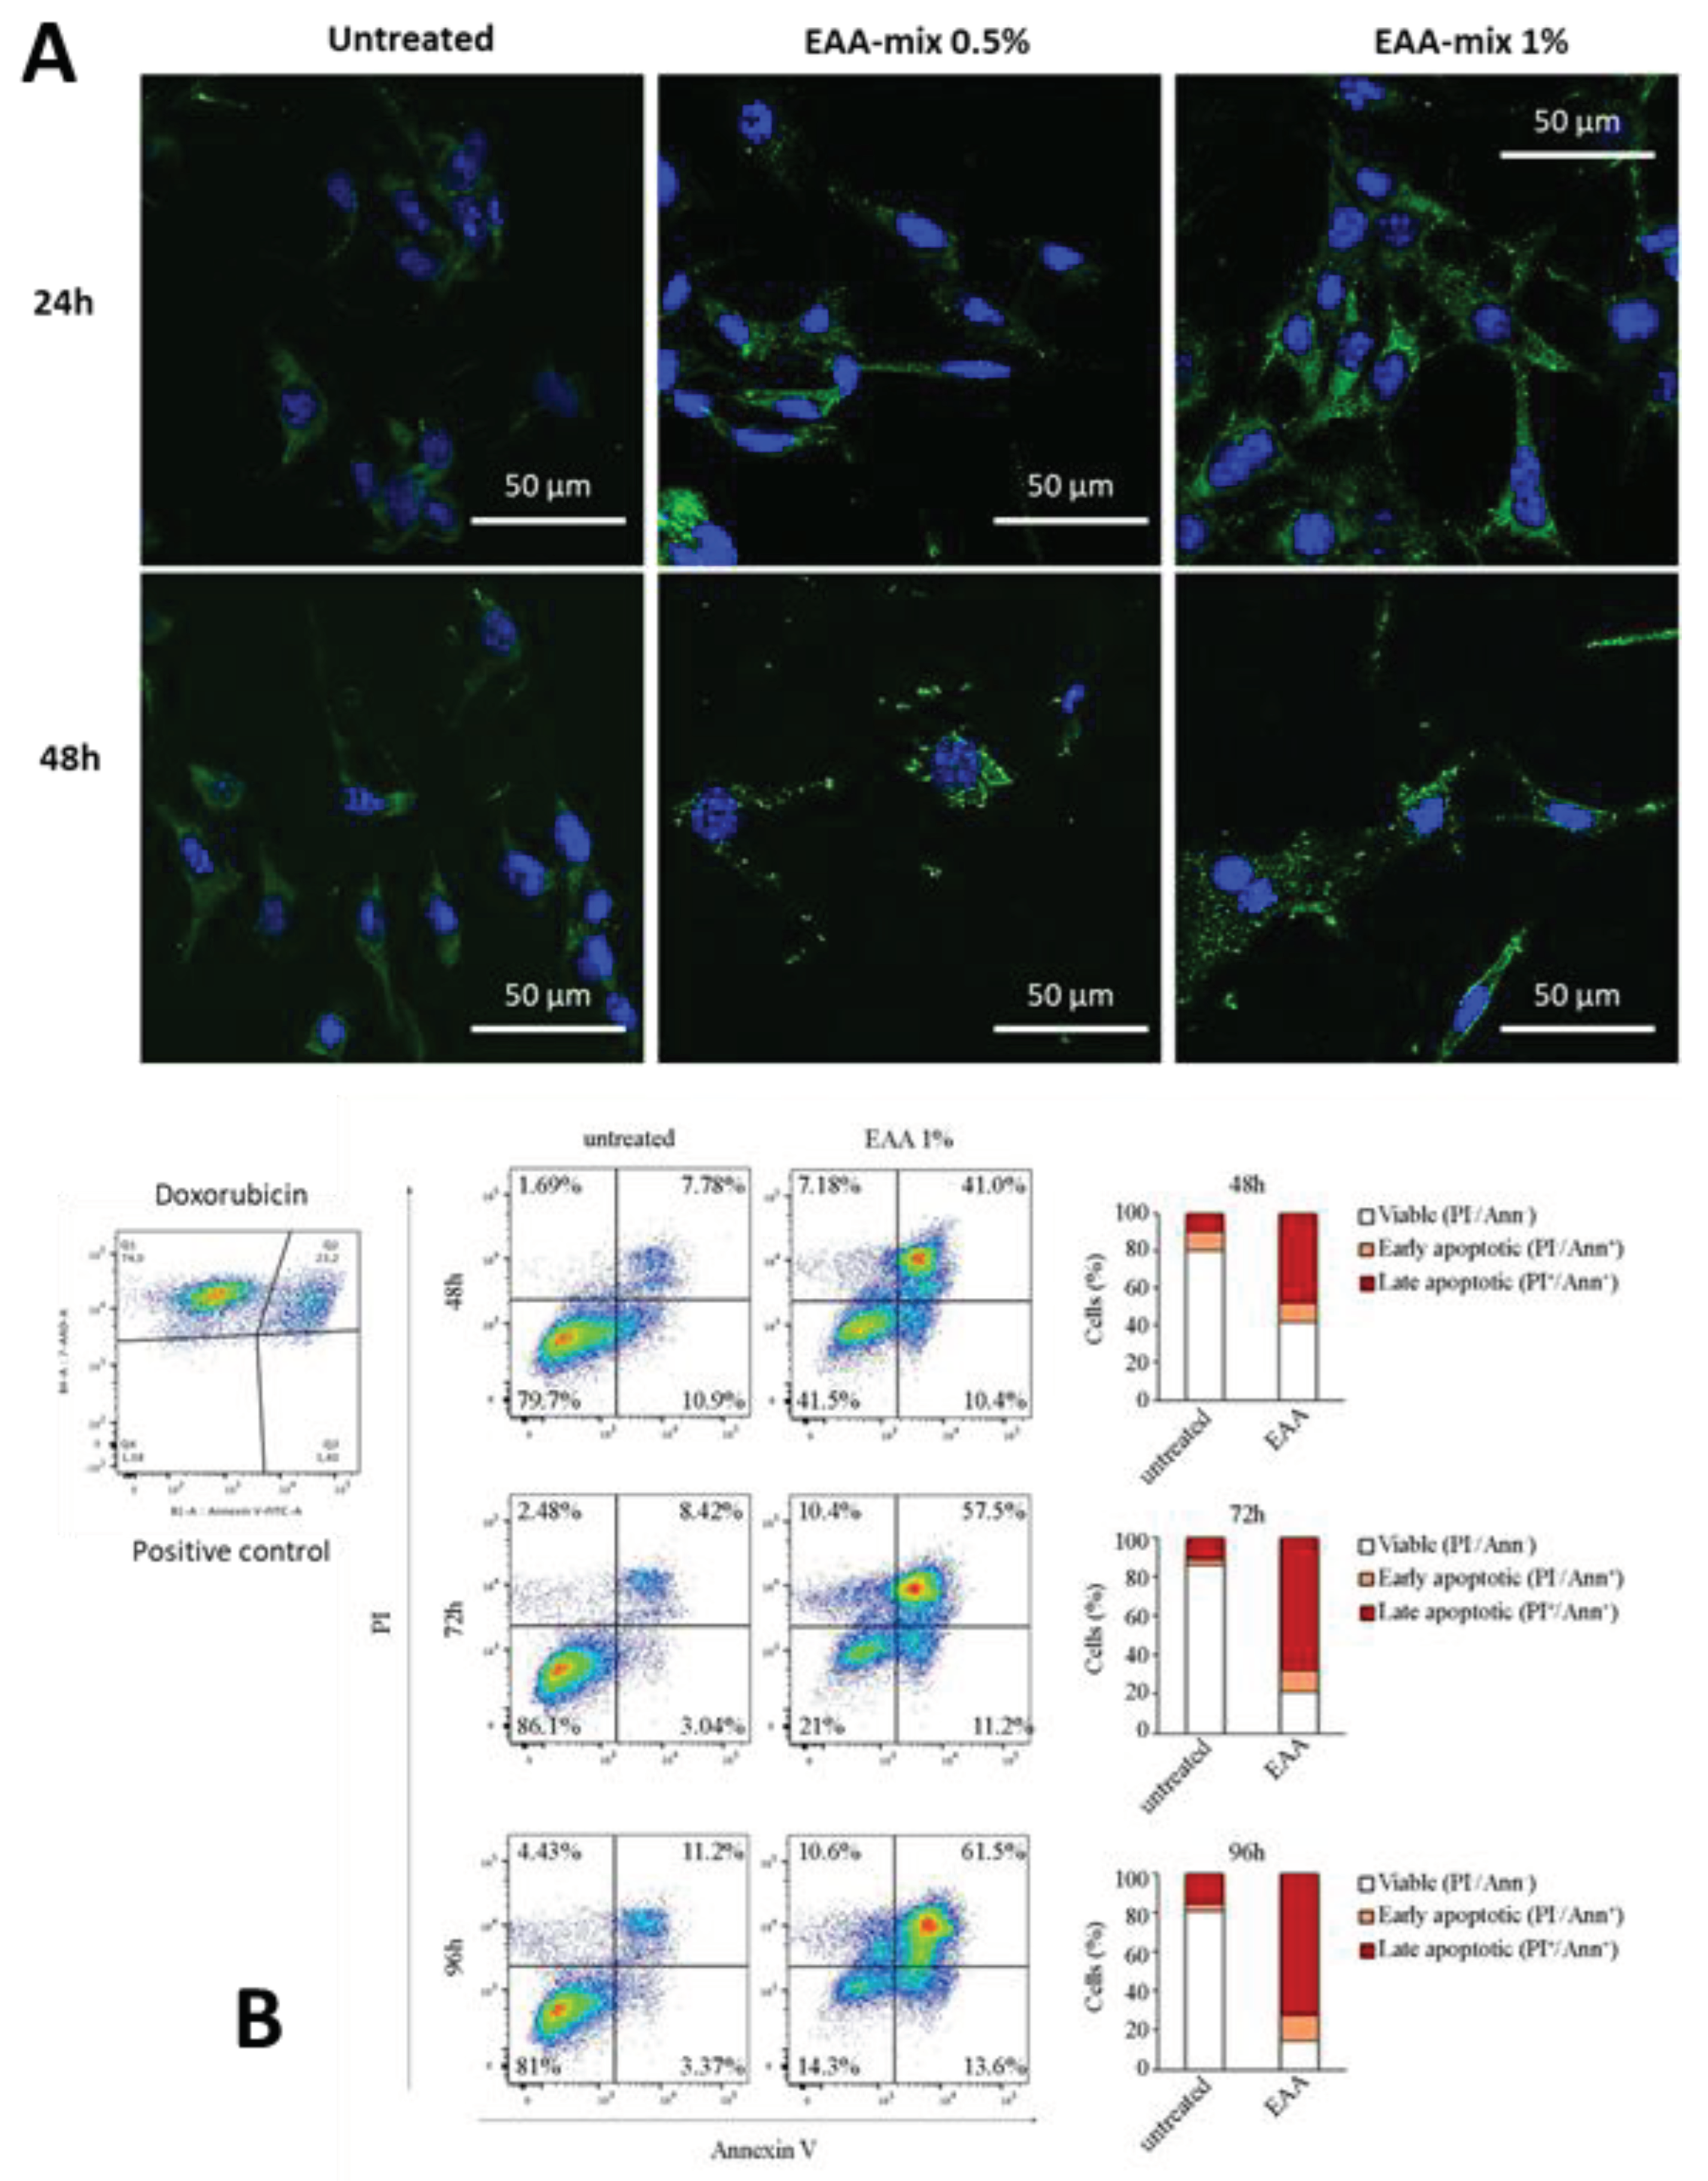
Next, we sought to evaluate the capacity of EAA-mix to induce autophagy and apoptosis in cancer cell line. To this aim, CT26 cells were treated with EAA-mix at 0.5 or 1% concentration and the formation of autophagosomes was evaluated by immunofluorescence analysis for LC3β dots. After 24 hours CT26 cells showed the presence of LC3β positive autophagosomes, reaching the highest intensity after 48 hours. No LC3β signal was observed in untreated cells (Figure 2A). In addition, using FACS analysis, we evaluated cell apoptosis of cells treated with EAA-mix 1% in a 96-hour time course. We found that EAA-mix significantly increased the percentage of apoptotic cells, exhibiting 60% of cell death already after 48 hours of incubation and reaching 80% after 96 hours (Figure 2B).

3.2. In Vivo Experiments

3.2.1. Sub-Cutaneous (s.c.) CT26 Injection

The body weight (b.w.) of animals at the end of treatment shown a decrease of about 16% in StD and only 6.2% EAARD fed (Figure 3A). Two StD fed mice was necessary to euthanize before the deadline by order of the veterinary because they showed serious signs of suffering. No signs of sufferance were observed in EAARD fed mice, and all mice reached the deadline. The reduction of adipose tissue, rpWAT and BAT, was significative in StD-fed mice compared to those EAARD (rpWAT: T=2.811, p-value 0.013; BAT: T=2.349, p-value 0.036) (Figure 3B). Nevertheless, the b.w. loss observed in StD-fed mice derives mainly from the reduction of lean mass. In fact, with StD a significant reduction in the muscle (triceps of surae) was observed in comparison to EAARD (T=3.863; p-value 0.004) (Figure 3C).

3.2.2. Subcutaneous Tumor Development

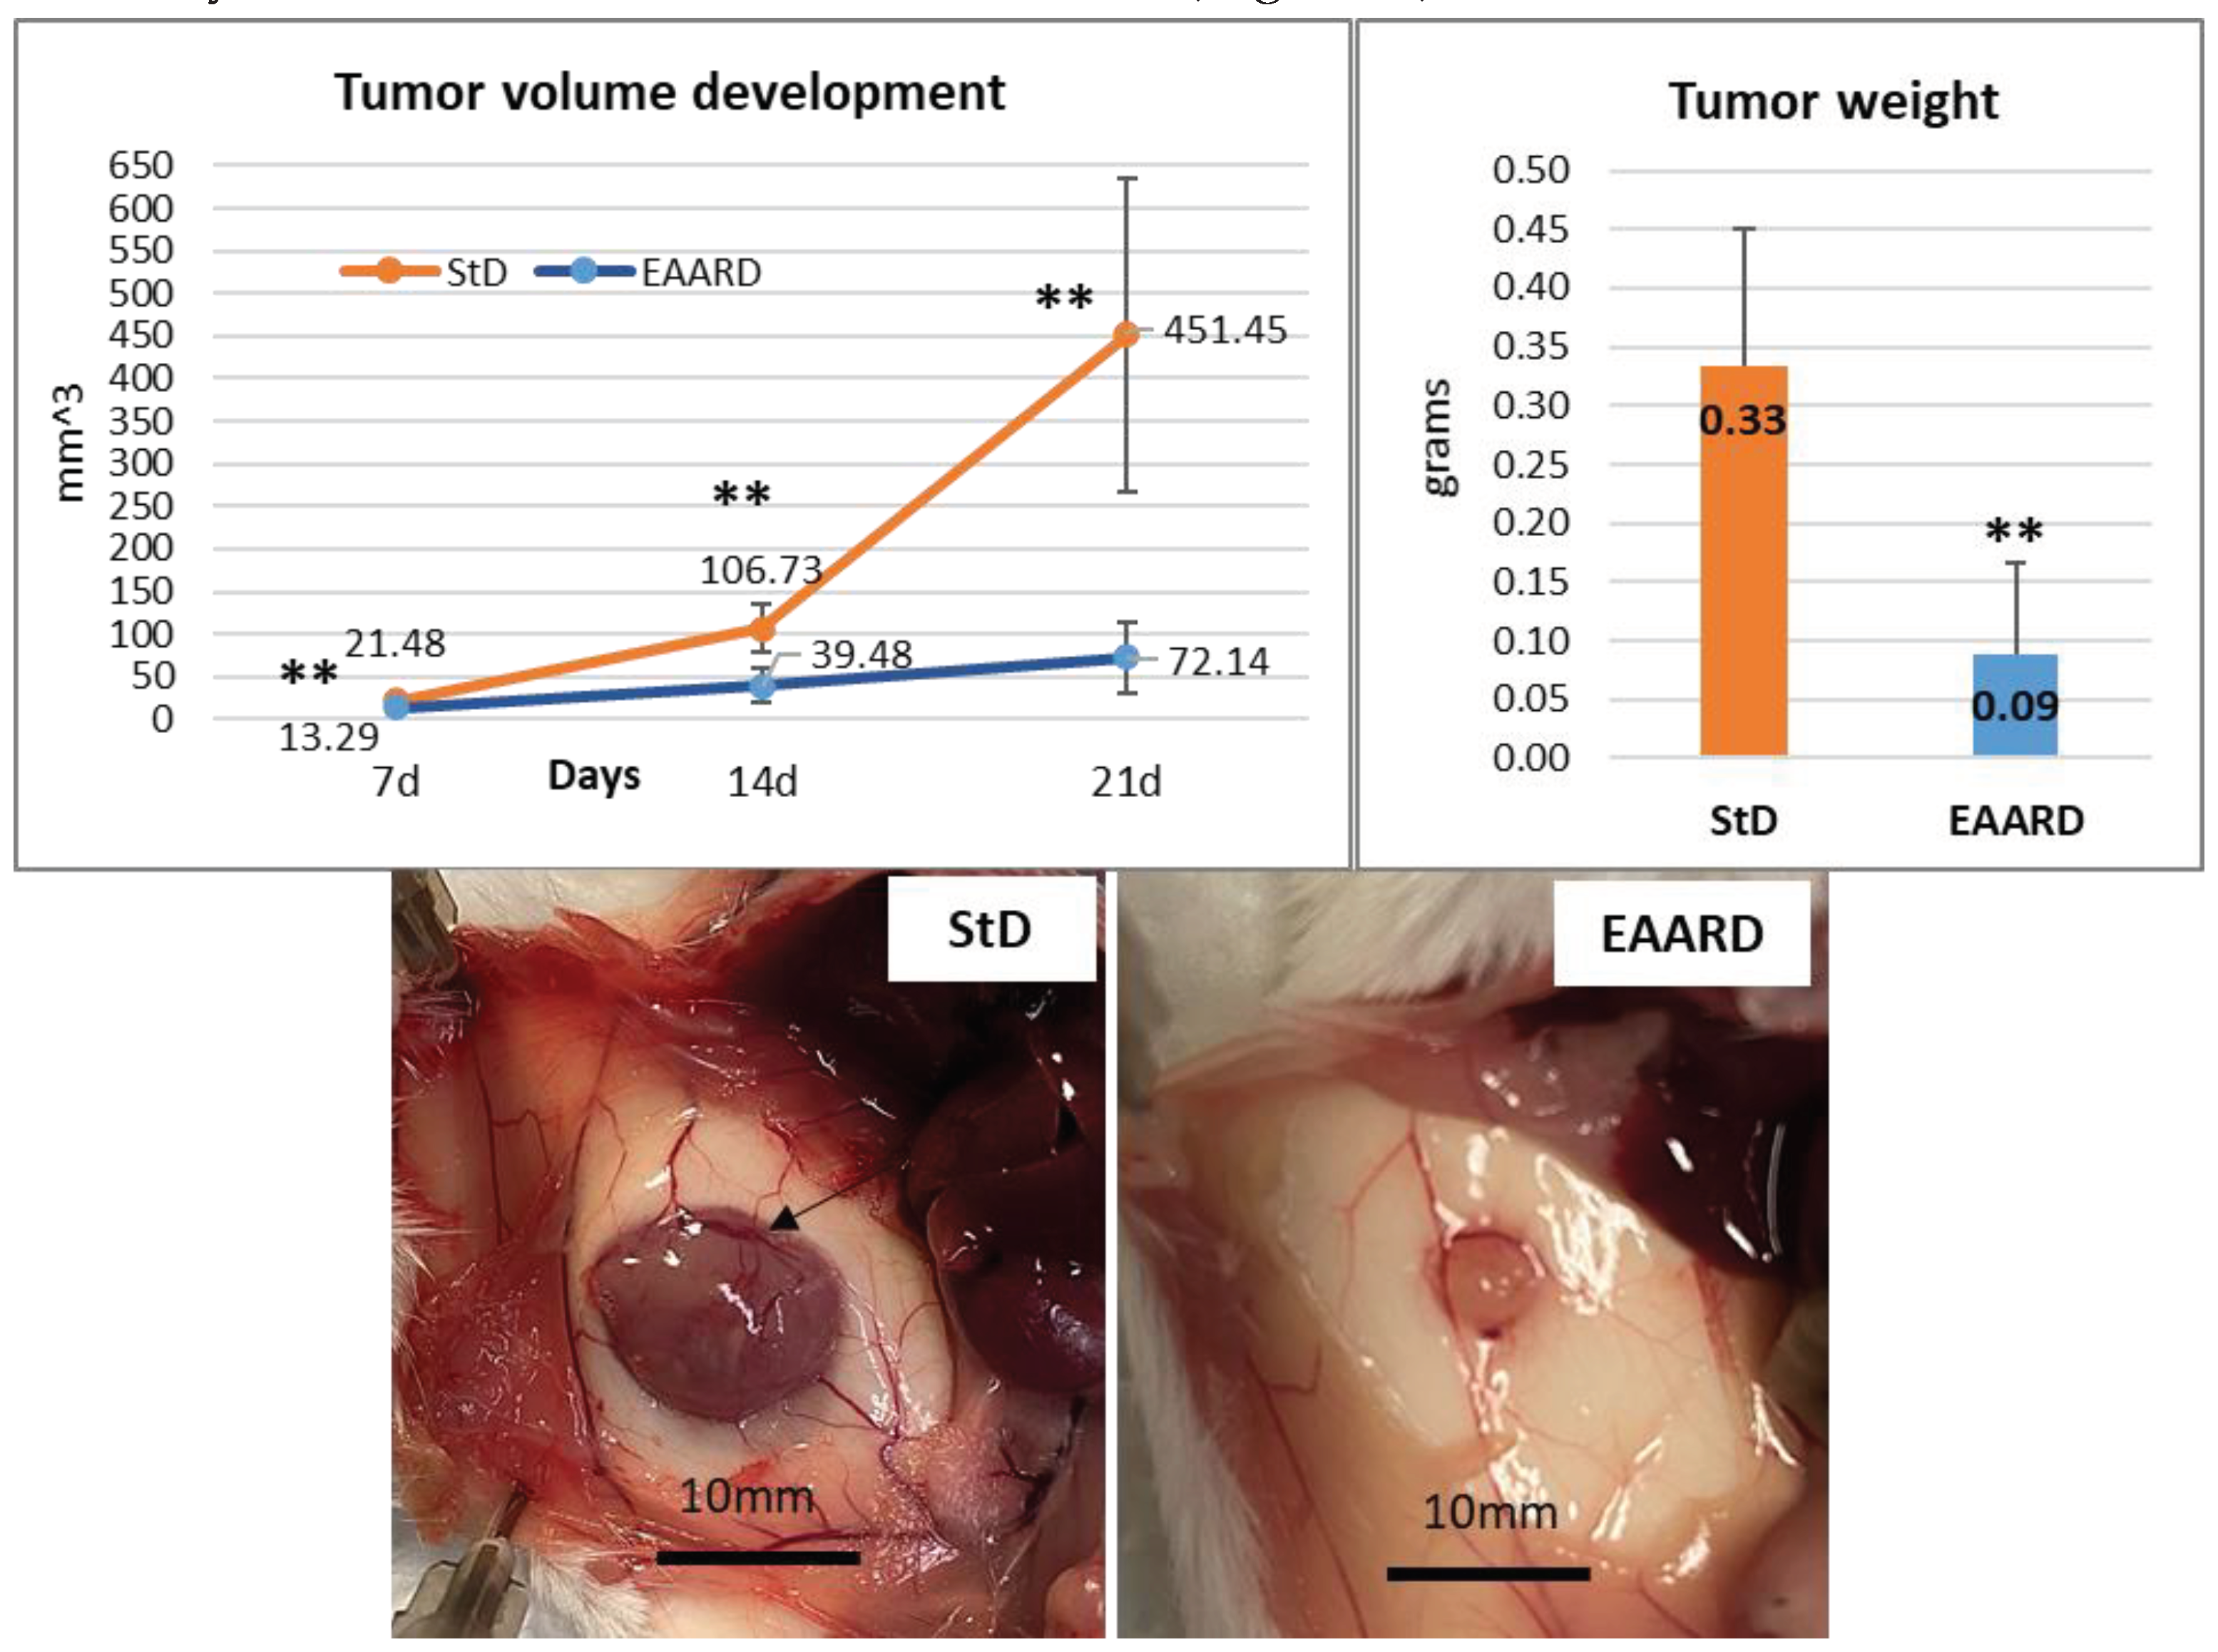
The progression of the subcutaneous (s.c.) tumor was monitored and measured at 7-, 14-, and 21-days post-injection of CT26 cells. Mice fed with the EAARD exhibited a significant slowdown in tumor development. Indeed, at the conclusion of the experiment (21 days), the average volume and weight of tumors in animals fed with the standard diet (StD) were over 6 times higher than those in animals on the EAARD. Specifically, the volume difference was statistically significant (T=5.702; p-value <0.000), as was the weight difference (T=4.535; p-value <0.000). Notably, StD-fed animals demonstrated a complex subcutaneous vascular network surrounding the tumor mass. This network was significantly reduced in animals on the EAARD (Figure 4).

3.3. Histopathological Examination

3.3.1. Eosin/Hematoxylin (E/H) Staining

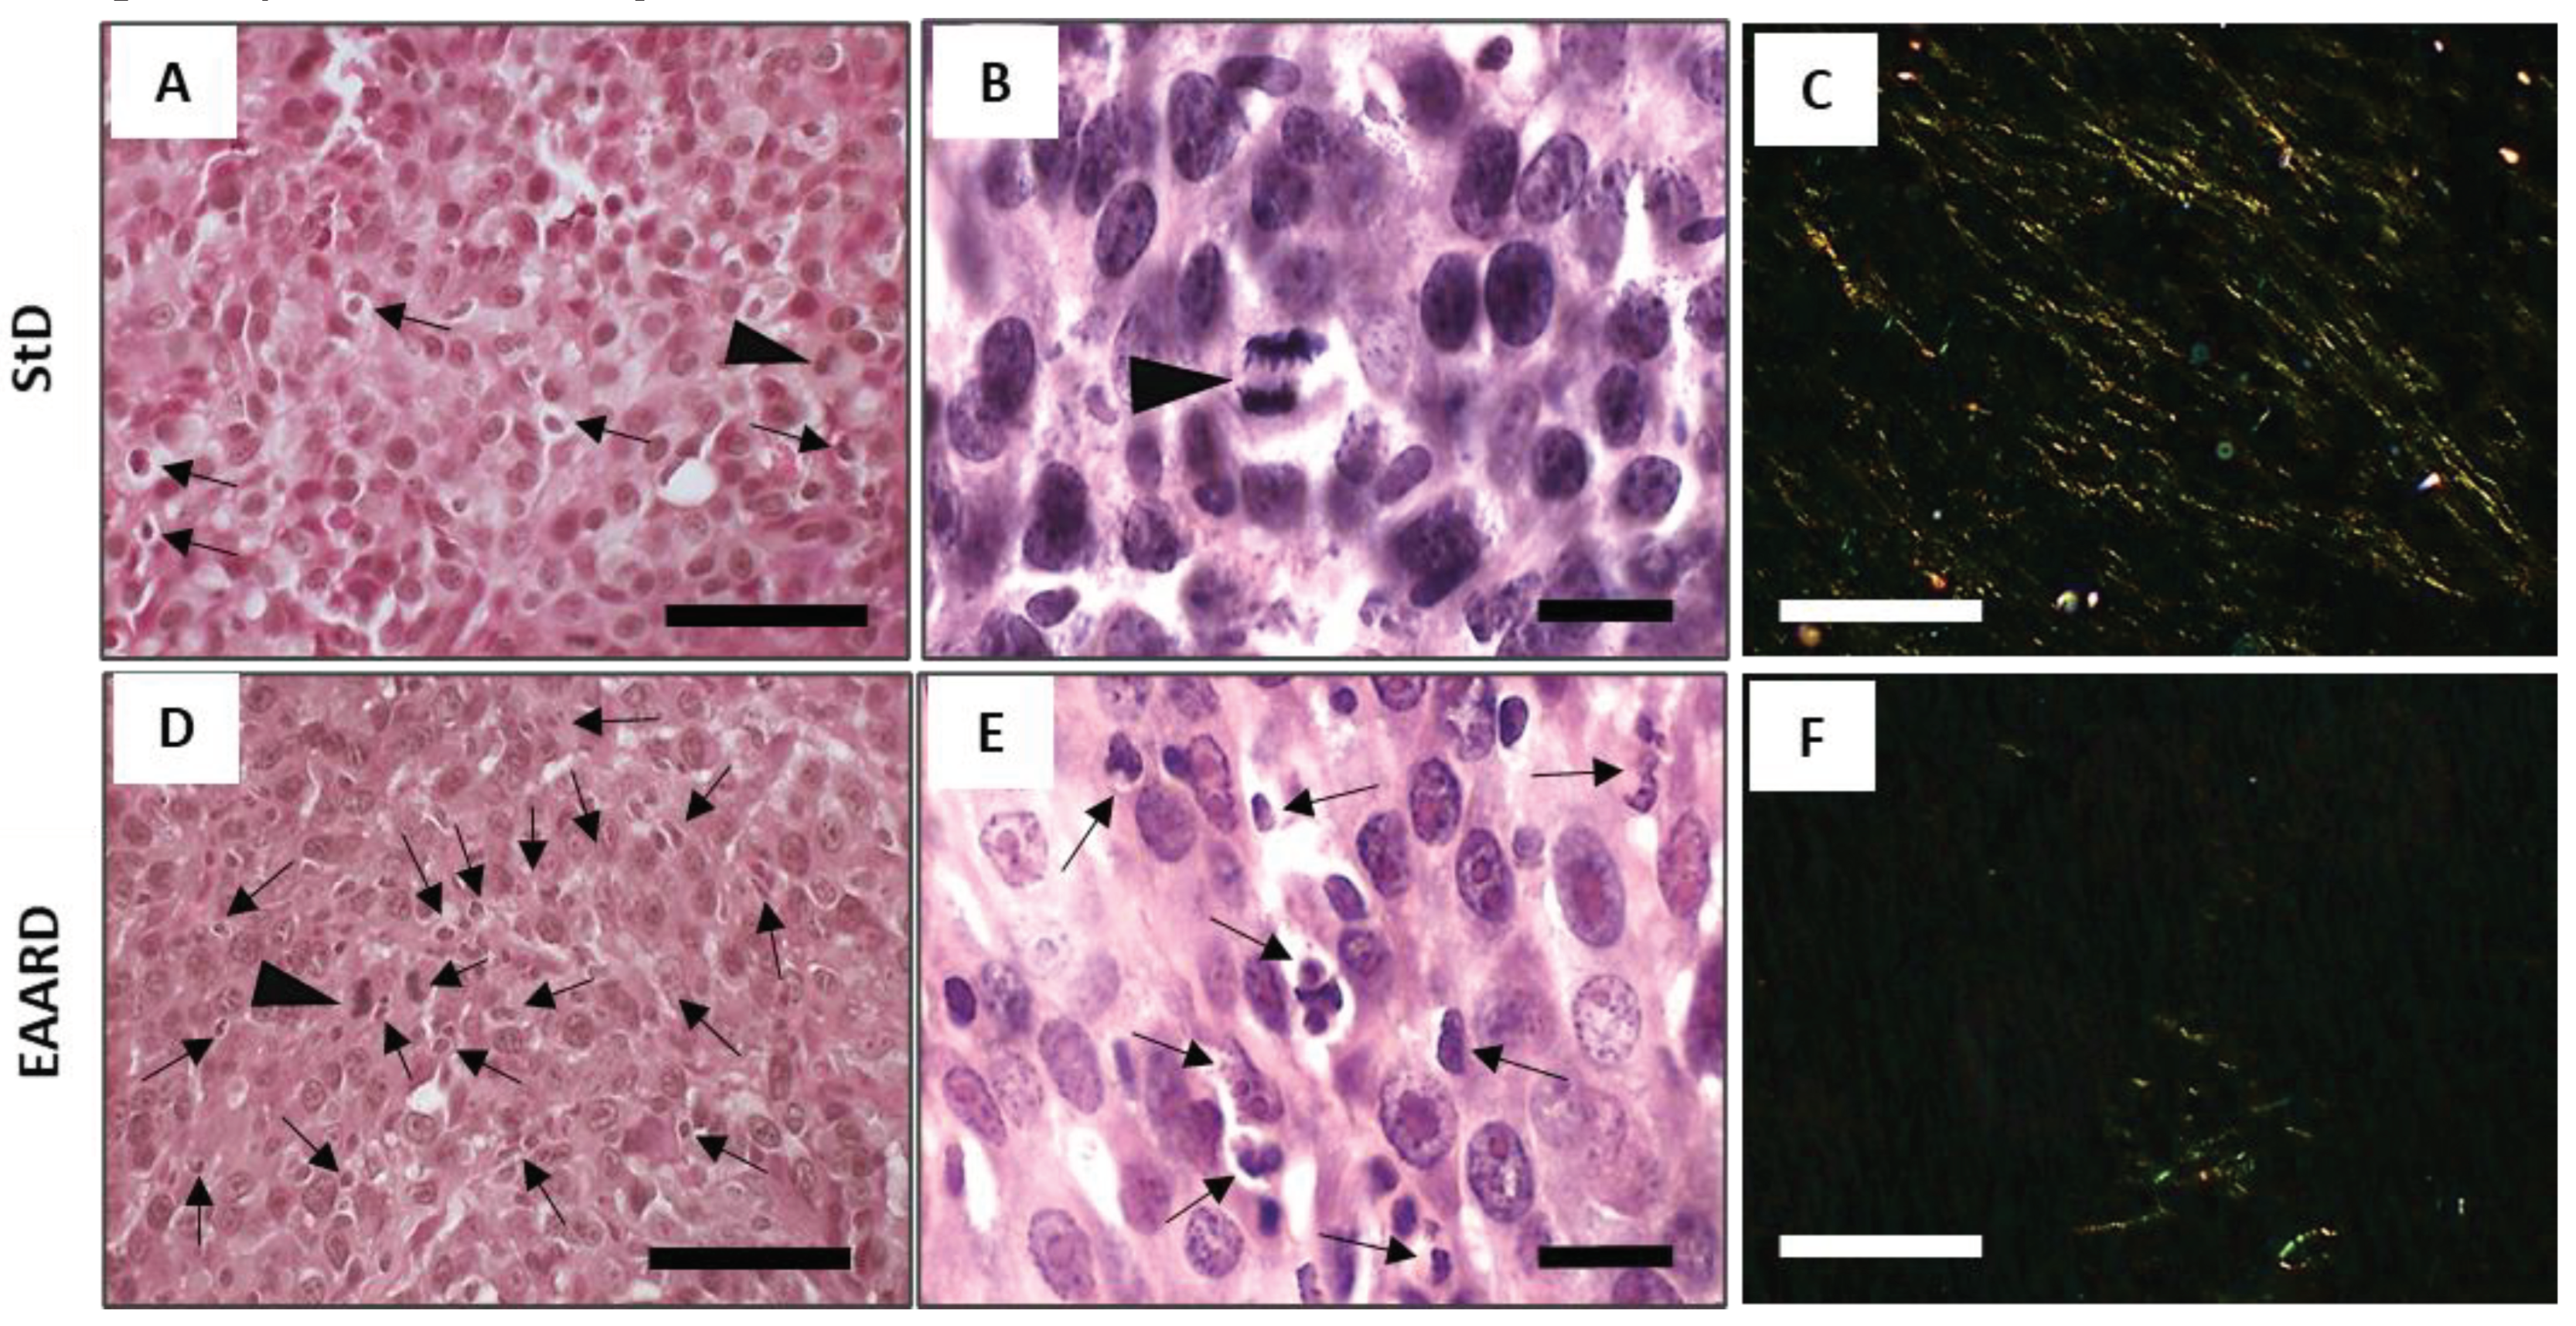
In the StD-fed samples, apoptotic cells were observed to be fewer and randomly dispersed, with the presence of a mitotic cell (Figure 5A and B). Conversely, samples from EAARD-fed mice displayed a high number of foci containing apoptotic cell debris. These were characterized by cytoplasmic and nuclear condensation, as well as nuclear fragmentation. Mitotic cells were infrequently observed (Figure 5D and E).

3.3.2. Sirius-Red Staining

Under Sirius-red staining at polarized light, thinner collagen fibers (type III) were uniformly distributed within the tumor from StD-fed mice, appearing yellow to green in color. In contrast, in the samples from EAARD-fed mice, collagen fibers were scarce and clustered within smaller areas (Figure 5C and F).

3.4. Immunohistochemical Analysis

3.4.1. Anti-Ki-67 Staining

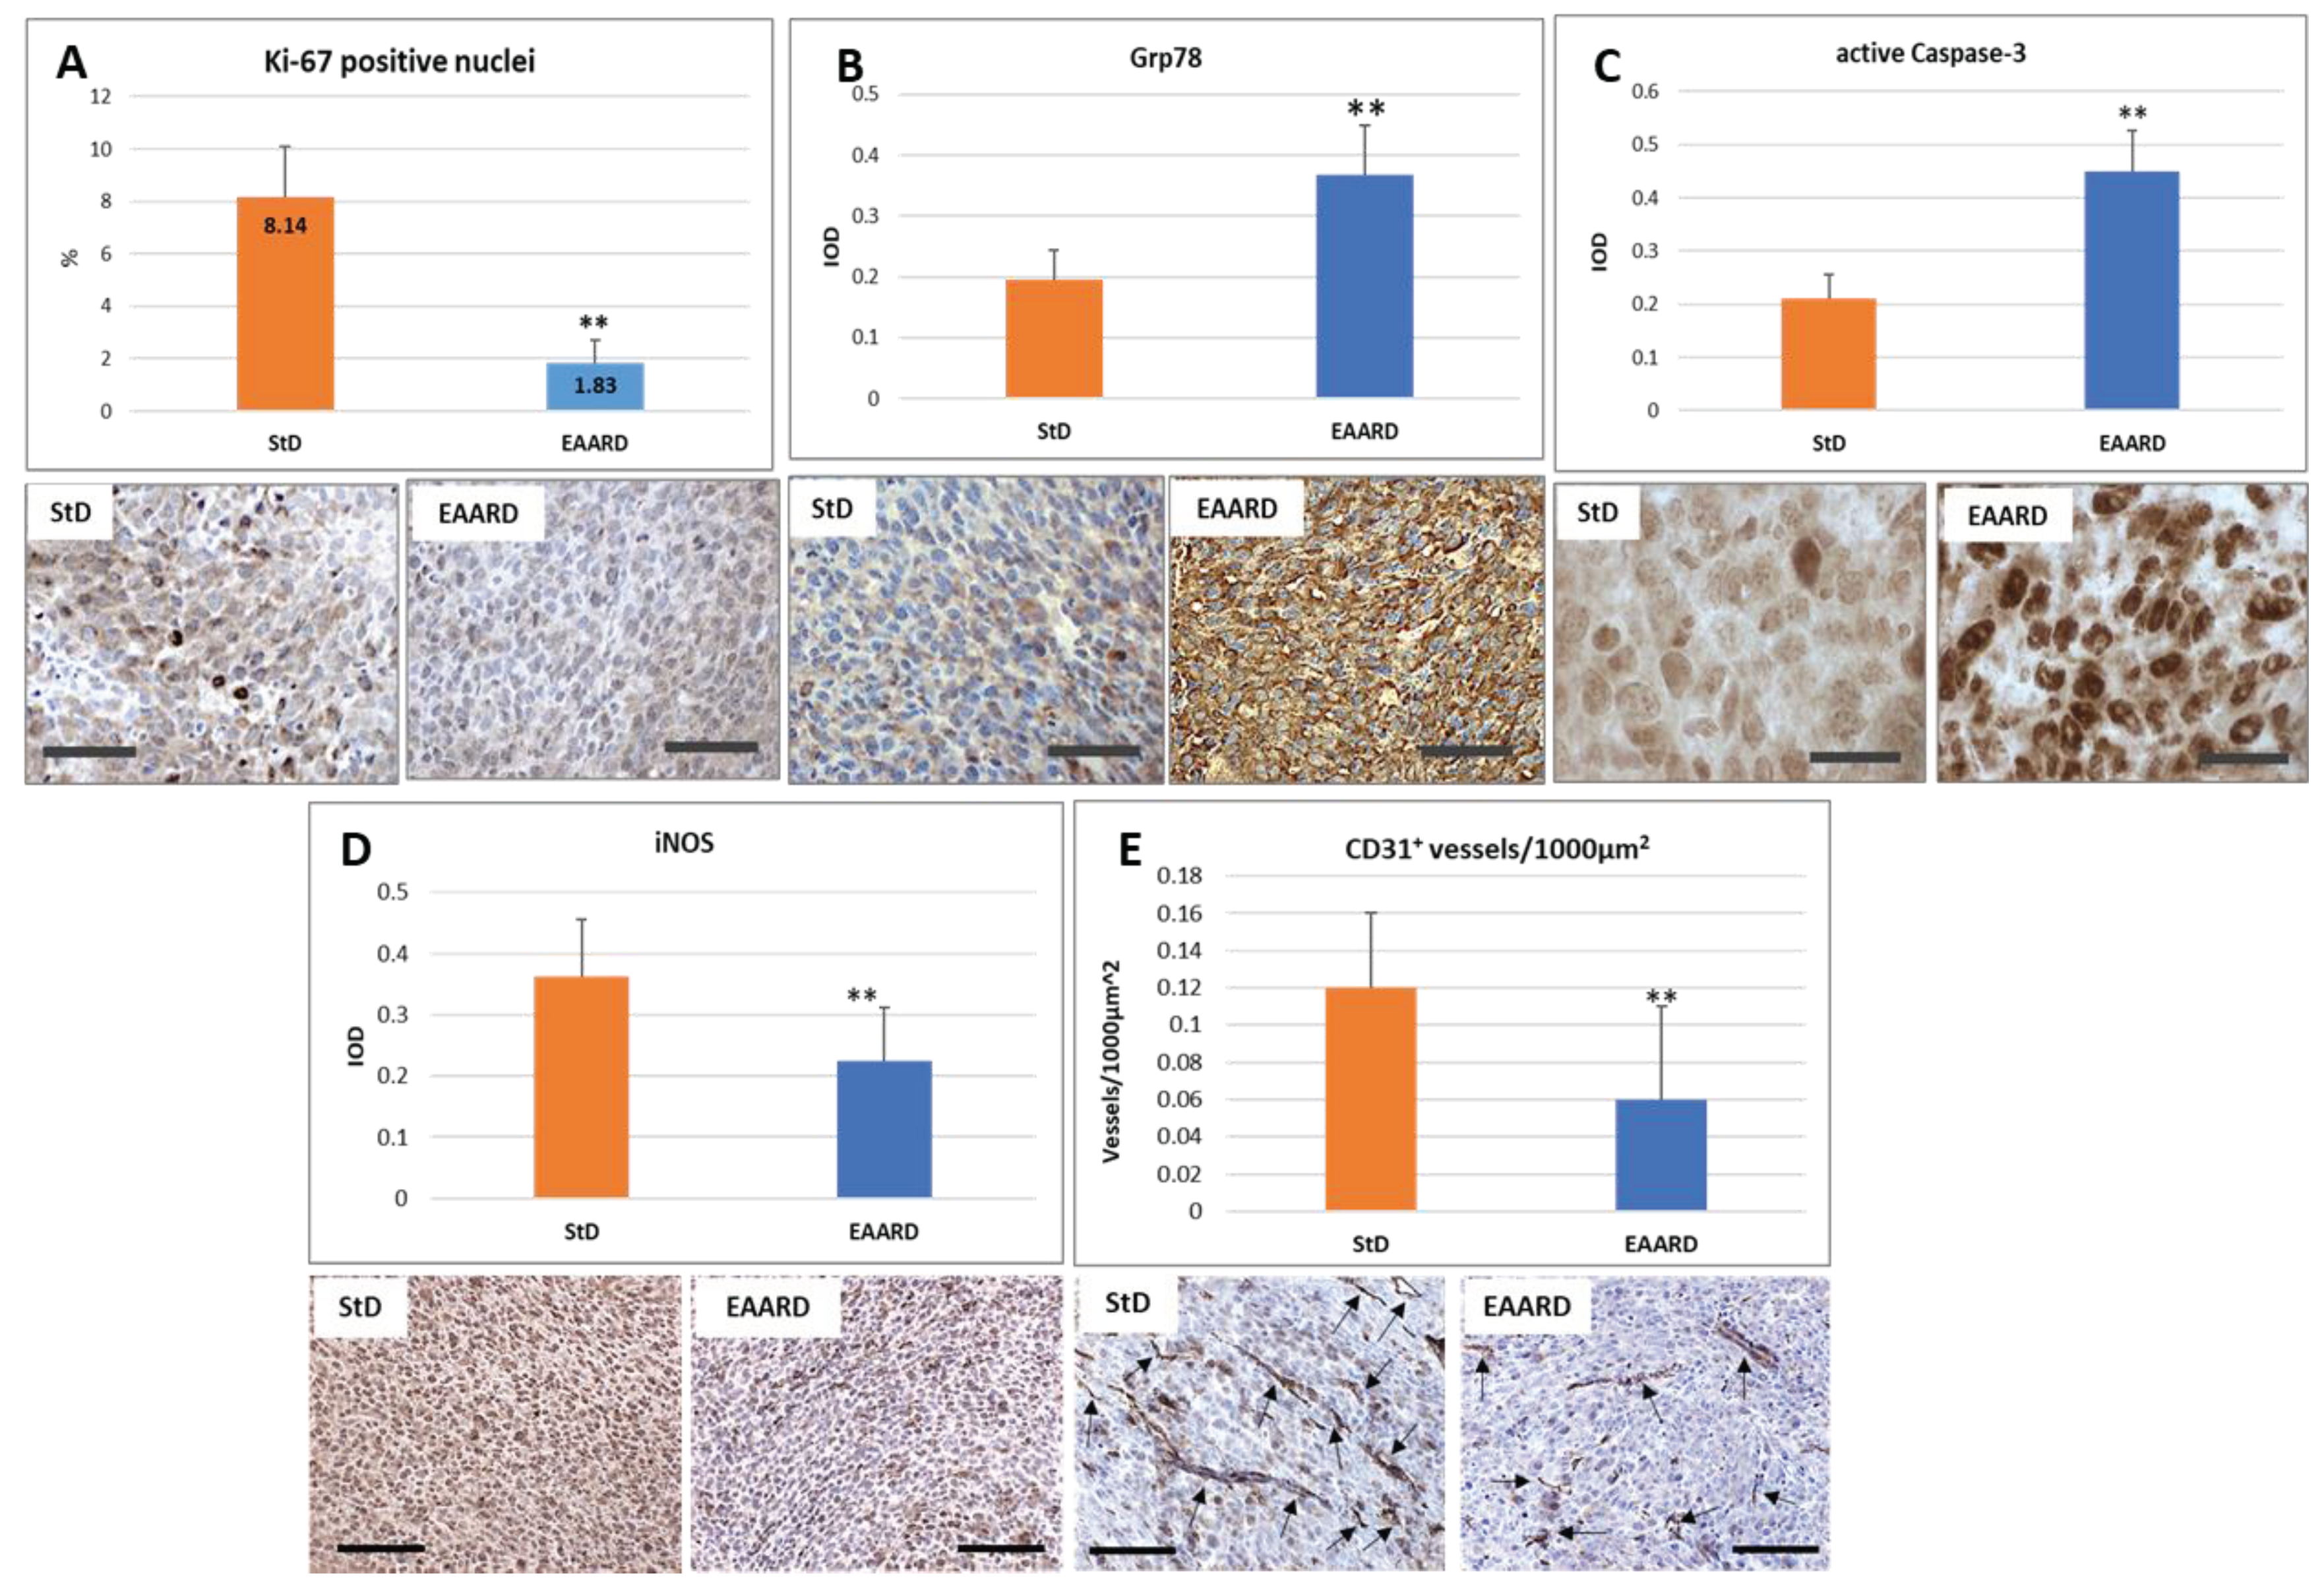
The magnitude of tumor cell proliferation was evaluated using anti-Ki-67, a recognized pathological proliferation marker in cancer cells. The nuclei were counted at 40x magnification. A total of 1524 nuclei were examined in StD-fed samples, and 1650 in the EAARD-fed group. Nuclei were considered Ki-67 positive only when they exhibited intense staining. Tumors from StD-fed mice demonstrated a significantly higher percentage (8.14±1.96) of intensely stained nuclei than those observed in EAARD-fed mice (1.83±0.88) (T=10.174; p-value <0.000) (Figure 6A).

3.4.2. Anti-GRP78 Staining

Given the key role of endoplasmic reticulum (ER) stress in abnormal protein folding, leading to cellular dysfunction and cell death, we examined changes in GRP78 staining. Tumor cells from StD-fed animals showed faint GRP78 staining. In contrast, in EAARD-fed animals, widespread and intense immunostaining was observed, particularly concentrated around the nuclei (T=8.341; p-value <0.000) (Figure 6B).

3.4.3. Anti-Caspase-3 Staining

To evaluate the induction of apoptosis, we examined the staining for activated caspase-3. Tumors from StD-fed animals only occasionally showed cells with intense immunostaining. In contrast, the majority of tumor cells in EAARD-fed animals showed intense optical density of immunostaining (T=15.029; p-value <0.000) (Figure 6C).

3.4.4. Anti-iNOS Staining

The presence of inflammation was evaluated by iNOS expression. Immunostaining was intensely expressed in all tumor cells from StD-fed animals. However, animals fed with EAARD showed significantly reduced staining, with only some cells intensely stained (T=4.743; p-value <0.000) (Figure 6D).

3.4.5. Anti-CD31 Vascular Staining

To evaluate the extent of tumor mass vascularization, we measured the number of positive anti-CD31 vessels per unit area (Vascular density = Vessels/1000 µm2). The vascular density was higher in tumors from StD-fed animals compared to EAARD-fed animals (T=3.692; p-value 0.001) (Figure 6E). The total tumor surface analyzed in each group was about 150,000 µm2.

3.5. Intraperitoneal (i.p.) CT26 Injection

To evaluate any variations in the impact of different diets on in vivo tumor cell inoculation methods, we also performed i.p. injections on two groups of 15 animals each, fed with StD and EAARD, respectively. The goal was to assess the total number and volume of tumors in the abdominal cavity, distinguishable even to the naked eye.
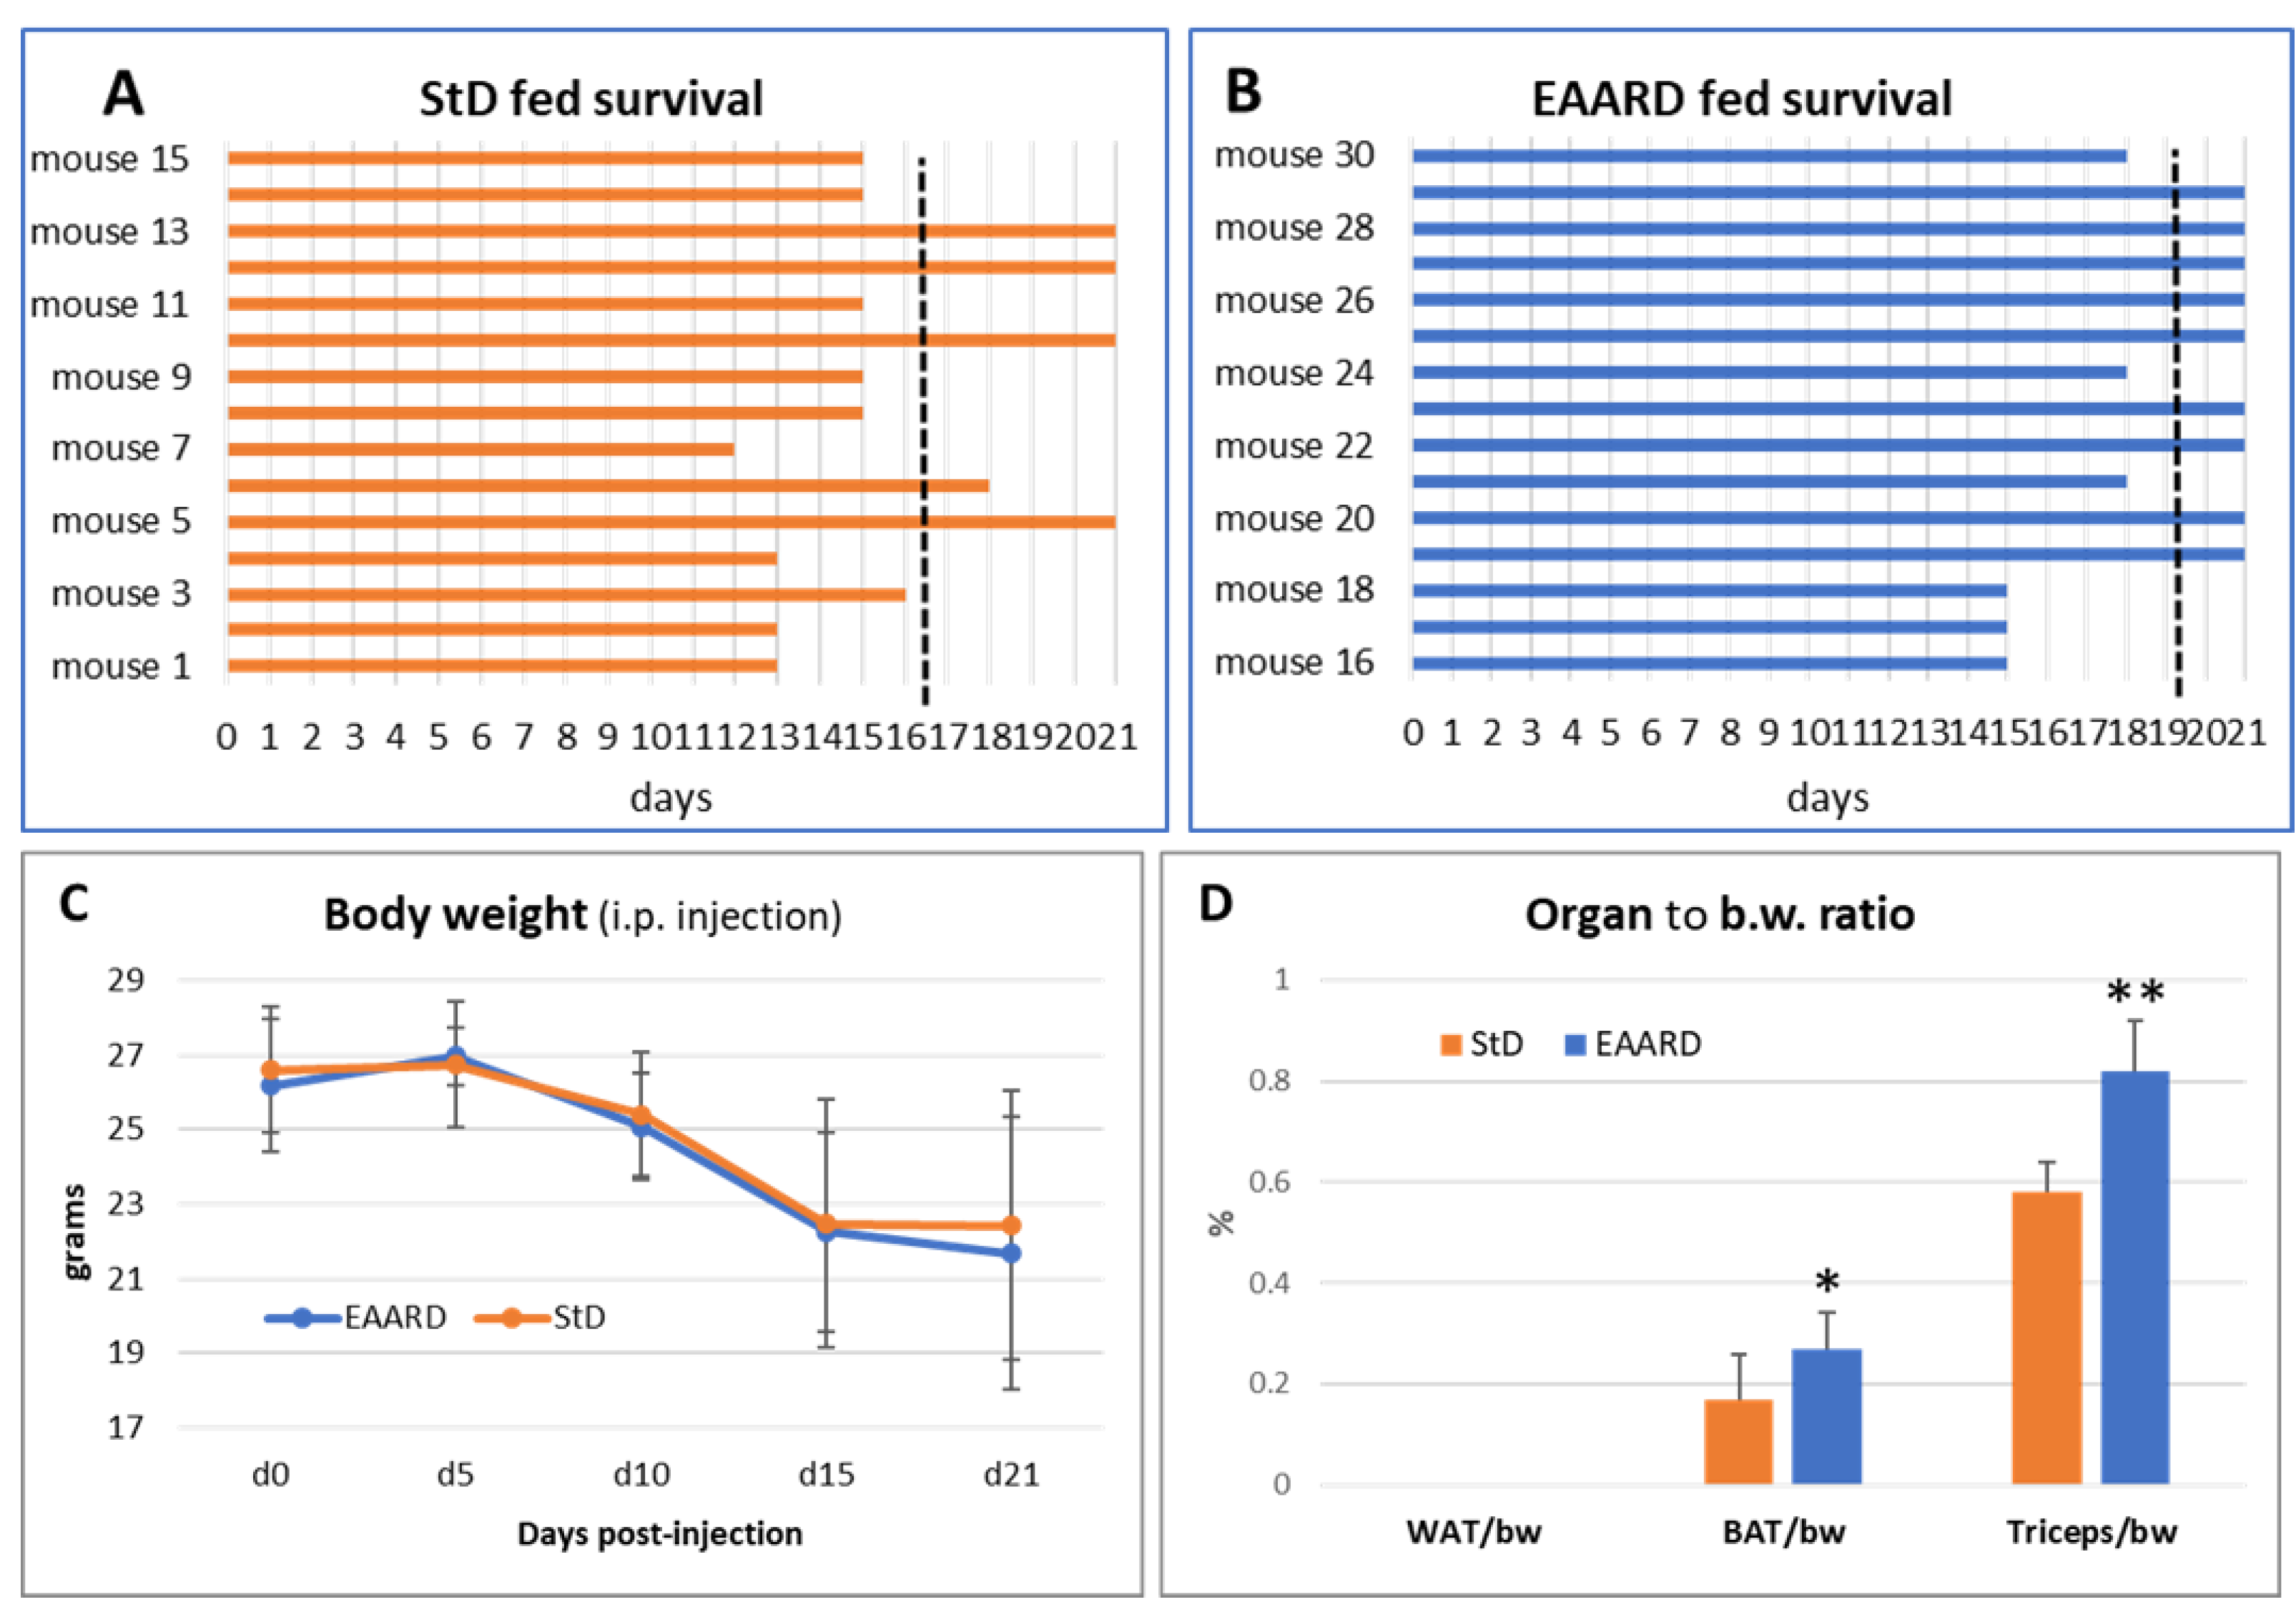
Notably, only 4 mice in the StD-fed group reached the predetermined endpoint of the trial (21 days). Three animals died on days 12, 13, and 15 post-inoculation, and the remaining 8 had to be euthanized prior to the endpoint due to severe signs of distress, resulting in an average survival of 16 days post-injection (Figure 7A).
Conversely, 9 mice in the EAARD-fed group reached the endpoint. One mouse died after 15 days, and 5 had to be euthanized before the end of the trial. The average survival in this group was 19.5 days post-injection (Figure 7B).
All i.p. injected mice began to lose body weight between 5 to 10 days post-injection in both groups, continuing until the end of the observation period (Figure 7C). In both groups, the retroperitoneal white adipose tissue (rpWAT) was absent. Moreover, the brown adipose tissue (BAT) was significantly reduced in StD-fed animals (T=2.909; p-value 0.01). Similarly, the triceps surae muscle mass was drastically reduced in the StD-fed animals. However, muscle mass was maintained in the EAARD-fed animals (T=6.825; p-value 0.000) (Figure 7D).

3.6. Mesenteric Tumors

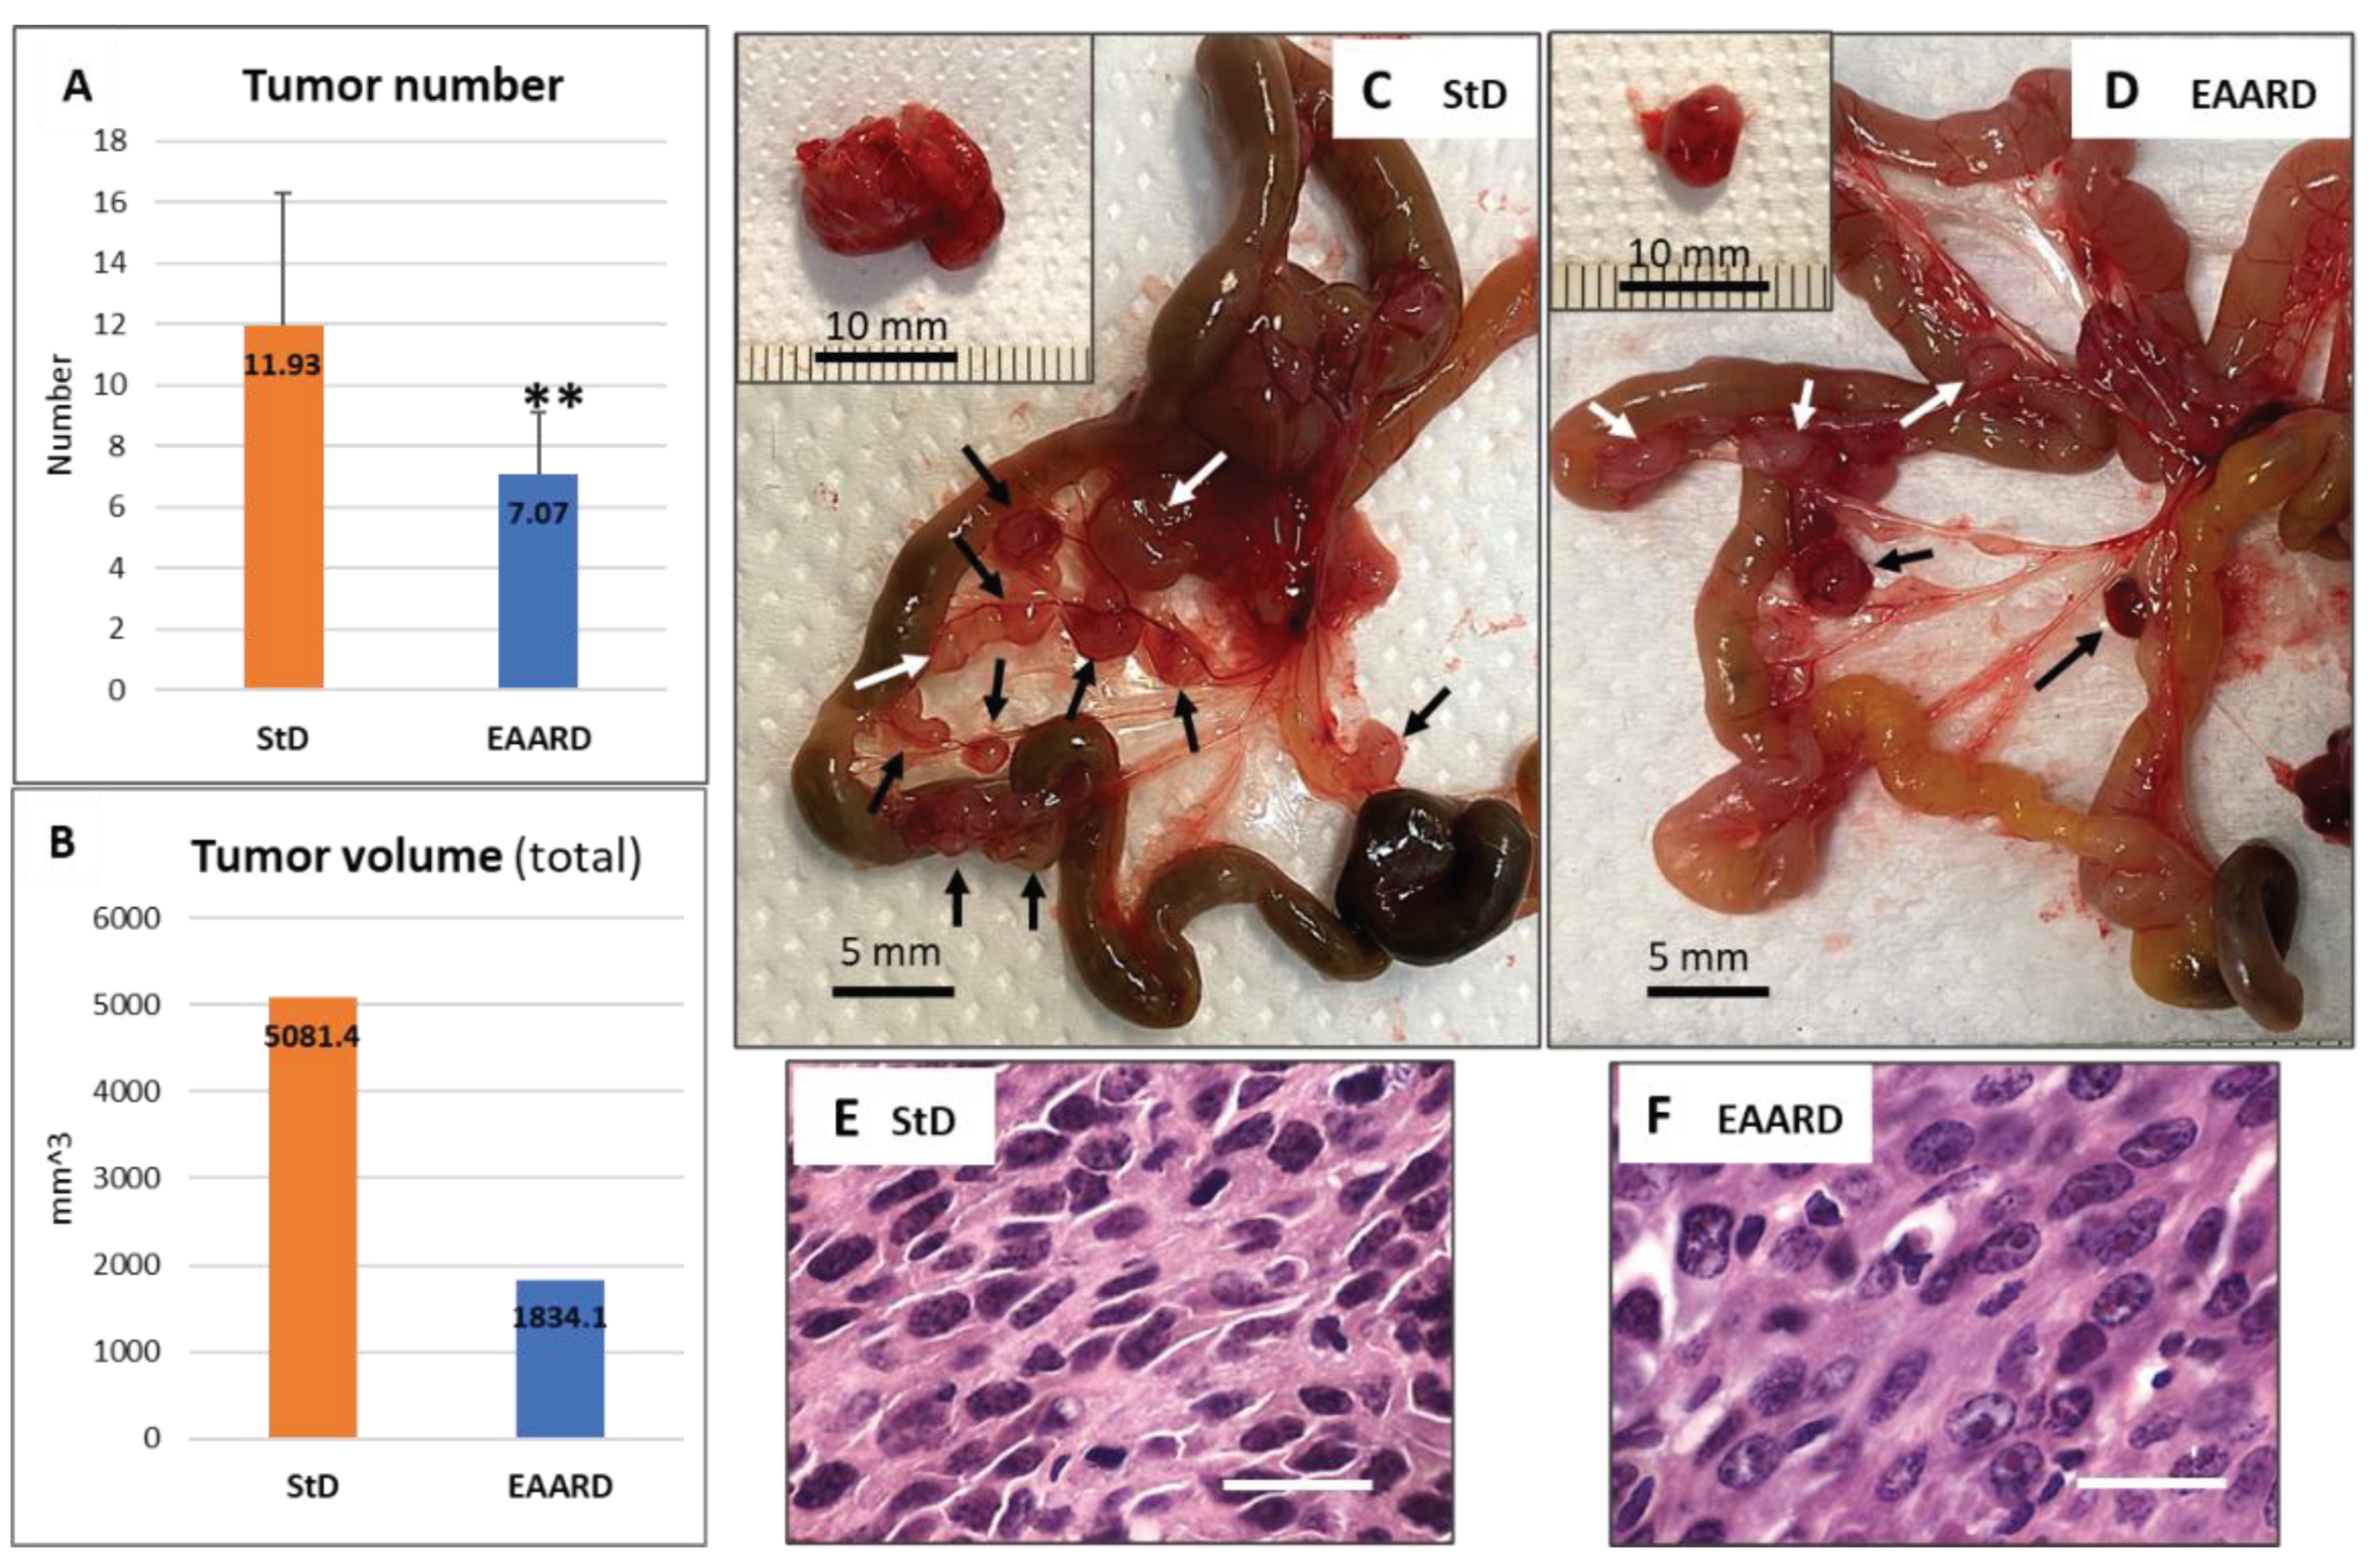
Both experimental groups exhibited mesenteric tumors of varying numbers and sizes (Figure 8A and B). StD-fed animals presented a higher number of tumors and/or swollen lymph nodes (11.93 ± 4.33), both adjacent to the small intestinal wall and at the mesentery's root. In contrast, EAARD-fed animals had a reduced number of tumors and mesenteric lymph nodes (7.07±2.05) (Figure 8C and D). In both groups, some mice also had large, single intraperitoneal tumors resting on the abdomen's posterior wall (insert in Figure 8C and D). These tumors were occasional and significantly smaller in EAARD-fed mice compared to those in StD-fed animals.
The total volume of tumors extracted from each group was significantly lower in EAARD-fed animals. The histopathological examination of E/H-stained sections revealed the same characteristics described for the two experimental groups in the subcutaneous (s.c.) inoculation (Figure 8E and F).

4. Discussion

The primary finding from this study's data is that increasing the ratio of essential amino acids to non-essential amino acids (EAA/NEAA >>1) significantly increases cell apoptosis and autophagy, therefore slowing down the growth of murine colon tumor cells (CT26) both in vitro and in vivo.
In vitro, tumor cells treated with EAA-mix exhibited a higher incidence of apoptosis. Similarly, in vivo experiments revealed high levels of nuclear chromatin thickening and fragmentation in tumors, along with strong immunostaining for activated caspase-3 in tumors from EAARD-fed mice. This aligns with previous studies showing that EAA-mix has a cell-dependent anti-proliferative and cytotoxic effect, activating autophagy and apoptotic pathways and leading to cancer cell death without affecting non-cancer cells [7,20,26].
Apoptosis, a regulated and programmed cell death process, is crucial in tumor therapy [27]. Caspases, a family of proteolytic enzymes, are fundamental components of the apoptotic pathway [28]. Many anticancer therapies, including cytotoxic drugs, radiotherapy, and immunotherapy, can induce tumor cell death by activating caspase-3. Therefore, caspase-3 activation is often used as a surrogate marker for cancer treatment efficacy [29]. However, colon cancer patients with low levels of activated caspase-3 have been reported to have longer disease-free survival times [30]. Recent studies have suggested that caspase-3 may promote tumor growth by creating a pro-angiogenic microenvironment [31]. Despite this, caspase-3 knockout cells show impaired growth when seeded at low densities [29]. A recent study on the antitumor properties of Cyclocaryapaliurus polysaccharide (CP) on CT26 mouse colon carcinoma cells showed that CP induced cell apoptosis through improving caspase-3 activity, suggesting CP as a potential natural therapeutic agent for colon cancer [32].
In accordance with these findings, we observed a strong induction of activated caspase-3 following EAARD in s.c. tumors, correlating with the slower tumor growth rate in both s.c. and i.p. tumors. This was also confirmed in vitro by the significant increase in mortality of tumor cells treated with EAA-mix. This evidence suggests that caspase-3 activation induced by EAA promotes tumor cell death in vivo. Indeed, a previous study indicated that EAA-mix increased branched-chain amino acid oxidation, decreased glycolysis, ATP levels, redox potential, and intracellular content of selective NEAA in cancer cells. This led to elevated EAA/NEAA ratios, NEAA deficiency, and consequently, NEAA starvation. The latter activated the stress pathway, mTOR inactivation, and apoptosis in cancer cells only [26].
In addition, our results showed that most tumor cells from StD-fed mice had numerous Ki-67 positive nuclei, but not EAARD fed mice. Ki-67 is a nuclear protein closely associated with cell proliferation [33,34], and is widely used to evaluate cell proliferation and aggressiveness in various malignant tumors [35]. High-expression of Ki-67 suggests active proliferation and mitosis of tumor significantly associated with its histological differentiation [36]. Although data on Ki-67 in relation to chemotherapy in human colon carcinoma are sometimes conflicting, several studies showed that high Ki-67 expression was related with poor overall survival and may be used to predict patient prognosis [37]. Considering the literature, the decrease in Ki-67 positive nuclei observed in mice fed with EAARD suggests an impairment of cell replication potential, further supported by the smaller volume reached by the tumors, both resulting from s.c. or i.p. injection, and by pro-apoptotic markers.
Interestingly, tumors of animals fed with EAARD contained reduced vascularization. Tumor development is determined not only by the mitotic activity of its cells, but also by the degree of development of the vascular bed and its capacity to fulfill all its functions [38]. Angiogenesis is the process by which new and abnormal intra-tumor blood vessels expand to accommodate tumor growth, metastasis and metabolism promoting the anaerobic and glycolytic conditions that characterize the tumor microenvironment [39,40]. For these reasons, the inhibition of tumor angiogenesis is the target of many anti-neoplastic therapies [41]. We observed an intricate subcutaneous vascular network involving the tumor in StD-fed animals, while the vascular network was reduced in EAARD-fed mice. This difference in vascularization is maintained within the tumor, as demonstrated by anti-CD31 staining. Therefore, the poor vascularization observed in tumors of animals fed with EAARD, together with the slowing of tumor growth and the low presence of proinflammatory iNOS, suggests that excess of free EAA promotes maintenance of a microenvironment highly unfavorable for tumor cell metabolism and proliferation.
Another noteworthy morphological observation is the modulation of collagen syntheses in tumors of animals fed with EAARD. Collagen can directly promote and feed tumor growth [42] Indeed, recent study shows that solid tumor growth depends upon collagen binding and uptake mediated by the TEM8/ANTXR1 cell surface protein in tumor-associated stroma. Tumor-associated stromal cells processed collagen into glutamine, which was then released and internalized by cancer cells. Under chronic nutrient starvation, a condition driven by the high metabolic demand of tumors, cancer cells exploited glutamine to survive [43]. To become malignant, epithelial cells need to acquire the ability to degrade ECM molecules [44,45]. Because collagen can be a metabolic source to fuel cancer growth, the very scarce presence of newly formed collagen in tumors from EAARD-fed mice, suggests that tumor-associated stromal cells would lack substrates to convert into glutamine as an energy supplementary source, and this consequently would starve tumor cell. This fault may be a further strong drive activating either autophagy (AUT) and, finally, apoptosis.
We showed that EAA-mix promotes the induction of AUT in CT26 tumor cells. AUT is an intracellular process that suppresses tumorigenesis by inhibiting cancer-cell survival and inducing cell death, but at opposite it may also promote cancer-cell survival, proliferation and tumor growth. Mechanistically, those processes are controlled by a series of proteins, and peculiar focus has been established on mTORcs and the cascades controlling both mTOR activation and inhibition of AUT [46].
The increase in AUT observed in our experiments suggests the “suicidal” attempt of tumor cells to counteract the excess of EAA to obtain the NEAA necessary to complete protein syntheses (which contain NEAA in large excess of EAA) and cell replication. Evidently these mechanisms are not sufficient, or excessively efficient, to protect cancer cells which therefore undergo apoptosis and death. Indeed, ER-stress-associated AUT (termed ER-phagy) is essential for maintaining stabilized ER function via the degradation of aberrant unfolded protein and/or surplus components of the ER [47]. As we have already hypothesized [2], syntheses of all structures necessary to duplicate, both functional proteins or membrane lipids, require an enormous ATP to AMP consumption, and since AMP activates AMP kinase and this in turn further pushes AUT to perform, the sums of all those metabolic drives may rise limits of AUT towards activation of apoptosis.
We also observed significant increases in ER-stress, as evidenced by the increased expression of the 78-kDa glucose-regulated protein (GRP78) in tumors from EAARD-fed mice. GRP78, an ER chaperone, plays a central role in maintaining protein homeostasis across all cell types. GRP78, a member of the heat-shock protein family, is primarily located in the ER where it plays a key role in protein folding. Its expression is upregulated during the unfolded protein response (UPR), which is triggered in response to ER-stress [48]. The secretion and translocation of GRP78 from the ER to the plasma membrane are associated with several pathological conditions, including autoimmune diseases [49], and tumors cells [50]. In these contexts, GRP78 plays a significant role in proliferation, angiogenesis, metastasis, and resistance to anticancer drugs [51]. In addition, it has been demonstrated that drug-induced expression of GRP78 prevents apoptosis and production of intracellular ROS, enhancing survival and proliferation of drug-resistant colon cancer cells via regulation of apoptosis-, survival-, and cell cycle-associated signaling pathways [52]. Conversely, surface expression of GRP78 is an early response to inflammation, and consequently, over 90% of early apoptotic pancreatic cells express GRP78 on their cell membrane. This suggests that surface GRP78 acts as a pro-apoptotic receptor in pancreatic beta cells, with the underlying mechanism mediated by ER-stress [53]. This difference in physiological response may depend on whether surface GRP78 is engaged at its N- or C-terminus. In cancer cells, ligation of surface GRP78 with blocking antibodies against the N-terminal domain induces proliferation [50], whereas ligation with blocking antibodies against the C-terminal domain promotes apoptosis [54]. Accumulating evidence suggests that ER-stress induced cellular dysfunction and cell death are major contributors to many diseases, making modulators of ER-stress pathways potentially attractive targets for therapeutic discovery [55].
Our findings indicate that the EAARD diet increased GRP78 and activated caspase-3, while reducing iNOS immunostaining in cancer cells. This suggests the presence of inflammation, deeply altered protein homeostasis inducing ER-stress, and activation of apoptosis, which in turn impairs cell proliferation. These results are in line with those of Ragni et al., which showed that the specific EAARD diet promoted ER-stress and inhibited mTOR activity, thereby reducing tumor growth [26].
However, it is well known that EAA can enhance mTORC1 activity, promoting cell proliferation [9,14]. mTORC1 is activated by the availability of growth factors (mitogens, i.e., growth factors, extracellular signals capable of inducing cell duplication and proliferation, such as insulin), cellular energy (ATP), and nutrients, particularly some amino acids (AA). These stimuli trigger the synthesis of essential building blocks for the organism, such as proteins, lipids, and nucleotides, activating metabolic pathways that drive cellular and organismal growth [56]. Altered regulation of mTORC1 activity is closely associated with various diseases, including cancer, diabetes, and neurodegenerative disorders [57,58].
Considering these data, one might think that a large amount of EAA could also stimulate tumor cell proliferation. However, this is not necessarily the case. Only two experimental studies have reported that long-term leucine supplementation, a potent inducer of mTORC1, promoted the development of bladder cancer in rats [59,60]. Currently, there is insufficient evidence to establish a cause-effect relationship between leucine and cancer growth [26]. In fact, recent experimental studies suggest the opposite.
Studies have shown that a diet enriched in leucine (3%) can steer tumor metabolism towards a less glycolytic phenotype, resulting in a reduction of the Warburg effect. This is associated with decreased tumor aggressiveness and fewer metastatic sites [61]. Moreover, a recent literature review indicates that leucine, by activating mTORC1 and increasing protein synthesis, can decrease protein degradation, thereby mitigating the symptoms of cancer cachexia [62]. Furthermore, recent in vivo studies on tumor cells demonstrated that after treatment with a complete mixture of EAA, the intracellular concentration of glutamate, glycine, aspartate, and alanine (all of which are NEAA) decreased, while that of EAA increased. This situation mimics a response to hunger, particularly a deficiency in glutamate, which activates the catabolism of BCAA at the mitochondrial level, inhibiting glycolysis (Warburg effect) in favor of the Krebs cycle. The decrease in intracellular NEAA levels, being a significant percentage of all amino acids needed for protein synthesis, ultimately activates ATF4, leading to reduced mTORC1 activity. The result is reduced tumor growth due to increased ER-stress and reduced mTORC1 activity, which in turn supports autophagy. All these changes would eventually lead to increased apoptosis and cell death. Non-tumor cells did not suffer these detrimental effects; indeed, their metabolism was actively supported by the EAA-mix [26]. Overall, these findings suggest that high levels of amino acids alone are not sufficient to increase tumor biomass. In order to serve as a metabolic fuel for cell proliferation, their supply must be linked to an unchallenged mTORC1 activation, as supported by any naturally occurring AA composition.
Cancer cells are highly dependent on an excess of NEAA for development, survival, and multiplication [18]. This is also evident in our in vitro data in which tumor cells proliferated normally with administration of NEAA alone. Serine, like glutamine and glycine, is a NEAA that tumors particularly crave and probably depend on to sustain multiple anabolic processes that support growth and proliferation [63]. Some cancer cells upregulate de novo serine synthesis [64,65,66], while many others depend on exogenous serine for optimal growth [15,67,68]. In fact, it has been proven that dietary restriction of serine and glycine can reduce tumor growth in xenograft and allograft models [15,69]. Additionally, in genetically engineered mouse models of lymphoma and intestinal tumors, a serine and glycine-free diet increased survival compared to a control diet or normal diet that contains whole protein as a source of AA [17].
However, as previously noted, we believe that by administering diets without serine and glycine, and not substituting these amino acids with other NEEA, the authors did not consider that the EAA/NEAA ratio changes in favor of EAA. Therefore, it could be possible that the observed increase in survival does not depend on NEAA deficiency, but on the proportional increase in EAA [18]. Interestingly, the EAA-mix used in our experiments contained serine, but despite this, we observed significant cancer cell death in vitro and a substantial slowdown of tumor progression in vivo, both subcutaneously and intraperitoneally.
Serine is commonly found in food proteins and can be easily synthesized from gluconeogenic AA. It can also be derived from glycine, but this reaction consumes NADH and depletes a specific methyl group of folates through this metabolic pathway. Notably, folate fortification of food has significantly reduced the incidence of colon cancer in the USA, according to a long-term epidemiological survey [70]. Our EAA-mix contained serine to achieve a 15% ratio of NEAA for three main reasons: i) it is the quickest metabolically available amino acid for energy production and transamination, generating one pyruvate molecule; ii) it plays a crucial role in maintaining folates charged with methyl groups [71], and, iii) in combination with EAA, it may have an anti-cancer effect as an allosteric activator of pyruvate kinase by forming a tetramer (isoform PKM2) [72]. This could potentially enhance the drive of glucose to full oxidation in mitochondria, allowing metabolic production of sufficient reactive oxygen species (ROS) to further activate the autophagy pathway [20,73].
The results from this study indicate that an excess of EAA, leading to an increased EAA/NEAA ratio, can significantly and negatively influence colon cancer cell survival, exhibiting remarkable anti-proliferative properties. In fact, if the EAA/NEAA ratio in the tumor cell is tilted in favor of EAA, the consumption of large quantities of ATP would be activated for protein synthesis, leading to an increase in ADP and AMP. The resulting low energy levels, due to the consumption of ATP for constructing the thousands of peptide bonds necessary for protein synthesis, activate AMPK, which in turn inhibits mTORC1 and activates autophagy, providing substrates to support new ATP production and a decrease in NEAA availability. These changes create a cycle that inhibits proliferation and induces apoptosis [2,18].
From a clinical perspective, these results challenge the common belief and suggest that the continuous administration of EAA in sufficient excess may represent a strategy to create an unfavorable metabolic environment for tumors, selectively impairing cancer metabolism and subsequently reducing cell growth, while maintaining muscle mass. Therefore, we may summarize our findings with the following statement: the administration of a special mix of EAA allows the patient to be nourished and the tumor to be starved.

4.1. Study Limitation

A potential limitation of this study is the exclusive use of immunohistochemistry (IHC) to support our in vivo results. However, as demonstrated in previous studies [74,75], this choice was made due to the heterogeneous cell population within tumors and the varying states of the cell cycle and differentiation among cancer cells. Consequently, histopathological changes, precise location of markers, and evaluation of their staining intensity can only be accurately determined with IHC. In contrast, molecular analysis, while sensitive in detecting the presence of proteins, requires immediate freezing and homogenization of the sample, and does not take into account the specificities of the protein’s location, tissue morphology, and organization. This is a major limitation in the exclusive use of molecular analysis, which we believe is comparable, if not superior, to IHC. Therefore, we believe that our data, even if based on IHC, are worth considering and form the basis for further studies. These data clearly highlight a slowdown in tumor progression due to the EAA-rich diet.

5. Conclusions

These data strongly suggest that dietary supplementation with an adequate amount of all free EAA is safe and promotes the slowdown of colon cancer cell proliferation in a mouse model. This effect could potentially be an effective integrated therapy to complement and support conventional therapies in cancer patients.

Author Contributions

Conceptualization, G.C., C.R. and F.S.D.; methodology, G.C., C.R., A.F., S.C.; software, G.C., C.R., S.C., L.G.; validation, A.F., E.P. and F.S.D.; formal analysis, G.C., C.R., S.C.; investigation, G.C., C.R., S.C., L.G.; resources, G.C.; data curation, G.C., S.C.; X.X.; writing—original draft preparation, G.C., F.S.D., A.F. and E.P.; writing—review and editing, E.P., G.C., C.R., T.S., A.F.; visualization, X.X.; supervision, F.S.D.; project administration, G.C.; funding acquisition, G.C. All authors have read and agreed to the published version of the manuscript.

Funding

This research was funded by grant provided by NAMED S.p.a. (Milan, Italy) and by grants provided by Dolomite-Franchi S.p.a. (Marone, Brescia, Italy) to G.C.

Institutional Review Board Statement

The animal study protocol was approved and conducted in accordance with laws of the Italian Ministry of Health and complied with the “The National Animal Protection Guidelines”. The Ethical Committee for animal experiments of the University of Brescia (OPBA) and the Italian Ministry of Health had approved the procedures (decree n. 539/2021-PR).

Informed Consent Statement

not applicable.

Data Availability Statement

The data are available on request from the corresponding author.

Acknowledgments

CT26 cell was a kind gift from Prof. Paola Costelli and Prof. Fabio Penna (University of Turin, Italy). We thank NAMED S.p.a. (Milan, Italy), and Dolomite-Franchi S.p.a. (Marone, Brescia, Italy) for supporting this research.

Conflicts of Interest

The funders had no role in the design of the study, in the collection, analyses, or interpretation of data, in the writing of the manuscript, or in the decision to publish the results. The authors declare that the research was conducted in the absence of any commercial or financial relationships that could be construed as a potential conflict of interest.

References

  1. Siegel, R.L.; Miller, K.D.; Fuchs, H.E.; Jemal, A. Cancer statistics, 2022. CA Cancer J Clin 2022, 72, 7–33. [Google Scholar] [CrossRef] [PubMed]
  2. Dioguardi, F.S.; Chen-Scarabelli, C.; Pasini, E.; Corsetti, G.; Scarabelli, T.M. Diet, muscle protein synthesis and autophagy relationships in cancer. An attempt to understand where are we going, and why. Adv in Nutri and Food Sci, 2022; 238. [Google Scholar]
  3. Saxton, R.A.; Sabatini, D.M. MTOR signaling in growth, metabolism and disease. Cell 2017, 168, 960–976. [Google Scholar] [CrossRef] [PubMed]
  4. Ragni, M.; Fornelli, C.; Nisoli, E.; Penna, F. Amino acids in cancer and cachexia: an integrated view. Cancers 2022, 14, 5691. [Google Scholar] [CrossRef] [PubMed]
  5. Corsetti, G.; Pasini, E.; D’Antona, G.; Nisoli, E.; Flati, V.; Assanelli, D.; Dioguardi, F.D.; Bianchi, R. Morphometric changes induced by amino acid supplementation in skeletal and cardiac muscles of old mice. Am J Cardiol 2008, 101, 26E–34E. [Google Scholar] [CrossRef] [PubMed]
  6. Corsetti, G.; Stacchiotti, A.; Tedesco, L.; D'Antona, G.; Pasini, E.; Dioguardi, F.S.; Nisoli, E.; Rezzani, R. Essential amino acid supplementation decreases liver damage induced by chronic ethanol consumption in rats. Int J ImmunopatholPharmacol 2011, 24, 611–619. [Google Scholar] [CrossRef] [PubMed]
  7. Corsetti, G.; Flati, V.; Sanità, P.; Pasini, E.; Dioguardi, F.S. Protect and counter-attack: nutritional supplementation with essential amino acid ratios reduces doxorubicin-induced cardiotoxicity in vivo and promote cancer cell death in vitro. J Cytol Histol 2015, 6, 1. [Google Scholar] [CrossRef]
  8. Corsetti, G.; Romano, C.; Pasini, E.; Scarabelli, T.; Chen-Scarabelli, C.; Dioguardi, F.S. Essential amino acids-rich diet increases cardiomyocytes protection in Doxorubicin-treated mice. Nutrients 2023, 15, 2287. [Google Scholar] [CrossRef] [PubMed]
  9. D’Antona, G.; Ragni, M.; Cardile, A.; Tedesco, L.; Dossena, M.; Bruttini, F.; Caliaro, F.; Corsetti, G.; Bottinelli, R.; Carruba, M.O.; et al. Branched-chain amino acid supplementation promotes survival and supports cardiac and skeletal muscle mitochondrial biogenesis in middle-aged mice. Cell Metab 2010, 12, 362–372. [Google Scholar] [CrossRef] [PubMed]
  10. D'Antona, G.; Tedesco, L.; Ruocco, C.; Corsetti, G.; Ragni, M.; Fossati, A.; Saba, E.; Fenaroli, F.; Montinaro, M.; Carruba, M. O. , et al. A peculiar formula of essential amino acids prevents rosuvastatin myopathy in mice. Antioxid Redox Signal 2016, 25, 595–608. [Google Scholar] [CrossRef]
  11. Buondonno, I.; Sassi, F.; Carignano, G.; Dutto, F.; Ferreri, C.; Pili, F.G.; Massaia, M.; Nisoli, E.; Ruocco, C.; Porrino, P.; et al. From mitochondria to healthy aging: The role of branched-chain amino acids treatment: MATeR a randomized study. ClinNutr 2020, 39, 2080–2091. [Google Scholar] [CrossRef]
  12. Tedesco, L.; Corsetti, G.; Ruocco, C.; Ragni, M.; Rossi, F.; Carruba, M.O.; Valerio, A.; Nisoli, E. A specific amino acid formula preventsalcoholicliverdisease in rodents. Am J PhysiolGastrointest Liver Physiol 2018, 314, G566–G582. [Google Scholar] [CrossRef] [PubMed]
  13. Tedesco, L.; Rossi, F.; Ragni, M.; Ruocco, C.; Brunetti, D; Carruba, M. O.; Torrente, Y.; Valerio, A.; Nisoli, E. A special amino-acid formula tailored to boosting cell respiration prevents mitochondrial dysfunction and oxidative stress caused by doxorubicin in mouse cardiomyocytes. Nutrients, 2020, 12, 282. [Google Scholar] [CrossRef] [PubMed]
  14. Flati, V.; Corsetti, G.; Pasini, E.; Rufo, A.; Romano, C.; Dioguardi, F.S. Nutrition, nitrogen requirements, exercise and chemotherapy-induced toxicity in cancer patients. A puzzle of contrasting truths? Anticancer Agents Med Chem 2016, 16, 89–100. [Google Scholar] [CrossRef]
  15. Maddocks, O.D.; Berkers, C.R.; Mason, S.M.; Zheng, L.; Blyth, K.; Gottlieb, E.; Vousden, K.H. Serine starvation induces stress and p53-dependent metabolic remodelling in cancer cells. Nature 2013, 493, 542–546. [Google Scholar] [CrossRef] [PubMed]
  16. Newman, A.C.; Maddocks, O.D.K. One-carbon metabolism in cancer. Br J Cancer 2017, 116, 1499–1504. [Google Scholar] [CrossRef] [PubMed]
  17. Maddocks, O.D.K.; Athineos, D.; Cheung, E.C.; Lee, P.; Zhang, T.; van den Broek, N.J.F.; Mackay, G.M.; Labuschagne, C.F.; Gay, D.; Kruiswijk, F.; et al. Corrigendum: Modulating the therapeutic response of tumours to dietary serine and glycine starvation. Nature 2017, 548, 122, Erratum for: Nature. 2017, 544(7650): 372-376. [Google Scholar] [CrossRef] [PubMed]
  18. Dioguardi, F.S.; Flati, V.; Corsetti, G.; Pasini, E.; Romano, C. Is the response of tumours dependent on the dietary input of some amino acids or ratios among essential and non-essential amino acids? All that glitters is not gold. Int J Mol Sci 2018, 19, 3631. [Google Scholar] [CrossRef]
  19. Romano, C.; Corsetti, G.; Flati, V.; Pasini, E.; Picca, A.; Calvani, R.; Marzetti, E.; Dioguardi, F.S. Influence of diets with varying essential/nonessential amino acid ratios on mouse lifespan. Nutrients 2019, 11, 1367. [Google Scholar] [CrossRef]
  20. Bonfili, L.; Cecarini, V.; Cuccioloni, M.; Angeletti, M.; Flati, V.; Corsetti, G.; Pasini, E.; Dioguardi, F.S.; Eleuteri, A.M. Essential amino acid mixtures drive cancer cells to apoptosis through proteasome inhibition and autophagy activation. FEBS J 2017, 284, 1726–1737. [Google Scholar] [CrossRef]
  21. Elmore, S.A.; Dixon, D.; Hailey, J.R.; Harada, T.; Herbert, R.A.; Maronpot, R.R.; Nolte, T.; Rehg, J.E.; Rittinghausen, S.; Rosol, T.J.; et al. Recommendations from the INHAND Apoptosis/Necrosis Working Group. Toxicol Pathol 2016, 44, 173–188. [Google Scholar] [CrossRef]
  22. Chan, J.K. The wonderful colors of the hematoxylin-eosin stain in diagnostic surgical pathology. Int J Surg Pathol 2014, 22, 12–32. [Google Scholar] [CrossRef] [PubMed]
  23. Dayan, D.; Hiss, Y.; Hirshberg, A.; Bubis, J.J.; Wolman, M. Are the polarization colors of picrosirius red-stained collagen determined only by the diameter of the fibers? Histochemistry 1989, 93, 27–29. [Google Scholar] [CrossRef] [PubMed]
  24. Williams, I.F.; McCullagh, K.G.; Silver, I.A. The distribution of types I and III collagen and fibronectin in the healing equine tendon. Connect Tissue Res 1984, 12, 211–227. [Google Scholar] [CrossRef] [PubMed]
  25. Koren, R.; Yaniv, E.; Kristt, D.; Shvero, J.; Veltman, V.; Grushko, I.; Feinmesser, R.; Sulkes, J.; Gal, R. Capsular collagen staining of follicular thyroid neoplasm by picrosirius red: Role in differential diagnosis. Acta Histochem 2001, 103, 151–157. [Google Scholar] [CrossRef] [PubMed]
  26. Ragni, M.; Ruocco, C.; Tedesco, L.; Carruba, M.O.; Valerio, A.; Nisoli, E. An amino acid-defined diet impairs tumour growth in mice by promoting endoplasmic reticulum stress and mTOR inhibition. Mol Metab 2022, 60, 101478. [Google Scholar] [CrossRef] [PubMed]
  27. Jin, M.; Zhao, K.; Huang, Q.; Shang, P. Structural features and biological activities of the polysaccharides from Astragalus membranaceus. Int J Biol Macromol 2014, 64, 257–266. [Google Scholar] [CrossRef] [PubMed]
  28. Noor, Z.M.; Ahmad, H.; Ain, Q.; Anjum, T.; Malik, Z.S.; Hussain, Z.; Naseer, F. Caspase 3 and its role in the pathogenesis of cancer. Clin Oncol 2022, 7, 1941. [Google Scholar]
  29. Zhou, M.; Liu, X.; Li, Z.; Huang, Q.; Li, F.; Li, CY. Caspase-3 regulates the migration, invasion and metastasis of colon cancer cells. Int J Cancer 2018, 143, 921–930. [Google Scholar] [CrossRef] [PubMed]
  30. Flanagan, L.; Meyer, M.; Fay, J.; Curry, S.; Bacon, O.; Duessmann, H. , John, K., Boland, K.C.; McNamara, D.A.; Kay, E.; et al. Low levels of Caspase-3 predict favorable response to 5FU-based chemotherapy in advanced colorectal cancer: Caspase-3 inhibition as a therapeutic approach. Cell Death Dis 2016, 7, e2087. [Google Scholar] [CrossRef]
  31. Feng, X.; Yu, Y.; He, S.; Cheng, J.; Gong, Y.; Zhang, Z. , Yang, X.; Xu, B.; Liu, X.; Li, C.Y.; et al. Dying glioma cells establish a proangiogenic microenvironment through a caspase 3 dependent mechanism. Cancer Lett 2017, 385, 12–20. [Google Scholar] [CrossRef]
  32. Xie, L.; Shen, M.; Huang, R.; Liu, X.; Yu, Y.; Lu, H.; Xie, J. Apoptosis of colon cancer CT-26 cells induced polysaccharide from Cyclocaryapaliurus and its phosphorylated derivative via intrinsic mitochondrial passway. Food Sci Hum Well 2023, 12, 1545–1556. [Google Scholar] [CrossRef]
  33. Scholzen, T.; Gerdes, J. The Ki-67 protein: from the known and the unknown. J Cell Physiol 2000, 182, 311–322. [Google Scholar] [CrossRef]
  34. Mrouj, K.; Andrés-Sánchez, N.; Dubra, G.; Singh, P.; Sobecki, M.; Chahar, D.; Al Ghoul, E.; Aznar, A.B.; Prieto, S.; Pirot, N.; et al. Ki-67 regulates global gene expression and promotes sequential stages of carcinogenesis. PNAS 2021, 118, e2026507118. [Google Scholar] [CrossRef] [PubMed]
  35. Li, L.T.; Jiang, G.; Chen, Q.; Zheng, J.N. Ki67 is a promising molecular target in the diagnosis of cancer (review). Mol Med Rep 2015, 11, 1566–1572. [Google Scholar] [CrossRef]
  36. Liu, Q.; Ran, D.; Wang, L.; Feng, J.; Deng, W.; Mei, D.; Peng, Y.; Du, C. Association between Ki67 expression and therapeutic outcome in colon cancer. Oncol Lett 2023, 25, 272. [Google Scholar] [CrossRef]
  37. Luo, Z.W.; Zhu, M.G.; Zhang, Z.Q.; Ye, F.J.; Huang, W.H.; Luo, X.Z. Increased expression of Ki-67 is a poor prognostic marker for colorectal cancer patients: a meta-analysis. BMC Cancer 2019, 19, 123. [Google Scholar] [CrossRef]
  38. Kuznetsov, S.S.; Snopova, L.B.; Karabut, М.М.; Sirotkina, М.А.; Buyanova, N.L.; Kalganova, Т.I.; Elagin, V.V.; Senina-Volzhskaya, I.V.; Barbashova, L.N.; Shumilova, A.V.; et al. Features of morphological changes in experimental CT-26 tumors growth. Sovremennyetehnologii v medicine 2015, 7, 32. [Google Scholar] [CrossRef]
  39. Hashizume, H.; Baluk, P.; Morikawa, S.; McLean, J.W. , Thurston, G., Roberge, S.; Jain, R.K.; McDonald, D.M. Openings between defective endothelial cells explain tumor vessel leakiness. Am J Pathol 2000, 156, 1363–1380. [Google Scholar] [CrossRef]
  40. Trédan, O.; Galmarini, C.M.; Patel, K.; Tannock, I.F. Drug resistance and the solid tumor microenvironment. J Natl Cancer Inst 2007, 99, 1441–1454. [Google Scholar] [CrossRef]
  41. Lopes-Coelho, F.; Martins, F.; Pereira, S.A.; Serpa, J. anti-angiogenic therapy: current challenges and future perspectives. Int J Mol Sci 2021, 22, 3765. [Google Scholar] [CrossRef]
  42. Fang, M.; Yuan, J.; Peng, C.; Li, Y. Collagen as a double-edged sword in tumor progression. Tumour Biol 2014, 35, 2871–2882. [Google Scholar] [CrossRef] [PubMed]
  43. Hsu, K.S.; Dunleavey, J.M.; Szot, C.; Yang, L.; Hilton, M.B.; Morris, K.; Seaman, S.; Feng, Y.; Lutz, E.M.; Koogle, R.; et al. Cancer cell survival depends on collagen uptake into tumor-associated stroma. Nat Commun 2022, 13, 7078. [Google Scholar] [CrossRef] [PubMed]
  44. Hotary, K.B; Allen, E.D.; Brooks, P.C.; Datta, N.S. , Long, M.W., Weiss, S.J. Membrane type I matrix metalloproteinase usurps tumor growth control imposed by the three-dimensional extracellular matrix. Cell 2003, 114, 33–45. [Google Scholar] [CrossRef] [PubMed]
  45. Bhattacharjee, S.; Hamberger, F.; Ravichandra, A.; Miller, M.; Nair, A.; Affo, S.; Filliol, A.; Chin, L.; Savage, T.M.; Yin, D.; et al. Tumor restriction by type I collagen opposes tumor-promoting effects of cancer-associated fibroblasts. J Clin Invest 2021, 131, e146987. [Google Scholar] [CrossRef] [PubMed]
  46. Yun, C.W.; Lee, S.H. The roles of autophagy in cancer. Int J Mol Sci 2018, 19, 3466. [Google Scholar] [CrossRef] [PubMed]
  47. Kwon, J.; Kim, J.; Kim, K. Crosstalk between endoplasmic reticulum stress response and autophagy in human diseases. Anim Cells Syst (Seoul) 2023, 27, 29–37. [Google Scholar] [CrossRef]
  48. Lee, A.S. Glucose-regulated proteins in cancer: molecular mechanisms and therapeutic potential. Nat Rev Cancer 2014, 14, 263–276. [Google Scholar] [CrossRef] [PubMed]
  49. Bläss, S.; Union, A.; Raymackers, J.; Schumann, F.; Ungethüm, U.; Müller-Steinbach, S.; De Keyser, F.; Engel, J.M.; Burmester, G.R. The stress protein BiP is overexpressed and is a major B and T cell target in rheumatoid arthritis. Arthritis Rheum 2001, 44, 761–771. [Google Scholar] [CrossRef]
  50. Gonzalez-Gronow, M.; Cuchacovich, M.; Llanos, C.; Urzua, C.; Gawdi, G.; Pizzo, S.V. Prostate cancer cell proliferation in vitro is modulated by antibodies against glucose-regulated protein 78 isolated from patient serum. Cancer Res 2006, 66, 11424–11431. [Google Scholar] [CrossRef]
  51. Luo, B.; Lee, A.S. The critical roles of endoplasmic reticulum chaperones and unfolded protein response in tumorigenesis and anticancer therapies. Oncogene 2013, 32, 805–818. [Google Scholar] [CrossRef]
  52. Lee, J.H.; Yoon, Y.M.; Lee, S.H. GRP78 regulates apoptosis, cell survival and proliferation in 5-fluorouracil-resistant snuc5 colon cancer cells. Anticancer Res 2017, 37, 4943–4951. [Google Scholar] [CrossRef] [PubMed]
  53. Vig, S.; Buitinga, M.; Rondas, D.; Crèvecoeur, I.; van Zandvoort, M.; Waelkens, E.; Eizirik, D.L.; Gysemans, C.; Baatsen, P.; Mathieu, C.; et al. Cytokine-induced translocation of GRP78 to the plasma membrane triggers a pro-apoptotic feedback loop in pancreatic beta cells. Cell Death Dis 2019, 10, 309. [Google Scholar] [CrossRef] [PubMed]
  54. Misra, U.K.; Pizzo, S.V. Ligation of cell surface GRP78 with antibody directed against the COOH-terminal domain of GRP78 suppresses Ras/MAPK and PI 3-kinase/AKT signaling while promoting caspase activation in human prostate cancer cells. Cancer Biol Ther 2010, 9, 142–152. [Google Scholar] [CrossRef] [PubMed]
  55. Sano, R.; Reed, J.C. ER stress-induced cell death mechanisms. BiochimBiophys Acta 2013, 1833, 3460–3470. [Google Scholar] [CrossRef] [PubMed]
  56. Kim, J.; Guan, K.L. mTOR as a central hub of nutrient signalling and cell growth. Nat Cell Biol 2019 21, 63–71. [CrossRef]
  57. Takahara, T.; Amemiya, Y.; Sugiyama, R.; Maki, M.; Shibata, H. Amino acid-dependent control of mTORC1 signaling: a variety of regulatory modes. J Biomed Sci 2020, 27, 87. [Google Scholar] [CrossRef] [PubMed]
  58. Shimobayashi, M.; Hall, M. Multiple amino acid sensing inputs to mTORC1. Cell Res 2016, 26, 7–20. [Google Scholar] [CrossRef] [PubMed]
  59. Liu, K.A.; Lashinger, L.M.; Rasmussen, A.J.; Hursting, S.D. Leucine supplementation differentially enhances pancreatic cancer growth in lean and overweight mice. Cancer Metab 2014, 2, 6. [Google Scholar] [CrossRef] [PubMed]
  60. Xie, X.L.; Wei, M.; Yunoki, T.; Kakehashi, A.; Yamano, S.; Kato, M.; Wanibuchi, H. Long-term treatment with L-isoleucine or L-leucine in AIN-93G diet has promoting effects on rat bladder carcinogenesis. Food Chem Toxicol 2012, 50, 3934–3940. [Google Scholar] [CrossRef]
  61. Viana, L.R.; Tobar, N.; Busanello, E.N.B.; Marques, A.C.; de Oliveira, A.G.; Lima, T.I.; Machado, G.; Castelucci, B.G.; Ramos, C.D.; et al. Leucine-rich diet induces a shift in tumour metabolism from glycolytic towards oxidative phosphorylation, reducing glucose consumption and metastasis in Walker-256 tumour-bearing rats. Sci Rep 2019, 9, 15529. [Google Scholar] [CrossRef]
  62. Beaudry, A.G.; Law, M.L. Leucine Supplementation in cancer cachexia: mechanisms and a review of the pre-clinical literature. Nutrients 2022, 14, 2824. [Google Scholar] [CrossRef] [PubMed]
  63. Locasale, J.W. Serine, glycine and one-carbon units: cancer metabolism in full circle. Nat Rev Cancer 2013, 13, 572–583. [Google Scholar] [CrossRef]
  64. Locasale, J.W.; Cantley, L.C. Genetic selection for enhanced serine metabolism in cancer development. Cell Cycle 2011, 10, 3812–3813. [Google Scholar] [CrossRef]
  65. Possemato, R.; Marks, K.M.; Shaul, Y.D.; Pacold, M.E.; Kim, D.; Birsoy, K.; Sethumadhavan, S.; Woo, H.K. , Jang, H.G.; Jha, A.K.; et al. Functional genomics reveal that the serine synthesis pathway is essential in breast cancer. Nature 2011, 476, 346–350. [Google Scholar] [CrossRef]
  66. Snell, K. Enzymes of serine metabolism in normal and neoplastic rat tissues. BiochimBiophys Acta 1985, 843, 276–281. [Google Scholar] [CrossRef] [PubMed]
  67. Jain, M.; Nilsson, R.; Sharma, S.; Madhusudhan, N.; Kitami, T.; Souza, A.L.; Kafri, R.; Kirschner, M.W.; Clish, C.B.; Mootha, V.K. Metabolite profiling identifies a key role for glycine in rapid cancer cell proliferation. Science 2012, 336, 1040–1044. [Google Scholar] [CrossRef]
  68. Labuschagne, C.F.; van den Broek, N.J.; Mackay, G.M.; Vousden, K.H.; Maddocks, O.D. Serine, but not glycine, supports one-carbon metabolism and proliferation of cancer cells. Cell Reports 2014, 7, 1248–1258. [Google Scholar] [CrossRef] [PubMed]
  69. Gravel, S.P.; Hulea, L.; Toban, N.; Birman, E.; Blouin, M.J.; Zakikhani, M.; Zhao, Y.; Topisirovic, I.; St-Pierre, J.; Pollak, M. Serine deprivation enhances antineoplastic activity of biguanides. Cancer Res 2014, 74, 7521–7533. [Google Scholar] [CrossRef]
  70. Keum, N.N.; Giovannucci, E.L. Folic Acid fortification and colorectal cancer risk. Am J Prev Med 2014, 46, S65–S72. [Google Scholar] [CrossRef]
  71. Kruman, I.I.; Fowler, A.K. Impaired one carbon metabolism and DNA methylation in alcohol toxicity. J Neurochem 2014, 129, 770–780. [Google Scholar] [CrossRef]
  72. Iqbal, M.A.; Gupta, V.; Gopinath, P.; Mazurek, S.; Bamezai, R.N. Pyruvate kinase M2 and cancer: an updated assessment. FEBS Lett 2014, 588, 2685–2692. [Google Scholar] [CrossRef] [PubMed]
  73. Ristow, M.; Zarse, K.; Oberbach, A.; Klöting, N.; Birringer, M.; Kiehntopf, M.; Stumvoll, M.; Kahn, C.R.; Blüher, M. Antioxidants prevent health-promoting effects of physical exercise in humans. Proc Natl Acad Sci U S A 2009, 106, 8665–8670. [Google Scholar] [CrossRef] [PubMed]
  74. Romano, C.; Corsetti, G.; Pasini, E.; Flati, V.; Dioguardi, F.S. Dietary modification of nitrogen intake decreases inflammation and promotes rejuvenation of spleen in aged mice. J Food Nutr Res 2018, 6, 419–432. [Google Scholar] [CrossRef]
  75. Corsetti, G.; Romano, C.; Pasini, E.; Testa, C.; Dioguardi, F.S. Qualitative nitrogen malnutrition damages gut and alters microbiome in adult mice. A preliminary histopathological study. Nutrients 2021, 13, 1089. [Google Scholar] [CrossRef]
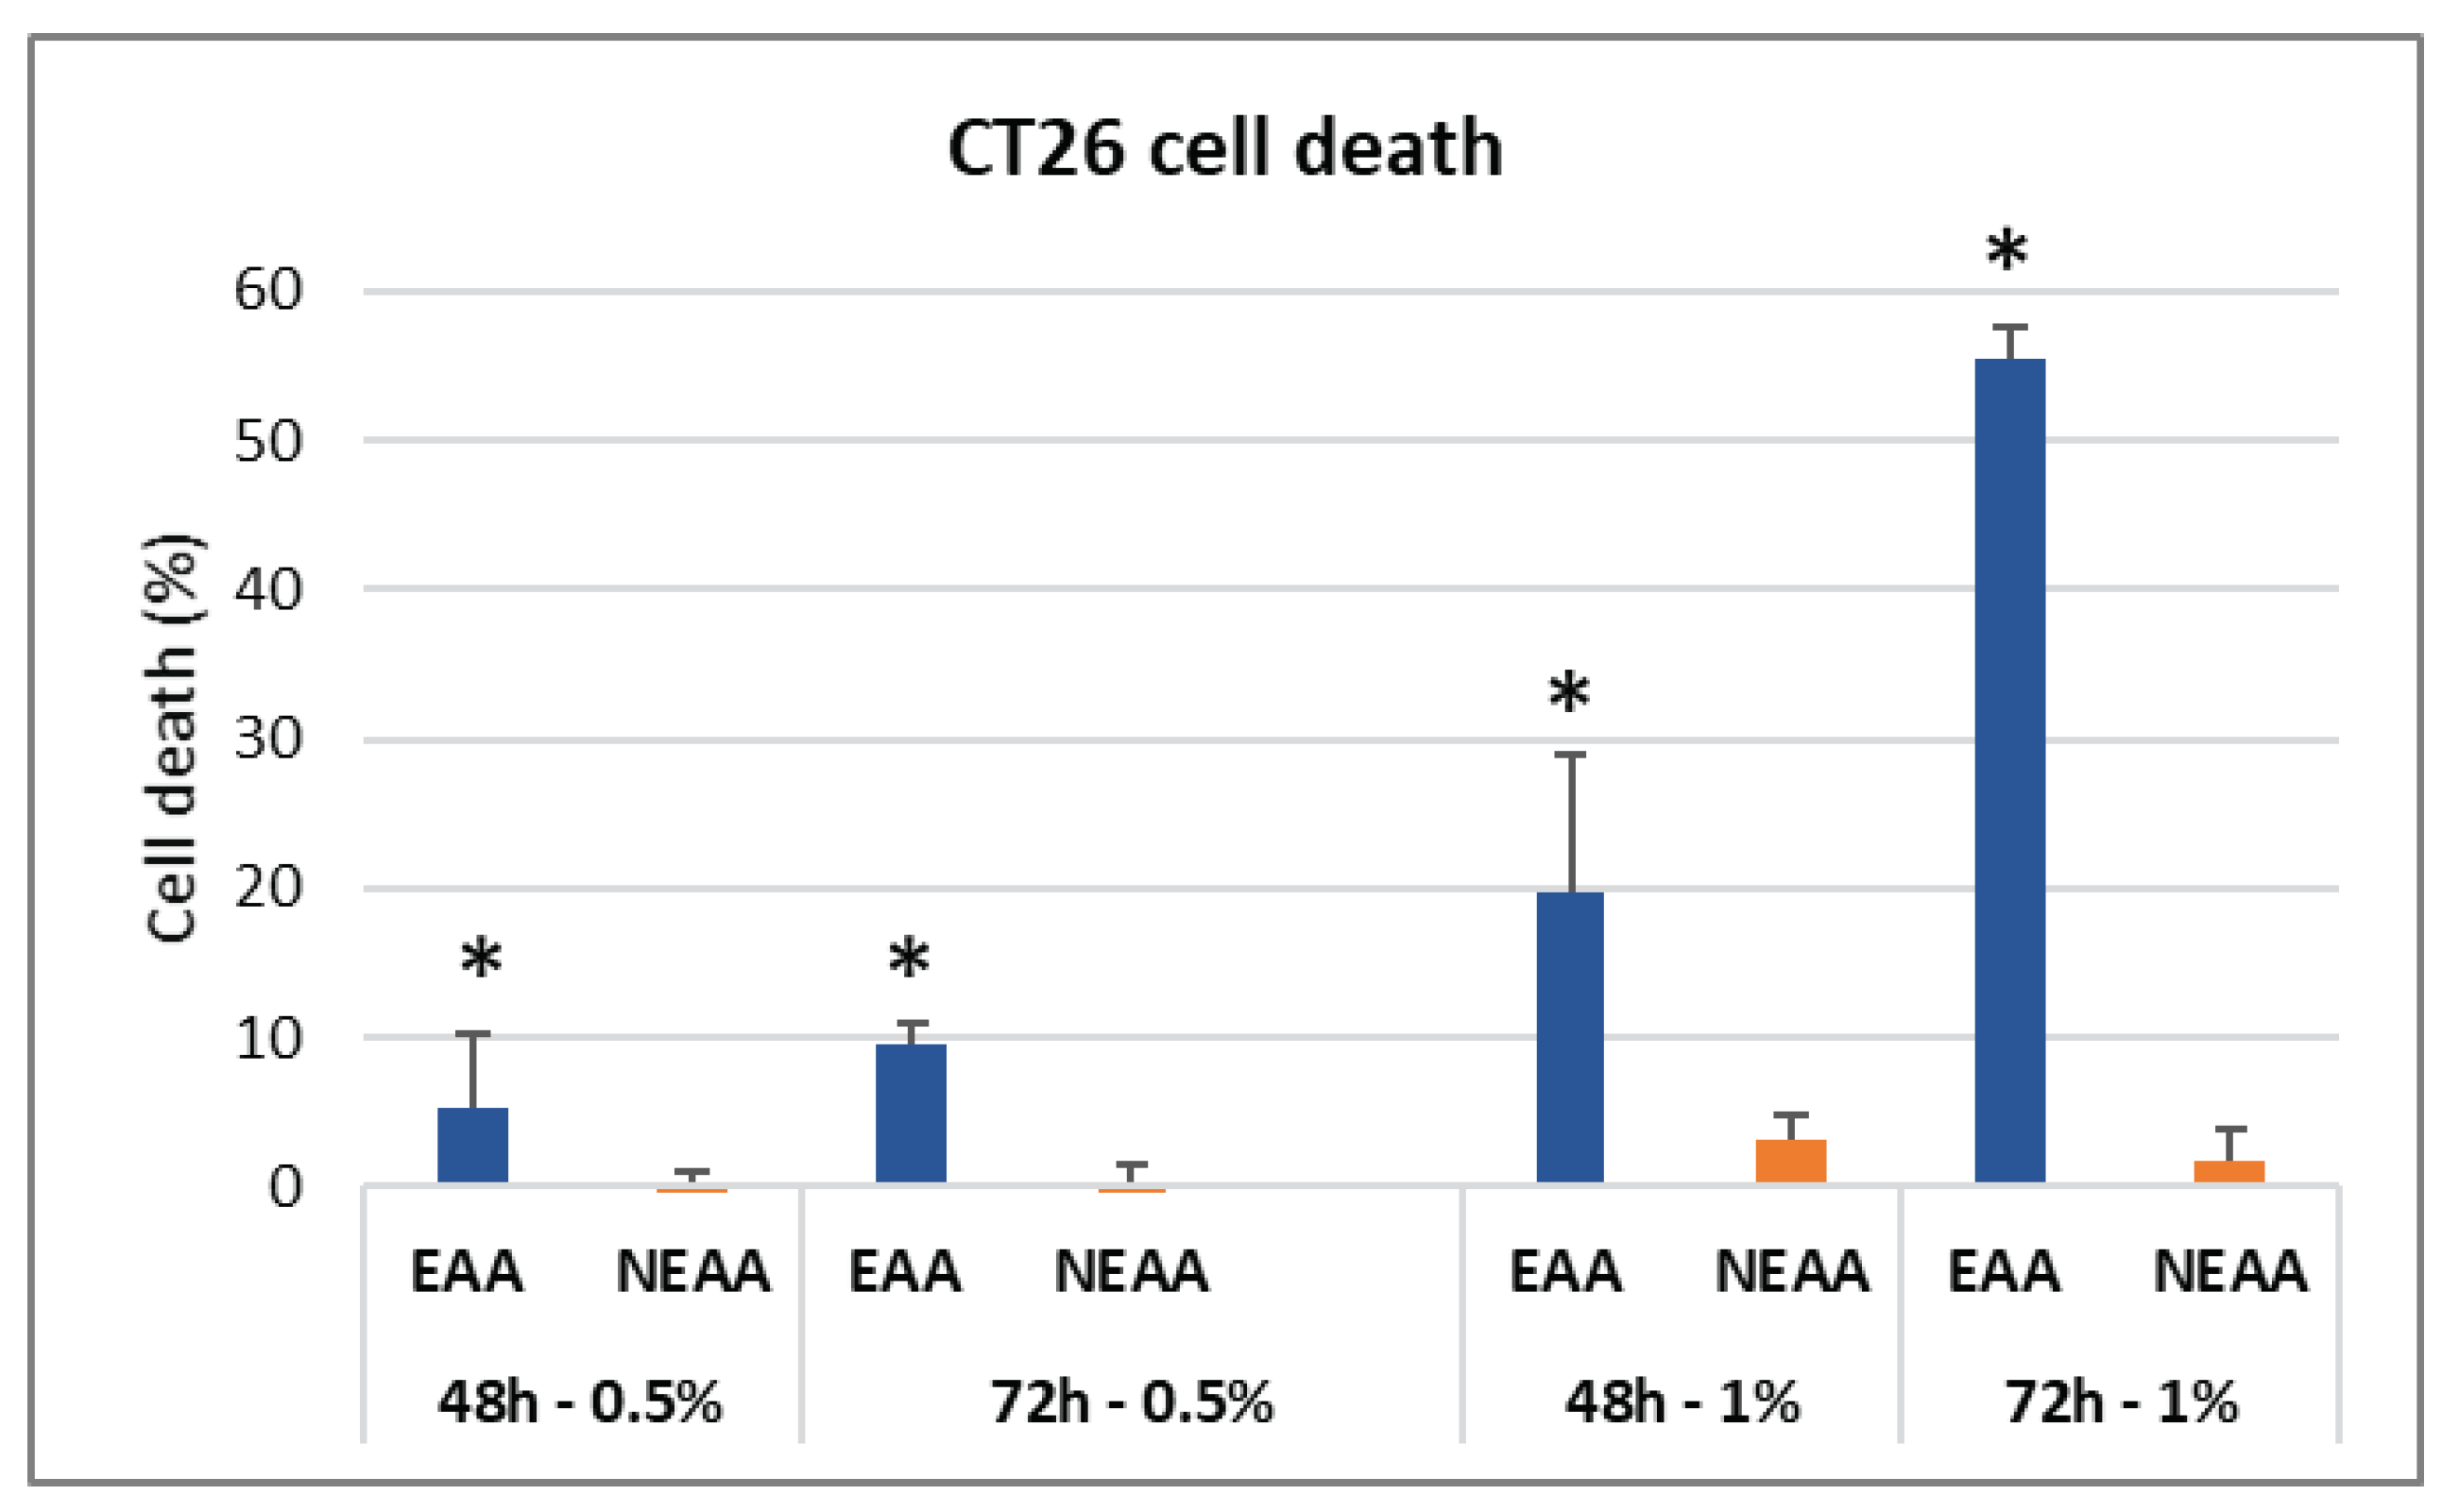
Figure 1. EAA-mix reduced colon carcinoma cells viability. Neutral red viability assay was performed on CT26 cells treated for 48 and 72 hours with EAA-mix or NEAA-mix at 0.5 and 1% concentration. Results are presented as percentage of cell death compared to untreated cells. * p>0.001.
Preprints 102225 g001
Figure 2. A) Immunofluorescence analysis for LC3β was conducted on CT26 cells incubated with EAA at 0.5% and 1% concentration for 24 and 48 hours. Representative images were acquired using a 63x objective. Scale bar, 50 µm. B)Fluorescence-Activated Cell Sorting (FACS) analysis for apoptosis was performed on CT26 cells receiving 1% EAA for the indicated time points. Doxorubicin was used as positive control.
Preprints 102225 g002
Figure 3. A) body weight (g) trend in the two experimental groups. B)Weight of rpWAT and BATshows the significant reduction in animals StD-fed. C) Ttriceps muscle weight was maintained in mice fed with the EAARD. Value are expressed ad mean±sd. * p<0.05.
Preprints 102225 g003
Figure 4. Above. Timing of tumor volume development (mean ± sd) (left) andmean tumor weight (mean ± sd) according to diets (right).Below. Representative s.c. tumor in StD-fed and EAARD-fed mice.In StD-fed animals, note the presence of an intricate subcutaneous vascular network that also involves the tumor (arrow). Scale bar: 10mm.
Preprints 102225 g004
Figure 5. S.c. injection. Representative tumor H/E and Sirius red (polarized light) stained sections in StD-fed (A-C) and EAARD-fed mice (D-F). Cytoplasmic and nuclear condensation and fragmentation, and foci of apoptotic cell debris are found (black arrows) in StD-fed and, much more, in EAARD-fed mice. Mitotic cell (arrowhead) is also present. Note the presence of abundant thin stromal collagen fibers in tumors with StD (C). In those with EAARD the presence of stromal collagen is very scarce and tends to be concentrated in restricted areas (F). Scale bar: A,D,C,D,100µm; B and E, 20µm.
Preprints 102225 g005
Figure 6. S.c. injection. Immunohistochemistry dataand representive images of tumor tissue immunostaining.A) Ki-67 is expressed as percentage ofintese immunostained nuclei in each section.StD-fed tumor show more cells intensely stained.Scale bar:50µm. B, C, D)The graphs indicate the optical density for GRP78, active-Caspase-3 and iNOS which appears to be significantly different in tumors from animals fed EAARD. Scale bar: A,B,D, 50µm; C,20 µm. E) CD31 staining is expressed as number of vessels for unit area.EAARD determines the significant reduction of the vascularization of the tumor. Scale bar: 50µm.**p<0.01.
Preprints 102225 g006
Figure 7. I.p. injection. A and B) Survival time between the day of inoculation (day 0) and the day of sacrifice at the end of the planned observation period (day 21). The dashed black line indicates the average survival days. The mean survival time for StD-fed and EAARD-fed was 16.5 and 19.5 days respecrtively. C) Mice body weight change after i.p. CT26 inoculation (mean ± sd). D) Ratio between organ weight and body weight according to group (mean ± sd). * p<0.05; ** p<0.01.
Preprints 102225 g007
Figure 8. I.p. injection. A) Abdominal numberof tumors clearly distinguishable even to the naked eye (mean ± sd).**p<0.01.B) Total tumor volume according to group. C and D) Representative image of the mesenteric tumor (arrows) in StD-fedand EAARD-fed respectively, after 21 days from injection. Scale bar: 5 mm. C-D insert). Large intraperitoneal tumor sometime observed in animals fed with StD and EAARD. Scale bar: 10 mm. E and F) Representative E/H-stained sections. Nuclear condensation and fragmentation, and foci of apoptotic cell debris are found mostly in EAARD-fed mice. Scale bar: 20µm.
Preprints 102225 g008
Table 1. Composition of EAA-mix and NEAA-mix for in vitro experiments, and composition of pellets (StD and EAARD) for mice. * Nitrogen (%) from free AAs only. ° Nitrogen (%) from vegetable and animal proteins and added AA. StD = Standard diet; EAARD = Essential-AA rich diet; N = nitrogen. bcaa = branched chain AA.
EAA-mix NEAA-mix StD EAARD
KCal/Kg -- -- 3952 3995
Carbohydrates (%) -- -- 54.61 61.76
Lipids (%) -- -- 7.5 6.12
Nitrogen (%) -- -- 21.8 ° 20 *
Proteins: % of total N content -- -- 95.93 --
Free AA: % of total N content -- -- 4.07 100
EAA/NEAA (% in grams) -- -- < or <<0.9 6.14 (86/14)
Free AA composition (%)
L-Leucine (bcaa) 13.53 -- -- 13.53
L-Isoleucine (bcaa) 9.65 -- -- 9.65
L-Valine (bcaa) 9.65 -- -- 9.65
L-Lysine 11.6 -- 0.97 11.6
L-Threonine 8.7 -- -- 8.7
L-Histidine 11.6 -- -- 11.6
L-Phenylalanine 7.73 -- -- 7.73
L-Methionine 4.35 -- 0.45 4.35
L-Tyrosine 5.80 1.0 -- 5.80
L-Triptophan 3.38 -- 0.28 3.38
L-Cystine/Cysteine 8.20 -- 0.39 8.20
L-Alanine -- 35.0 -- --
L-Glycine -- 15.0 0.88 --
L- Arginine -- 14.0 1.1 --
L-Proline -- 12.0 -- --
L-Glutamine -- 12.0 -- --
L-Serine 2.42 6.0 -- 2.42
L-Glutamic Acid -- 2.0 -- --
L-Asparagine -- 2.0 -- --
L-Aspartic Acid -- 1.0 -- --
Ornithine-αKG 2.42 -- -- 2.42
N-acetylcysteine 0.97 -- -- 0.97
Disclaimer/Publisher’s Note: The statements, opinions and data contained in all publications are solely those of the individual author(s) and contributor(s) and not of MDPI and/or the editor(s). MDPI and/or the editor(s) disclaim responsibility for any injury to people or property resulting from any ideas, methods, instructions or products referred to in the content.
Copyright: This open access article is published under a Creative Commons CC BY 4.0 license, which permit the free download, distribution, and reuse, provided that the author and preprint are cited in any reuse.
Prerpints.org logo

Preprints.org is a free preprint server supported by MDPI in Basel, Switzerland.

Subscribe

© 2024 MDPI (Basel, Switzerland) unless otherwise stated