1. Introduction
In the realm of sustainable materials, the exploration of bio-based plastics has emerged as a pivotal avenue for reducing our environmental footprint. Among the plethora of biodegradable polymers, the likes of Poly(lactic acid) (PLA), Thermoplastic Polyurethane (TPU), Polyvinyl Alcohol (PVA), starch-based polymers, and Thermoplastic Starch (TPS) have garnered significant attention. These materials, derived from renewable resources, hold promise as eco-friendly alternatives to conventional plastics.
Biopolymers, originating from renewable sources and intricately integrated into the biological framework, represent nature’s sophisticated response to the requirements for structural support, energy storage, and cellular communication. Positioned as sustainable alternatives to conventional polymers, biopolymers have attracted escalating interest due to their environmentally friendly attributes and potential applications across diverse industries. A crucial endeavor involves comprehending the thermal decomposition of biopolymers, aiming to elucidate their responses to elevated temperature conditions.
This work focuses on the thermal decomposition of biopolymers, studying the behavior of biological macromolecules as they undergo transformation in response to thermal stimuli. Investigating these pathways becomes paramount for optimizing the utilization of biopolymers in applications ranging from biomedical devices to sustainable packaging.
Exploring thermal decomposition becomes more insightful when examined from the perspective of kinetics. Kinetic models serve as essential tools, revealing the complex temporal changes in bio-based plastics as they react to heat, rather than being mere mathematical abstractions.
Examining reactions from a kinetic standpoint provides a pathway to understanding reaction rates, unraveling the complex interplay between temperature, time, and molecular structures. For Poly(lactic acid) (PLA), this involves the elucidation of the rate constants dictating its transition from a complex polymer matrix to simpler, more volatile compounds. Understanding the degradation kinetics of PLA allows us to go beyond static observations, gaining dynamic insights into the reactions that occur as temperature increases. In the case of Polyvinyl Alcohol (PVA), starch-based polymers, and Thermoplastic Starch (TPS), the kinetic lens brings forth a nuanced understanding of the multi-step degradation processes.
Polyvinyl Alcohol (PVA), starch-based polymers, and Thermoplastic Starch (TPS) present a diverse array of bio-based materials with unique properties and potential applications. Within the context of their thermal decomposition, our study extends to the development of kinetic models adapted to each material. These models serve as powerful tools for predicting degradation kinetics, offering insights into the factors influencing biodegradability and contributing to a more comprehensive understanding of their environmental impact. Poly(lactic acid), commonly known as PLA, has become a flagship bio-based polymer due to its biodegradability and versatile applications.
Beyond the laboratory bench, the kinetic models derived from the thermal decomposition of bio-based plastics have far-reaching implications for biodegradability and the overall life cycle of products. By integrating kinetic data into life cycle assessments, we bridge the gap between laboratory experiments and real-world applications. This holistic approach provides a deeper understanding of how thermal treatments influence the degradation kinetics and subsequent environmental fate of these materials, guiding decisions in waste management strategies and contributing to a circular economy.
Thermoplastic Starch (TPS) is typically produced through a process that involves blending starch with a plasticizer and, in some cases, additives. The starch, often derived from crops like corn, wheat, or potatoes, serves as the main biopolymer component. The plasticizer, which is commonly glycerol, is added to improve the flexibility and processability of the starch.
The process involves heating and mixing the starch and plasticizer, leading to gelatinization of the starch granules. This results in the formation of a homogeneous and thermoplastic starch matrix. After shaping, the material can be cooled and solidified to produce TPS. The final properties of TPS depend on factors such as the type of starch, plasticizer content, and any additional additives used in the formulation.
Some previous literature attempted to elucidate the thermal decomposition pathways of biopolymers. Guo et al., 2018 demonstrated that PVA decomposition occurs in two stages, one peaking at 250 ºC (523 K) and the second at 420 ºC (693 K). In contrast, TPS exhibited a complex decomposition profile, with the maximum weight loss rate observed around 330 ºC (603 K). During TPS decomposition, weight loss occurred at temperatures below 160 ºC, attributed to water evolution and glycerol (plasticizer) decomposition.
In another study, Kaewtatip & Thongmee, 2013 also identified the maximum rate of TPS decomposition at approximately 333 ºC. Conversely, Karim et al., 2021 reported that the maxima in the decomposition of glycerol-starch were centered at 305 ºC. These authors emphasized the interaction between glycerol and starch in the film, noting that glycerol evaporation typically occurs at 180 °C, while starch decomposes at 340 °C [
4].
Regarding PVA decomposition, Sin et al., 2011 prepared polymers using this alcohol in conjunction with cassava starch. Results indicated that neat cassava starch exhibited better thermal resistance than neat PVA, attributed to the presence of a cyclic hemiacetal structure in starch, conferring sustainability to thermal attacks. Blending these materials enhanced thermal stability, with the decomposition of pure PVA occurring at a maximum rate of 320 ºC, whereas mixtures containing 50% alcohol with cassava starch shifted the decomposition to almost 400 ºC (in runs performed at 20 K/min).
In the present work key components of TPS, including starch, glycerin, and polyvinyl alcohol (PVA), are subjected to systematic evaluation to delineate their individual contributions to the overall thermal degradation process. Furthermore, the incorporation of different starch sources and the addition of calcium carbonate in TPS serve as focal points for exploring the impact of these variables on the polymer’s thermal stability.
By undertaking this experimental endeavor, our goal is to offer valuable insights that aid in the optimization of processing conditions and enhance our ability to predict material behavior across diverse thermal environments. This research not only contributes to the growing body of knowledge in the field but also underscores the significance of experimental precision in advancing our understanding of the thermal characteristics of TPS and PLA.
2. Materials and Methods
2.1. Materials
In this work, a total of twelve samples were tested for pyrolytic decomposition. The study comprised samples of TPS using starch extracted from different vegetables (potato, corn, wheat, rice and cassava), and potato based TPS that has different calcium carbonate adding. Also, other samples different from TPS were tested, such as PLA, and some components of the TPS polymers (starch from potato, PVA and glycerin, that is used as plasticizer). The specific composition of the samples is shown in
Table 1.
The starch film samples were prepared following the method outlined by Domene-López et al., 2018, with some modifications. Briefly, the raw materials mixture was processed in a HAAKETM PolyLabTM QC Modular Torque Rheometer (ThermoFisher Scientific, Waltham, MA, USA). Processing involved subjecting the raw materials mixtures for the potato, corn, wheat, and rice samples, to a temperature of 110 °C for 10 minutes, with the initial 5 minutes at 50 rpm and the remaining time at 100 rpm. Cassava sample was obtained by applying 140 °C for 5 minutes, with the first minute at 50 rpm and at 100 rpm for the last minutes. Subsequently, the obtained blend was hot-pressed at 160 °C for 10 minutes under a pressure of 7-10 tons, resulting in a 1.035 mm thick sheet.
Samples different from TPS were used as received. Potato Starch powder was purchased from ThermoFisher SCIENTIFIC, PVA and Zinc Stearate were purchased from Sigma Aldrich, glycerin from Fisher Chemicals and PLA from TotalEnergies Corbion.
2.2. Methods
Runs for the TG analysis were carried out on a Mettler Toledo TGA/SDTA851e/SF/1100 Thermal Gravimetric Analyzer. The decomposition temperatures were measured under dynamic conditions in nitrogen atmosphere (pyrolytic runs) with a total flow rate of 100 mL min-1. Dynamic experiments were carried out at heating rates of 5, 10 and 20 K min-1 from room temperature up to 1173 K. For each run, 6 ± 0.3 mg of sample were used.
2.3. Kinetic Modelling
As different materials are studied in the present work, diverse kinetic models will be applied. The kinetic model proposed for thermal decomposition of the different components considers each material formed by one to three independent parts (depending on the material), each one following an independent reaction, as follows:
with i=1, 2 or 3. In the previous equation, Solid
i refers to different fractions of the original material, Volatiles
i are the gases and condensable volatiles evolved in the corresponding reactions and Residue
i is the possible residue formed in the decomposition of each Solid
i. Each fraction has a yield coefficient (considered constant throughout the reaction) representing the maximum mass fraction obtainable by each reaction. In this way, v
i∞ is the yield coefficient for the Volatiles
i and (c
Si0- v
i∞) is the yield coefficient for the Residue
i. On the other hand, the sum of initial mass fractions of the components (c
Si0) is exactly one minus the final mass fractions of solid [
7].
The conversion degree for each reaction is defined as the ratio between the mass fractions of solid reacted at any time (c
Si0-w
Si) and the corresponding initial fraction of this component:
From the mass balance between products and reactants and the conversion degrees, the kinetic equations for decomposition runs can be defined as follows:
with n
i being the reaction order and the kinetic constants following the Arrhenius equation:
For calculation of the total mass remaining a weighted sum is used:
Bearing in mind the form of each curve (that will be shown later), three different fractions (i=3) where considered for explaining the behavior of the different TPS samples, whereas two fractions (i=2) was necessary to explain starch, PVA and glycerin, and only one fraction (i=1) for PLA decomposition.
The optimization was done by integration of the differential equations presented in the kinetic model by the finite differences’ method [
8]. considering and testing that the intervals of time were small enough to make the integration errors negligible. The optimization method of the function Solver in a Microsoft Excel® spreadsheet was used to minimize the differences between the experimental and calculated mass fraction and their derivatives. The objective function (OF) to be minimized was:
where ’p’ represents the experimental data at time ’t’ in the experiment with a heating rate ’m’. The value of M is the number of runs and P is the number of points in each run. The value of the ‘factor’ was arbitrarily chosen to be 10
+3, in order to give similar contribution to the O.F. to the mass fraction differences and those of the derivatives [
9]. Note that with this methodology, a unique set of kinetic constants is calculated from the experimental curves obtained at different heating rates[
10,
11,
12], and it gives kinetic constants valid for the whole set of heating rates used.
As a result of the optimization, reaction orders different from unity are obtained. This fact can be due to the variation of the surface exposed to the decomposition as discussed elsewhere [
13]. A reaction order greater than unity could indicate that there is a decrease in the surface exposed to the thermal decomposition, whereas a reaction order less than unity would imply that the surface exposed increases with the conversion.
3. Results
3.1. TPS Samples Using Different Starch
As mentioned before, five different samples of TPS were tested using starch obtained from different vegetables.
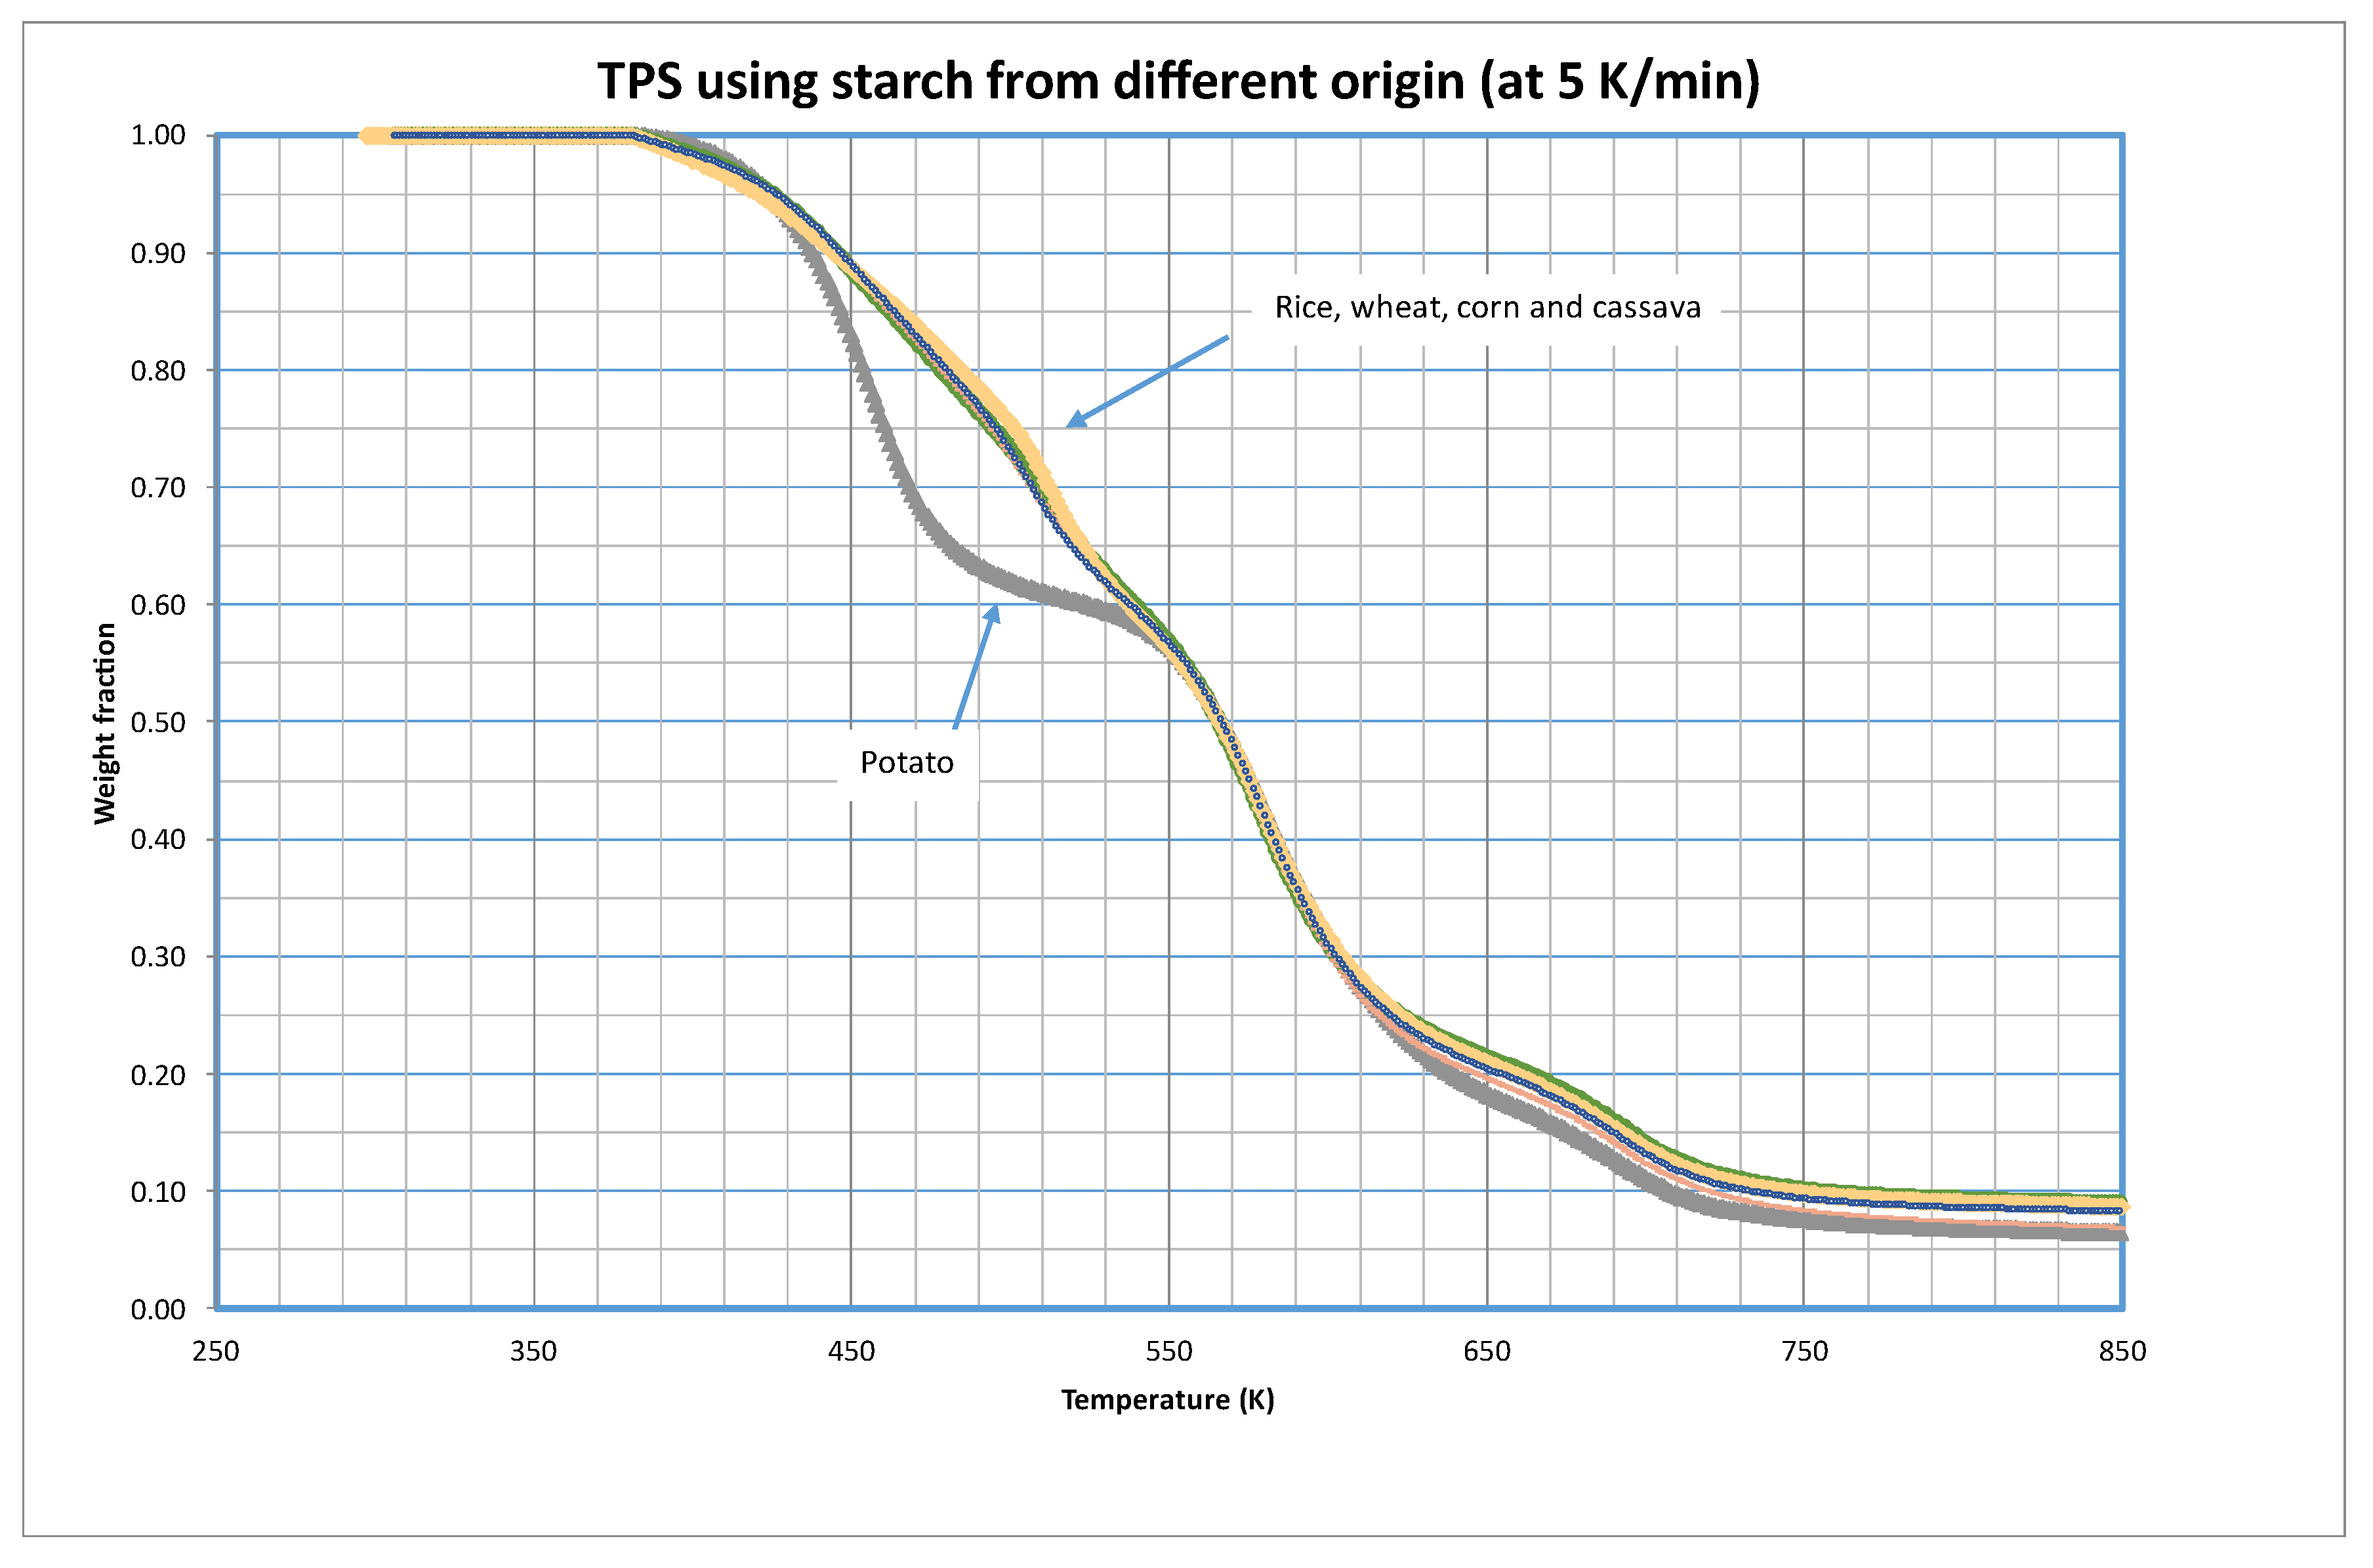
Figure 1 shows a comparison of the thermal decomposition in inert atmosphere (pyrolytic runs) of these five materials at 5 K/min. The complete study at the different heating rates is presented as
Supplementary Materials of this article (
Figures S1 to S5).
There are significant variations in the decomposition behavior between TPS made from potato starch and all other tested materials. The initial observation reveals that potato based TPS decomposes at a lower temperature, suggesting reduced temperature stability. Notably, the distinctions primarily manifest in the temperature range of 430 to 550 K (approximately 160 to 280 ºC), beyond which the decomposition curves converge.
Although most starches typically contain 20% – 30% amylose and 70% – 80% amylopectin, these percentages vary based on the nature of the starch. Regarding amylose content, potato starch contains around 20%, wheat starch contains about 25%, corn starch contains between 55% – 75%, rice starch contains around 33%, and cassava starch contains about 20% [
14,
15]. Different amylose/amylopectin ratios impart various characteristics to Thermoplastic Starch (TPS) [
16].
For the kinetic modeling of these decompositions, three fractions of materials were considered (i=3), but bearing in mind the form of the curves shown in
Figure 1, a single group of parameters were considered for the corn, wheat, rice and cassava decomposition, that furthermore would coincide with the final stages with the decomposition of potato based TPS. In this sense,
Table 2 shows the optimized values of the parameters. Note that decomposition of Fractions 2 and 3 coincides for all five tested materials.
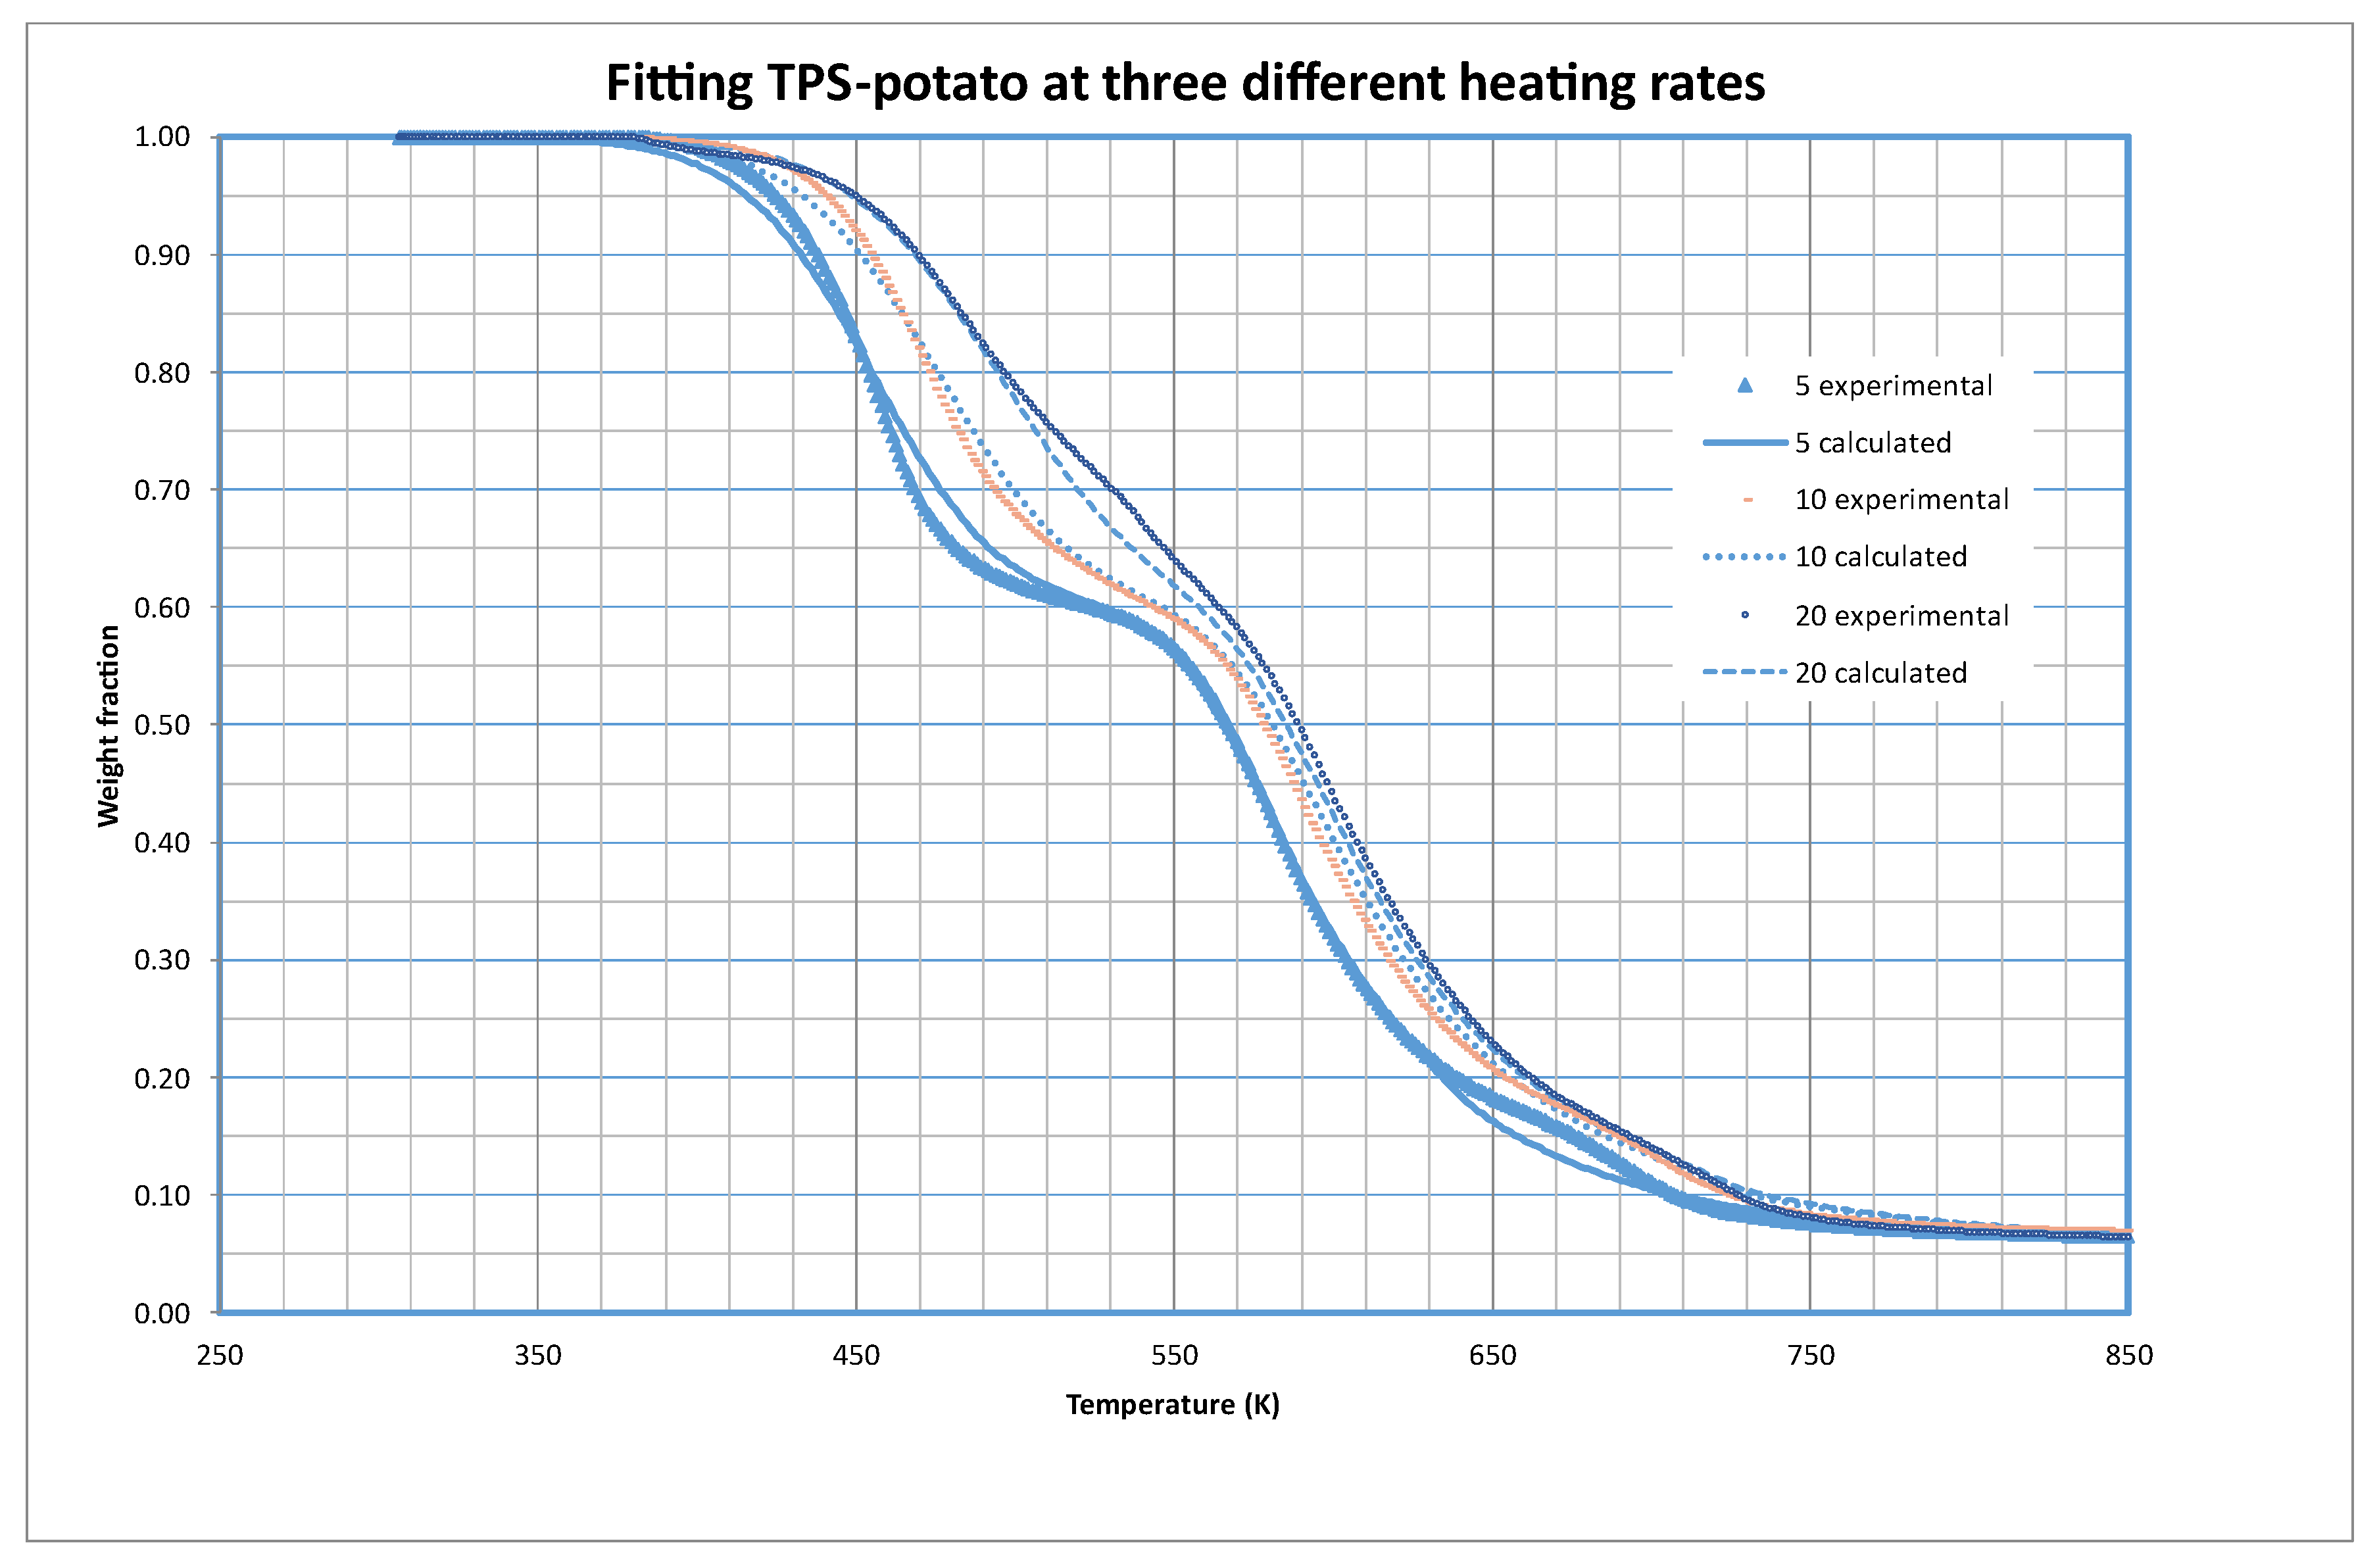
As an example of the quality of the fittings obtained,
Figure 2 shows the fitting of potato based TPS at the three different heating rates tested in this work. As we can check the model explains in a very convenient way the experimental results.
The parameters obtained indicate that in the samples there are three different materials from the thermal decomposition point of view. The first one accounts for almost 40 % of the material (as s10 equals 0.3996), the second one for a 53.5 % and the rest is in a third fraction (almost 1 %). The contribution of this last fraction to the weight is negligible.
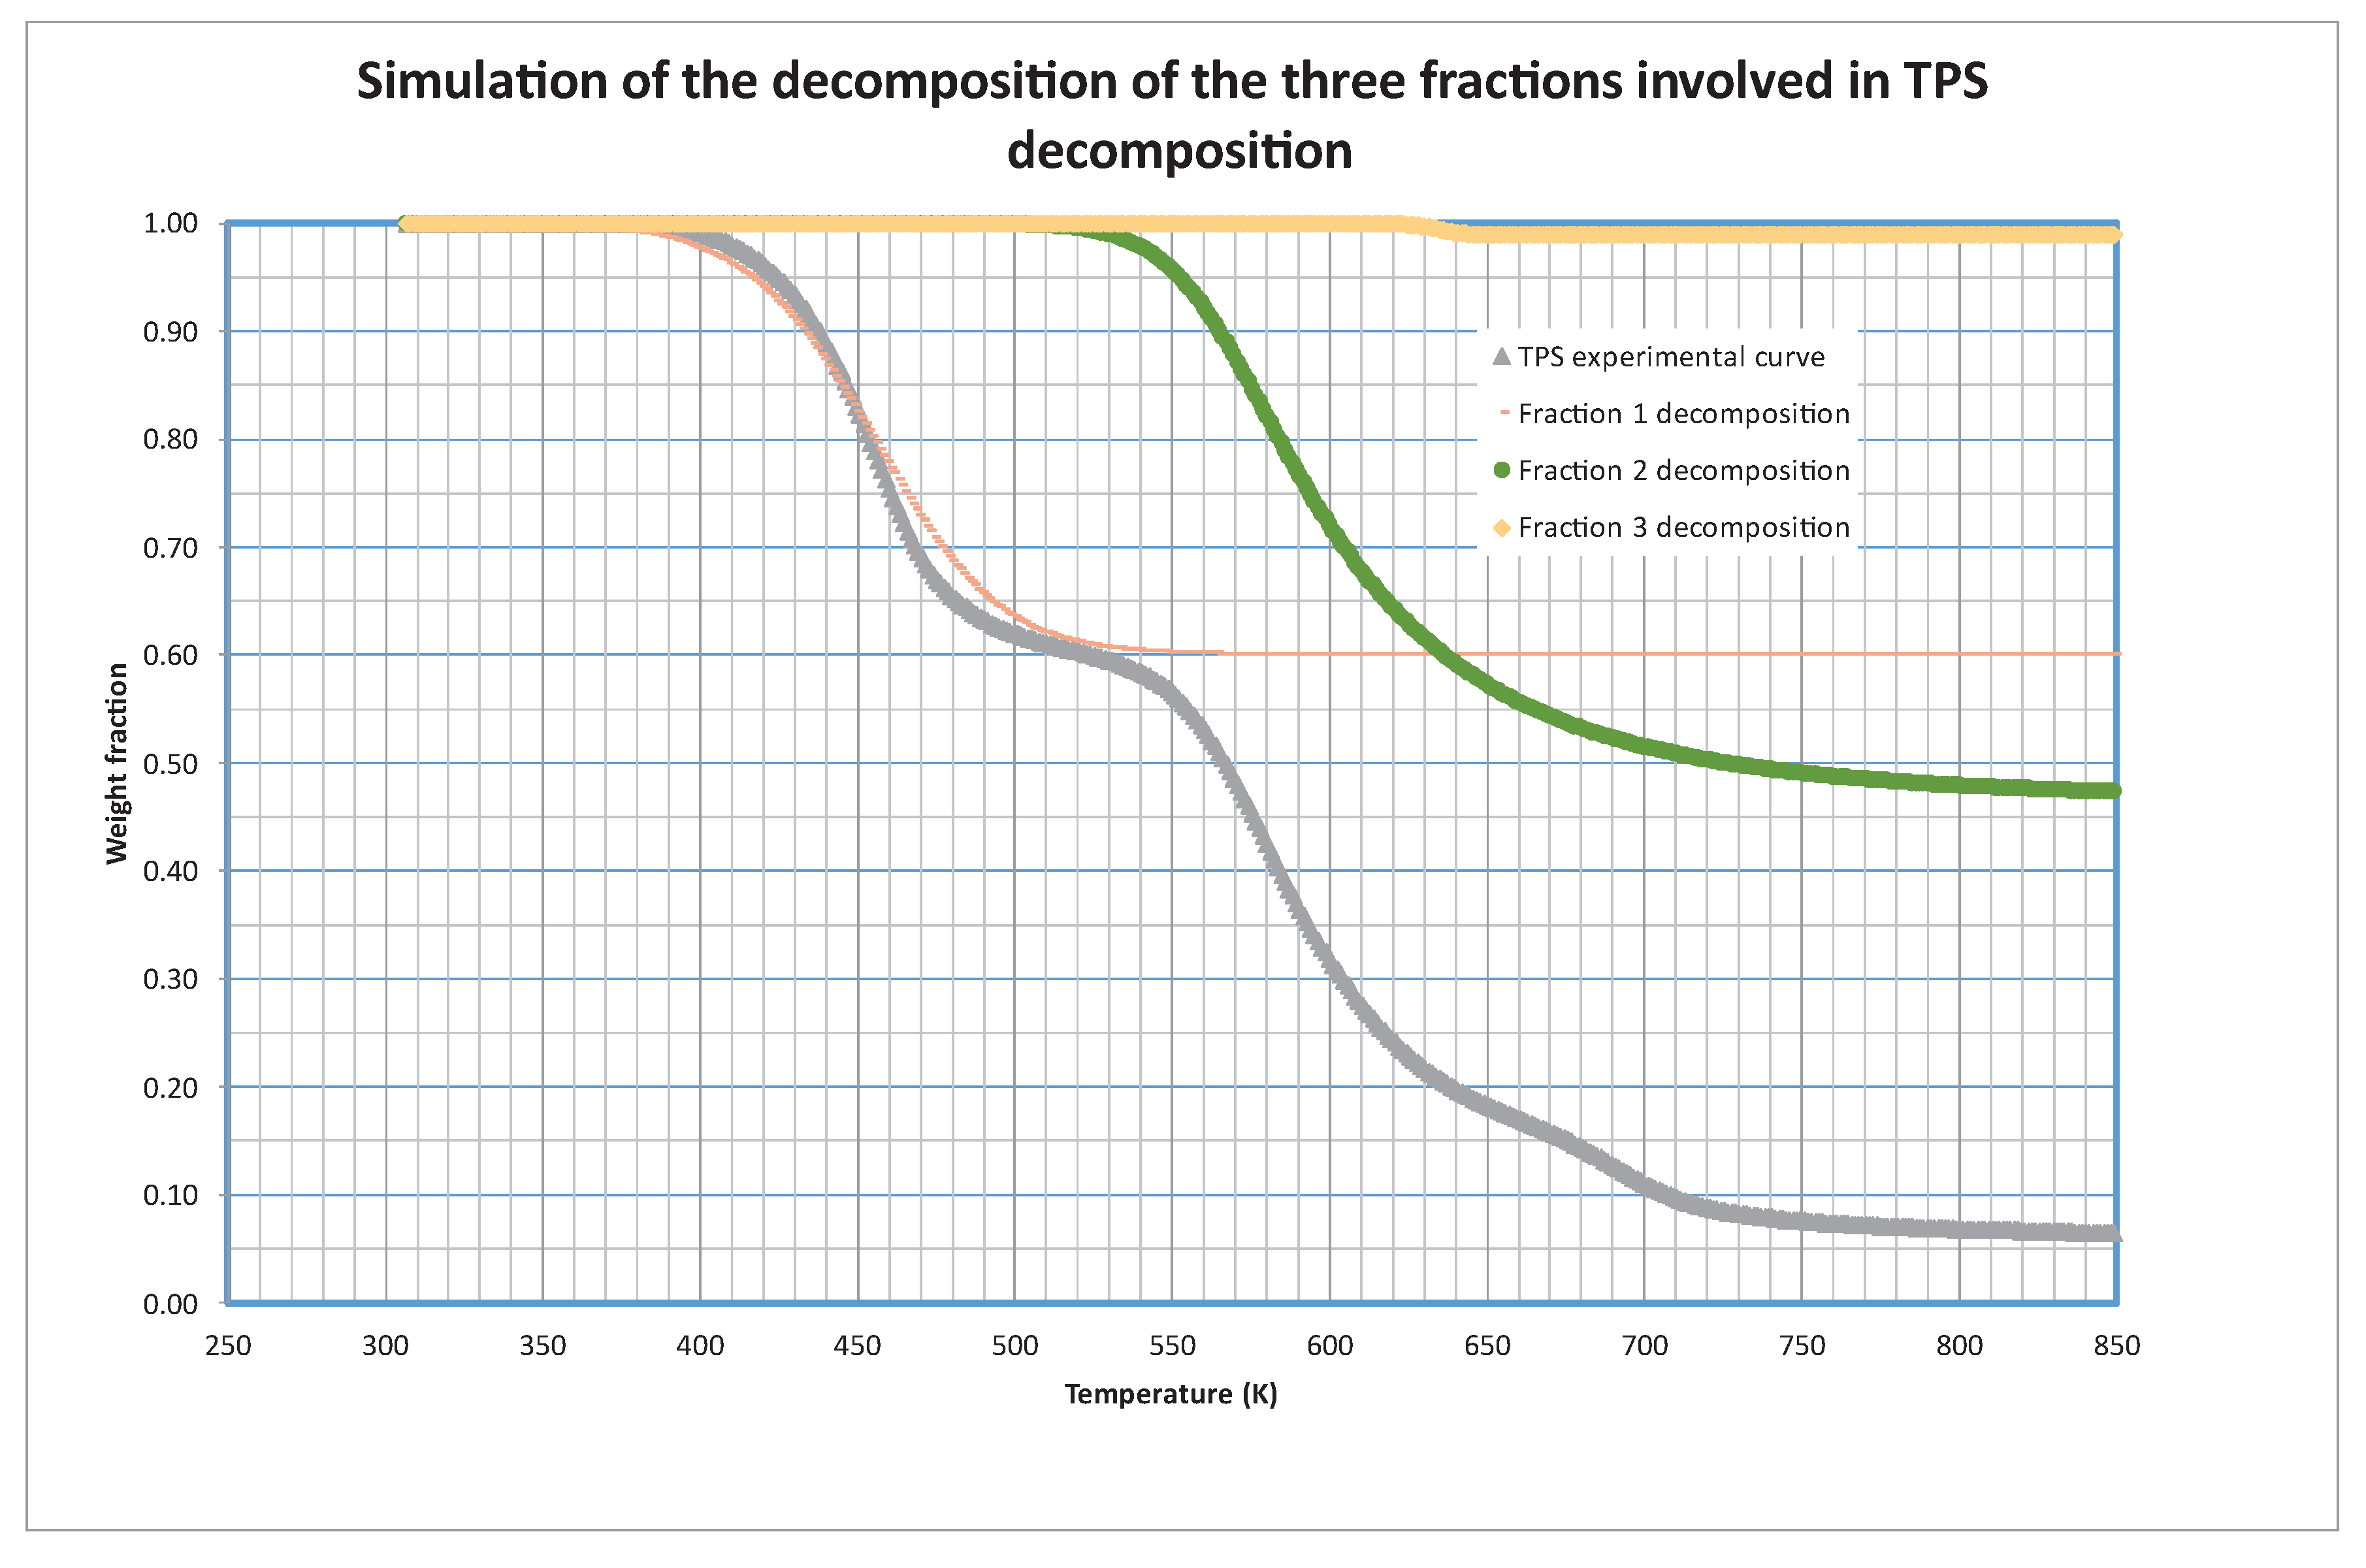
During the mathematical treatment of the kinetic model, it is possible to simulate the decomposition of each one of these fractions separately.
Figure 3 shows this simulation, with the decomposition and contribution (s
i0) of each fraction to the global curve. As we can see, the decomposition of the first fraction is centered around 450 K (at 5 K/min that is the heating rate shown in the Figure), the second one is centered at 600 K and the third one does not contribute appreciably to the total weight loss, although it is centered at 635 K.
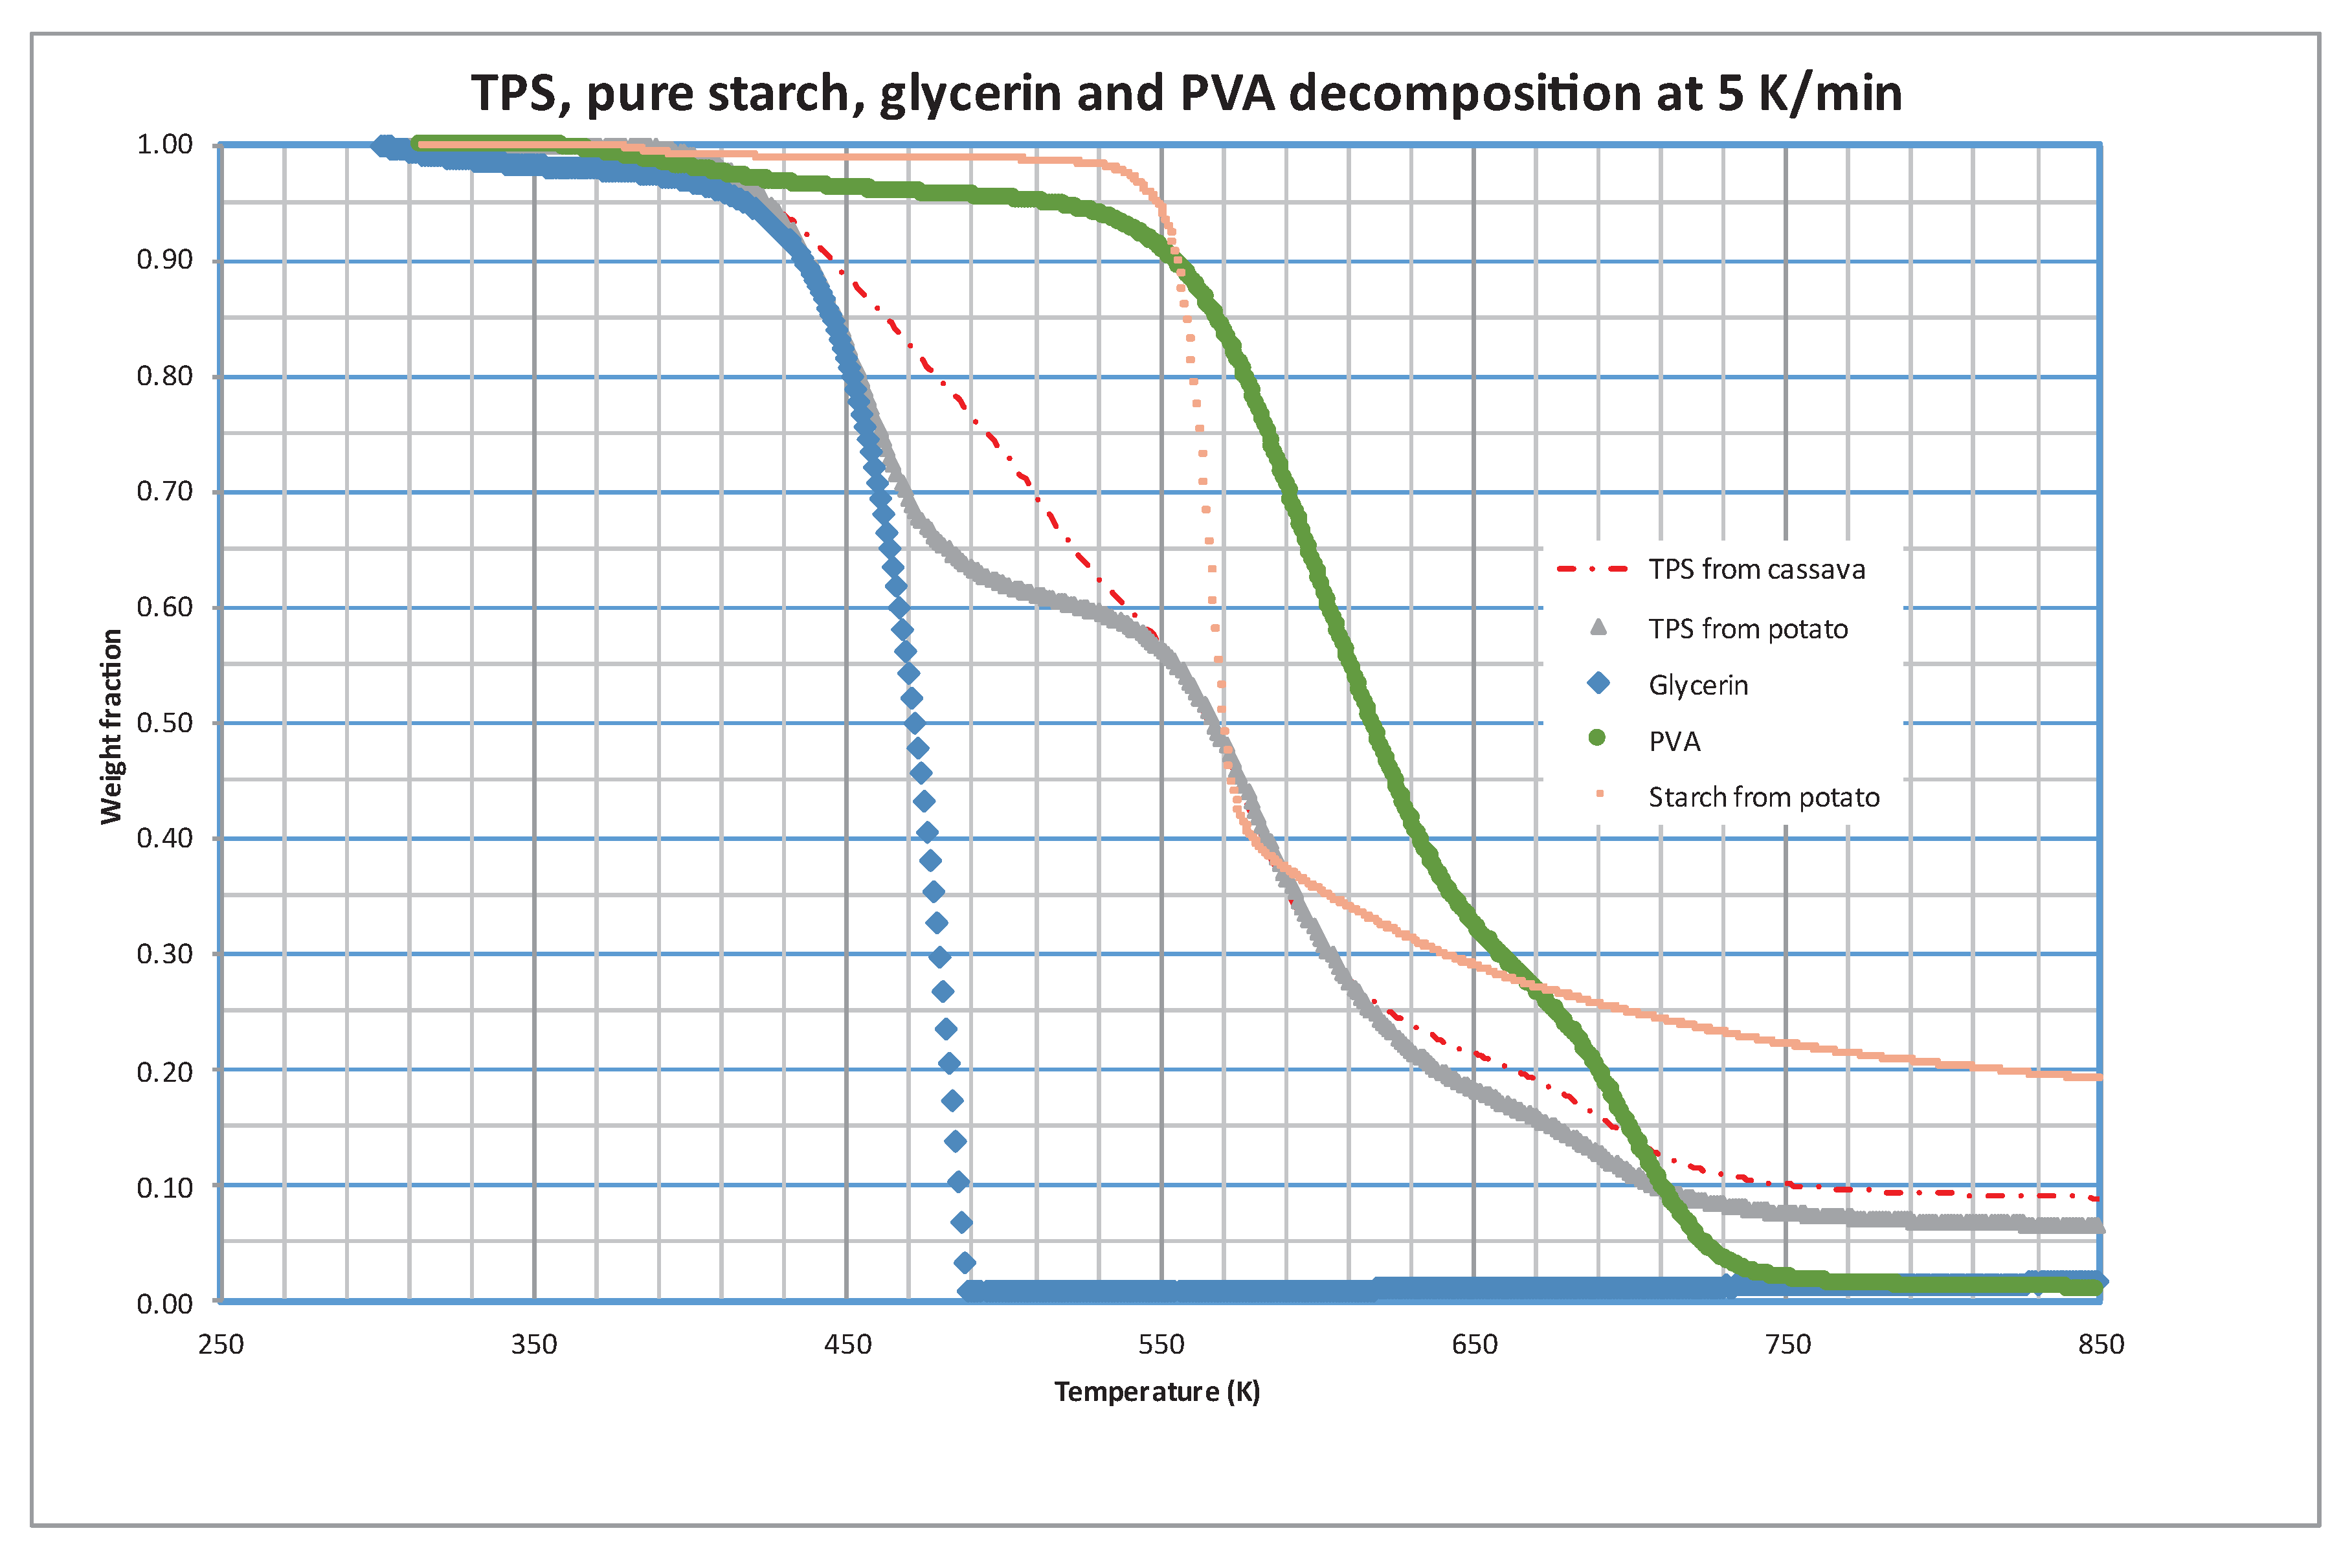
In order to elucidate the possible composition of these fractions, runs were performed using the different components of the TPS separately. Potato starch, PVA, and glycerin were subjected to pyrolytic decomposition at three heating rates, representing the TPS composition.
Figure 4 displays the results at 5 K/min, with the decomposition of TPS made from cassava starch included for comparison. It is evident that the initial loss of volatiles from TPS aligns closely with the decomposition of glycerin. The second peak in TPS decomposition can largely be attributed to starch decomposition, while PVA decomposition occurs over a broad temperature range (approximately 450-750 K), overlapping with the evolution of other fractions.
As previously mentioned, Sin et al., 2011 observed significant interaction between PVA and cassava starch. In our study, we also observed this interaction; however, it was not evident between PVA and potato starch. These results suggest that this interaction may not be as effective when using potato starch.
The decomposition of the components of the TPS were also tested for kinetic study. The following
Table 3 shows the results of the optimized parameters. Note that only two fractions (i=2) were necessary to explain the decomposition of pure starch, PVA and glycerin. In all cases, three heating rates (5, 10 and 20 K/min) were simultaneously fitted. In the case of glycerin, almost only one fraction (s
10=0.98) is able to explain the decomposition. Curiously the decomposition of glycerin shows a zero-order kinetic behavior. This is typical for evaporation processes [
17]. Glycerin, a trihydric alcohol, and a common component in various industries, exhibits a remarkable physical characteristic at room temperature. With a melting point of approximately 18 ºC (291 K), glycerin defies the conventional solid-state expectations. Instead, it manifests itself as a near-liquid, underscoring its unique and versatile nature.
3.2. TPS with CaCO3 Adding
More than 8.5 billion euros are moved by the global market of fillers being calcium carbonate one of the most used by the plastic industry due to its low cost, high availability, non-toxicity, and good thermal stability – it is expected for this market to grow annually more than 5% until 2026 [
18]. It has been considered important to study the influence of this plastic additive in the bioplastic formulation. For this reason, TPS-PVA blends were prepared with identical formulations except for the weight percentage of calcium carbonate (CaCO
3) to be able to compare their behavior.
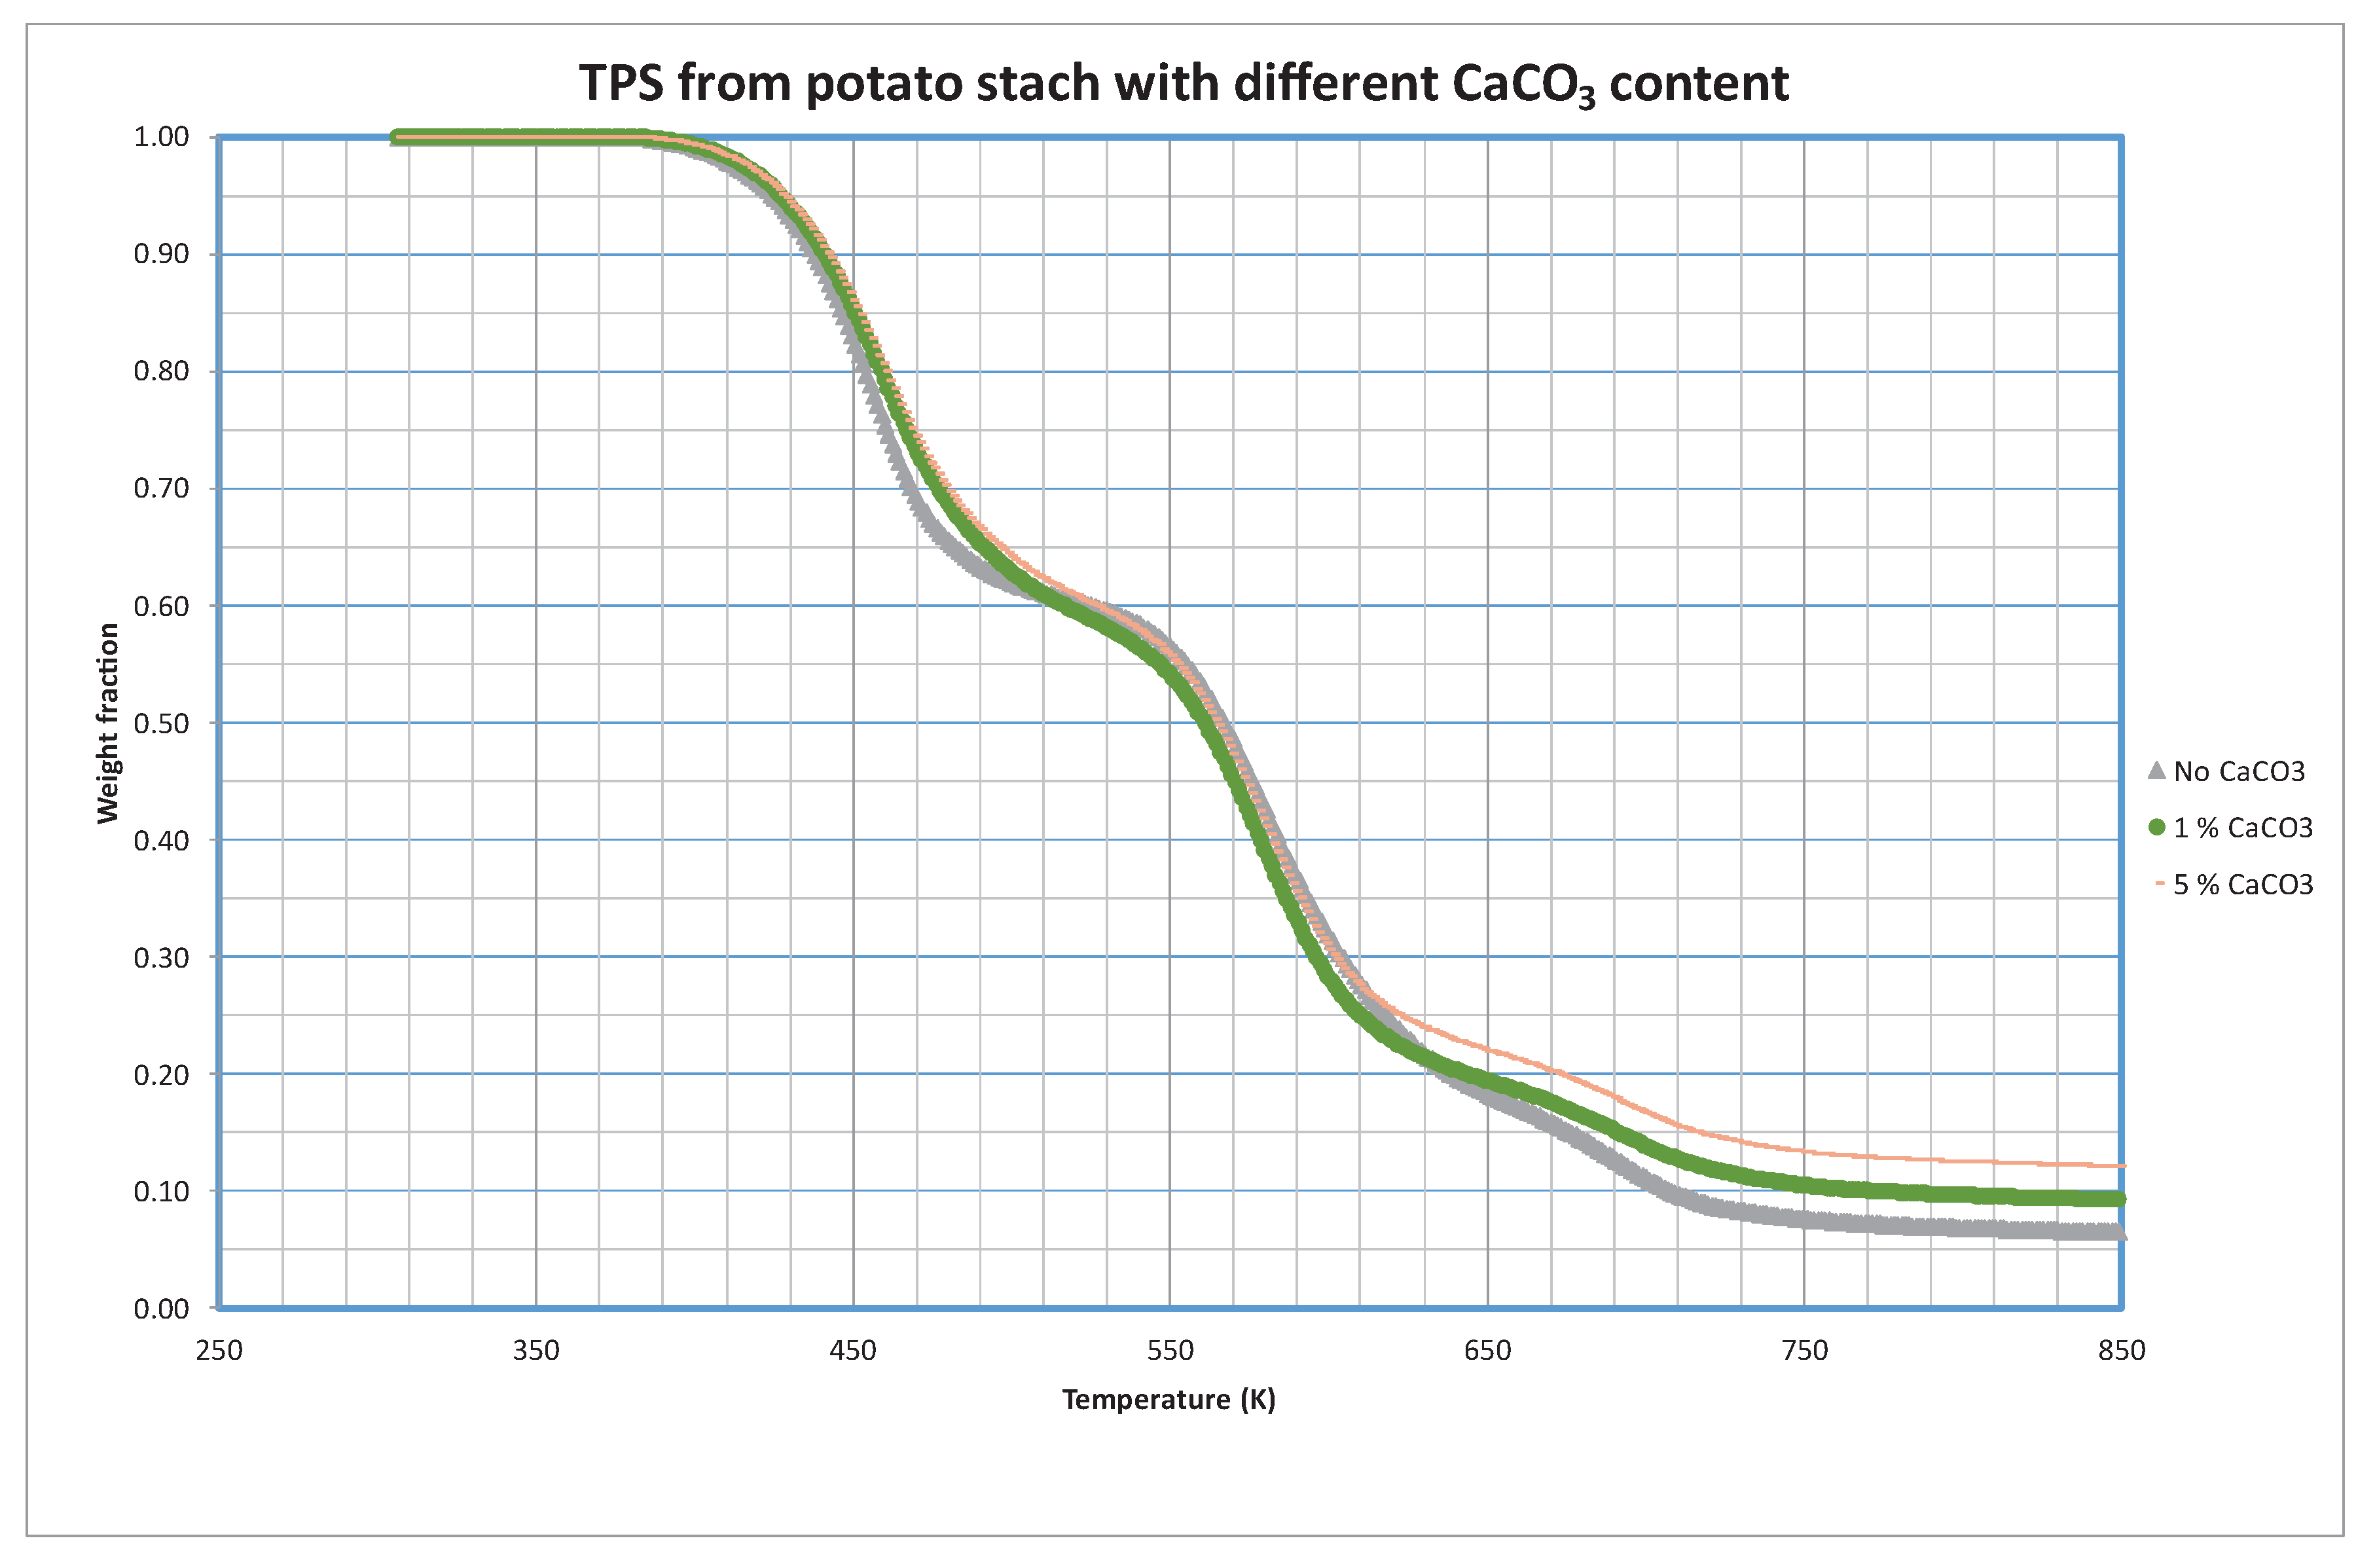
Analysis of the decomposition of the samples prepared with different CaCO
3 content is shown in
Figure 5. As in previous sections, only 5 K/min curves are shown although the complete set or curves can be found in
Supplementary Materials (
Figures S6 and S7).
An interesting aspect of the thermal response of TPS evolves when investigating the influence of inert fillers in pyrolytic conditions. Contrary to expectations, pyrolytic curves shown in
Figure 5 suggest that the presence of inert fillers has minimal impact on the decomposition kinetics of TPS. Under pyrolytic conditions, TPS seems to degrade independently of the inert fillers, maintaining its characteristic decomposition profile. This finding holds significant implications for the design and engineering of TPS-based materials, as it suggests a robust and predictable thermal behavior of TPS, regardless of the inert fillers incorporated.
3.3. PLA Decomposition
Another of the materials tested in the present study is PLA (poly-lactic acid), a material widely used in 3D impression devices. Its low melting point, eco-friendly nature, and compatibility with various printers make it a popular choice. PLA’s ease of use and safety during printing contribute to its widespread adoption in both hobbyist and professional settings.
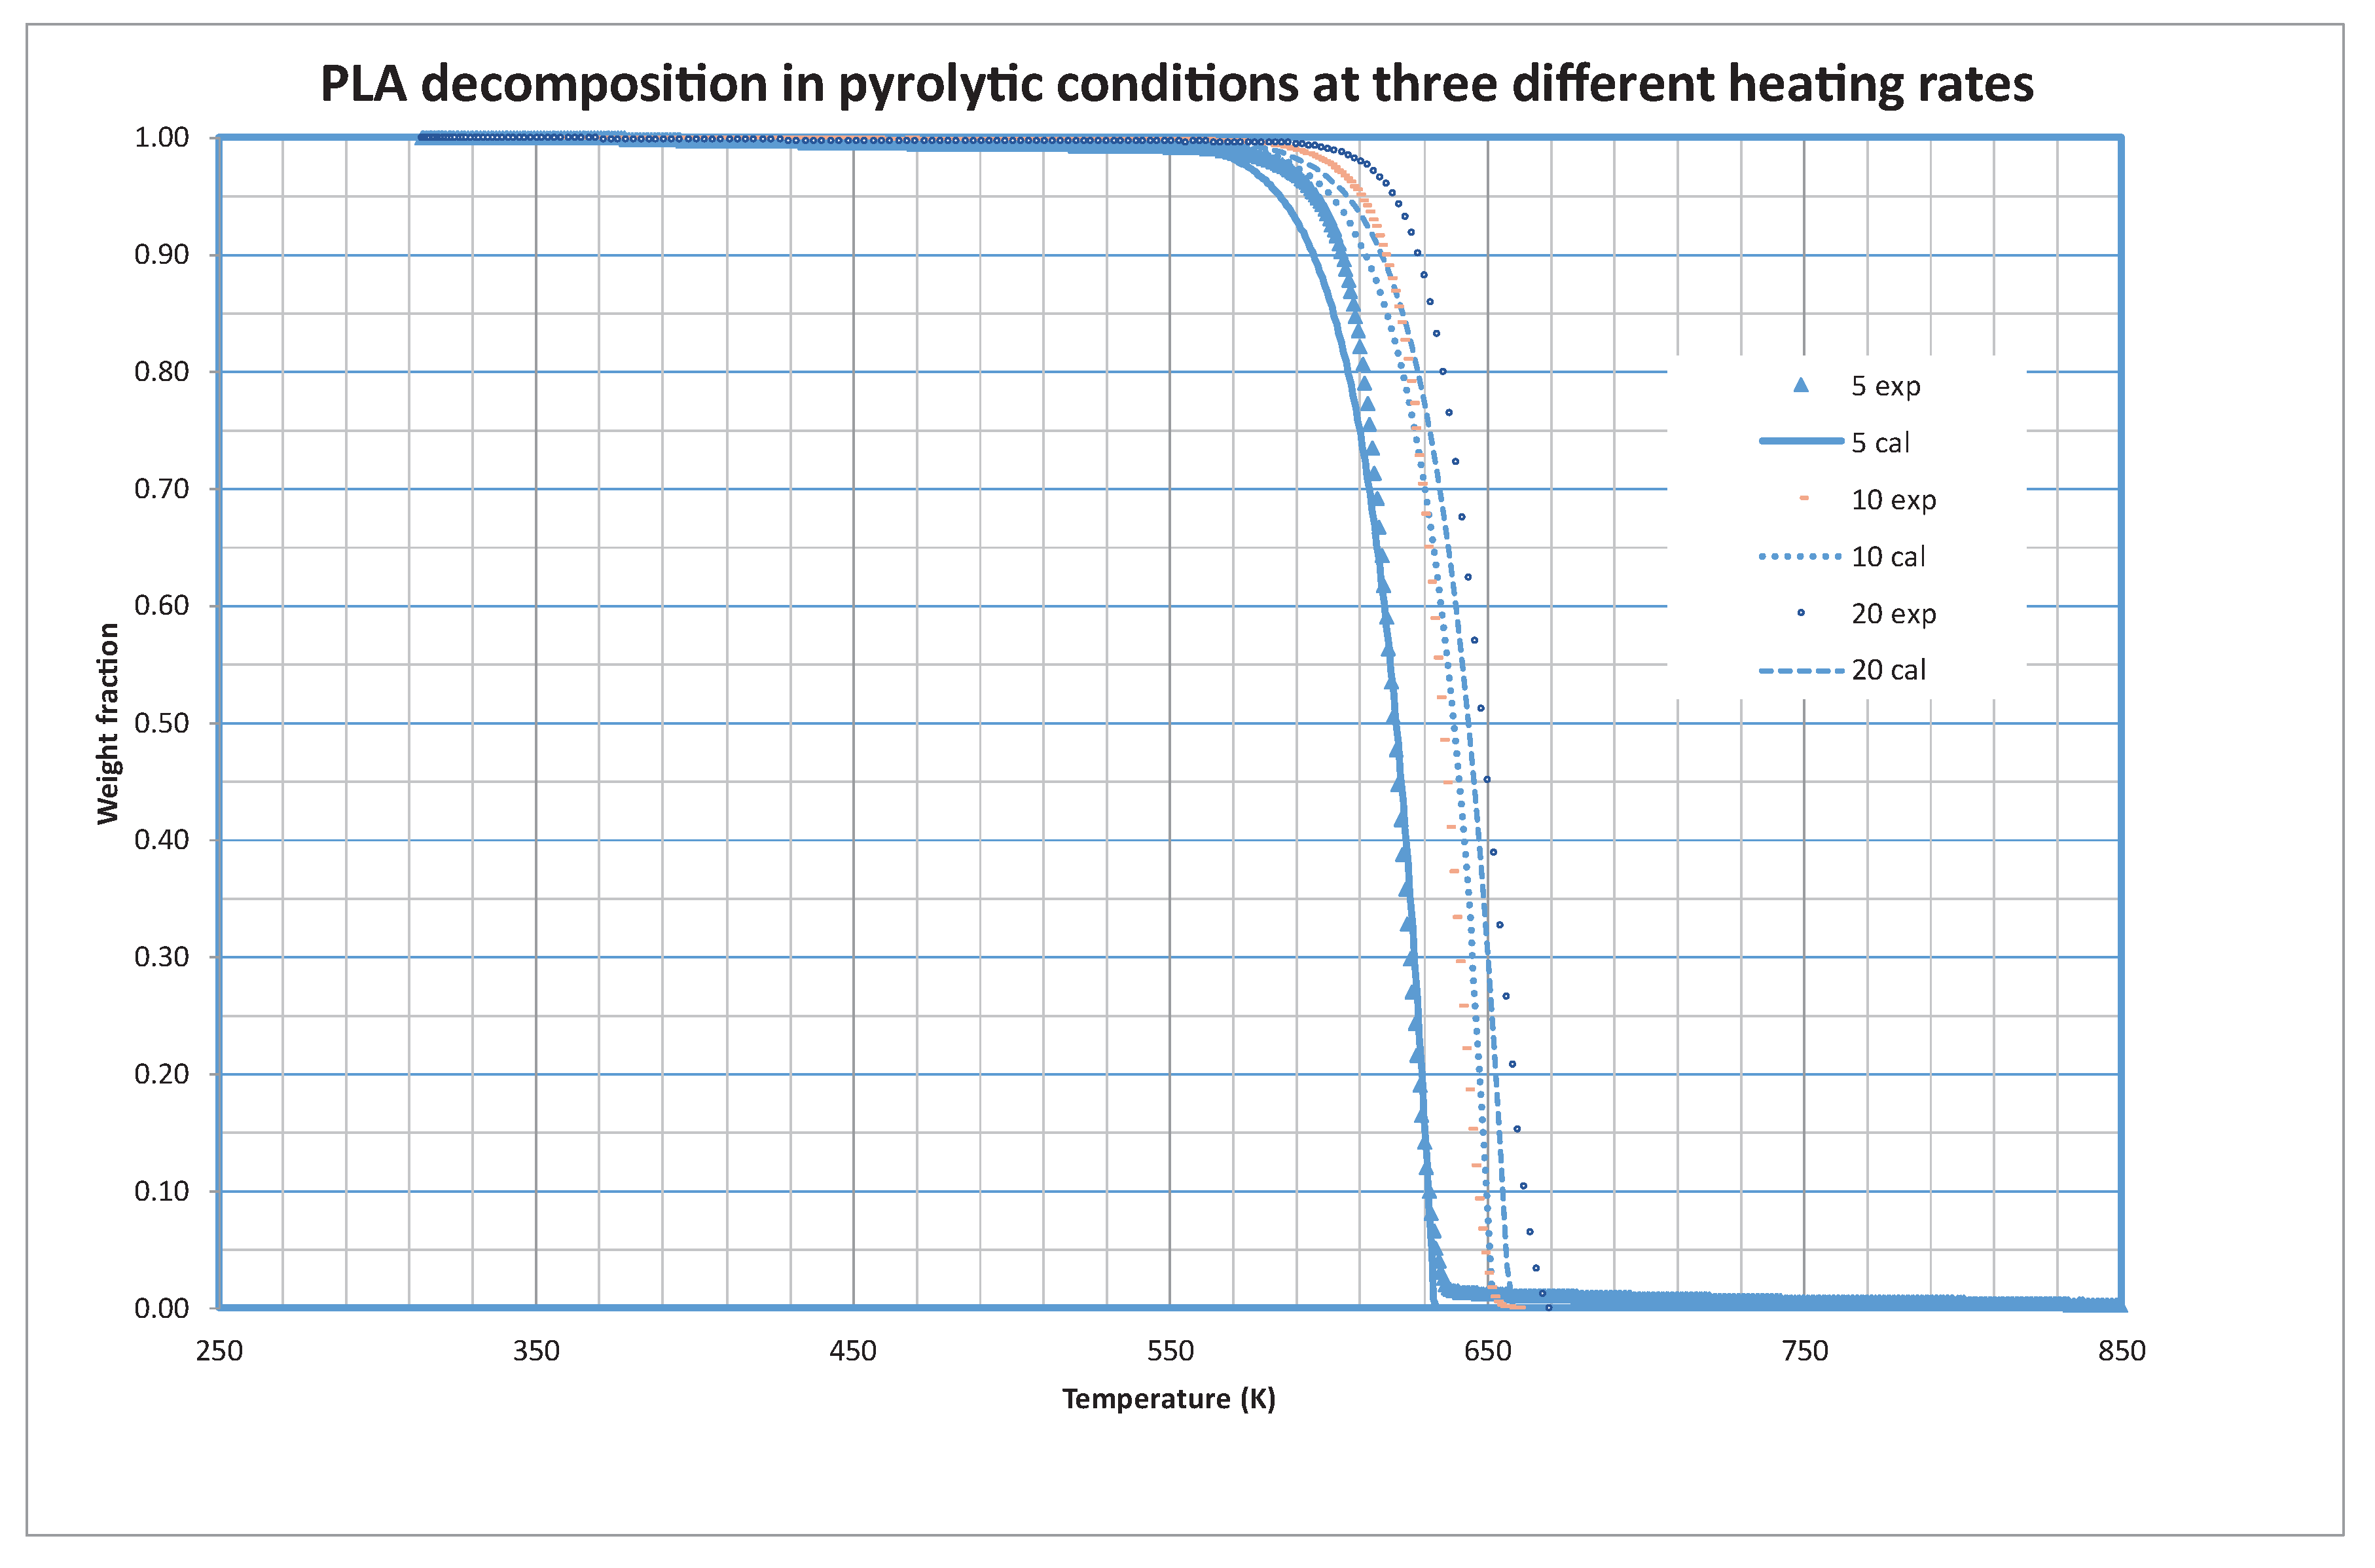
Figure 6 shows the experimental and calculated values of the weight fraction at the different heating rates. The optimized values of the kinetic constants reveal that it is only necessary to consider one (i=1) fraction for the decomposition of PLA. The optimized values of the constants are shown in
Table 4.
The thermal degradation of Polylactic Acid (PLA), a biodegradable and renewable polymer, is a process marked by its simplicity and efficiency. Unlike some polymers that undergo multi-step decomposition, PLA exhibits a notable characteristic—its decomposition takes place in a singular, well-defined step. This one-step degradation process is indicative of PLA’s inherent homogeneity and structural integrity. As PLA is subjected to elevated temperatures, it seamlessly undergoes depolymerization, transitioning from a complex macromolecular structure to simpler components without the need for intermediate stages. This unique attribute not only simplifies the understanding of PLA’s thermal behavior but also enhances its attractiveness in various applications, offering a streamlined approach to harnessing its eco-friendly properties in industries ranging from packaging to biomedical devices. The unequivocal single-step decomposition of PLA stands as a testament to its efficiency and lends itself to further exploration for sustainable material development.
Note that zero-order kinetics is also found for PLA decomposition. The pyrolytic decomposition of Polylactic Acid (PLA) introduces a fascinating dimension to its thermal behavior, as it unfolds in a liquid phase. Unlike traditional solid-state pyrolysis, PLA exhibits a distinctive transition into a liquid state during the decomposition process. This liquid-phase pyrolysis is a result of the specific chemical structure of PLA, which facilitates its transformation into a molten state under elevated temperatures. The remarkable characteristic of liquid-phase pyrolysis enhances the fluidity and mobility of PLA molecules during degradation, promoting efficient depolymerization. Understanding and harnessing this liquid-phase pyrolytic decomposition of PLA hold significant implications for optimizing processing conditions and tailoring end-product properties in various applications, spanning from the production of bio-based fuels to the design of advanced materials with tailored functionalities. This unique aspect of PLA’s pyrolysis opens new avenues for exploring and engineering sustainable materials with enhanced performance characteristics.
4. Conclusions
The thermal decomposition behavior of TPS blends and PLA, both bio-based plastics, along with some of their components, such as pure potato starch, PVA, and glycerin, has been investigated. Kinetic models were developed for pyrolysis at three different heating rates: 5 K/min, 10 K/min, and 20 K/min.
The analysis of TPS samples using various starch sources revealed that TPS made from potato starch decomposes at lower temperatures compared to other types of starch origin. All TPS samples exhibited three fractions, with the contribution of the last one to the overall weight being negligible. Further, by study the decomposition of individual components, it was found that the initial loss of volatile substances from TPS corresponds to the glycerin component, while the subsequent loss is attributed to starch decomposition.
Interestingly, the addition of CaCO3 as a filler to the TPS formulation did not result in a significant alteration of the decomposition profile. This suggests that the presence of CaCO3 has no substantial impact on the thermal degradation characteristics of TPS.
PLA demonstrated a unique, simple, and efficient one-step decomposition, indicating its homogeneity and structural integrity.
The findings presented in this article contribute valuable data for researchers, engineers, and industries striving to develop sustainable materials with enhanced thermal properties, acknowledging the distinct kinetic models governing the thermal decomposition of TPS and PLA.
Supplementary Materials
The following supporting information can be downloaded at the website of this paper posted on Preprints.org. Figure SM1. Pyrolysis of TPS from potato starch at three heating rates. Figure SM2. Pyrolysis of TPS from corn starch at three heating rates. Figure SM3. Pyrolysis of TPS from wheat starch at three heating rates. Figure SM4. Pyrolysis of TPS from rice starch at three heating rates. Figure SM5. Pyrolysis of TPS from cassava starch at three heating rates. Figure SM6. Pyrolysis of TPS from potato starch and 1 % CaCO3 adding at three heating rates. Figure SM7. Pyrolysis of TPS from potato starch and 5 % CaCO3 adding at three heating rates.
Author Contributions
Inés Oliver: Methodology, Writing – review & editing, Data curation, Investigation, Formal analysis. Juan A. Conesa: Conceptualization, Funding acquisition, Project administration, Supervision, Writing – original draft, Formal analysis. Andrés Fullana: Conceptualization, Funding acquisition, Project administration, Supervision, Writing – review & editing, Formal analysis.
Funding
This work was supported by the Agencia Estatal de Investigación (Spain) [grant number AEI/10.13039/501100011033], and by the Generalitat Valenciana [grant number PROMETEO CIPROM/2021/027/Generalitat Valenciana].
Institutional Review Board Statement
Not applicable.
Acknowledgments
This work was supported by the Agencia Estatal de Investigación (Spain) [grant number AEI/10.13039/501100011033], and by the Generalitat Valenciana [grant number PROMETEO CIPROM/2021/027/Generalitat Valenciana].
Conflicts of Interest
The authors declare no conflicts of interest.
References
- Guo, B.; Zha, D.; Li, B.; Yin, P.; Li, P. Polyvinyl Alcohol Microspheres Reinforced Thermoplastic Starch Composites. Materials 2018, 11. [Google Scholar] [CrossRef] [PubMed]
- Kaewtatip, K.; Thongmee, J. The Effects of Cross-Linked Starch on the Properties of Thermoplastic Starch. Mater Des 2013, 45, 586–589. [Google Scholar] [CrossRef]
- Karim, S.F.A.; Jai, J.; Hamid, K.H.K.; Norhisam, F.N. Thermal and Mechanical Properties of Polyethylene-Starch Based Film Incorporated with Crude Palm Oil. IOP Conf Ser Mater Sci Eng 2021, 1092, 012033. [Google Scholar] [CrossRef]
- Nguyen, D.M.; Vu, T.T.; Grillet, A.C.; Ha Thuc, H.; Ha Thuc, C.N. Effect of Organoclay on Morphology and Properties of Linear Low Density Polyethylene and Vietnamese Cassava Starch Biobased Blend. Carbohydr Polym 2016, 136, 163–170. [Google Scholar] [CrossRef] [PubMed]
- Sin, L.T.; Rahman, W.A.W.A.; Rahmat, A.R.; Mokhtar, M. Determination of Thermal Stability and Activation Energy of Polyvinyl Alcohol–Cassava Starch Blends. Carbohydr Polym 2011, 83, 303–305. [Google Scholar] [CrossRef]
- Domene-López, D.; Guillén, M.M.; Martin-Gullon, I.; García-Quesada, J.C.; Montalbán, M.G. Study of the Behavior of Biodegradable Starch/Polyvinyl Alcohol/Rosin Blends. Carbohydr Polym 2018, 202, 299–305. [Google Scholar] [CrossRef] [PubMed]
- Grønli, M.G.; Várhegyi, G.; Di Blasi, C. Thermogravimetric Analysis and Devolatilization Kinetics of Wood. Ind Eng Chem Res 2002, 41, 4201–4208. [Google Scholar] [CrossRef]
- Conesa, J.A. Chemical Reactor Design: Mathematical Modeling and Applications. Chemical Reactor Design: Mathematical Modeling and Applications 2019, 1–332. [Google Scholar] [CrossRef]
- Garrido, M.A.; Font, R.; Conesa, J.A. Kinetic Study and Thermal Decomposition Behavior of Viscoelastic Memory Foam. Energy Convers Manag 2016, 119. [Google Scholar] [CrossRef]
- Font, R.; Fullana, A.; Conesa, J. Kinetic Models for the Pyrolysis and Combustion of Two Types of Sewage Sludge. J Anal Appl Pyrolysis 2005, 74, 429–438. [Google Scholar] [CrossRef]
- Caballero, J.A.; Conesa, J.A. Mathematical Considerations for Nonisothermal Kinetics in Thermal Decomposition. J Anal Appl Pyrolysis 2005, 73, 85–100. [Google Scholar] [CrossRef]
- Conesa, J.A. Kinetics of Decomposition Measured Using Thermobalance. Fuel 2001, 80, 2123–2124. [Google Scholar] [CrossRef]
- Font, R.; Garcia-Cortes, A.N. Application of the Transition State Theory to the Pyrolysis of Biomass and Tars. J Anal Appl Pyrolysis 1995, 35(2), 249–258. [Google Scholar] [CrossRef]
- Sirohi, R.; Singh, S.; Tarafdar, A.; Reddy, N.B.P.; Negi, T.; Gaur, V.K.; Pandey, A.K.; Sindhu, R.; Madhavan, A.; Arun, K.B. Thermoplastic Starch. In Biomass, Biofuels, Biochemicals: Biodegradable Polymers and Composites - Process Engineering to Commercialization; Elsevier, 2021; pp. 31–49 ISBN 9780128218884.
- Bugnotti, D.; Dalle Vacche, S.; Esposito, L.H.; Callone, E.; Orsini, S.F.; Ceccato, R.; D’Arienzo, M.; Bongiovanni, R.; Dirè, S.; Vitale, A. Structure of Starch–Sepiolite Bio-Nanocomposites: Effect of Processing and Matrix–Filler Interactions. Polymers (Basel) 2023, 15. [Google Scholar] [CrossRef] [PubMed]
- Zhang, Y.; Rempel, C.; McLaren, D. Thermoplastic Starch. In Innovations in Food Packaging: Second Edition; Elsevier Ltd., 2013; pp. 391–412 ISBN 9780123946010.
- Conesa, J.A.; Fullana, A.; Font, R. Reactivity of Carbonaceous Materials Modified by Copper Chloride Addition. A Thermogravimetric Study; 2001.
- Santos, J.D.C.; Brites, P.; Martins, C.; Nunes, C.; Coimbra, M.A.; Ferreira, P.; Gonçalves, I. Starch Consolidation of Calcium Carbonate as a Tool to Develop Lightweight Fillers for LDPE-Based Plastics. Int J Biol Macromol 2023, 226, 1021–1030. [Google Scholar] [CrossRef] [PubMed]
|
Disclaimer/Publisher’s Note: The statements, opinions and data contained in all publications are solely those of the individual author(s) and contributor(s) and not of MDPI and/or the editor(s). MDPI and/or the editor(s) disclaim responsibility for any injury to people or property resulting from any ideas, methods, instructions or products referred to in the content. |
© 2024 by the authors. Licensee MDPI, Basel, Switzerland. This article is an open access article distributed under the terms and conditions of the Creative Commons Attribution (CC BY) license (http://creativecommons.org/licenses/by/4.0/).
