1. Introduction
Peripheral arterial disease (PAD) poses significant challenges due to its high risk of limb and tissue loss as well as cardiovascular events, particularly in cases of CLI [
1,
2]. Magnetic resonance angiography (MRA) is crucial in evaluating PAD, aiding treatment decision-making, and guiding revascularisation procedures. While MRA, especially CE-MRA, offers valuable insights, there is a growing need to extract more clinically relevant data to enhance patient management strategies. Test-bolus examinations, conducted before peripheral CE-MRA, present an opportunity to acquire additional insights into the cardiovascular status of patients with PAD [
3,
4,
5,
6]. There is an emphasis on assessing and reducing cardiac risk in individuals undergoing surgeries unrelated to cardiac issues [
7]. Most authors underscore the significance of diagnostic tools such as transthoracic echocardiography [
8], the American Society of Anesthesiologists (ASA) Physical Status Classification System [
9], and a variety of risk indices, including the revised cardiac risk index [
10], for the prediction and management of cardiovascular risks [
11,
12,
13,
14]. The critical role of preoperative cardiovascular examination in identifying patients susceptible to complications, for instance, those presenting with asymptomatic left ventricular dysfunction [
15] or diminished physical capacity [
16], is highlighted.
Additionally, some studies stress the importance of physical fitness and exercise capability [
17], quantified in metabolic equivalents (METs) [
18], in forecasting surgical outcomes and informing preoperative evaluations and planning.
Our retrospective study aims to bridge the gap by analysing data from test-bolus exams in patients with PAD, explicitly focusing on the TTP parameter and its correlation with various cardiac parameters. By correlating TTP with parameters such as ejection fraction (EF), ASA classification, Lee index, and MET score, this study seeks to contribute to risk stratification and inform decision-making regarding urgent interventions for CLI. Ultimately, the findings of this study could have implications for refining treatment approaches and improving outcomes in patients with PAD, particularly those at high risk of limb and tissue loss. This study explores the diagnostic value of test bolus injections in assessing specific cardiac function parameters and their potential clinical applicability. Test bolus data from previous studies are correlated retrospectively with established cardiac function parameters and evaluation scores to investigate this relationship.
2. Materials and Methods
2.1. Study Design
This retrospective study investigates the relationship between heart function and the delay in contrast agent test bolus or bolus arrival time measurements in MR angiographies. A data query was carried out at the Institute for Medical Informatics, Statistics, and Documentation. All MR angiographies conducted with contrast media were compiled into two tables from the clinic's documentation system. These lists were organised by the date of the examinations. A patient could appear multiple times in these lists if repeated examinations were performed at different times. The MRA examination that was closest to the time of the cardiac diagnostic test was selected for analysis. The collected data was categorised into three locations: extremities, trunk, and skull. Based on this list, screenings were conducted. Hereafter, the pseudonymised list with identification numbers is referred to as the "primary file," which can be found in Möller’s doctoral thesis [
19].
2.2. MRA Protocol for Test Bolus with Peak Determination
Here, the standardised procedure for an MRA, focusing on a test bolus injection for pelvic and leg vessels (referred to as "Step Angio"), is described as an example. Radiological technologists (RTs) execute the protocol for capturing the standardised MRA and, thus, the test bolus. Radiologists always consult with radiology technicians to make necessary adjustments to the procedure.
After establishing intravenous access and correctly positioning the patient in the MRI machine, the injection pump filled with contrast media is connected to the IV access. For CE-MRA, the "MEDRAD
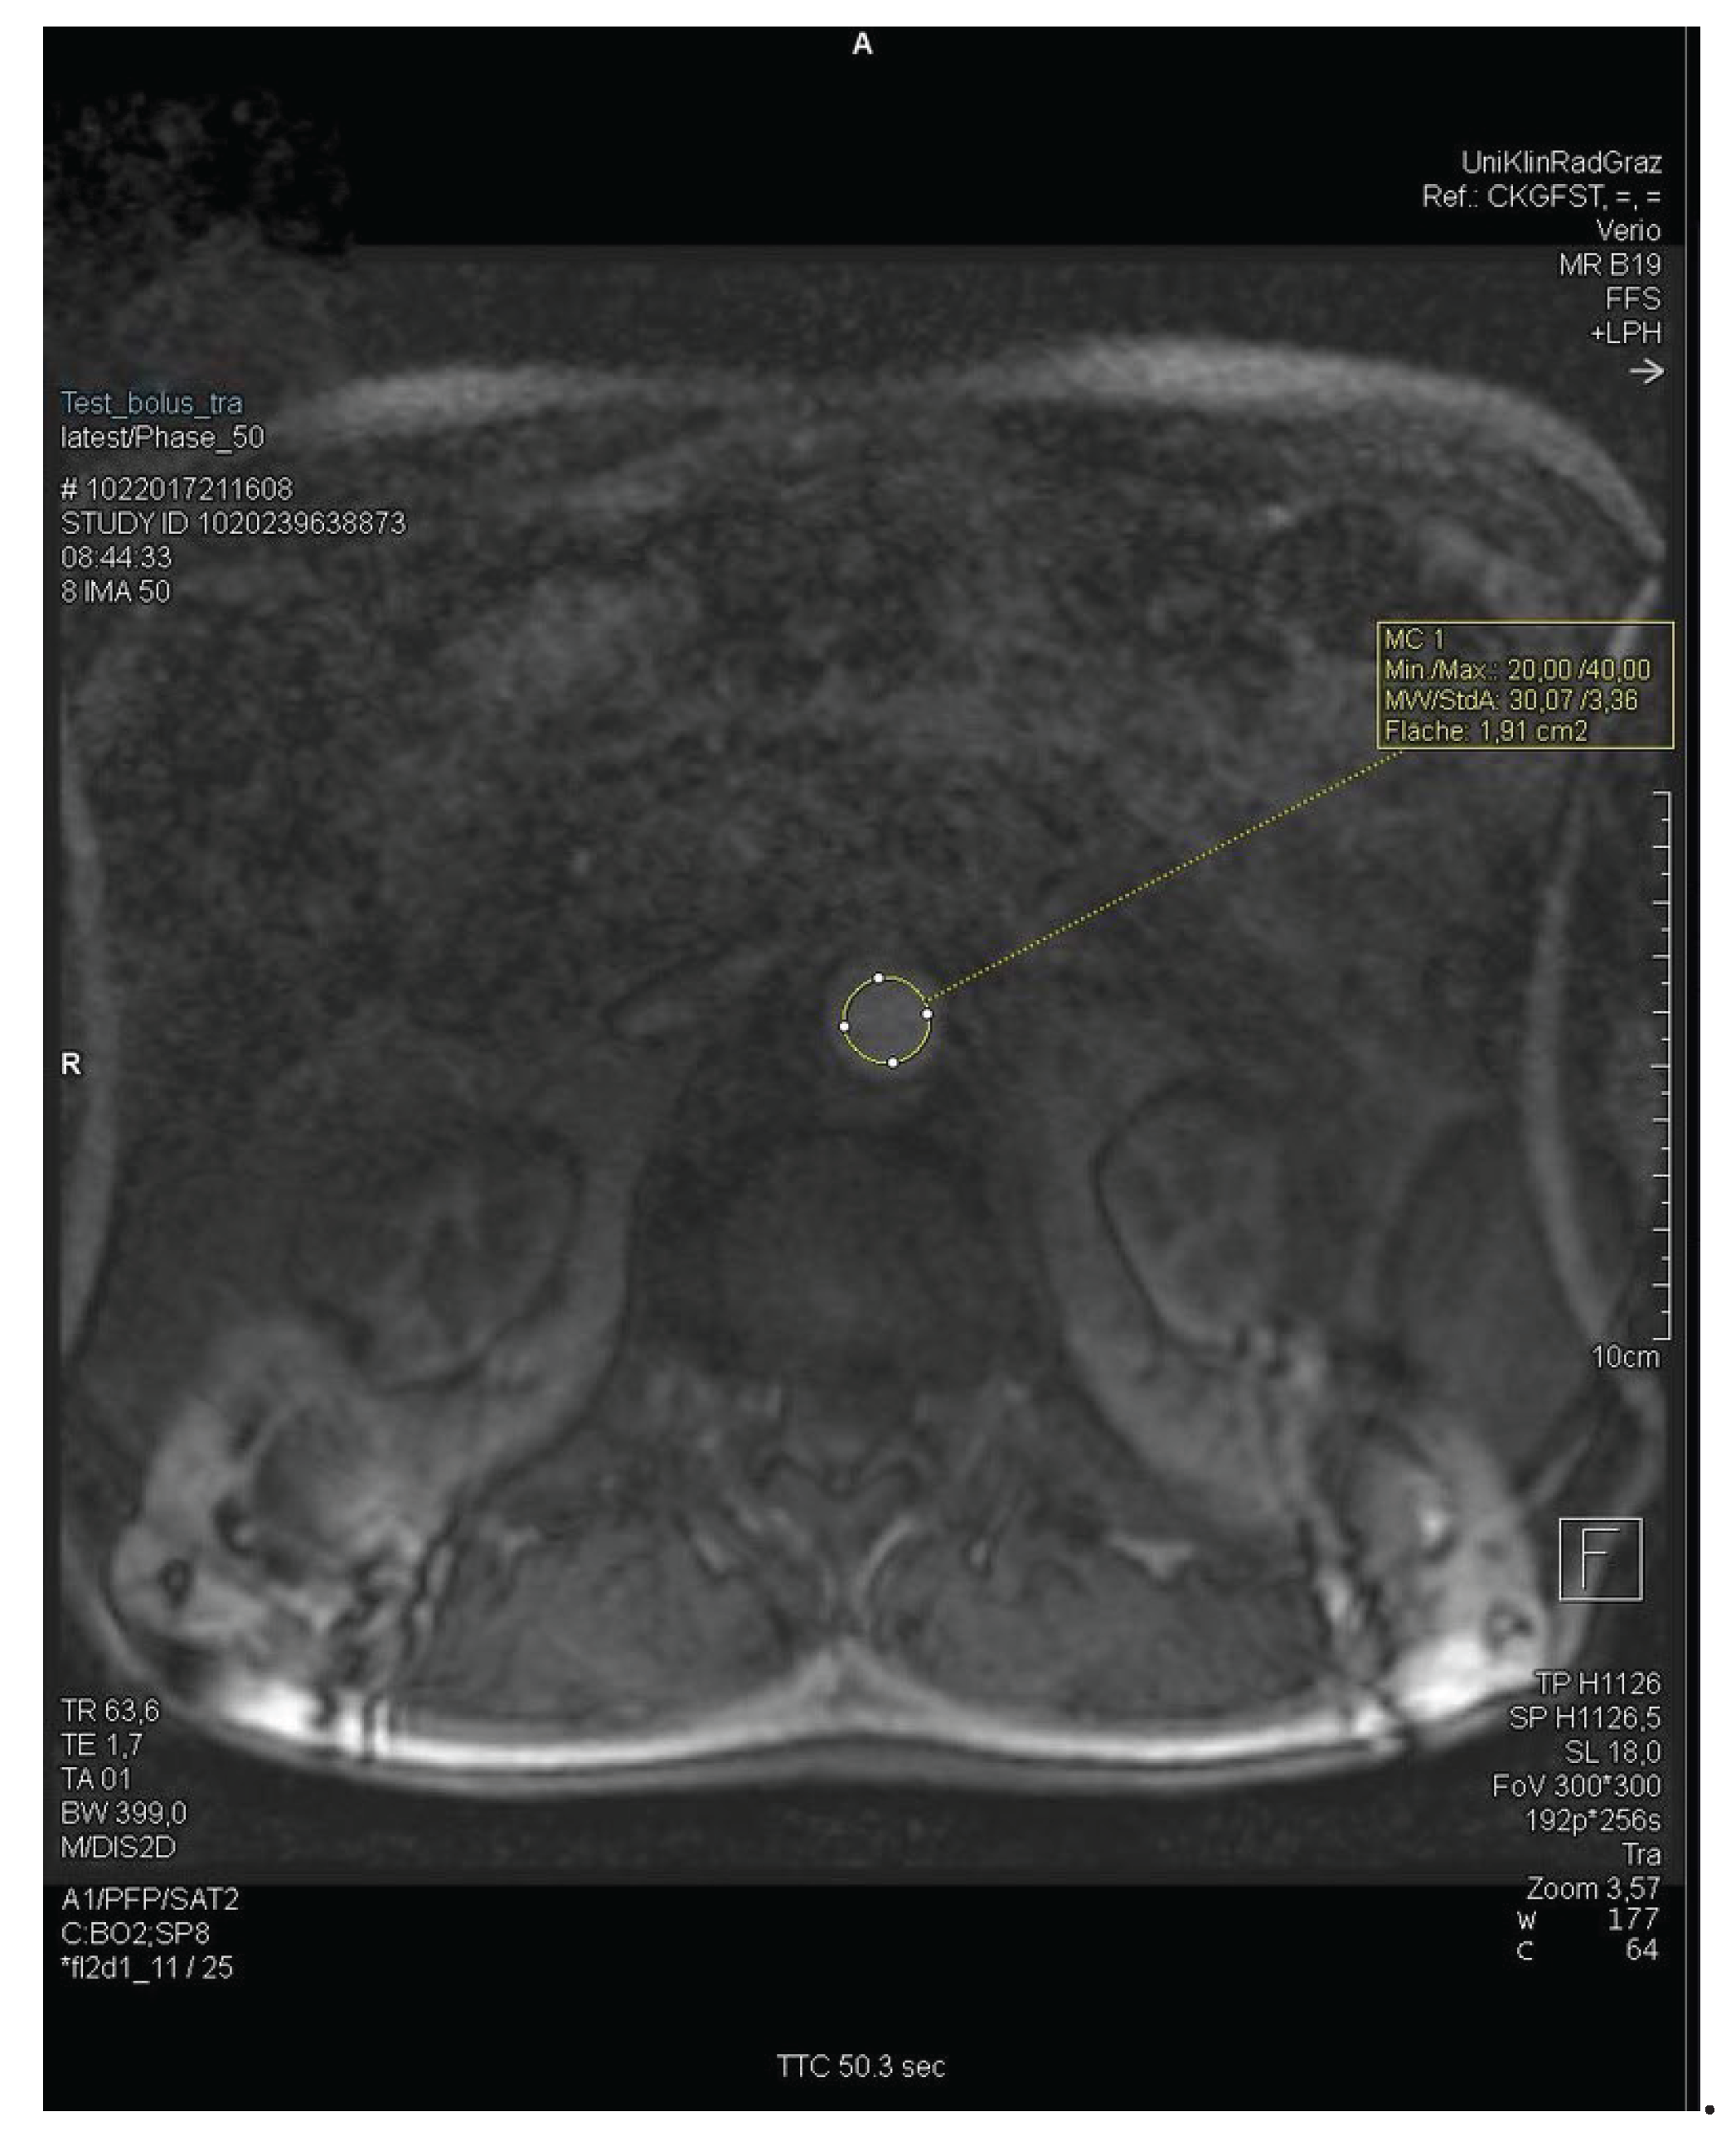
® MRXperion" injection pressure pump is used. Initial images are taken without contrast media for a preliminary overview of the body regions. The infusion pump is activated at a flow rate of 1.0 ml/s, 1.5 ml/s, or 2 ml/s, and simultaneously, a sequence of images from the abdominal aorta is captured every second. After 60 to 90 seconds, the image sequence capture is stopped. The ROI (region of interest) for determining the delay is located over the bifurcation of the abdominal aorta into the right and left common iliac arteries at the level of the kidneys or the branching of the renal arteries (
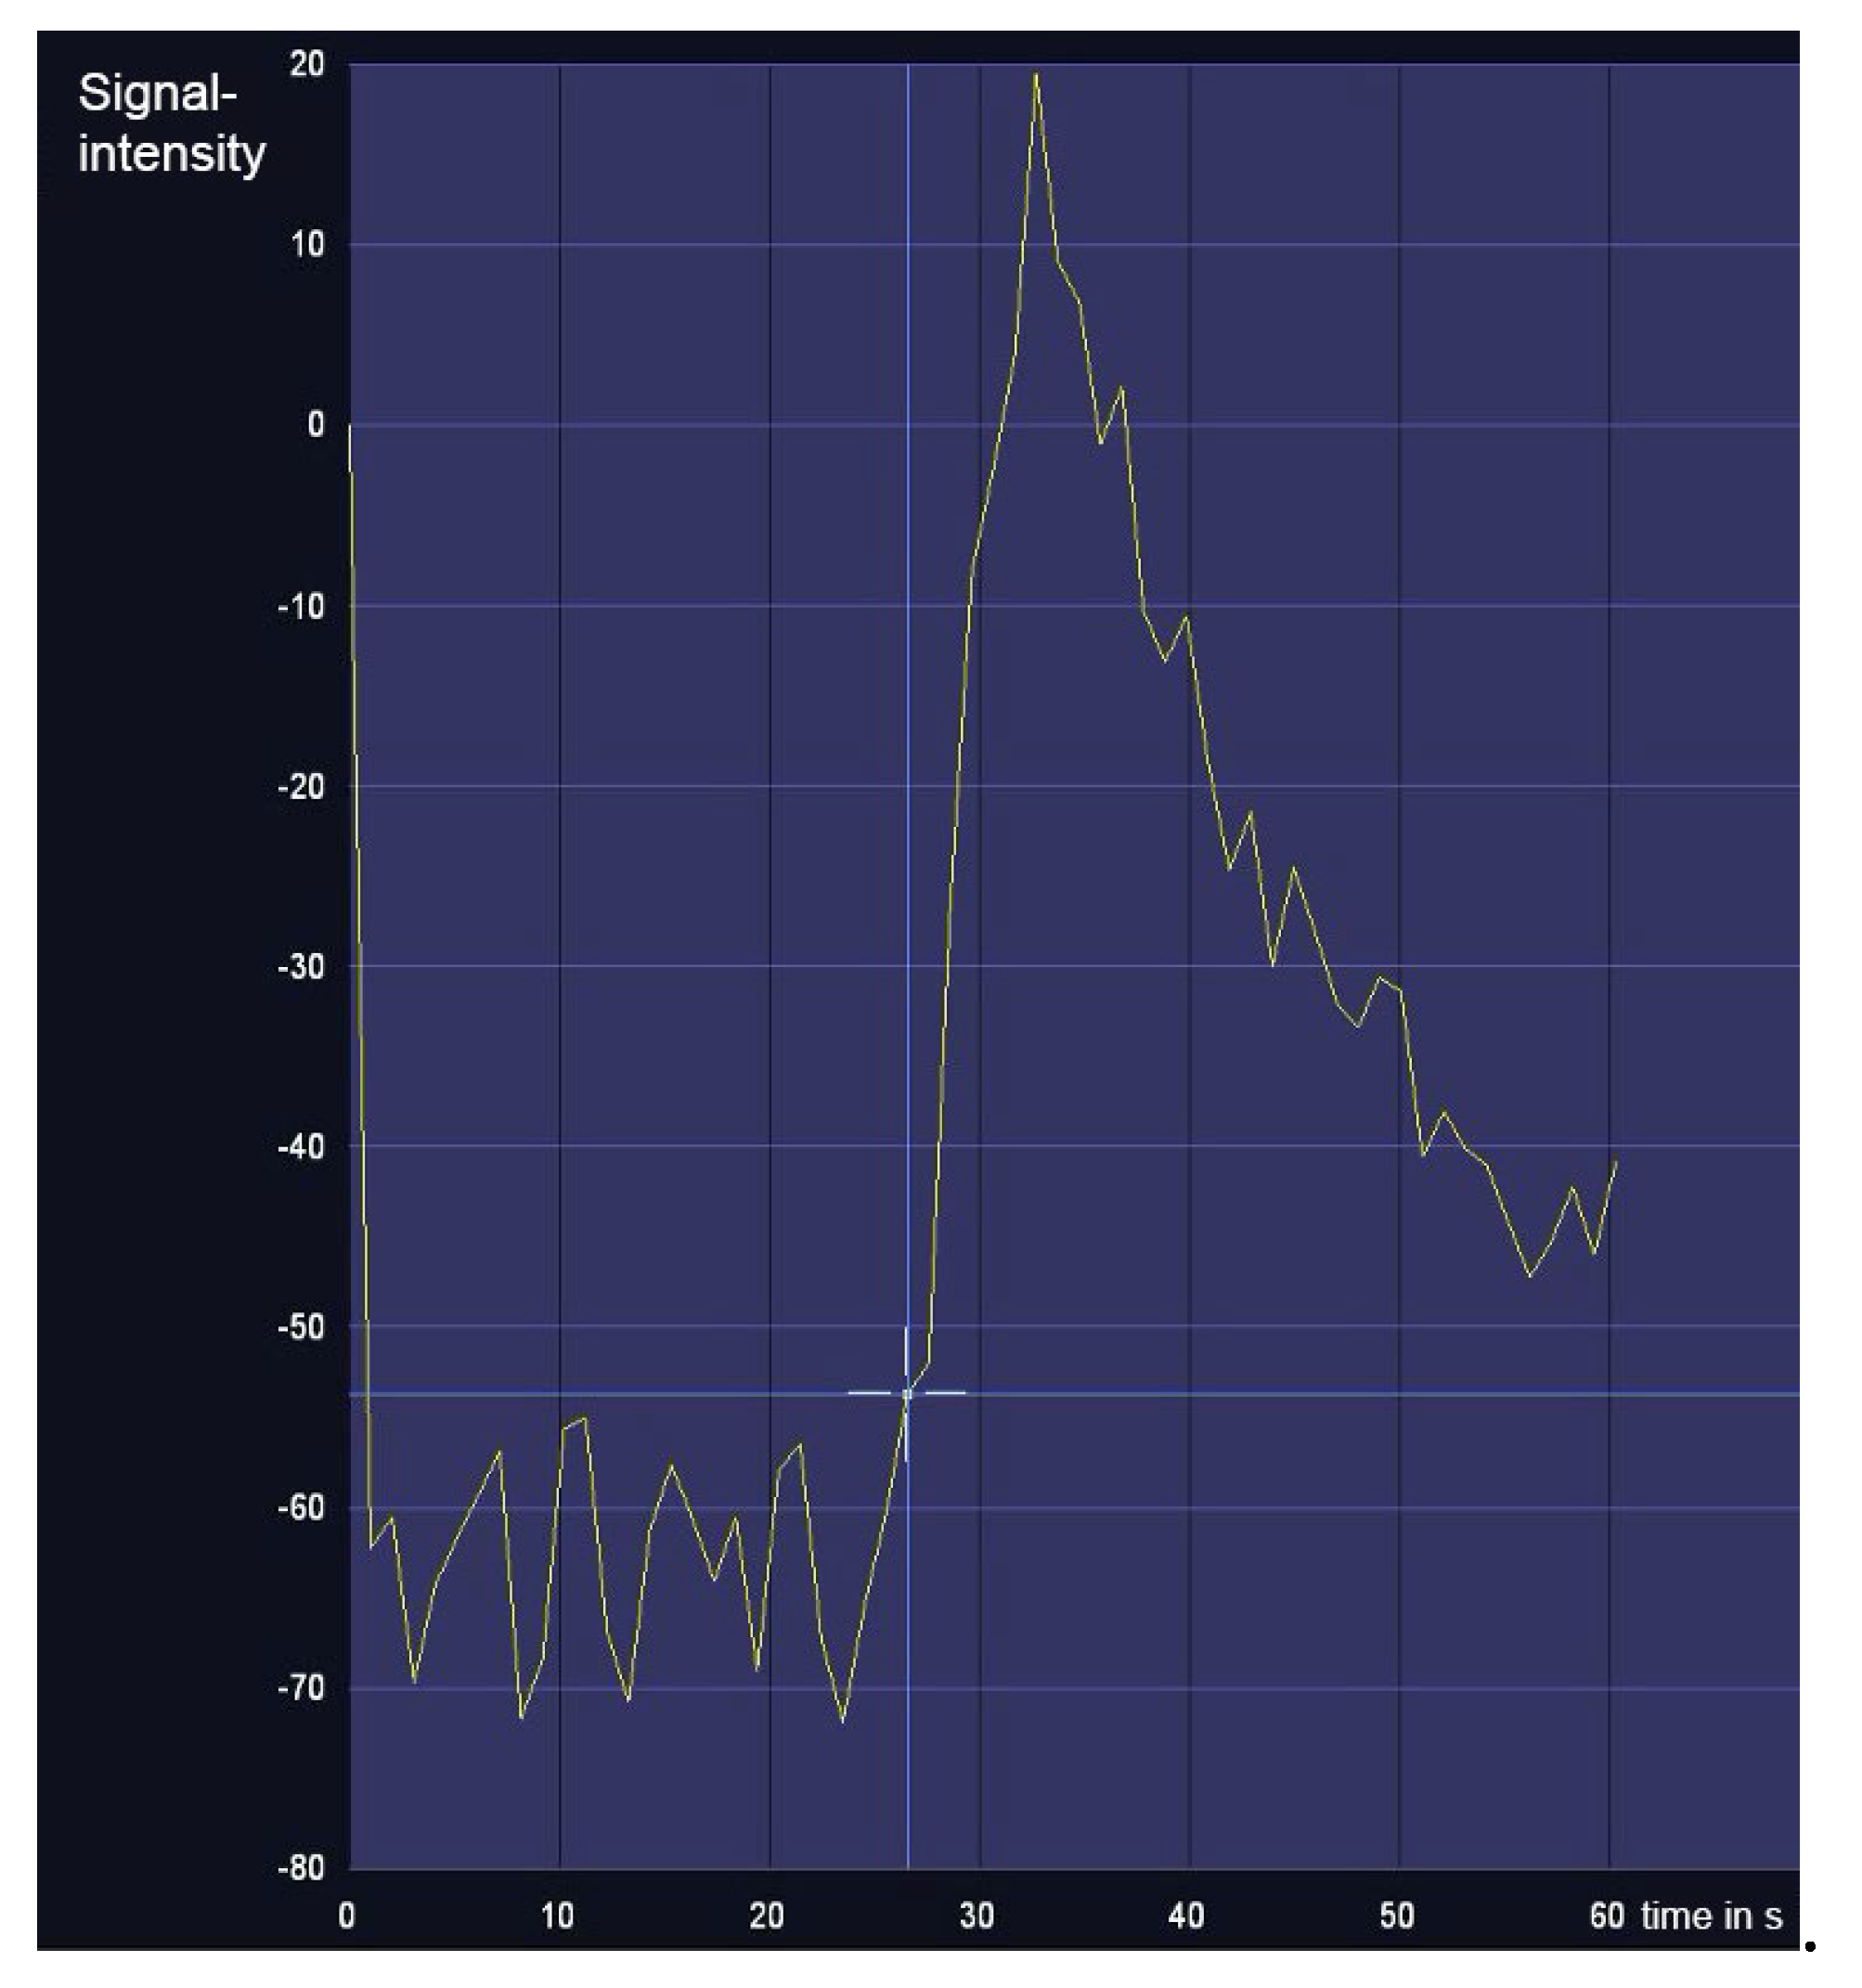
Figure 1). The resulting graph shows signal intensity's rise, peak, and fall over time (
Figure 2). The maximum signal intensity, defined as the TTP, is used as the delay time for the actual angiography. The TTP value is the peak measured by the graph.
The delay used for CE-MRA may differ slightly from the TTP, extended by a few seconds based on the radiology technicians experience, the desired angio sequence (e.g. centre of k-space), and the precise ROI. For instance, 2-3 extra seconds are often added to the TTP for older patients.
2.3. Screening
The primary lists from the Institute for Medical Informatics, Statistics, and Documentation were used for screening. Using the provided information, the patient's examination was in MEDOCS® and checked against inclusion and exclusion criteria. The inclusion criteria were limited to the availability of the source data, namely the test bolus delay and a cardiac examination with a documented EF (determined by cardiac ultrasound, cardiac MRI, or myocardial scintigraphy). The data collection was carried out regardless of age or gender. The radiology technicians documented the delay as part of the TTP measurement and delay determination in the protocol or entered MEDOCS®.
The primary cardiac parameter chosen was the EF. Other indices of heart function, such as the MET score, ASA classification, and Lee index, which are part of the preoperative anaesthesia assessment, were collected. The test bolus was stored as an image sequence, which could be evaluated in the subsequent data collection step. According to the exclusion criteria, patients who were under 18 years of age at the time of the examination or had experienced an acute deterioration of their condition between examinations were not included in the study. Pregnant women were also excluded. An acute decline of the condition refers to any event significantly affecting heart function, thus altering blood flow speed, leading to patient exclusion. Examples include a heart attack, reversible shock states, pulmonary oedema, recent stroke, and asthma attack.
2.4. Data collectionClassification according to defined ROI
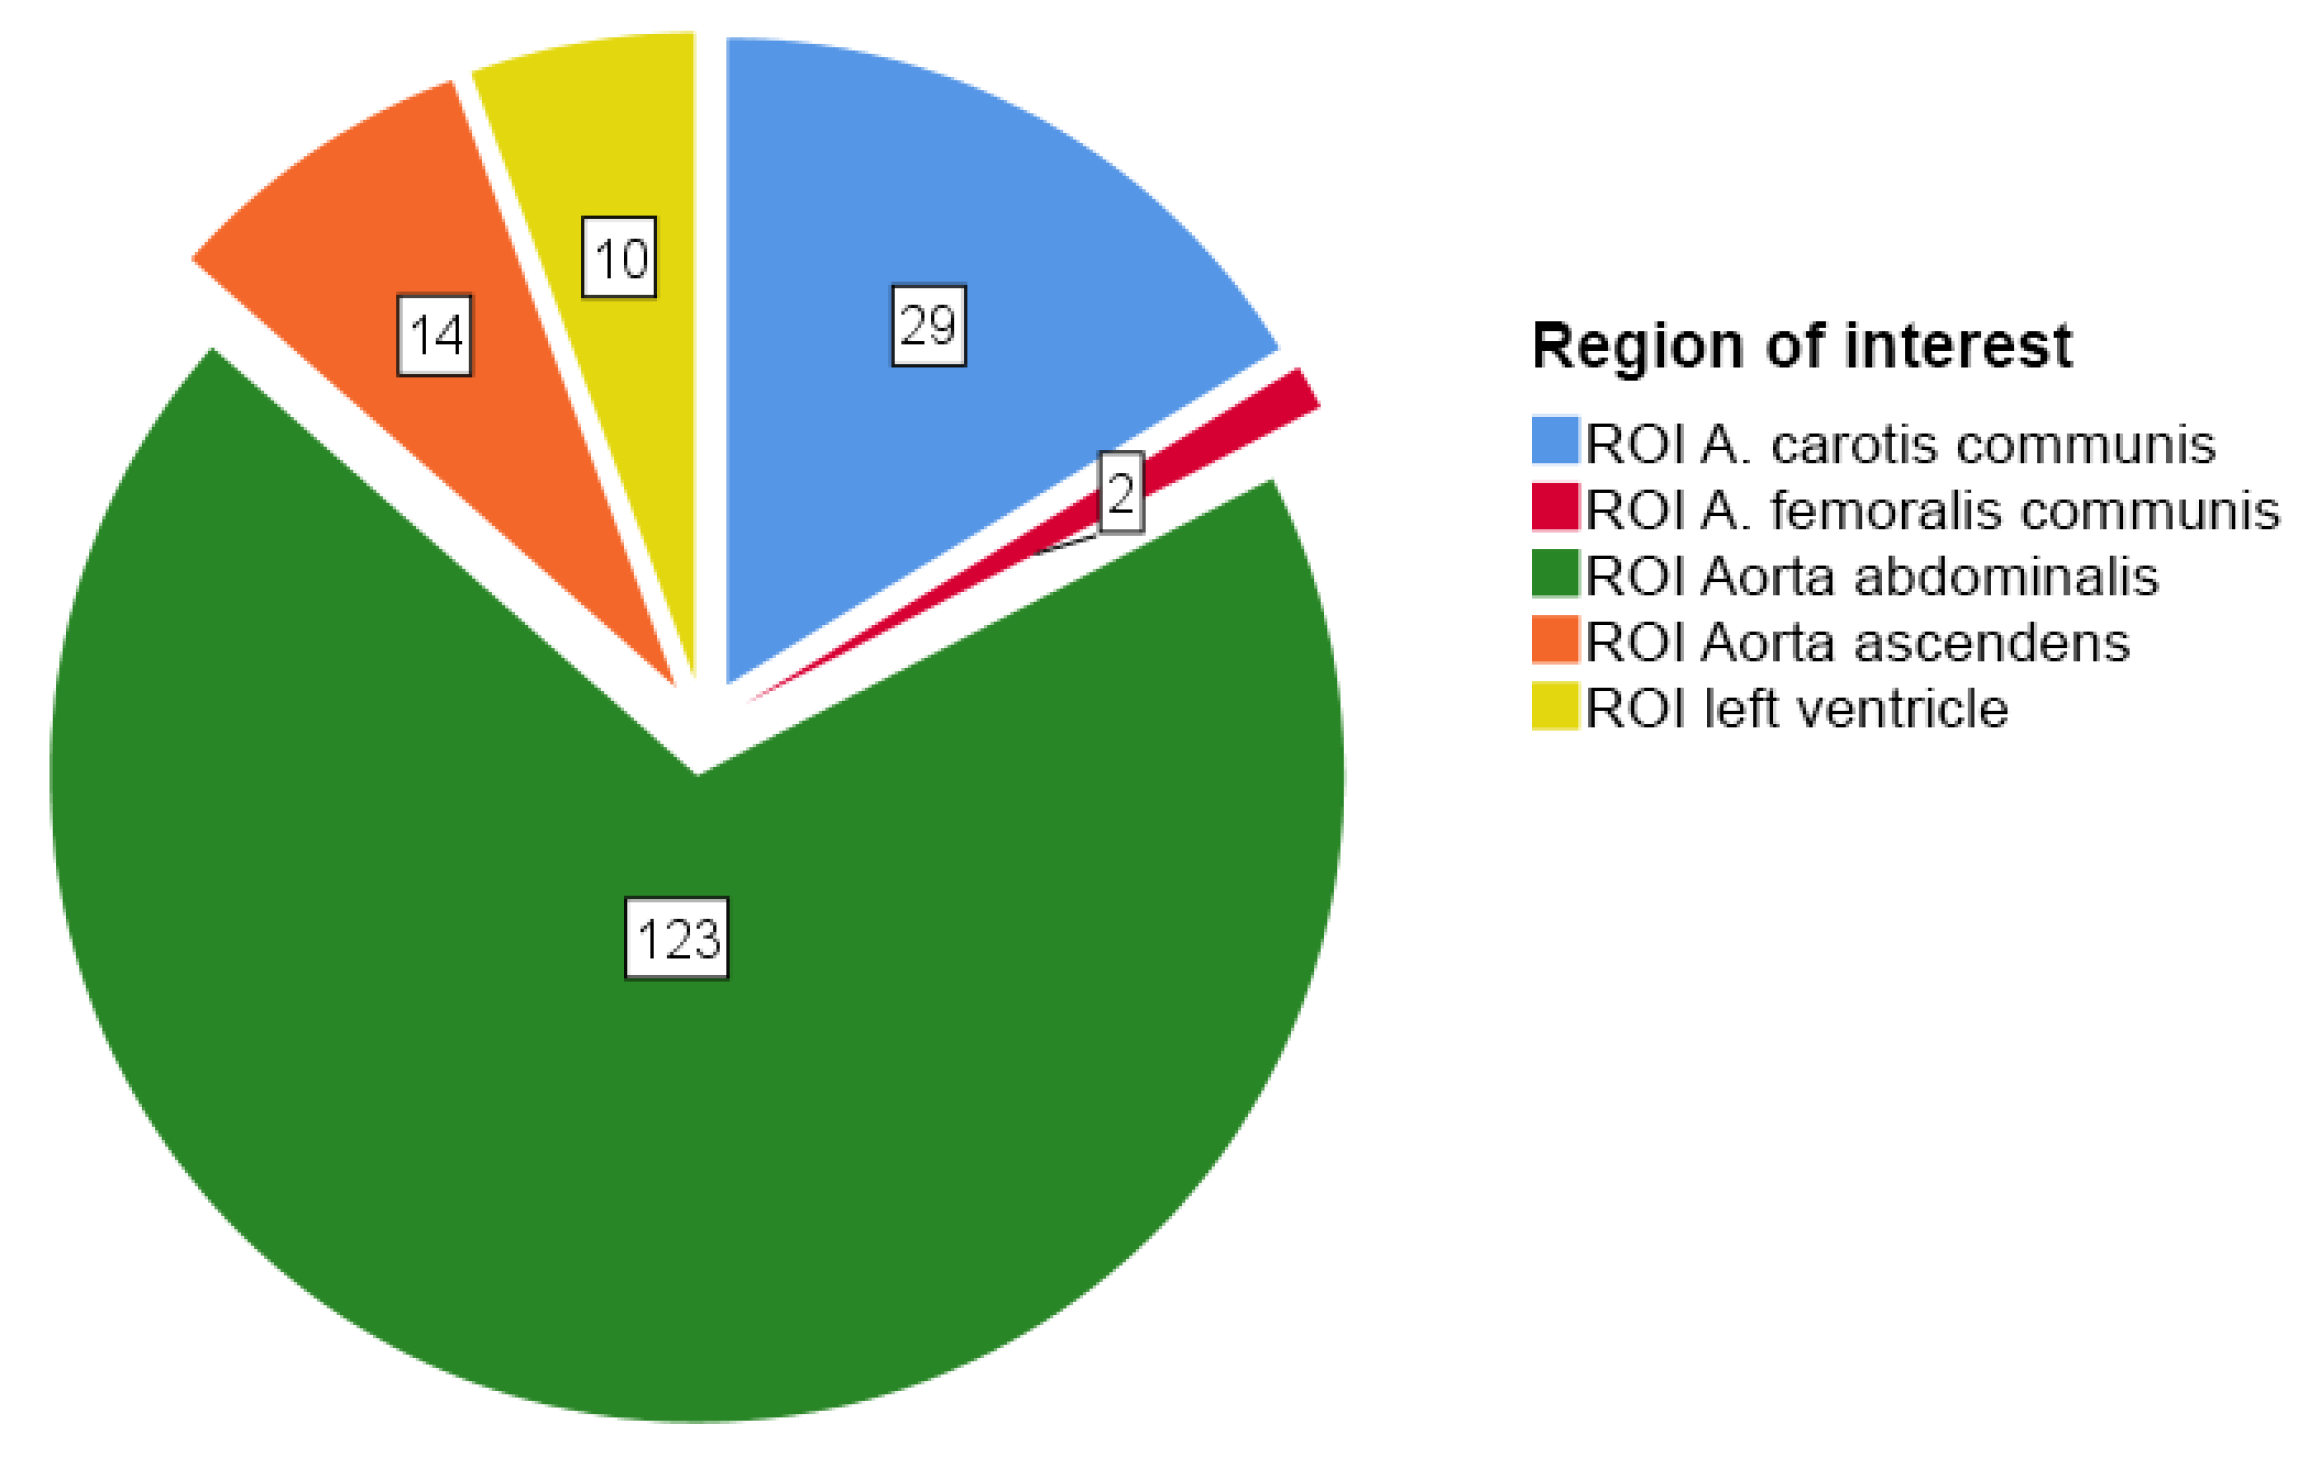
The required data of a given patient was extracted from the examination documents stored in MEDOCS® and syngo.via® workstation. If the same patient had undergone several MRA examinations, the examination with the shortest time between the MRA and the cardiac diagnosis was included in the study. The different examinations of the same patient are listed individually in the primary file. Personal information, such as age, gender, previous illnesses, and referral diagnosis, could be collected from the primary file and the examinations stored in MEDOCS®. All angiographies with different ROIs were summarised in the primary file. It was still being determined at the time which ROI would have the most frequent and accurate data. For this reason, several databases were created with the respective ROIs. Aorta abdominalis, A. carotis communis, Ao. ascendens, Arteria femoralis communis, and left ventricle. The abdominal aorta was included in the largest number of examinations, which is why the following detailed correlation analysis and evaluation are also limited to this region.
Test bolus and measurement
In MEDOCS
®, the delay was documented and recorded either in the documents of the radiology technicians or as part of the scanned protocols. If the test bolus was sent and saved as an image sequence with the MR images, the test bolus graph could also be analysed. The syngo.via
® workstation (Siemens
®) was used to analyse the TTP, full-width-half-maximum (FWHM) time, and the time the continuous signal increase began. For better readability, the start of the continuous signal rise is referred to below simply as "signal start." The height of the test bolus image sequence limited the plane of the ROI in the transverse section. For coronary sectioning, the ROI was set at the level of the kidneys and caudal to the renal arteries. An example of the ROI set in the abdominal aorta is shown here.
Figure 1 shows the ROI at the level of the kidneys due to the transverse plane.
The width of the graph calculates the FWHM time at half the height of the maximum amplitude. The value is calculated as follows:
FWHM = 31.7 - 23.5 = 8.2 seconds.
This value describes the width of the graph and has been used in publications for correlation calculations between the contrast agent transit time and the heart function [
20]. Unfortunately, the image sequence was not sent with every test bolus injection and delay determination. As a result, only test bolus graphs of about half (60 / 123 examinations) of the included examinations could be measured by the syngo.via
® workstation. For examinations with no image sequence available, we limited ourselves to the delay documented by the radiology technicians as the cycle time. In some test boli image sequences, the delay was so long that the graph only showed an increase. Therefore, the limited 60 seconds of the image sequence recording only allowed a limited measurement. This explains why the "start of signal" value was measured most frequently. At least the peak must be visible in the 60-second interval to calculate the TTP. The measurement of the FWHM requires a complete graph.
Selective collection of delay times from the primary file
To obtain an image of the test bolus delay times used at Graz University Hospital and the flow rates, bolus volumes, average value, normal value/median, distribution, and standard deviation used, delay times from the primary file were collected and analysed selectively and separately. This additional data was collected to determine a statistically more meaningful representation of the test bolus delay times used to increase the number of cases. This was limited to the ROI aorta abdominalis, where most examinations were found. In this case, no cardiac diagnostics were required. The standardised protocol of the radiologists and radiology technicians made it possible to determine the delay used, the flow rate in ml/s, bolus volume in ml, and the conduction region of the venous access.
Cardiac function parameters
Additional information on cardiac function was obtained from documented cardiac examinations. The most crucial secondary target parameter, EF could be determined by cardiac ultrasound examinations, myocardial scintigraphy, or cardiac MR examinations. During preoperative anaesthesia examinations, further information on exercise tolerance and, thus, cardiac function could be determined indirectly. The MET score (metabolic equivalent), ASA classification (suitability for surgery or risk and urgency of surgery), and the Revised Cardiac Risk Index (Lee Index), which have been routinely determined for several years, made it possible to collect the values. In addition, the days between the examinations (MRA & cardiac examination) were calculated and documented. From a cardiological point of view, the question arose as to the change in the delay in the (pre-)existence of an atrial fibrillation arrhythmia. This was also investigated.
2.5. Data analysis
The complete statistics (descriptive statistics, retrospective correlation analysis, and analysis of variance) were performed using SPSS. All graphs and diagrams were also created with this program.
3. Results
Of the total 1276 examinations, data of which is available [
19], 178 (14.0%) could be included in the study and categorised in the various ROIs (
Figure 3). 112 examinations (8.8%) had a time interval that was too long between the MRA and the cardiac examination. In 63 examinations (4.9%), no test bolus for the MRA was performed or documented. In 12 examinations (1.0%), renal angiograms were performed using a much shorter delay time because of k-space order of the sequence. In these cases, the documented delay does not represent the signal's peak during test bolus acquisition. It cannot be utilised. 2 patients (0.2%) were too young, and the condition deteriorated drastically between the examinations in another 2 (0.2%). Finally, the data for one examination (0.1%) was inaccessible. Most patients lacked cardiac diagnostics (71.0%, n=906) and could not be included in the study.
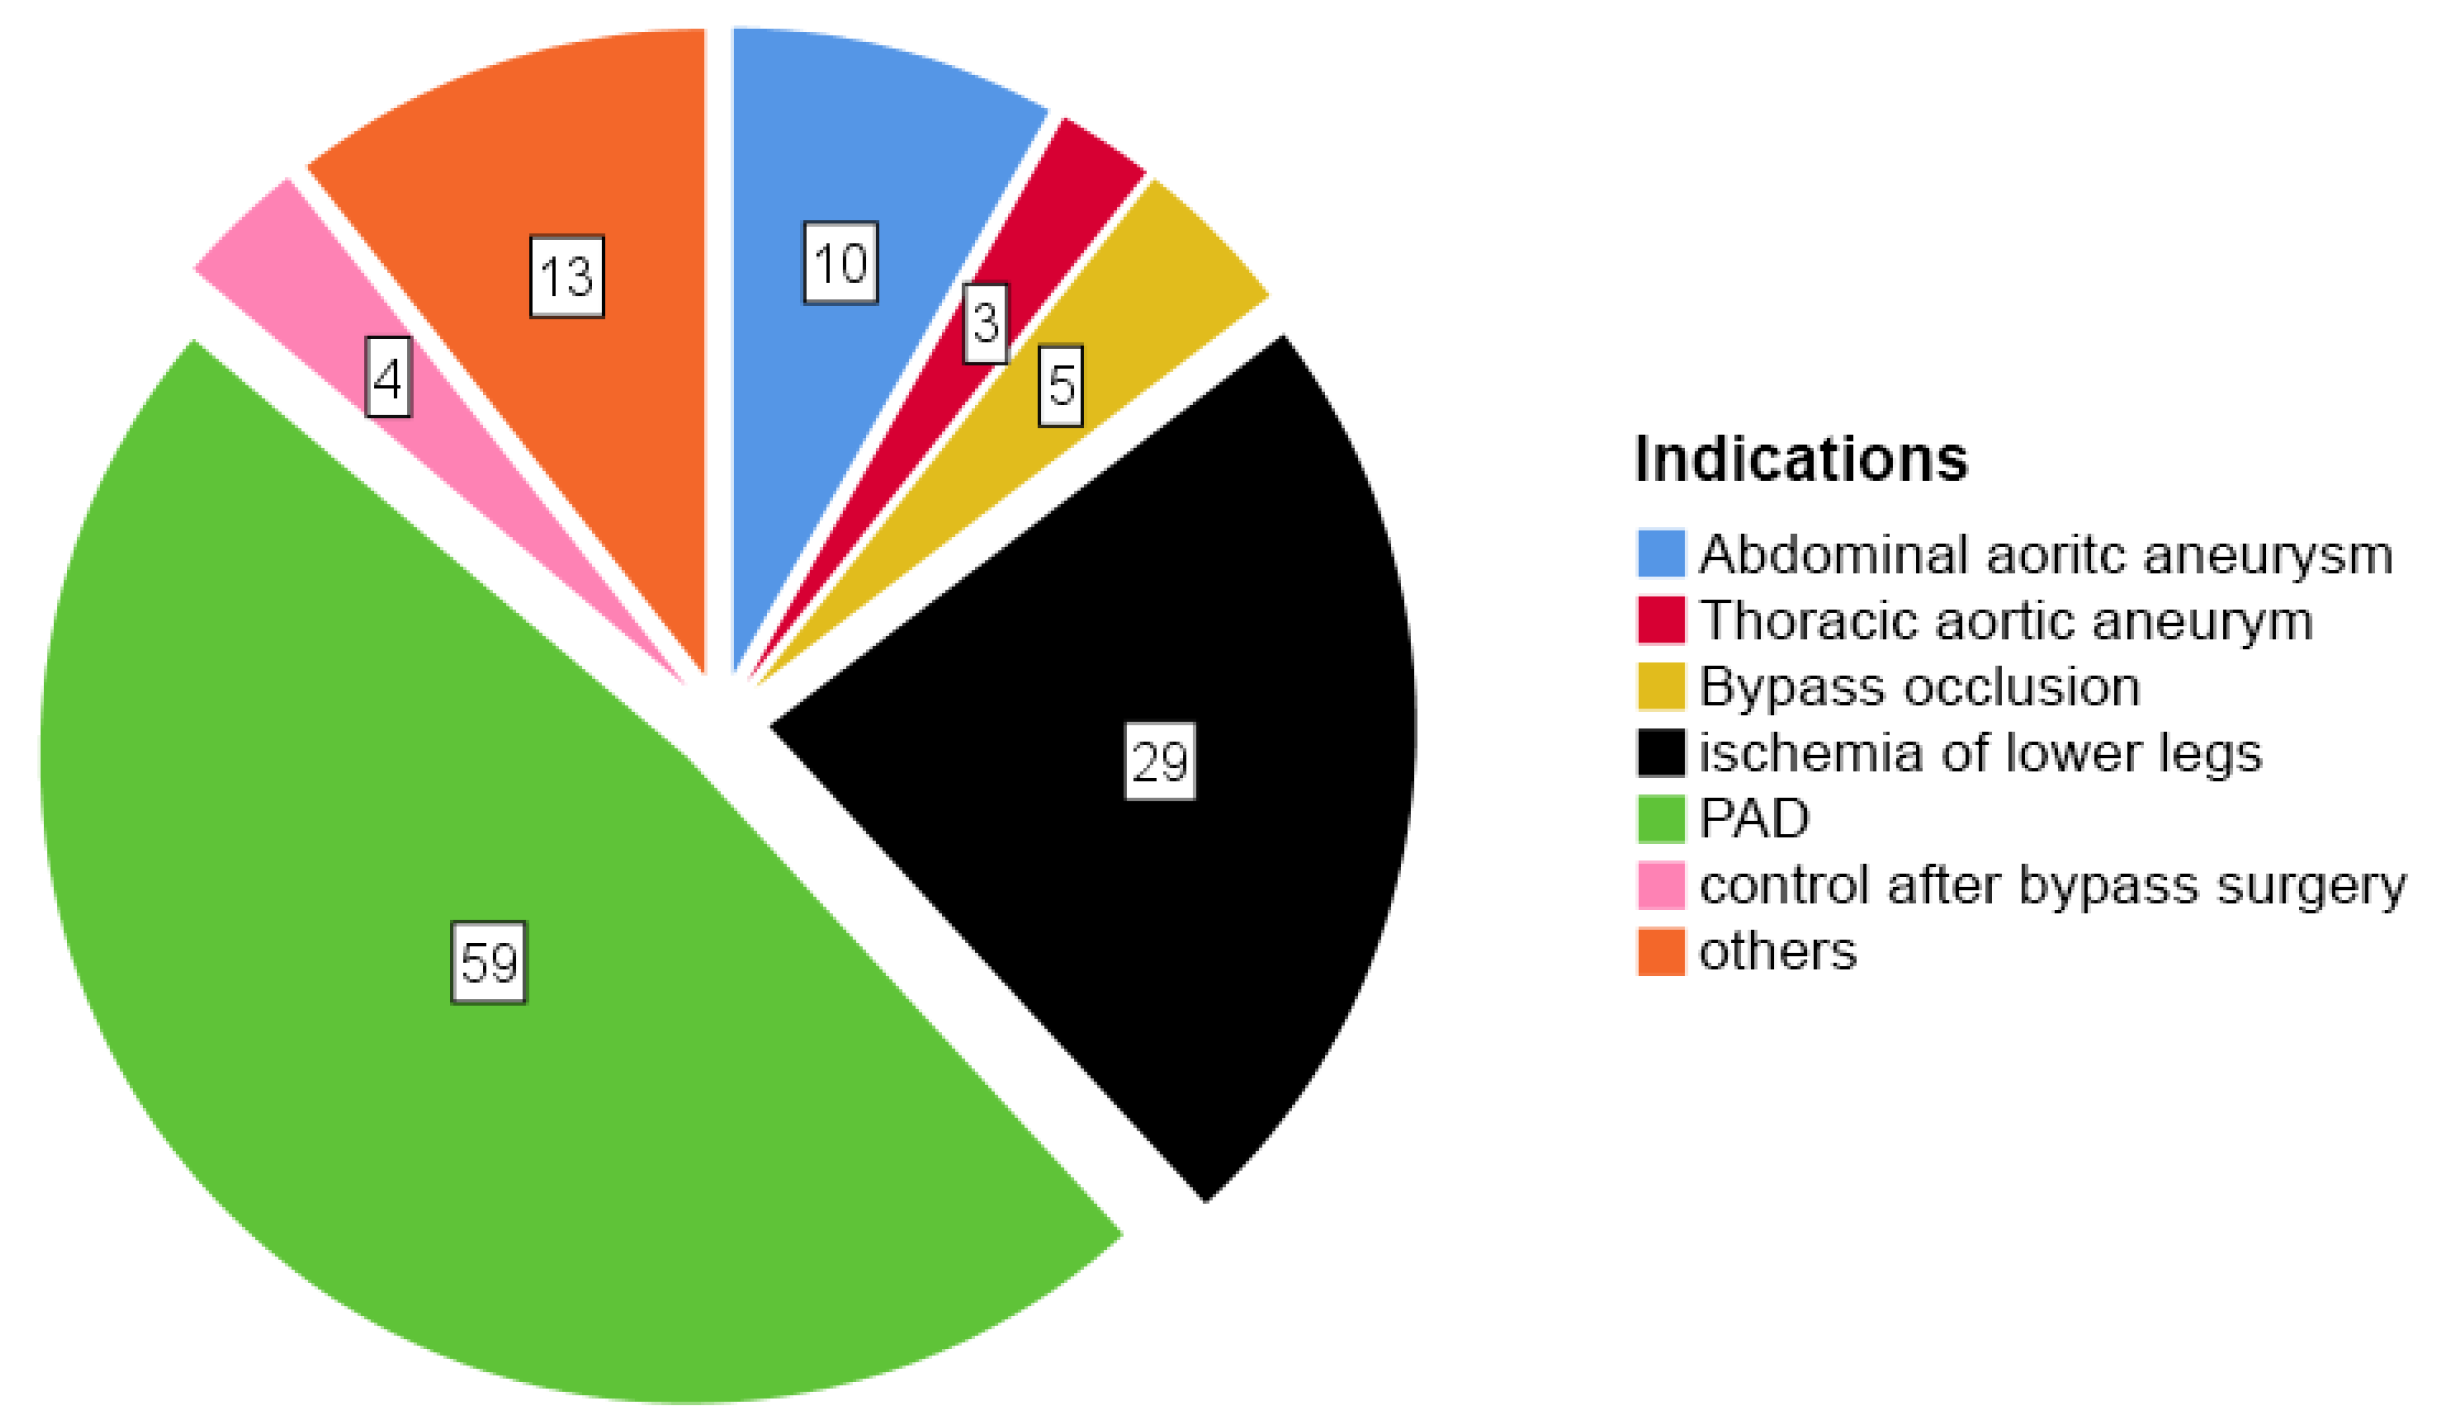
At this point, the ROI abdominal aorta patient collective (123 patients) was researched in more detail.
Figure 4 shows the indications for the MRA for these patients.
Subsequently, an analysis explored the correlation between the measured TTP and cardiac parameters, including EF and ASA classification regarding to the before mentioned 123 patients with the ROI of abdominal aorta. A correlation between the delay with the EF and the ASA-classification could be seen.
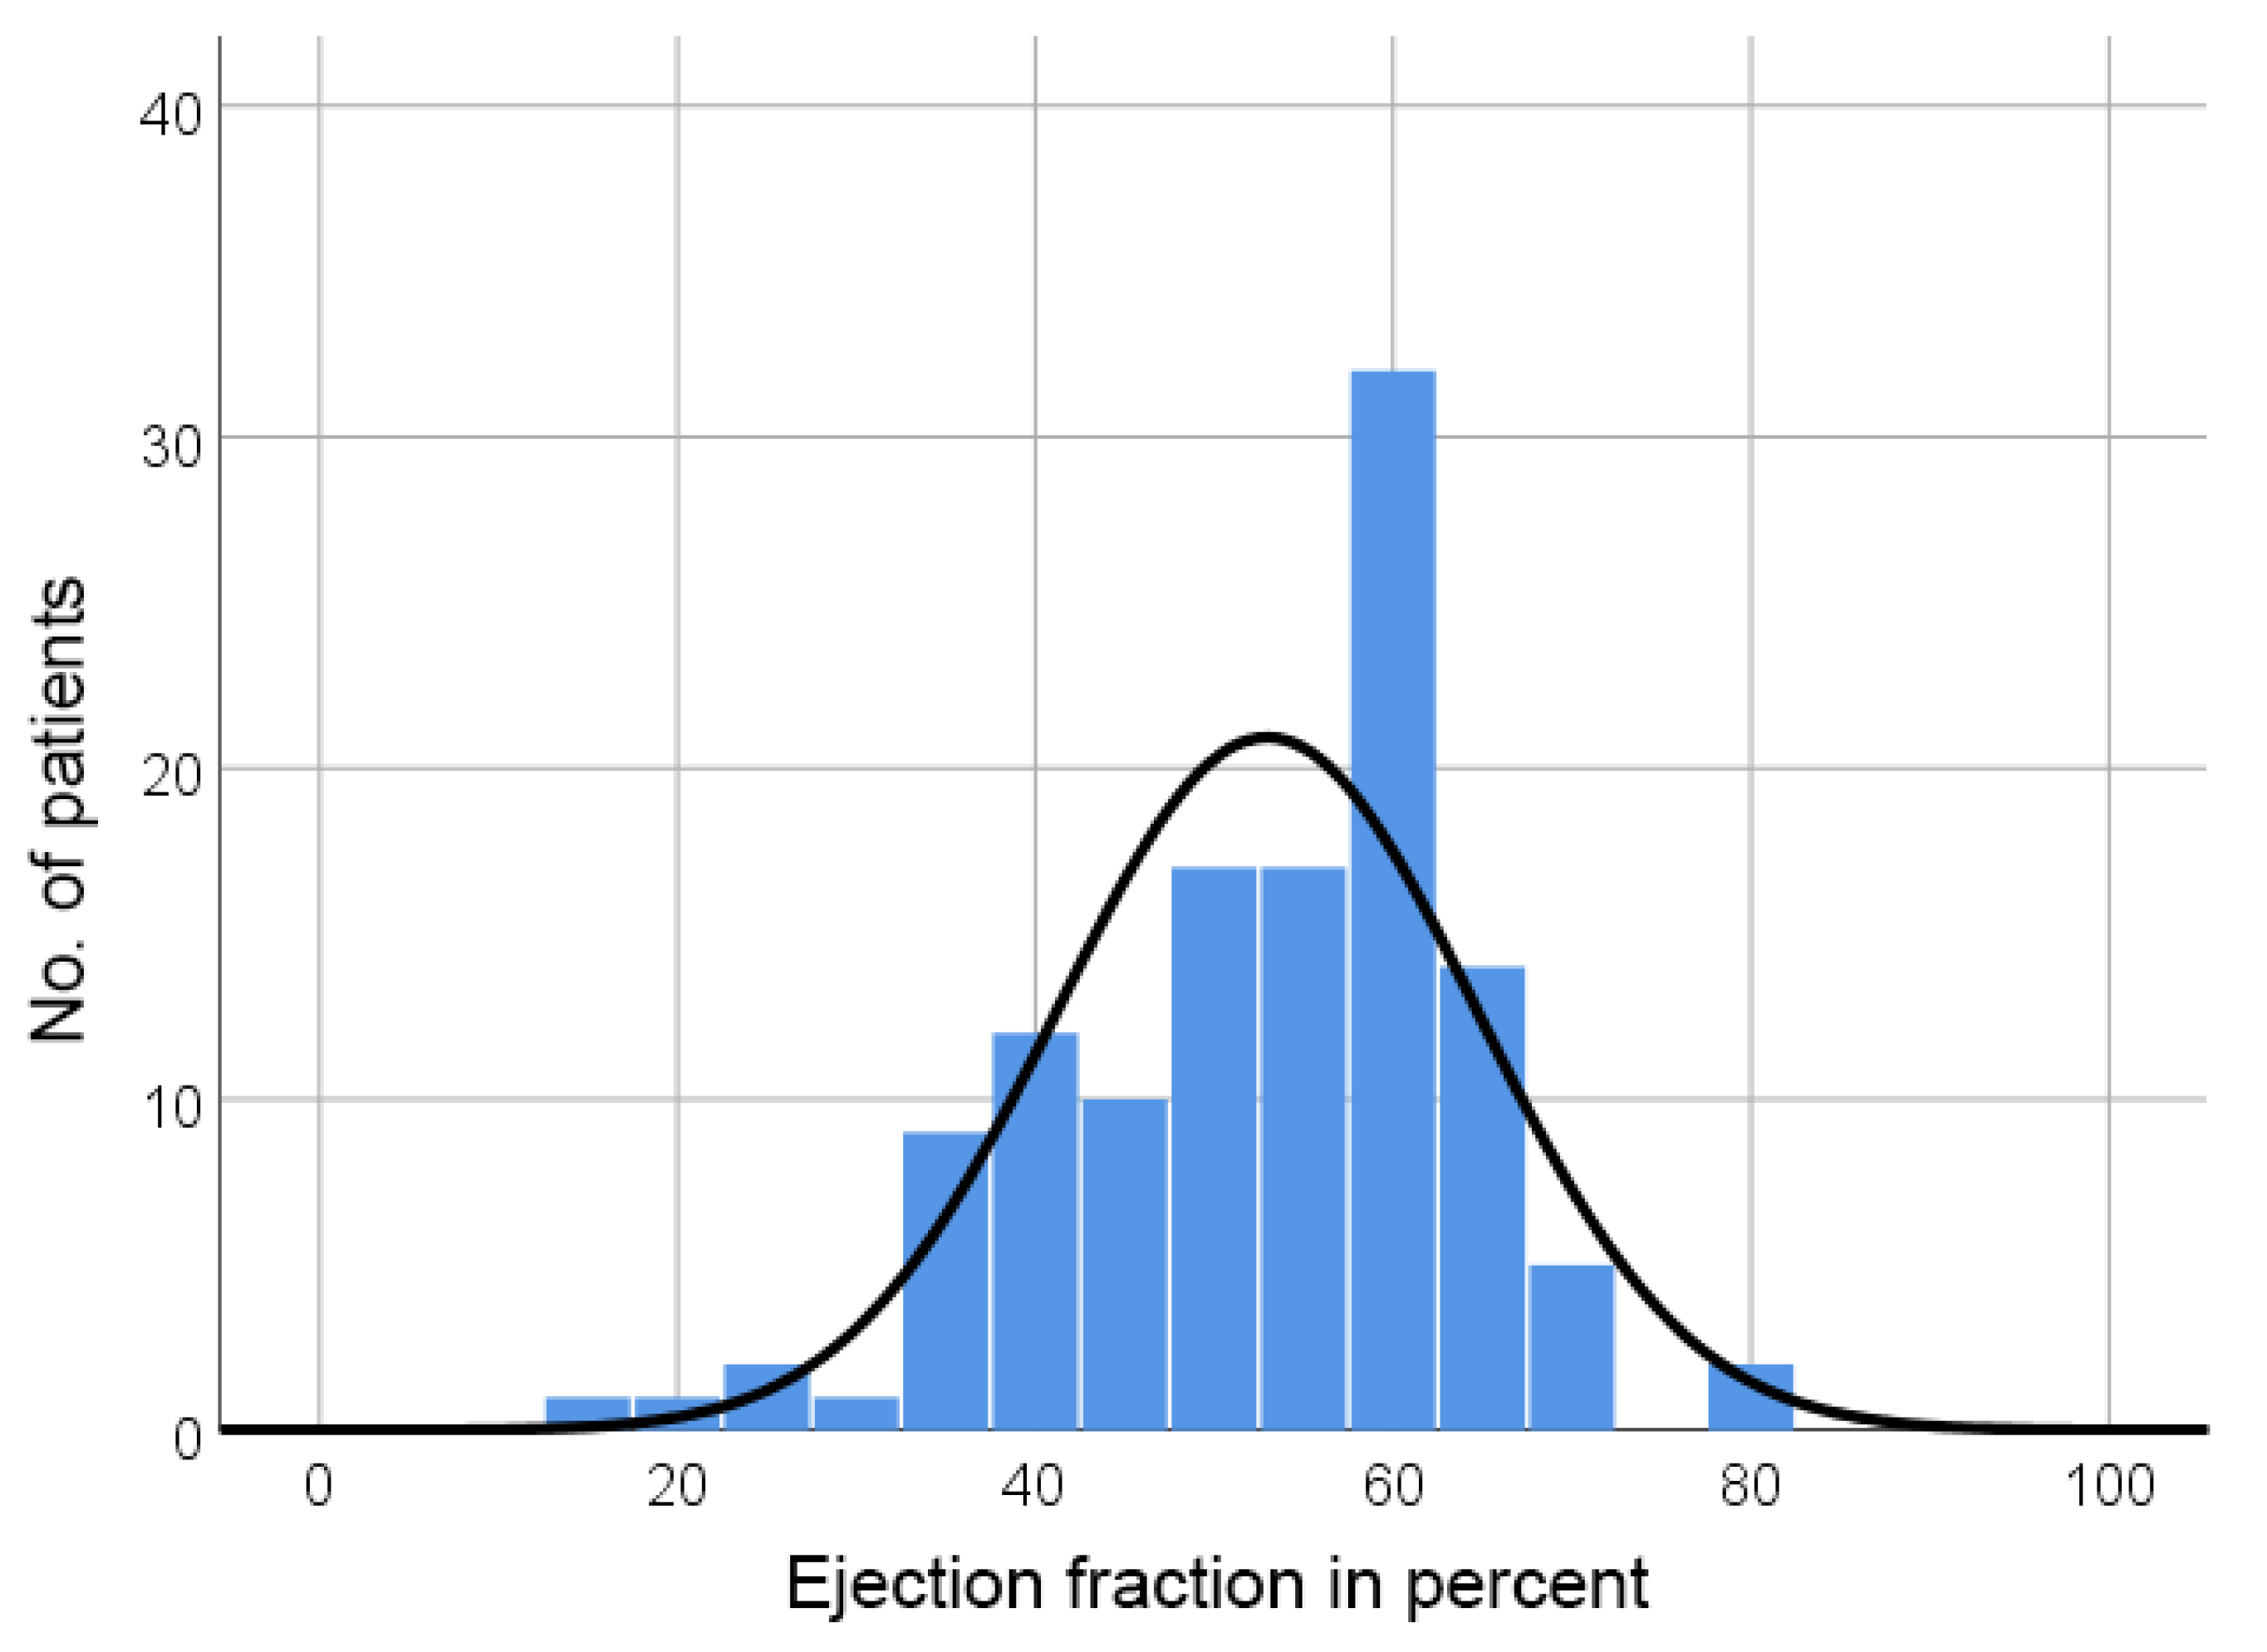
Figure 5 shows the frequency in relation to EF.
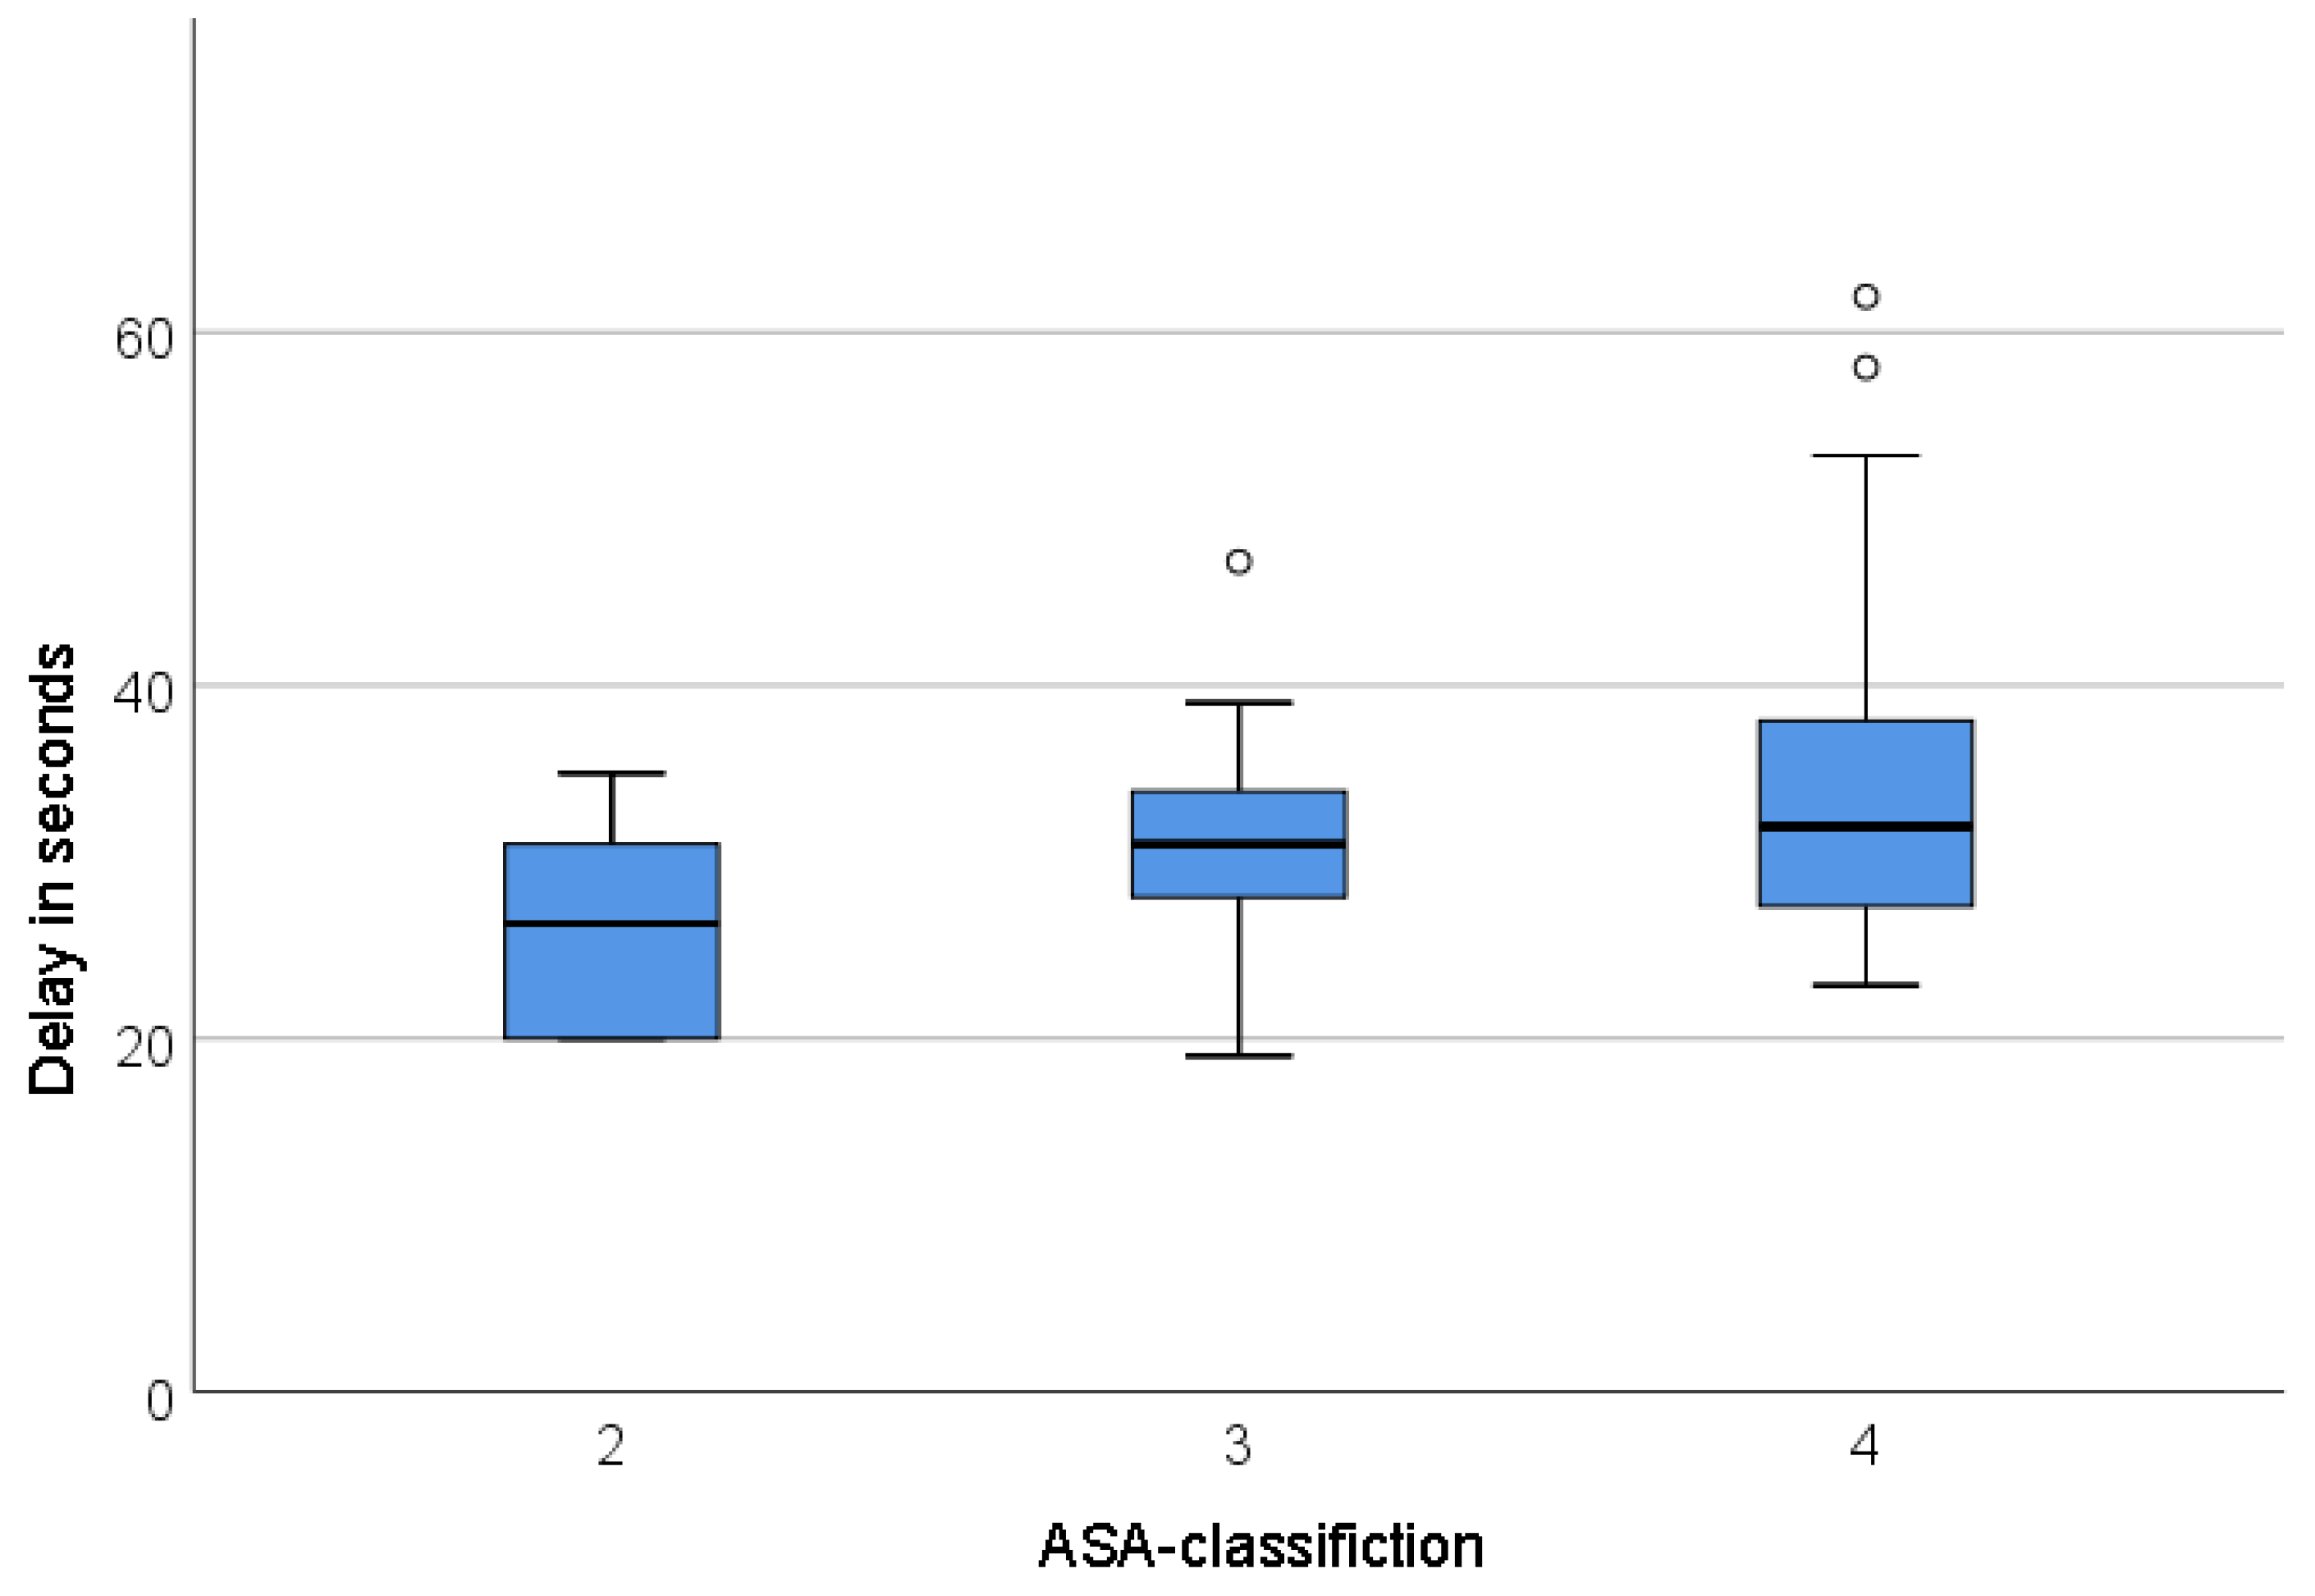
Figure 6 presents the delay in seconds with regard to the ASA-classification.
Interestingly, almost all delay values above 40s are in ASA classification 4, which leads to an interesting assumption: It is likely that if the delay is above 40s, the surgical/interventional risk could be categorised as ASA classification, even though the average delay between the classifications was not significantly different. Further investigations are necessary to analyse and substantiate this statement in more detail.
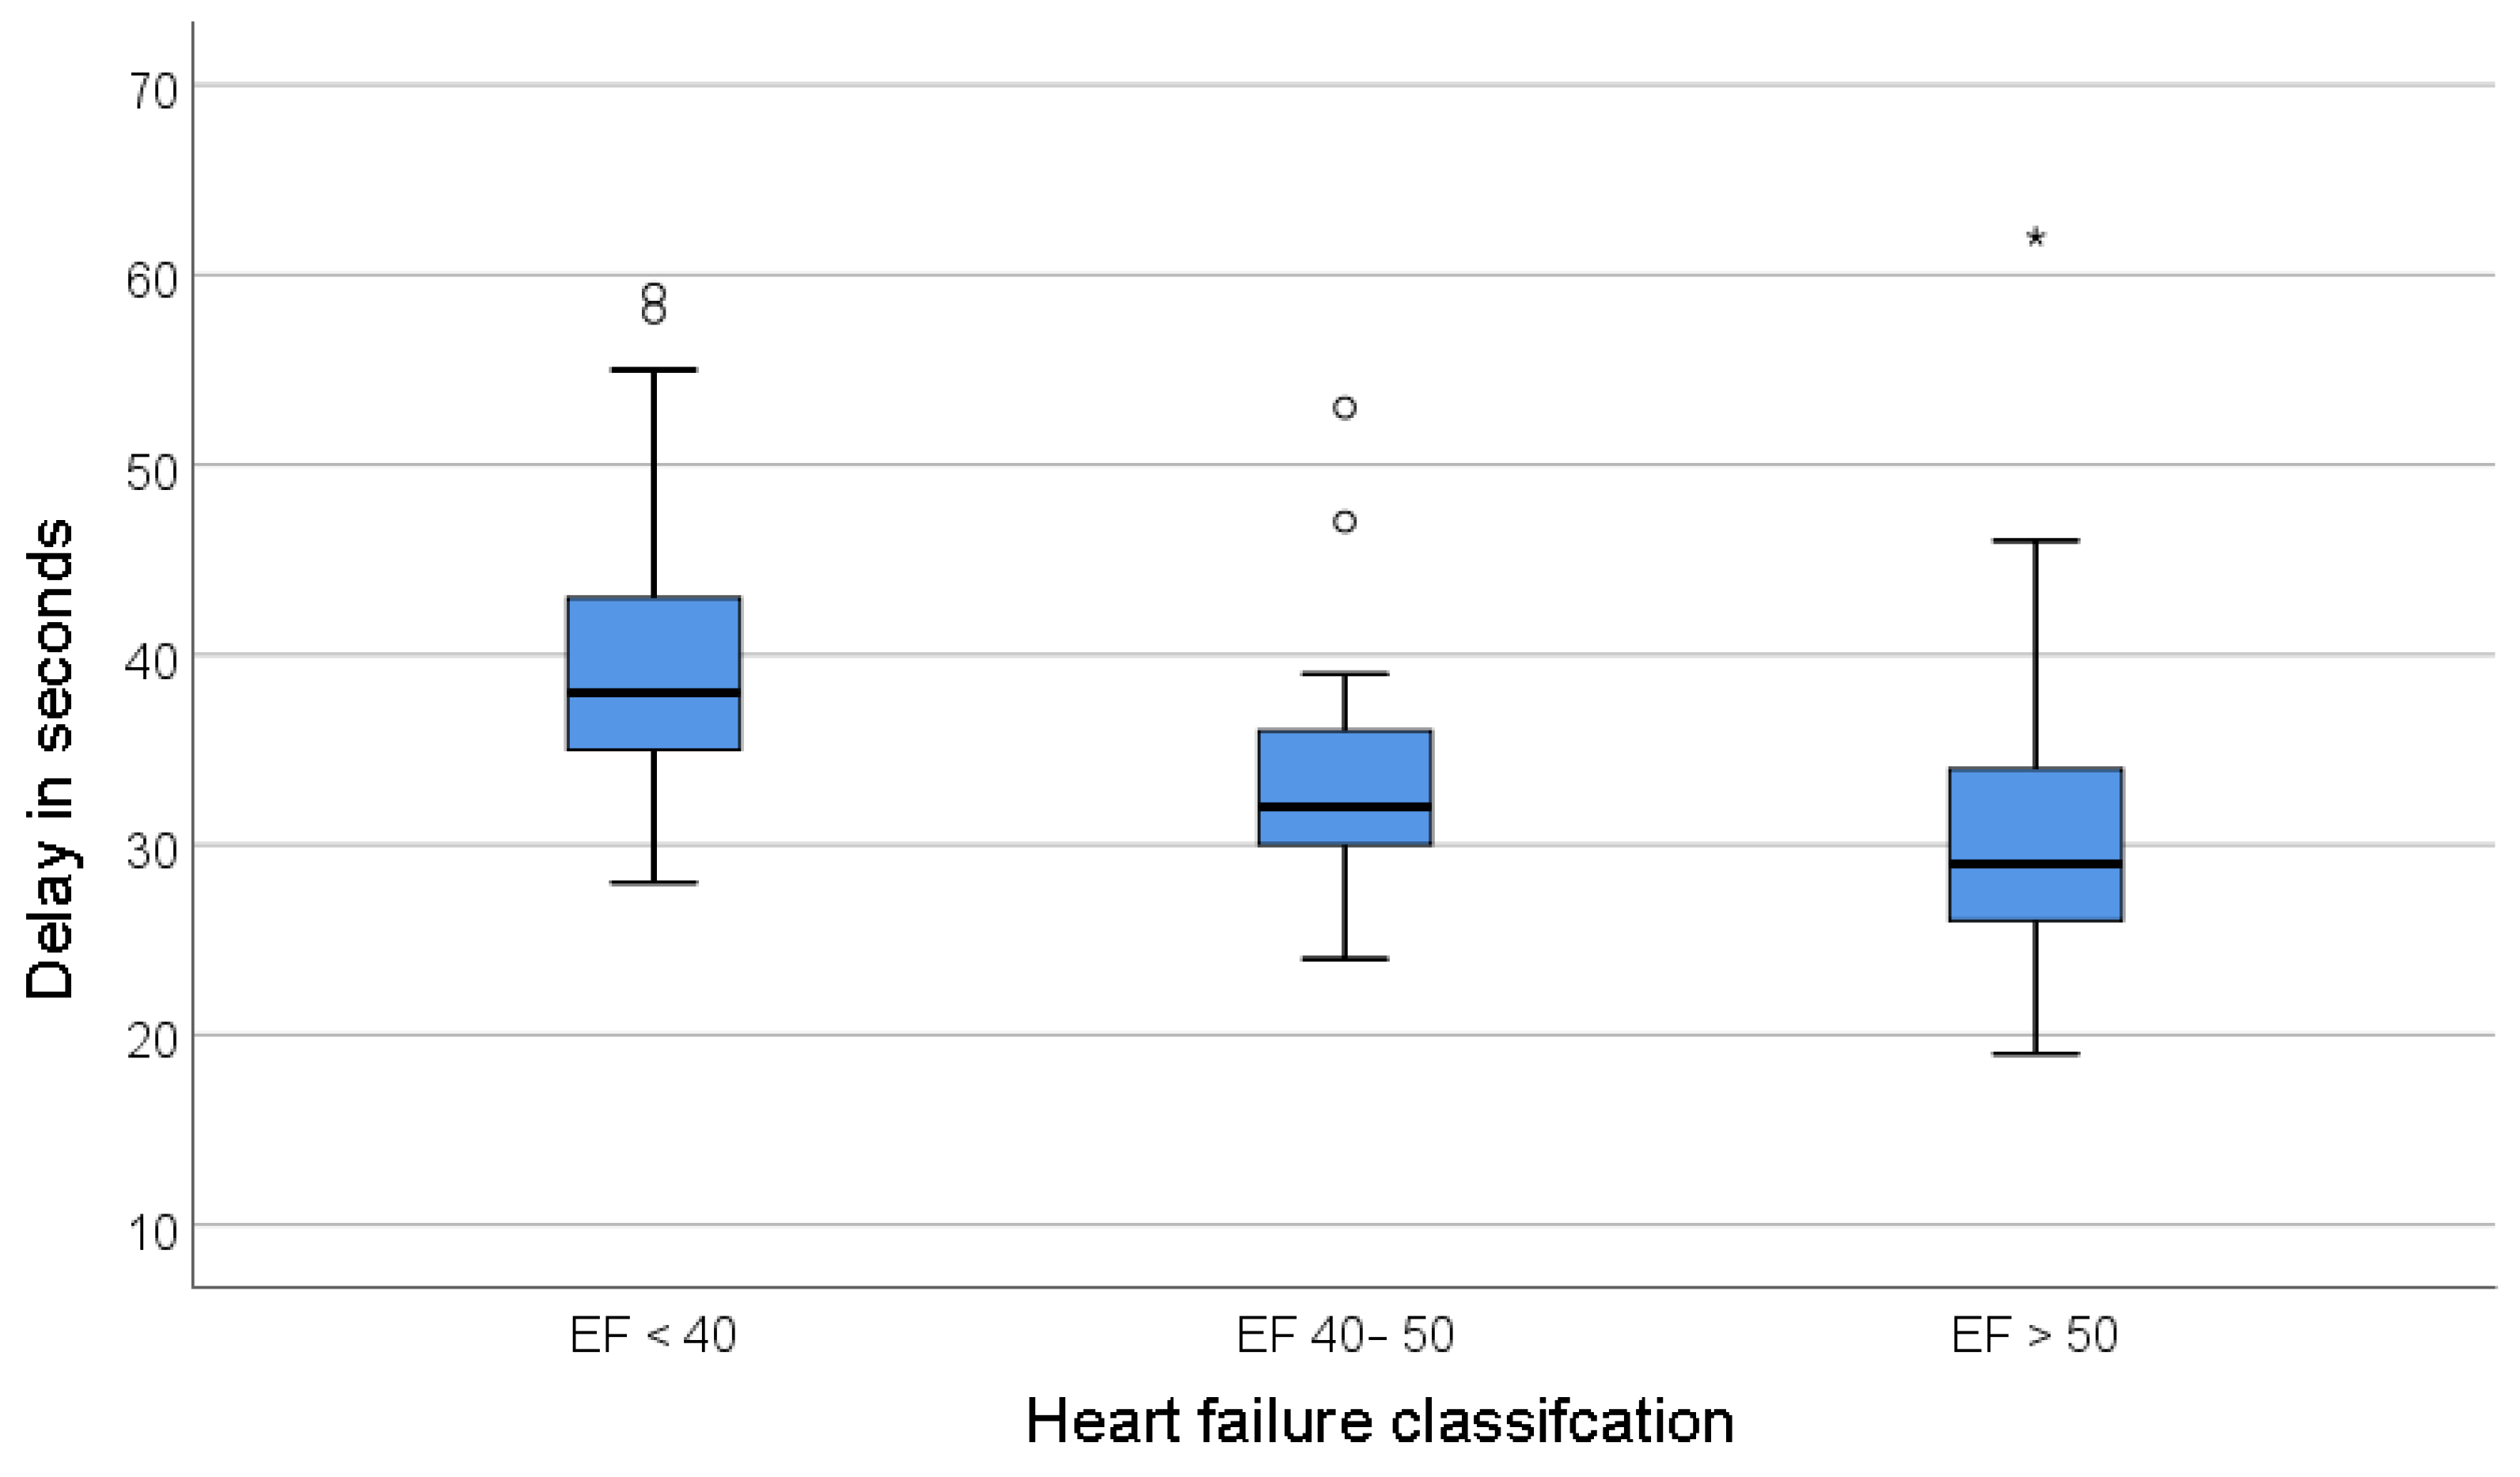
A deviation was found between the TTP in the used heart failure classifications (heart failure (HF) with preserved ejection fraction (HFpEF), EF ≥ 50 %; HF with mildly reduced ejection fraction (HFmrEF), EF 41 - 49 %; HF with a reduced ejection fraction (HFrEF), EF ≤ 40 %). This is presented in
Figure 7.
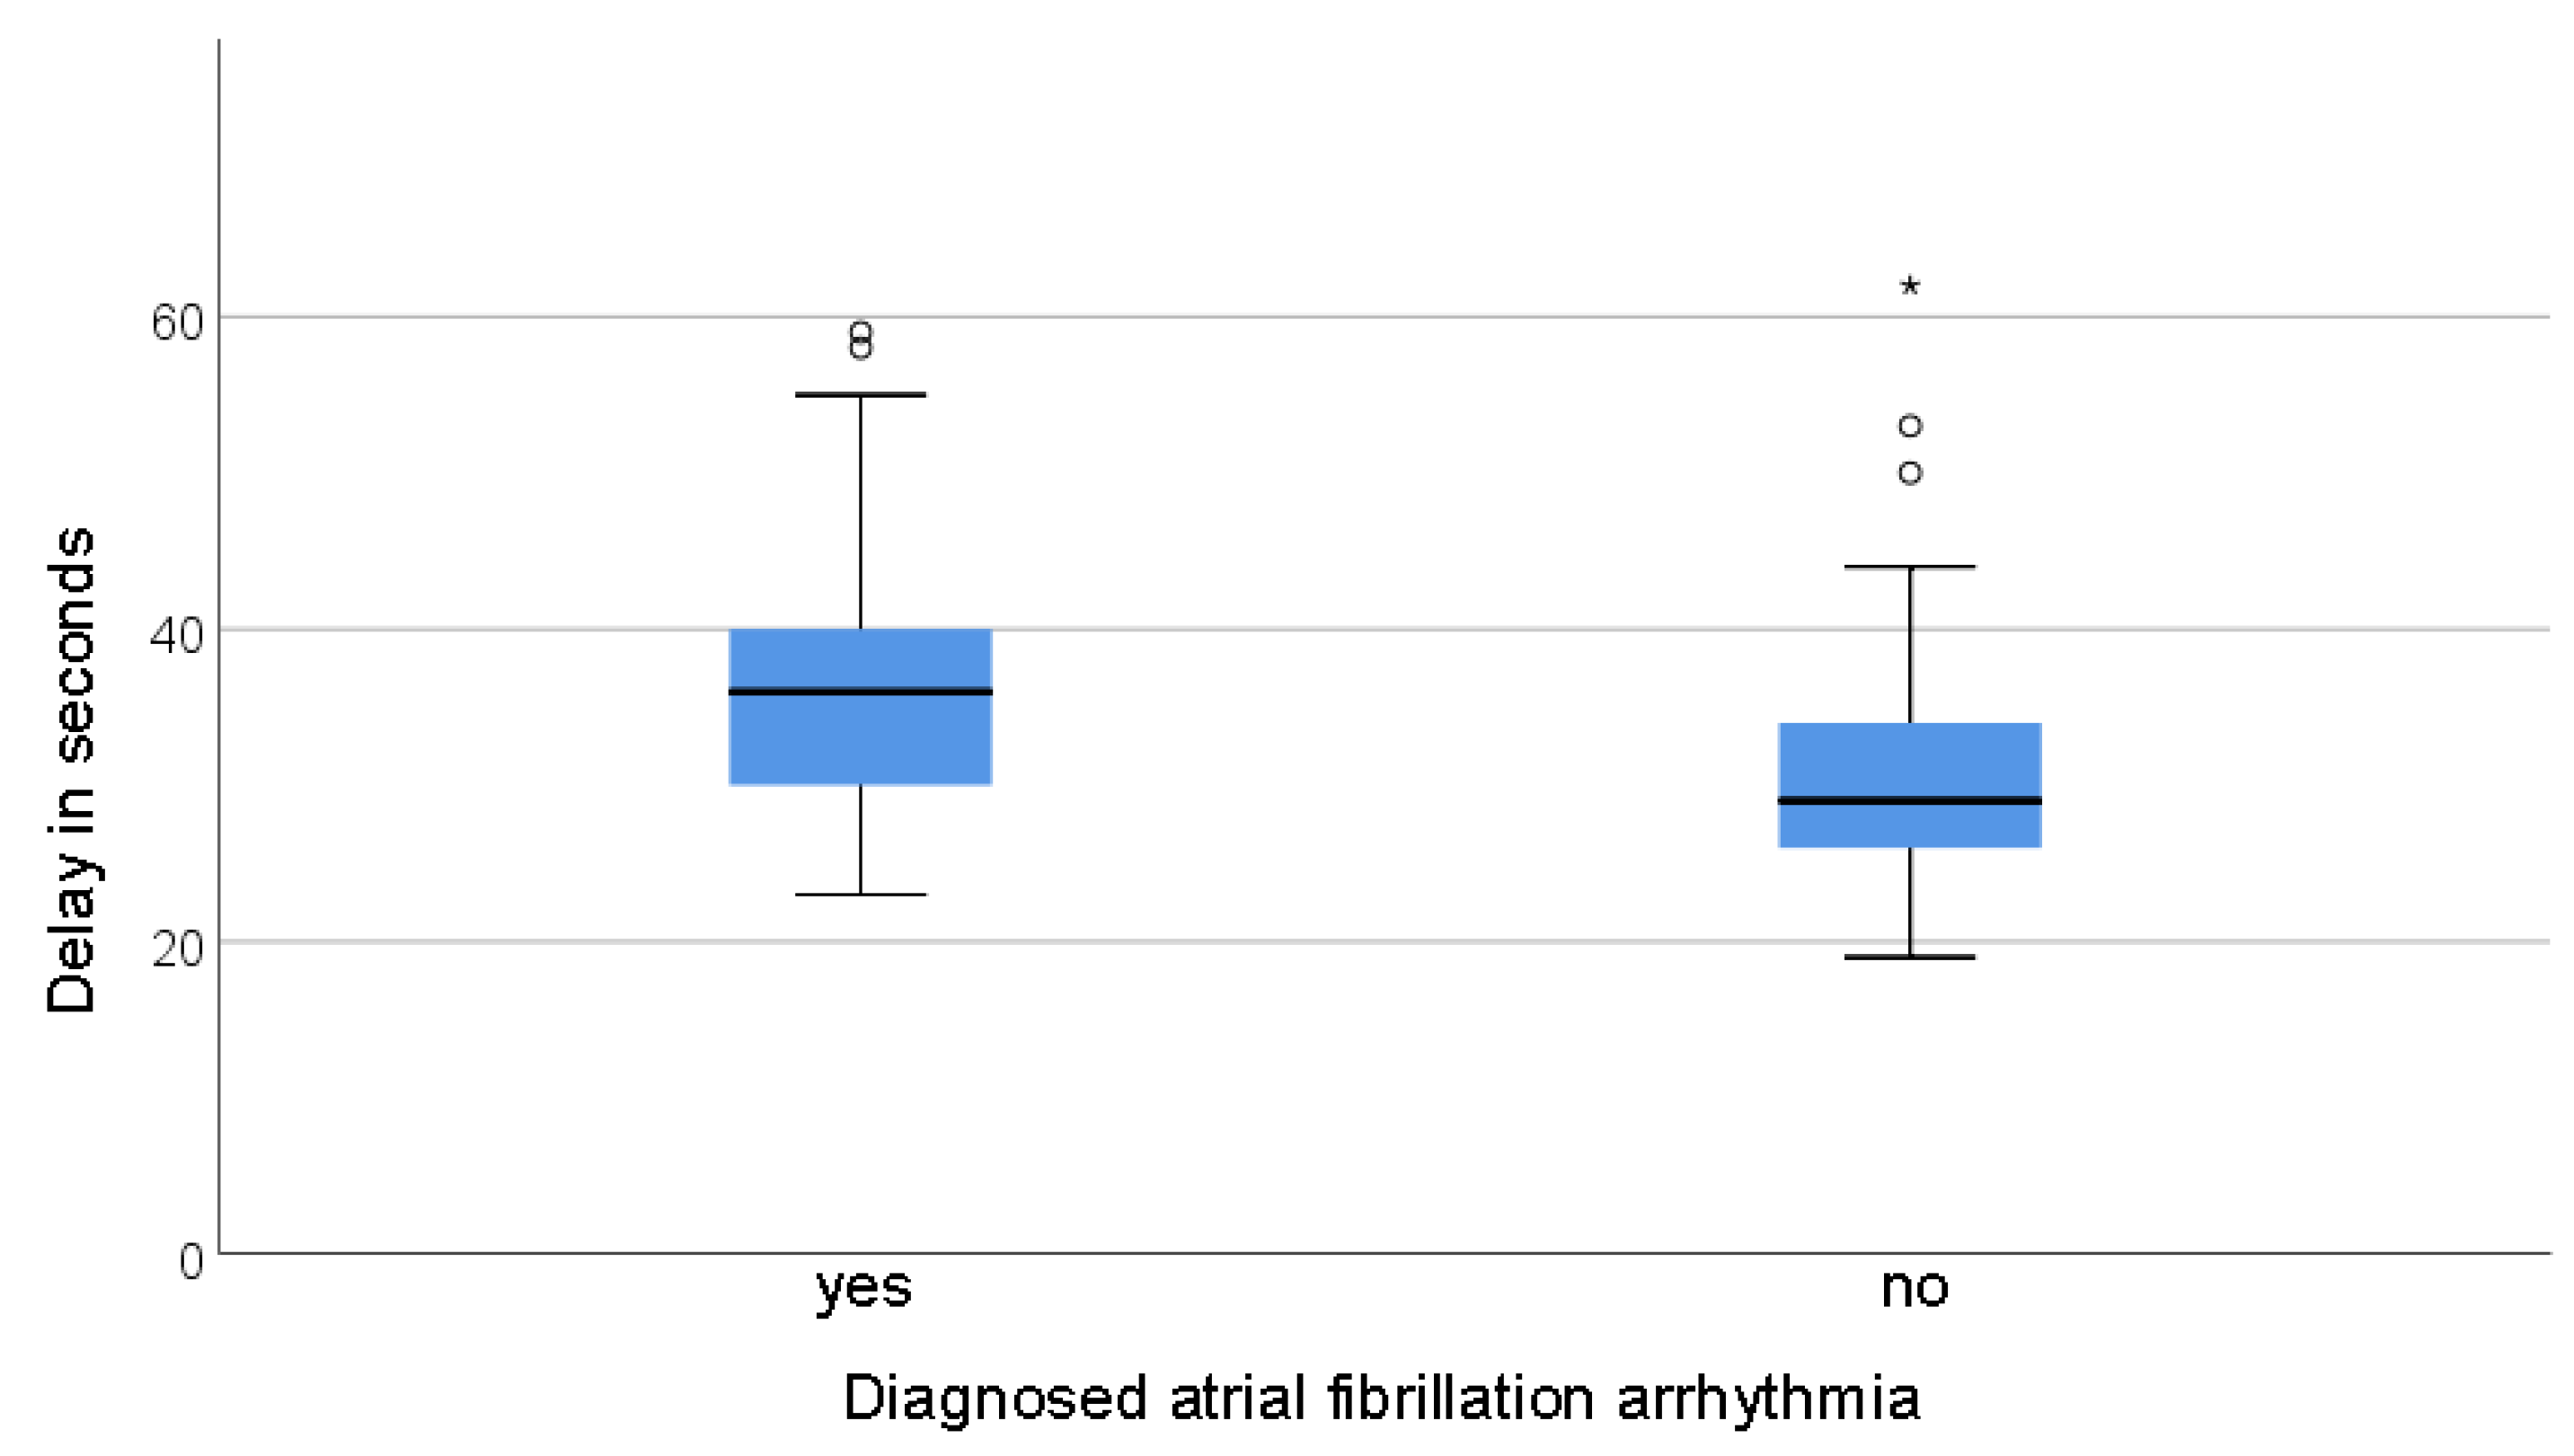
Patients diagnosed with atrial fibrillation had a prolonged TTP compared to those without (mean time 36,7 ± 9,1s vs. 30,6 ±7,1s respectively, p<0,001). This is illustrated in
Figure 8, which presents the delays in patients with and without AF.
Further research on other parameters, such as the MET-classification and Lee-index in relation to TTP and delay, did not show statistically significant results. We cannot determine if a correlation between these parameters and TTP exists; additional research should be conducted. This concludes our research results regarding the 123 patients with ROI of abdominal aorta.
In addition to the previously discussed 123 patients with ROI of the abdominal aorta, our final analysis expanded to include a total of 248 patients from the primary file of 1276 examinations, specifically selected to calculate the delay of the examination protocols. These patients met the criteria for appropriate ROI and provided necessary data for the calculation, thus forming a comprehensive dataset encompassing both previously included and newly identified subjects. Descriptive statistics were used to describe the distribution of the documented delays of the radiology technicians in more detail. With a mean (μ) of 31.2s and a standard deviation (σ) of 7.3s, it can be calculated that there is a 95% probability that the TTP values lie between the interval [16.9s;45.5s] for repeated examinations (min 18s, max 63s). Calculated: [μ - 1.96 x σ; μ + 1.96 x σ].
4. Discussion
This paper investigates the significance of the test bolus delay time for cardiac function in MR angiographies. Specifically, many MRA examinations were conducted in peripheral arterial occlusive disease (PAD) or acute lower extremity ischemia, where rapid revascularisation and reperfusion are crucial. The standardised determination of the delay/TTP could serve as an additional tool for risk assessment for interventions [
20,
21]. The finding that a delay over 45 seconds poses an increased risk for interventions has clinical implications and should be further investigated in prospective multi-centre studies.
Its retrospective nature and the heterogeneous patient population limit the study. Various examination methods were applied, and the patient's condition was not dynamically considered. Therefore, future studies should use a more homogeneous patient population and standardised examination methods.
The results of this study enable a clinical application of the test bolus in relation to cardiac function. Comparisons with previous studies underscore the importance of the test bolus delay time for distinguishing patients with and without heart diseases [
19,
22].
Francois et al. [
21] compared test bolus injections of 77 patients with cardiovascular disease before CE-MRA to a healthy cohort of 33 participants. The primary outcome measure was the arm-to-aorta delay time with the bifurcation of the common carotid artery as the defined ROI. They found a mean TTP of 20.8s ± 3.9s in the cardiovascularly preloaded group and a mean of 16.6s ± 1.9s in the control subjects (p<0.05). Their study described a cut-off value of 18s with the highest sensitivity and specificity for detecting patients with cardiovascular disease. In 2003, when this paper was published, the value of these test bolus TTP measurements was recognised, and attempts were made to generate clinically useful information. In this example, this cut-off value makes it possible to differentiate between patients with or without heart disease. Our retrospective study shows the correlation analysis of the delay with the Lee index as a comparison parameter. Here, pre-existing conditions were primarily included in the study. The advantage of Francois' work is the comparison with the control group, which has no previous cardiovascular disease. This makes it possible to calculate this cut-off value, which is the best way to differentiate between the groups studied [
19].
Shors et al. [
20] examined the pulmonary transit time (PTT) and full-width-half-maximum (FWHM) time in CE-MRA for patients with heart disease and compared them with a healthy cohort. They used the left and right ventricle as ROI. The FWHM times were measured at 11.6s ± 3.1s in the "heart disease" cohort. These values correspond well with the 13.16s ± 3.3s measured in this study [
19]. In Shors et al., the colleagues recognised a correlation between PTT and EF. This study also showed a significant correlation between FWHM time and EF. The discrepancy in the values (11.6s vs. 13.2s) is probably due to the ROI abdominal aorta used compared to the ascending aorta and the resulting longer blood flow distance [
19,
20].
In their work, Mahnken AH. et al. [
22] evaluated the signal curve of test bolus injections in multi-slice spiral computed tomography examinations using a modified Stewart-Hamilton equation (SHE). They compared the cardiac output (CO) values of the CT (computed tomography) images CO determined by measuring the heart dimensions) with the calculated values (using SHE) from the signal curve. The Pearson correlation analysis between the geometric analysis and the corrected contrast dilution (calculated by SHE) yielded an R=0.87 for CO and R=0.87 for EF. Thus, their calculations showed a significant correlation between the signal curve and the measured cardiac dimensions and, thus, with the cardiac EF. This analysis method would produce similarly promising results in investigating test bolus injections in CE-MRA [
19,
22].
Future research should focus on developing regression models and standardised protocols for test bolus data collection. The application of the Stewart-Hamilton equation could allow for the non-invasive determination of CO in CE-MRA. In the future, AI could also play an essential role as a tool to aid in the development of regression models [
23,
24,
25].
5. Conclusion
This retrospective study underscores the significance of precise documentation of bolus arrival time in every radiology report after performing a CE-MRA. It reveals mean TTP or bolus arrival time as a potential clinical cardiovascular parameter correlated with EF and ASA classification, particularly impactful in risk stratification for CLI interventions. These findings advocate for standardised injection protocols to facilitate future multicentre studies and optimise patient care.
Author Contributions
Conceptualization, M.A.A. and D.F.M.; methodology B.M. and T.S; software, B.M. and T.S; validation, B.M., T.S. and T.E.A.; formal analysis, D.F.M., B.M., T.E.A. and T.S.; investigation, D.F.M.; resources; D.F.M.; data curation, D.F.M.; writing—original draft preparation, B.M. and T.S.; writing—review and editing M.A.A., T.E.A. and D.F.M.; visualisation, M.A.A. and D.F.M.; supervision, M.A.A. and D.F.M.; project administration, B.M. and T.S.. All authors gave important input revising the manuscript. All authors have read and agreed to the published version of the manuscript.
Funding
This research received no external funding.
Informed Consent Statement
Not applicable. As a standard procedure, informed consent was obtained from all subjects involved in the study regarding the MRA examination.
Data Availability Statement
Data can be accessed via the thesis [
19]
Acknowledgements
We would like to thank all our administrative and technical support, especially the people of the Institute for Medical Informatics. We are grateful to the Medical University of Graz and the Department of Radiology at the University Clinical Centre Graz.
Conflicts of Interest
The authors declare no conflicts of interest.
References
- Elsayed, S.; Clavijo, L.C. Critical Limb Ischemia. Cardiol Clin 2015, 33, 37–47. [Google Scholar] [CrossRef] [PubMed]
- Conte, S.M.; Vale, P.R. Peripheral Arterial Disease. Heart Lung Circ 2018, 27, 427–432. [Google Scholar] [CrossRef] [PubMed]
- Parwani, D.; Ahmed, M.A.; Mahawar, A.; Gorantla, V.R. Peripheral Arterial Disease: A Narrative Review. Cureus 2023, 15, e40267. [Google Scholar] [CrossRef] [PubMed]
- Hosadurg, N.; Kramer, C.M. Magnetic Resonance Imaging Techniques in Peripheral Arterial Disease. Adv Wound Care (New Rochelle) 2023, 12, 611–625. [Google Scholar] [CrossRef]
- Cavallo, A.U.; Koktzoglou, I.; Edelman, R.R.; Gilkeson, R.; Mihai, G.; Shin, T.; Rajagopalan, S. Noncontrast Magnetic Resonance Angiography for the Diagnosis of Peripheral Vascular Disease. Circ Cardiovasc Imaging 2019, 12, e008844. [Google Scholar] [CrossRef] [PubMed]
- Nagpal, P.; Grist, T.M. MR Angiography: Contrast-Enhanced Acquisition Techniques. Magn Reson Imaging Clin N Am 2023, 31, 493–501. [Google Scholar] [CrossRef]
- Maddox, T.M. Preoperative Cardiovascular Evaluation for Noncardiac Surgery. Mt Sinai J Med 2005, 72, 185–192. [Google Scholar]
- Rohde, L.E.; Polanczyk, C.A.; Goldman, L.; Cook, E.F.; Lee, R.T.; Lee, T.H. Usefulness of Transthoracic Echocardiography as a Tool for Risk Stratification of Patients Undergoing Major Noncardiac Surgery. Am J Cardiol 2001, 87, 505–509. [Google Scholar] [CrossRef] [PubMed]
- Doyle, D.J.; Hendrix, J.M.; Garmon, E.H. American Society of Anesthesiologists Classification. In StatPearls; StatPearls Publishing: Treasure Island (FL), 2024. [Google Scholar]
- Andersson, C.; Wissenberg, M.; Jørgensen, M.E.; Hlatky, M.A.; Mérie, C.; Jensen, P.F.; Gislason, G.H.; Køber, L.; Torp-Pedersen, C. Age-Specific Performance of the Revised Cardiac Risk Index for Predicting Cardiovascular Risk in Elective Noncardiac Surgery. Circ Cardiovasc Qual Outcomes 2015, 8, 103–108. [Google Scholar] [CrossRef]
- Hackett, N.J.; De Oliveira, G.S.; Jain, U.K.; Kim, J.Y.S. ASA Class Is a Reliable Independent Predictor of Medical Complications and Mortality Following Surgery. Int J Surg 2015, 18, 184–190. [Google Scholar] [CrossRef]
- Hurwitz, E.E.; Simon, M.; Vinta, S.R.; Zehm, C.F.; Shabot, S.M.; Minhajuddin, A.; Abouleish, A.E. Adding Examples to the ASA-Physical Status Classification Improves Correct Assignment to Patients. Anesthesiology 2017, 126, 614–622. [Google Scholar] [CrossRef]
- Goldman, L.; Caldera, D.L.; Nussbaum, S.R.; Southwick, F.S.; Krogstad, D.; Murray, B.; Burke, D.S.; O’Malley, T.A.; Goroll, A.H.; Caplan, C.H.; et al. Multifactorial Index of Cardiac Risk in Noncardiac Surgical Procedures. N Engl J Med 1977, 297, 845–850. [Google Scholar] [CrossRef] [PubMed]
- Lee, T.H.; Marcantonio, E.R.; Mangione, C.M.; Thomas, E.J.; Polanczyk, C.A.; Cook, E.F.; Sugarbaker, D.J.; Donaldson, M.C.; Poss, R.; Ho, K.K.; et al. Derivation and Prospective Validation of a Simple Index for Prediction of Cardiac Risk of Major Noncardiac Surgery. Circulation 1999, 100, 1043–1049. [Google Scholar] [CrossRef] [PubMed]
- Flu, W.-J.; van Kuijk, J.-P.; Hoeks, S.E.; Kuiper, R.; Schouten, O.; Goei, D.; Elhendy, A.; Verhagen, H.J.M.; Thomson, I.R.; Bax, J.J.; et al. Prognostic Implications of Asymptomatic Left Ventricular Dysfunction in Patients Undergoing Vascular Surgery. Anesthesiology 2010, 112, 1316–1324. [Google Scholar] [CrossRef] [PubMed]
- Van Beijsterveld, C.A.; Bongers, B.C.; Den Dulk, M.; Van Kuijk, S.M.J.; Dejong, K.C.H.; Van Meeteren, N.L.U. The Association between Preoperative Physical Functioning and Short-Term Postoperative Outcomes: A Cohort Study of Patients Undergoing Elective Hepatic Resection. HPB (Oxford) 2019, 21, 1362–1370. [Google Scholar] [CrossRef] [PubMed]
- Sharma, S.; Merghani, A.; Mont, L. Exercise and the Heart: The Good, the Bad, and the Ugly. Eur Heart J 2015, 36, 1445–1453. [Google Scholar] [CrossRef] [PubMed]
- Jetté, M.; Sidney, K.; Blümchen, G. Metabolic Equivalents (METS) in Exercise Testing, Exercise Prescription, and Evaluation of Functional Capacity. Clin Cardiol 1990, 13, 555–565. [Google Scholar] [CrossRef]
- Möller, D.F. Pilotstudie: Retrospektive Korrelation der Kreislaufzeit von Testbolusinjektionen bei MR- Angiographien und der Herzfunktion. Doktor der gesamten Heilkunde (Dr. med. univ.), Medical University of Graz: Graz, 2021.
- Shors, S.M.; Cotts, W.G.; Pavlovic-Surjancev, B.; François, C.J.; Gheorghiade, M.; Finn, J.P. Heart Failure: Evaluation of Cardiopulmonary Transit Times with Time-Resolved MR Angiography. Radiology 2003, 229, 743–748. [Google Scholar] [CrossRef]
- Francois, C.J.; Shors, S.M.; Bonow, R.O.; Finn, J.P. Analysis of Cardiopulmonary Transit Times at Contrast Material-Enhanced MR Imaging in Patients with Heart Disease. Radiology 2003, 227, 447–452. [Google Scholar] [CrossRef]
- Mahnken, A.H.; Klotz, E.; Hennemuth, A.; Jung, B.; Koos, R.; Wildberger, J.E.; Günther, R.W. Measurement of Cardiac Output from a Test-Bolus Injection in Multislice Computed Tomography. Eur Radiol 2003, 13, 2498–2504. [Google Scholar] [CrossRef]
- Pianykh, O.S.; Langs, G.; Dewey, M.; Enzmann, D.R.; Herold, C.J.; Schoenberg, S.O.; Brink, J.A. Continuous Learning AI in Radiology: Implementation Principles and Early Applications. Radiology 2020, 297, 6–14. [Google Scholar] [CrossRef] [PubMed]
- Hosny, A.; Parmar, C.; Quackenbush, J.; Schwartz, L.H.; Aerts, H.J.W.L. Artificial Intelligence in Radiology. Nat Rev Cancer 2018, 18, 500–510. [Google Scholar] [CrossRef] [PubMed]
- Syed, A.B.; Zoga, A.C. Artificial Intelligence in Radiology: Current Technology and Future Directions. Semin Musculoskelet Radiol 2018, 22, 540–545. [Google Scholar] [CrossRef] [PubMed]
|
Disclaimer/Publisher’s Note: The statements, opinions and data contained in all publications are solely those of the individual author(s) and contributor(s) and not of MDPI and/or the editor(s). MDPI and/or the editor(s) disclaim responsibility for any injury to people or property resulting from any ideas, methods, instructions or products referred to in the content. |
© 2024 by the authors. Licensee MDPI, Basel, Switzerland. This article is an open access article distributed under the terms and conditions of the Creative Commons Attribution (CC BY) license (http://creativecommons.org/licenses/by/4.0/).
