1. Introduction
However, it is heartening to note that there has been a growing interest in the issue of urban green spaces, which is a positive step towards improving the quality of life for urban residents. The importance of urban well-being cannot be overstated, with over 50% of the world's population residing in urban areas. In Europe, this figure is even higher, with 70% of the human population living in urban areas, and projections indicating that this will increase to 82% by 2050 [
1]. In Europe, this figure is even higher, with 70% of the human population living in urban areas, and projections indicating that this will increase to 82% by 2050 [
1]. In Europe, this figure is even higher, with 70% of the human population living in urban areas, and projections indicating that this will increase to 82% by 2050 [
1]. As a result of population growth, many cities around the world are becoming increasingly overcrowded [
2]. The United Nations Sustainable Development Goals (specifically Goals 3, 10, and 11) will promote equitable and sustainable urban development worldwide, reduce inequality, and address the needs of diverse populations by 2030. Ensuring the accessibility of GOS is a crucial issue of social justice. They provide a solution to current urban issues such as traffic congestion, environmental pollution, and limited space for recreation and socializing [
3]. Green spaces are a crucial positive feature in urban areas. Green spaces can be categorized as either public or private, including parks, nature reserves, riparian areas (such as streams or river banks), community gardens, cemeteries, and street trees. Private backyards, communal grounds of apartment buildings, green roofs, campus parks, and gardens [
4,
5] all fall under the second category. Normally, GOS areas in urban zones are a significant contributor to improving peoples quality of life. Accessing these areas and basic services is fundamental for the standard of living conditions in a sustainable society. GOS areas have a constructive effect on psychological and mental health in addition to relaxation [
6,
7,
8]. On the other hand, parks often provide sites for physical activity which is aligned with strengthened health and combatting many chronic diseases [
9,
10].
By providing access to basic services, GOS areas in urban areas can significantly improve people's quality of life. These areas have a positive effect on psychological and mental health, as well as relaxation. Parks, in particular, offer opportunities for physical activity, which can help combat chronic diseases.
Urban green spaces play a crucial role in cities by providing various ecosystem services and contributing to biodiversity conservation. They offer numerous benefits that support daily life in urban areas. For instance, these green spaces act as natural filters, purifying the air and removing pollutants. They also help in reducing noise levels, regulating temperature, and effectively managing stormwater, thus improving the overall environmental quality of cities [
11]. In addition to the environmental advantages, research has demonstrated a positive association between access to natural open spaces and mental health indicators. Studies have shown that having access to green spaces within a 300-metre radius has a beneficial impact on mental well-being [
12]. The presence of urban green spaces can provide a sense of tranquillity and respite from the hustle and bustle of city life, promoting relaxation and reducing stress levels. Recognizing the importance of urban green spaces, the European Union (EU) recommends that municipalities adopt a standardised metric to measure these areas. The EU suggests that citizens should have access to at least 5000 square metres of green or open space within a 300-metre radius of any location [EC, 2001]. Furthermore, according to a study by Annerstedt van den Bosch et al. (2015), a minimum of 1 hectare of urban green space is required within a 300-metre radius to meet the needs of the population [
14]. By implementing these recommendations, municipalities can ensure that urban green spaces are adequately planned and distributed throughout cities, promoting a healthier and more sustainable urban environment.
According to the World Health Organization (WHO), urban areas should provide a minimum of nine square metres of green open space (GOS) per person [
15]. In the United Kingdom, it is advised that natural green spaces, including GOS, be located within a 300-metre radius of residential areas. Moreover, a 20-hectare area should be available within a 2-kilometre distance, a 100-hectare area within 5 kilometres, and a 500-hectare area within 10 kilometres of each residence [
16]. Integrating green spaces into urban planning is crucial for improving living conditions and promoting sustainable development. In the case of the Kyrenia region, although there are no specific regulations, hierarchies, or targets for creating green and open spaces within its cities, there is an opportunity to learn from previous approaches to measuring accessibility and comparing different methods. By reviewing these approaches, the region can identify the most effective strategies for incorporating green spaces into its urban planning. One approach that could be considered is the concept of green corridors. These are linear stretches of green spaces that connect different parts of the city, providing a continuous network of natural areas. By creating green corridors, the Kyrenia region can enhance connectivity between residential areas and ensure that green spaces are easily accessible to its residents. Another strategy that could be explored is the conversion of vacant or underutilized land into green spaces. This could involve transforming abandoned lots or unused areas into parks, gardens, or community spaces. By repurposing these spaces, the Kyrenia region can not only increase its green open space per person but also revitalize neglected areas and improve the overall aesthetics of the city. Furthermore, the Kyrenia region can also consider implementing rooftop gardens or vertical greenery systems. These innovative approaches can help maximize the use of limited space in urban areas by incorporating greenery into buildings. Rooftop gardens not only provide additional green open space but also offer numerous environmental benefits, such as reducing energy consumption, improving air quality, and mitigating the urban heat island effect. By exploring these different approaches and adapting them to the specific context of the Kyrenia region, urban planners and policymakers can create a more sustainable and livable environment for its residents. It is essential to prioritize the integration of green spaces into urban planning to enhance the quality of life, promote physical and mental well-being, and foster a sense of community within the region.
Commonly used methods for measuring the distance between points include Euclidean distance, Manhattan distance, network distance, and network time [
17]. Numerous studies have explored the measurement of accessibility using these methods in various locations around the world. For instance, Logan et al. (2019) employed network distance at the building level to assess accessibility in cities such as Chicago, Baltimore, and Detroit [
18]. Macedo and Haddad (2016) calculated the accessibility of green spaces in Curitiba, Brazil, using Euclidean distance [
19]. In Catania, Italy, La Rosa proposed both Euclidean distance and network distance as indicators of accessibility to model open spaces [
20]. Chen et al. (2020) conducted a study in Shanghai, China, using network time to investigate environmental inequality [
21]. Geographic Information System (GIS) technology plays a vital role in assessing and comprehending the current conditions of urban areas. It enables better decision-making for future urban development by striking a balance between green open spaces and built-up areas. In the case of the Kyrenia region, GIS has proven its competence and expertise in investigating GOS areas, providing valuable insights for urban planning and development.
2. Research Zone
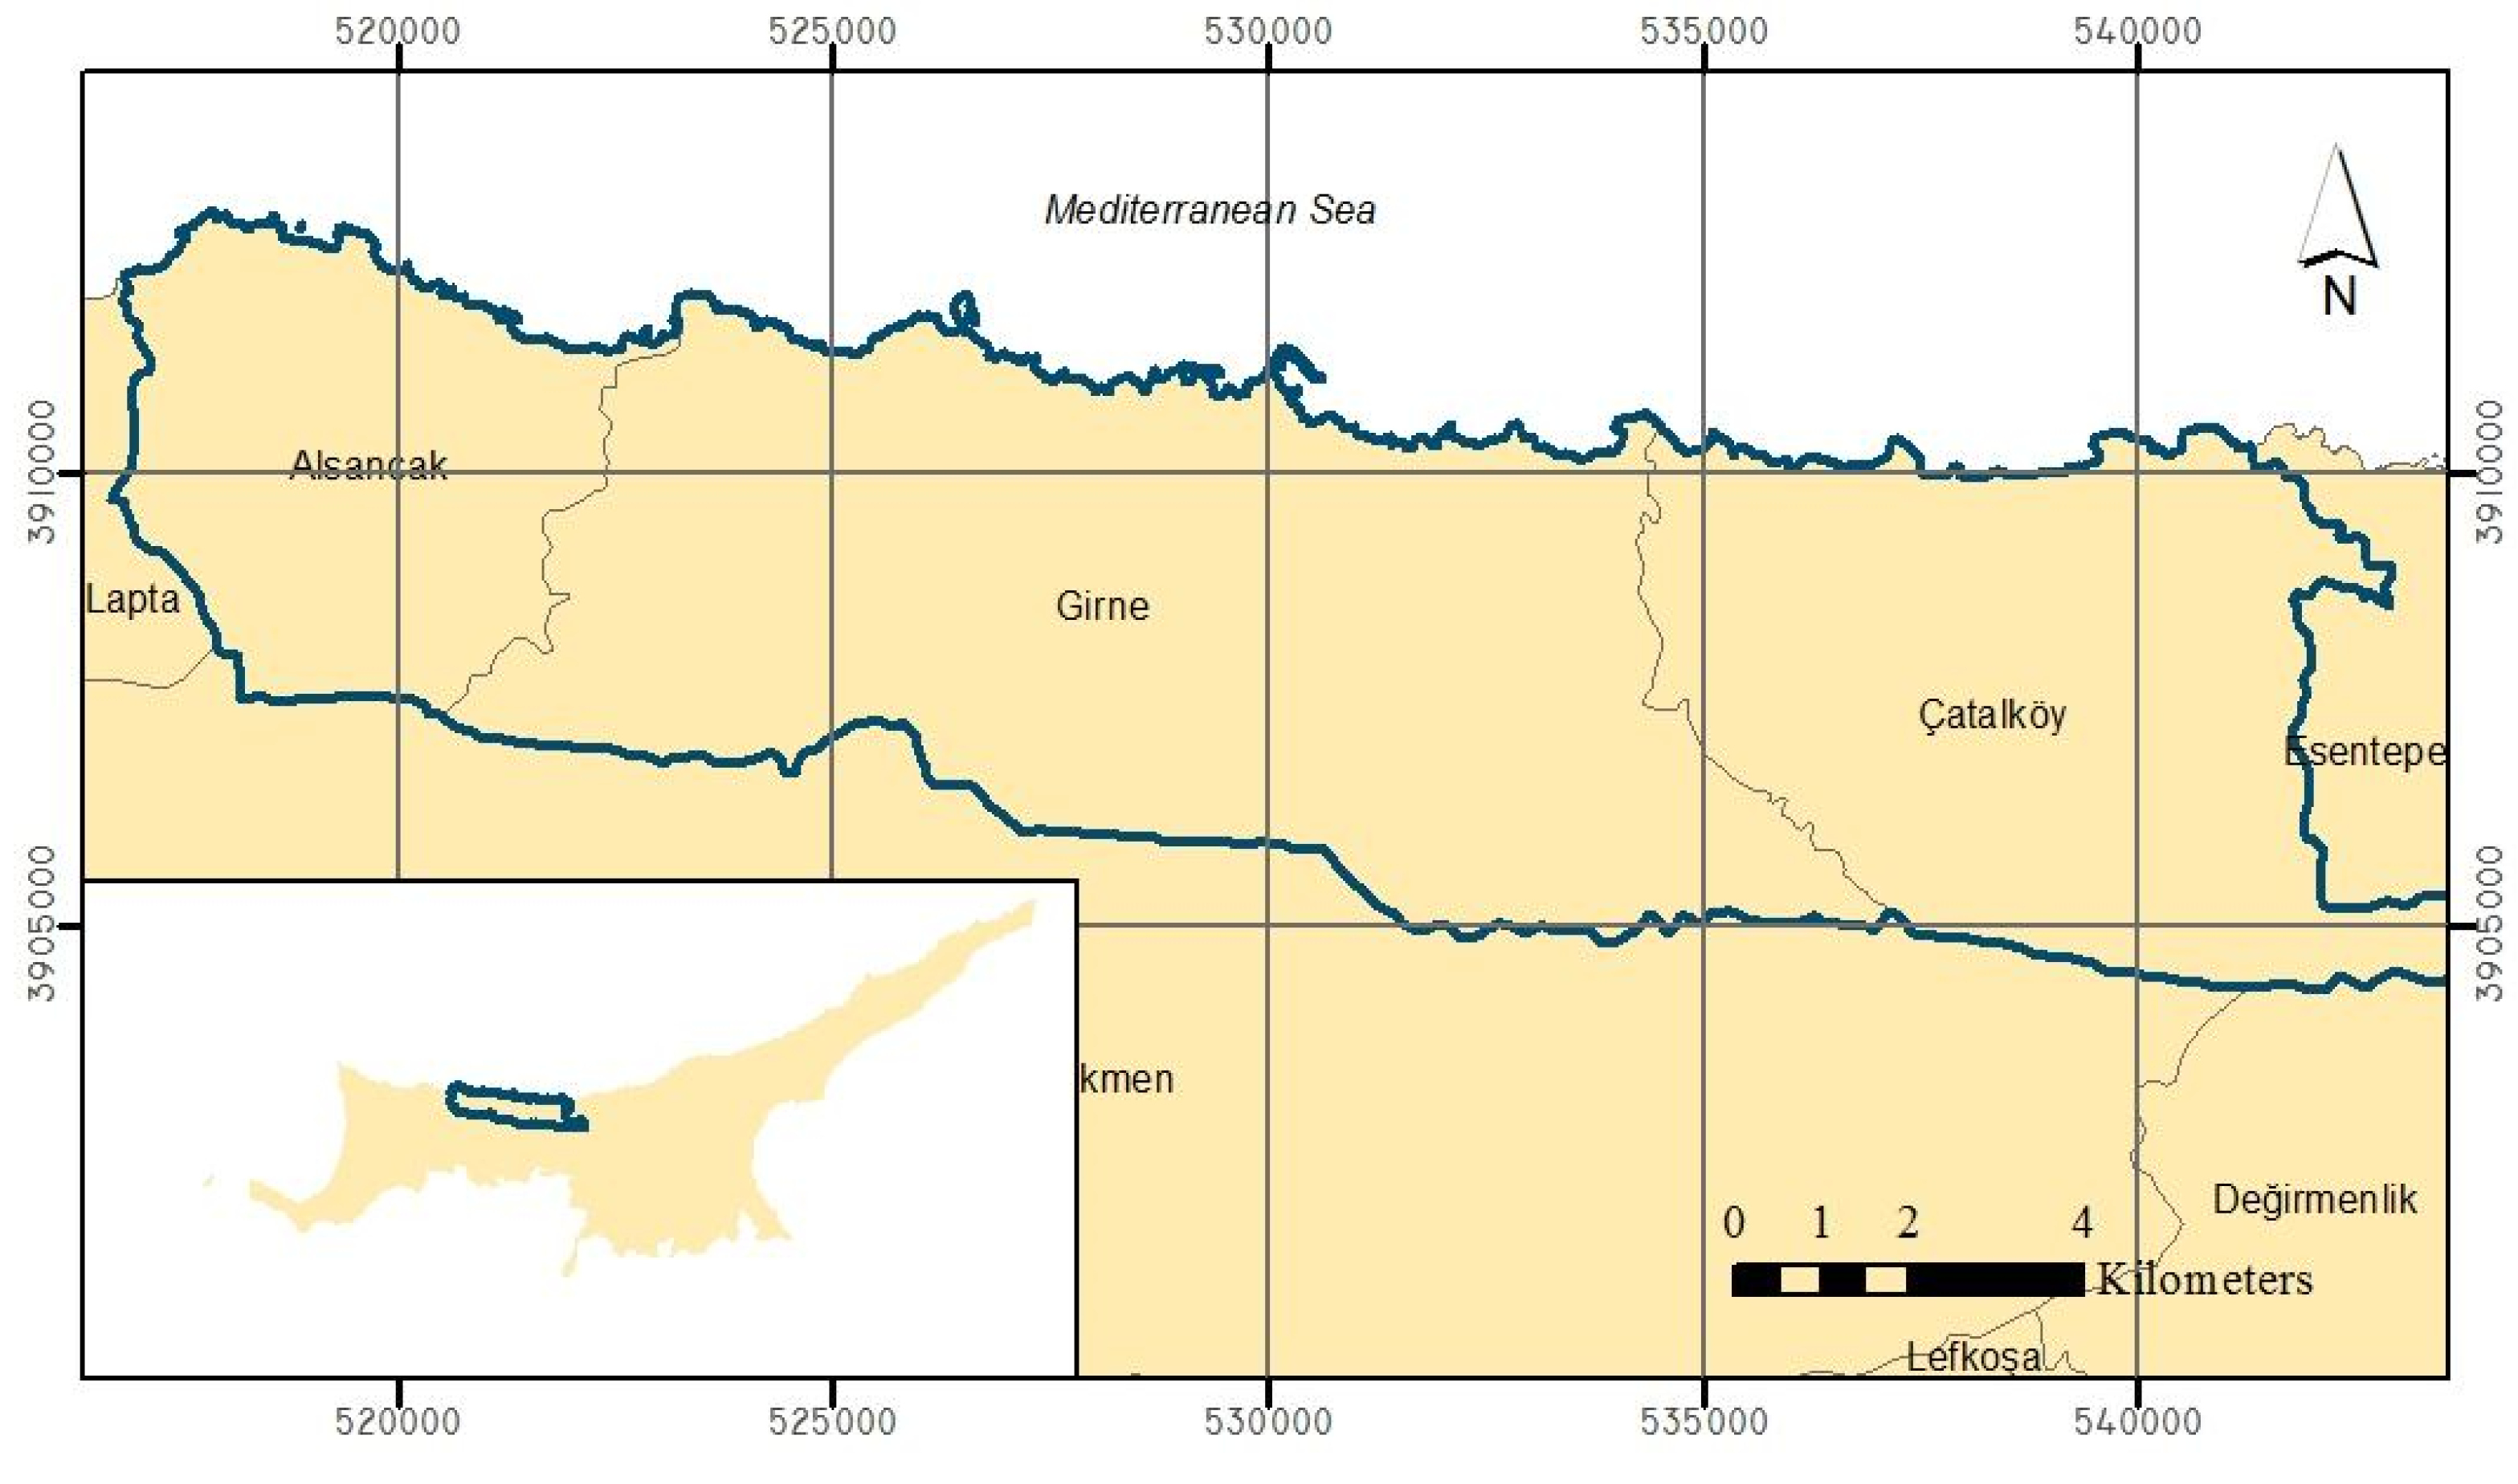
The research zone is confidently located in the northern part of Cyprus Island, covering an impressive area of 130 square kilometers. Based on the 2011 census data from the State Planning Organization, the study area comprises of Kyrenia (Girne), Karavas (Alsancak), and Agios Epiktitos (Çatalköy), with a substantial population of 45,456 people and 14,468 housing units. Notably, Kyrenia City alone accounts for a remarkable 73% of the total population in the area, demonstrating a very high population density. Kyrenia Central Zone had a population of 20,850 in 2011, with 6,857 housing units. Thanks to the planning processes and ordinance regulations implemented since 2010, the central zone development ratios have increased from 1.2 to 2 total development plot ratio, and 3 to 10 floors in any location of the central zone. The decision to increase the housing density to 190 units per hectare from 2011 to 2016 has resulted in a significant rise in the number of housing units in Kyrenia City. The planning department is the only authorized entity to obtain 10% green space from development or planning applications for plots with an area of 4000 square meters or more, based on ordinances and planning regulations from 2010 and 2015. Unfortunately, smaller plots or parcels in the central zone are not eligible for green or open space, which limits the potential for GOS development.
Figure 1.
Study Area Region and Boundary.
Figure 1.
Study Area Region and Boundary.
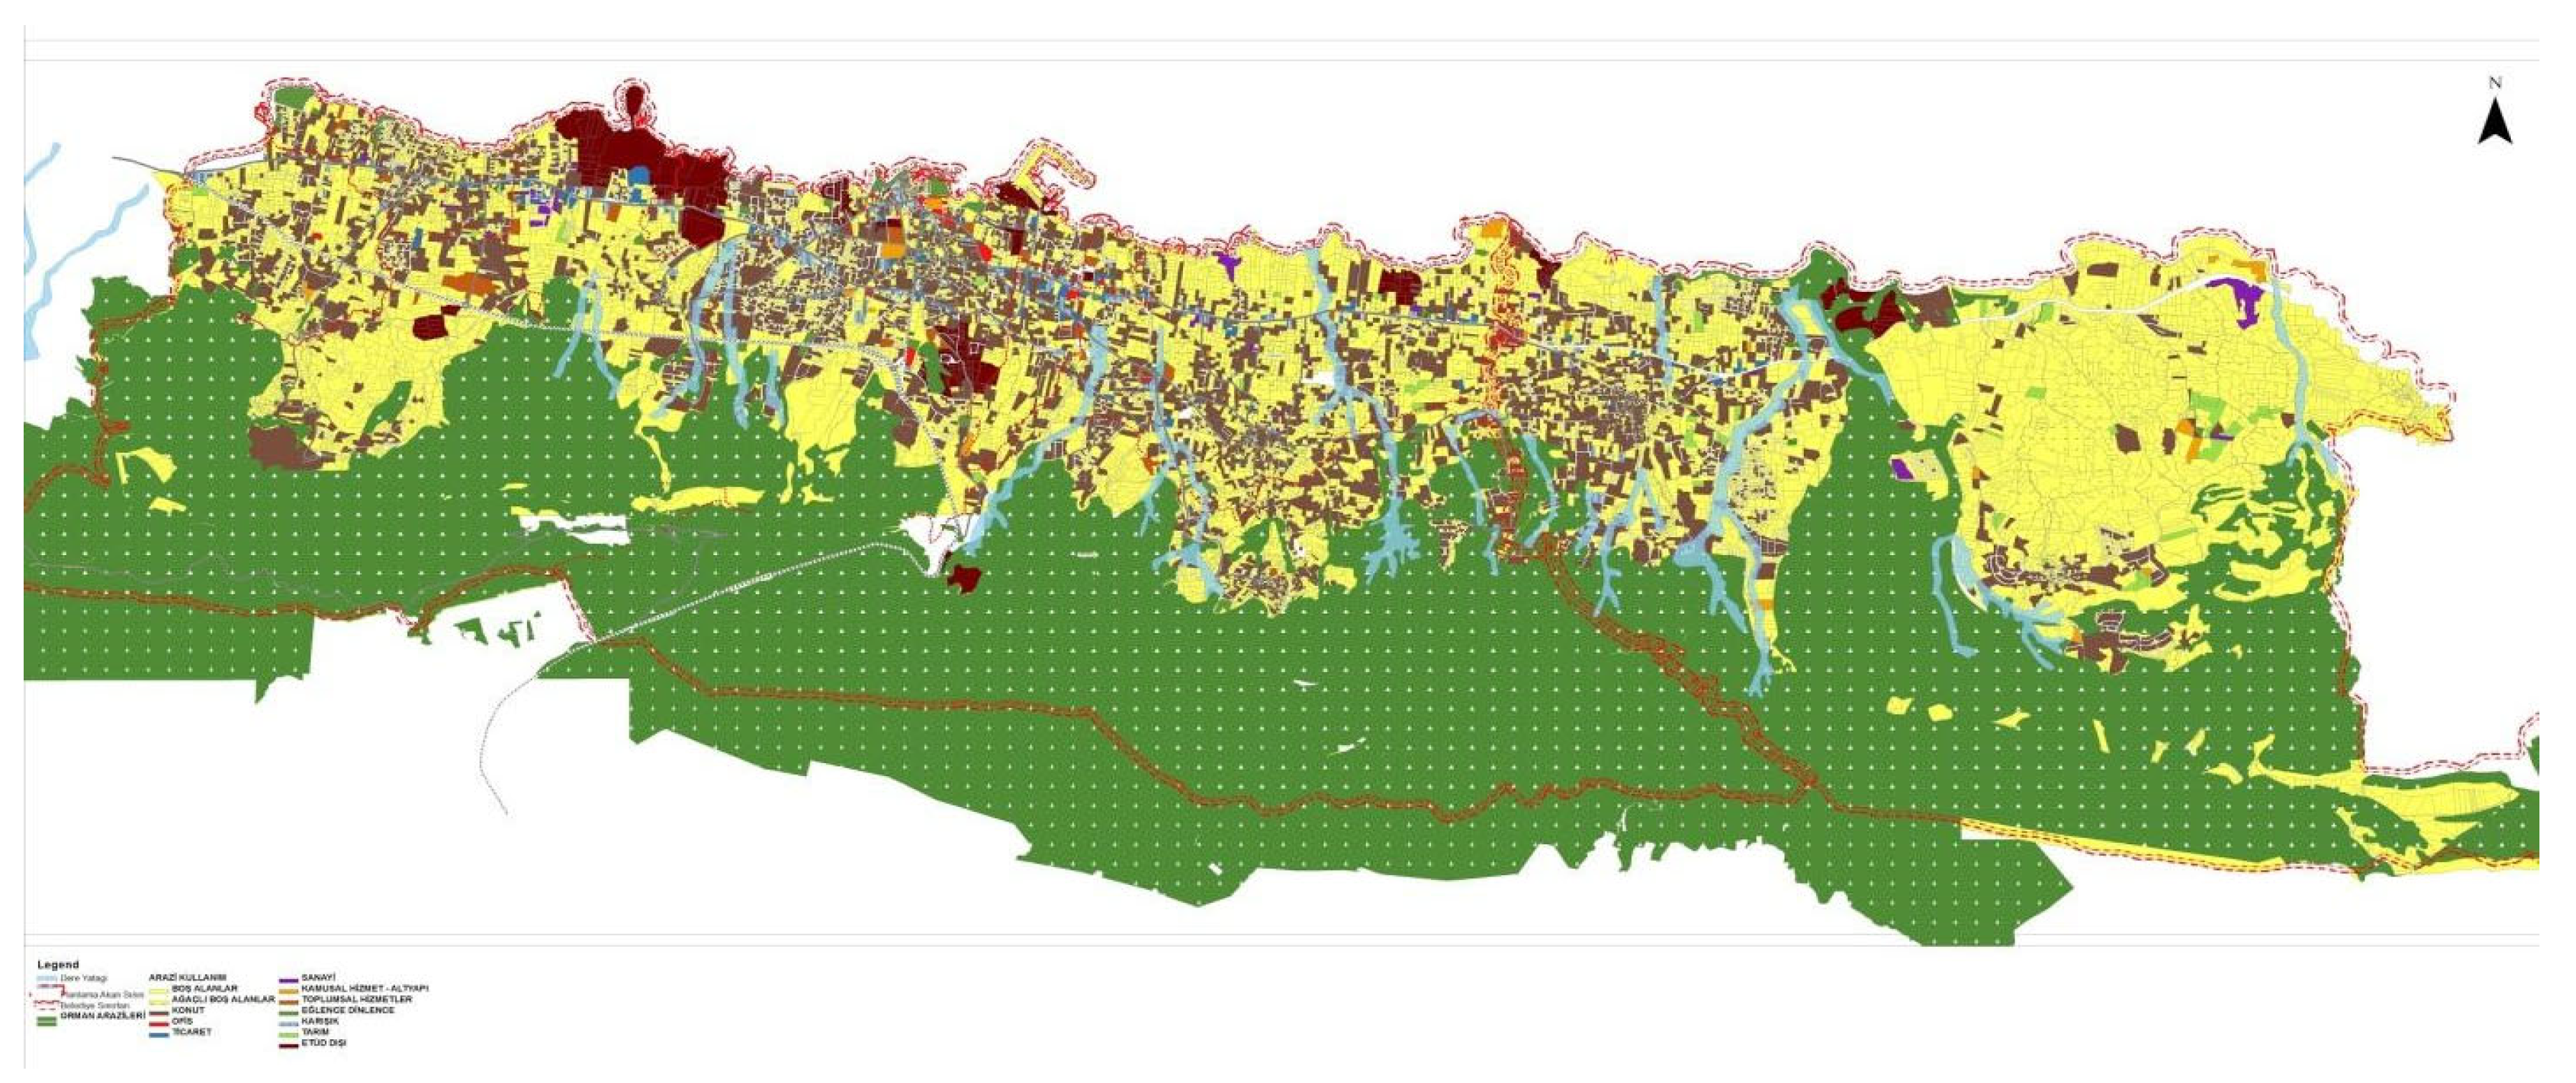
Figure 2.
Land Use Analysis of Kyrenia Region [
22].
Figure 2.
Land Use Analysis of Kyrenia Region [
22].
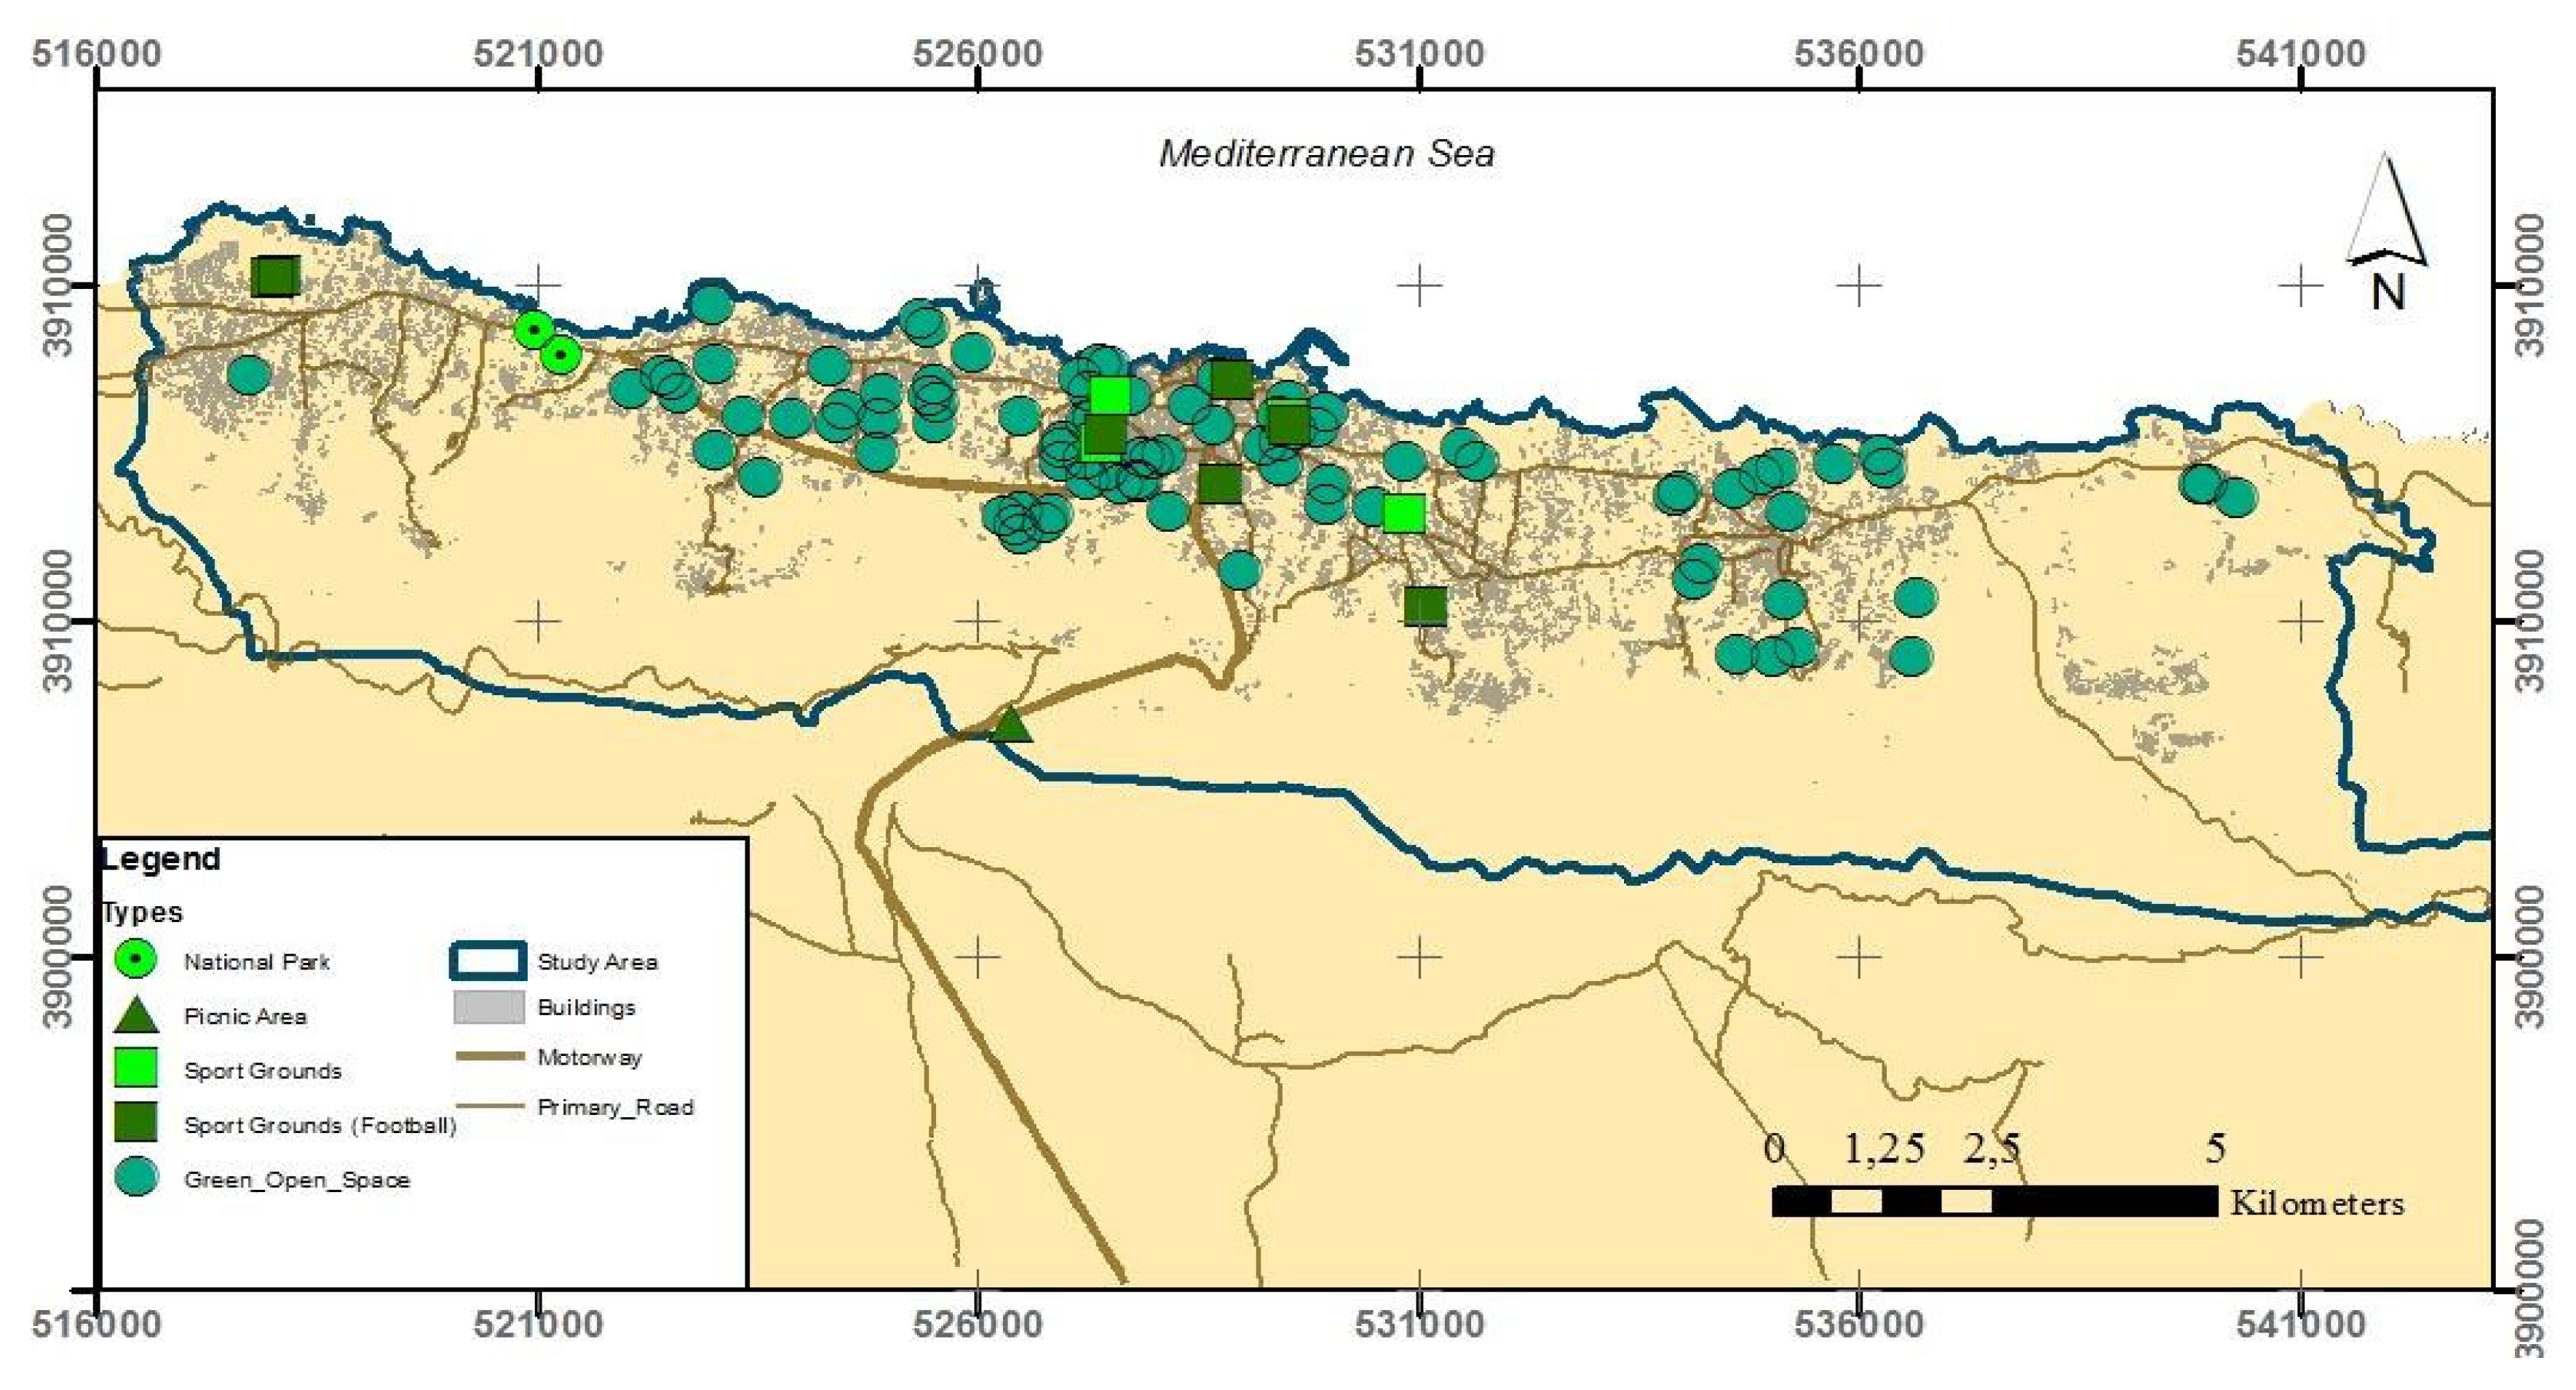
Figure 3.
Types of GOS and Developed Areas within Kyrenia Region (2018).
Figure 3.
Types of GOS and Developed Areas within Kyrenia Region (2018).
The Kyrenia Region confidently boasts a diverse range of green open spaces (GOS), such as national parks, picnic zones, sports grounds, and more. According to GIS data, national parks and picnic zones make up 62% of the total area, while sports grounds cover 12% and GOS areas cover 25% with a total of 175,735 square meters.
3. Materials and Methods
Local offices provided data on GOS located within Kyrenia (Girne), Karava (Alsancak), and Agios Epiktitos (Çatalköy) cities. It can be confidently stated that the information gathered is accurate and reliable. The collected data was converted into a geodatabase using GIS and conversion tools. The locations of the GOS were verified using Google Maps and satellite images from local offices. Additionally, data files were developed in the World Geodetic System 1984 36 North. Supportive data, such as building or road network vector geographical data, is confidently obtained from Open Street Map data services and updated by editing in GIS software. The 2018 Kyrenia Master Plan GIS data files are also confidently used for updates. The information about the relative data and sources used is given below.
Table 1.
Spatial Data Sources.
Table 1.
Spatial Data Sources.
| Road Network |
OpenStreetMap |
| Buildings |
Town Planning Office, Google Earth, OpenStreetMap |
| Green Space |
Town Planning Office, Google Earth, OpenStreetMap, Local Offices |
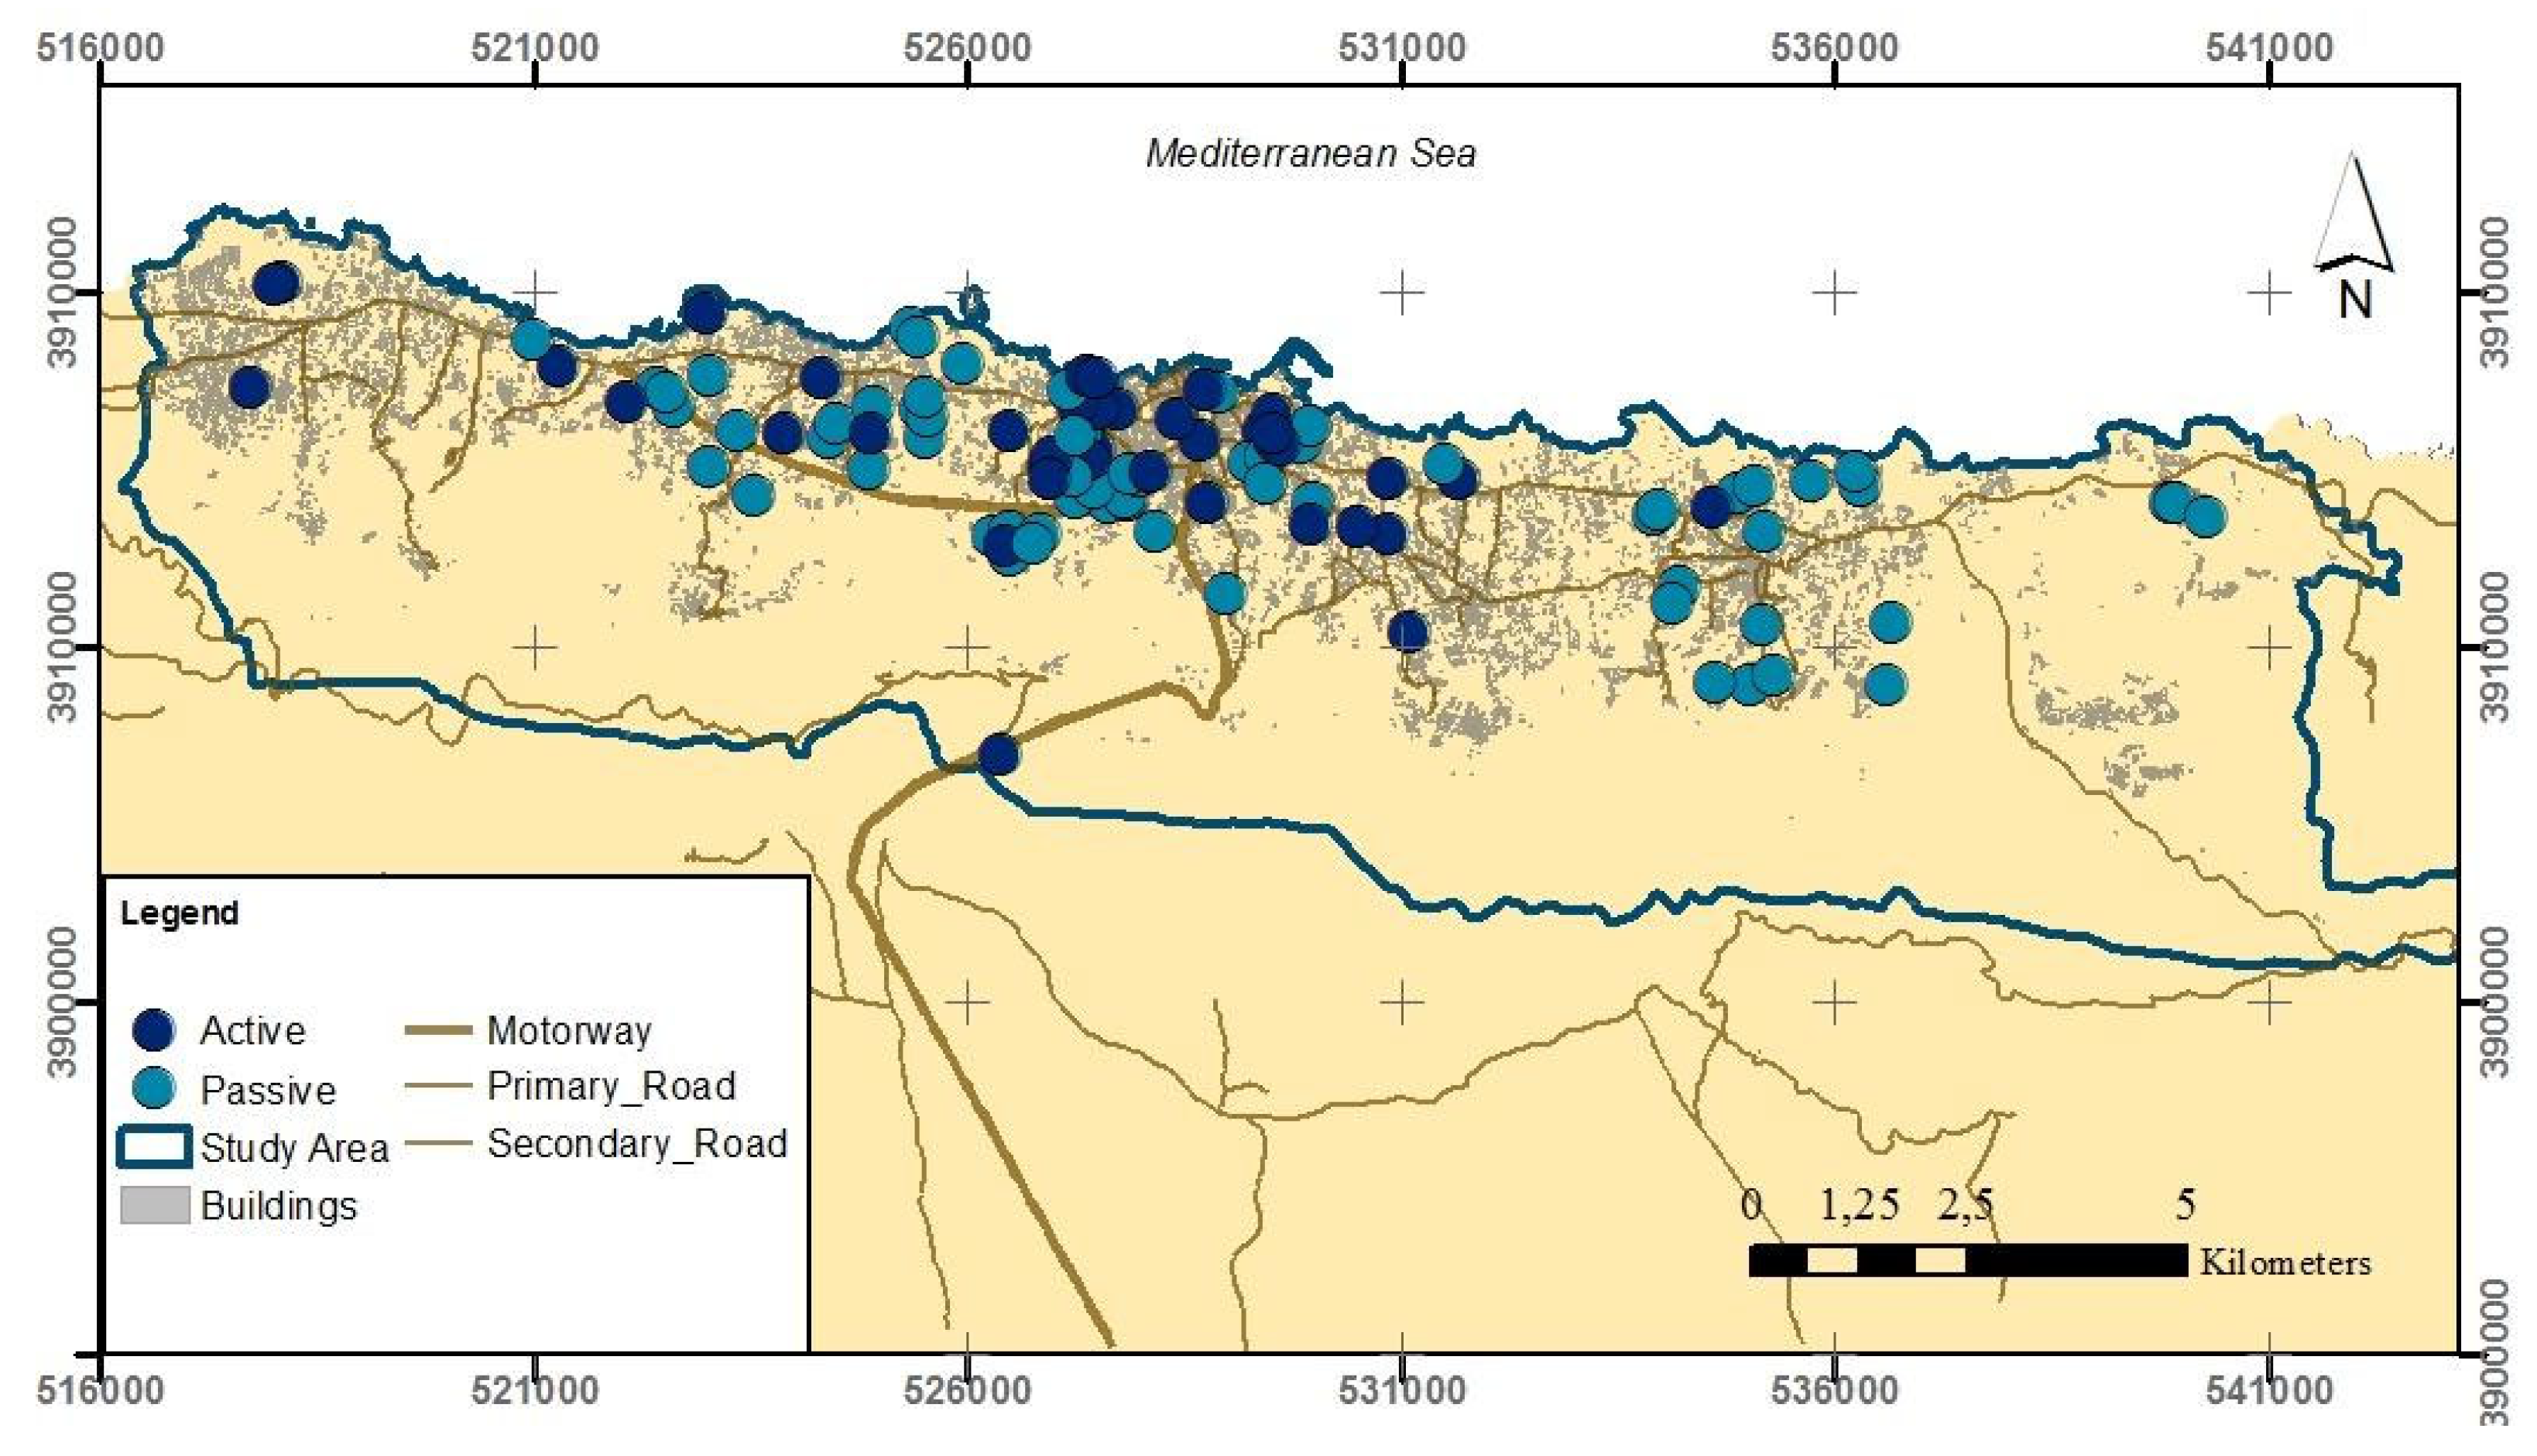
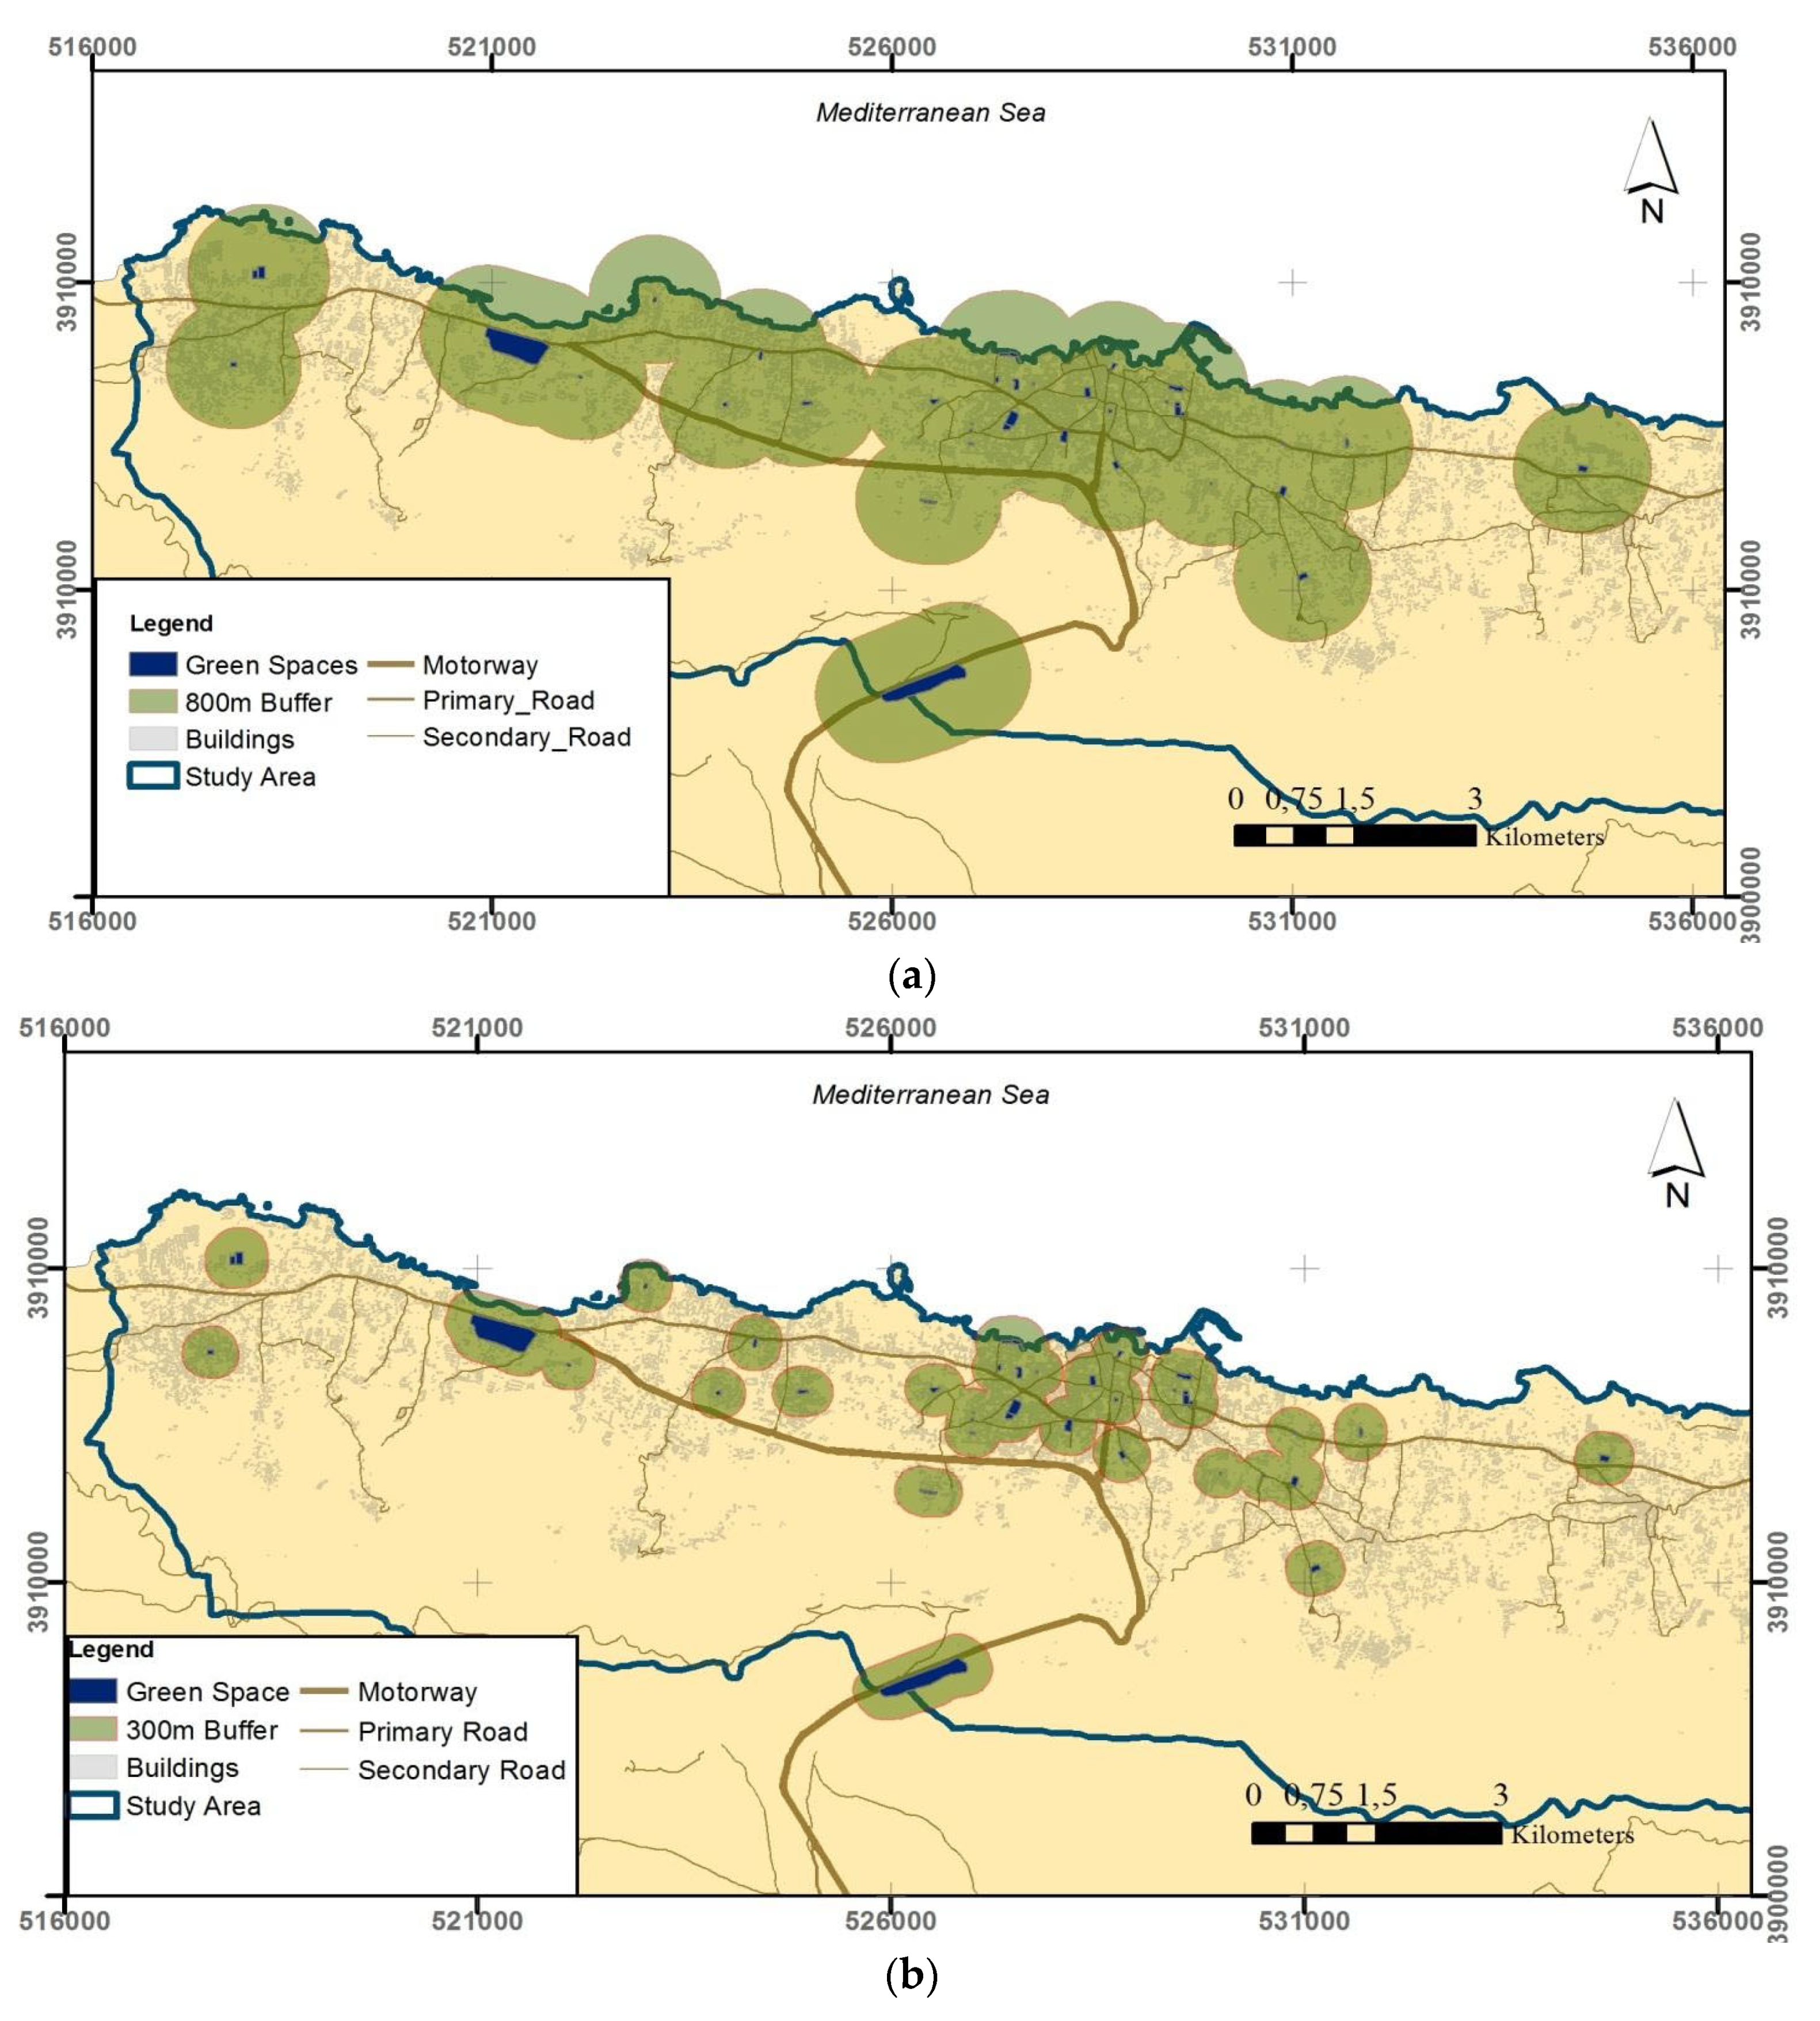
GIS software was used to analyse the accessibility of various parks and sports grounds in the Kyrenia region. A 300-meter buffer was applied to Kyrenia (Girne), Karava (Alsancak), and Agios Epiktitos (Çatalköy) to measure the building accessibility ratio. The analysis encompassed areas designated for recreational and open-air activities. The buffer analysis will encompass active areas, and district parks will also be included in the 5000m accessibility analysis. Furthermore, the population and GOS ratio have been analysed for comparison with other urban areas. To initiate the analysis, classify open/green spaces as either active or inactive for further buffer analysis (see
Figure 4).
Apart from this, we can also define open and green spaces as active and passive according to their use. Active green spaces include children's playgrounds, parks, picnic and promenade areas, zoos and other similar areas open to the use of society.
Passive green areas are those that are not open to the public and/or are organised for purposes such as protection, aesthetics, not used for recreation and entertainment, and cannot be used for active use for topographical reasons, wooded areas arranged as a protective band between two uses, roadsides, reliefs and other similar areas.
The Kyrenia region boasts a total of 103 green open spaces (GOS), out of which 39 are currently active (refer to
Figure 4). All GOS undergo regular checks for functionality and usage, with some areas consisting solely of planted trees and others remaining empty. Furthermore, certain GOS serve as car parks for various land use functions, including tourism facilities and faculty building car parks. Despite being registered as green spaces, they are unfortunately not being utilized to their full potential. The classification of passive GOS has been done in this manner. Active areas are analyzed using parameters based on literature research from various studies.
Table 2 presents different approaches and distance parameters for various levels of spatial scale in urban areas. A distance of 300-400 meters is commonly used in many case studies from different countries to measure the accessibility of GOS at the neighborhood level. It is important to note that proximity analysis at the quarter or district level may vary from 800 to 1600 meters, while at the city/urban scale it can differ from 1000 to 5000 meters. For GIS analysis, a 300-meter proximity analysis is primarily selected as it has been shown by Davand et al. (2014) to have a positive effect on mental health indicators and blood pressure. To achieve a 'walkable distance' in the Mediterranean climate of Cyprus, a distance of 800 meters is preferred. Given the hot and humid summers experienced in Kyrenia, it can be challenging to walk during certain periods. Hence, a closer distance value has been selected from the table. For the analysis of urban forests or large picnic areas, a distance of 5000 meters has been used.
In addition to the table provided above, various distance approaches are used to calculate accessibility based on time, such as 5, 5-15, 15-30, and 30+ minutes [33].
Network distance or network time analyses are widely acknowledged as more realistic than the Euclidean distance method. The analysis of network distance and time may vary depending on the urban development pattern or layout. Incorporating Euclidean distance parameters into network distance analysis will be compared in this study. Moreover, better results can be achieved in the Kyrena Region by combining accessibility values for different GOS areas with population data. It is worth noting that combining population data is challenging due to outdated information within the GIS environment.
Buildings situated in the eastern and western parts of the study area have limited accessibility to green spaces within a 300-meter buffer or network analysis. In contrast, buildings in the central zone have greater accessibility. The data in
Figure 5 a-b confidently support this conclusion. This is a result of the piecemeal projects and low-density suburban development in the eastern and western parts, which have led to the formation of small, fragmented green spaces.
The analysis of the Kyrenia region's buildings was extended to 800 meters, in addition to the 300-meter distance. The results of the 800-meter buffer analysis demonstrate a significant increase in accessibility for buildings, as illustrated in
Figure 6(a-b). Moreover, the accessibility zones of 5000 meters encompass vast urban areas, including Karavas National Park and Kyrenia Mountain Pass picnic zone, as depicted in
Figure 7(a-b).
4. Results and Discussion
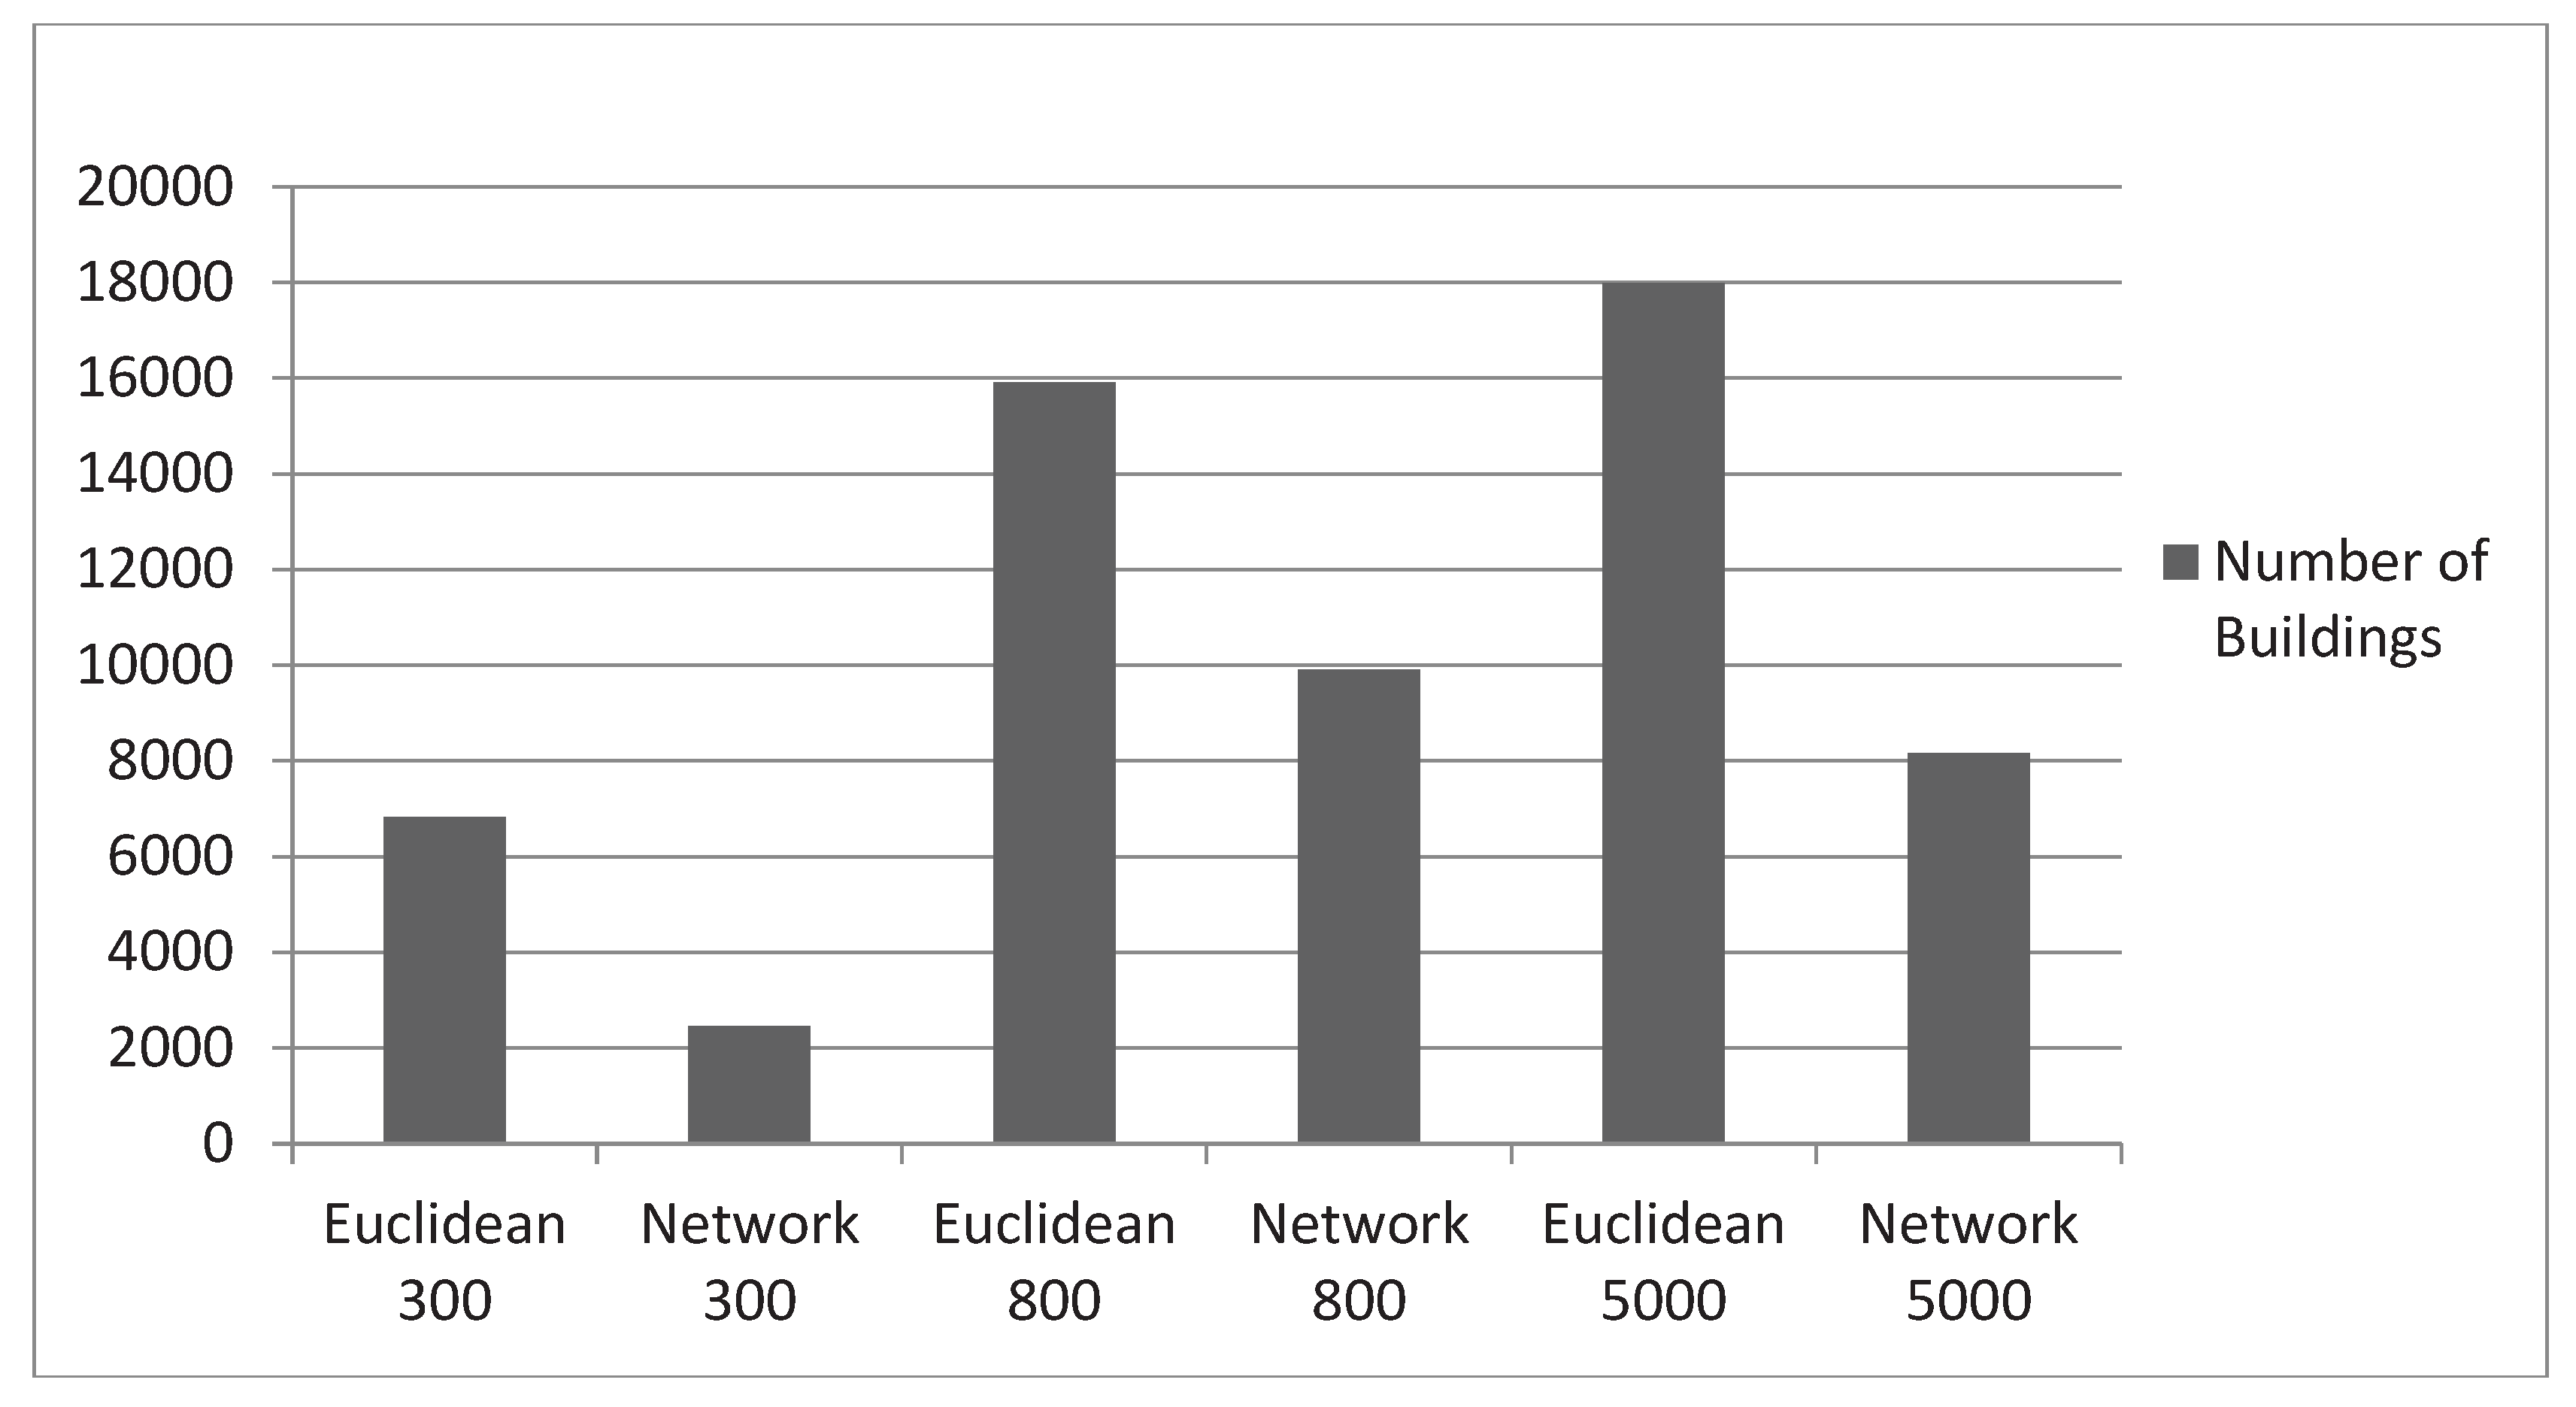
In addition to the existing information, it is interesting to observe that the majority of buildings in the study area, approximately 62%, have access to GOS within an 800m buffer zone. This indicates that a significant portion of the buildings are conveniently located within a reasonable walking distance to GOS facilities. However, when considering network distance accessibility, the percentage drops to 39%, suggesting that the actual travel distance to reach GOS facilities may be longer than expected. Furthermore, it is worth highlighting that a substantial number of buildings, around 70% or 18,000 in total, are situated within a 5000m buffer zone of an urban forest or picnic area. This indicates that a significant portion of the study area benefits from the proximity to green spaces, providing residents with opportunities for outdoor activities and recreational pursuits. However, when network distance analysis is taken into account, the percentage decreases to 32%, suggesting that the actual traveldistance to reach these green spaces may be greater than initially perceived.
The results presented in the text clearly indicate that network distance accessibility is considerably lower than Euclidean distance accessibility. This disparity can be attributed to the fact that network lengths tend to be longer than Euclidean distances. This is primarily because it takes more time to travel along the road network, as mentioned in reference [
19]. It is important to highlight that the Kyrenia Region experiences linear urban growth and has a road network in place. However, the combination of elevated terrain and road infrastructure poses challenges to connectivity, resulting in a significant increase in network distance compared to densely populated urban areas. This, in turn, has a negative impact on accessibility within the region. Given these circumstances, it becomes crucial to have readily available and comprehensive General Overviews (GOS) for urban areas or neighbourhood units. These overviews should meet the highest standards in terms of quality and quantity. Unfortunately, such amenities are currently lacking in the Kyrenia region, which further exacerbates the accessibility issues faced by its residents.
In addition to the information provided, it is worth noting that the Kyrenia region is known for its stunning natural beauty and diverse flora and fauna. The abundance of green and open spaces not only contributes to the aesthetic appeal of the area but also provides numerous recreational opportunities for residents and visitors alike. The active green areas in Kyrenia are carefully maintained and offer a range of facilities such as parks, gardens, and sports fields. These spaces are designed to promote physical activity, social interaction, and overall well-being. They serve as popular gathering spots for families, friends, and community events. Given the increase in population over the years, the demand for housing has also risen. As a result, the number of housing units in the Kyrenia region has grown significantly. This growth has put pressure on the available green spaces, leading to a decrease in the ratio of active green area per person. Recognizing the importance of maintaining a healthy living environment, the local authorities have been actively working towards preserving and expanding the green spaces in the region. Efforts are being made to create new parks, improve existing ones, and implement sustainable urban planning practices. By prioritizing the preservation of green areas and ensuring their accessibility to all residents, the Kyrenia region aims to meet the minimum ratio standards set by the World Health Organization (WHO) and provide a high quality of life for its growing population.
Green open space detail plans should be included in urban master plans rather than zone plans. This will ensure a hierarchical distribution of these areas, improving connectivity within the region. Piecemeal housing projects and design schemes can disrupt this hierarchical pattern. Expanding green spaces throughout the region will enhance the livability of the city.
5. Conclusions
The study confidently asserts that the accessibility of green and open spaces in Kyrenia, Karavas, and Agios Epiktitos can be improved by implementing measures identified through the use of Euclidean and network distance methods. These methods provide valuable insights into the spatial distribution of green spaces and help identify areas where improvements can be made. By analysing the accessibility of green and open spaces in these three coastal cities, the study highlights the importance of having access to such spaces at various levels, including residential, neighborhood, quarter, district, and city levels. The results of the study indicate that the accessibility of active or accessible green spaces is currently limited within a 300-meter radius of buildings in all three cities. This finding underscores the need for better design and spatial distribution of green spaces in the Kyrenia region. Currently, there is a lack of nearby residential or pocket green spaces, which further emphasizes the urgency of addressing this issue. To optimize urban living and promote a healthier environment, it is crucial to ensure that green spaces are strategically located and easily accessible to residents. Urban forests, for example, can play a significant role in providing larger green areas that offer recreational opportunities and contribute to the overall well-being of the community. Experts in the field widely acknowledge that the design of urban green spaces requires careful consideration of both organizational structure and spatial distribution. By implementing the measures identified through the use of Euclidean and network distance methods, the accessibility of green and open spaces in Kyrenia, Karavas, and Agios Epiktitos can be improved, enhancing the quality of life for residents and promoting a more sustainable and vibrant urban environment.
Unfortunately, this type of pattern does not exist in the study area. Moreover, planning offices and municipalities have been using very old legal frameworks which also support incremental housing growth in this manner. Modern planning or design tools may be supportive within this process. It should be emphasized that, the Master Plan that covered Kyrenia and Agios Epiktitos cities was published in 2018. Until 2018, there were zoning ordinances for these cities from 1993 to 2018. These zoning ordinances only propose some building regulations and functional distribution of the basic land use types within the cities. Unfortunately, there isn’t any detailed plan for green and open spaces or landscape elements. Incremental development of housing sites and fragmentary growth often expose several problems for green/open space planning. Sadly, there is no trend in the field of analysis. Planning approvals raise green spaces within the city that are limited and useless. In linear urban areas it is not efficient to access different GOS areas equally in general. The local service areas and suburban zones should be supported by using mix-use land use patterns for improving accessibility within linear growth type urban zones. Therefore, smart growth and compact growth policies should be implemented for spatially sustainable urban growth processes.
Funding
This research received no specific grant from any funding agency in the public, commercial, or not-for-profit sectors.
Conflicts of Interest
The authors declare that they have no conflict of interest.
References
- United Nations (UN), 2012. World urbanization prospects the 2011 revision. World Urbanization Prospects, Department of Economic and Social Affairs.
- Blanco, H.; Alberti, M.; Forsyth, A.; Krizek, K.J.; Rodriguez, D.A.; Talen, E.; Ellis, C. Hot, congested, crowded and diverse: Emerging research agendas in planning. Progress in Planning 2009, 71, 153–205. [Google Scholar] [CrossRef]
- Sanesi, G.; Chiarello, F. Residents and urban green spaces: The case of Bari. Urban forestry and Urban Greening 2006, 4, 125–134. [Google Scholar] [CrossRef]
- Roy, S.; Byrne, J.; Pickering, C. A systematic quantitative review of urban tree benefits, costs, and assessment methods across cities in different climatic zones. Urban Forestry and Urban Greening 2012, 4, 351–363. [Google Scholar] [CrossRef]
- Oberndorfer, E.; Lundholm, J.; Bass, B.; Coffman, R.R.; Doshi, H.; Dunnett, N.; Gaffin, S.; Köhler, M.; Liu, K.K.Y.; Rowe, B. Green Roofs as Urban Ecosystems: Ecologiacal Structures, Functions, and Services. BioScience 2007, 57, 823–833. [Google Scholar] [CrossRef]
- Kuo, F.E.; Bacaicoa, M.; Sullivan, W.C. Transforming inner-city landscapes: Trees, sense of safety and preference. Environment and Behaviour 1998, 30, 28–59. [Google Scholar] [CrossRef]
- Cheiesura, A. The role of urban parks for the sustainable city. Landscape and urban Planning 2004, 68, 129–138. [Google Scholar] [CrossRef]
- Maas, J.; Verheij, R.A.; de Uries, S.; Spreeuwenberg, P.; Schllevis, F.G.; Groenwegen, P.P. Morbidity is related to a green living environment. Joournal of Epidemiology and Community Health 2009, 63, 967–997. [Google Scholar] [CrossRef]
- Anon. Surgeon general’s report on physical activity and health. Journal of the American Medical Association 1996, 276, 522. [Google Scholar] [CrossRef]
- Barton, J.; Pretty, J. What is the best dose of nature and green exercise for improving menthal health? A multi-study analysis. Environmental Science and Technology 2010, 44, 3947–3955. [Google Scholar] [CrossRef] [PubMed]
- Sandström, U.G.; Angelstam, P.; Khakee, A. Urban comprehensive planning – identifying barriers for the maintenance of functional habitat networks. Landscape Urban Planning 2006, 75, 43–57. [Google Scholar] [CrossRef]
- Triguero-Mas, M.; Dadvand, P.; Cirach, M.M.; Martínez, D.; Medina, A.; Mompart, A.; Basagaña, X.; Gražulevıčıenė, R.; Nıeuwenhuıjsen, M.J. Natural outdoor environments and mental and physical health: relationships and mechanisms. Environment International 2015, 77, 35–41. [Google Scholar] [CrossRef] [PubMed]
- Kabisch, N.; Strohbach, M.; Haase, D.; Kronenberg, J. Urban green space availability in European cities. Ecological Indicators 2016, 70, 586–596. [Google Scholar] [CrossRef]
- Annerstedt van den Bosch, M.; Mudu, P.; Uscila, V.; Barrdahl, M.; Kulinkina, A.; Staatsen, B.; Swart, W.; Kruize, H.; Zurlyte, I.; Egorov, A.I. Development of an urban green space indicator and the public health rationale. Scand J Public Health 2016, 44, 159–167. [Google Scholar] [CrossRef] [PubMed]
- World Health Organization. ‘Urban Planning, Environment and Health: From Evidence to Policy Action’, 2010 (World Health Organization, ‘Urban Planning, Environment and Health:From Evidence to Policy Action’, 2010, [Online] available at http://www.euro.who.int/__data/assets/pdf_file/0004/114448/E93987.pdf?
- Herzele, V.; Wiedeman, T. A Monitoring Tool for the Provision for Accessible and Attractive Green Spaces. Elsevier Sciences: Landscape and Urban Planning 2003, 63, 109–126. [Google Scholar] [CrossRef]
- Vale, D.S.; Saraiva, M.; Pereira, M. Active accessibility: A review of operational measures of walking and cycling accessibility. Journal of Transport and Land Use 2015, 9, 1–27. [Google Scholar] [CrossRef]
- Logan, T.M.; Williams, T.G.; Nisbet, A.J.; Liberman, K.D.; Zuo, C.T.; Guikema, S.D. Evaluating urban accessibility: leveraging open-source data and analytics to overcome existing limitations. Urban Analytics and City Science 2017, 46, 897–913. [Google Scholar] [CrossRef]
- Macedo, J.; Haddad, M.A. Equitable distribution of open space: Using spatial analysis to evaluate urban parks in Curitiba, Brazil. Environment and Planning B: Planning and Design 2016, 43, 1096–1117. [Google Scholar] [CrossRef]
- La Rosa, D. Accessibility to greenspaces: GIS based indicators for sustainable planning in a dense urban context. Ecological Indicators 2014, 42, 122–134. [Google Scholar] [CrossRef]
- Chen, Y.; Yue, W.; La Rosa, D. Which communities have better accessibility to green space? An investigation into environment inequality using big data. Landscape and Urban Planning 2020, 204, 13919. [Google Scholar] [CrossRef]
- SPO Girne Çatalköy İmar Planı Mevcut Durum Rapor 2017.
- Davand.
- Gupta, K.; Roy, A.; Luthra, K.; Mahavir, S.M. GIS based analysis for assessing the accessibility at hierarchical levels of urban green spaces. Urban Forestry & Urban Greening 2016, 18, 198–211. [Google Scholar]
- Fan, P.; Xu, L.; Yue, W.; Chen, J. Accessibility of public urban green space in an urban periphery: The case of Shanghai. Landscape and Urban Planning 2017, 165, 177–192. [Google Scholar] [CrossRef]
- European Commission, 2001. Towards A Local Sustainability Profile - European Common Indicators Methodology Sheets retrieved from http://ec.europa.eu/environment/urban/pdf/local_sustainability_en.pdf.
- Wood, L.; Hooper, P.; Foster, S.; Bull, F. Public green spaces and positive mental health–investigating the relationship between access, quantity and types of parks and mental wellbeing. Health & Place 2017, 48, 63–71. [Google Scholar] [CrossRef]
- Neema, M.N.; Ohgai, A. Multitype green-space modeling for urban planning using GA and GIS. Environment and Planning B: Planning and Design 2013, 40, 447–473. [Google Scholar] [CrossRef]
- Ye, C.; Hu, L.; Min Li, M. Urban green space accessibility changes in a high-density city: A case study of Macau from 2010 to 2015. Journal of Transport Geography 2018, 66, 106–115. [Google Scholar] [CrossRef]
- Oh, K.; Jeong, K. Assessing the spatial distribution of urban parks using GIS. Landscape and Urban Planning 2007, 82, 25–32. [Google Scholar] [CrossRef]
- Shi, L.; Halik, Ü.; Abliz, A.; Mamat, Z.; Welp, M. Urban Green Space Accessibility and Distribution Equity in an Arid Oasis City: Urumqi, China. Forests 2020, 11, 690. [Google Scholar] [CrossRef]
- Xing, L.; Liu, Y.; Wang, B.; Wang, Y.; Liu, H. An environmental justice study on spatial access to parks for youth by using an improved 2SFCA method in Wuhan, China. Cities 2020, 96, 102405. [Google Scholar] [CrossRef]
|
Disclaimer/Publisher’s Note: The statements, opinions and data contained in all publications are solely those of the individual author(s) and contributor(s) and not of MDPI and/or the editor(s). MDPI and/or the editor(s) disclaim responsibility for any injury to people or property resulting from any ideas, methods, instructions or products referred to in the content. |
© 2024 by the authors. Licensee MDPI, Basel, Switzerland. This article is an open access article distributed under the terms and conditions of the Creative Commons Attribution (CC BY) license (http://creativecommons.org/licenses/by/4.0/).
