2.1. Finite Volume Thermofluid Network Methodology Balance Equations
The thermofluid network methodology entails the simultaneous solution of the 1D forms of the mass, energy, and momentum balance equations. The closure equations for the balance equations include models for the component specific characteristics such as the rate of heat transfer, power, frictional pressure drop, or pressure rise due to work input. The network method discretizes a flow system into nodes and elements. The elements are control volumes representing components such as pipes, heat exchangers, or compressors in the fluid system. Each element has only one inlet and one outlet and fluid properties in the element are assumed to be taken as some weighted average between the inlet and outlet values. The nodes in the network represent connection points between elements and have multiple inlets and outlets with the fluid properties assumed to be uniform within the node. The mass and energy balance equations are solved for each node in the network, whereas the momentum balance equation is solved for each element in the network.
The differential form of the 1D steady-state mass, energy and momentum balance equations are given by
In Equations (1)–(3),
is the fluid density,
is the fluid velocity,
is the 1D spatial dimension,
is the static fluid enthalpy,
is the gravitational acceleration constant,
is the elevation,
is the volumetric heat transfer rate to the fluid control volume from its surroundings,
is the volumetric work exertion by the fluid on its surroundings,
is the fluid static pressure,
is the total pressure rise due to work done on the fluid, and
is the total pressure loss. Using the chain rule together with the differential form of the mass balance equation, and neglecting the elevation term, Equation (4) can be written as
The spatially integrated mass and energy balances that are solved for each node in the network are given by Equations (5) and (6), while ignoring the potential energy term.
In the above equations, is the mass flow rate and the subscripts and indicate the flows into and out of the node respectively. For the energy balance equation, is the heat transfer rate into the fluid elements flowing into the node, is the stagnation enthalpy and is the power (work rate) exerted by the fluid elements flowing into node on its surroundings. For a compressor element , while for a turbine element .
In Equation (7), the fundamental definition of stagnation enthalpy is used, namely
which is valid for incompressible fluids, compressible ideal gases, and compressible real gases.
As mentioned previously, the network IPCM method solves the stagnation pressures, and Equation (4) should be cast accordingly. We therefore need to find the appropriate formulation for stagnation pressure as a function of static pressure for compressible real gas applications, which will be different from those for ideal gases or incompressible fluids. Knowing that
for all fluids, we may characterize any isentropic process by
. Therefore, we integrate between the static and stagnation states as follows:
In the case of compressible real gases, the density will not remain constant between the stagnation and static states, and since we cannot apply the ideal gas assumption, the density cannot be expressed in simple form to enable direct integration. We circumvent this difficulty by adopting a constant value for the density while ensuring that we assign the appropriate mean value between the stagnation and static states. We therefore define the mean stagnation density
as shown in the equation below, where the subscript
implies an isentropic process.
Given this, the real gas stagnation pressure can be expressed in terms of static pressure as follows:
In the application of the network methodology the value of the mean stagnation density in each node can be obtained with the sequence provided in Equation (11) as follows: (i) determine the entropy at the stagnation conditions using the known values of stagnation enthalpy and stagnation pressure with the aid of a suitable real gas fluid property library (such as CoolProp); (ii) determine the static enthalpy from the stagnation enthalpy and the velocity; (iii) obtain the static pressure using the known values of static enthalpy and entropy (which is the same value as at the stagnation conditions) with the aid of a suitable real gas fluid property library; (iv) determine the value of the mean stagnation density from Equation (11).
The formulation of the momentum balance Equation (4) may now be manipulated for compressible real gases as follows:
and then expressed in terms of stagnation pressure as
For a one-dimensional fluid control volume with a well-defined single inlet (
i) and single outlet (
e) Equation (13) can be integrated to get
where
is the average density inside the fluid element,
is the total pressure rise due to the work input, and
is the total pressure drop due to lost work, i.e., irreversibilities. Note that for a compressor
and for a turbine
, while we always have
.
The simultaneous solution of (5) and (6) for each node and (14) for each element in the network, together with appropriate boundary conditions will yield the nodal stagnation pressures and enthalpies as well as the elemental mass flow rates. Following this the static properties can be obtained from equation (11), which can then be used to determine all the other fluid properties with the aid of a suitable real gas fluid property library. Once all the fluid property values are known for the nodes, the appropriate mean values can also be determined for the elements, which in turn can be used in the calculation of the component characteristics (, , and ), which are required as inputs to the solution of the energy balance and momentum balance equations. For the current work this compressible real gas approach will be designated as M1.
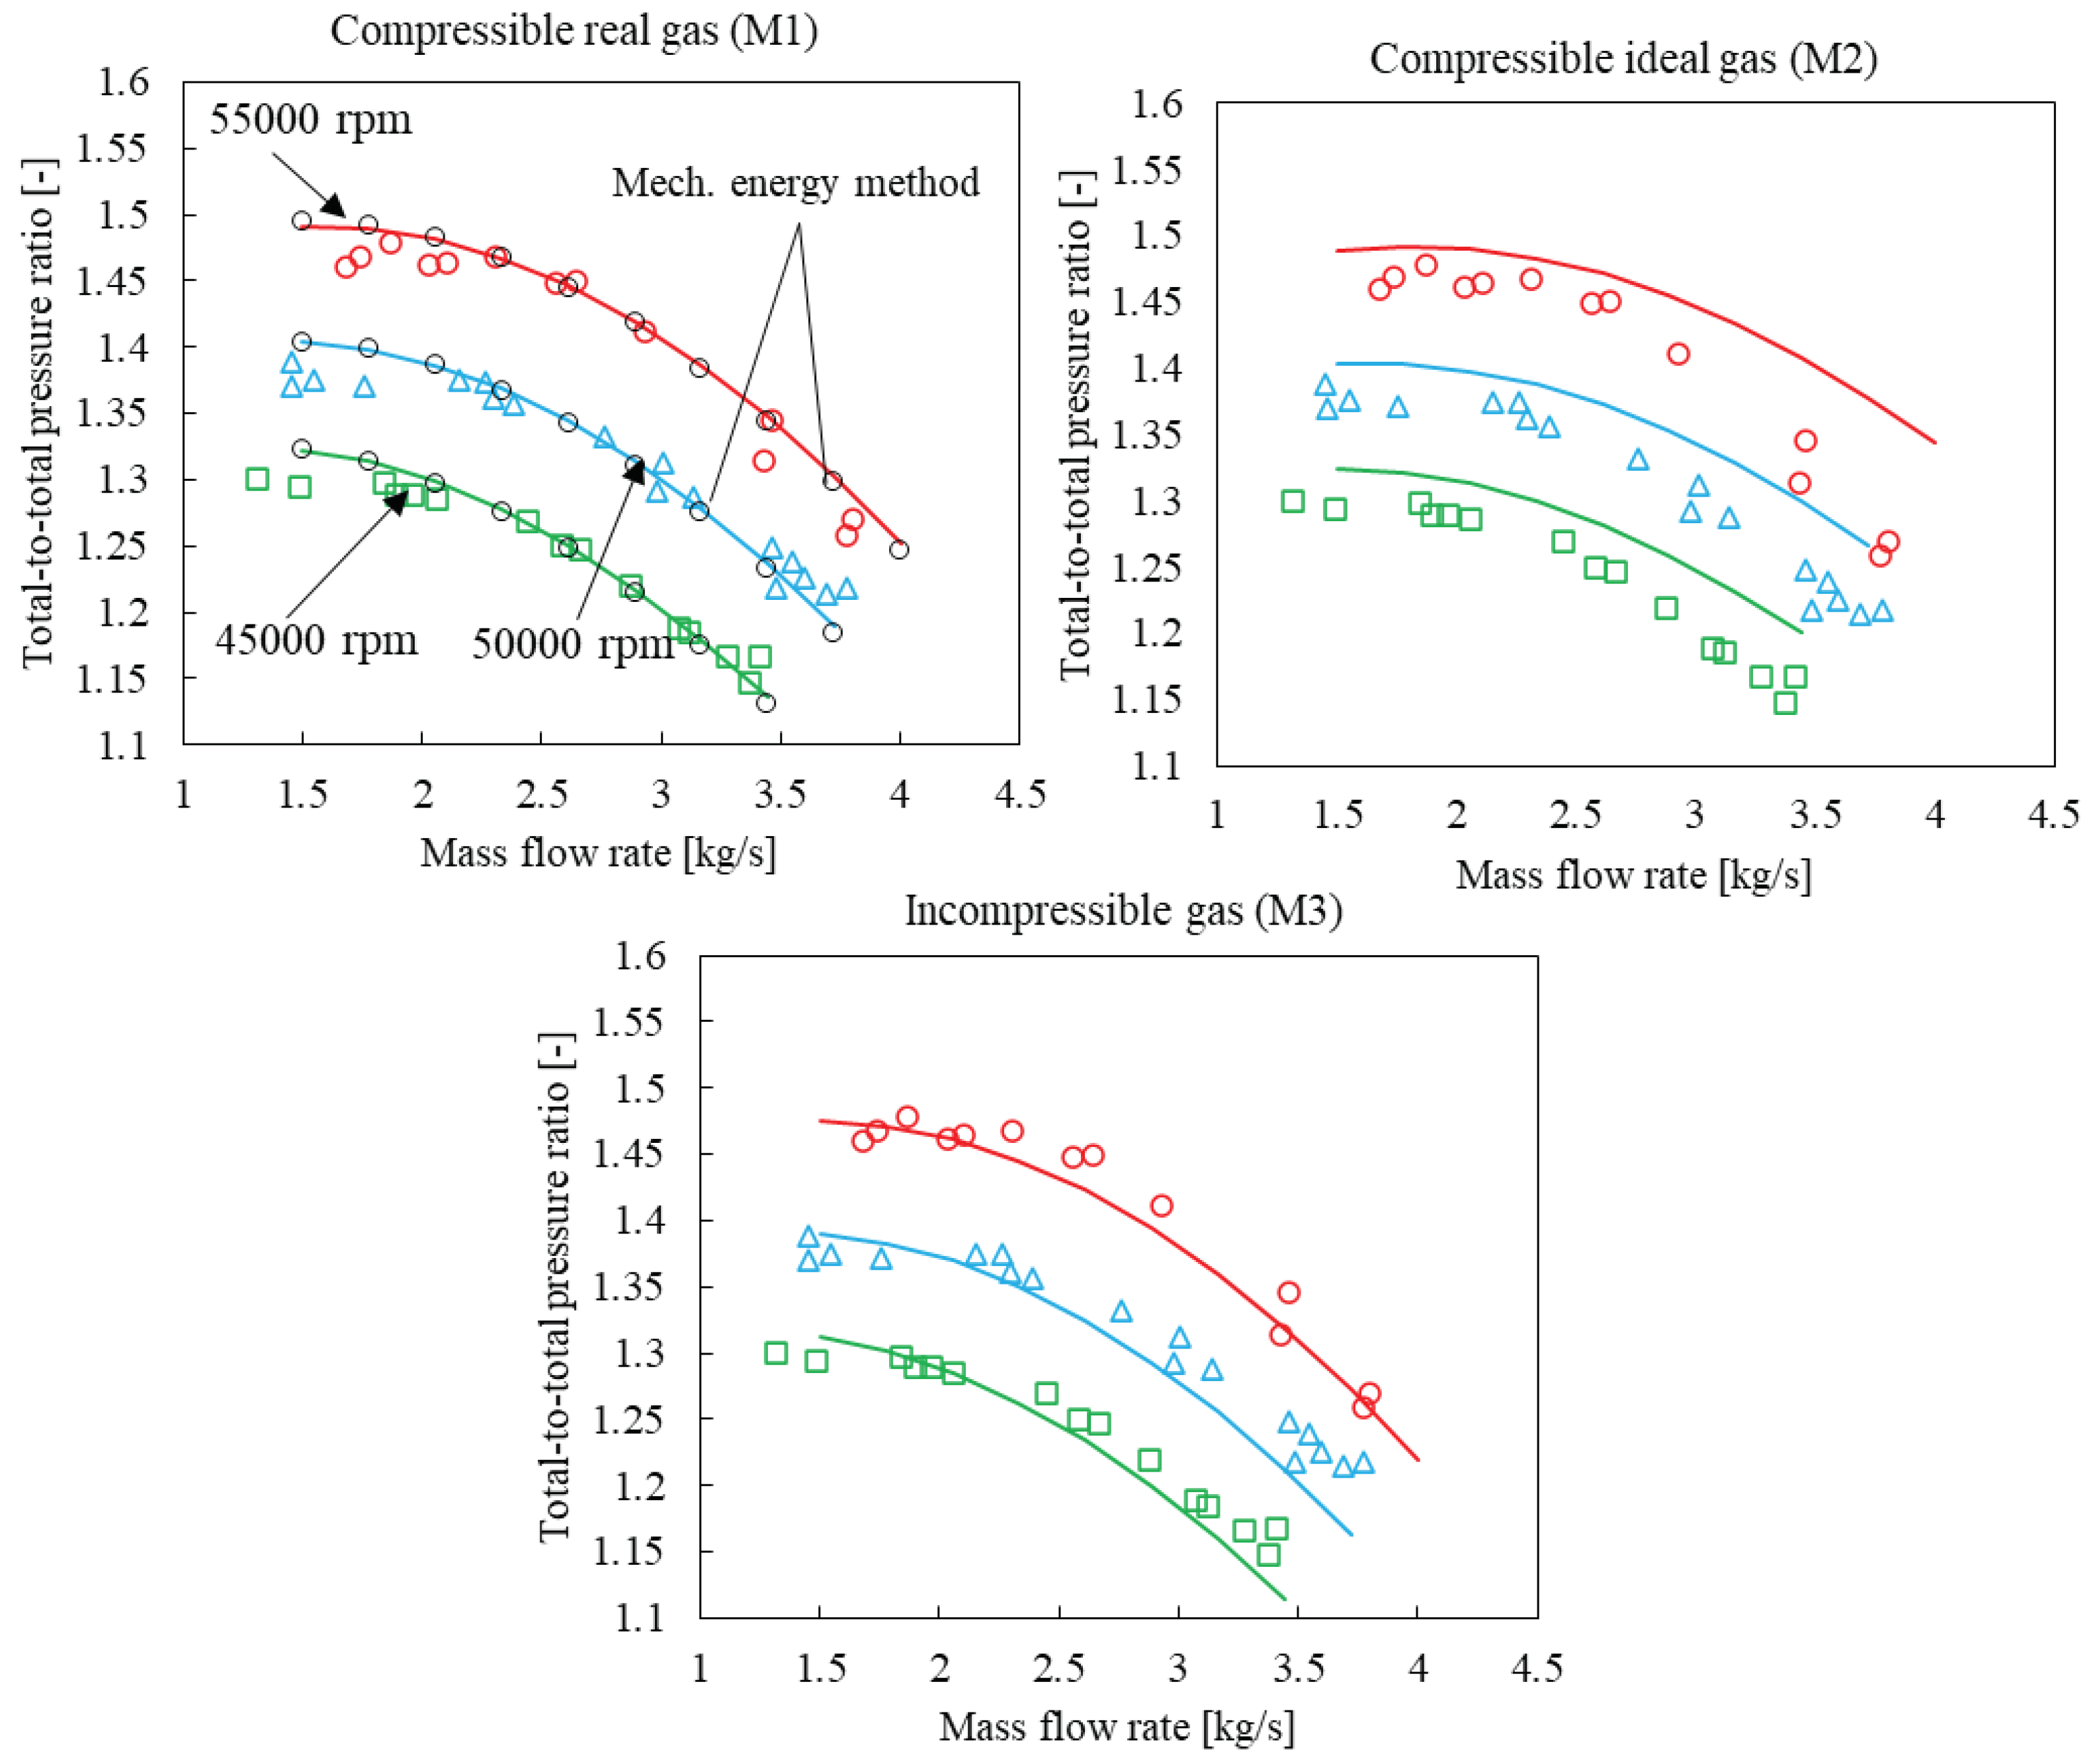
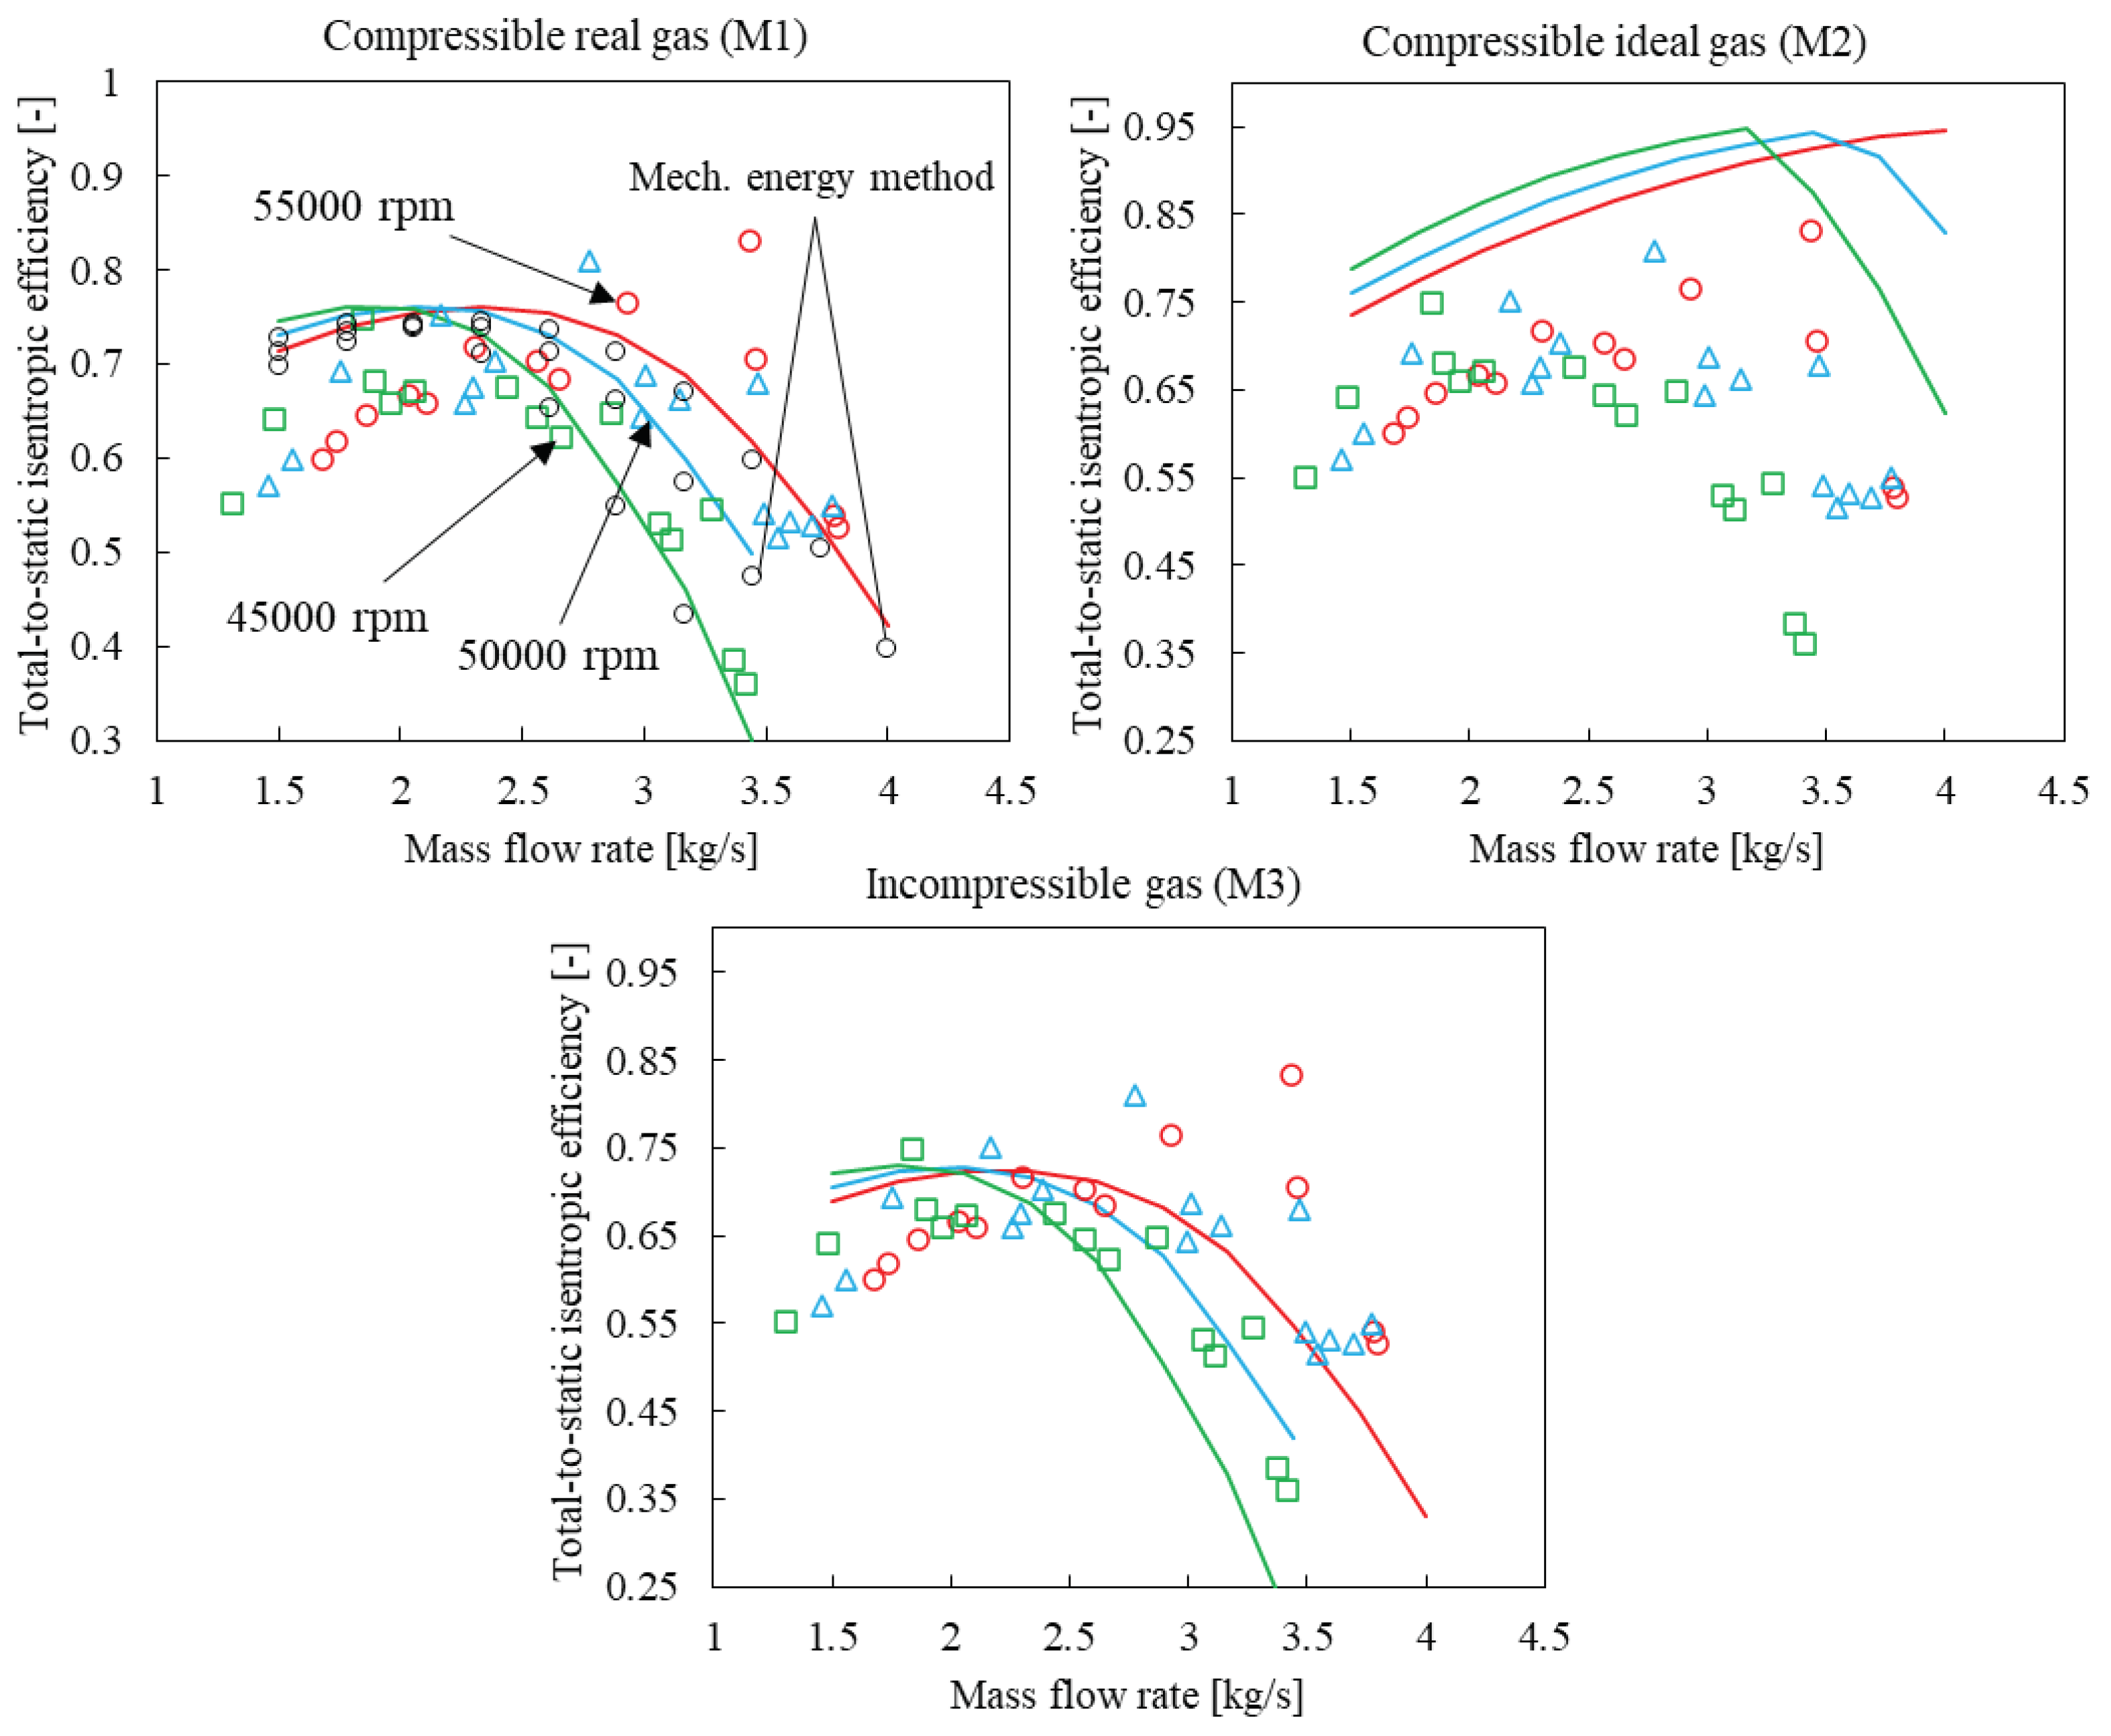
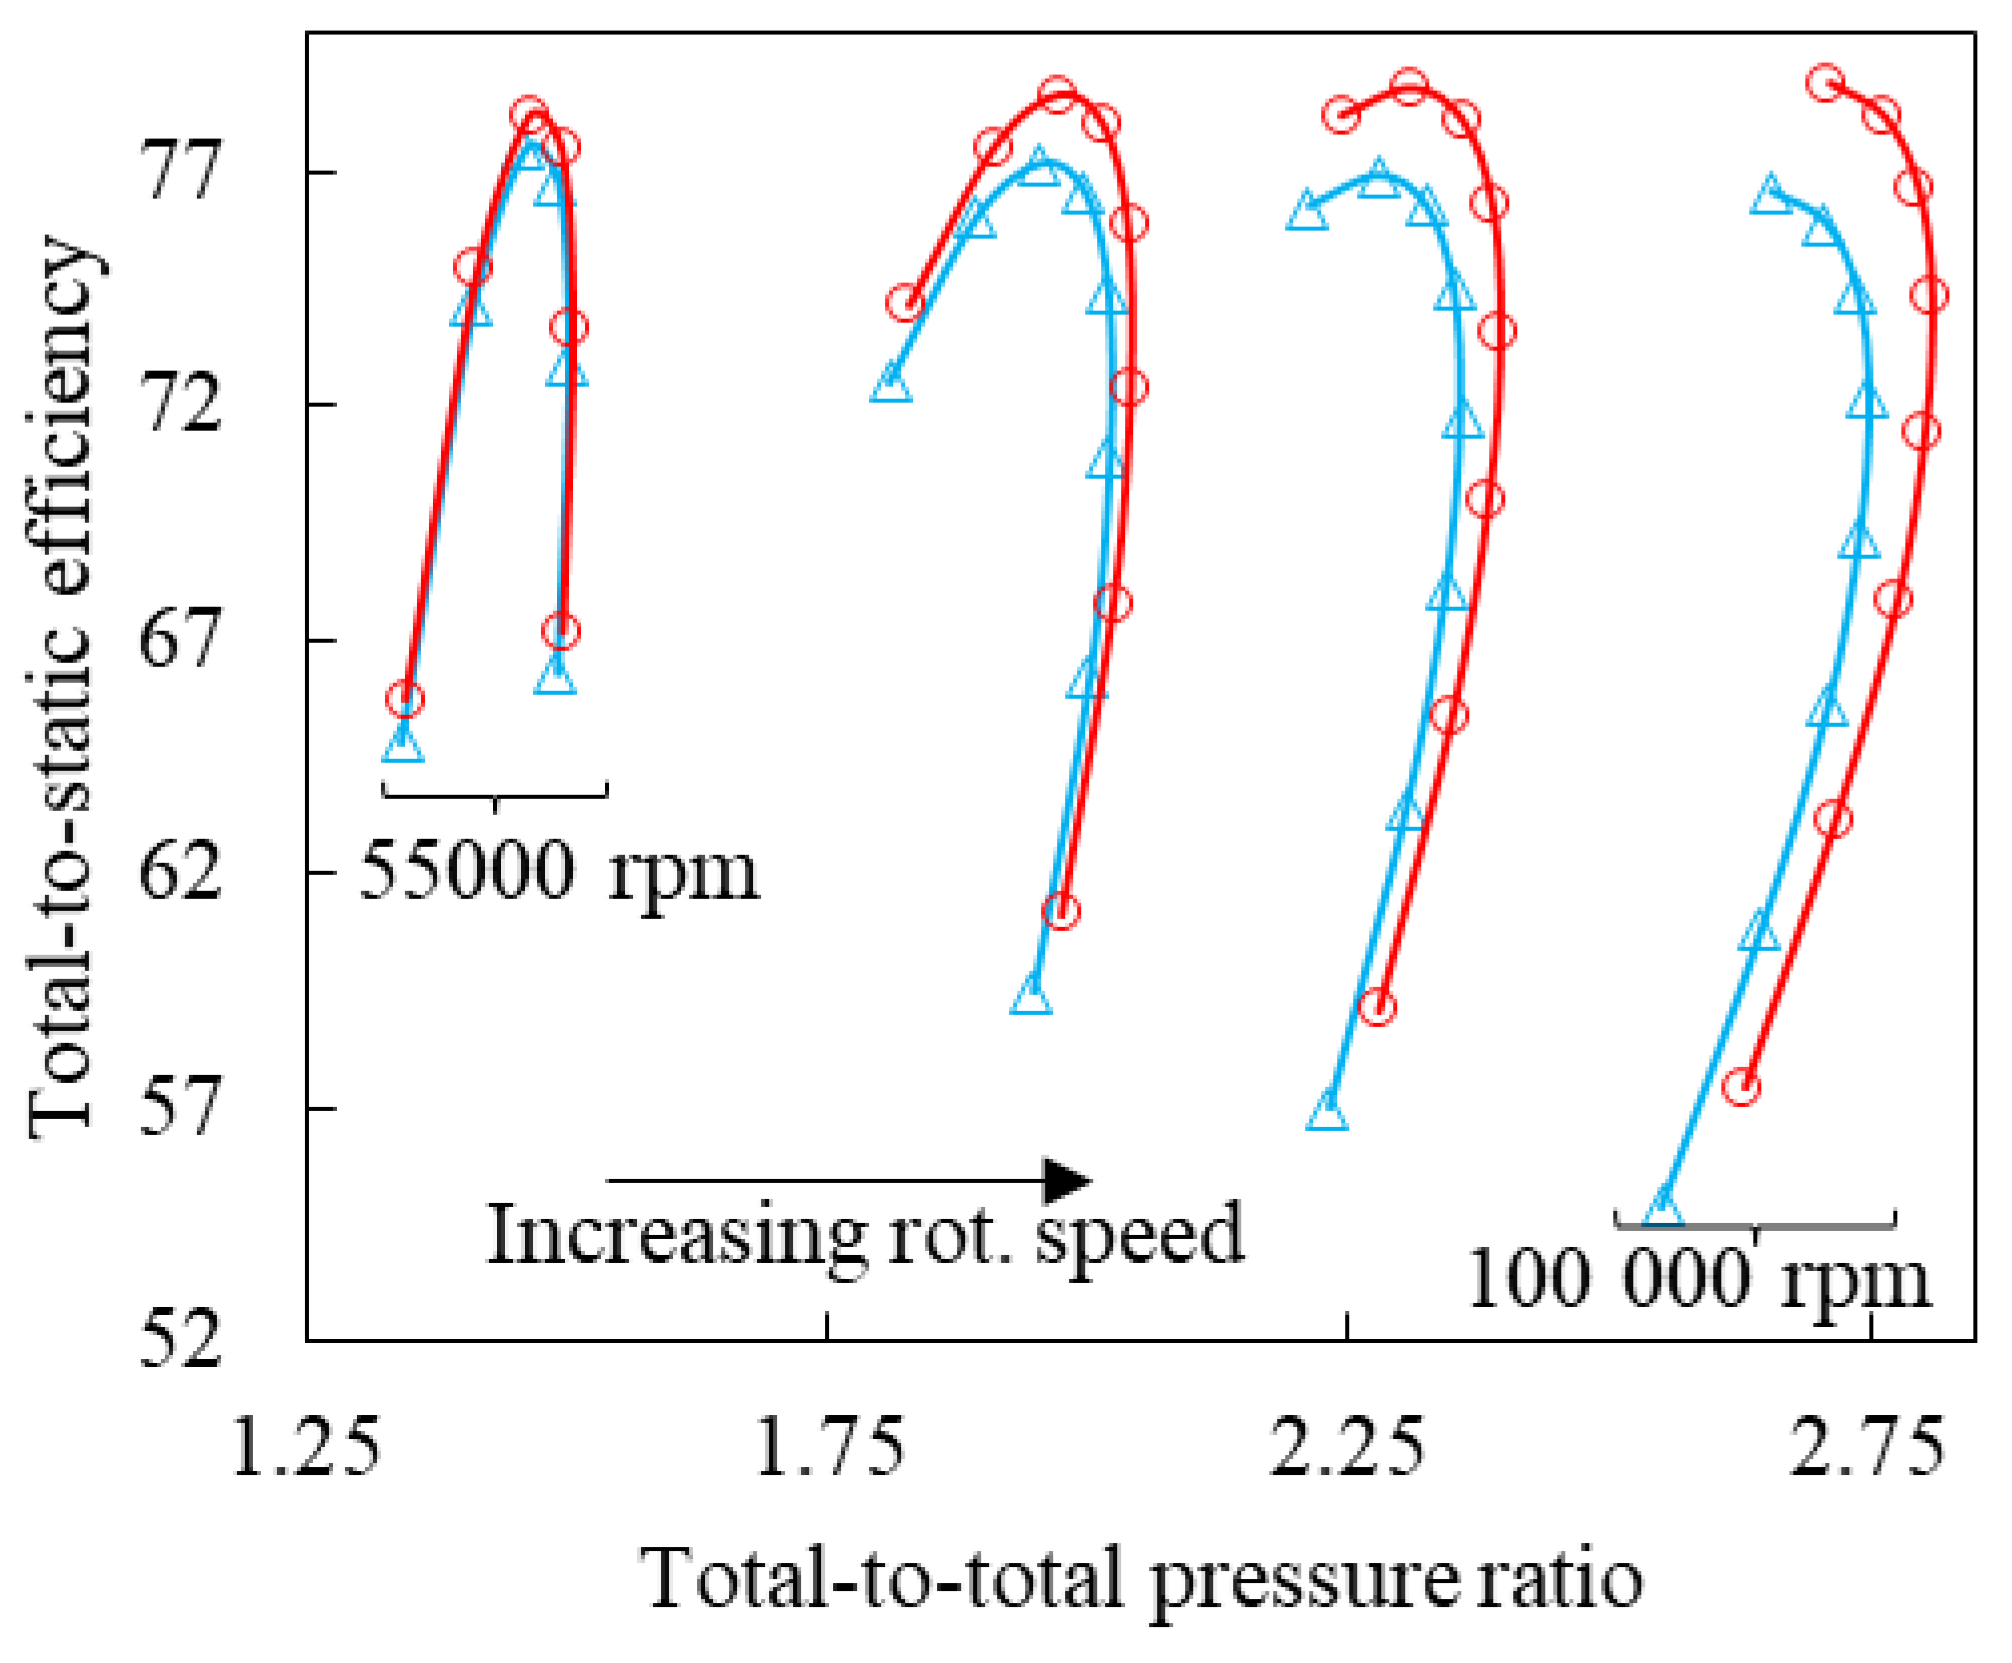
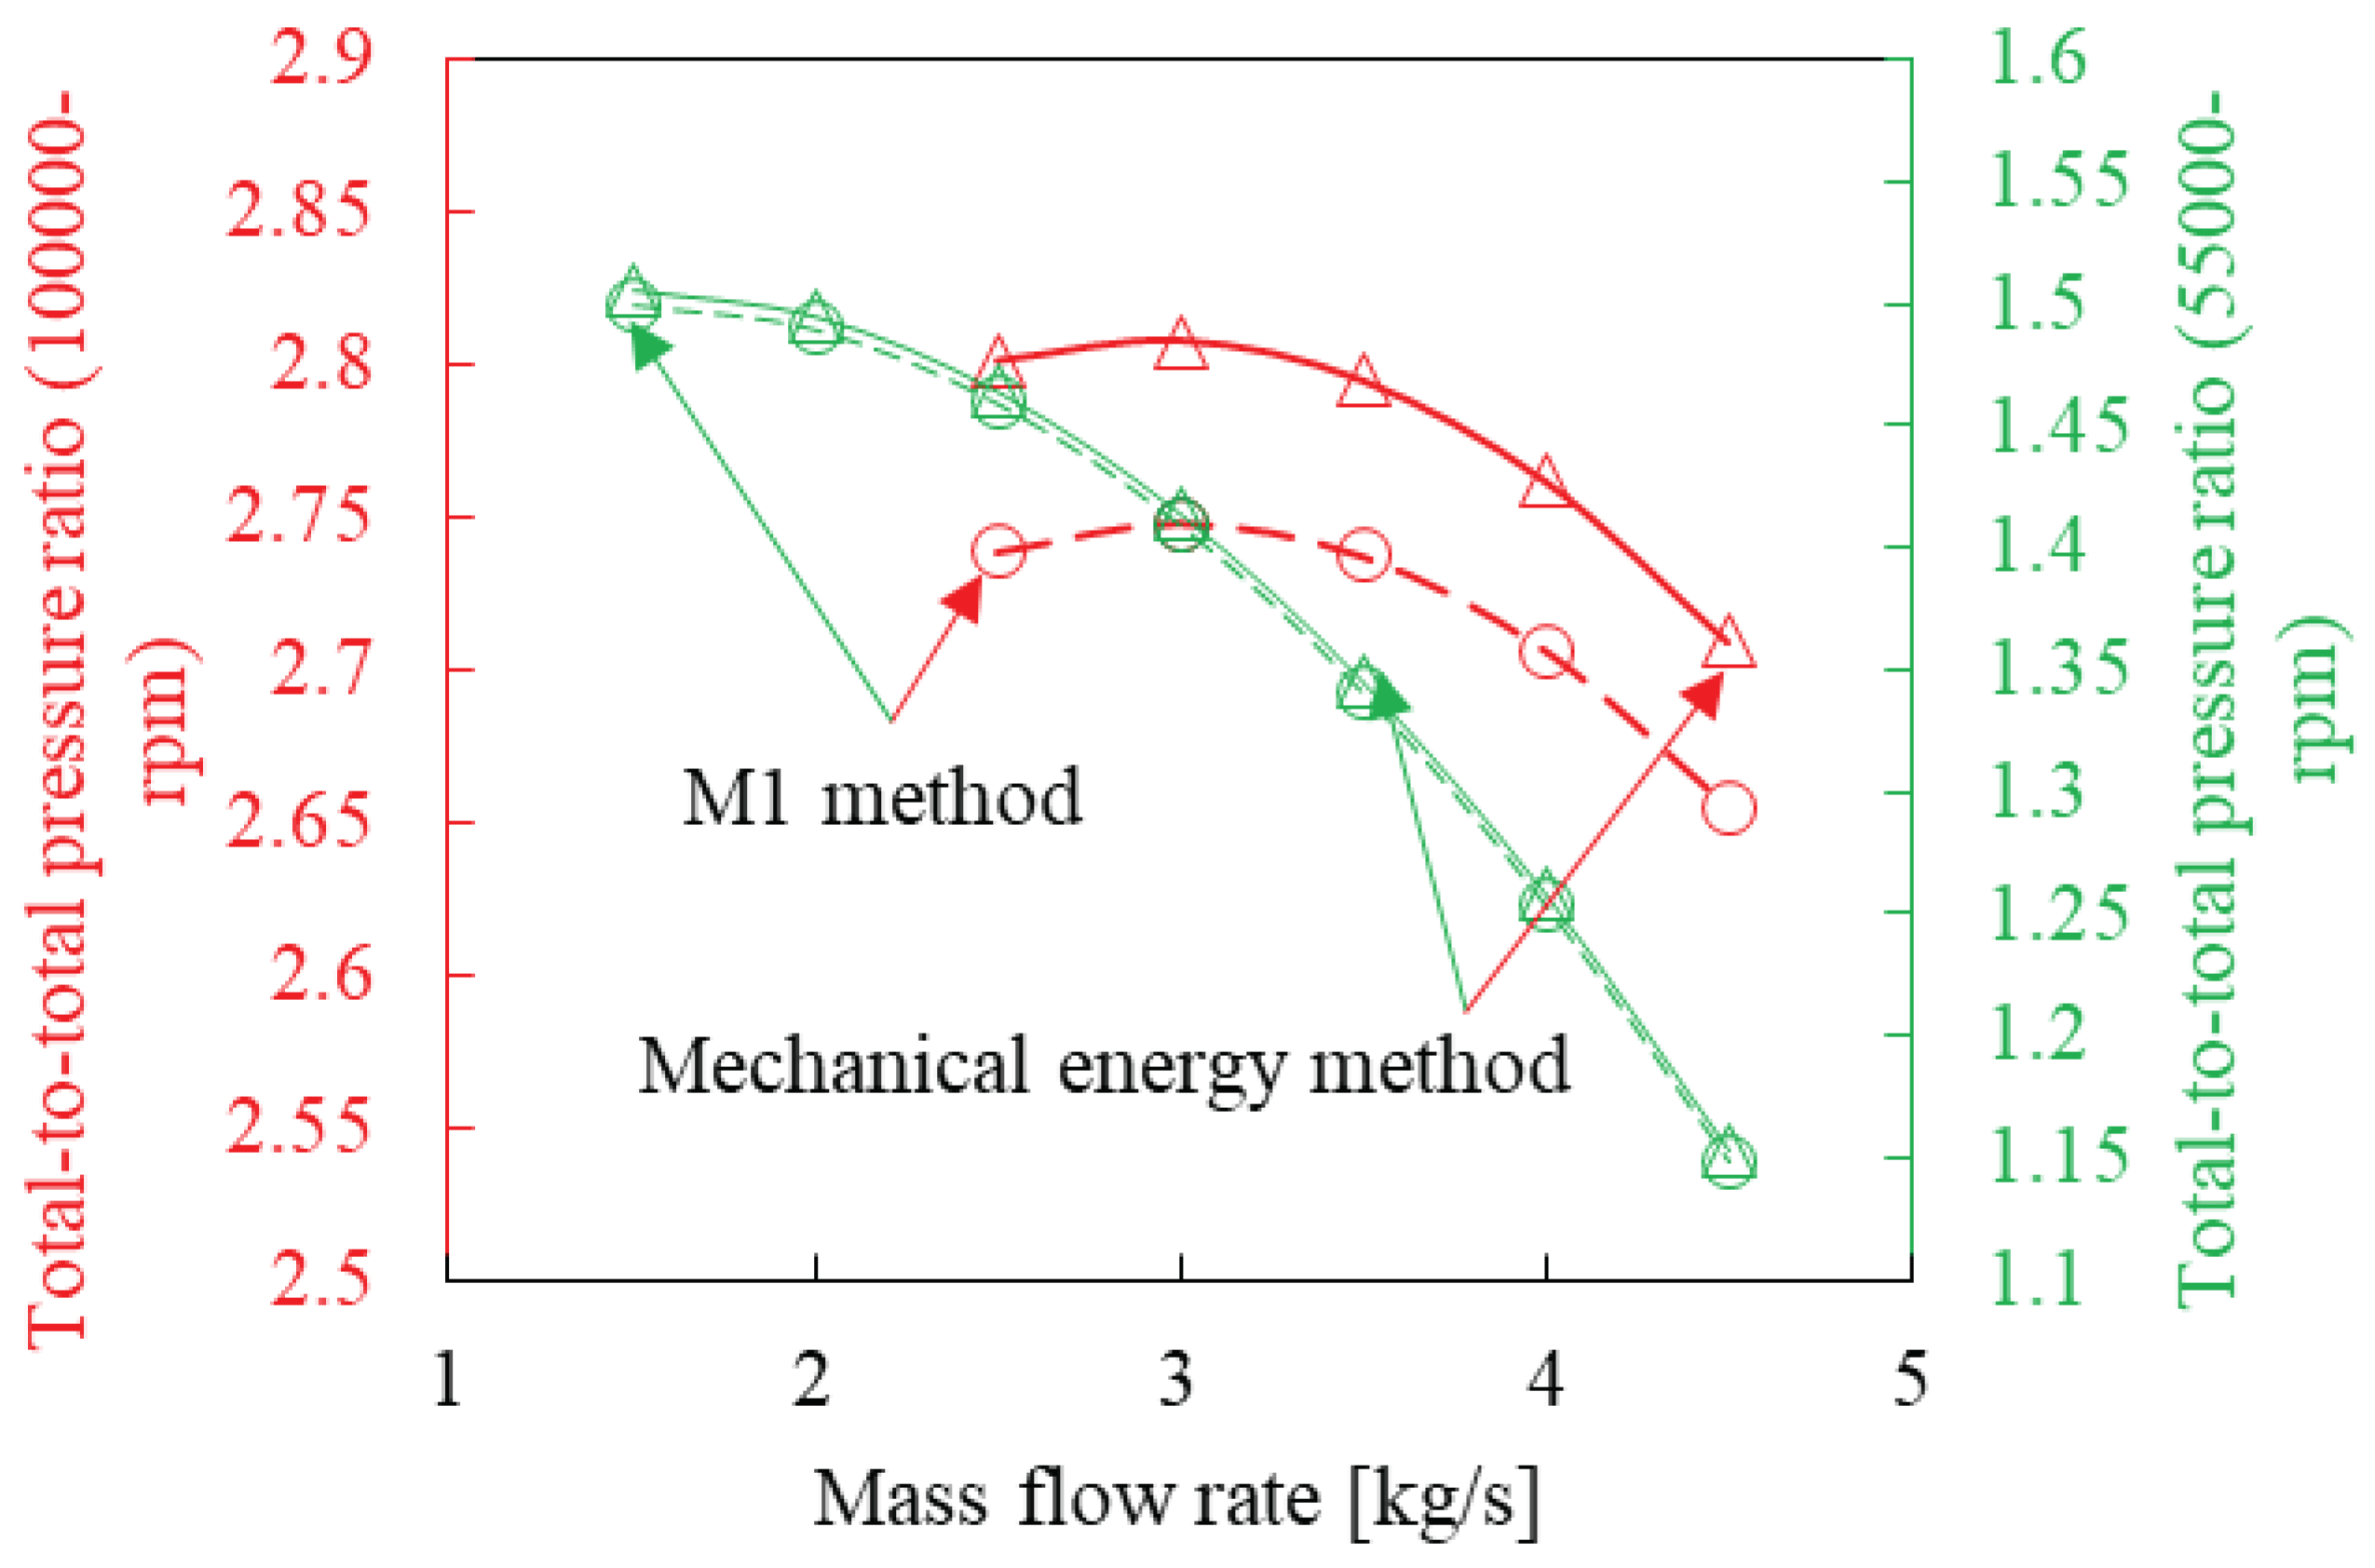
To showcase the accuracy and benefits of this approach, the results for the SNL and Eckardt compressors will not only be compared to experimental data but also to results generated with the conventional incompressible and compressible ideal gas thermofluid network IPCM approaches.
The compressible ideal gas approach is designated
M2. It is based on the same mass and energy balance equations used in M1. The discretized integral momentum balance equation for M2 is given by [
30]
In the above equation, is the stagnation temperature of the fluid and is evaluated using the stagnation pressure, stagnation enthalpy and the fluid property database. To find the static pressure using the stagnation pressure the conventional isentropic perfect gas relation between static and stagnation pressure and temperature, covered in many textbooks, can be used. Close to the critical point of a fluid, as is the case for the SNL sCO2 compressor, the variation in fluid properties is highly non-linear with pressure and enthalpy and the behavior of the fluid is non-ideal. Therefore, applying the ideal gas law to calculate the nodal densities will result in values far below the actual values. For example, the actual SNL compressor inlet density is approximately , whereas the density calculated using the ideal gas law and corresponding inlet temperature and pressure is approximately . These underpredictions of density have a detrimental effect on the model to calculate the correct fluid velocities and other fluid properties. Therefore, to generate reasonable results using the SNL compressor M2 model, the CoolProp fluid property database is used to calculate the required fluid properties such as and using the predicted velocities and stagnation conditions. To estimate the static pressure from the stagnation pressure the well isentropic ideal gas relation will be used, .
The conventional incompressible IPCM approach is designated
M3. The fluid is assumed to be weakly compressible, therefore, density is only a function of the local thermodynamic conditions. M3 also employes Equations (5) and (6) for the mass and energy balances respectively. The discretized integral momentum balance equation for
M3 is given by [
3]:
For the incompressible approach, the relationship between stagnation pressure and static pressure is governed by .
In Equations (14) and (15) various mean values of fluid properties are required such as
and
. Since the velocity and property distributions through a centrifugal compressor are not linear, the harmonic mean values are utilized. For example, the mean density is calculated as follows:
By solving the mass(5), energy (6) and momentum balance equations [(14) or (15) or (16)] for the compressor impeller and downstream components such as the vaneless space, the mass flow rates, stagnation enthalpy changes and stagnation pressure changes through the system can be calculated.
2.2. Mechanical Energy Equation Approach to Estimate Compressor Stagnation Pressure Rise
The reversible work produced by a working fluid undergoing a thermodynamic process can be written in the mechanical energy form as
[
23], where
is the reversible work produced by the fluid,
is the actual work produced by the working fluid, which in the case of a compressor is the Euler work, and
is the lost work due to aerodynamic losses such frictional pressure drop. The mechanical energy equation can be used to estimate the stagnation pressure at the outlet of the compressor by replacing the reversible work term with the change in isentropic stagnation enthalpy as shown in equation (18). In the below equation,
is the element exit isentropic stagnation enthalpy based on the inlet entropy,
, and outlet stagnation pressure,
.
The application of Equation (18) to estimate compressor outlet pressure, for high pressure ratios, using only the inlet thermodynamic conditions of the compressor would lead to significant overprediction, due to the fact that the polytropic compression path shape was not taken into consideration. The shape of the polytropic path on the T-s diagram which illustrates the temperature and entropy increase during compression, can significantly influence the amount of pressure rise for specified amounts of actual work,
, and lost work,
. This occurs because as the fluid undergoes compression, the temperature increases due the dissipation of lost work, which in turn increases the compression work requirements. Consequently, the pressure gain diminishes for a given amount of reversible work. This phenomenon can also be observed in the divergence of pressure iso-lines on T-s and Mollier diagrams as entropy increases. Hence, if Equation (18) is applied to a real gas compressor operating at high pressure ratios, it only accounts for the inlet thermodynamic conditions (
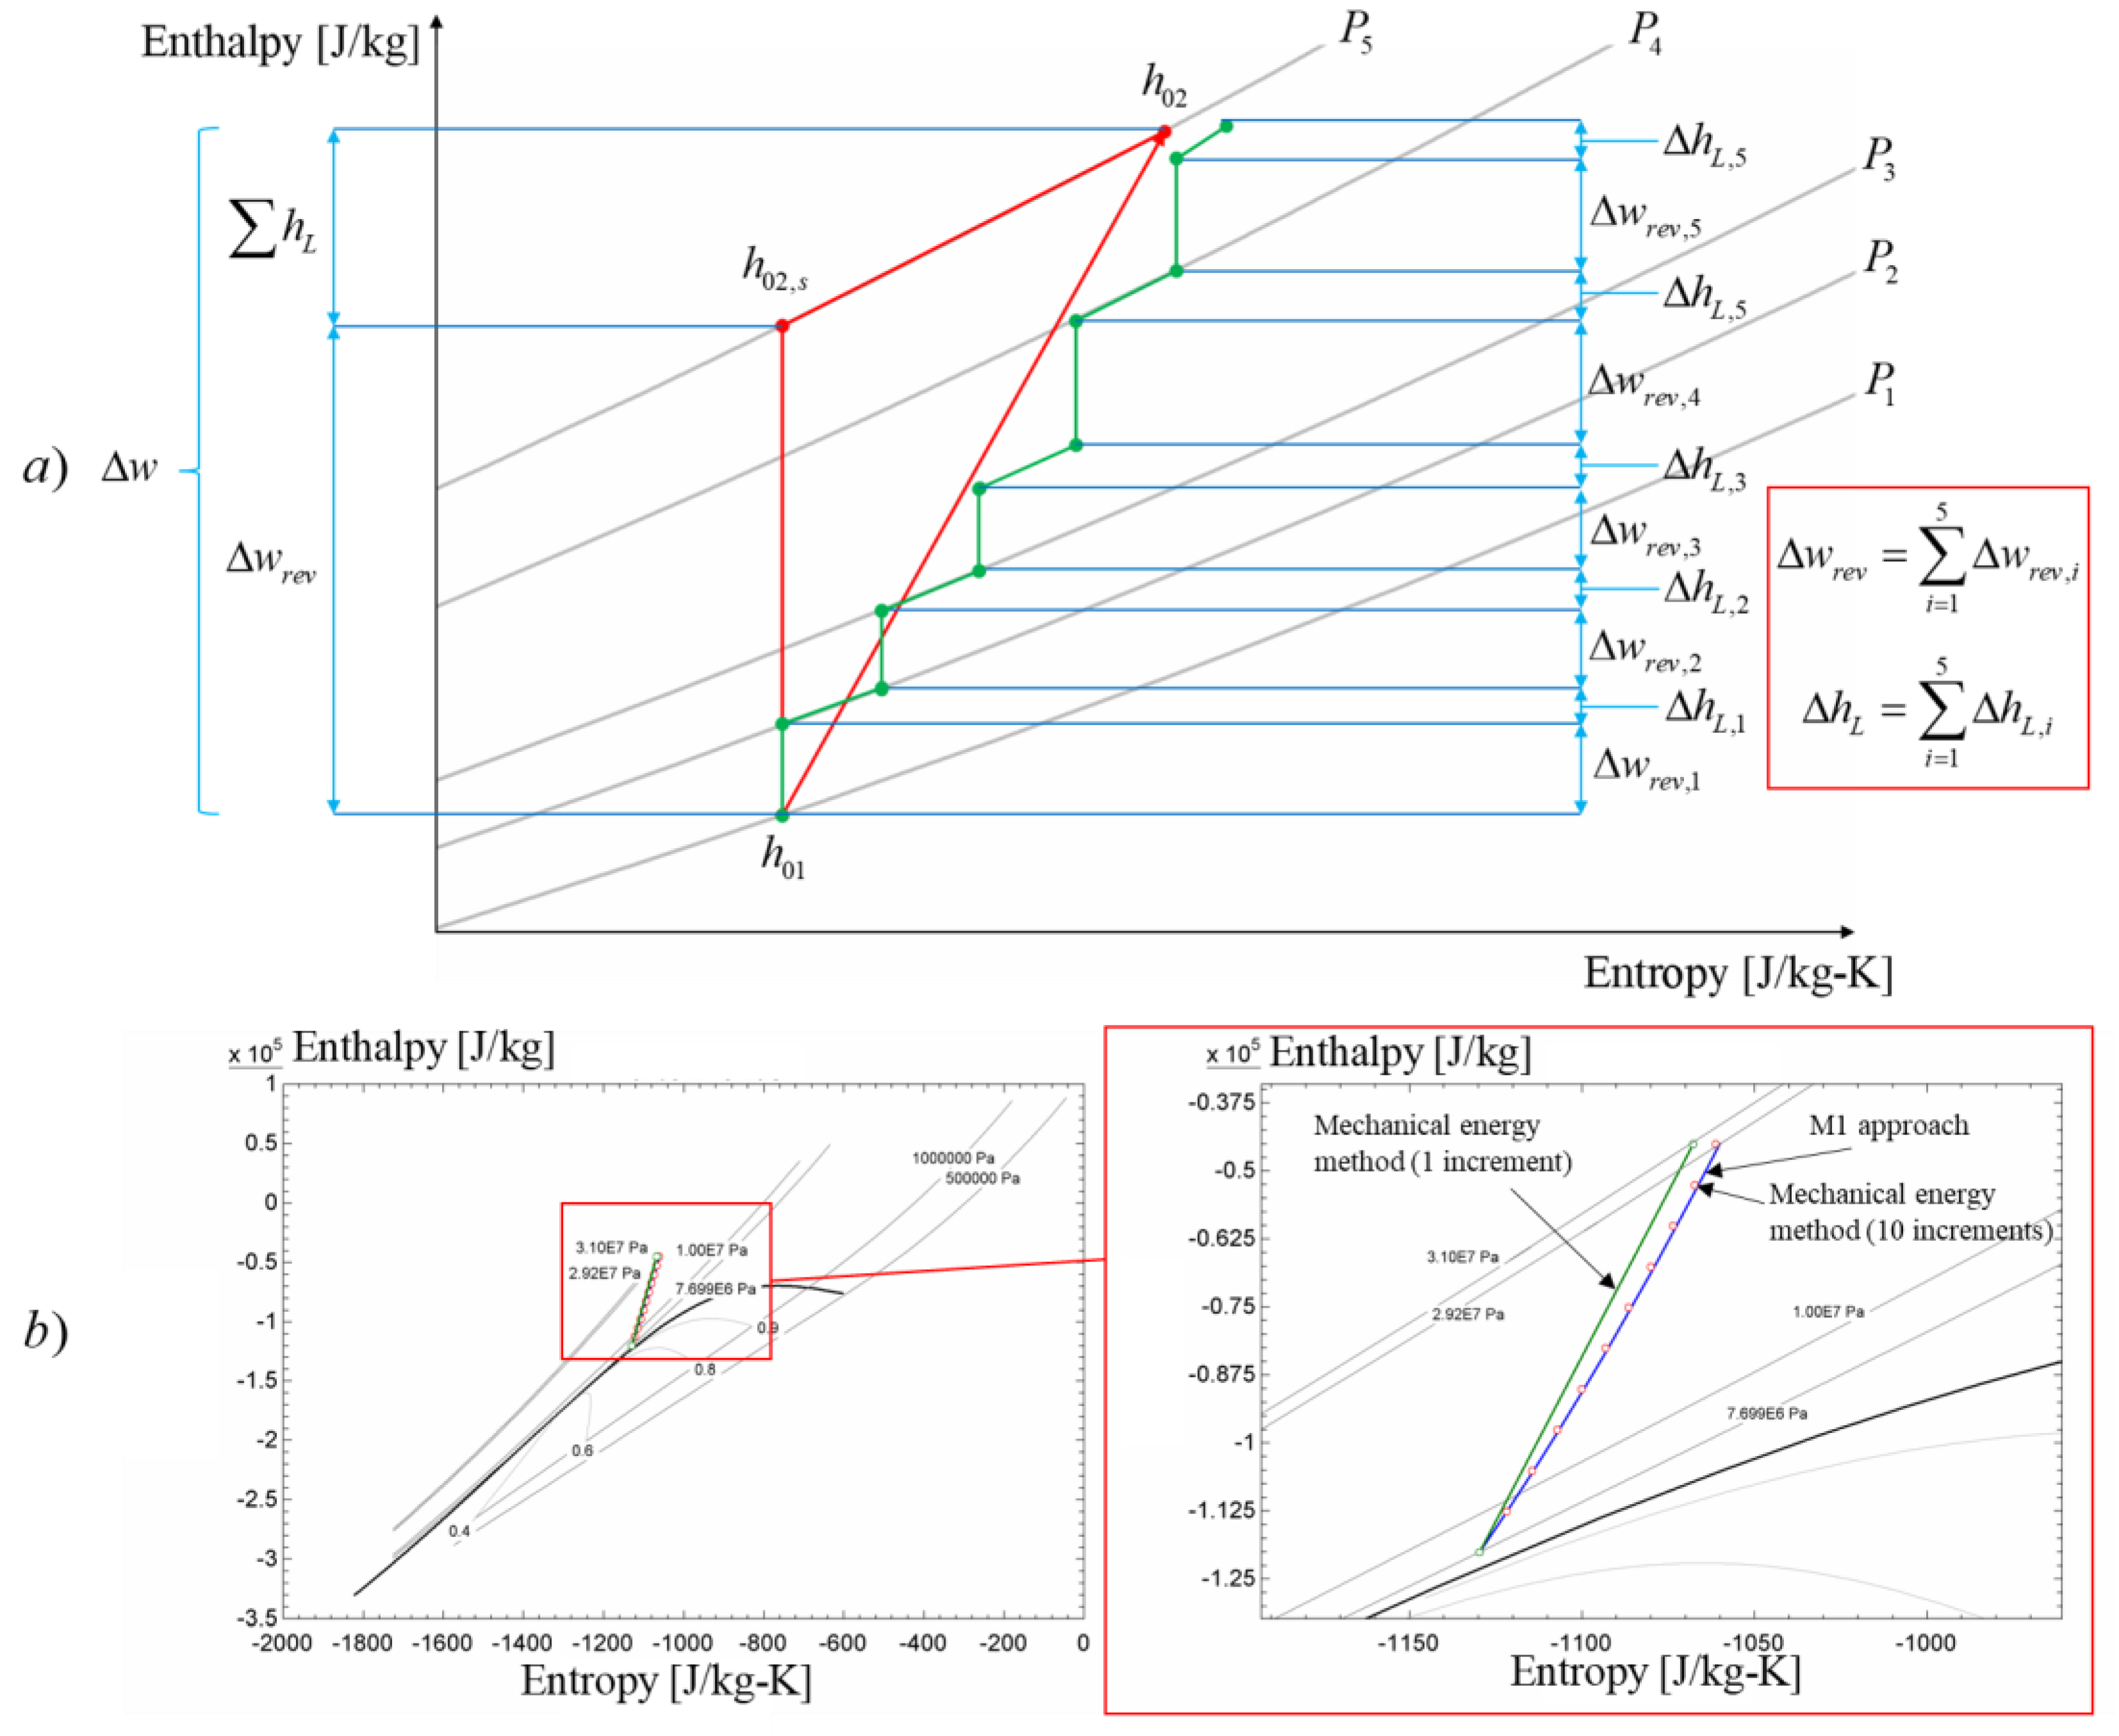
) when calculating the exit stagnation pressure, neglecting the effects of entropy and temperature increase along the polytropic path. To circumvent this shortcoming of the mechanical energy method, the compression process can be discretised into multiple small-step compression processes and Equation (18) applied to each step, thereby accounting for the effect of temperature and entropy increases along the compression path. This is illustrated in the sketch shown in
Figure 1a, where the compression process using both single-step and multi-step mechanical energy methods is depicted on the Mollier diagram. As shown in
Figure 1a, the total amount of lost work and reversible work remains constant between the single- and multi-step variations. However, due to the diverging pressure iso-lines, a lower final pressure is achieved at an increased entropy value. Aungier [
25] mentioned that not accounting for the entropy increase would result in significant overprediction of pressure ratios and therefore under designing of the compressor. To correct this Aungier proposed the use of an ideal gas pressure rise correction factor which works well up to pressure ratios of 3.5.
To demonstrate the effect of not capturing the correct polytropic path shape using the single-step mechanical energy method and only the compressor inlet conditions, as applied by many researchers in the literature, a numerical experiment simulating a toy compression process is conducted. For this numerical experiment, the results generated using the single step mechanical energy method, the M1 approach and the multi-step mechanical energy method are compared. The experiment consists of a single small conduit supplied by CO2 at inlet conditions of 35 ⁰C and 7.687 MPa. Constant specific work of 75 kJ/kg is supplied to the fluid while the lost work is set to a constant value of 25 kJ/kg.
Figure 1b shows the results for this toy problem on the CO2 Mollier diagram. The results show that the exit stagnation pressure predicted by the single step mechanical energy method (1 increment) is 31 MPa, whereas the M1 approach and the multi-step mechanical energy method (10 increments) predicts exit stagnation pressures of 29.26 MPa and 29.38 MPa respectively. The relative percentage difference between the results of the M1 approach and the single-step and multi-step mechanical energy methods are 6% and 0.4% respectively. As the number of increments for the multi-step approach is increased to 50, the relative percentage difference between the multi-step mechanical energy method and the M1 approach reduces to 0.1%, indicating that the multi-step method converges to the results of the M1 approach. It should be noted that the M1 approach only utilizes a single increment to model the compression process, therefore, it can be concluded that it is a numerically more robust approach compared to the mechanical energy balance method. One potential reason for the ability of the M1 approach to predict the exit stagnation pressure close to that of a multi-step mechanical energy method, with only a single step, could be that the pressure rise and drop due to actual work input and lost work respectively are included in the momentum equation, which then directly solves for the stagnation pressure change across the component.
For the remainder of the work, only the single-step mechanical energy method will be utilized for comparison with the M1 approach results. The motivation behind this decision is that a significant number of researchers are employing this approach to model sCO2 centrifugal compressors.
2.3. Component Characteristic Models
In the current work we will assume that all processes through the compressor are adiabatic, i.e.,
. However, a crucial part of the analysis is to determine the appropriate relationship between the rate of work input to the fluid and the total pressure rise due to this work, i.e.,
, and between the rate of lost work and the total pressure drop due to the lost work, i.e.,
. We start by writing the energy balance equation for steady flow through a control volume in difference form as follows:
Where in the above equation
[kJ/kg] is the incremental specific heat transfer to the fluid from its surroundings with
, and
[kJ/kg] is the incremental specific work done by the fluid on its surroundings with
. Similarly, we write the entropy balance for steady flow through a control volume in difference form as
where
[kJ/kg] is the incremental specific lost work with
, which is always positive. Inserting
into this entropy balance equation and then subtracting it from Equation (19) we get
We now manipulate Equation (20) as follows:
Then, inserting the definition of stagnation pressure for compressible real gases we get
Integrating Equation (22) over a one-dimensional fluid element between the inlet and outlet while neglecting the elevation term leads to
By comparing Equation (23) with the momentum balance Equation (14) we see that and . In the present work, both the Eckardt and SNL centrifugal compressor models consist of an impeller and vaneless space. Additionally, the SNL compressor has a vaned diffuser located downstream of the vaneless diffuser. For each of these sections the applicable source terms are defined below.
The net change in specific angular momentum over the impeller fluid control volume can be determined using the well-known Euler turbomachinery Equation (24), where
is the specific angular momentum,
is the radius with the subscripts
and
indicating the impeller inlet and outlet tip stations (nodes) respectively, and
is the absolute tangential velocity component of the fluid flow.
A positive value of
implies a driving torque on the fluid as in a compressor, while a negative value implies a braking torque on the fluid as in a turbine. The various impeller inlet and outlet velocity components are calculated using the respective velocity triangles and the mean line method approach discussed in [
31]. The Wiesner slip factor model [
32] is implemented in the current work.
To calculate the required specific work input into the impeller control volume, which we will refer to as the Euler specific work, the following is applied , with where is the rotational speed of the impeller. To convert the Euler specific work to the total pressure rise the previous relation is used, where the subscript refers to the impeller element.
The total internal pressure loss experienced by the fluid within the impeller element due to irreversibilities is calculated using Equation (25).
Many of the loss models found in literature express the internal impeller losses as enthalpy losses (
) rather than pressure losses. These enthalpy losses are transformed to pressure losses using
where the subscript
indicates the specific loss contribution, for example the incidence loss for the impeller element is
. The various empirical internal impeller loss models used for the case study compressors are shown in
Table 1.
Besides the losses experienced by the fluid within the impeller element there are also parasitic losses in the flow around the impeller that require additional power input to the impeller element. The total required power input to the impeller is given by
In Equation (26),
is the combined specific work loss due to parasitic losses which consists of the disk friction, recirculation, and leakage losses for the impeller element designated with subscript 1. The values of individual specific work losses are obtained from empirical correlations. The three main sources of parasitic work considered in the current work are disk friction loss, recirculation loss and leakage loss [
33]. In the present work the disk friction, recirculation and leakage losses are calculated using the approach proposed by Daily and Nece [
40], Coppage et al. [
36] and Aungier [
34] respectively. The combined parasitic loss is expressed as
.
For the case study compressors, the impeller is followed by a vaneless diffuser element. The vaneless diffuser inlet velocity vector and fluid properties are simply taken as the absolute velocity and properties at the outlet of the impeller element. To calculate the vaneless diffuser outlet velocity vector the conservation of angular momentum is applied [
41]. The only pressure drop considered for the vaneless diffuser element is the skin friction loss, which is calculated using the hydraulic diameter and average velocity for the vaneless space [
34]. The typical mean line method approach is utilized to calculate the outlet velocity vector for the vaned diffuser element given the vaned diffuser blade angles
and
. To estimate the stagnation pressure drop experienced by the flow through the vaned diffuser, the incidence and skin friction losses were accounted for, since these are assumed to be the dominant pressure drop mechanisms [
15].
2.4. Solution Strategy
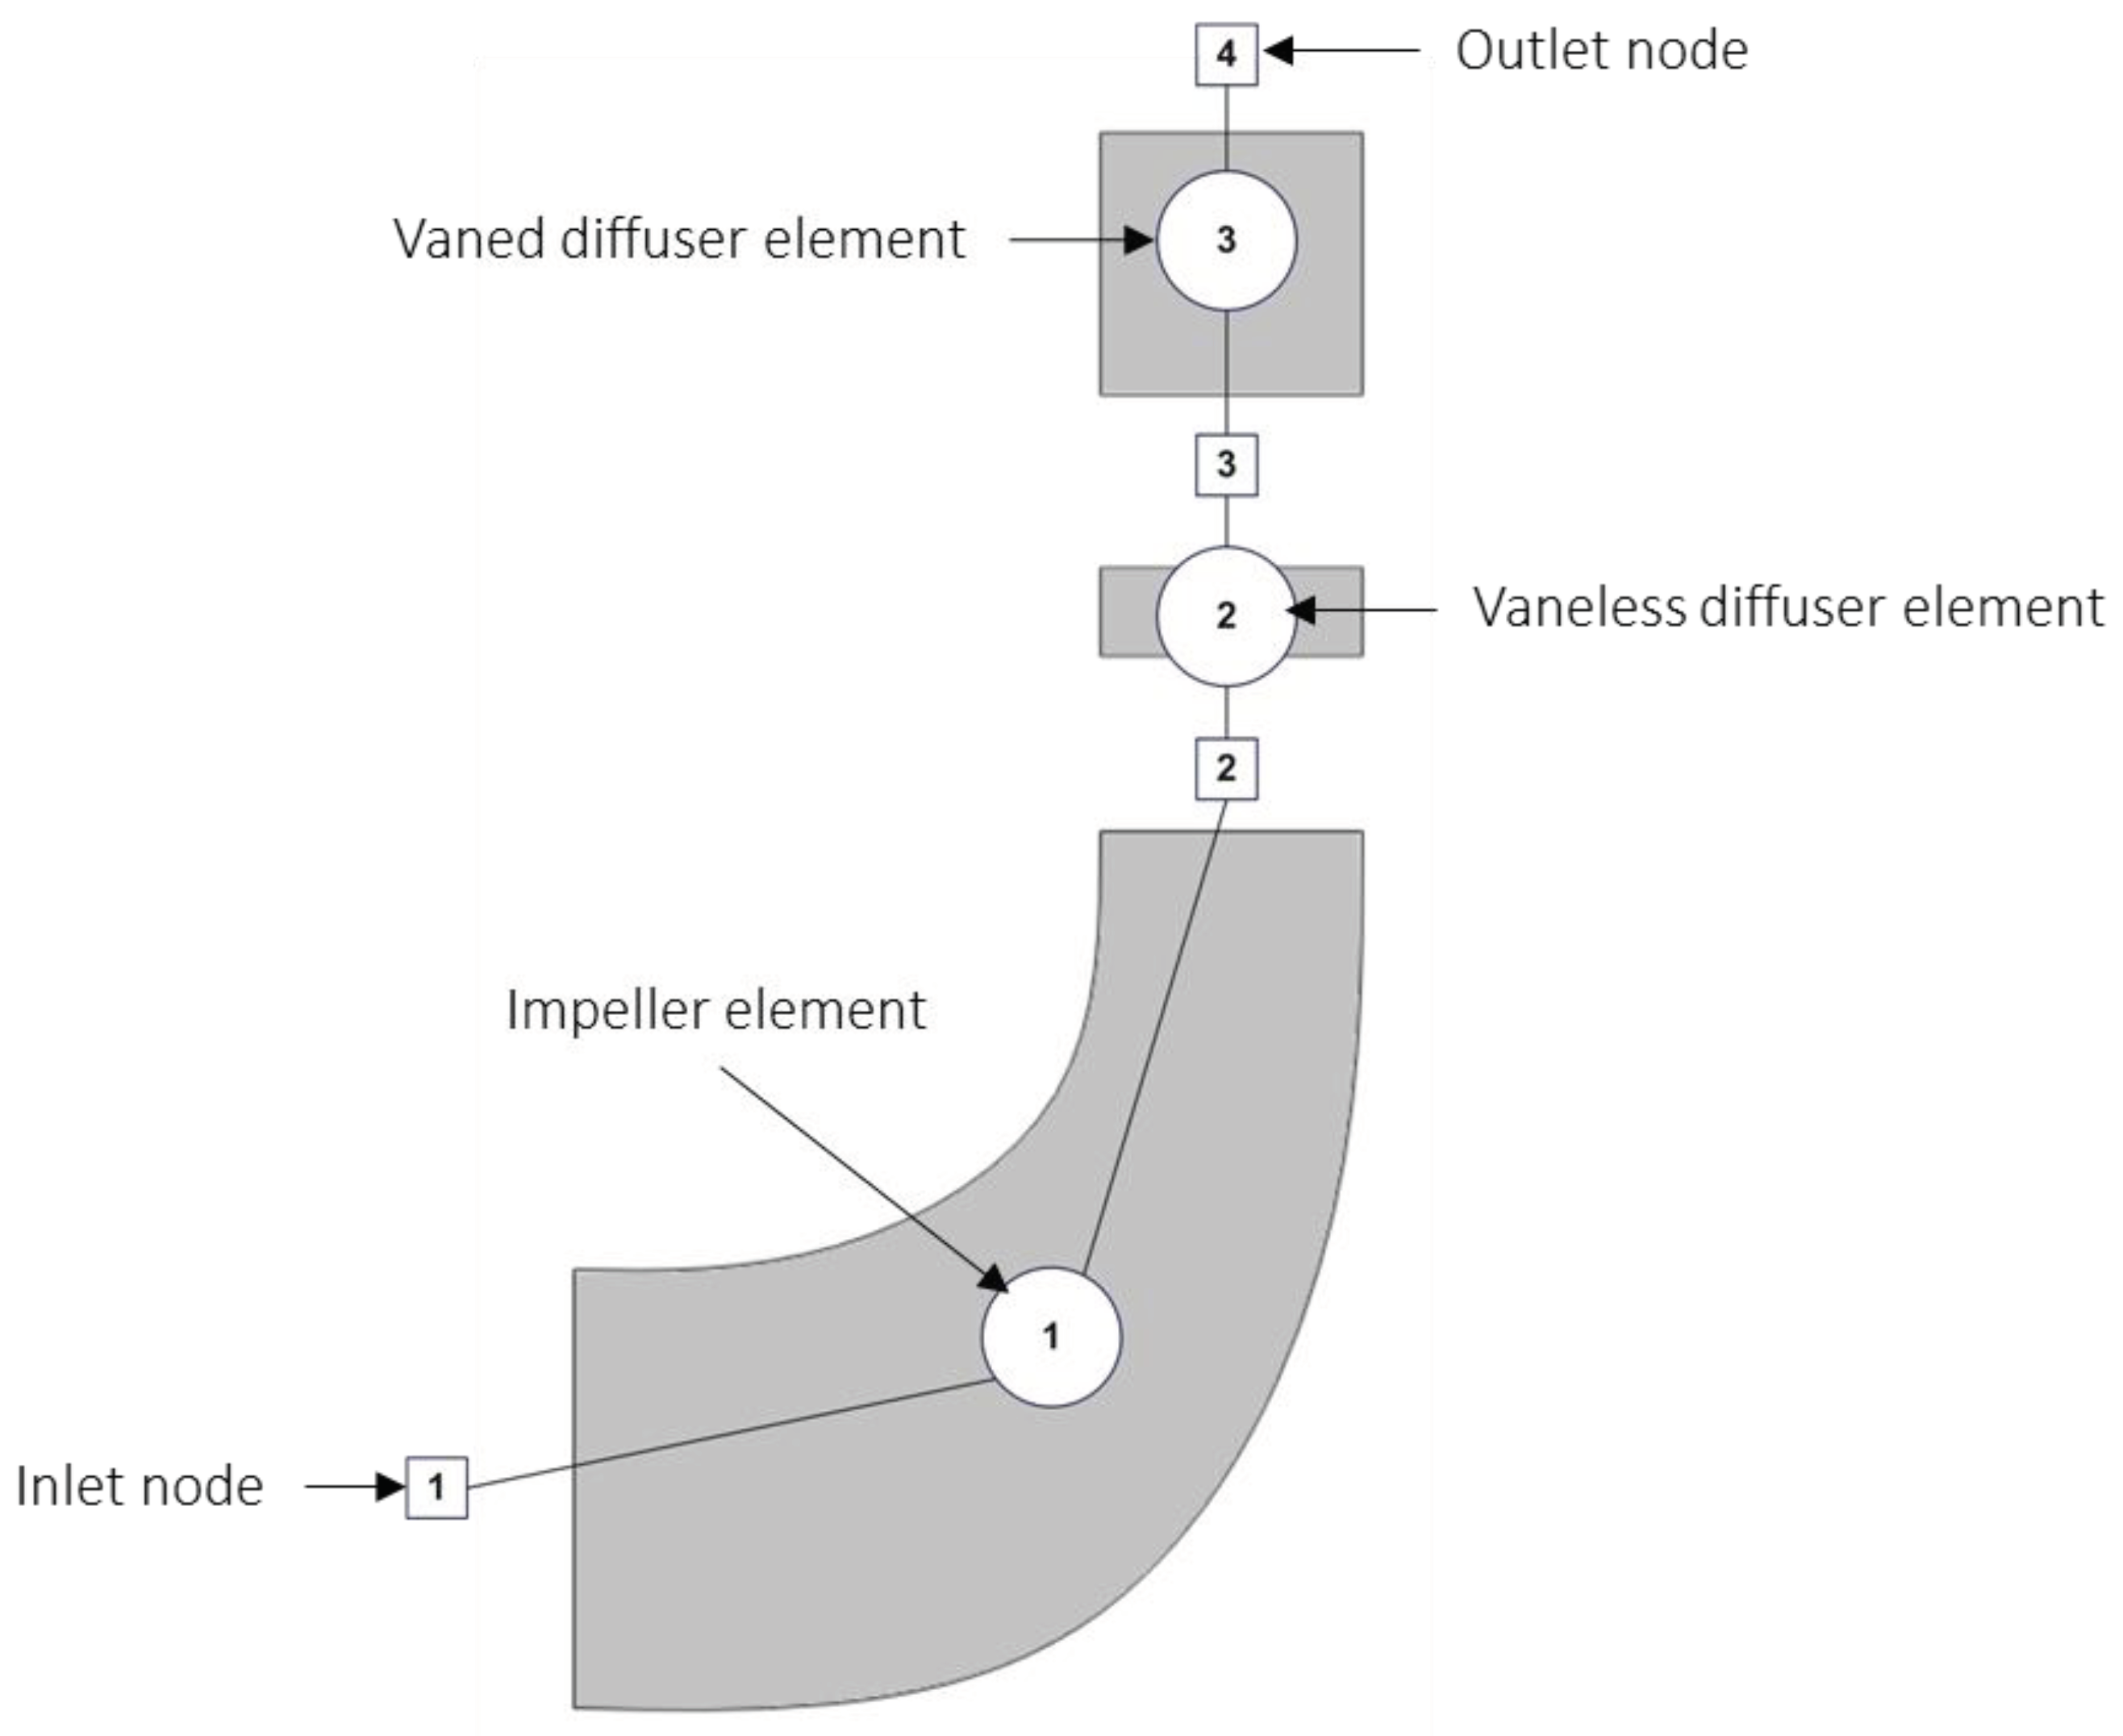
The two case study compressors both consist of three flow elements and four nodes. The three flow elements are the impeller, vaneless diffuser space and the vaned diffuser, designated elements 1, 2 and 3 respectively. The discretized thermofluid network model of the compressors is shown in
Figure 2. For the Eckardt compressor the vaned diffuser element is simply a dummy component where no pressure drop or fluid direction change is induced. For each flow element the 1D momentum balance equation is solved based on the selected model namely M1, M2 or M3. The mass and energy balance equations are solved for each node along with the fluid property relations. The solver routine uses a combination of the Newton-Raphson and successive substitution numerical schemes to solve the steady-state discretized equations [
2].
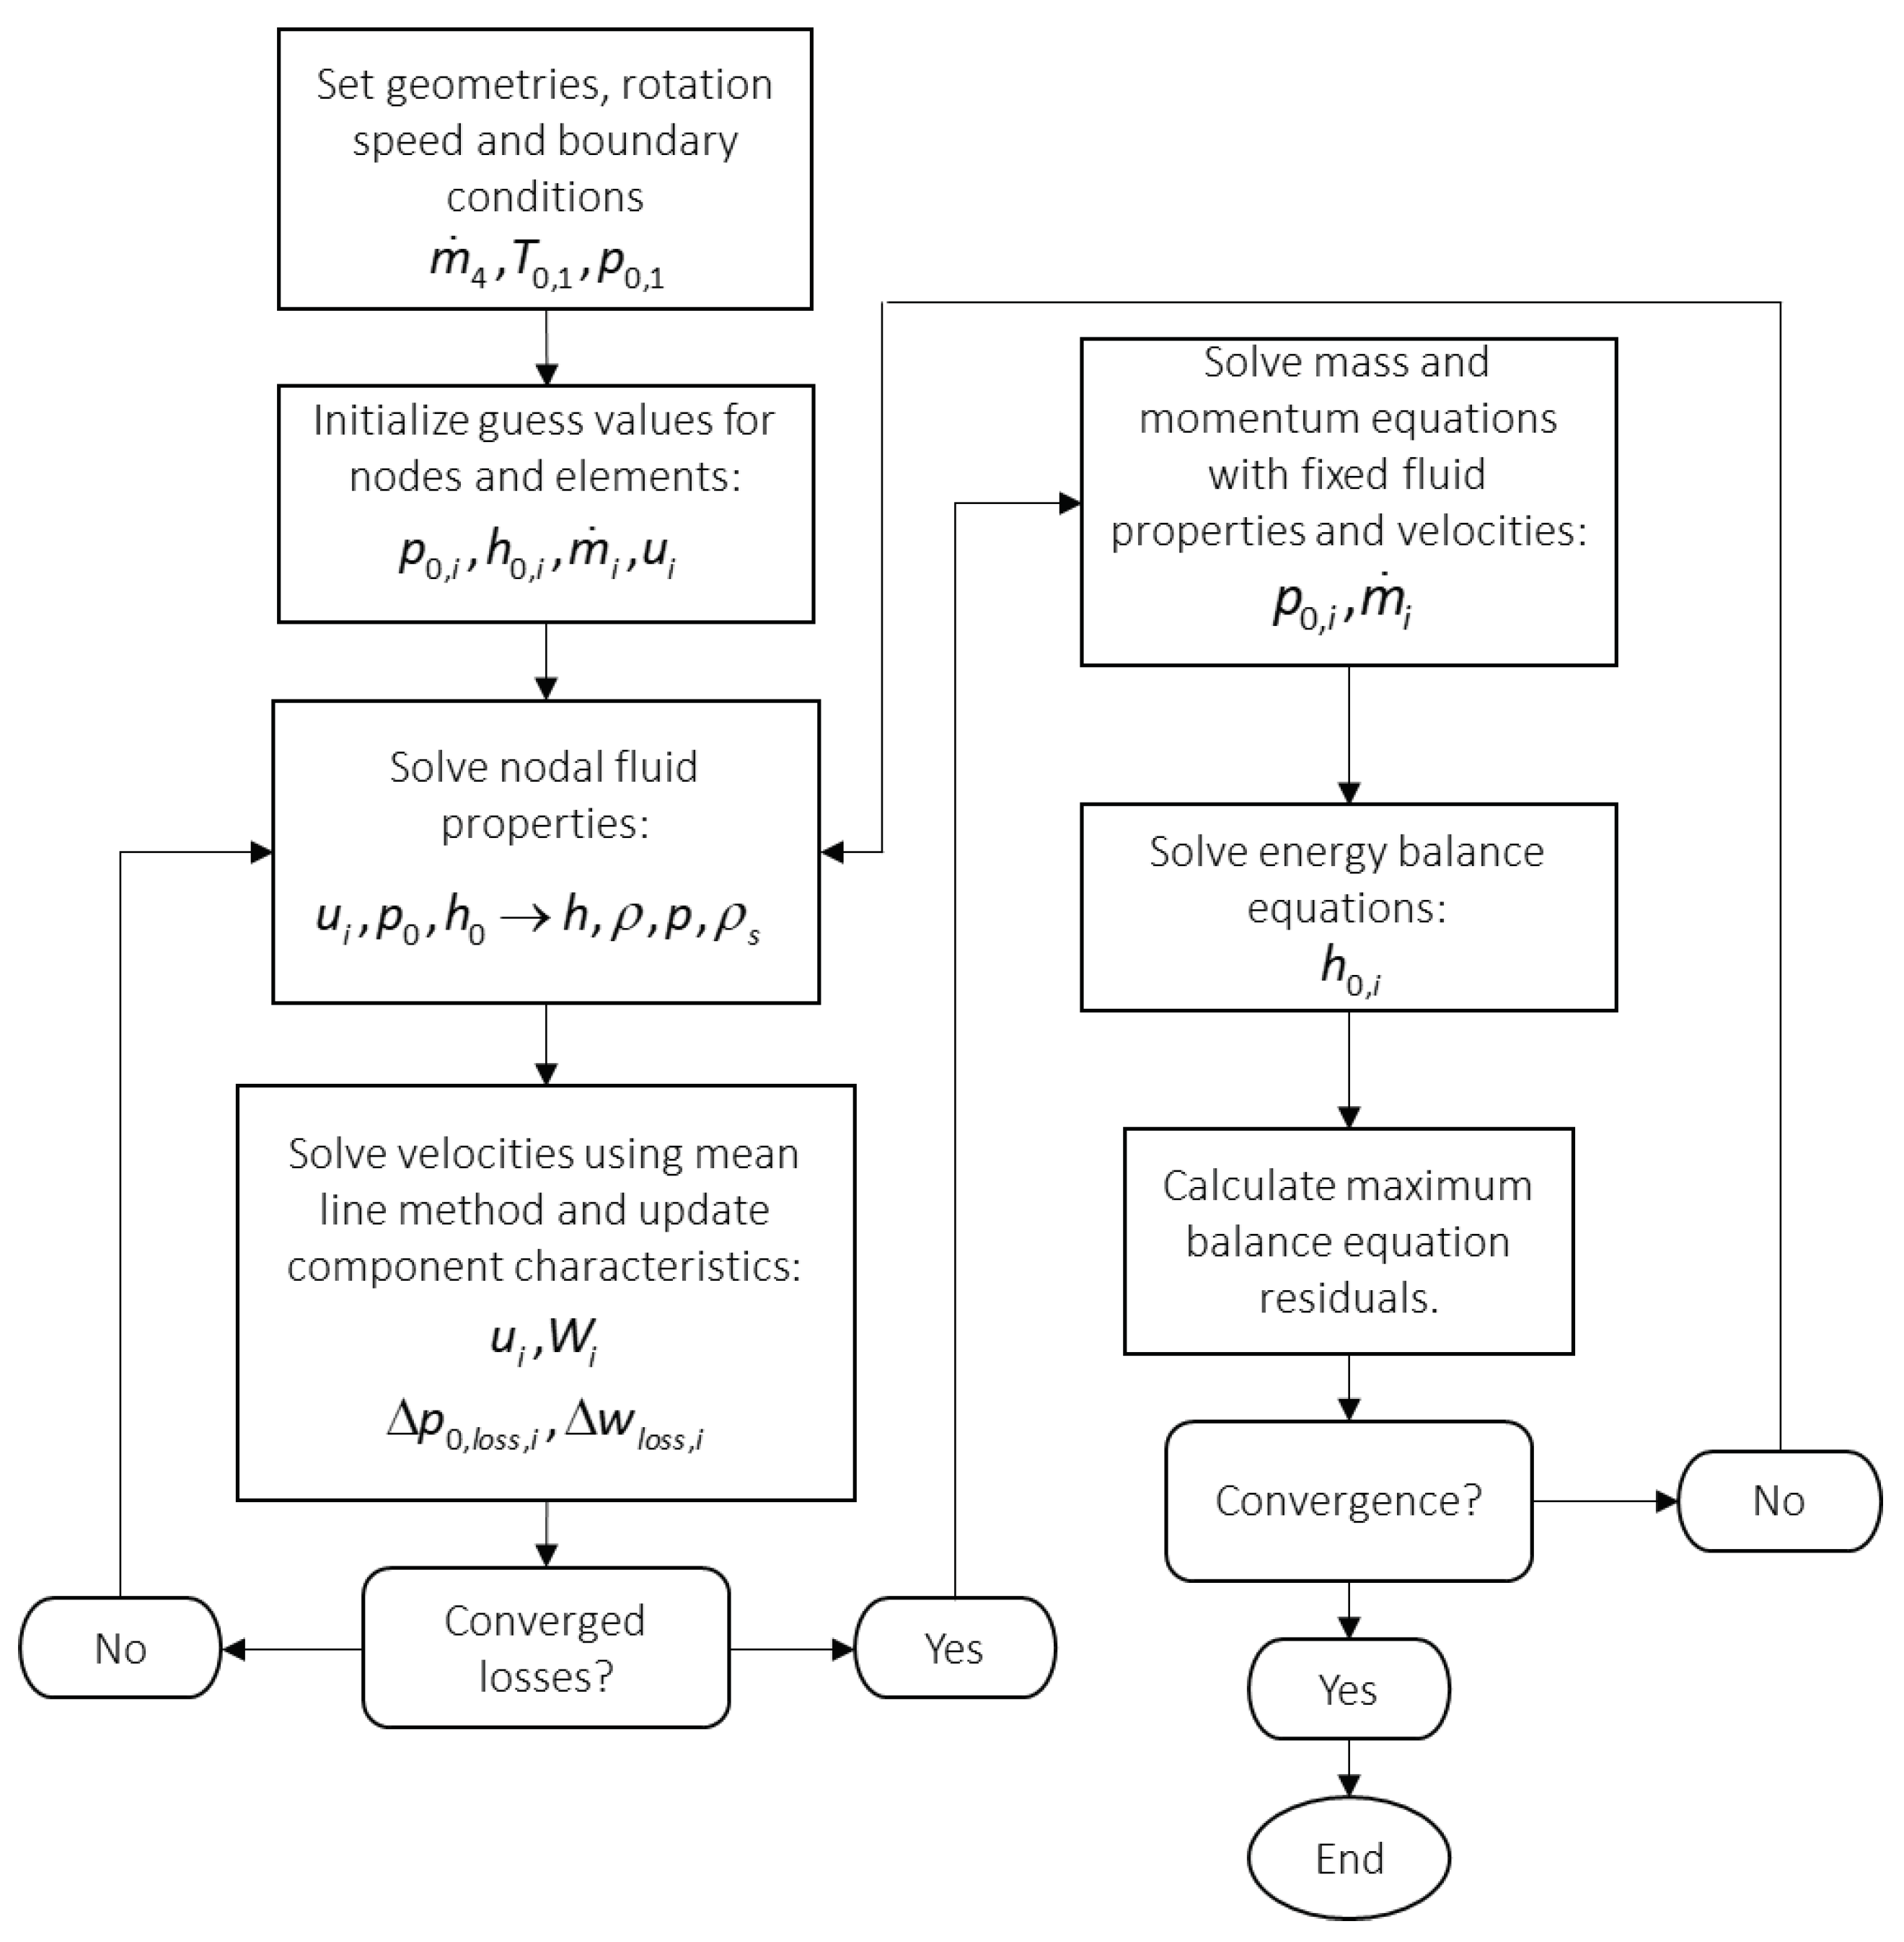
The algorithm initiates with user-specified geometric features, boundary conditions, and rotational speed for compressor components. Inlet stagnation temperature, pressure, and outflow node conditions are defined. Flow element mass flow rates are set to unity, and nodal properties are initialized based on inlet conditions. Fluid properties are iteratively solved using guessed values, employing fluid property relations. The mean line method calculates velocity vector values for each flow element. Component characteristic source terms are estimated, and the process repeats until energy and momentum balance equations converge. Converged fluid properties and characteristics are used to simultaneously solve mass and momentum balance equations with a Newton Raphson solver. Energy balance equations are solved via successive substitution once the mass and momentum equations are solved for a given iteration. Residuals are checked for convergence, using a user-specified criterion (1e-3). The solver loop iterates through fluid property and source term updates until overall convergence is achieved for stagnation pressure, stagnation enthalpy, and mass flow rates.
A flow diagram of the solver process is shown in
Figure 3, where the subscripts indicate the nodal and elemental indices.
Table 2 below contains the discretized network balance equations solved for the M1 model approach. Similar sets of equations can be derived for approaches M2 and M3 using Equations (15) and (16) respectively. As previously indicated, the mass and energy balance equations remain unchanged for the three approaches studied in the current work.
designates the boundary condition.
