Submitted:
27 March 2024
Posted:
27 March 2024
You are already at the latest version
Abstract
Keywords:
1. Introduction
2. Materials and Methods
2.1. Materials
2.2. Methods
2.2.1. Nanocomposites Manufacturing
2.2.2. Microhardness and Wear Characterization
2.2.3. UV-Curing Characterization
3. Results
3.1. Microhardness of ND-Nanocomposites
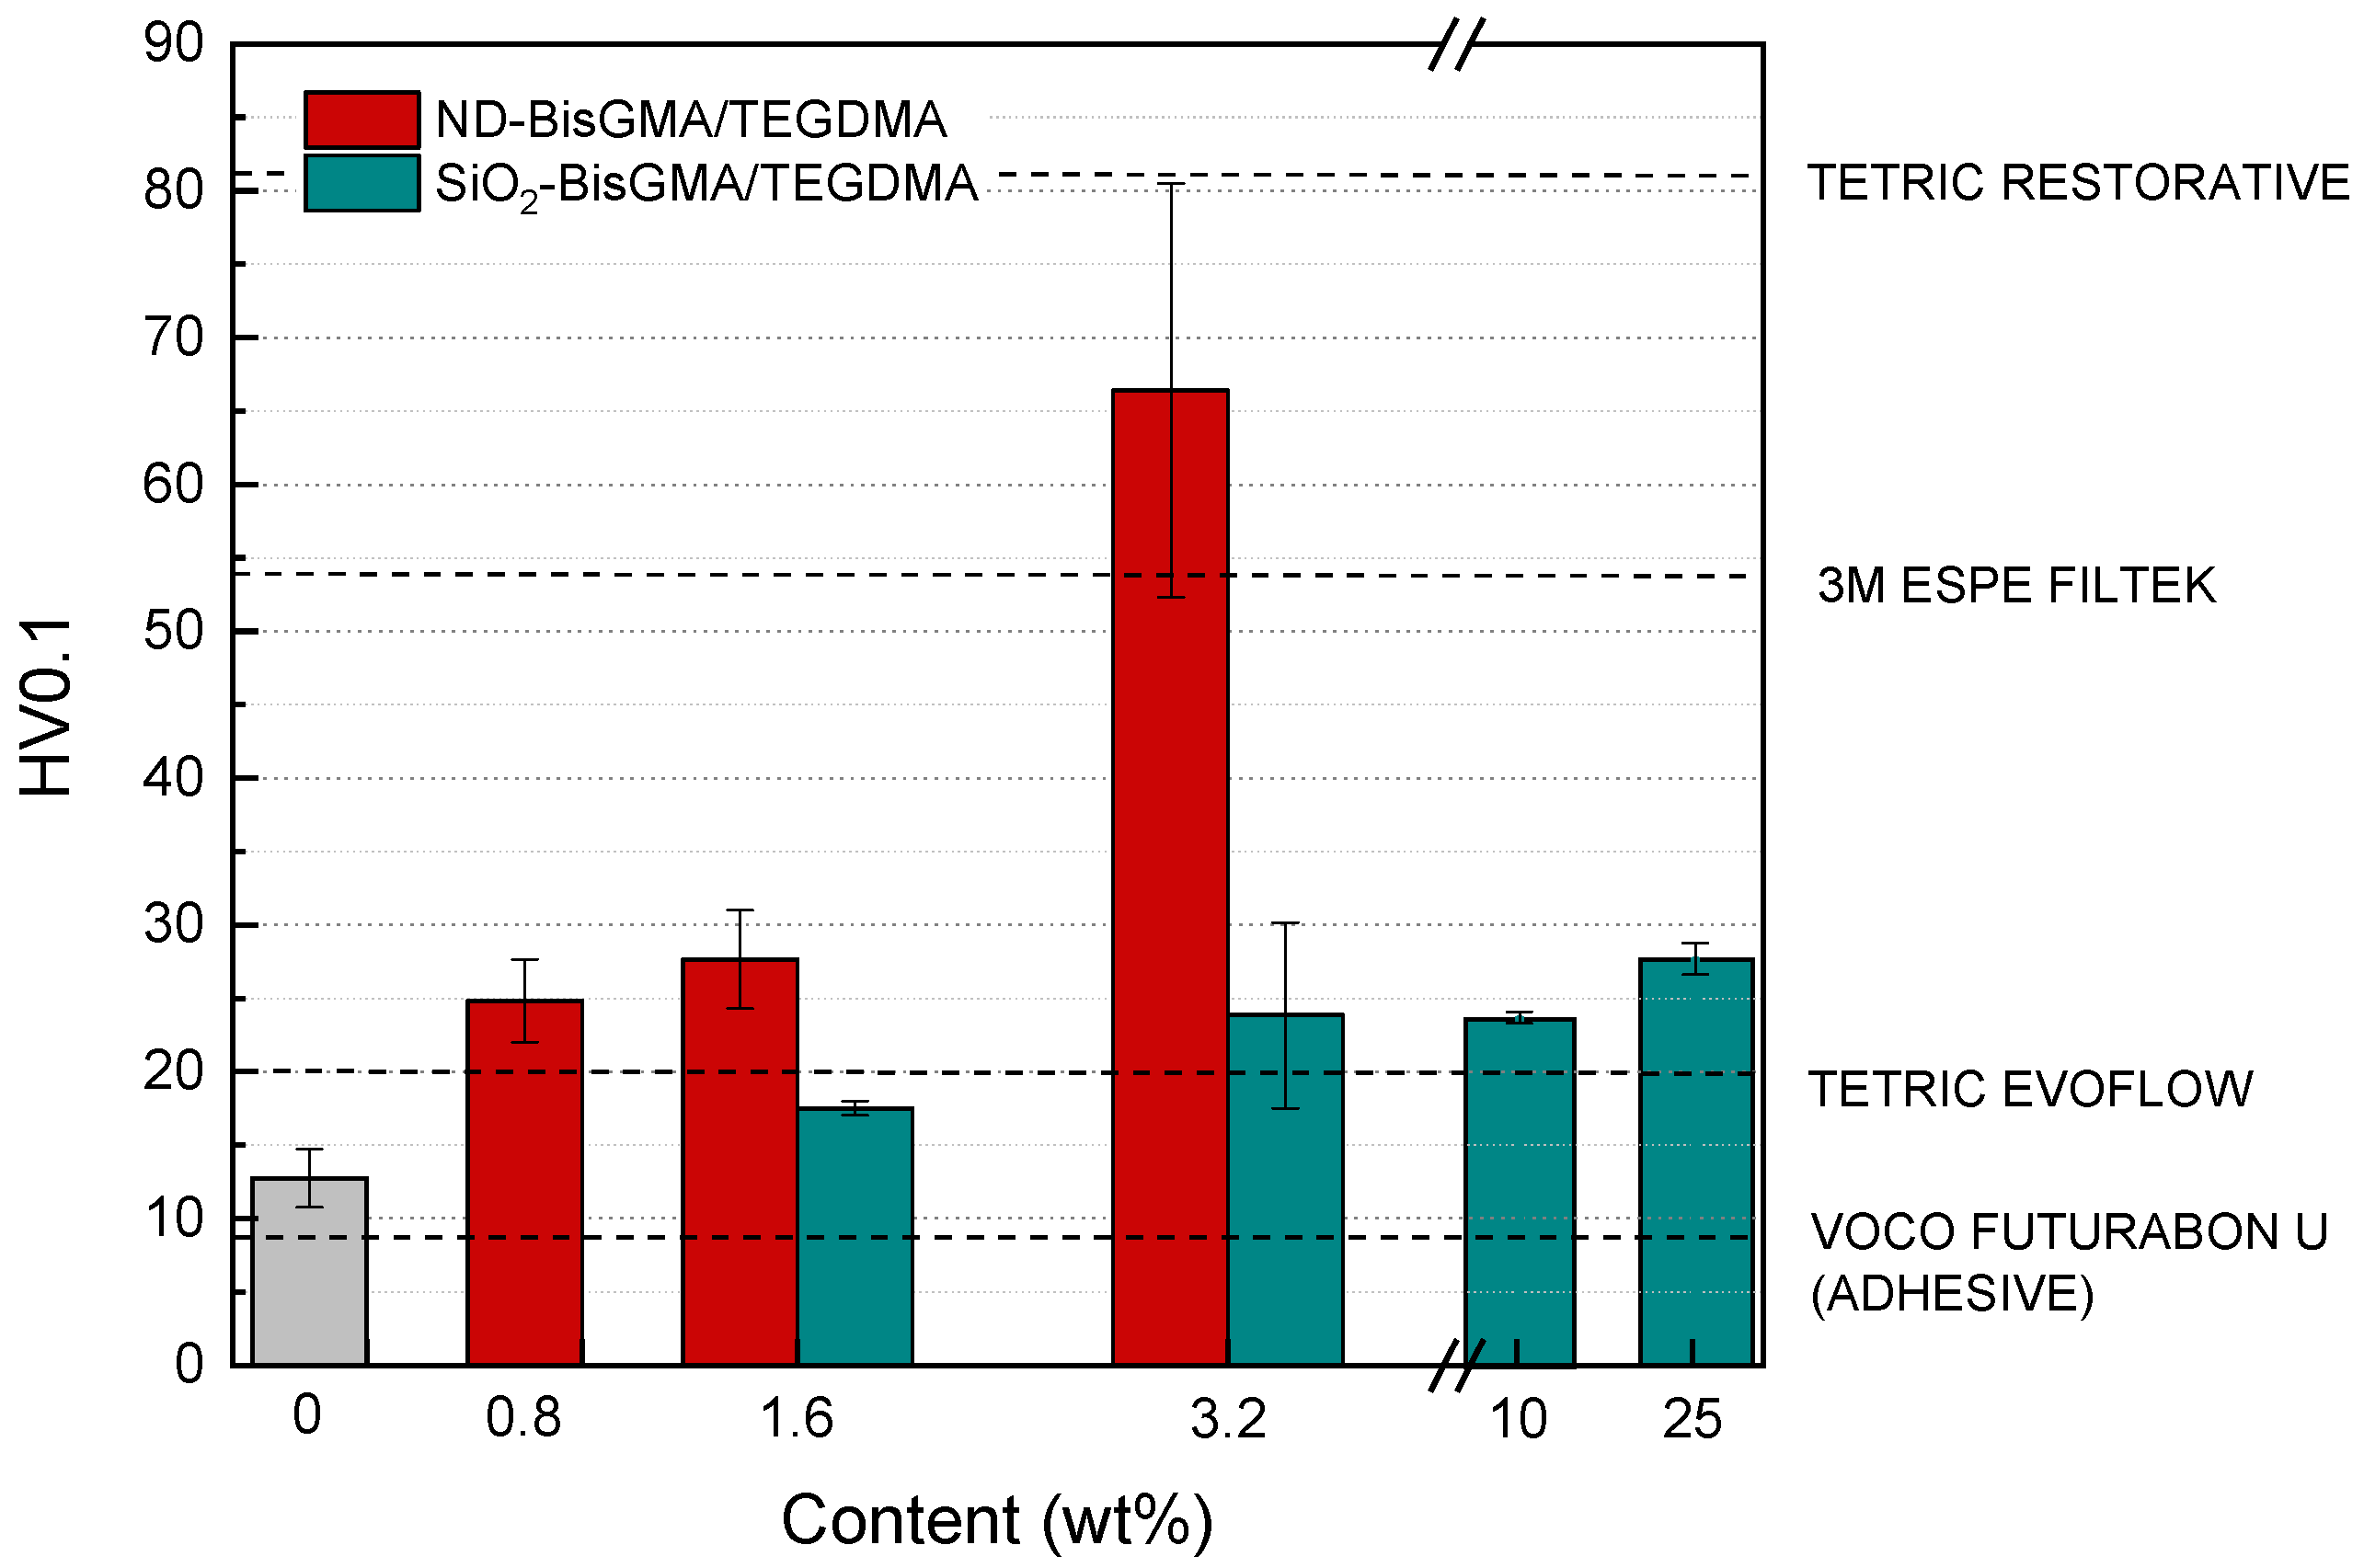
3.2. Wear Behavior of ND-Nanocomposites
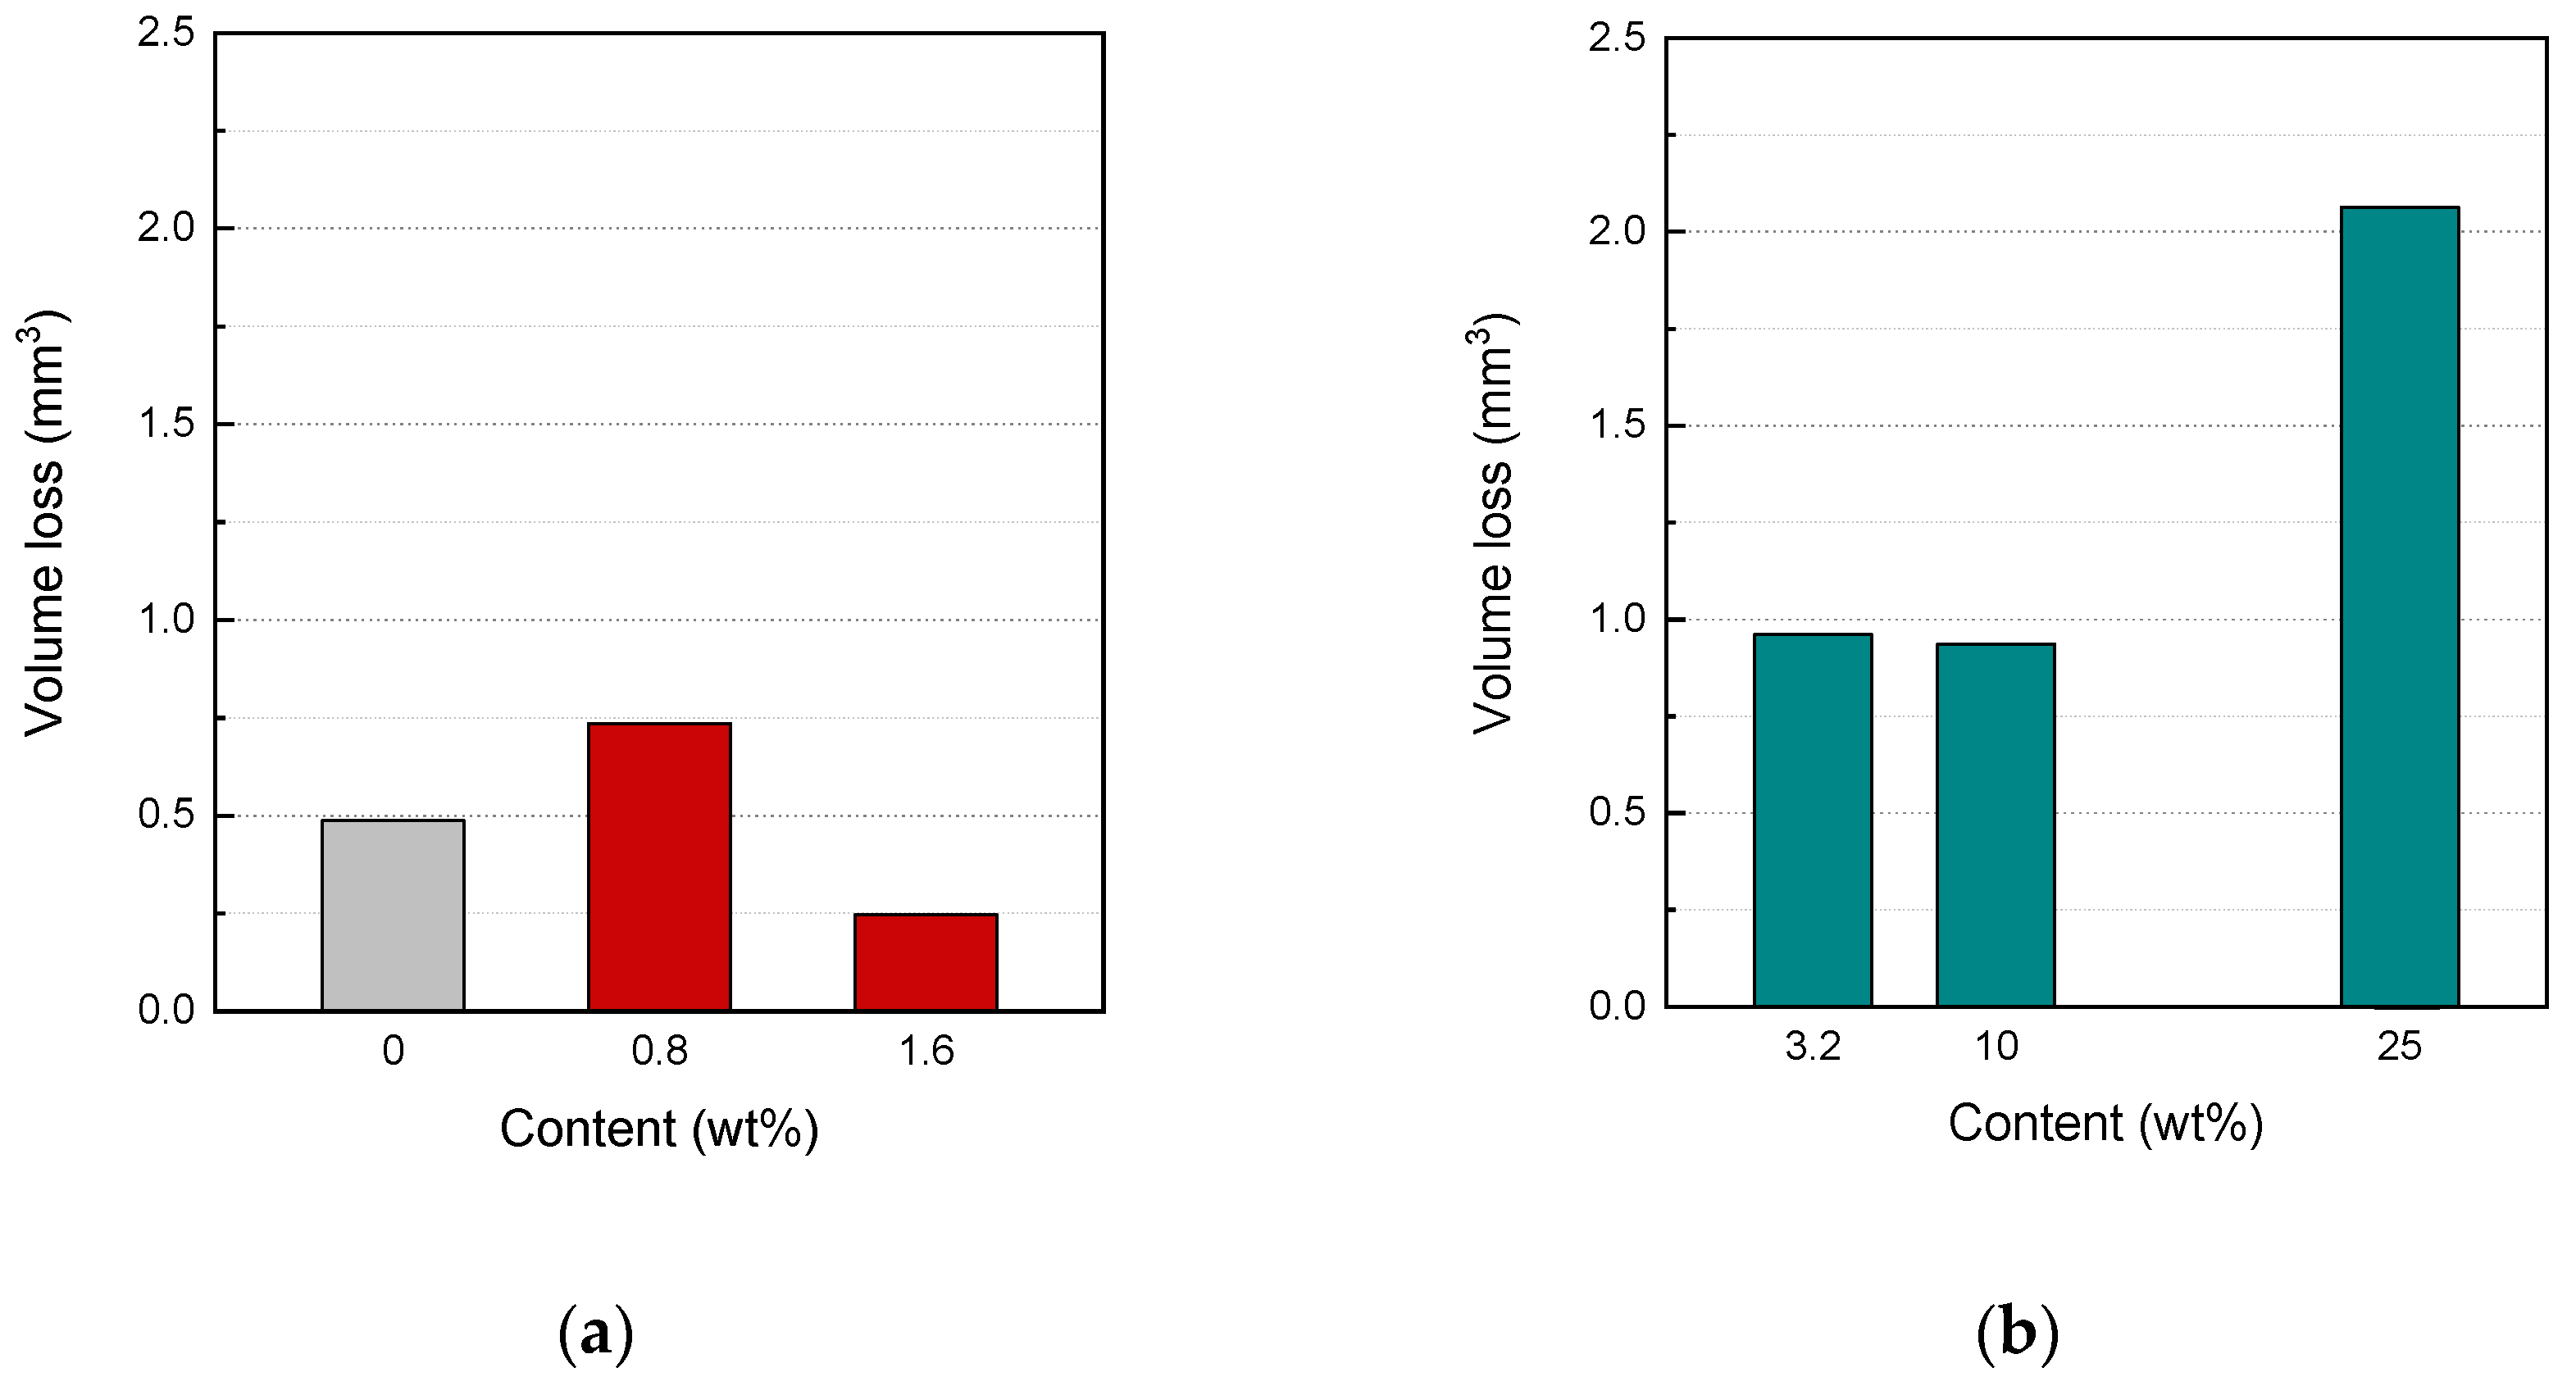
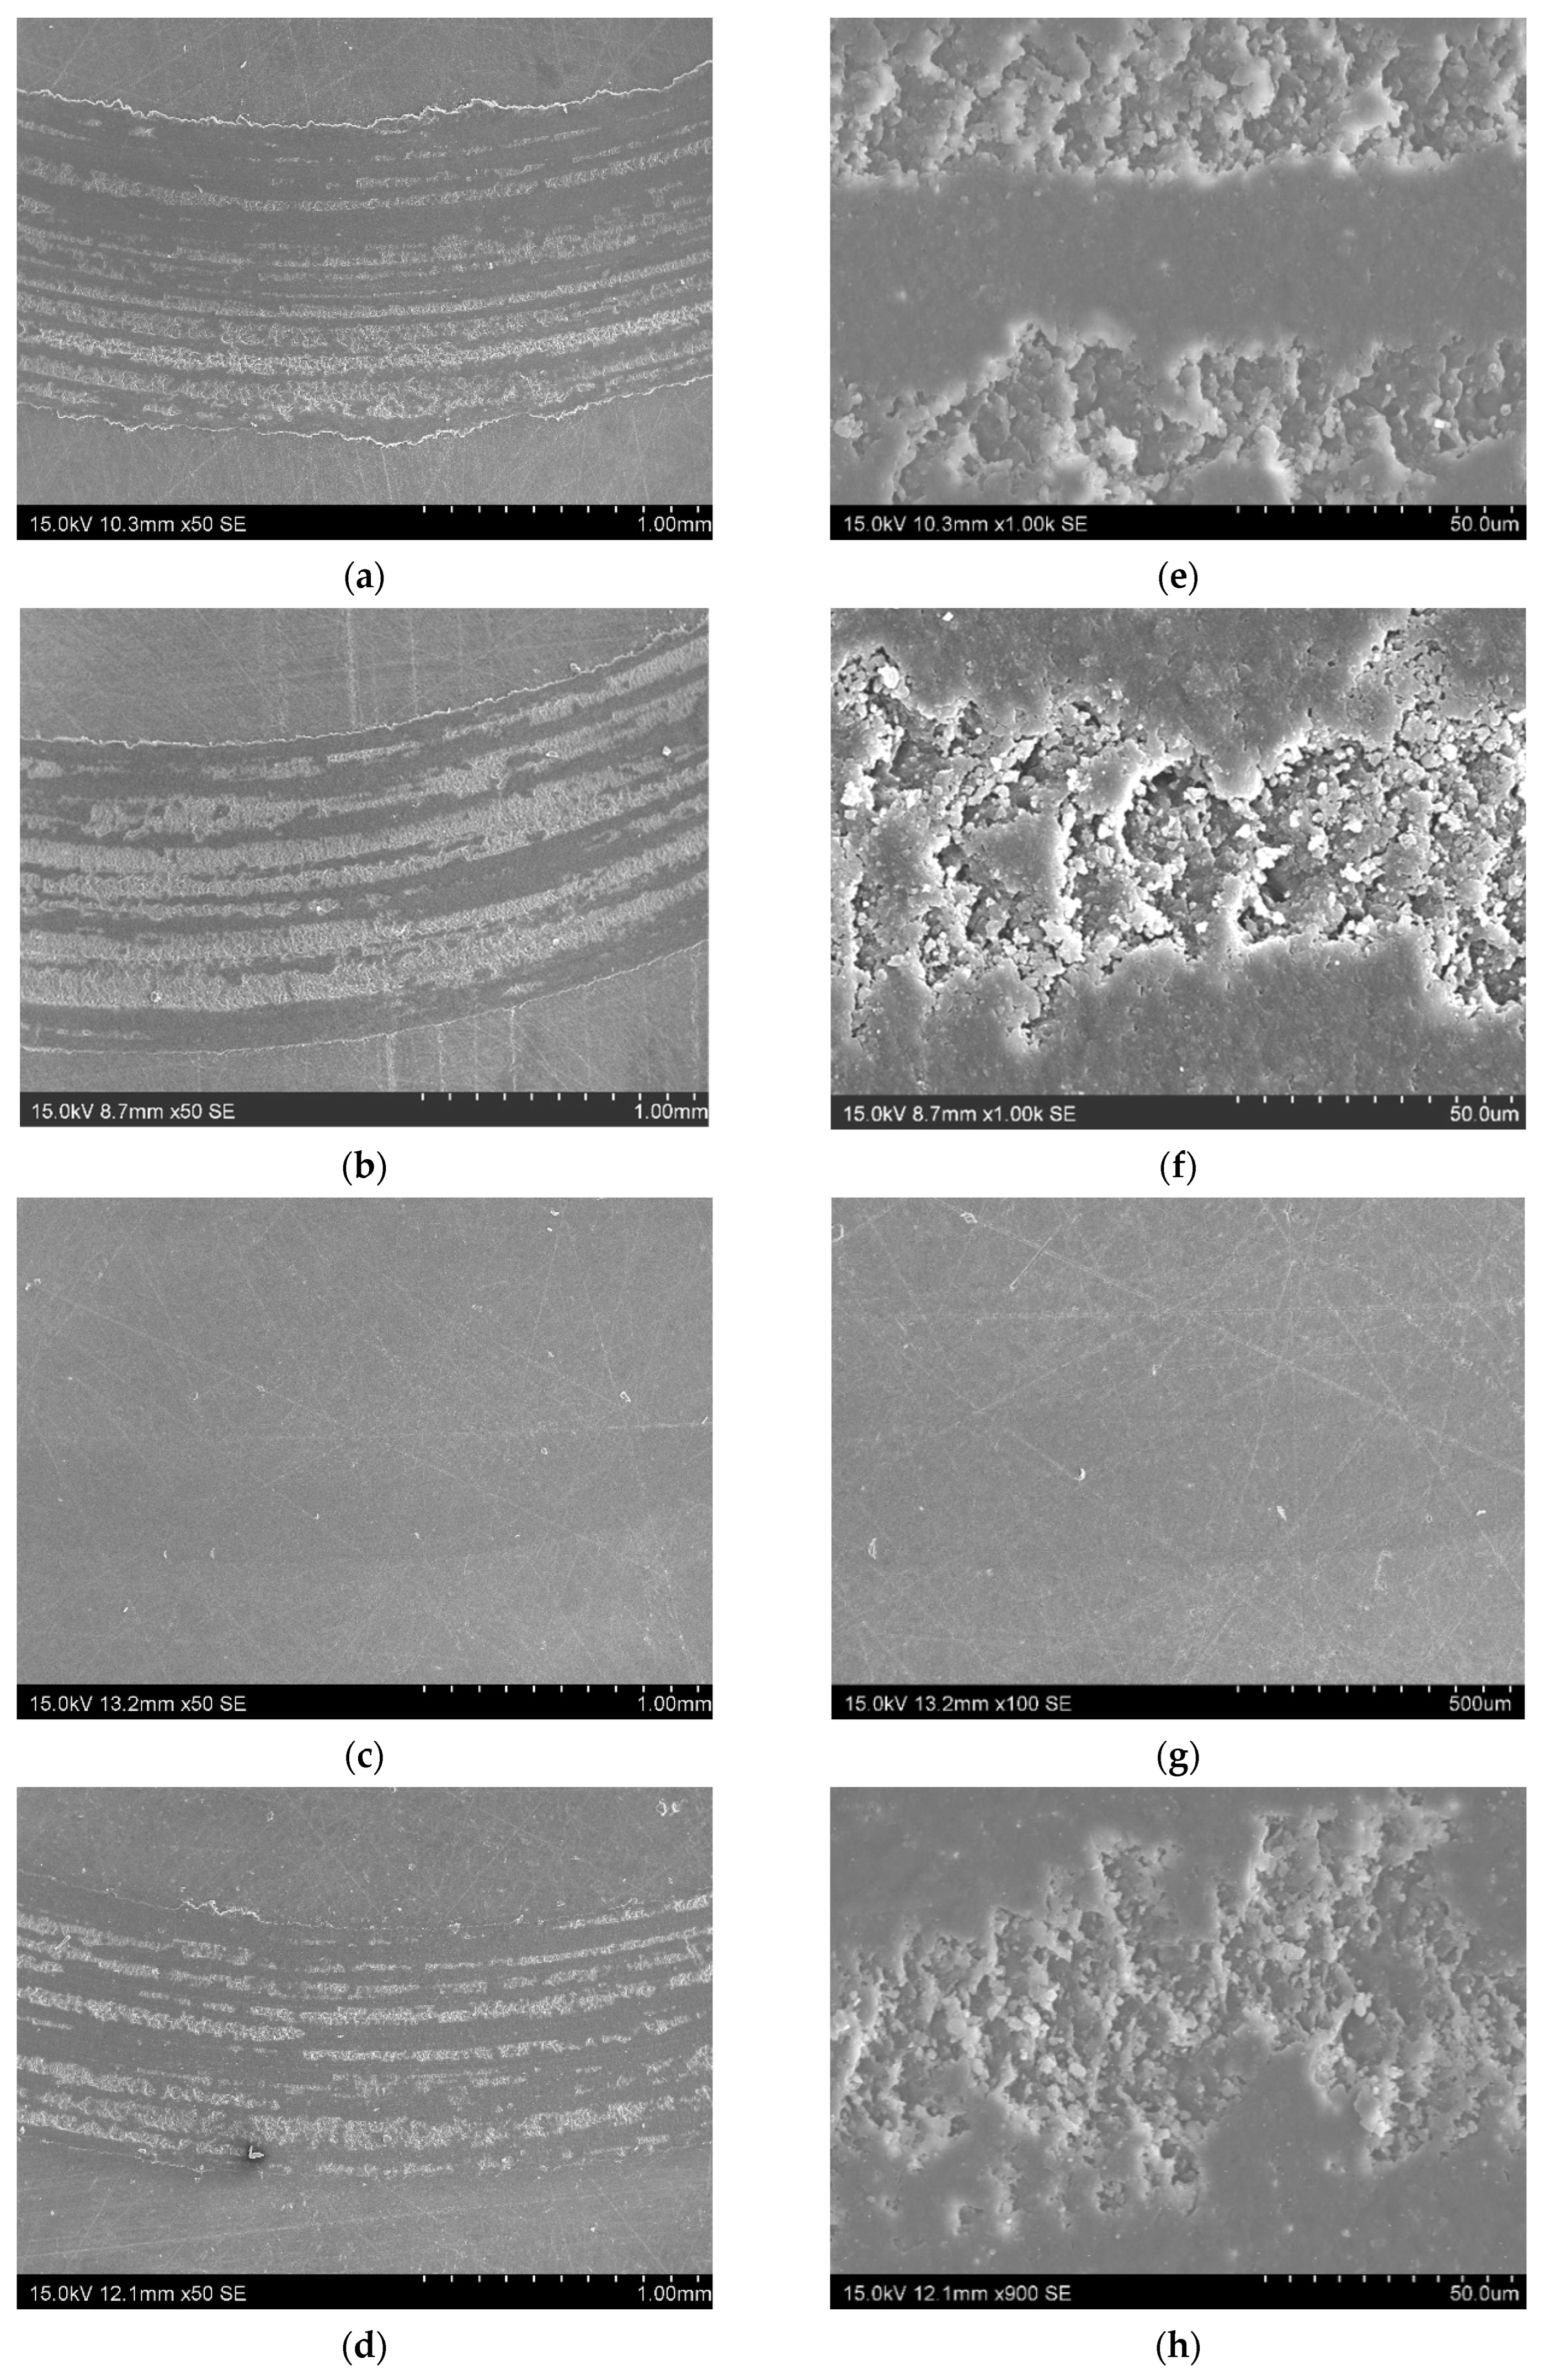
3.3. UV-Curing Analysis of ND-Based Nanocomposites
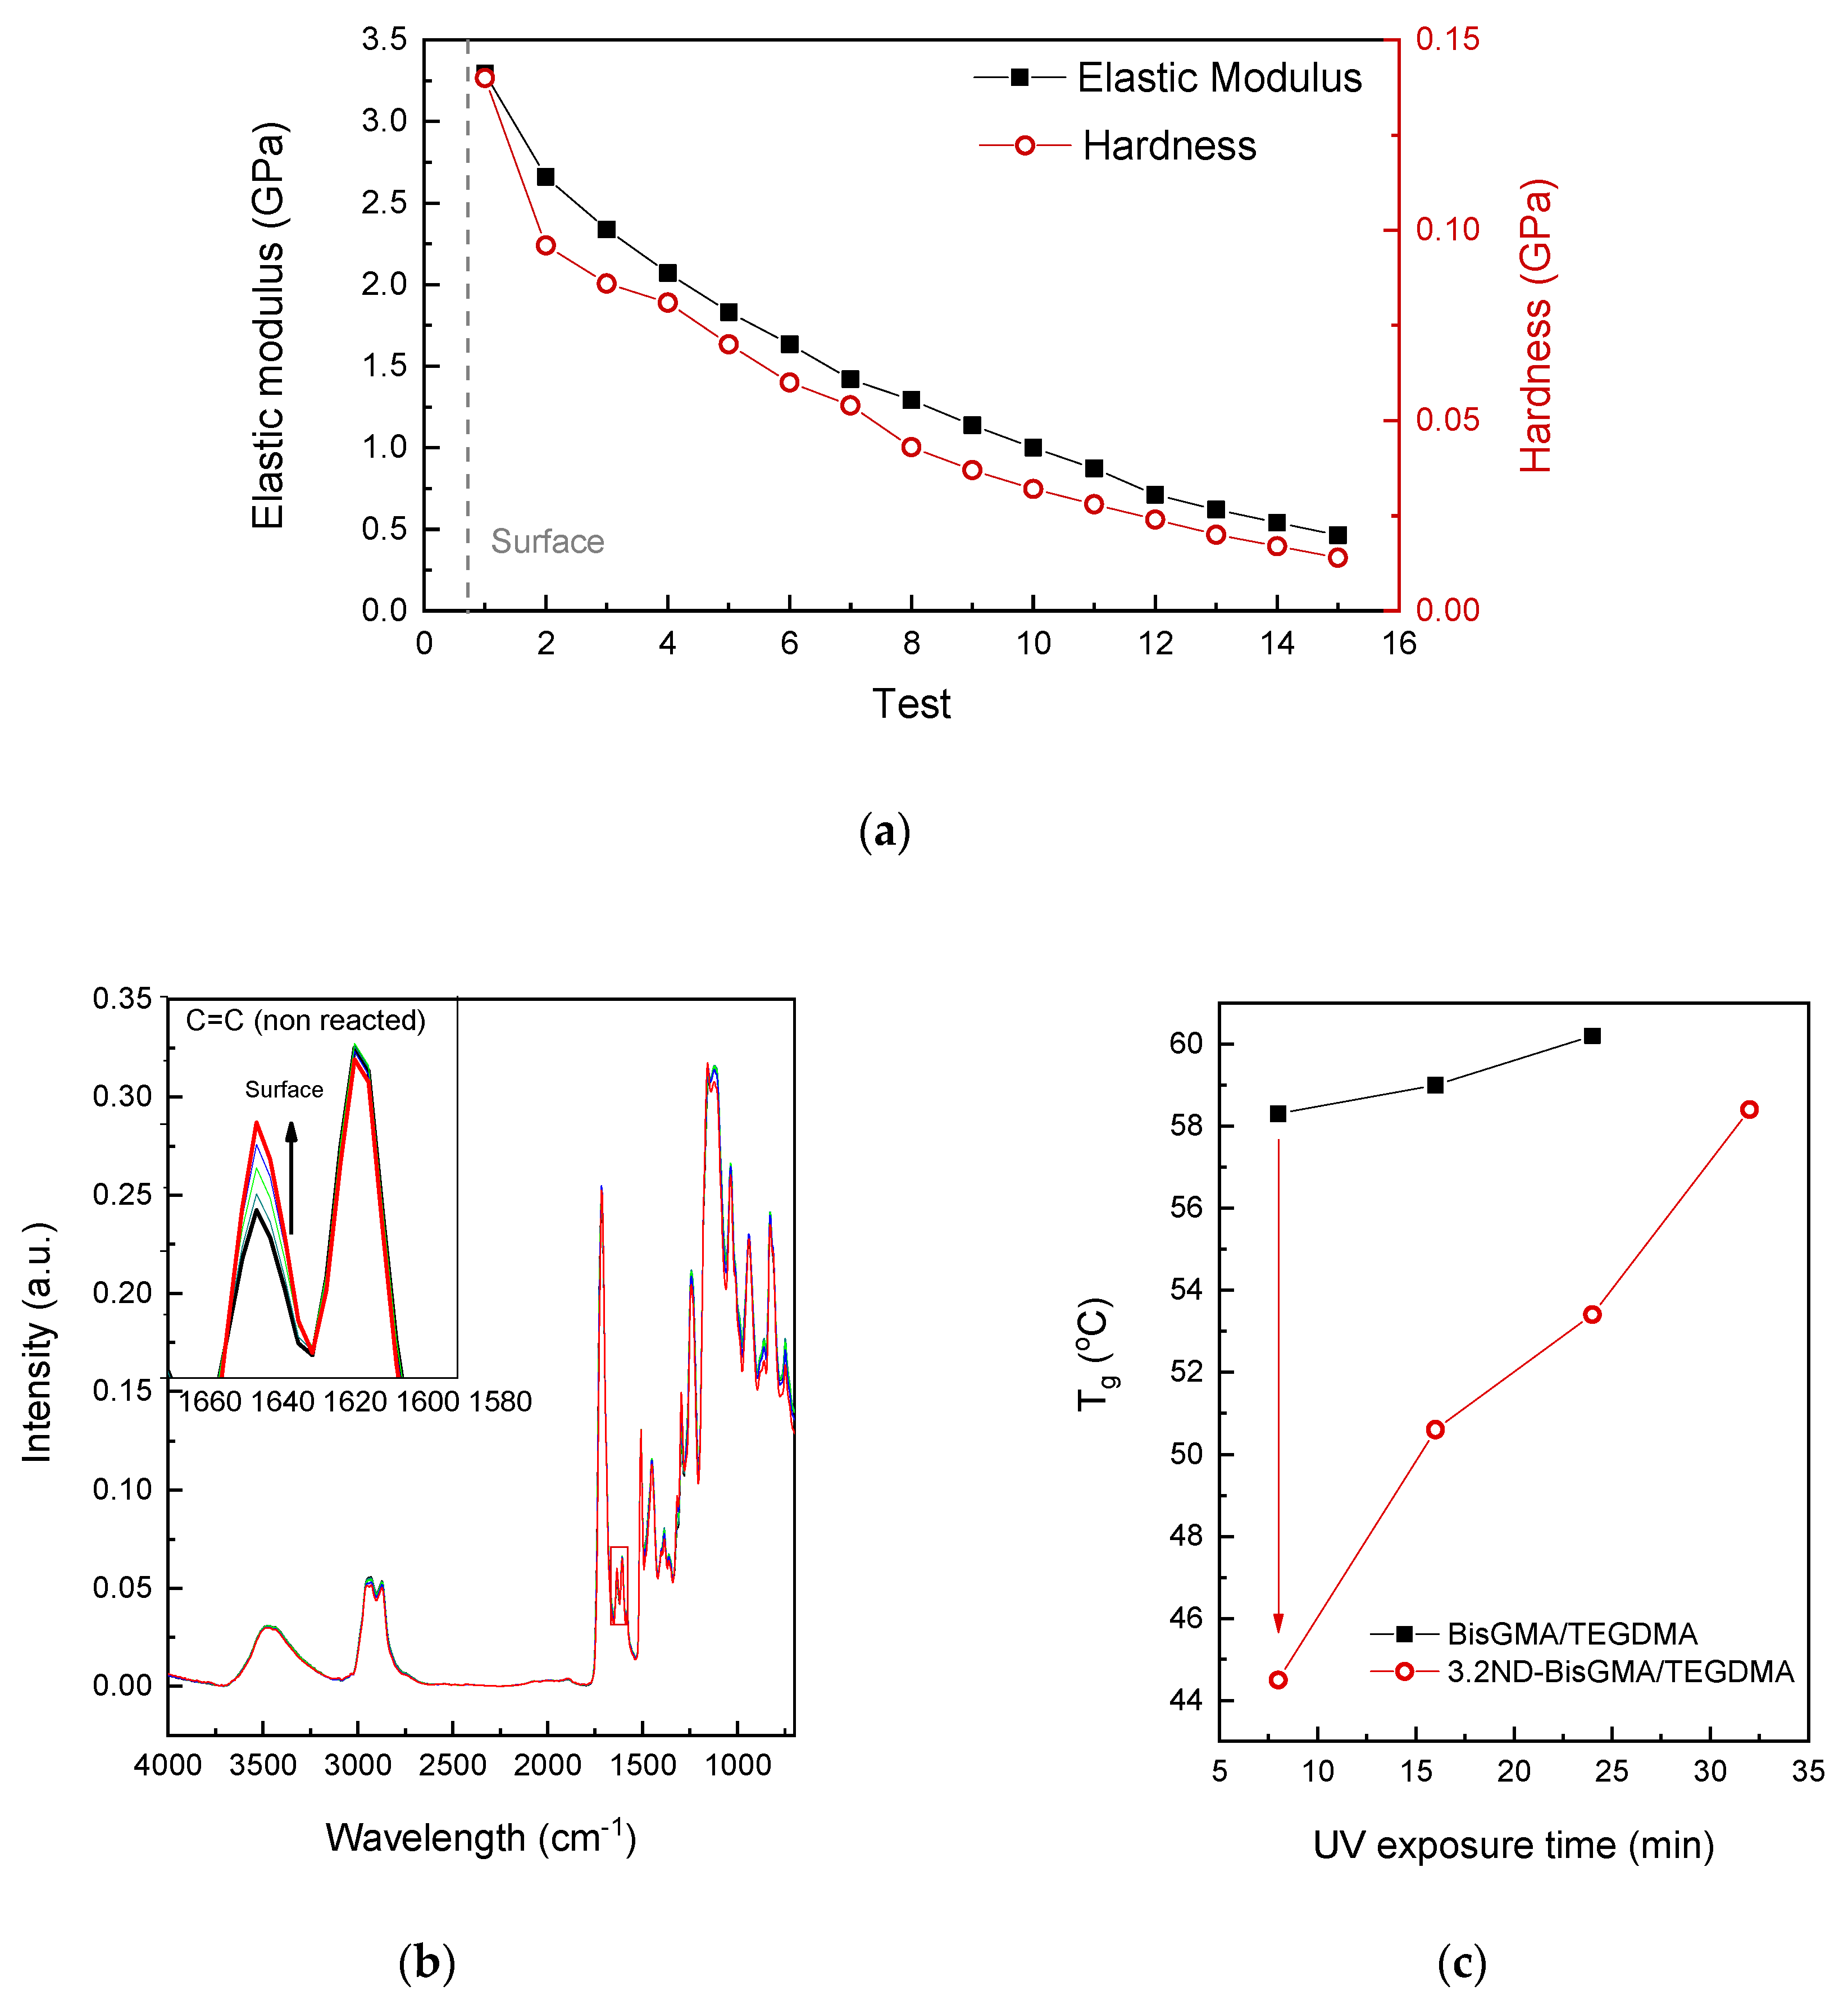
4. Conclusions
Author Contributions
Funding
Institutional Review Board Statement
Informed Consent Statement
Data Availability Statement
Conflicts of Interest
References
- Pirmoradian, M.; Hooshmand, T.; Jafari-Semnani, S.; Fadavi, F. Degree of conversion and microhardness of bulk-fill dental composites polymerized by LED and QTH light curing units. J Oral Biosci 2020, 62, 107–113. [Google Scholar] [CrossRef] [PubMed]
- Parasher, A.; Ginjupalli, K.; Somayaji, K.; Kabbinale, P. Comparative evaluation of the depth of cure and surface roughness of bulk-fill composites: An in vitro study. Dent Med Probl 2020, 57, 39–44. [Google Scholar] [CrossRef] [PubMed]
- Aljabo, A.; Abou Neel, E.A.; Knowles, J.C.; Young, A.M. Development of dental composites with reactive fillers that promote precipitation of antibacterial-hydroxyapatite layers. Mater Sci Eng C 2016, 60, 285–292. [Google Scholar] [CrossRef] [PubMed]
- Ender, A.; Bienz, S.; Mörmann, W.; Mehl, A.; Attin, T.; Stawarczyk, B.; et al. Marginal adaptation, fracture load and macroscopic failure mode of adhesively luted PMMA-based CAD / CAM inlays. Dent Mater 2015, 32, 1–8. [Google Scholar] [CrossRef] [PubMed]
- Zhang, X.; Zhang, J.; Zhang, T.; Yao, S.; Wang, Z.; Zhou, C.; Wu, J. Novel low-shrinkage dental resin containing microcapsules with antibacterial and self-healing properties. J Mech Behav Biomed Mater 2023, 148, 106212. [Google Scholar] [CrossRef]
- Kessler, A.; Reymus, M.; Hickel, R.; Kunzelmann, K.H. Three-body wear of 3D printed temporary materials. Dent Mater 2019, 35, 1805–1812. [Google Scholar] [CrossRef] [PubMed]
- Branco, A.C.; Silva, R.; Santos, T.; Jorge, H.; Rodrigues, A.R.; Fernandes, R.; et al. Suitability of 3D printed pieces of nanocrystalline zirconia for dental applications. Dent Mater 2020, 36, 442–455. [Google Scholar] [CrossRef] [PubMed]
- Li, G.; Qi, H.; Zhang, G.; Zhao, F.; Wang, T.; Wang, Q. Significant friction and wear reduction by assembling two individual PEEK composites with specific functionalities. Mater Des 2017, 116, 152–159. [Google Scholar] [CrossRef]
- Zhang, L.; Zhang, G.; Chang, L.; Wetzel, B.; Jim, B.; Wang, Q. Distinct tribological mechanisms of silica nanoparticles in epoxy composites reinforced with carbon nanotubes, carbon fibers and glass fibers. Tribol Int 2016, 104, 225–236. [Google Scholar] [CrossRef]
- Tereza, G.P.G.; de Oliveira, G.C.; de Andrade Moreira Machado, M.A.; de Oliveira, T.M.; da Silva, T.C.; Rios, D. Influence of removing excess of resin-based materials applied to eroded enamel on the resistance to erosive challenge. J Dent 2016, 47, 49–54. [Google Scholar] [CrossRef]
- Hasselkvist, A.; Johansson, A.; Johansson, A.K. A 4 year prospective longitudinal study of progression of dental erosion associated to lifestyle in 13–14 year-old Swedish adolescents. J Dent 2016, 47, 55–62. [Google Scholar] [CrossRef]
- Santos, M.; Coelho, A.S.; Paula, A.B.; Marto, C.M.; Amaro, I.; Saraiva, J.; et al. Mechanical and tribological characterization of a dental ceromer. J Funct Biomater 2020, 11, 11. [Google Scholar] [CrossRef]
- Buldur, M.; Sirin Karaarslan, E. Microhardness of glass carbomer and high-viscous glass Ionomer cement in different thickness and thermo-light curing durations after thermocycling aging. BMC Oral Health 2019, 19, 1–13. [Google Scholar] [CrossRef] [PubMed]
- Ivanov, M.; Shenderova, O. Nanodiamond-based nanolubricants for motor oils. Curr Opin Solid State Mater Sci 2017, 21, 17–24. [Google Scholar] [CrossRef]
- Tortora, A.M.; Halenahally Veeregowda, D. Effects of two sliding motions on the superlubricity and wear of self-mated bearing steel lubricated by aqueous glycerol with and without nanodiamonds. Wear 2017, 386–387, 173–178. [Google Scholar] [CrossRef]
- Pan, F.; Khan, M.; Tiehu, L.; Javed, E.; Hussain, A.; Zada, A.; Alei, D.; Wahab, Z. Effect of nanodiamond particles on the structure, mechanical, and thermal properties of polymer embedded ND/PMMA composites. J Polym Eng 2022, 42, 795–807. [Google Scholar] [CrossRef]
- Golchin, A.; Villain, A.; Emami, N. Tribological behaviour of nanodiamond reinforced UHMWPE in water-lubricated contacts. Tribol Int 2017, 110, 195–200. [Google Scholar] [CrossRef]
- Haleem, Y.A.; Song, P.; Liu, D.; Wang, C.; Gan, W.; Saleem, M.F.; et al. The effect of high concentration and small size of nanodiamonds on the strength of interface and fracture properties in epoxy nanocomposite. Mater 2016, 9, 507. [Google Scholar] [CrossRef] [PubMed]
- Koumoulos, E.P.; Jagadale, P.; Lorenzi, A.; Tagliaferro, A.; Charitidis, C.A. Evaluation of surface properties of epoxy-nanodiamonds composites. Compos Part B: Eng 2015, 80, 27–36. [Google Scholar] [CrossRef]
- Chen, Z.; Liu, Y.; Luo, J. Superlubricity of nanodiamonds glycerol colloidal solution between steel surfaces. Colloids Surf A: Physicochem Eng 2016, 489, 400–406. [Google Scholar] [CrossRef]
- Guo, L.; Qi, H.; Zhang, G.; Wang, T.; Wang, Q. Distinct tribological mechanisms of various oxide nanoparticles added in PEEK composite reinforced with carbon fibers. Compos Part A: Appl S 2017, 97, 19–30. [Google Scholar] [CrossRef]
- Abenojar, J.; Tutor, J.; Ballesteros, Y.; del Real, J.C.; Martínez, M.A. Erosion-wear, mechanical and thermal properties of silica filled epoxy nanocomposites. Compos Part B: Eng 2017, 120, 42–53. [Google Scholar] [CrossRef]
- Zhang, X.; Wang, H.; Liu, Z.; Zhu, Y.; Wu, S.; Wang, C.; et al. Fabrication of durable fluorine-free superhydrophobic polyethersulfone (PES) composite coating enhanced by assembled MMT-SiO2 nanoparticles. Appl Surf Sci 2017, 396, 1580–1588. [Google Scholar] [CrossRef]
- Chadda, H.; Satapathy, B.K.; Patnaik, A.; Ray, A.R. Mechanistic interpretations of fracture toughness and correlations to wear behavior of hydroxyapatite and silica/hydroxyapatite filled bis-GMA/TEGDMA micro/hybrid dental restorative composites. Compos Part B: Eng 2017, 130, 132–146. [Google Scholar] [CrossRef]
- Campo, M.; Jiménez-Suárez, A.; Ureña, A. Effect of type, percentage and dispersion method of multi-walled carbon nanotubes on tribological properties of epoxy composites. Wear 2015, 324–325, 100–108. [Google Scholar] [CrossRef]
- Campo, M.; Jiménez-Suárez, A.; Ureña, A. Tribological properties of different types of graphene nanoplatelets as additives for the epoxy resin. Appl Sci 2020, 10, 4363. [Google Scholar] [CrossRef]
- Zhao, Y.; Qi, X.; Dong, Y.; Ma, J.; Zhang, Q.; Song, L.; et al. Mechanical, thermal and tribological properties of polyimide/nano-SiO2 composites synthesized using an in-situ polymerization. Tribol Int 2016, 103, 599–608. [Google Scholar] [CrossRef]
- Wendler, M.; Kaizer, M.R.; Belli, R.; Lohbauer, U.; Zhang, Y. Sliding contact wear and subsurface damage of CAD/CAM materials against zirconia. Dent Mater 2020, 36, 387–401. [Google Scholar] [CrossRef] [PubMed]
- Pieniak, D.; Walczak, A.; Walczak, M.; Przystupa, K.; Niewczas, A.M. Hardness and wear resistance of dental biomedical nanomaterials in a humid environment with non-stationary temperatures. Mater 2020, 13, 1255. [Google Scholar] [CrossRef]
- Vul, A.Y.; Eydelman, E.D.; Sharonova, L.V.; Aleksenskiy, A.E.; Konyakhin, S.V. Absorption and scattering of light in nanodiamond hydrosols. Diam Relat Mater 2011, 20, 279–284. [Google Scholar] [CrossRef]
- Rodrigues de Menezes, L.; Oliveira da Silva, E. The Use of Montmorillonite Clays as Reinforcing Fillers for Dental Adhesives. Mater Res 2016, 19, 236–242. [Google Scholar] [CrossRef]
- Odermatt, R.; Par, M.; Mohn, D.; Wiedemeier, D.B.; Attin, T.; Tauböck, T.T. Bioactivity and Physico-Chemical Properties of Dental Composites Functionalized with Nano- vs. Micro-Sized Bioactive Glass. J Clin Med 2020, 9, 772. [Google Scholar] [CrossRef] [PubMed]
Disclaimer/Publisher’s Note: The statements, opinions and data contained in all publications are solely those of the individual author(s) and contributor(s) and not of MDPI and/or the editor(s). MDPI and/or the editor(s) disclaim responsibility for any injury to people or property resulting from any ideas, methods, instructions or products referred to in the content. |
© 2024 by the authors. Licensee MDPI, Basel, Switzerland. This article is an open access article distributed under the terms and conditions of the Creative Commons Attribution (CC BY) license (http://creativecommons.org/licenses/by/4.0/).


