1. Introduction
In 2020 alone, musculoskeletal disorders (MSDs) were ranked as the second leading cause of non-fatal disability, affecting over a billion people globally [
1]. In the United Kingdom, more than 7.1 million adults suffer from MSDs, imposing an economic burden exceeding £4.1billion annually. Bevan et al. (2015) [
2] highlighted that MSDs account for over 2% of the European Union’s gross domestic product (GDP), translating to an annual cost of approximately €240 billion. These statistics underscore the increasing concern surrounding MSDs, necessitating effective interventions.
MSDs arise from a variety of factors, ranging from congenital defects [
3] to neurological disorders [
4]. Contrary to common misconception, MSDs are not confined to the elderly; individuals of all ages are susceptible. Early development of MSDs can be attributed to various neurological conditions but also sedentary lifestyles and poor posture [
5]. The office environment, characterized by prolonged periods of sitting can exacerbate the risk of developing long-term musculoskeletal conditions, including back pain and spinal deformities [
6,
7,
8]. Studies conducted among daily office workers conclude that there is a strong correlation between prolonged sitting and severe back pains affecting the lumbar area [
9,
10]. To combat this problem, a recommendation is that the users take stroll breaks every few hours. The incorporation of exercise breaks as a daily routine, potentially increases cognitive functions in the long-term and improves muscle strength [
11].
Poor sitting posture has long been recognized as a significant contributor to the development of pressure sores, adversely affecting the function, comfort, physiology, and mobility of individuals who use wheelchairs [
12]. Healthcare professionals tasked with conducting postural assessments often rely on external observations to infer the internal configuration of musculoskeletal structures [
13]. Typically performed in clinical settings, these assessments are subjective, with the detection of abnormalities dependent on visual inspection and palpation of the underlying skeletal structure [
14]. Objective techniques for measuring musculoskeletal configuration such as MRI, CT scans, and X-rays are accurate but impractical for routine clinical use due to logistical, cost, and safety considerations, notably the risk of increased radiation exposure. Over the years, a diverse array of techniques for anthropometric measurements and postural assessments has been developed, broadly categorized into contact and non-contact methods. The contact methods include simple tactile devices such as anthropometric tapes, stadiometers or scoliometers [
15]. Non-contact techniques are radiography [
16], Moire fringe topography [
17], structured light methods [
17], laser scanning [
18], pressure mapping systems [
19], mechanical displacement sensors [
20] and ultrasonic localization [
21]. The primary drawbacks of tactile devices are their time-intensive nature, the absence of three-dimensional (3D) data, and potential discomfort for the patient. Non-contact methods, on the other hand, tend to offer enhanced accuracy and frequently provide 3D shape information. Yet, a significant limitation of these non-contact methods, particularly in the context of assessing sitting posture, is their dependence on direct access to the individual’s back. This necessitates the person to be in an upright, standing position for the measurement process, posing challenges for evaluations conducted in a seated posture.
Smart sensing chairs offer a solution to the limitations inherent in both contact and non-contact methods of assessing sitting posture. By integrating sensors directly into the seating surface and backrest, these chairs enable continuous, real-time monitoring of posture without the need for direct physical contact or the subject to be in a specific position, such as standing. Furthermore, the incorporation of smart sensing chairs into home or office environments enables active monitoring and feedback on user’s health and activity levels. With the recent development in sensor technology and Artificial Intelligence, these systems hold promise for advancing personalized healthcare and enhancing quality of life, particularly for individuals afflicted with musculoskeletal disorders (MSDs).
The concept of a smart sensing chair was first explored by Tan et al. (2001) [
22], pioneering the classification of sitting postures using integrated pressure sensors. Recent years have witnessed a surge in research focusing on smart sensing chairs, with approximately 500 studies published annually over the past five years. This trend underscores the growing interest in the field, highlighting the continuous increase in related publications.
The primary aim of this literature review is to evaluate published papers on smart sensing chair systems, aiming to understand the methods being employed in posture classification. By exploring existing studies, it is possible to analyse current trends such as commonly used sensors and machine learning algorithms being adopted as well as potential research gaps. Ultimately, this review paper aims to provide valuable insight for researchers in the development of non-invasive smart sensing chair systems.
2. Research Methodology
This paper is aimed at conducting a comprehensive review of similar research studies done on smart sensing chair technology. Overall, there are 7 steps involved with this review process which are the following: 1. Formulation of Research Questions 2. Search Strategy, 3. Study Screening and Selection, 4. Data Extraction, 5. Discussion, 6. Conclusion and Recommendations.
2.1. Formulation of Research Questions
Table 1 presents the research questions for the comprehensive literature review on smart sensing chairs, each accompanied by its underlying rationale. These questions have been crafted to guide the literature review of smart sensing chairs, targeting key aspects that are central to understanding the current state and future directions of this technology.
2.2. Search Strategy
A comprehensive search was conducted across several academic databases, including Google Scholar, IEEE Xplore, and MDPI, to gather relevant articles. A predefined set of keywords and combinations thereof were used to refine the search, ensuring the retrieval of pertinent studies published in the last two decades.
Table 2 outlines the search keywords.
2.3. Study Screening and Selection
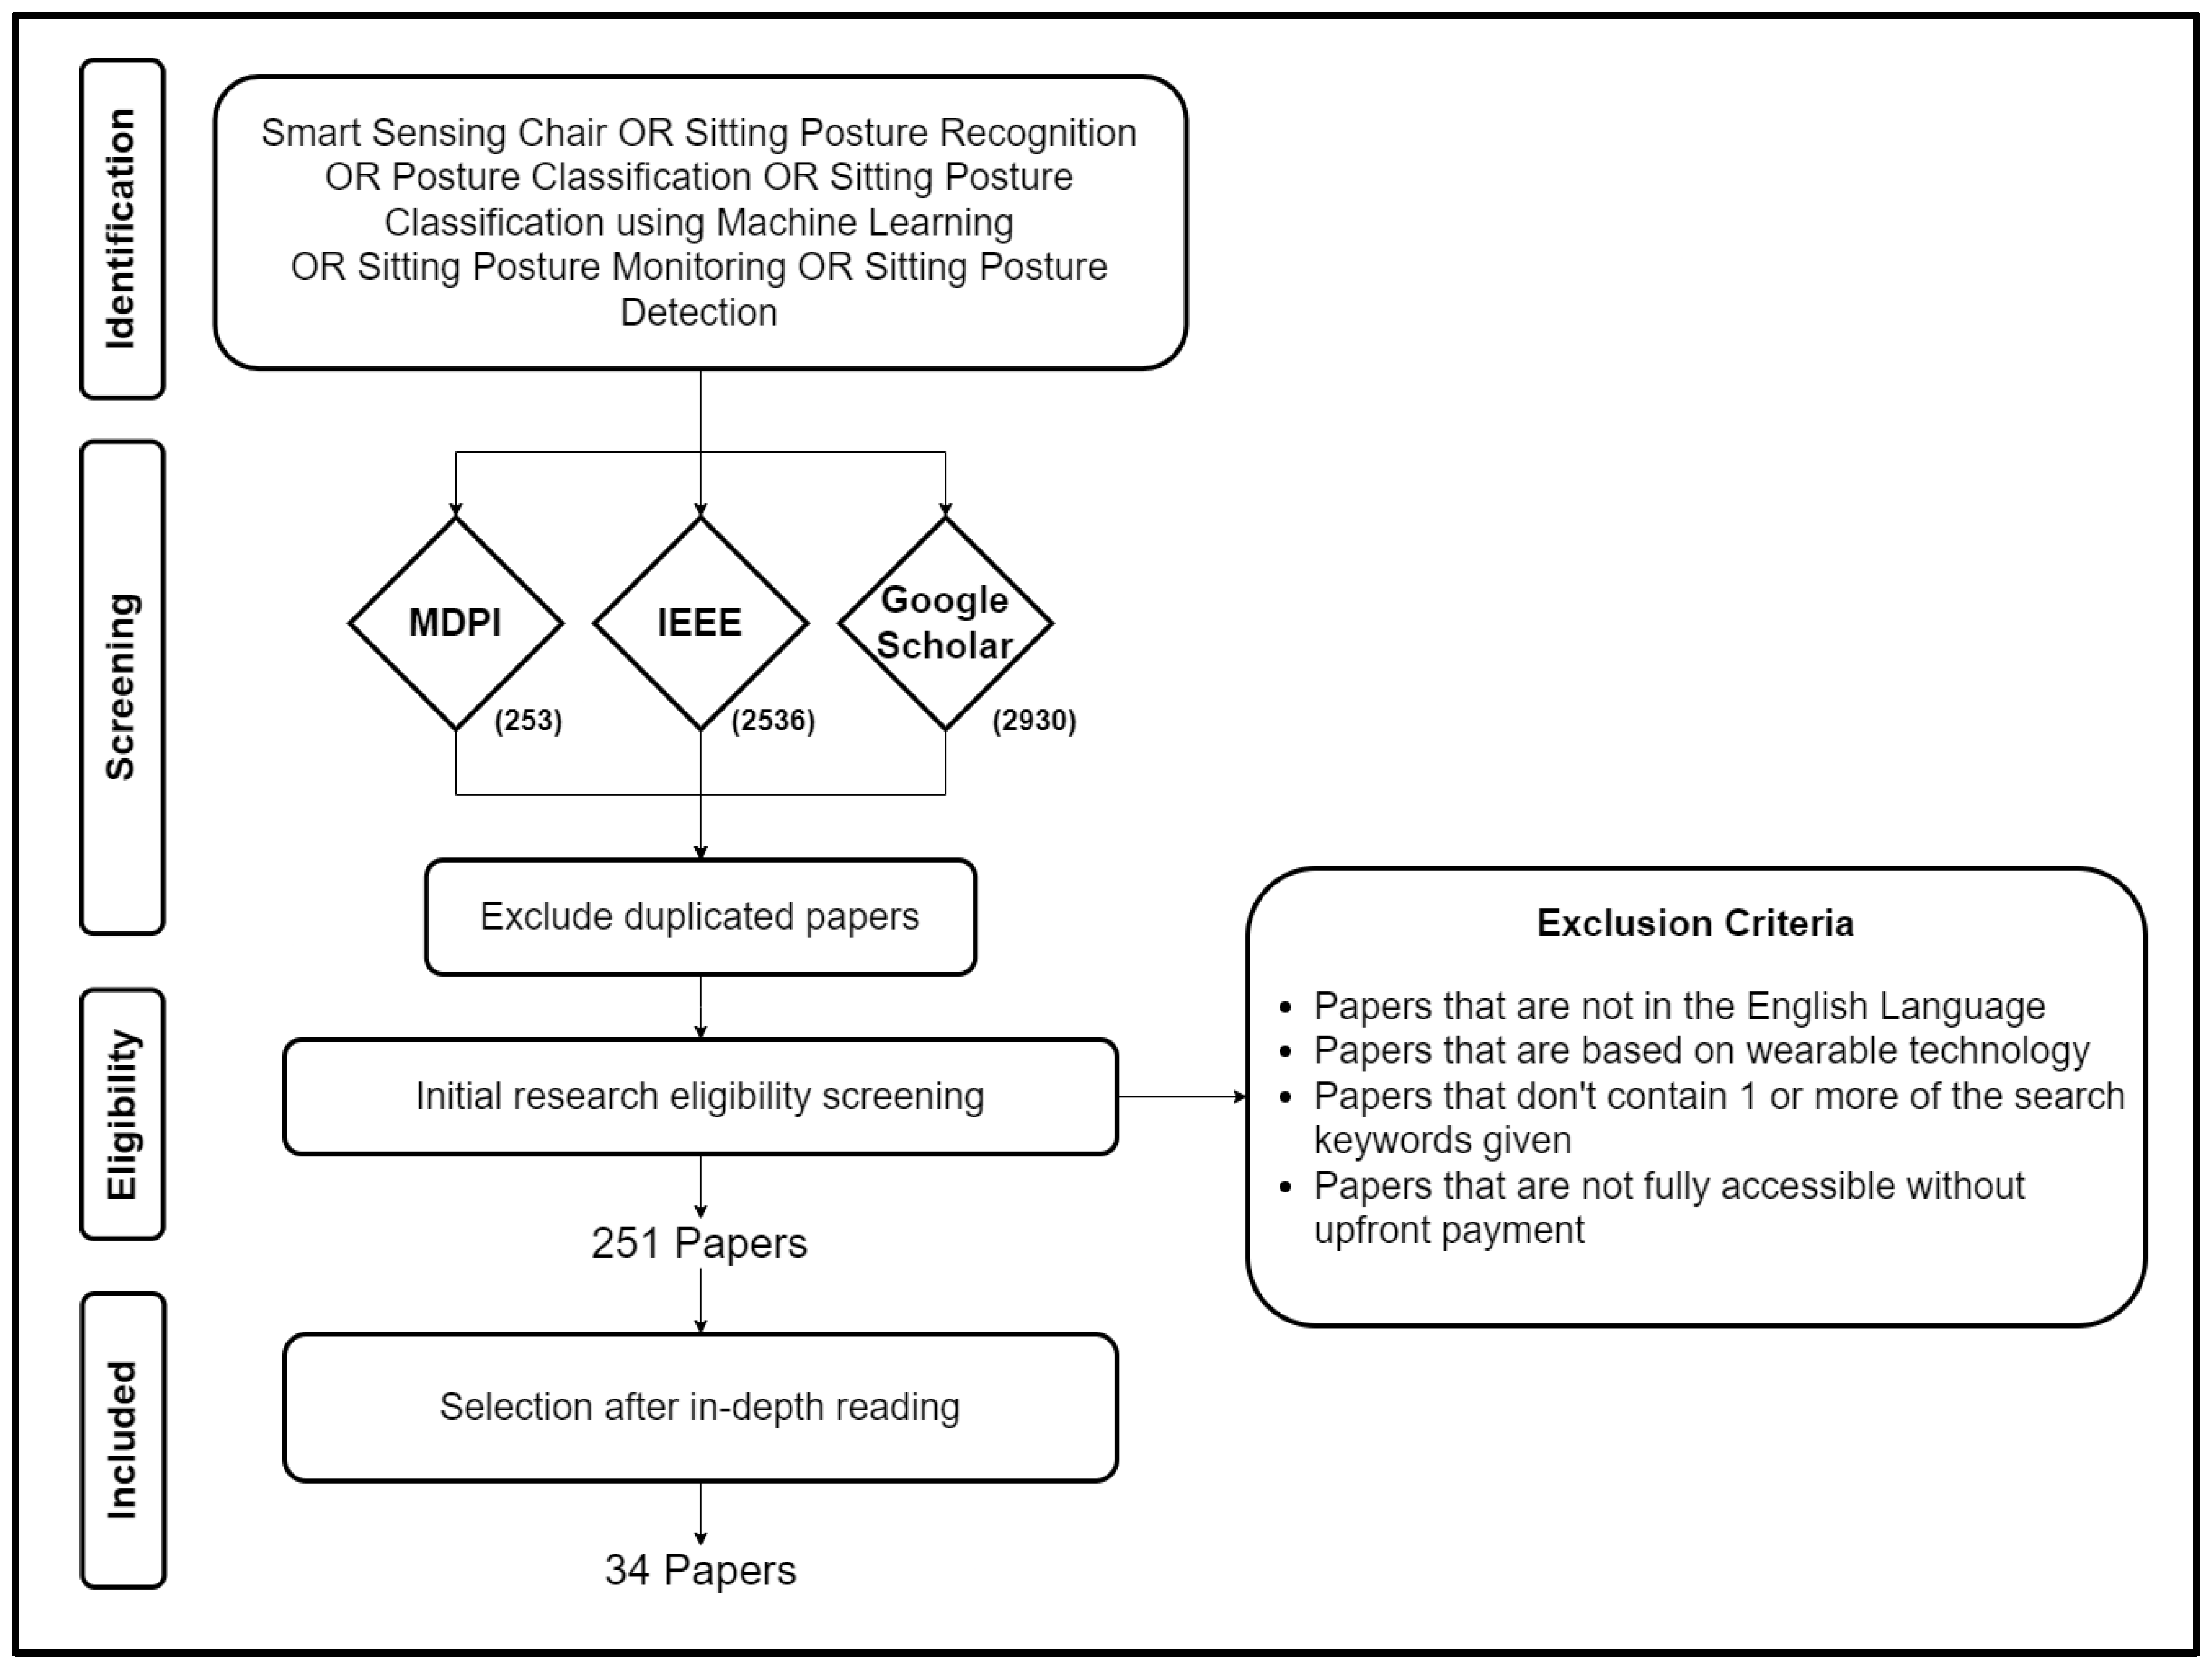
The initial screening was based on the relevance of the titles and abstracts to the research questions. Studies published within the last 20 years were considered, applying exclusion criteria to omit research using invasive methods for posture classification. The selection process, illustrated in
Figure 1, resulted in a total of 34 pertinent papers.
2.4. Data Extraction
The data extraction phase is primarily focused on extracting the relevant information from the research papers gathered. This was achieved by reading through each paper with the aim of gathering useful data, especially on the methods and techniques being employed in the development of a smart sensing chair system. Listed below are the following information that was captured while going through each research paper: Authors, Published Year, Sensors Used, Sensor Placement, Number of Postures Classified and Recognized, Postures Classification Method, Classification Accuracy, Limitations, User Feedback System, Realtime, and Method Used.
3. Sitting Posture Selection
The concept of an “ideal” sitting posture is inherently subjective, reflecting significant variation across diverse groups. Particularly for individuals with permanent mobility impairments or those who use wheelchairs, the parameters defining a comfortable sitting posture are distinctly unique. While the conventional wisdom among healthcare professionals’ advocates for an upright lordotic spinal position, the inherent variability in spinal anatomy across individuals challenges the notion of a one-size-fits-all “correct” posture [
23]. Biomechanical research has shed light on the consequences of various sitting positions on spinal alignment and muscle engagement, emphasizing the musculoskeletal stress induced by inadequate postures [
24,
25,
26]. These investigations reveal that extended periods of sitting, especially in a slumped position, intensify the symptoms of musculoskeletal disorders and are a contributing factor to lower back pain. Moreover, recommendations consistently suggest minimizing prolonged sitting durations, regardless of whether the posture is upright or slouched, to mitigate potential health risks. Korakakis et al. [
24] underscored the absence of conclusive medical evidence associating any particular sitting posture with enhanced health benefits, further complicating the pursuit of an optimal sitting strategy.
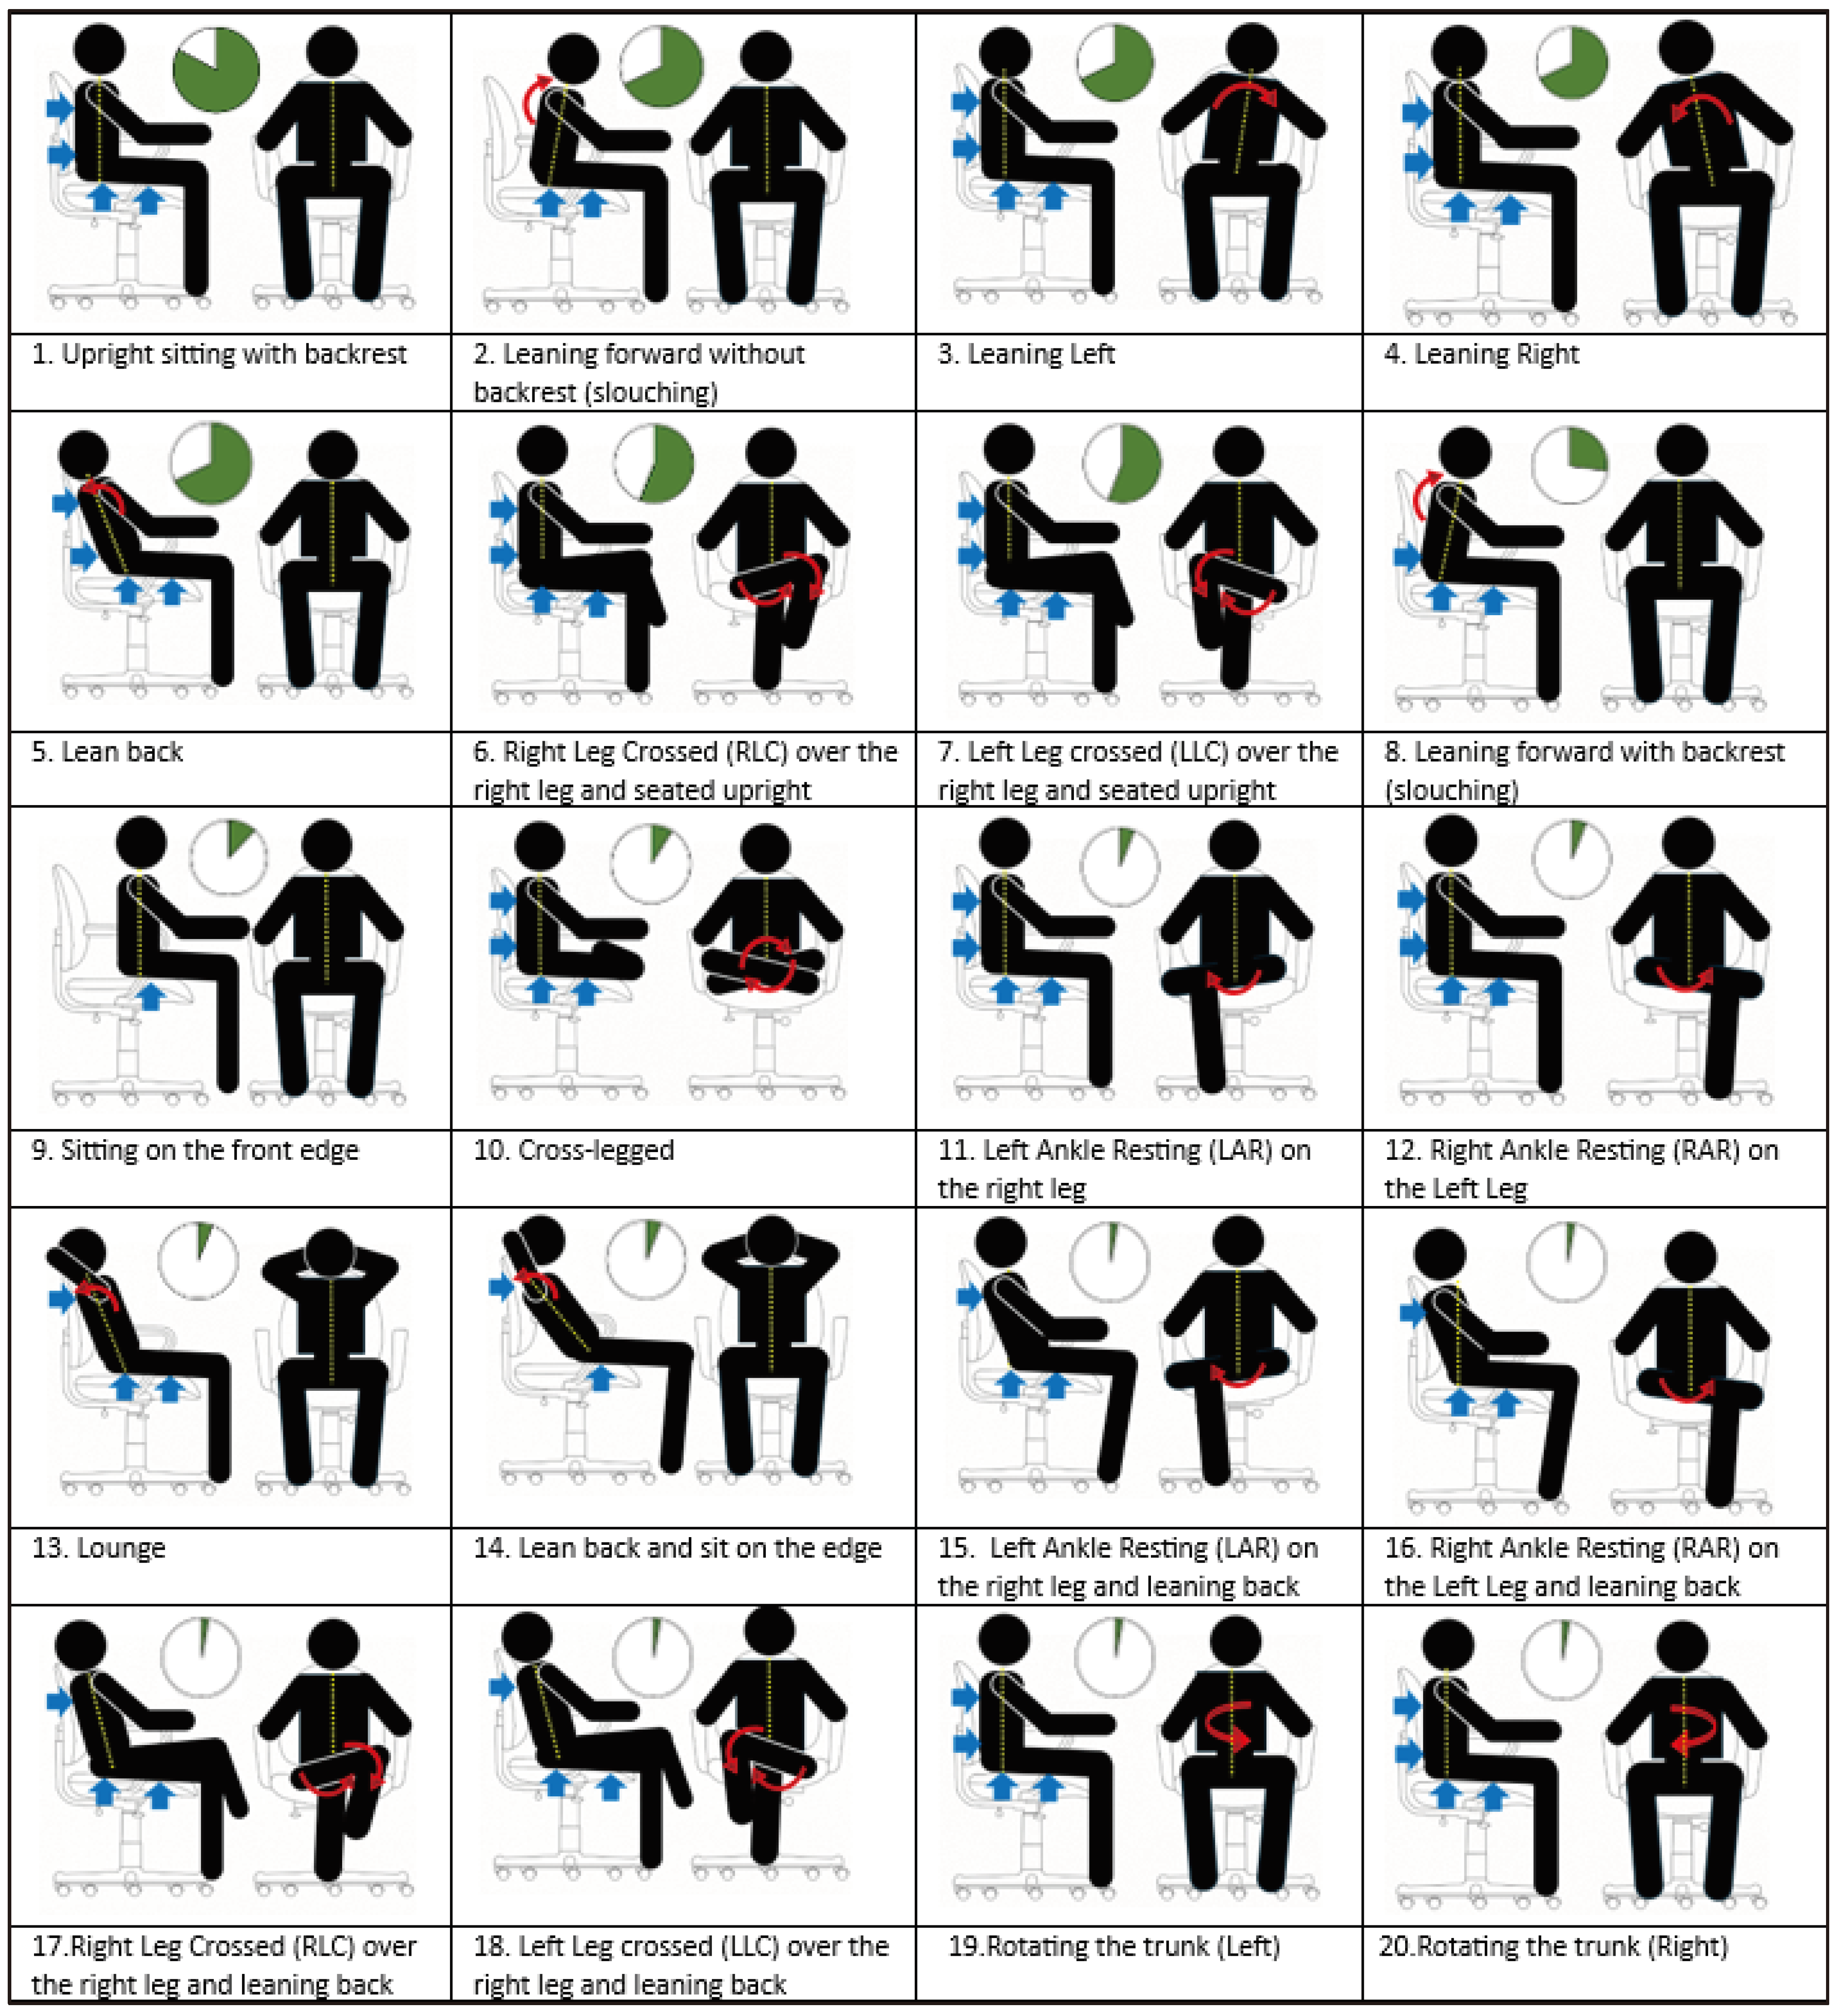
Figure 2 presents 20 sitting postures detected by smart sensing chair systems as reported in the literature, with the relative prevalence of each posture depicted through a pie chart. This pie chart quantifies the percentage of review papers that have investigated each specific posture, ranking these postures from the most to the least frequently detected by such systems. Blue arrows highlight the primary pressure points at the interface between the seat and the occupant, while red arrows delineate the direction of adjustments necessary for adopting each specific posture. The most popular sitting postures detected by the smart sensing chairs include: 1. Upright sitting with backrest, 2. Leaning forward without backrest (slouching), 3. Leaning left, 4. Leaning right, and 5. Leaning back, reported by the majority of studies.
4. Technologies Used in Smart Sensing Chairs
4.1. Sensor Technologies
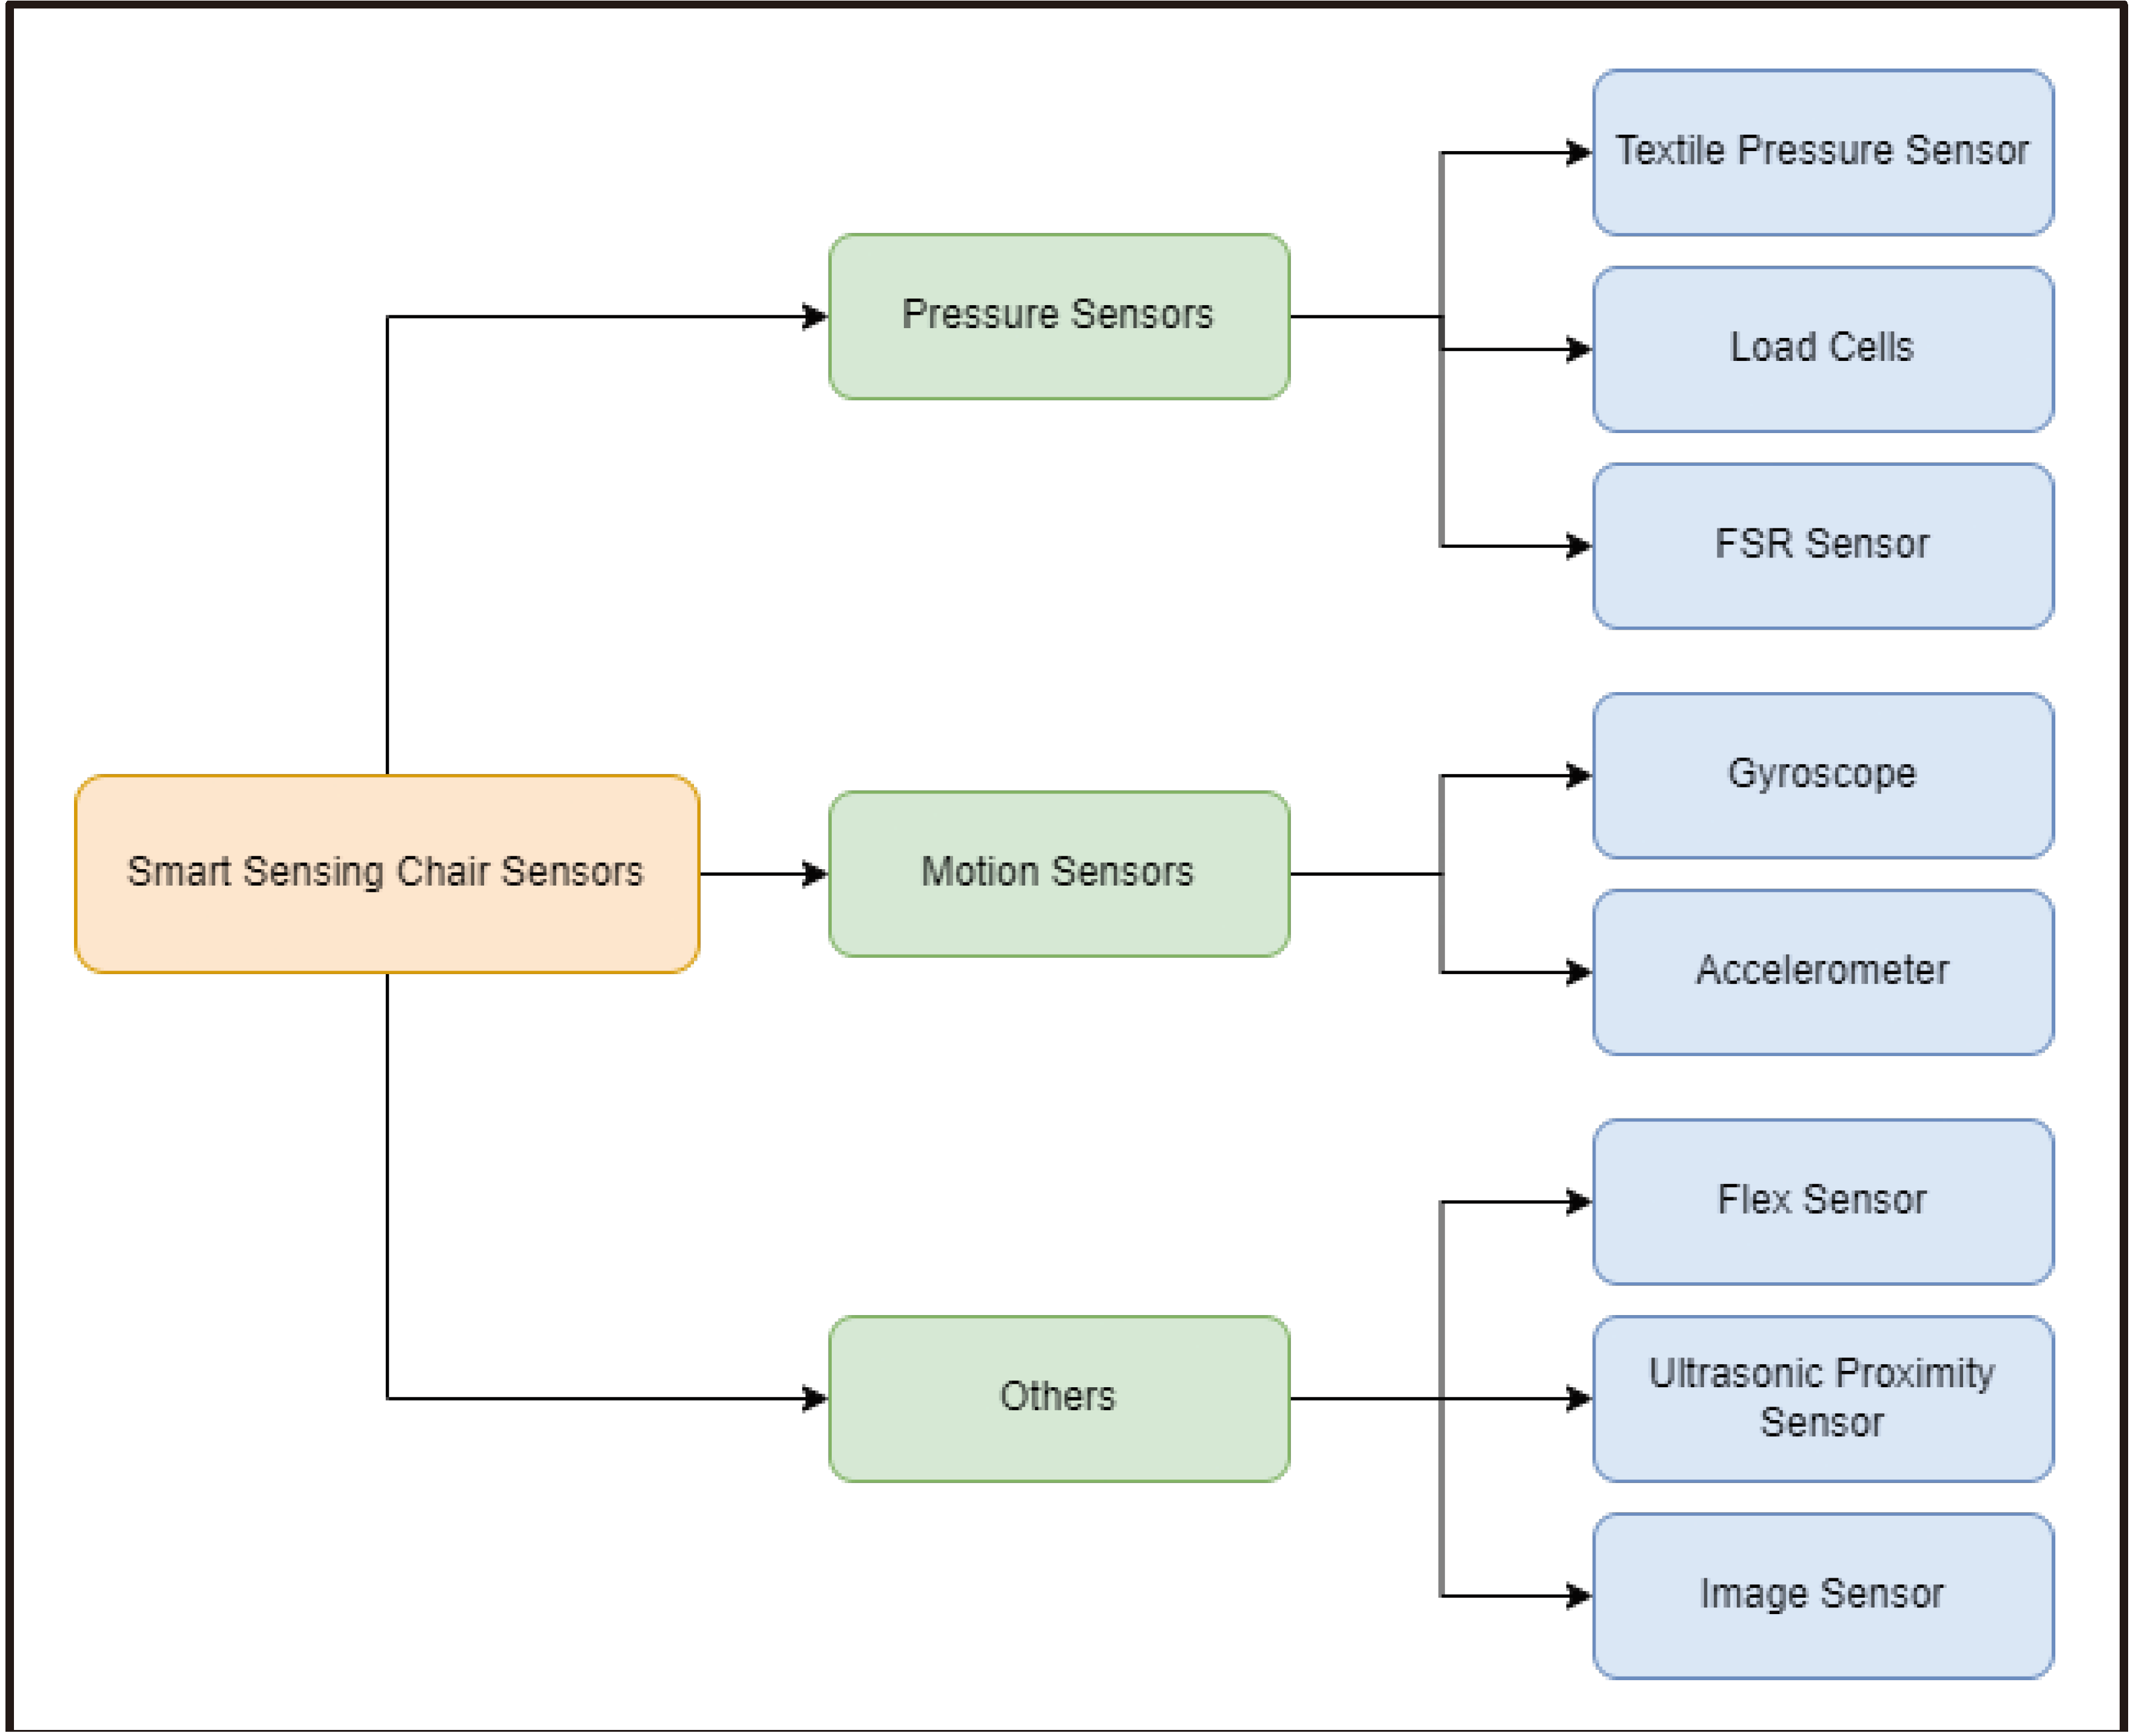
Currently, there are several types of sensors being used in the development of smart sensing chairs ranging from pressure sensors to image-based sensors. This section aims to review the variety of sensor technologies being integrated into smart sensing chairs system; each offering its unique benefits and challenges in the classification of sitting postures.
Figure 3 below visualises the category of sensors being used by researchers in the classification of sitting postures.
4.1.1. Force Sensing/Sensitive Sensor (FSR)
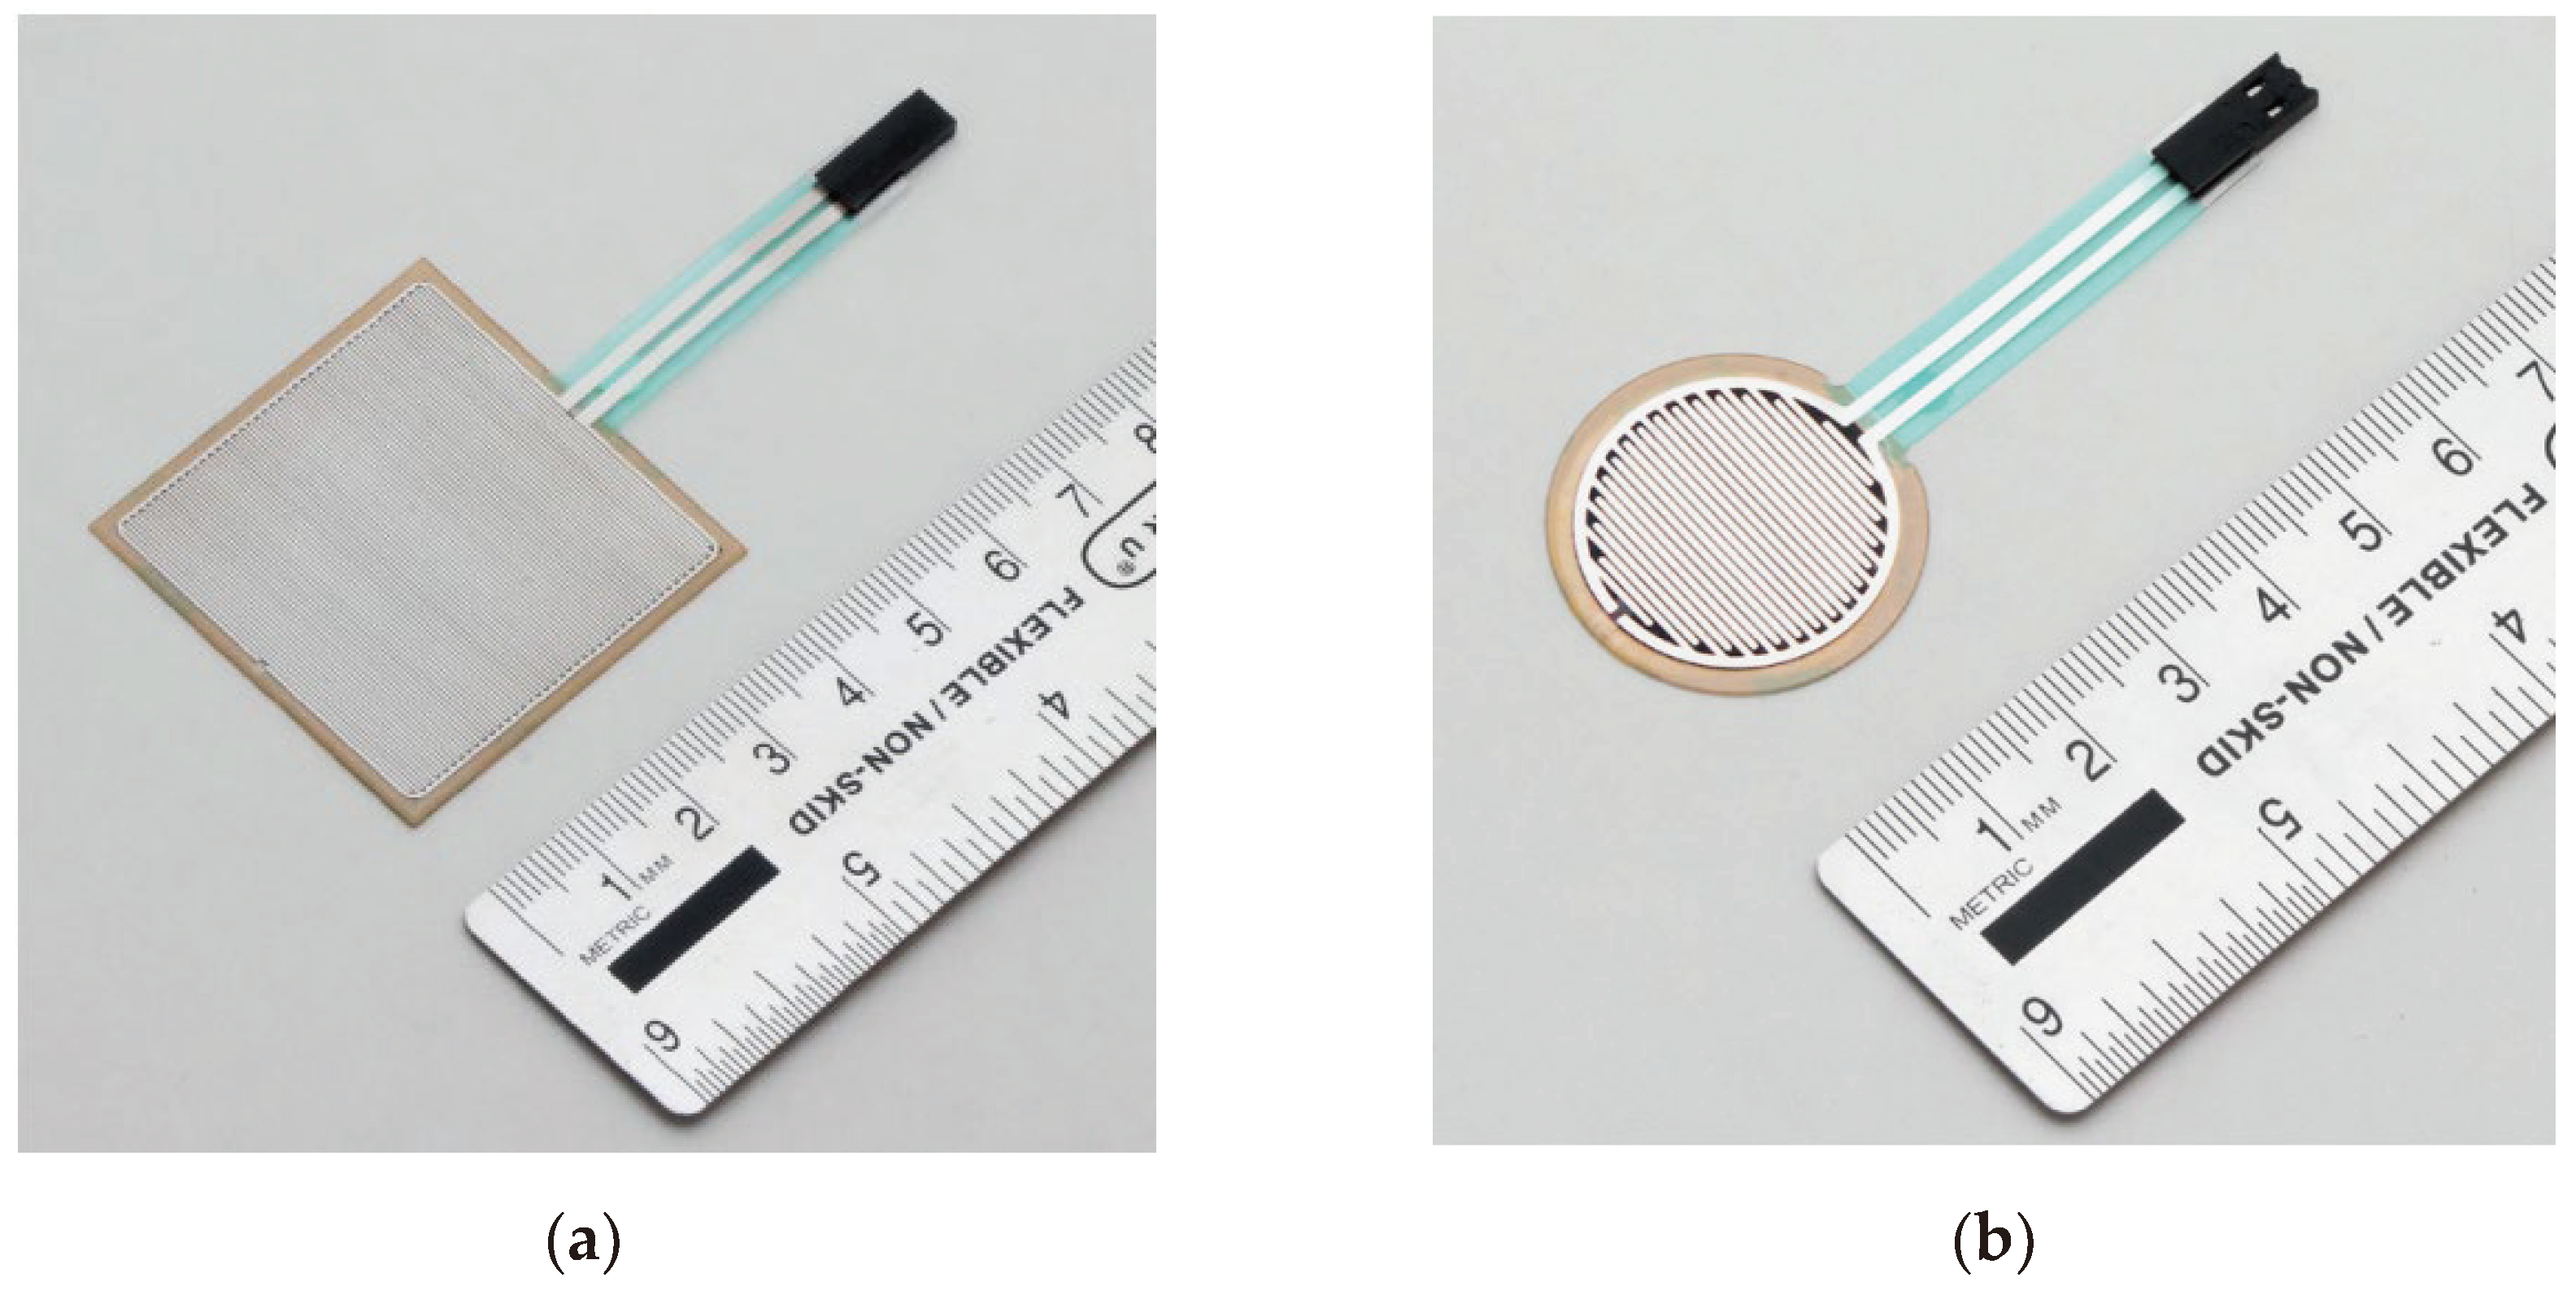
Force Sensing Resistors, also known as force sensors, are commonly used to measure the forces and physical pressure applied to its surface area. These sensors work by varying their output resistance in response to the pressure exerted on them. A FSR sensor, shown in
Figure 4, is typically composed of a conductive polymer-based material that is integrated between 2 metal electrodes [
25]. This conductive material changes in resistivity as more direct pressure are applied on the sensor’s z-axis. FSR sensors are also known to be very cost-effective and have been utilized in various fields ranging from robotics to medical applications [
26]. However, the main limitation seen with these sensors is that it can be susceptible to drift errors which can negatively affect the accuracy of its readings. Different methods such as periodical sensor calibration and other advanced force computing techniques are able to mitigate this issue [
27]. Listed in
Table 3 are some of the commercially available FSR sensors as well as some of its technical specifications.
4.1.2. Textile Pressure Sensor
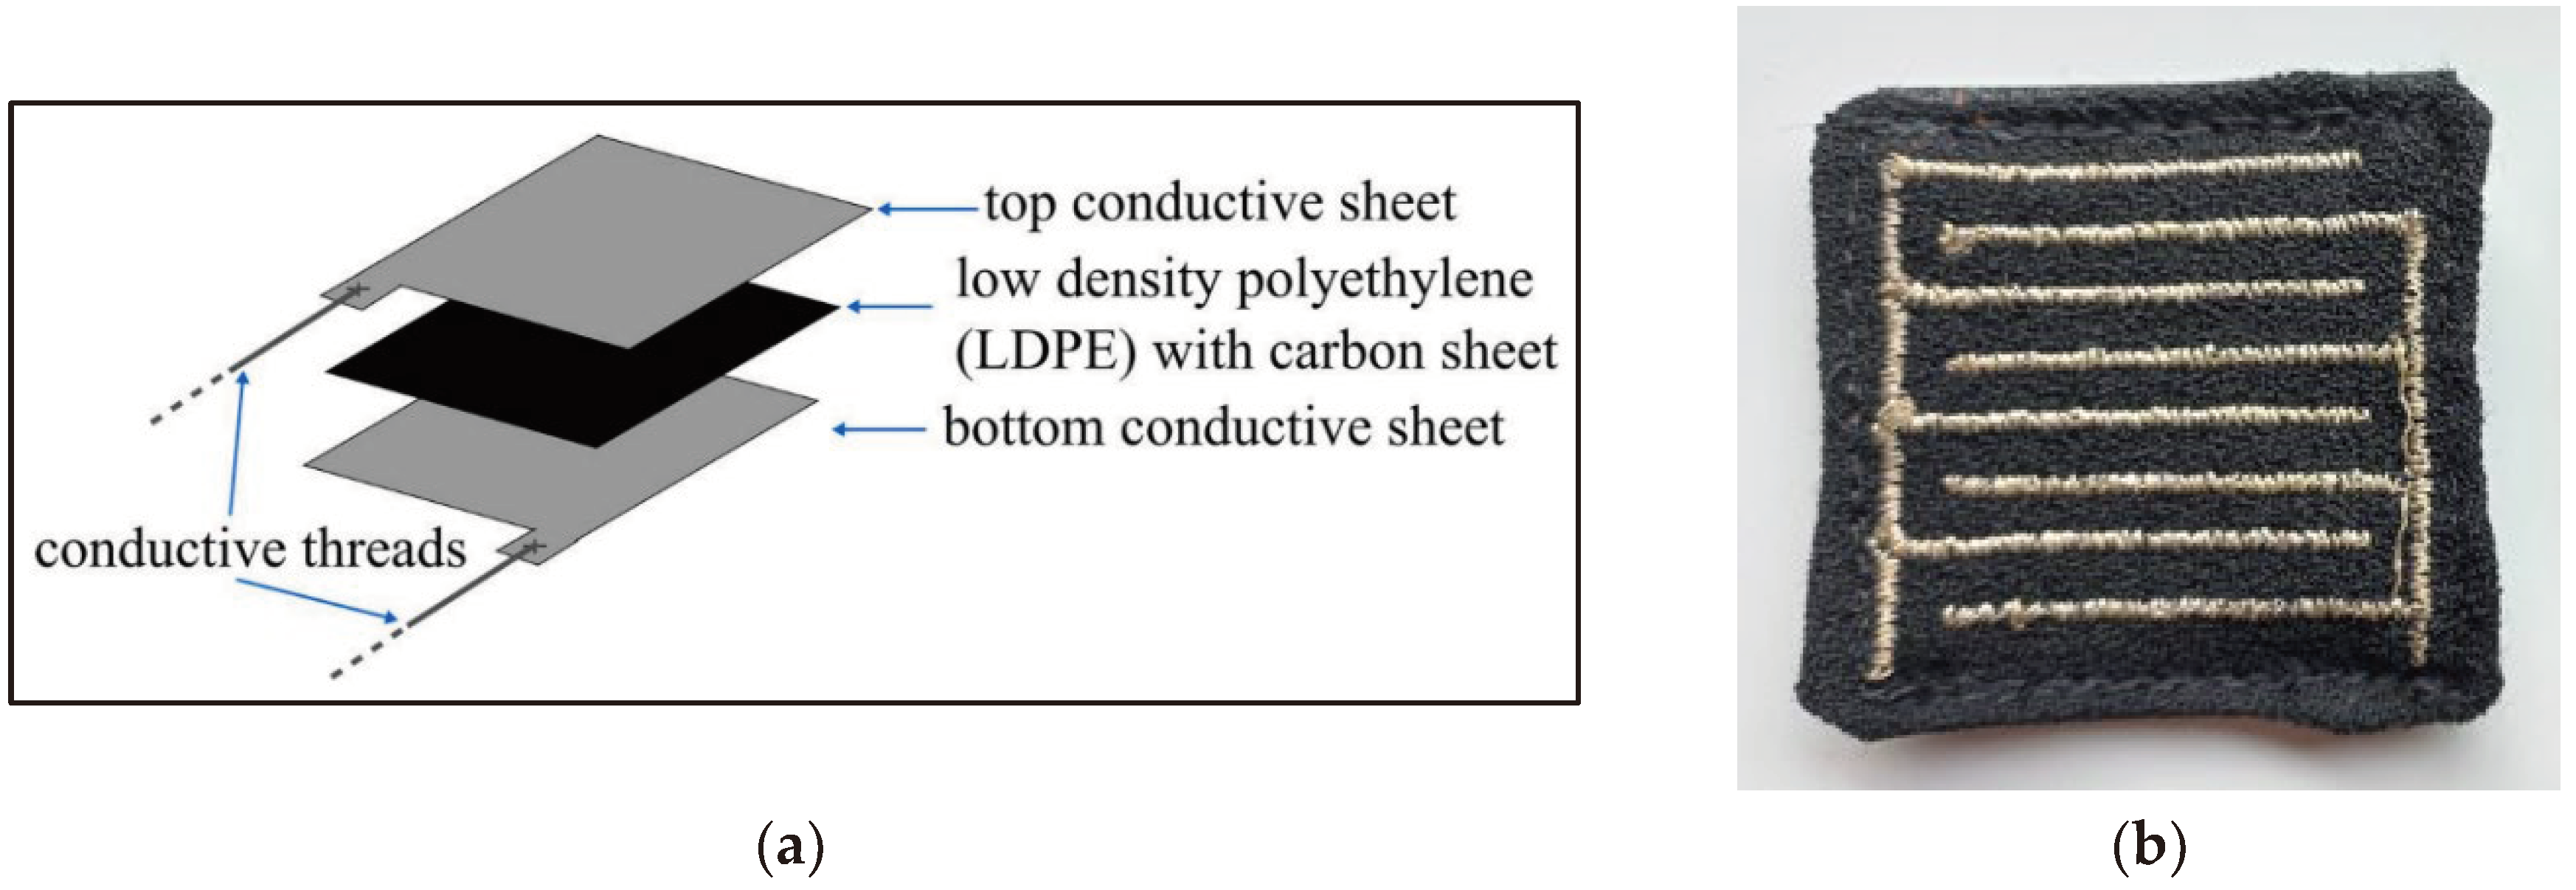
A textile-based pressure sensor is generally composed of a soft fabric-based material which consists of a conductive thread pattern placed over a dielectric material that serves as a substrate between the threads [
31].
Figure 5a visualises an example of how each layer within the textile pressure sensor is structured within. One of the main advantages seen with textile force sensors is the fact that it can very durable, and it seamlessly integrates with garments making it unobstructive and comfortable to the end user. Hence, the reason this sensor tends to be more popular among wearable technologies.
There were a few research studies found that employed textile pressure sensors to classify sitting postures. One of which was Kim et al. [
33] who developed a washable textile pressure sensor and incorporated it into their chair system to classify 7 sitting postures using a decision-tree algorithm. Another study proposed a “eCushion” device which incorporated an “eTextile” pressure sensor array that could detect 7 different sitting postures at 85.9% accuracy [
34]. Additionally, Martínez-Estrada et al. [
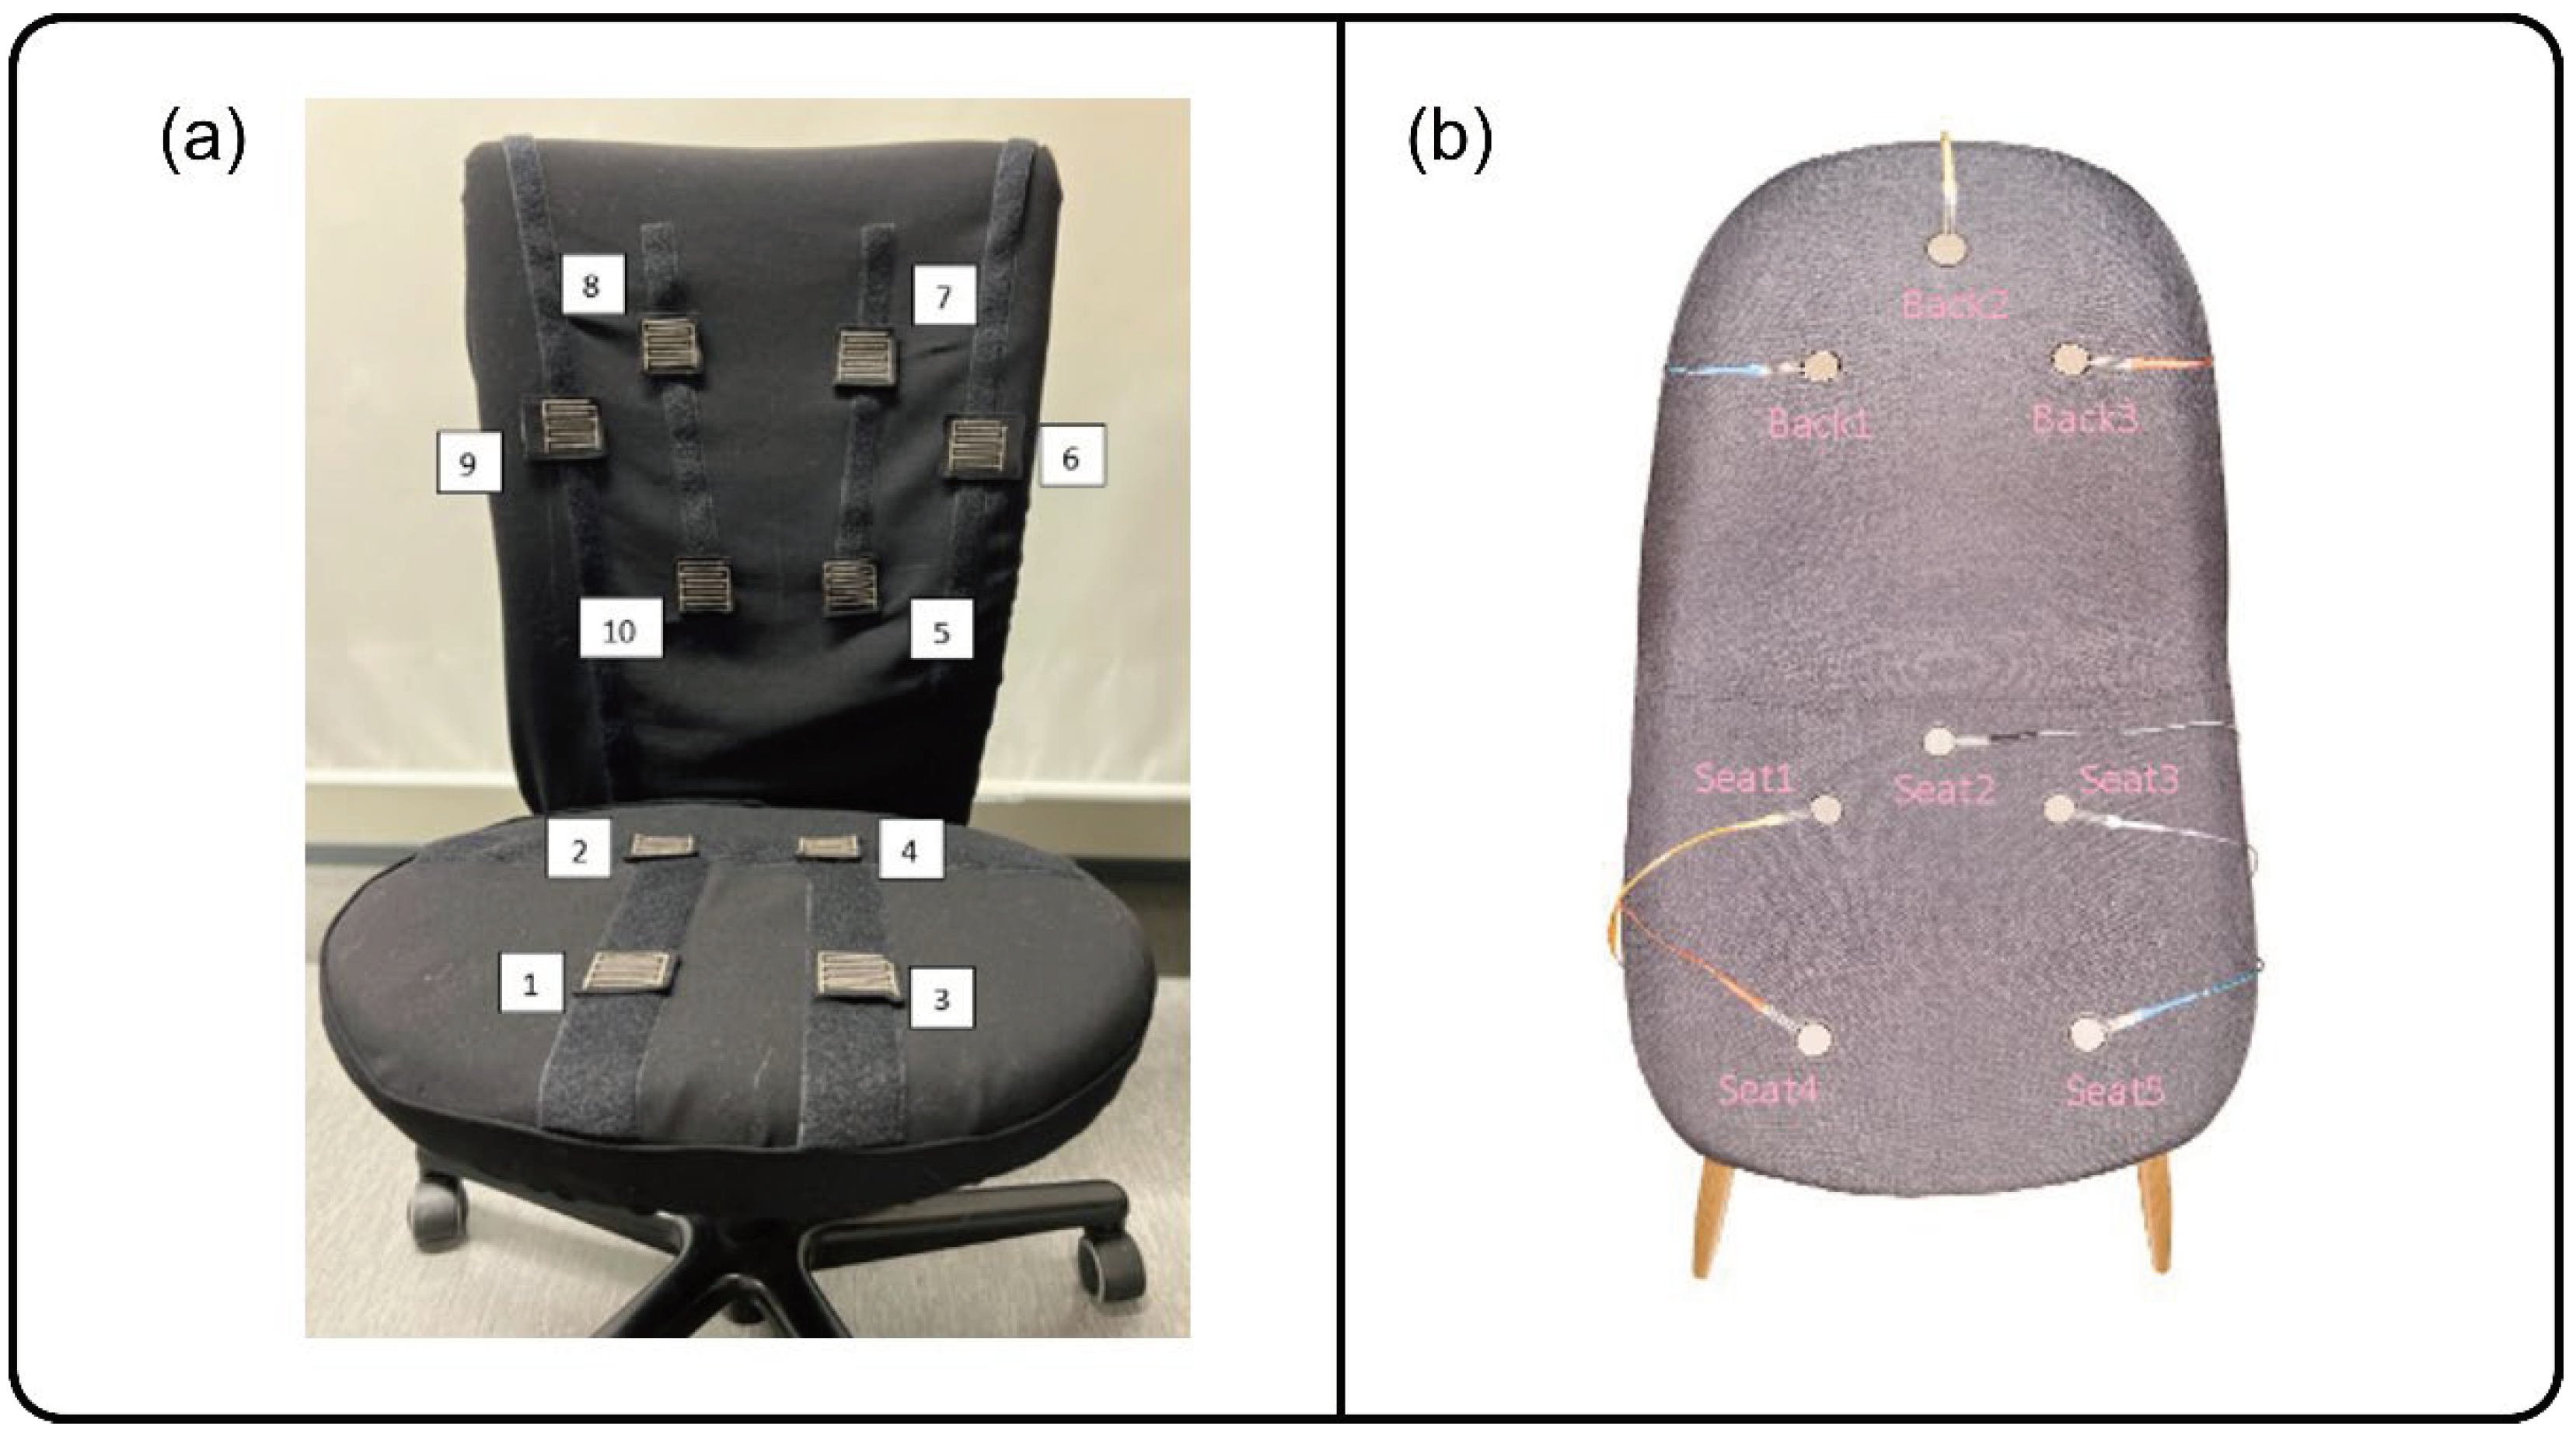
32] developed 10 detachable textile pressure sensor (PreCaTex) (shown in
Figure 5b) which were placed at strategic points around the chair.
4.1.3. Load Cells
Load cells are another variation of force sensor which is used among researchers in the monitoring of sitting postures. A load cell sensor works by converting applied mechanical forces into measurable digital signals which can be read by microcontrollers. There are different types of load cells being used such as strain gauge, piezoelectric, hydraulic, and capacitive load cells [
35]. Some of the commercially available load cell sensors can be found in
Table 4 below.
The use of load cells is not a popular option among research studies, so far there were only 2 research studies that implemented load cells in their smart sitting systems. Roh et al. in 2018 [
36] developed a smart chair by integrating 4 load cell sensors within the chair sitting cushion to classify 6 sitting postures. An accuracy of 97.94% was achieved using a SVM (RBF kernel) ML model. Similarly, Pereira and Plácido da Silva in 2023 [
37] distributed 3 load cells across the seat’s cushion in order to classify 8 sitting postures; overall they were able to a classification accuracy of 98.50%.
4.1.4. Flex Sensors
A flex sensor, also known as a bend sensor, works by measuring the degree of displacement resulting from the bending action being applied to the sensor. Currently, it is being used in various applications from robotics to medical devices. There are multiple types of flex sensors in the market, however it is the conductive ink-based flex sensors that are widely popular among robotics projects. These flex sensors are typically composed of a flexible composite material that has a conductive ink material which changes in resistance as the sensor is being bent [
38].
Table 5 shows two commercially available flex sensors along with their technical specifications.
Overall, there were only 2 studies identified that utilized this method for sitting posture detection. The first study was by Hu et al. [
41] who developed a smart sensing chair using 6 flex sensors and a 2-layer Artificial neural network (ANN) for detecting 7 sitting postures and achieved an accuracy of 97.43%. The second study was by AbuTerkia et al. [
42] which developed a similar smart-seating system without the use of an ML model that could detected up to 7 different sitting postures.
4.1.5. Image-Based Sensors
Image-based sensor such as cameras and 3D image sensors are another type of technology being used by some studies. These sensors often integrate with computer vision algorithms. These algorithms operate by identifying visual elements from images and videos. In the classification of sitting postures, there is a digital camera actively positioned directly at the subjects. Subsequently, with the use of image processing libraries such as OpenPose or OpenCV, researchers were able analyse each video frame to determine the sitting postures of test subject in view.
This method is not a very popular option among the research studies found. Mallare et al. in 2017 [
43] developed a system utilizing 2 digital cameras, strategically positioned at (front and side) angles in the detection of bad sitting postures. Overall, they were only able to achieve an accuracy of 61.3% using the SVM algorithm. Additionally, Chen et al. in 2019 [
44] further improved on this by using an Astra3D Sensor, a 3D depth sensing camera. With the integration of the OpenPose library along with CNN for the posture classification, they were able to achieve an overall accuracy of 90%.
4.2. Pressure Sensors Placement Strategy
Across the research studies found, it was seen that are two main approaches being employed in the placement of pressure sensors among smart sensing chairs systems which is the dense sensor configuration and the sparse sensor configuration as describe by Ma et al. [
45]. A dense sensor configuration involves the use of a flexible sensor array mat containing multiple pressure sensors units interconnected together. Meanwhile, the sparse sensor configuration goes on the concept of having several individual pressure sensors placed at strategic point around the chair.
4.2.1. Dense Sensor Configuration
Xu et al, [
34] used a textile pressure sensor array along with a dynamic time wrapping based algorithm to classify 7 sitting postures with 85.90 accuracy. Huang et al. [
46] used a 52x44 Piezo-Resistive Sensor Array which was placed on the bottom seating. Using the ANN classifier, they were able to achieve a classification accuracy of 92.2%. Kim et al., 2018 [
33] developed a washable fabric-based sensor array. Even after one thousand independent washes, the capacitance reading from textile sensors array had not deteriorated. Kim et al. [
47] achieved a 95.30% accuracy using 8 x 8 pressure array and a CNN classifier to classify 5 sitting postures among children. Similarly, Cai et al. [
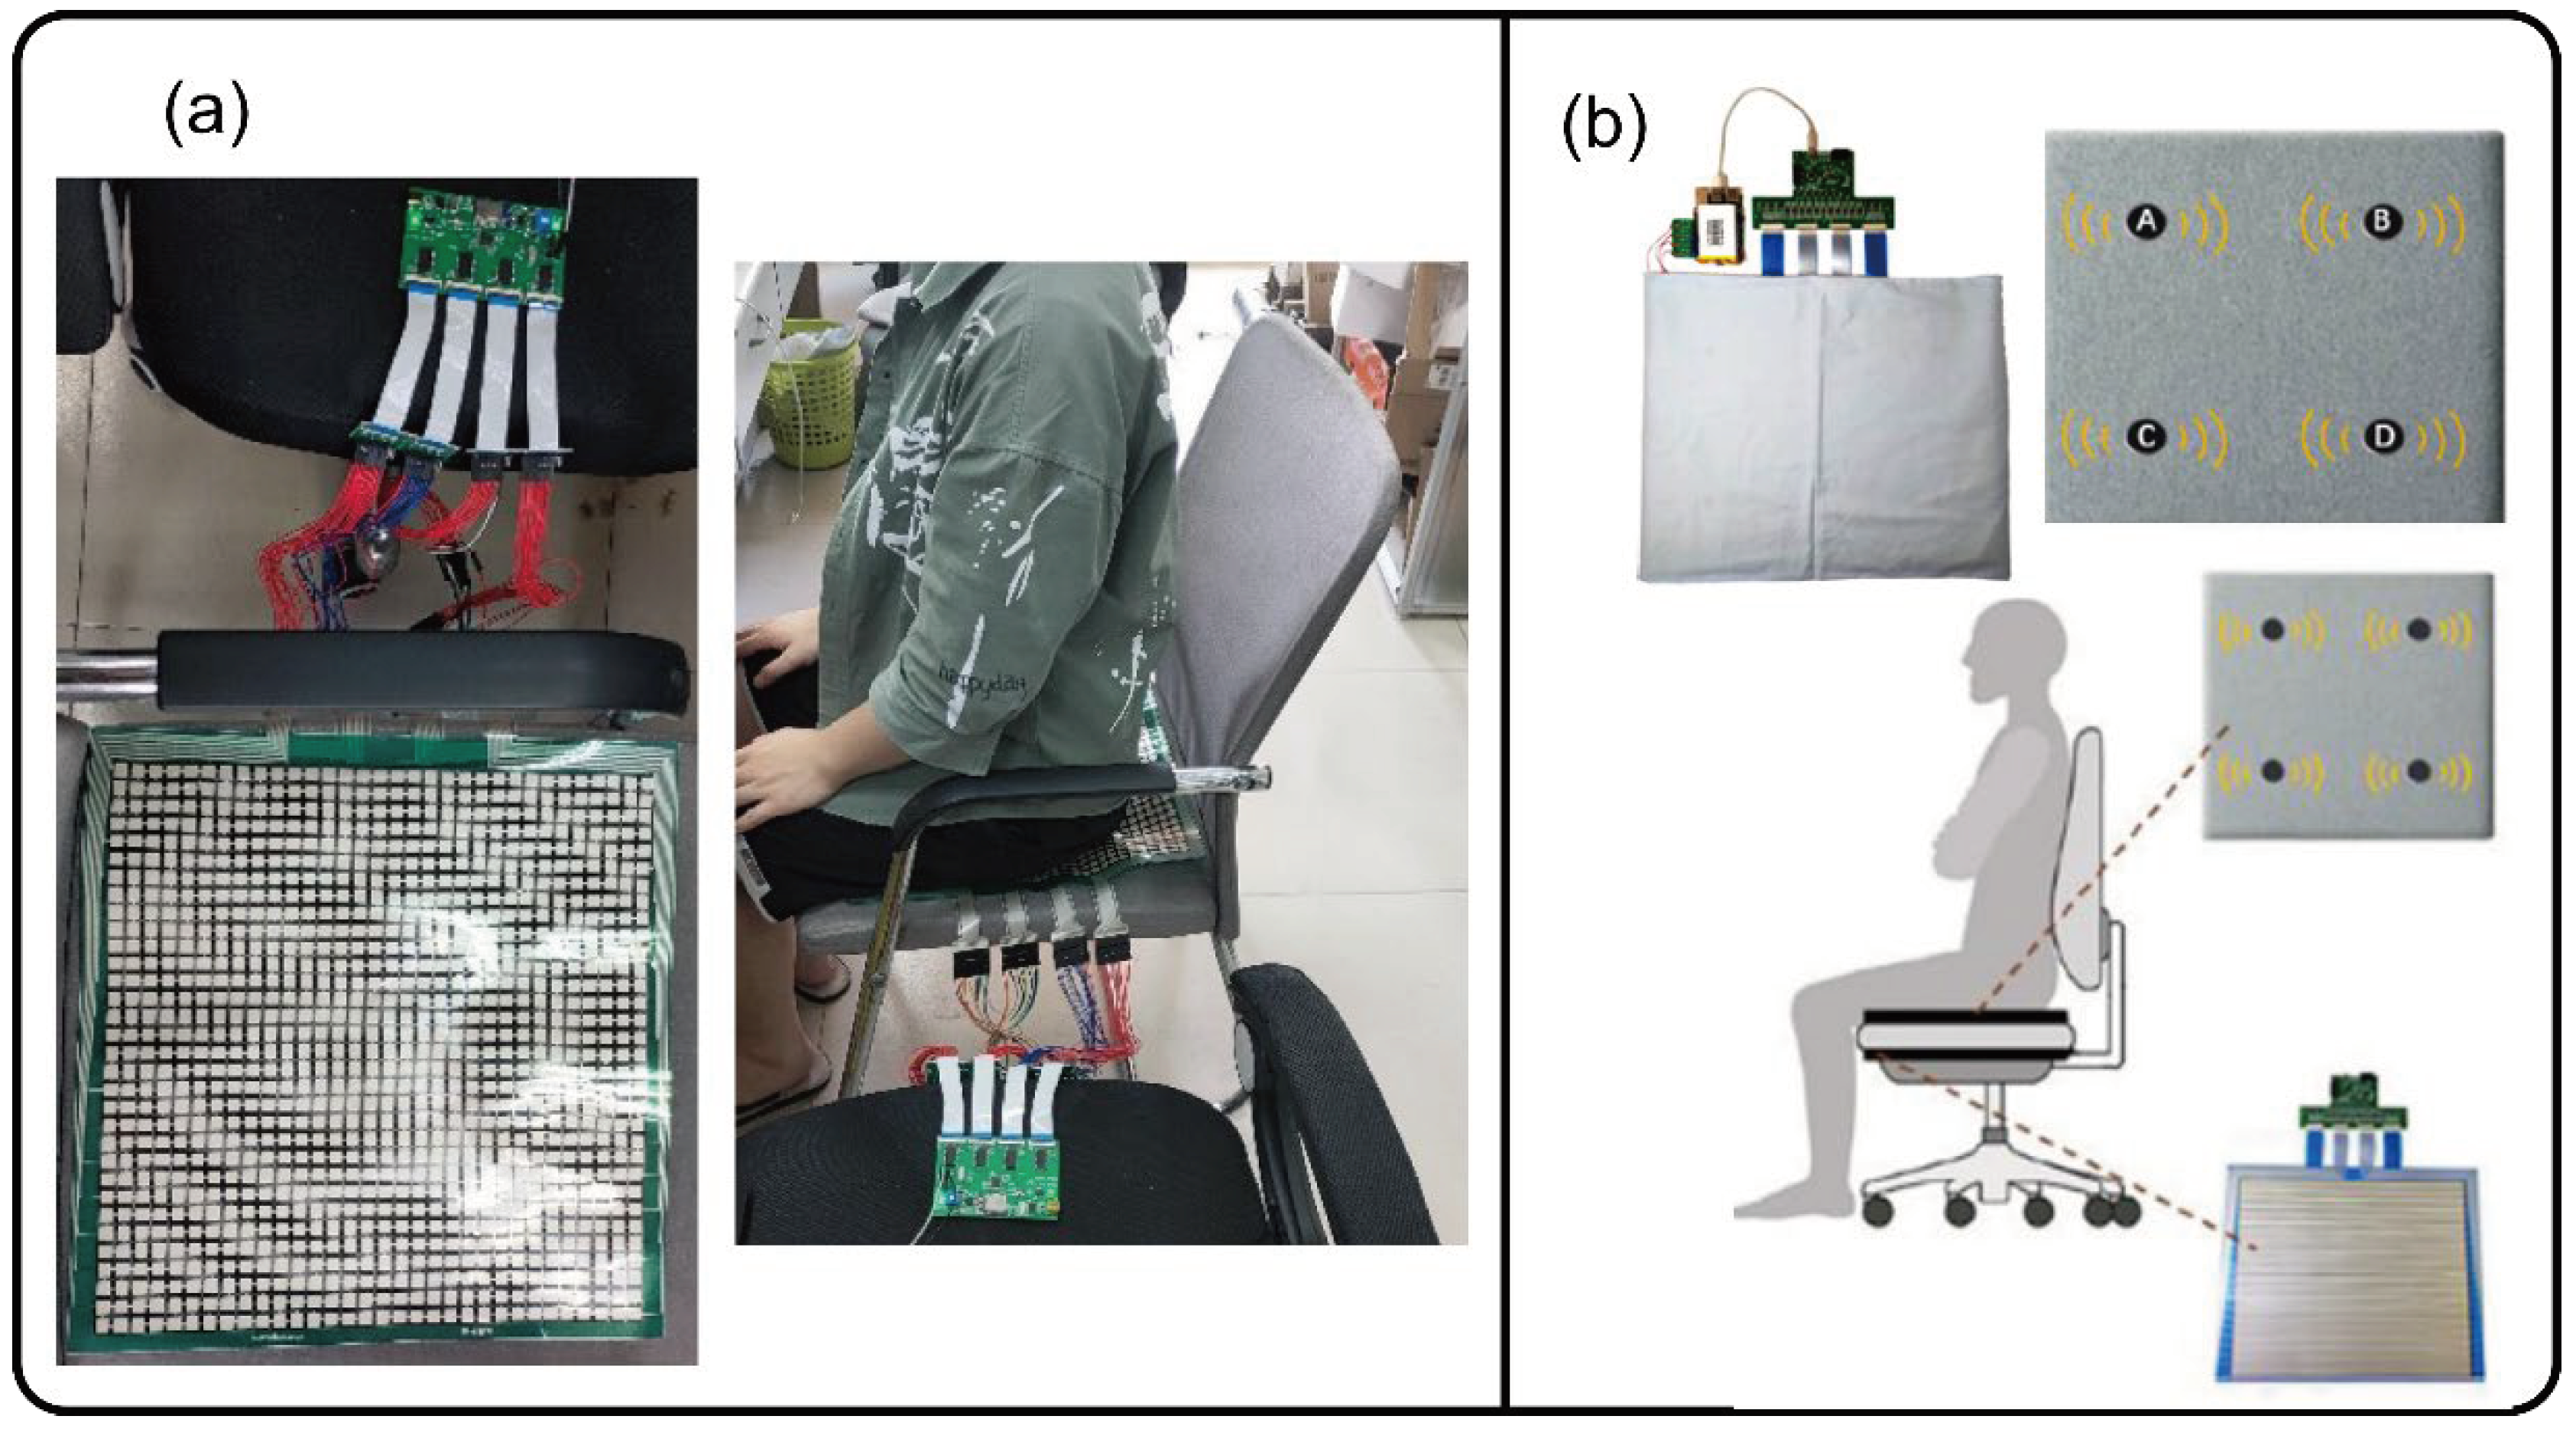
48] utilized a flexible pressure sensor array (400mm x 400mm) placed on the bottom seat cushion to recognize 6 different sitting postures as shown in
Figure 6a. Ran et al. [
49] installed a 11 × 13 Pressure Sensor Array (IMM00014, I-MOTION) which communicated with a Raspberry PI computer which achieve a 96.22% classification accuracy using a 5-layer ANN classifier seen in
Figure 6b. Ahmad et al. [
50] embedded a 16 screen pressure sensor array, also using a Raspberry Pi computer for sitting classification which obtained an high accuracy of 99.03% using LightGBM machine learning algorithm. Wang et al. [
51] developed 2 sets of interconnected sensor sheets which covered both backrest and the seating cushion of the smart sensing chair. Using the SNN classifier, their proposed system could distinguish 15 different sitting postures with an accuracy of 88.52%, which is among the highest number of postures being classified. Fan et al. [
52] also implemented a similar system that analyses the hip pressure, which subsequently achieved an accuracy of 99.82 using CNN.
Table 6 below provides the list of studies that used sensor arrays.
4.2.2. Sparse Sensor Configuration
This sensor configuration appears to be a more popular option as more studies implemented this setup compared to the dense sensor configuration. Mutlu et al. in 2007 [
53] integrated 19 different FSRs into the seating cushion and used the Simple Logistic Regression ML algorithm to achieve 78% accuracy in classifying 10 different postures. Martínez-Estrada et al. [
32] placed 6 textile sensors on the backrest and an additional 4 sensors on the seating cushion in order to classify 8 sitting postures as show in
Figure 7a. Tsai et al. [
54] used 13 pressure sensors to classify 10 sitting postures and was able to achieve an accuracy of 99.10% using the SVM ML algorithm. Aminosharieh Najafi et al. [
55] applied 8 sensors (4 on the seating cushion and 4 on the back rest) and used EMN algorithm to classify 8 sitting posture and achieved an accuracy of 91.68% seen in
Figure 7b. In addition to this, a Desktop Graphical User Interface (GUI) application was also developed which displayed the sensor reading in real-time. Luna-Perejón et al. [
56] added 6 sensors which was placed on the seating cushion and resulted in an 81.5% classification accuracy using SOM (ISOM-SPR) ML algorithm.
Table 7 below provides the full list of studies using this sensor configuration.
4.3 Machine Learning Models
There are multiple machine learning algorithms across various studies being used to classify different sitting postures. Furthermore, two of the most commonly used ML models were the CNN (Convolutional Neural Networks) [
44,
47,
52,
65,
68] and ANN (Artificial Neural Networks) [
46,
49,
56,
59,
62]. Other algorithms being adopted were KNN (K-Nearest Neighbours) [
37,
59], Decision Tree [
45,
63], SVM (Support Vector Machine) [
36,
54], RF (Random Forest) [
61,
69], SNN (Spiking Neural Network) [
51], SLR (Simple Logistic Regression) [
53], Self-Organizing Map [
48], and Dynamic time Wrapping [
34]. On the other hand, there were 7 studies that didn’t employ the use ML models in the classification of sitting postures [
32,
33,
57,
62,
70,
71]. Instead, most of these studies resulted in the implementation of straightforward threshold-based system.
To perform a concrete validation on an ML model’s performance and accuracy, most studies resort to various methods such as the use of a confusion matrix and performance comparison between different ML models. A confusion matrix is an analytical tool that is used to measure the performance of machine learning algorithms. For binary classification models, there are only 4 possible options within a 2x2 matrix table which is True Positive (TP), True Negative (TN), False Positive (FP), and a False Negative (FN). On the other hand, for multi-class models, the confusion matrix goes beyond a 2x2 matrix, for it becomes a NxN matrix. The N value signifies the number of classes being present [
72].
4.4. Integration with (Internet of Things) IoT
Over recent years, IoT has gained in popularity and has become a game changer within certain industries. It was projected that by the year 2030, there would be over 50 billion devices interconnected through IoT [
45]. Within the context of smart-sensing chair system, Ma et al. [
23] highlighted the effectiveness of integrating IoT-based systems into healthcare sensor systems due to its major advantage of being able to seamlessly monitor user’s health data in real-time. The use of IoT systems for remote health monitoring is believed to not only reduce medical costs but could also aid in the early detection of chronic illnesses. Subsequently, this could potentially accelerate the treatment and improve overall life expectancy of an individual.
There were some studies found that utilized IoT-based technology. Matuska et al. [
57] used an Arduino-based microcontroller which communicated using the Message Queuing Telemetry Transport (MQTT) telemetry protocol in the detection of 9 different sitting postures. The sensor data was sent in real-time to a mobile application which alerted a user if an incorrect posture is being detected by signify ‘green”, “orange”, and “red” for standard sitting, bad sitting, and heavy load on backbone respectively. Similarly Kundaliya et al. [
70] developed a smart sensing chair which used the Blynk 2.0 platform to stream the sensor data to the web. Other studies such as [
64] and [
66] similarly used IoT for bad postures detection as well as providing valuable real-time feedback to the end-user.
4.5. User Feedback System
The integration of a feedback system into a smart sensing chair is an integral component of enhancing the user experience. From the end user’s perspective, individuals should be able to receive real-time alerts whenever an improper sitting posture is being detected. It was seen that most studies focus on the classification aspects and leave out the implementation of a feedback platform. So far only 35% (12) of all the studies incorporated a feedback platform that would encourage the user to maintain a correct posture. The implementation of mobile application was seen as the most used platform for alerting a user whenever an improper sitting posture is being detected [
48,
57,
59,
65,
70]. Another common method was the use of a desktop application which was done by some studies [
44,
51,
54,
64]. Ran et al. [
49] on the other hand, proposed the use of a haptic motor system which was integrated into the seating cushion and would vibrate its motors whenever an incorrect sitting posture is being detected. To even make the system as unintrusive as possible, another study by Ren et al. [
60] looked at using a RGB bulb capable of changing colours whenever an incorrect posture is being detected.
5. Discussion
5.1. Technology
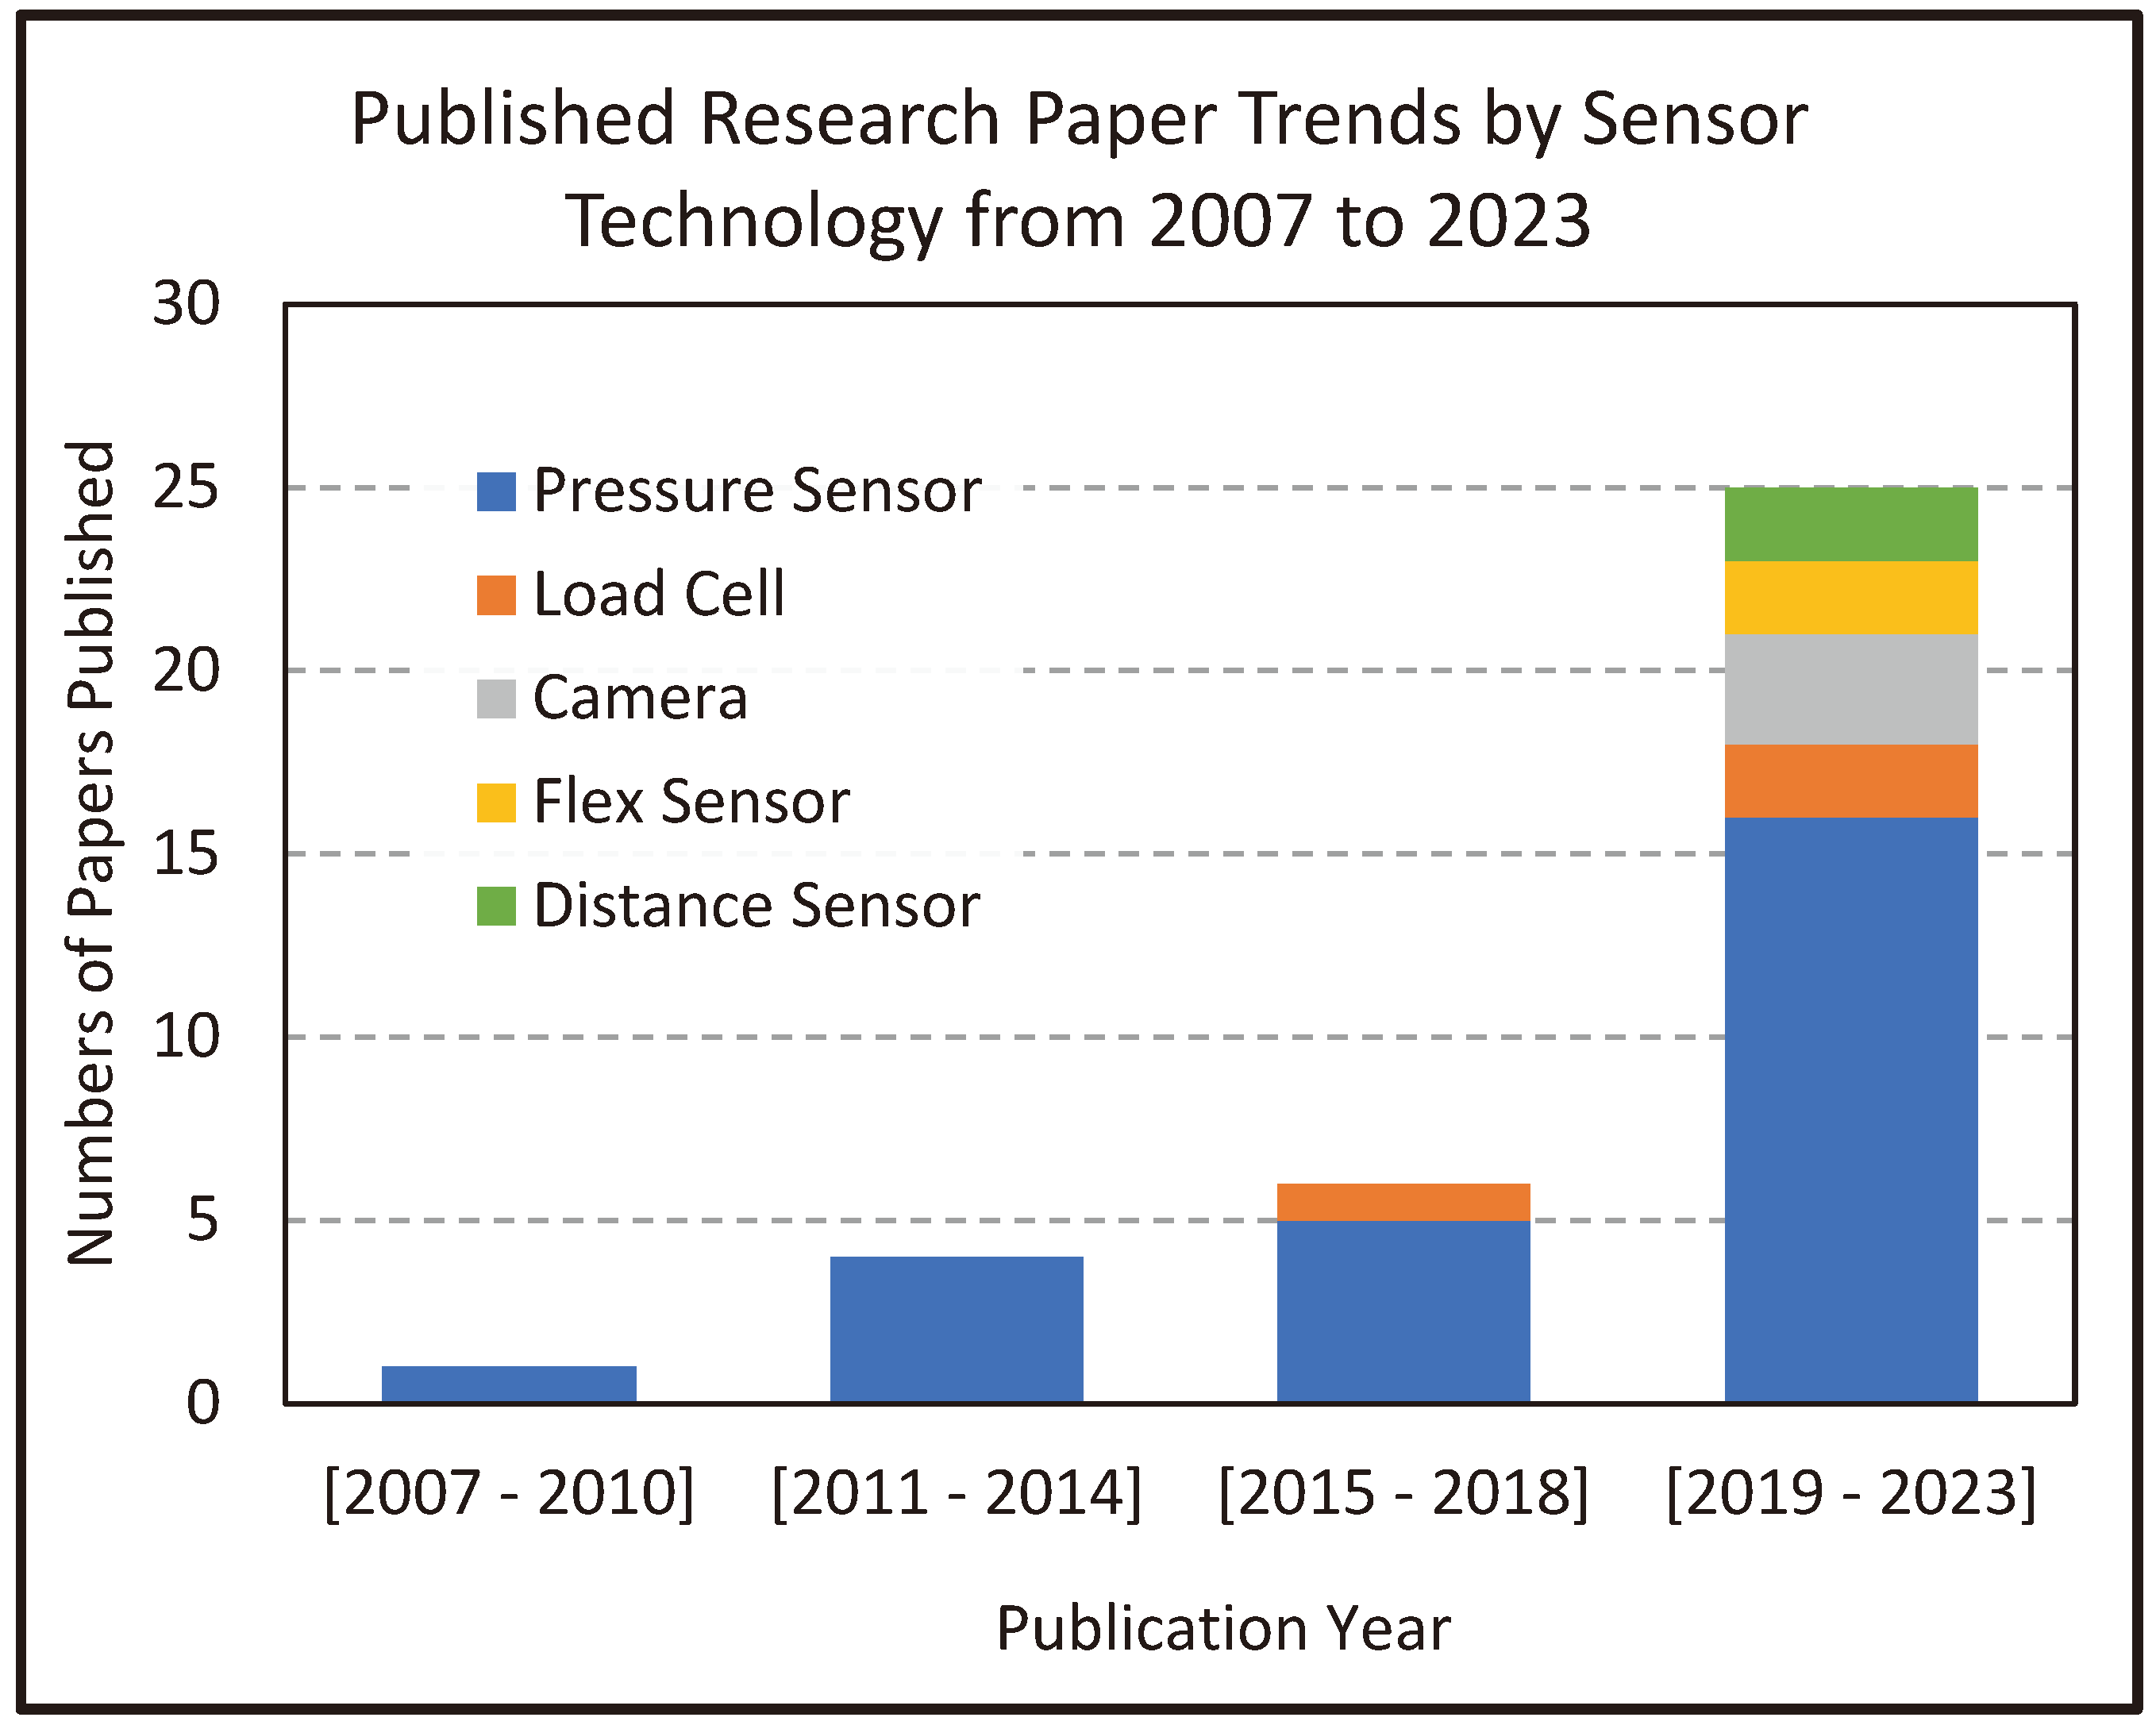
The vast majority of the research studies revealed that the most popular approach to develop a smart sensing chair is to employ the use of pressure sensors.
Figure 8 clearly shows that over the years pressure sensors have always been the preferred option in the classification of sitting posture among researchers; out of which, FSR sensors were the preferred option compared to textile pressure sensors.
In terms of the sensor placement configuration, placing various individual pressure sensors around the chair tends to be preferred method, rather than utilizing dense pressure arrays. So far there was no correlation seen that suggested that one sensor placement strategy produces higher classification accuracy over the other. However, there are other variables that should be considered such as maintenance and costs. Dense sensor arrays are known to be more costly and harder to manage compared to their counterparts [
45]. Reason being in the scenario that one or more of the individual sensing units within the array is faulty, it would be required to replace the entire sensor array further increasing the maintenance costs.
While most studies utilize a singular type of sensor for posture detection, there are a selected few study that involved multiple sensor types into their proposed smart chair system. Jeong and Park [
58] utilized 6 pressure sensors (placed on the seating cushion) along with 6 Infrared Reflective Distance Sensors (placed on the back rest). By using the K-Nearest Network (KNN), they were able to classify eleven different sitting postures while achieving an accuracy of 92%. This study highlighted one of the main limitations seen with other smart sensing systems stating that pressure sensors alone are incapable of measuring the spinal trunk angle which another important factor in maintaining a proper sitting posture. Similarly, Cho et al. [
65], used 16 pressure sensors placed on the sitting cushion along with 2 ultrasonic sensors placed at the neck support region. With this configuration, they were able to achieve 96% accuracy using LBCNet to classify fifteen sitting postures.
5.2. Classification Algorithm
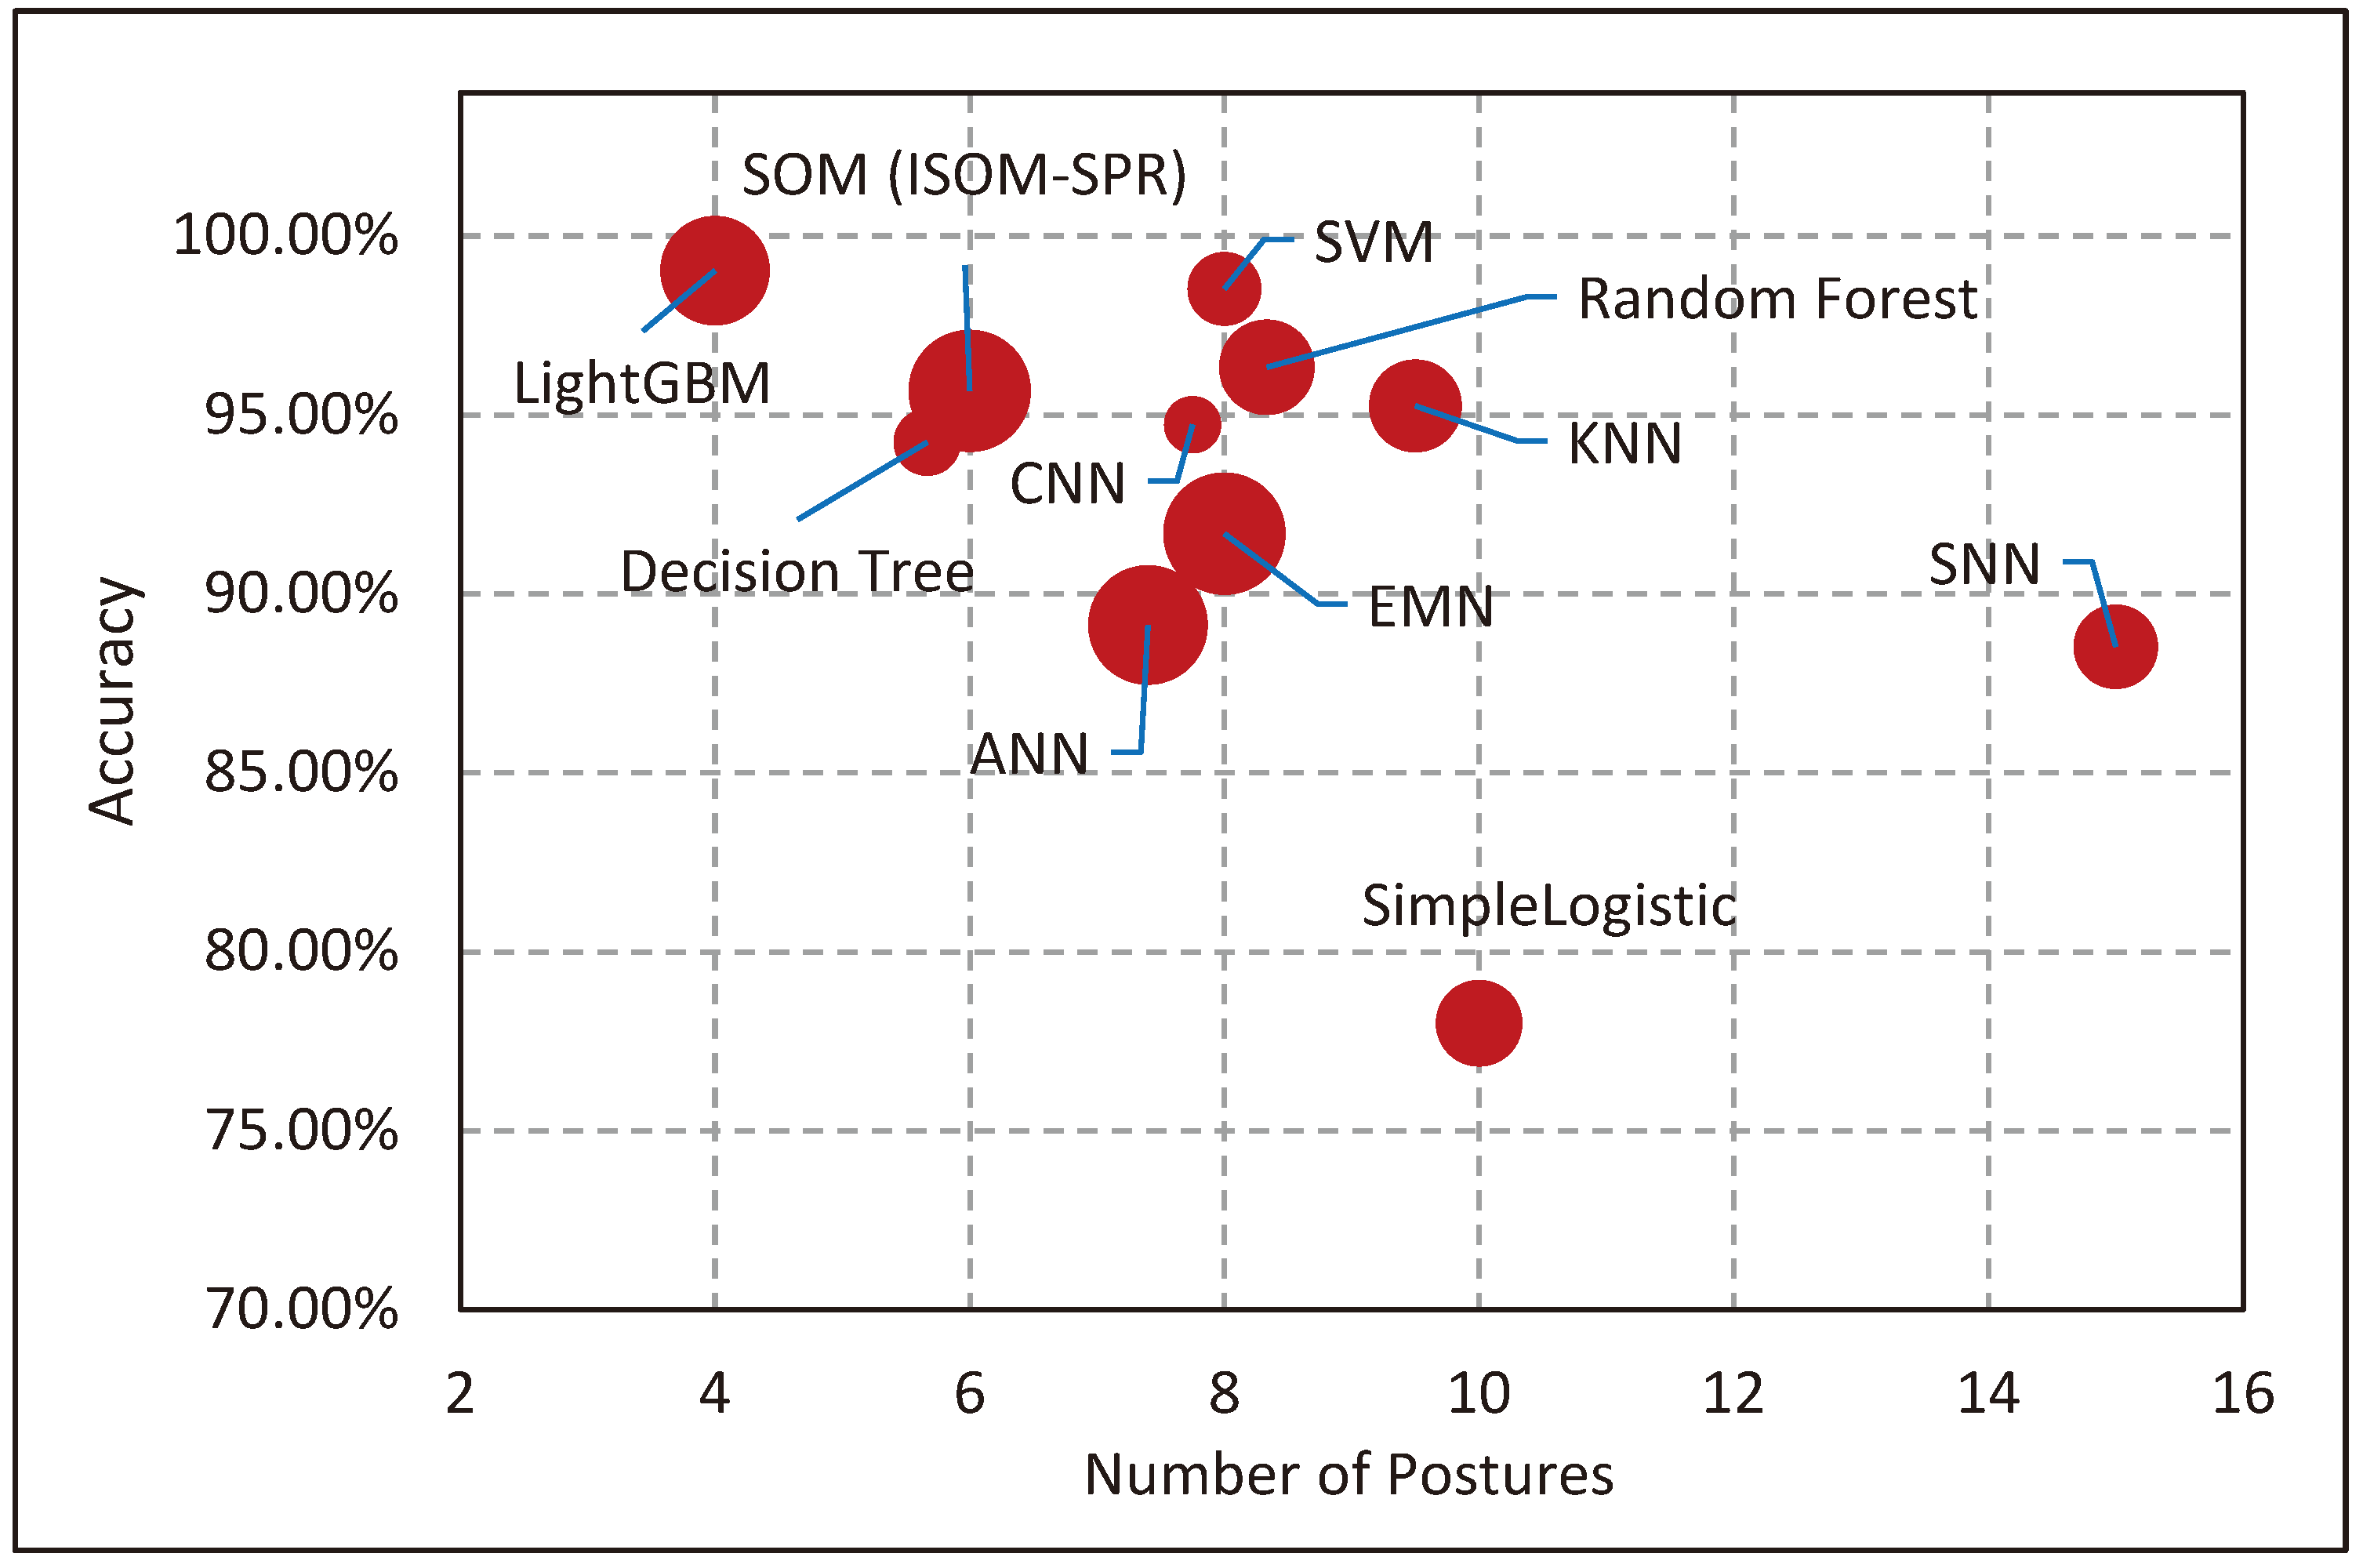
Figure 9 illustrates the relationship between the number of sitting postures classified and the overall classification accuracy of various machine learning models, as reported in the literature. Data analysis indicates a moderate negative correlation between the model's accuracy and the number of postures it classifies. This trend indicates that as the complexity of posture classification increases—with more postures being identified—the precision of classification tends to decrease. Consequently, this pattern has led researchers to typically restrict the scope of posture detection to between five to seven specific positions, including leaning left, leaning right, leaning backward, upright sitting, and leaning forward, to optimize accuracy. The study by Feng et al. [
69] which utilized RFID tags in conjunction with a camera sensor to classify three distinct sitting postures—sitting straight, leaning forward, and leaning backward—represents the lower end of posture classification spectrum. In contrast, investigations by Wang et al. [
51], Cho et el. [
65], Bourahmoune et al. [
66] expanded posture classification to encompass up to 15 different postures, achieving notable accuracies of 88.52%, 96%, and 98.82%, respectively. This range highlights the diverse capabilities and limitations of machine learning applications in posture detection within smart sensing chair systems.
Figure 9 also indicate that deep learning models, including Convolutional Neural Networks (CNNs) and Artificial Neural Networks (ANNs), do not significantly outperform traditional statistical models in terms of classification accuracy for sitting posture detection. This observation may be attributed to the size of the datasets employed for model training. Deep learning models are recognized for their superior performance with extensive datasets, in contrast to statistical models that require less data. An additional reason for this disparity is the limited number of test subjects contributing data to train the deep learning models, suggesting that an expansion of dataset size could enhance their classification accuracy.
5.3. Research Gaps
5.3.1. Lack of User Feedback Evaluation
In examining the current state of this research field, many of the studies predominantly focus on the development of algorithms that would achieve high classification accuracy. Although the pursuit of enhanced algorithmic performance in posture detection is important, there exists a noticeable void in the integration and subsequent evaluation of user feedback methods. Most studies tend to prioritize other aspects such as sensor placement and classification accuracy and leave out the need to perform critical evaluation on user feedback systems for posture correction. As previously discussed, only 11 studies implemented a user feedback system for posture correction; 5 of which used a mobile application. This limited adoption underscores a significant research gap in the assessment of such feedback systems.
With the lack of a comprehensive evaluation being conducted, a few questions can be raised regarding the effectiveness, feasibility, and overall usability from the end user’s perspective when interacting with these systems. Are these systems truly effective in motivating and guiding users towards adopting healthier sitting postures? Performing a critical evaluation on these systems would be beneficial in various aspects. Firstly, it would provide vital information regarding the user experience while interacting with these systems, making it quite easy to find potential gaps that could be further improved upon. Moreover, a detailed examination would elucidate whether user expectations align with the system’s outcomes, thereby facilitating targeted improvements to ensure agreement between user needs and system functionality. Employing methodologies such as user interviews, surveys, and usability testing stands to offer invaluable feedback, paving the way for the refinement of feedback mechanisms within smart sensing chair systems.
5.3.2. Lack of diversity on the training dataset
The quality of the training dataset is very important during the training of machine learning model. In the process of model training, test subjects are commonly enlisted to simulate various sitting postures over designated periods. On average, the research studies utilize a low number of test subjects, typically around 21 individuals. A sample size this small might not be adequate to fully represent the wide postural variances that exist within the wider population. Additionally, there also seems to be a bias towards the test subjects involved in the data collection, most of which are healthy individuals who are mocking poor sitting postures.
While this no doubt simplifies the data collection phase for most studies, it fails to account for the different challenges involved in the recognition of poor sitting postures among individuals that are suffering musculoskeletal conditions. Consequently, the effectiveness of the machine learning model might be compromised when applied in real scenario settings involving a much wider demographic.
Addressing this issue requires a lot of effort which involves broadening the dataset by the inclusion of wider demographic ranging from different age groups, body shapes, and health conditions. Enriching the dataset in this manner would enhance the model’s ability to accurately classify sitting postures among a heterogeneous population, thereby increasing its robustness and applicability in diverse real-world scenarios.
6. Conclusions & Recommendations for Future Research
This paper provides comprehensive literature review of smart sensing chair systems within the research landscape. It has identified a diverse array of sensors utilized across studies, including Force Sensing Resistors (FSR), textile pressure sensors, load cells, and image sensors, with FSR sensors emerging as the predominant choice among researchers. The strategies for sensor placement predominantly fall into two categories: utilizing a pressure sensor array or distributing individual sensors throughout the chair. Presently, no conclusive evidence suggests a definitive advantage of one strategy over the other in terms of enhancing classification accuracy. However, from a maintenance and cost perspective, the dispersed sensor approach is deemed more favourable but may not be feasible for people with MSDs due to their unique body shapes. In the area of sitting posture classification, various machine learning models have been employed, with many achieving a high classification accuracy rate of 90%. Despite these successes, a notable gap in the research is the quality of the datasets used for training these models. Predominantly, test subjects are healthy individuals from a narrow demographic, simulating incorrect sitting postures, which raises concerns about the model’s applicability to a broader population, particularly those with musculoskeletal disorders.
Looking ahead, it is important for future research to prioritize the development and rigorous evaluation of user feedback systems aimed at posture correction. Such investigations would significantly contribute to assessing the effectiveness of these systems in real-world settings. Validation tools such as System Usability Scale, NASA Task-Load Index (TLX), and Single Ease Questions could be implemented to assess user usability across the entire system [
73,
74].
Moreover, there is a compelling case for exploring the integration of various sensor types to enhance the functionality of smart sensing chair systems. While current studies often focus on a single sensor type for posture detection, the integration of multiple sensor types, as demonstrated by Jeong and Park [
58], who combined infrared reflective distance sensors with pressure sensors, could offer a more versatile approach to posture classification. Incorporating Inertial Measurement Unit (IMU) sensors could further enable the monitoring of user activity, enriching the data available for posture analysis and correction [
45].
Author Contributions
Conceptualization, J.K. and D.O.; methodology, D.O., J.K. and A.P.; validation, A.P. and C.G..; investigation and formal analysis, D.O. and J.K.; resources, J.K. and C.G.; data curation, D.O.; writing—original draft preparation, D.O. and J.K.; writing—review and editing, S.V. and A.P.; visualization, D.O. and J.K.; supervision and project administration, J.K. and S.V.; funding acquisition, J.K. and C.G. All authors have read and agreed to the published version of the manuscript.
Funding
This work is partly supported by the University of South Wales (USW) QR fund (Ref: 104607.13.1125), RIS funding (Ref: 1125.104790), and Cardiff & Vale University Health Board, Rehabilitation Engineering Unit (REU) contribution (EFAS 22754).
Institutional Review Board Statement
Not applicable.
Informed Consent Statement
Not Applicable.
Data Availability Statement
No new data were created or analysed in this study. Data sharing is not applicable to this article.
Acknowledgments
The authors would like to thank the University of South Wales and Cardiff & Vale University Health Board, REU for supporting the project.
Conflicts of Interest
There are no conflicts of interest among authors.
References
- Gill, T.K.; Mittinty, M.M.; March, L.M.; Steinmetz, J.D.; Culbreth, G.T.; Cross, M.; Kopec, J.A.; Woolf, A.D.; Haile, L.M.; Hagins, H.; et al. Global, Regional, and National Burden of Other Musculoskeletal Disorders, 1990–2020, and Projections to 2050: A Systematic Analysis of the Global Burden of Disease Study 2021. The Lancet Rheumatology 2023, 5, e670–e682. [Google Scholar] [CrossRef] [PubMed]
- Bevan, S. Economic Impact of Musculoskeletal Disorders (MSDs) on Work in Europe. Best Practice & Research Clinical Rheumatology 2015, 29, 356–373. [Google Scholar] [CrossRef] [PubMed]
- Devi, R.R.; Singh, C.I.; Singh, K.C. Incidence and Profile of Neonatal Musculoskeletal Birth Defects at a Tertiary Hospital in North East India. International Journal of Scientific Study 2015. [Google Scholar] [CrossRef]
- Collange, C.; Burde, M.-A. Musculoskeletal Problems of Neurogenic Origin. Best Practice & Research Clinical Rheumatology 2000, 14, 325–343. [Google Scholar] [CrossRef]
- European Agency for Safety and Health at Work. Musculoskeletal Disorders among Children and Young People: Prevalence, Risk Factors and Preventive Measures : A Scoping Review.; Publications Office: LU, 2021. [Google Scholar]
- Arora, S.N.; Khatri, S. Prevalence of Work-Related Musculoskeletal Disorder in Sitting Professionals. Int J Community Med Public Health 2022, 9, 892. [Google Scholar] [CrossRef]
- Putsa, B.; Jalayondeja, W.; Mekhora, K.; Bhuanantanondh, P.; Jalayondeja, C. Factors Associated with Reduced Risk of Musculoskeletal Disorders among Office Workers: A Cross-Sectional Study 2017 to 2020. BMC Public Health 2022, 22, 1503. [Google Scholar] [CrossRef] [PubMed]
- Van Eerd, D.; Irvin, E.; Le Pouésard, M.; Butt, A.; Nasir, K. Workplace Musculoskeletal Disorder Prevention Practices and Experiences. INQUIRY 2022, 59, 004695802210921. [Google Scholar] [CrossRef]
- Keskin, Y. Correlation between Sitting Duration and Position and Lumbar Pain among Office Workers. Haydarpasa Numune Med J 2019. [Google Scholar] [CrossRef]
- Bontrup, C.; Taylor, W.R.; Fliesser, M.; Visscher, R.; Green, T.; Wippert, P.-M.; Zemp, R. Low Back Pain and Its Relationship with Sitting Behaviour among Sedentary Office Workers. Applied Ergonomics 2019, 81, 102894. [Google Scholar] [CrossRef]
- Yoon, D.H.; Lee, J.-Y.; Song, W. Effects of Resistance Exercise Training on Cognitive Function and Physical Performance in Cognitive Frailty: A Randomized Controlled Trial. J Nutr Health Aging 2018, 22, 944–951. [Google Scholar] [CrossRef]
- Partlow, A. A Knowledge Based Engineering System for the Prescription and Manufacture of Custom Contoured Seating for Clients with Severe Musculoskeletal and Postural Conditions, University of South Wales, Faculty of Computing, Engineering and Science: Wales, UK, 2014.
- Kulon, J.; Partlow, A.; Gibson, C.; Wilson, I.; Wilcox, S. Rule-Based Algorithm for the Classification of Sitting Postures in the Sagittal Plane from the Cardiff Body Match Measurement System. Journal of Medical Engineering & Technology 2014, 38, 5–15. [Google Scholar] [CrossRef]
- Partlow, A.; Gibson, C.; Kulon, J.; Wilson, I.; Wilcox, S. Pelvis Feature Extraction and Classification of Cardiff Body Match Rig Base Measurements for Input into a Knowledge-Based System. Journal of Medical Engineering & Technology 2012, 36, 399–406. [Google Scholar] [CrossRef]
- Amendt, L.E.; Ause-Ellias, K.L.; Eybers, J.L.; Wadsworth, C.T.; Nielsen, D.H.; Weinstein, S.L. Validity and Reliability Testing of the Scoliometer®. Physical Therapy 1990, 70, 108–117. [Google Scholar] [CrossRef] [PubMed]
- Berthonnaud, E.; Dimnet, J. Analysis of Structural Features of Deformed Spines in Frontal and Sagittal Projections. Computerized Medical Imaging and Graphics 2007, 31, 9–16. [Google Scholar] [CrossRef] [PubMed]
- Burwell, R.; James, N.; Johnson, F.; Webb, J.; Wilson, Y. Standardised Trunk Asymmetry Scores. A Study of Back Contour in Healthy School Children. The Journal of Bone and Joint Surgery. British volume 1983, 65-B, 452–463. [Google Scholar] [CrossRef] [PubMed]
- Jaremko, J.L.; Poncet, P.; Ronsky, J.; Harder, J.; Dansereau, J.; Labelle, H.; Zernicke, R.F. Indices of Torso Asymmetry Related to Spinal Deformity in Scoliosis. Clinical Biomechanics 2002, 17, 559–568. [Google Scholar] [CrossRef] [PubMed]
- Meyer, J.; Arnrich, B.; Schumm, J.; Troster, G. Design and Modeling of a Textile Pressure Sensor for Sitting Posture Classification. IEEE Sensors J. 2010, 10, 1391–1398. [Google Scholar] [CrossRef]
- Partlow, A.; Gibson, C.; Kulon, J. 3D Posture Visualisation from Body Shape Measurements Using Physics Simulation, to Ascertain the Orientation of the Pelvis and Femurs in a Seated Position. Computer Methods and Programs in Biomedicine 2021, 198, 105772. [Google Scholar] [CrossRef] [PubMed]
- Kulon, J.; Voysey, M.; Partlow, A.; Rogers, P.; Gibson, C. Development of a System for Anatomical Landmarks Localization Using Ultrasonic Signals. In Proceedings of the 2016 IEEE International Symposium on Medical Measurements and Applications (MeMeA); IEEE: Benevento, Italy, May, 2016; pp. 1–6. [Google Scholar]
- Tan, H.Z.; Slivovsky, L.A.; Pentland, A. A Sensing Chair Using Pressure Distribution Sensors. IEEE/ASME Trans. Mechatron. 2001, 6, 261–268. [Google Scholar] [CrossRef]
- Slater, D.; Korakakis, V.; O’Sullivan, P.; Nolan, D.; O’Sullivan, K. “Sit Up Straight”: Time to Re-Evaluate. J Orthop Sports Phys Ther 2019, 49, 562–564. [Google Scholar] [CrossRef]
- Korakakis, V.; O’Sullivan, K.; O’Sullivan, P.B.; Evagelinou, V.; Sotiralis, Y.; Sideris, A.; Sakellariou, K.; Karanasios, S.; Giakas, G. Physiotherapist Perceptions of Optimal Sitting and Standing Posture. Musculoskeletal Science and Practice 2019, 39, 24–31. [Google Scholar] [CrossRef]
- Paredes-Madrid, L.; Matute, A.; Bareño, J.; Parra Vargas, C.; Gutierrez Velásquez, E. Underlying Physics of Conductive Polymer Composites and Force Sensing Resistors (FSRs). A Study on Creep Response and Dynamic Loading. Materials 2017, 10, 1334. [Google Scholar] [CrossRef]
- Sadun, A.S.; Jalani, J.; Sukor, J.A. Force Sensing Resistor (FSR): A Brief Overview and the Low-Cost Sensor for Active Compliance Control.; Jiang, X., Chen, G., Capi, G., Ishll, C., Eds.; Tokyo, Japan, July 11 2016; p. 1001112.
- Velásquez, E.I.G.; Gómez, V.; Paredes-Madrid, L.; Colorado, H.A. Error Compensation in Force Sensing Resistors. Sensing and Bio-Sensing Research 2019, 26, 100300. [Google Scholar] [CrossRef]
- Ohmite Ohmite FSR Series Integration Guide: Force Sensing Resistor 2018.
- Interlink Electronics FSR 402 Data Sheet.
- Interlink Electronics FSR 406 Data Sheet.
- Pizarro, F.; Villavicencio, P.; Yunge, D.; Rodríguez, M.; Hermosilla, G.; Leiva, A. Easy-to-Build Textile Pressure Sensor. Sensors 2018, 18, 1190. [Google Scholar] [CrossRef]
- Martínez-Estrada, M.; Vuohijoki, T.; Poberznik, A.; Shaikh, A.; Virkki, J.; Gil, I.; Fernández-García, R. A Smart Chair to Monitor Sitting Posture by Capacitive Textile Sensors. Materials 2023, 16, 4838. [Google Scholar] [CrossRef]
- Kim, M.; Kim, H.; Park, J.; Jee, K.-K.; Lim, J.A.; Park, M.-C. Real-Time Sitting Posture Correction System Based on Highly Durable and Washable Electronic Textile Pressure Sensors. Sensors and Actuators A: Physical 2018, 269, 394–400. [Google Scholar] [CrossRef]
- Xu, W.; Huang, M.-C.; Amini, N.; He, L.; Sarrafzadeh, M. eCushion: A Textile Pressure Sensor Array Design and Calibration for Sitting Posture Analysis. IEEE Sensors J. 2013, 13, 3926–3934. [Google Scholar] [CrossRef]
- Kamble, V.; shinde, V.D.; Kittur, J.K. Overview of Load Cells. Journal of Mechanical and Mechanics Engineering 6.3 2020, 22–29. [Google Scholar]
- Roh, J.; Park, H.; Lee, K.; Hyeong, J.; Kim, S.; Lee, B. Sitting Posture Monitoring System Based on a Low-Cost Load Cell Using Machine Learning. Sensors 2018, 18, 208. [Google Scholar] [CrossRef]
- Pereira, L.; Plácido Da Silva, H. A Novel Smart Chair System for Posture Classification and Invisible ECG Monitoring. Sensors 2023, 23, 719. [Google Scholar] [CrossRef]
- Sreejan, A.; Narayan, Y.S. A Review on Applications of Flex Sensors. International Journal of Emerging Technology and Advanced Engineering 2017, 7, 97–100. [Google Scholar]
- SpectraSymbol Flex Sensor Data Sheet 2014.
- SpectraSymbol Flex Sensor 2.2.
- Hu, Q.; Tang, X.; Tang, W. A Smart Chair Sitting Posture Recognition System Using Flex Sensors and FPGA Implemented Artificial Neural Network. IEEE Sensors J. 2020, 20, 8007–8016. [Google Scholar] [CrossRef]
- AbuTerkia, I.; Hannoun, M.; Suwal, B.; Ahmed, M.S.; Sundaravdivel, P. FPGA-Based Smart Chair Recognition System Using Flex Sensors. In Proceedings of the 2022 IEEE 15th Dallas Circuit And System Conference (DCAS); IEEE: Dallas, TX, USA, June 17, 2022; pp. 1–2. [Google Scholar]
- Mallare, J.C.T.; Pineda, D.F.G.; Trinidad, G.M.; Serafica, R.D.; Villanueva, J.B.K.; Dela Cruz, A.R.; Vicerra, R.R.P.; Serrano, K.K.D.; Roxas, E.A. Sitting Posture Assessment Using Computer Vision. In Proceedings of the 2017IEEE 9th International Conference on Humanoid, Nanotechnology, Information Technology, Communication and Control, Environment and Management (HNICEM); IEEE: Manila, Philippines, December, 2017; pp. 1–5. [Google Scholar]
- Chen, K. Sitting Posture Recognition Based on OpenPose. IOP Conf. Ser.: Mater. Sci. Eng. 2019, 677, 032057. [Google Scholar] [CrossRef]
- Ma, C.; Li, W.; Gravina, R.; Du, J.; Li, Q.; Fortino, G. Smart Cushion-Based Activity Recognition: Prompting Users to Maintain a Healthy Seated Posture. IEEE Syst. Man Cybern. Mag. 2020, 6, 6–14. [Google Scholar] [CrossRef]
- Huang, M.; Gibson, I.; Yang, R. Smart Chair for Monitoring of Sitting Behavior. KEG 2017, 2, 274. [Google Scholar] [CrossRef]
- Kim, Y.; Son, Y.; Kim, W.; Jin, B.; Yun, M. Classification of Children’s Sitting Postures Using Machine Learning Algorithms. Applied Sciences 2018, 8, 1280. [Google Scholar] [CrossRef]
- Cai, W.; Zhao, D.; Zhang, M.; Xu, Y.; Li, Z. Improved Self-Organizing Map-Based Unsupervised Learning Algorithm for Sitting Posture Recognition System. Sensors 2021, 21, 6246. [Google Scholar] [CrossRef]
- Ran, X.; Wang, C.; Xiao, Y.; Gao, X.; Zhu, Z.; Chen, B. A Portable Sitting Posture Monitoring System Based on a Pressure Sensor Array and Machine Learning. Sensors and Actuators A: Physical 2021, 331, 112900. [Google Scholar] [CrossRef]
- Ahmad, J.; Sidén, J.; Andersson, H. A Proposal of Implementation of Sitting Posture Monitoring System for Wheelchair Utilizing Machine Learning Methods. Sensors 2021, 21, 6349. [Google Scholar] [CrossRef]
- Wang, J.; Hafidh, B.; Dong, H.; El Saddik, A. Sitting Posture Recognition Using a Spiking Neural Network. IEEE Sensors J. 2021, 21, 1779–1786. [Google Scholar] [CrossRef]
- Fan, Z.; Hu, X.; Chen, W.-M.; Zhang, D.-W.; Ma, X. A Deep Learning Based 2-Dimensional Hip Pressure Signals Analysis Method for Sitting Posture Recognition. Biomedical Signal Processing and Control 2022, 73, 103432. [Google Scholar] [CrossRef]
- Mutlu, B.; Krause, A.; Forlizzi, J.; Guestrin, C.; Hodgins, J. Robust, Low-Cost, Non-Intrusive Sensing and Recognition of Seated Postures. In Proceedings of the Proceedings of the 20th annual ACM symposium on User interface software and technology; ACM: Newport Rhode Island USA, 7 October 2007; pp. 149–158. [Google Scholar]
- Tsai, M.-C.; Chu, E.T.-H.; Lee, C.-R. An Automated Sitting Posture Recognition System Utilizing Pressure Sensors. Sensors 2023, 23, 5894. [Google Scholar] [CrossRef]
- Aminosharieh Najafi, T.; Abramo, A.; Kyamakya, K.; Affanni, A. Development of a Smart Chair Sensors System and Classification of Sitting Postures with Deep Learning Algorithms. Sensors 2022, 22, 5585. [Google Scholar] [CrossRef]
- Luna-Perejón, F.; Montes-Sánchez, J.M.; Durán-López, L.; Vazquez-Baeza, A.; Beasley-Bohórquez, I.; Sevillano-Ramos, J.L. IoT Device for Sitting Posture Classification Using Artificial Neural Networks. Electronics 2021, 10, 1825. [Google Scholar] [CrossRef]
- Matuska, S.; Paralic, M.; Hudec, R. A Smart System for Sitting Posture Detection Based on Force Sensors and Mobile Application. Mobile Information Systems 2020, 2020, 1–13. [Google Scholar] [CrossRef]
- Jeong, H.; Park, W. Developing and Evaluating a Mixed Sensor Smart Chair System for Real-Time Posture Classification: Combining Pressure and Distance Sensors. IEEE J. Biomed. Health Inform. 2021, 25, 1805–1813. [Google Scholar] [CrossRef] [PubMed]
- Martins, L.; Lucena, R.; Belo, J.; Santos, M.; Quaresma, C.; Jesus, A.P.; Vieira, P. Intelligent Chair Sensor. In Engineering Applications of Neural Networks; Iliadis, L., Papadopoulos, H., Jayne, C., Eds.; Communications in Computer and Information Science; Springer Berlin Heidelberg: Berlin, Heidelberg, 2013; Vol. 383, pp. 182–191. ISBN 978-3-642-41012-3. [Google Scholar]
- Ma, C.; Li, W.; Gravina, R.; Fortino, G. Posture Detection Based on Smart Cushion for Wheelchair Users. Sensors 2017, 17, 719. [Google Scholar] [CrossRef] [PubMed]
- Zemp, R.; Tanadini, M.; Plüss, S.; Schnüriger, K.; Singh, N.B.; Taylor, W.R.; Lorenzetti, S. Application of Machine Learning Approaches for Classifying Sitting Posture Based on Force and Acceleration Sensors. BioMed Research International 2016, 2016, 1–9. [Google Scholar] [CrossRef]
- Ren, X.; Yu, B.; Lu, Y.; Chen, Y.; Pu, P. HealthSit: Designing Posture-Based Interaction to Promote Exercise during Fitness Breaks. International Journal of Human–Computer Interaction 2019, 35, 870–885. [Google Scholar] [CrossRef]
- Fu, T.; Macleod, A. IntelliChair: An Approach for Activity Detection and Prediction via Posture Analysis. In Proceedings of the 2014 International Conference on Intelligent Environments; IEEE: China, June 2014; pp. 211–213. [Google Scholar]
- La Mura, M.; De Gregorio, M.; Lamberti, P.; Tucci, V. IoT System for Real-Time Posture Asymmetry Detection. Sensors 2023, 23, 4830. [Google Scholar] [CrossRef]
- Cho, H.; Choi, H.-J.; Lee, C.-E.; Sir, C.-W. Sitting Posture Prediction and Correction System Using Arduino-Based Chair and Deep Learning Model. In Proceedings of the 2019 IEEE 12th Conference on Service-Oriented Computing and Applications (SOCA); IEEE: Kaohsiung, Taiwan, November 2019; pp. 98–102. [Google Scholar]
- Bourahmoune, K.; Ishac, K.; Amagasa, T. Intelligent Posture Training: Machine-Learning-Powered Human Sitting Posture Recognition Based on a Pressure-Sensing IoT Cushion. Sensors 2022, 22, 5337. [Google Scholar] [CrossRef] [PubMed]
- Vermander, P.; Mancisidor, A.; Cabanes, I.; Perez, N.; Torres-Unda, J. Intelligent Sitting Posture Classifier for Wheelchair Users. IEEE Trans. Neural Syst. Rehabil. Eng. 2023, 31, 944–953. [Google Scholar] [CrossRef] [PubMed]
- R, N.; Sudhakar, T.; Bethanney Janney, J.; Krishnamoorthy, N.R.; Dhanalakshmi, K.; Vigneshwaran, S. Sitting Posture Analysis Using CNN and RCNN. In Proceedings of the 2023 International Conference on Bio Signals, Images, and Instrumentation (ICBSII); IEEE: Chennai, India, 16 March 2023; pp. 1–5. [Google Scholar]
- Feng, L.; Li, Z.; Liu, C. Are You Sitting Right?-Sitting Posture Recognition Using RF Signals. In Proceedings of the 2019 IEEE Pacific Rim Conference on Communications, Computers and Signal Processing (PACRIM); IEEE: Victoria, BC, Canada, August 2019; pp. 1–6. [Google Scholar]
- Kundaliya, B.; Patel, S.; Patel, J.; Barot, P.; Hadia, S.K. An IoT and Cloud Enabled Smart Chair for Detection and Notification of Wrong Seating Posture; In Review, 2022.
- Fard, F.D.; Moghimi, S.; Lotfi, R. Evaluating Pressure Ulcer Development in Wheelchair-Bound Population Using Sitting Posture Identification. ENG 2013, 05, 132–136. [Google Scholar] [CrossRef]
- Tharwat, A. Classification Assessment Methods. ACI 2021, 17, 168–192. [Google Scholar] [CrossRef]
- Laubheimer, P. Beyond the NPS: Measuring Perceived Usability with the SUS, NASA-TLX, and the Single Ease Question After Tasks and Usability Tests Available online: https://www.nngroup.com/articles/measuring-perceived-usability/.
- Suh, H.; Shahriaree, N.; Hekler, E.B.; Kientz, J.A. Developing and Validating the User Burden Scale: A Tool for Assessing User Burden in Computing Systems. In Proceedings of the Proceedings of the 2016 CHI Conference on Human Factors in Computing Systems; ACM: San Jose California USA, 7 May 2016; pp. 3988–3999. [Google Scholar]
|
Disclaimer/Publisher’s Note: The statements, opinions and data contained in all publications are solely those of the individual author(s) and contributor(s) and not of MDPI and/or the editor(s). MDPI and/or the editor(s) disclaim responsibility for any injury to people or property resulting from any ideas, methods, instructions or products referred to in the content. |
© 2024 by the authors. Licensee MDPI, Basel, Switzerland. This article is an open access article distributed under the terms and conditions of the Creative Commons Attribution (CC BY) license (http://creativecommons.org/licenses/by/4.0/).
