1. Introduction
In the realm of geomorphological research, particularly regarding rainfall-induced landslides and the structural failures of earthen dams, findings often reveal that total saturation of the soil substrate is not a necessary precondition for such geohazards to occur. This observation challenges the conventional belief that fully saturated soil conditions exacerbate the likelihood of failure due to compromised mechanical properties and structural integrity. Landslides, a critical natural disaster, are notably frequent in the complex topographies of the Himalayan and the North-eastern regions of India [
1]. These phenomena, often occur abruptly and capable of traversing considerable distances at high velocities, pose significant threats to both infrastructure and human life. The year 2012 served as a poignant case study, with severe landslides occurring in the Rohtang Pass, Himachal Pradesh, causing extensive damage and fatalities. The same year, the North-eastern regions, including Mizoram in 2017, experienced devastating landslides, underscoring the urgent need for understanding and mitigating the risks associated with these natural hazards in susceptible areas [
1].
Variations in soil state indicators, including matric suction, due to moisture penetration or the shift of the wetting front, are key factors to consider in addressing slope failures caused by rainfall. These variations are essential for determining the critical depths at which the soil’s shear strength no longer contributes to slope stability. Moreover, the principles of unsaturated soil mechanics are crucial in analyzing factors such as rainfall intensity, duration, and prior conditions that affect slope stability. This study highlights the significance of applying unsaturated soil mechanics in slope engineering practices [
2].
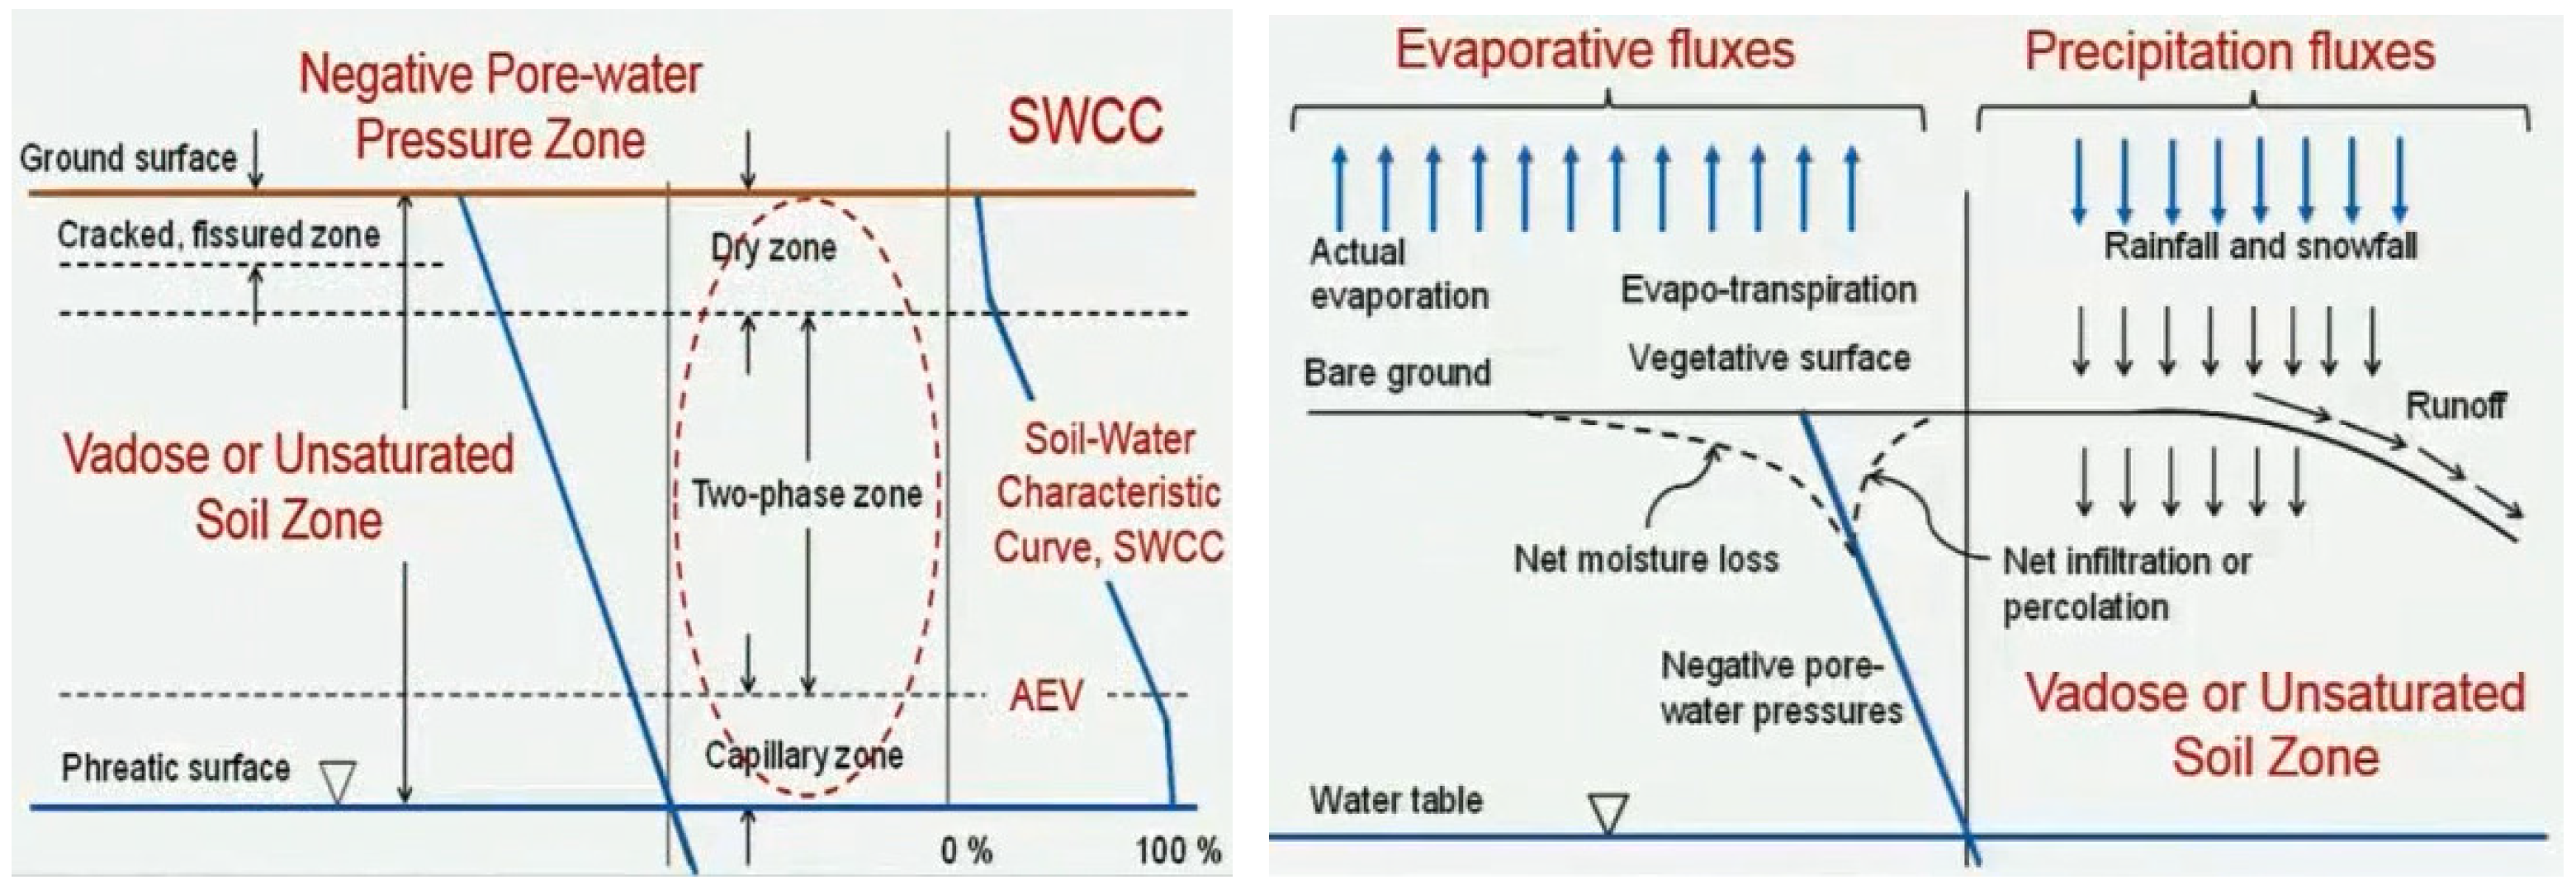
Figure 1 (a) shows the definition articulates the subdivisions of the vadose (or unsaturated) zone situated above the phreatic surface. Known as the vadose zone in engineering, it is described as the layer of Earth that stretches from the land surface down to the water table [
3]. This definition is important to maintain because it directly influences how the soil-water characteristic curve is measured in laboratory settings and subsequently applied in engineering contexts [
3]. The surface layer of the earth is exposed to a moisture flux that fluctuates in accordance with changing weather patterns, presenting a unique and complex boundary condition in the field of soil mechanics.
Figure 1 (b) highlights the factors that merge to result in either net infiltration or percolation. The interplay between the upward movement of moisture (through processes like evaporation and evapotranspiration) and downward moisture flow (due to rainfall) alters the steady-state negative pore-water pressure profile, creating a trumpet-shaped curve to represent the variations in soil suction over time [
3].
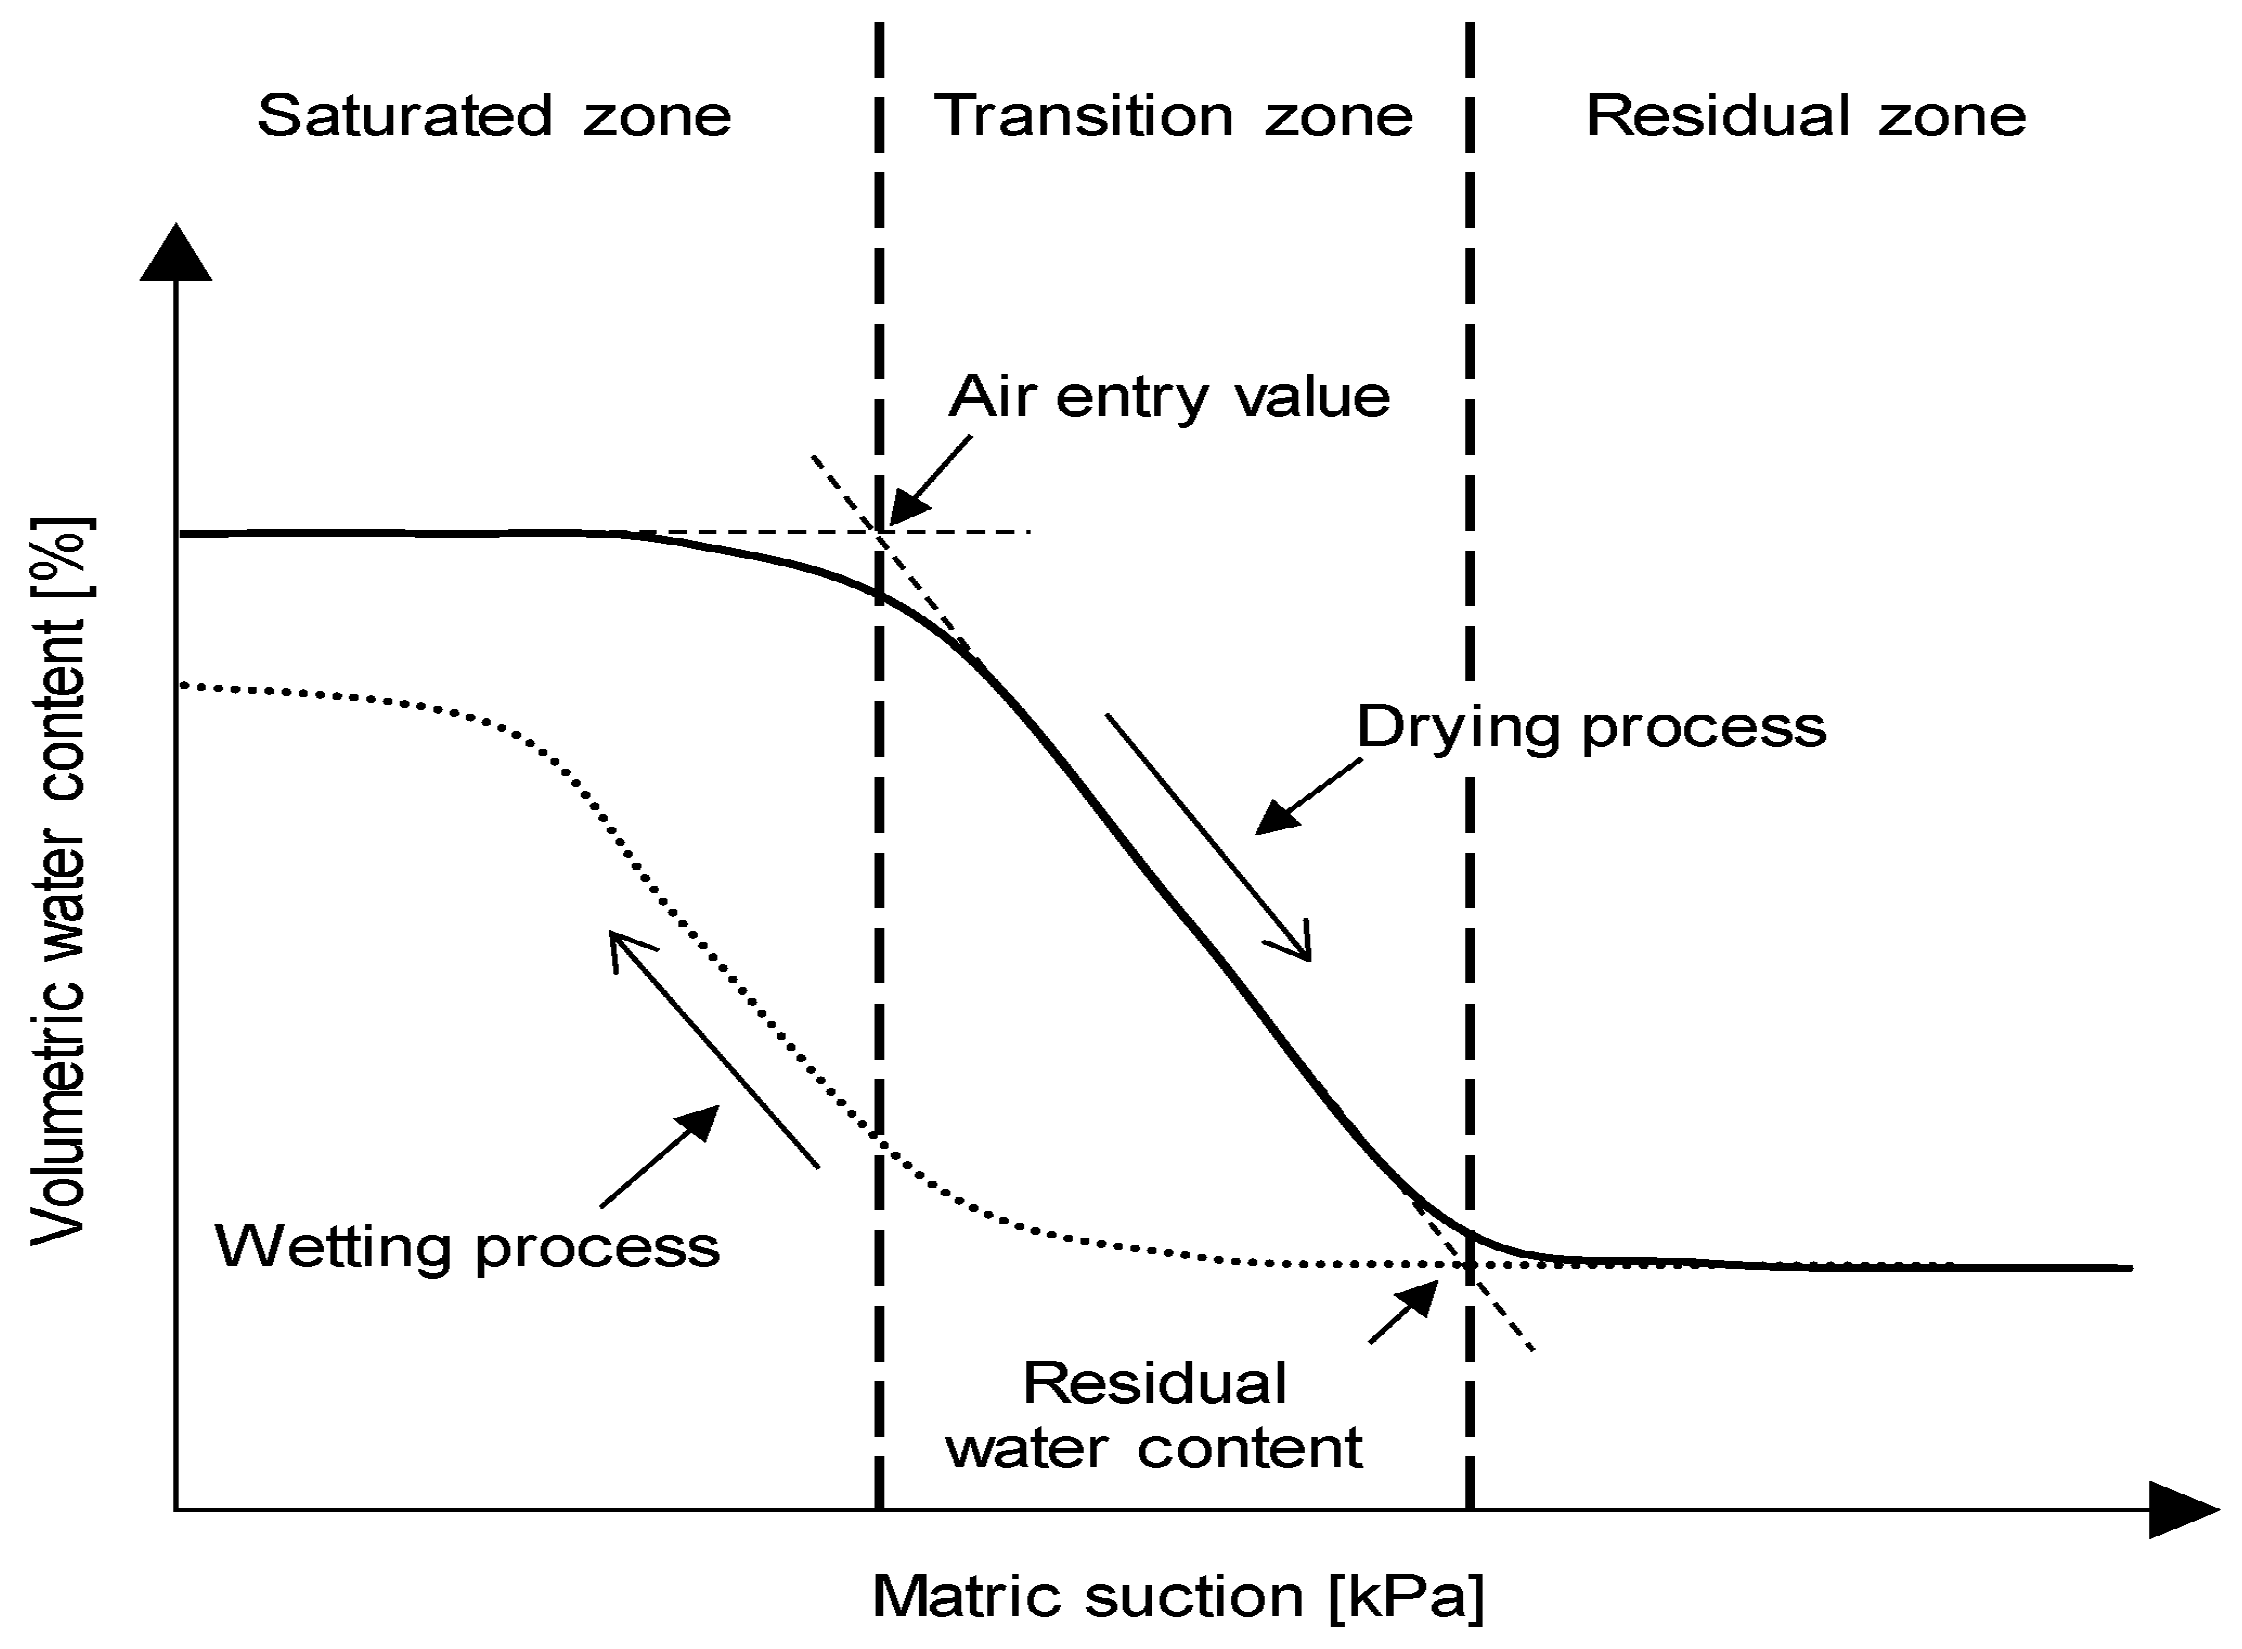
The soil-water characteristic curve (SWCC) describes how soil water content changes in relation to suction. Typically, this relationship is illustrated on a graph with the vertical axis representing gravimetric water content (w), volumetric water content (θ
w), or degree of saturation (S), and the horizontal axis depicting matric suction. The scale used for matric suction on the horizontal axis is logarithmic, facilitating a clear presentation of the relationship between water content and suction [
3].
The connection between the degree of saturation of soil and the negative pore water pressure adheres to the trend as per
Figure 2. Frequently established through experimental investigations on unsaturated geomaterials, this correlation is known as the water retention curve or the soil water characteristic curve. The importance of the retention curve in unsaturated soil mechanics cannot be overstated, as it is key to understanding the volume change, strength, and hydraulic properties of unsaturated soils [
3].
Landslides constitute a type of mass movement characterized by the rapid downhill displacement of soil, sediments, and rocks induced by gravity [
4]. Landslides triggered by rainfall are prevalent in the North-East region of India or elsewhere, particularly during the monsoon season, causing significant casualties and property damage [
5,
6]. The mechanism underlying rainfall-induced landslides involves water from rainfall permeating the soil through its pores. In such circumstance, treatments using microbial induced calcite precipitation could be used where a barrier layer is created through calcite precipitation [
7,
8,
9] or cementation [
10], respectively. However, if the slope is left barren, rainfall infiltration generates positive pore water pressure, reducing the soil’s effective stress and consequently weakening its strength. Ultimately, this process contributes to slope failure or landslides. In recent years, landslides have emerged as a highly destructive hazard on Earth [
11]. When these events transpire within populated areas, landslides can lead to disasters, causing significant harm to lives and properties. The slope characteristics of a region, its geomorphological features, climate, and human activities all contribute to the initiation of landslide processes. Mizoram, being a hilly terrain, encounters various types of slope failures, particularly during the monsoon season. This not only imposes hardships on the public, resulting in the loss of lives and properties, but also disrupts communication networks and imposes an economic burden on society.
From a geological perspective, Mizoram is part of the Tripura-Mizoram Mio-geosyncline, which, in turn, belongs to the broader Assam-Arakan geosynclinal basin. The geological makeup of the area is characterized by a repetitive succession of argillaceous and arenaceous sediments dating back to the Palaeogene-Neogene period. The overall trend of the rock formations is North-South, with varying dips ranging from 20° to 50° towards either the east or west [
12].
Table 1 given below are the landslide hazard class based on severity and their corresponding area of Mizoram.
In Mizoram, the primary causes of slope failures are predominantly associated with surface factors and hydro-environmental conditions, rather than sub-surface factors, seismic activities, or volcanic events, which are rare or non-existent in this region of India [
4].
Being part of the Himalayan mobile belt, Mizoram experiences significant neo-tectonic activity, and the associated factors play a substantial role in inducing slope failures, particularly in geologically unstable areas such as those near active fault zones and unconformities. The region is characterized by relatively young geological setting, and its lithology is primarily composed of unstable and soft sedimentary rocks [
11]. When subjected to intense rainfall, these rocks become highly susceptible to sliding down the slopes.
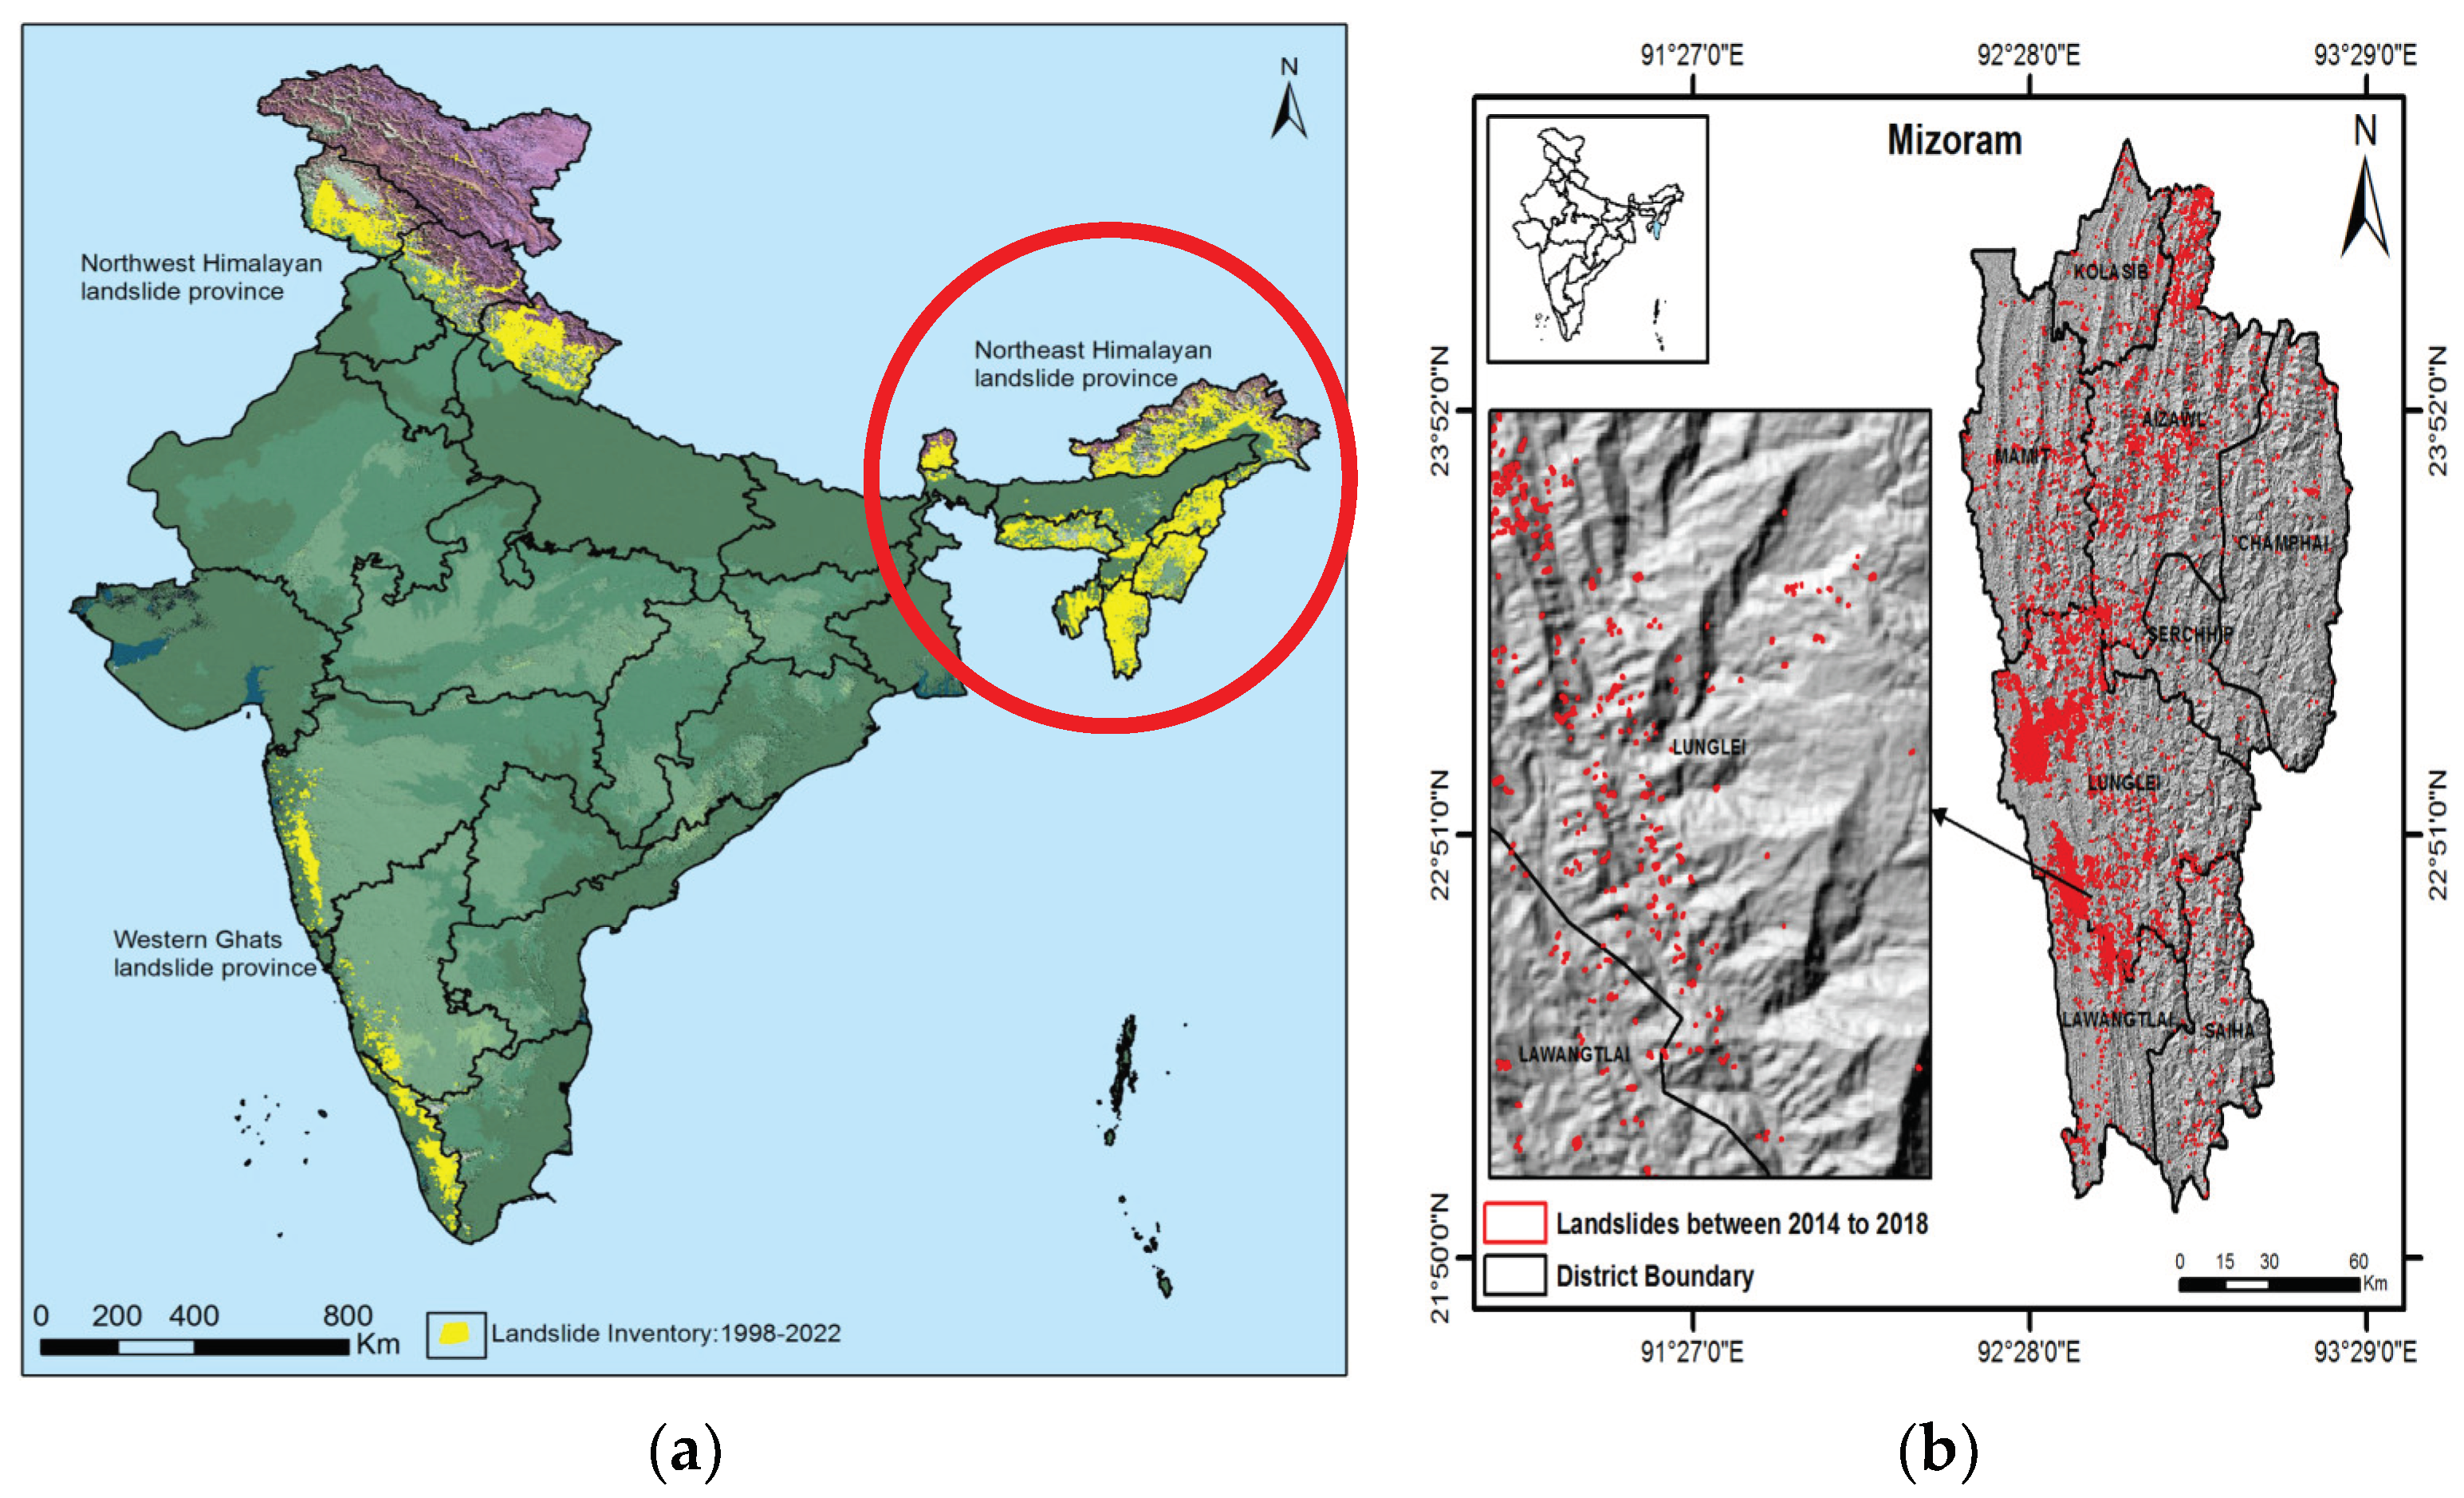
Figure 3 (a) show the landslide inventory of India which is indicative that North-East region of India have the greatest number of landslides.
Figure 3 (b) shows landslide mapping in Mizoram state, and it shows the greatest number of landslides are around Lunglei district. Additionally, the combination of steep slopes, and improper land use practices in the state has further increased the frequency of landslides. These factors collectively render the region highly prone to landslide occurrences [
14].
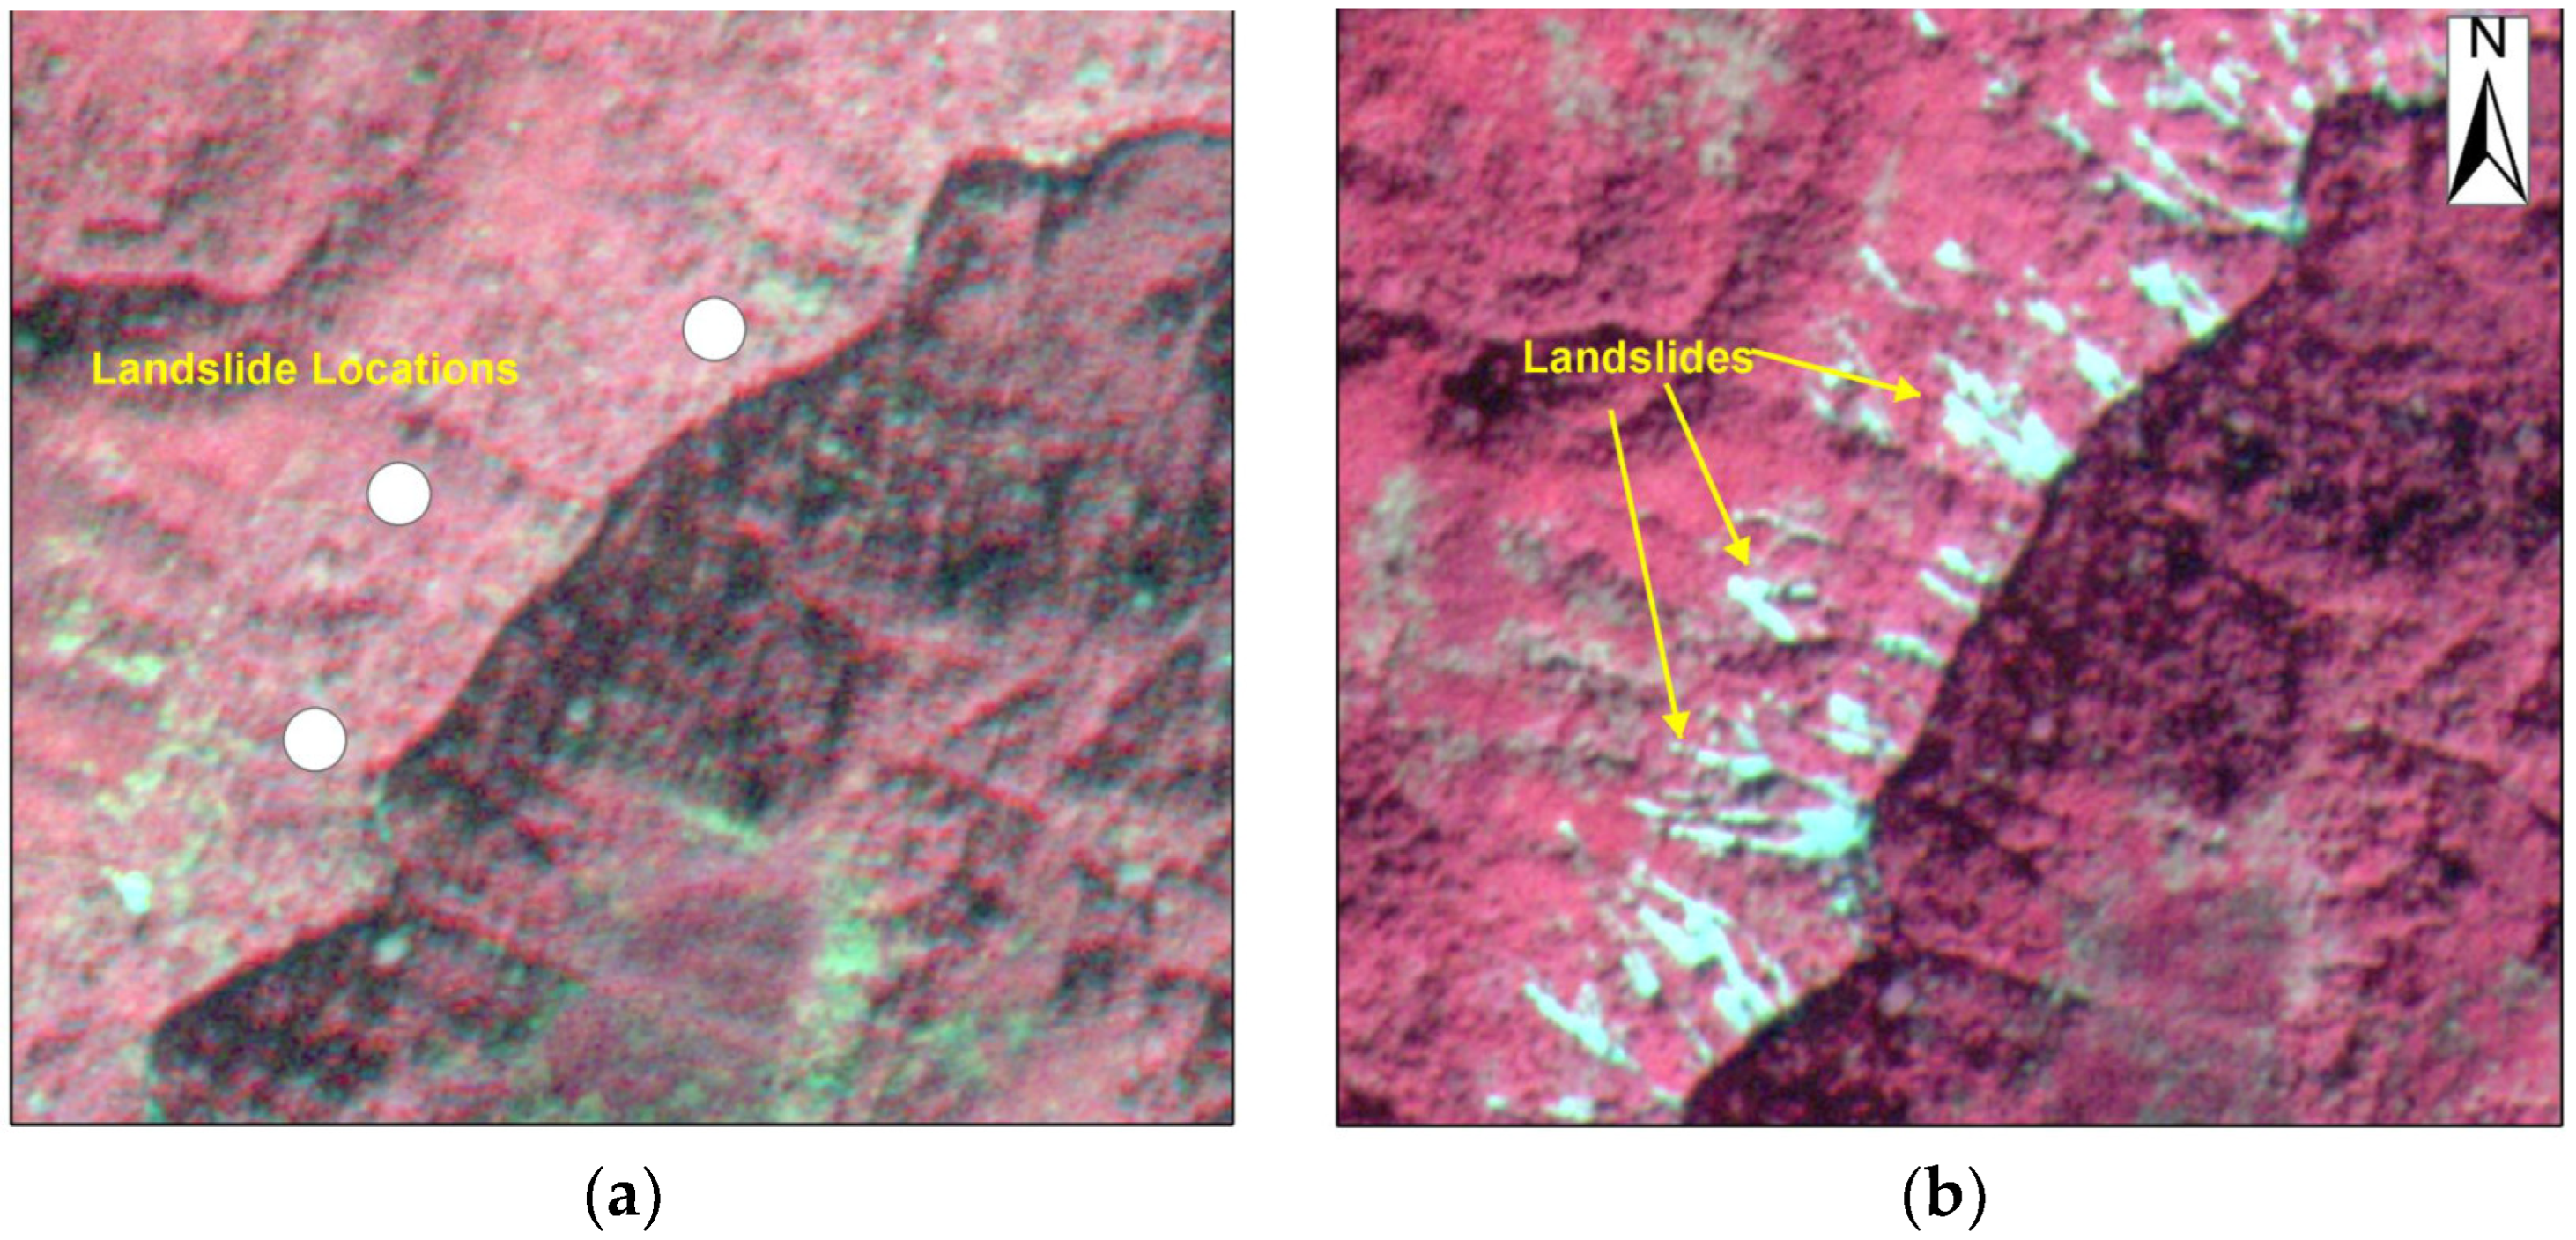
Figure 4 (a)&(b) shows conditions before and after shallow transitional landslides in the region around the Lunglei district of Mizoram encountered a shallow transitional landslide captured by satellite in 2013 and 2017 respectively which was captured by the satellite RESOURCESAT 2 LISS IV Mx, a phenomenon directly linked to substantial monsoonal rainfall. This specific landslide incident has been chosen as a case study for analysis in the present research. The comprehensive rainfall data for Lunglei, Mizoram, was obtained from the Mizoram Meteorological Department. The utilization of this meteorological data aims to facilitate an examination of the connection between heavy monsoonal rain activity and the occurrence of shallow transitional landslides in the specified region [
15].
The objective of this study is to delve into the soil water characteristic curve (SWCC) by determining matric suction using the contact filter paper technique for natural CI soils, across various densities and saturation levels. This research is of particular importance for unsaturated soils, showcasing a wide array of saturation levels and densities. The aim is to advance the understanding of the unsaturated properties and behavior of this soil, with a specific focus on its implications for slope stability. Moreover, the study is set to evaluate shear strength parameters by performing unconfined compressive tests on samples specifically prepared through the microwave drying method proposed by the ASTM standard. This preparation strategy is intended to achieve a precise level of unsaturation in the clay with intermediate plasticity (CI) specimens, which vary in saturation levels and dry densities. The goal is to clarify the in-situ unsaturated shear strength and unconfined compressive strength of the soil, drawing a correlation between these strengths and the soil’s density and saturation level [
15].
2. Background
The extent of rainwater infiltration and changes in the groundwater level during wet and dry seasons are significantly influenced by the characteristics of the soil. Consequently, the variations in pore-water pressures and the stability of residual soil slopes are profoundly affected by the mechanical and hydraulic behaviors of unsaturated soil. Therefore, grasping the principles of unsaturated soil mechanics, alongside the characterization and analysis of unsaturated soils, including the measurement of matric suction or negative pore-water pressures, is essential. This paper outlines the fundamentals of unsaturated soil mechanics, details the equipment used for measuring unsaturated soil properties, discusses numerical analyses that incorporate unsaturated soil mechanics, and examines the implementation of unsaturated soil mechanics principles in engineering practice [
16,
17,
18,
19].
To replicate the post-monsoon drying of natural slopes accurately, the microwave drying technique, guided by ASTM 4643 – 08 (2008) [
20], ensures uniform soil sample drying, leveraging the unique inside-out drying capability of microwave technology. This method is superior to traditional techniques like hot air ovens, which often cause uneven drying due to the faster evaporation of surface moisture compared to internal moisture. By vibrating water molecules with electromagnetic waves, the microwave method generates internal heat, leading to efficient and even moisture evaporation. This achieves a saturation level that closely simulates natural unsaturated soil conditions, essential for creating accurate soil specimens for research into soil behavior under varied moisture conditions, making it a pivotal method for studies on the impact of moisture on soil properties [
21,
22].
The conditions at the interface between soil and the atmosphere play a crucial role in determining the key parameters affecting slope stability, such as matric suction, water flow, and soil strength. During rainy seasons, the increase in water pressure and groundwater levels, coupled with a decrease in matric suction, contributes to more frequent slope failures. According to the findings of Cai & Ugai [
14], the hydraulic properties of the soil, the initial moisture content, rainfall intensity, and duration substantially influence water pressure in slopes, consequently leading to slope instability during rainfall.
The analysis conducted by Zhang et al. [
23] revealed that, under steady-state conditions, rainfall intensity emerged as the primary factor influencing matric suction. Conversely, during transient flow conditions, the matric suction profile was found to be influenced by the water storage function and saturated permeability in conjunction with rainfall infiltration. Collins et al. [
24] employed an analytical formulation to demonstrate that in coarse-grained soils, high infiltration rates lead to the development of positive pore-water pressure, resulting in slope failure due to seepage forces. Conversely, in fine-grained soils characterized by low infiltration rates, the loss of suction occurs, leading to a reduction in shear strength and, consequently, slope failure [
24,
25].
Understanding the problem of precipitation-triggered slope failure requires employing mechanical modelling and flow simulation, especially in situations involving unsaturated groundwater flow. Previous numerical examinations have commonly adopted a theory that separates groundwater flow from mechanical deformation, as described by Rahimi et al. [
26]. However, recognizing that the interaction between the hydraulic and mechanical properties are the primary cause of rainfall-induced slope failures, a robust tool is necessary for coordinating a series of numerical experiments to investigate these issues. The coupling approach of hydrological and mechanical behaviors, demonstrated by Chinkulkijniwat et al. [
27], offers a more precise simulation of these problems. Yubonchit et al. [
28] conducted parametric studies, discovering that slope failure can occur during the infiltration or rising water table stages, depending on the infiltration capacity at the saturated state [
29]. If the infiltration capacity surpasses the rainfall intensity at the saturated state, the slope remains stable due to residual matric suction throughout the infiltration stage but may fail during the rising water table stage [
30]. Conversely, if the rainfall intensity exceeds the infiltration capacity at the saturated state, matric suction disappears entirely during the infiltration stage, resulting in a higher likelihood of slope failure in this phase [
28].
A. K. Singh et al. [
31] conducted to ascertain the intrinsic properties of soil materials impacting the stability of the pre-existing slope. The study established an event-specific antecedent rainfall threshold to quantify the correlation between rainfall and the occurrence of slope failure. Utilizing a two-dimensional limit equilibrium method, the scenario of pre- and post-failure slope stability was visualized. The findings of the limit equilibrium analysis indicated that slope geometry played a significant role in influencing the pattern of failure [
32]. Furthermore, preventive measures involving benching and soil nailing were suggested and validated through limit equilibrium analysis to ensure long-term stability and secure transportation [
33].
The correlation between rainfall events and soil hydraulic characteristics determines the amount of rainwater infiltration necessary to reduce surface soil suction, potentially leading to slope failure. When the intensity of rainfall closely matches the soil hydraulic conductivity, the rainfall can theoretically be fully absorbed into the soil [
33]. In such cases, rainwater infiltration is most effective at reducing surface soil suction to a critical level. Moderate-intensity rainfall may fully penetrate the surface soil but might not adequately reduce soil suction [
34]. Conversely, during particularly intense rainfall, some rainwater may run off. Due to the typically shorter duration of strong rainfall, precipitation penetration might be insufficient to diminish soil suction. Numerous studies emphasize the significance of matric suction in shallow slope failures [
35,
36].
All the above findings from past research suggest that to tackle the issue of slope stability in unsaturated soils, an integrated approach is essential, starting with precise soil suction measurements and the development of Soil-Water Characteristic Curves (SWCC). Employing soil samples preparation reflecting accurate unsaturated conditions. Numerical modeling and flow simulations play a crucial role in understanding the soil’s response to moisture variations, exploring the dynamic interplay between hydraulic and mechanical properties [
37]. Additionally, assessing the soil’s hydraulic behavior and setting specific rainfall thresholds are critical for slope stability analysis. Stabilization measures like terracing, combined with soil nailing, form a comprehensive strategy for addressing slope stability [
38]. This multi-dimensional method leverages unsaturated soil mechanics to predict and mitigate the potential for slope failures, ensuring a proactive approach to managing slope integrity under varying moisture conditions [
39].
3. Material Properties
To gather samples from the landslide site, the landslide slope was divided into three equal parts: upper, middle, and lower sections. Soil samples were collected from each area at depths of 0.5 m, 1 m, and 1.5 m, employing the core cutter method within open pits. Various experiments, including index properties of the soil, compaction, Unconfined Compressive Strength tests following IS 2720 various parts [
40,
41,
42,
43,
44,
45,
46,
47], and oedometer tests, were conducted on these samples.
Table 2 shows the index properties of the soils after carrying out laboratory tests.
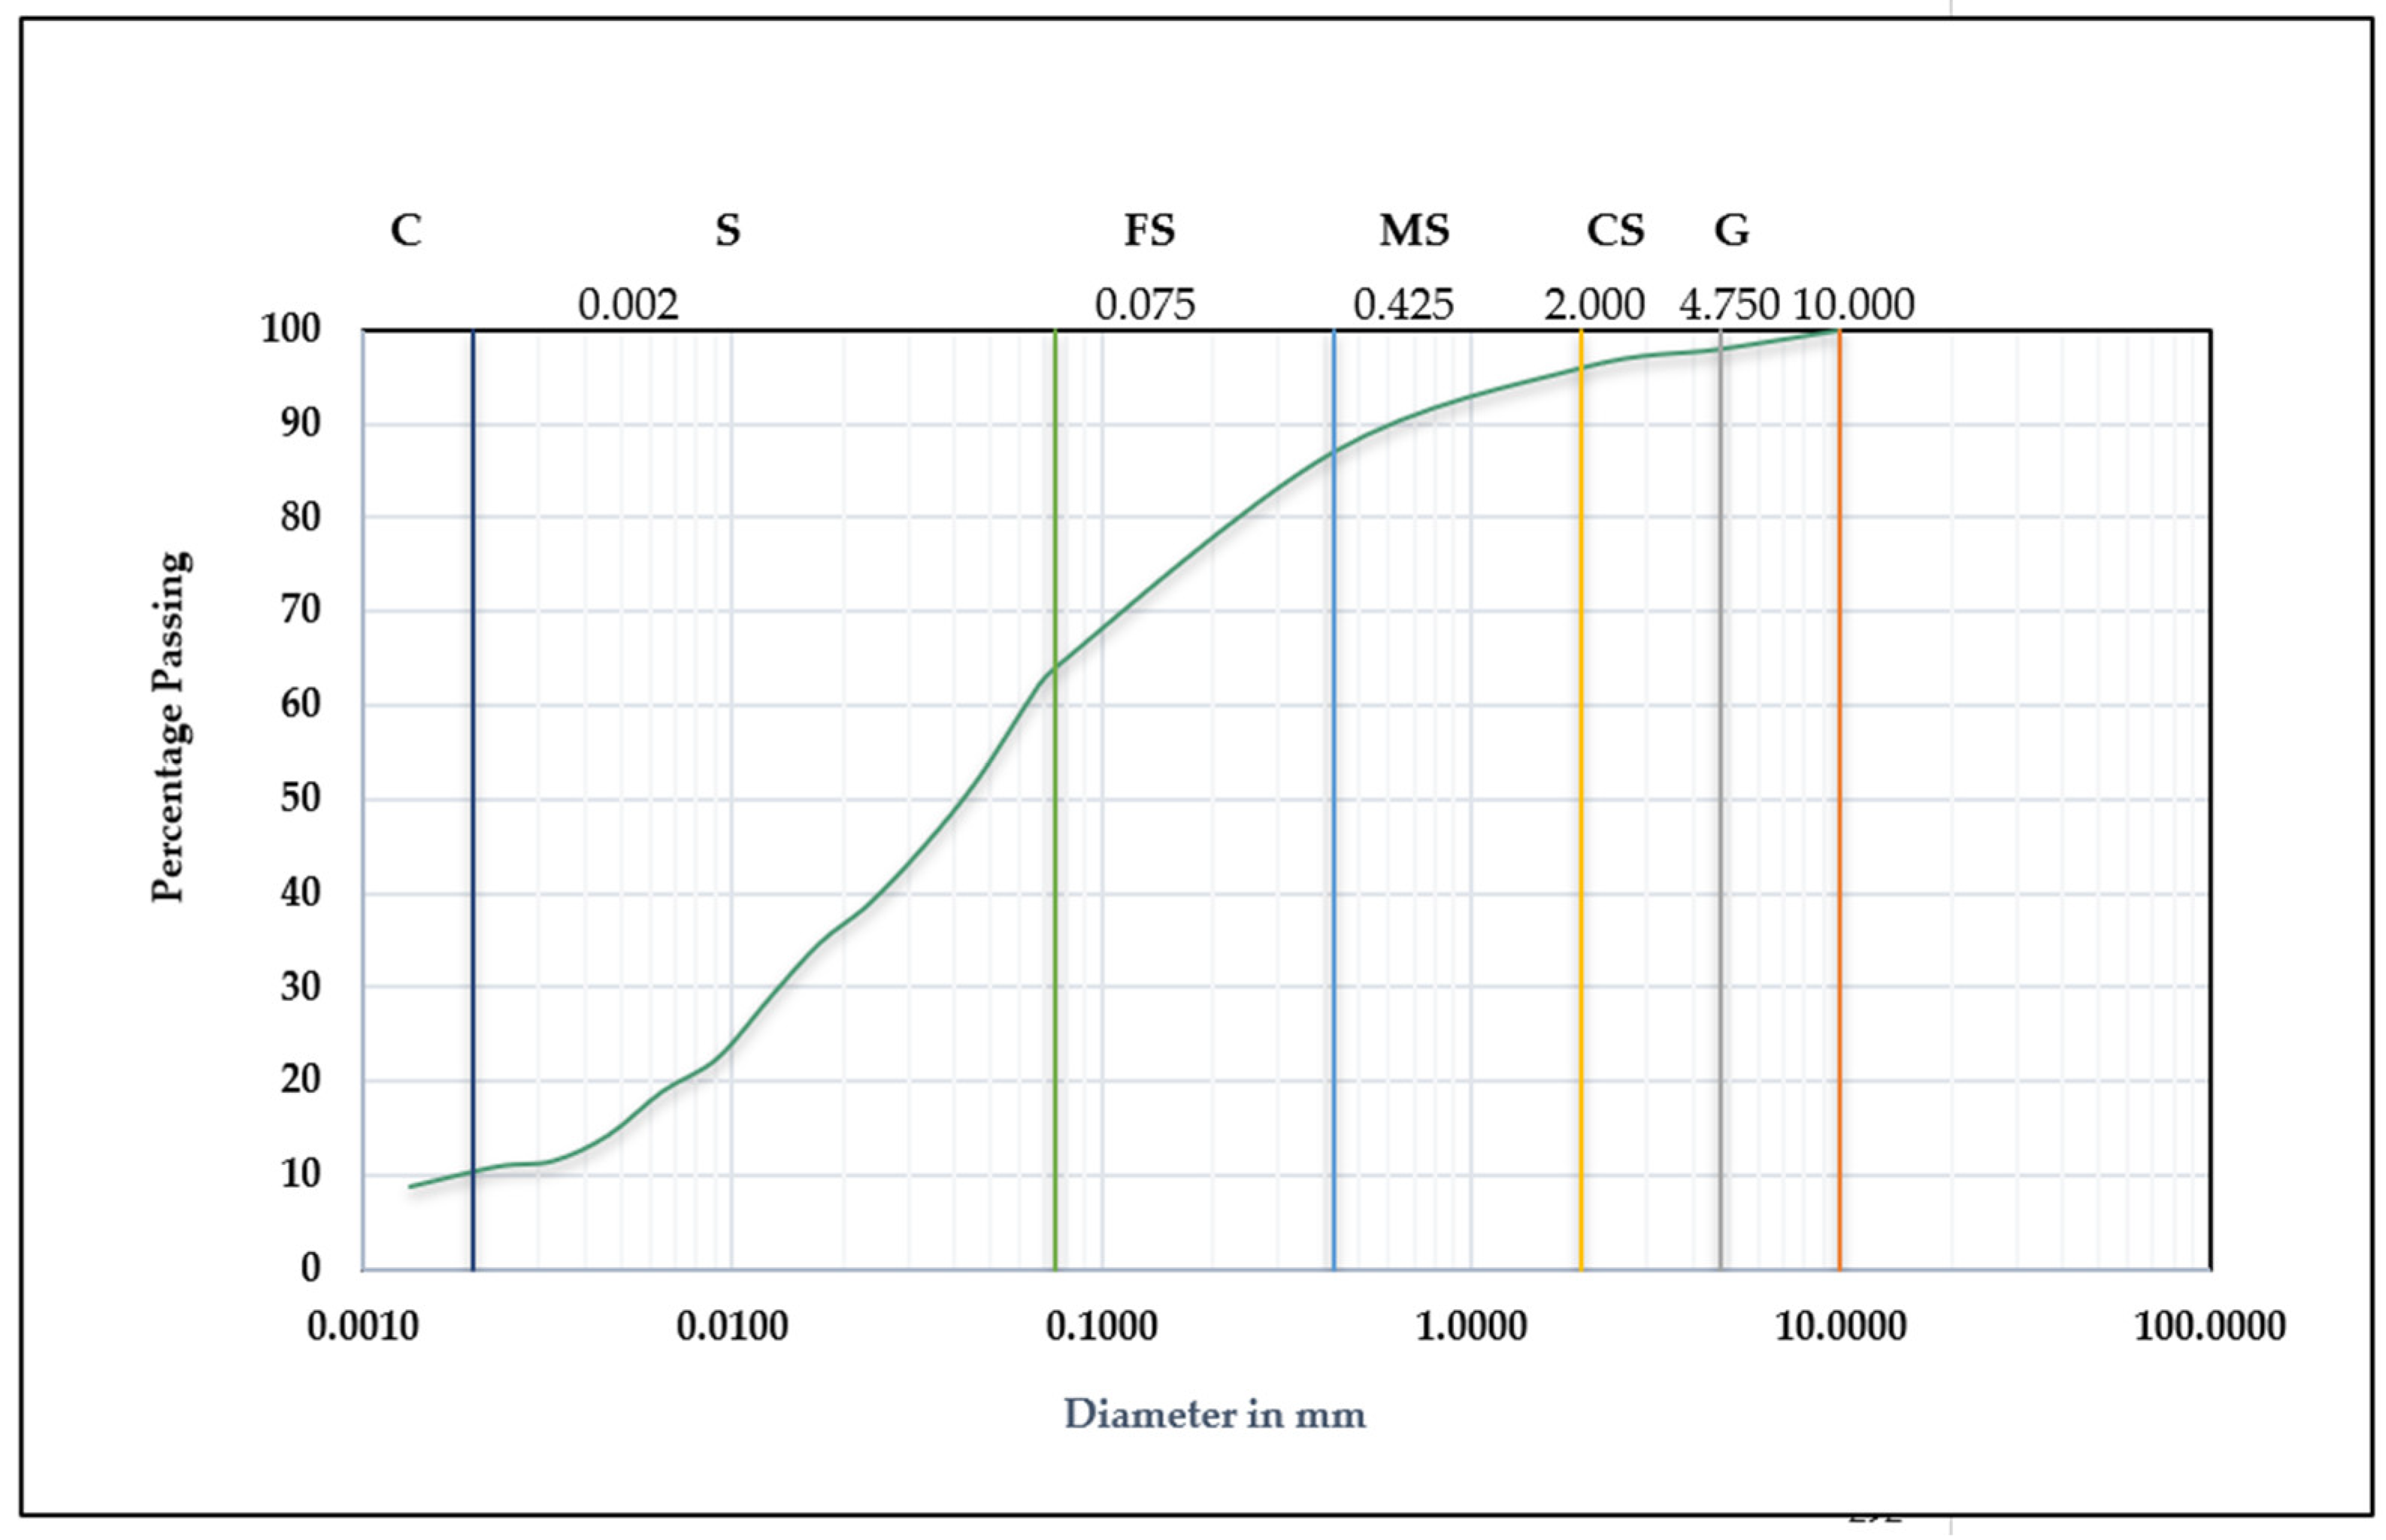
Figure 5 shows particle size distribution curve of the typical soil sample.
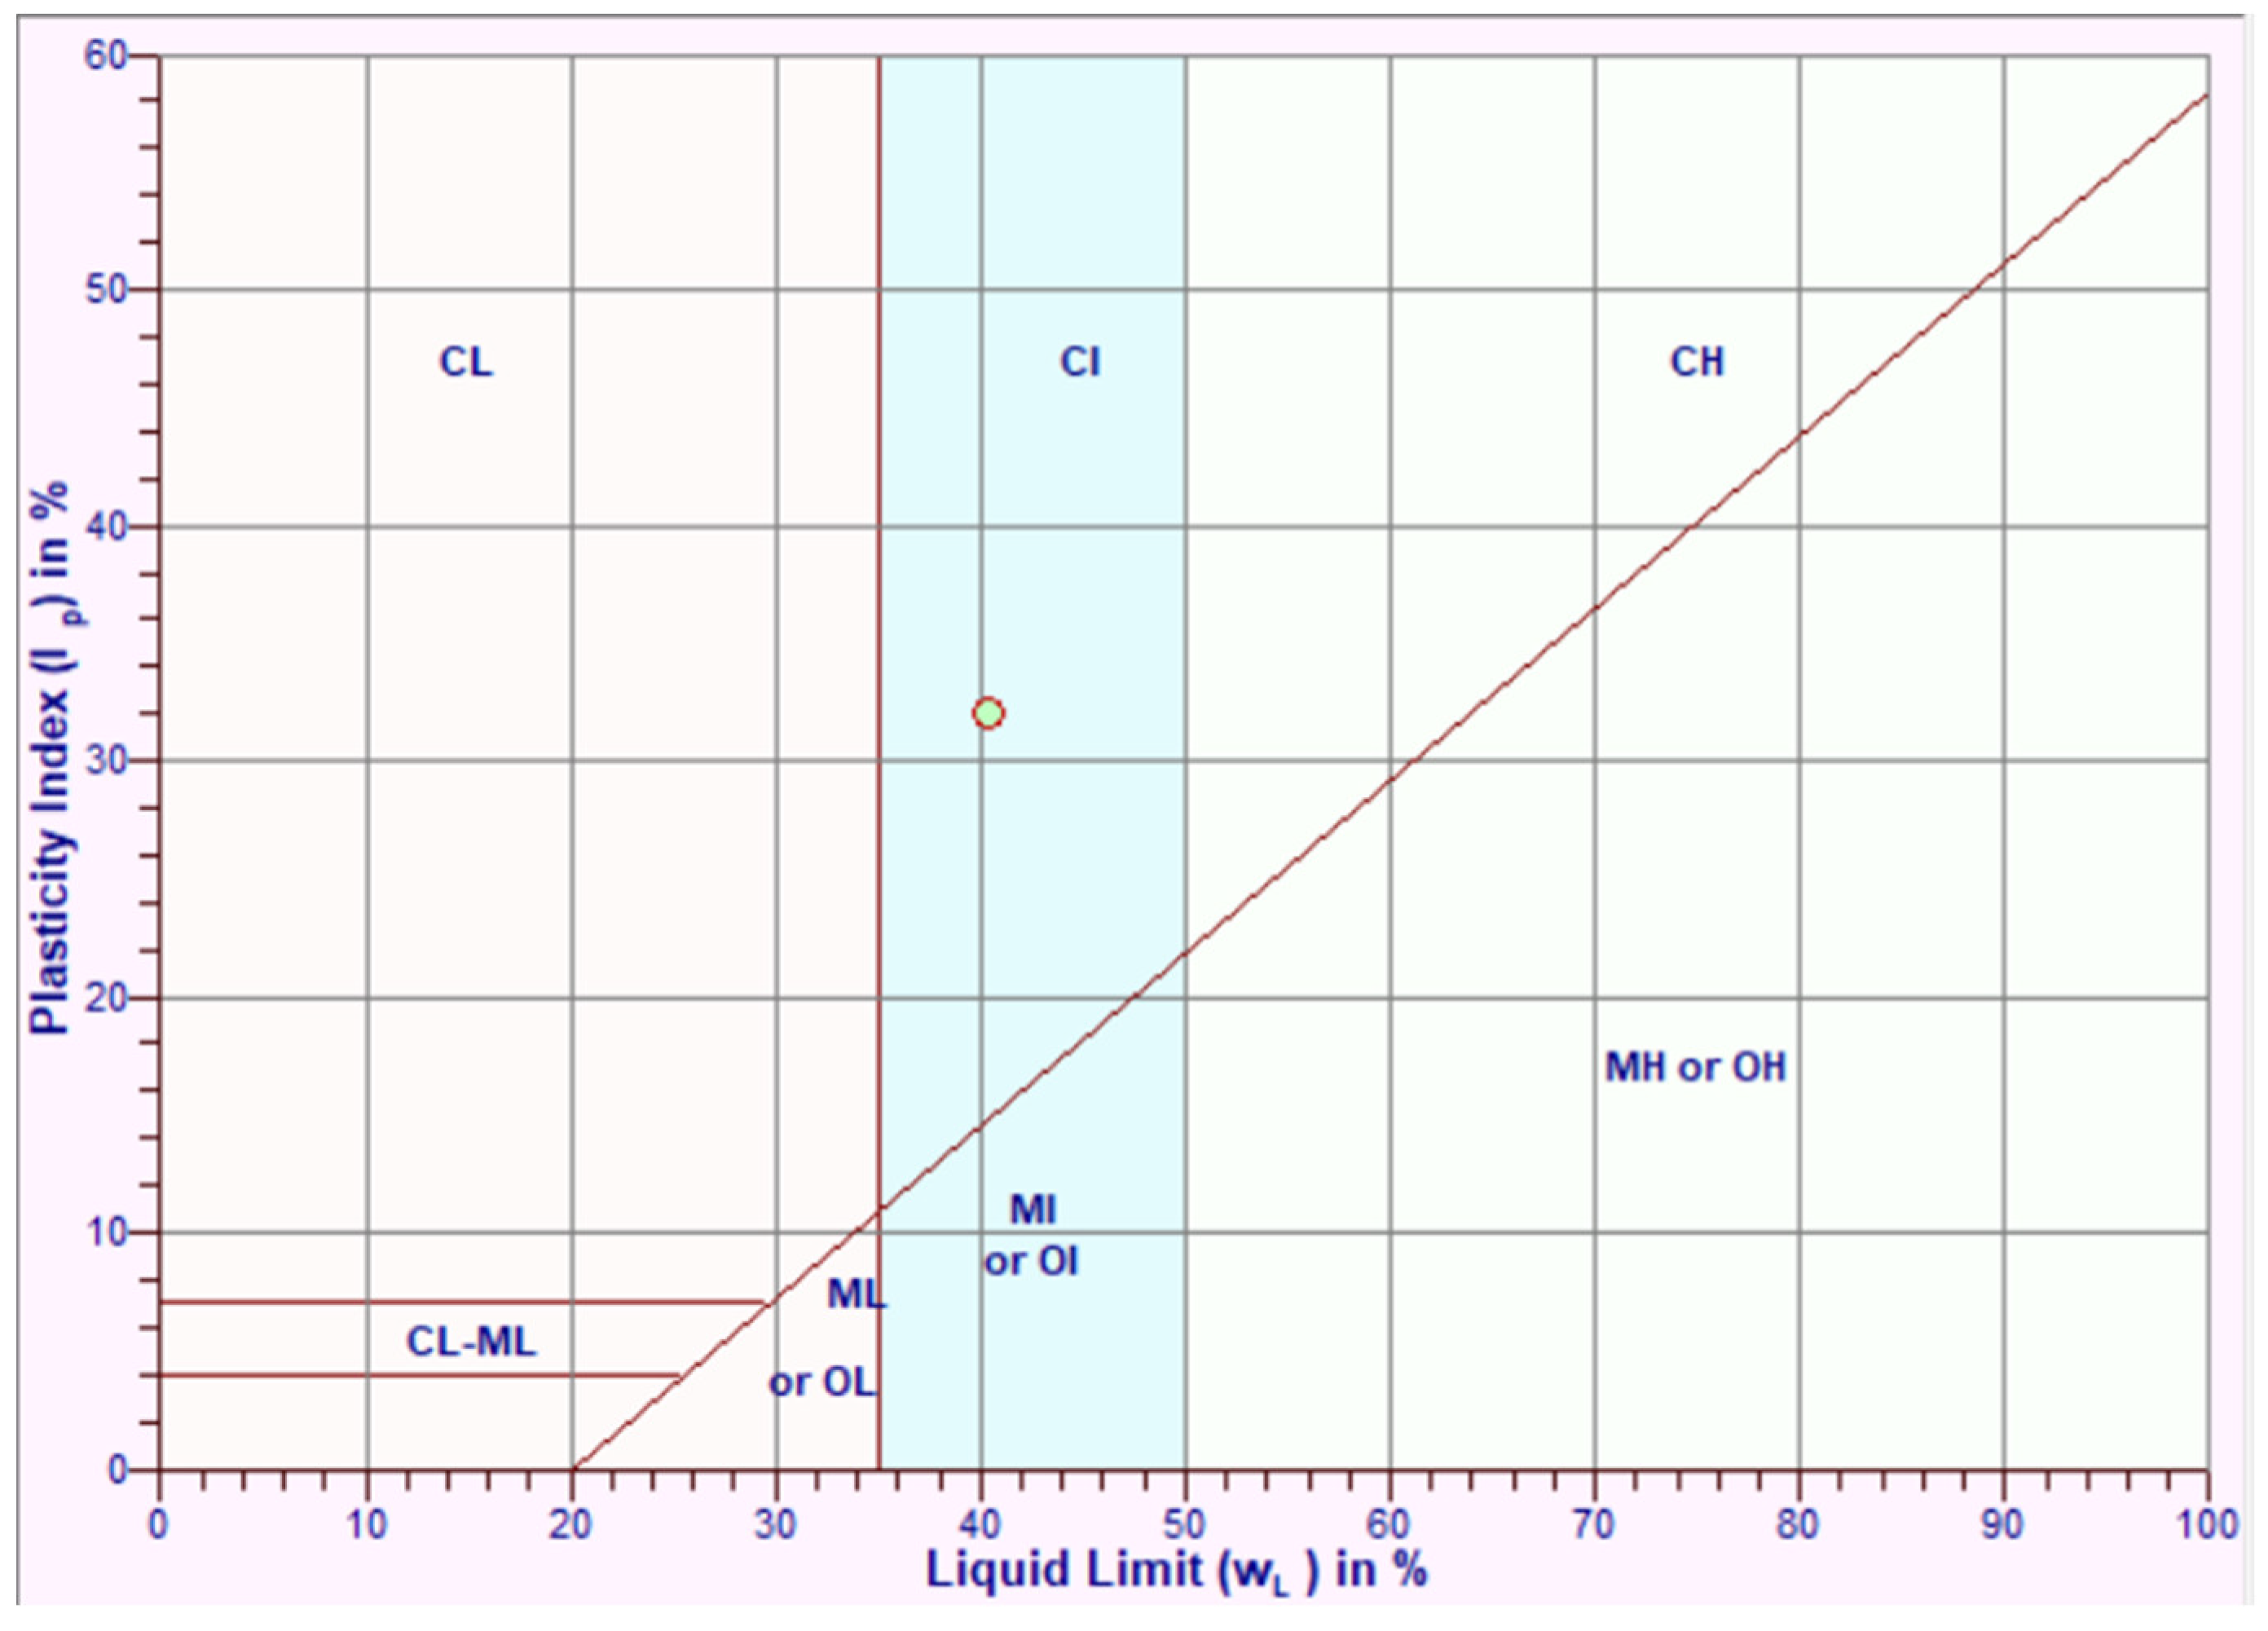
Figure 6 presents the A-line curve for Atterberg
’s limits, classifying the soil sample as clay with intermediate plasticity.
3.1. Soil Suction Measurement for SWCC Curves and Results
Soil matric suction is measured for varying dry density and degree of saturation. Aluminium plungers are used for compaction, ensuring no impact on soil and water mixture. Two-layered soil samples are compacted in PVC moulds with dimensions designed to accommodate sufficient soil samples according to ASTM 5298 - 10 [
48,
49].
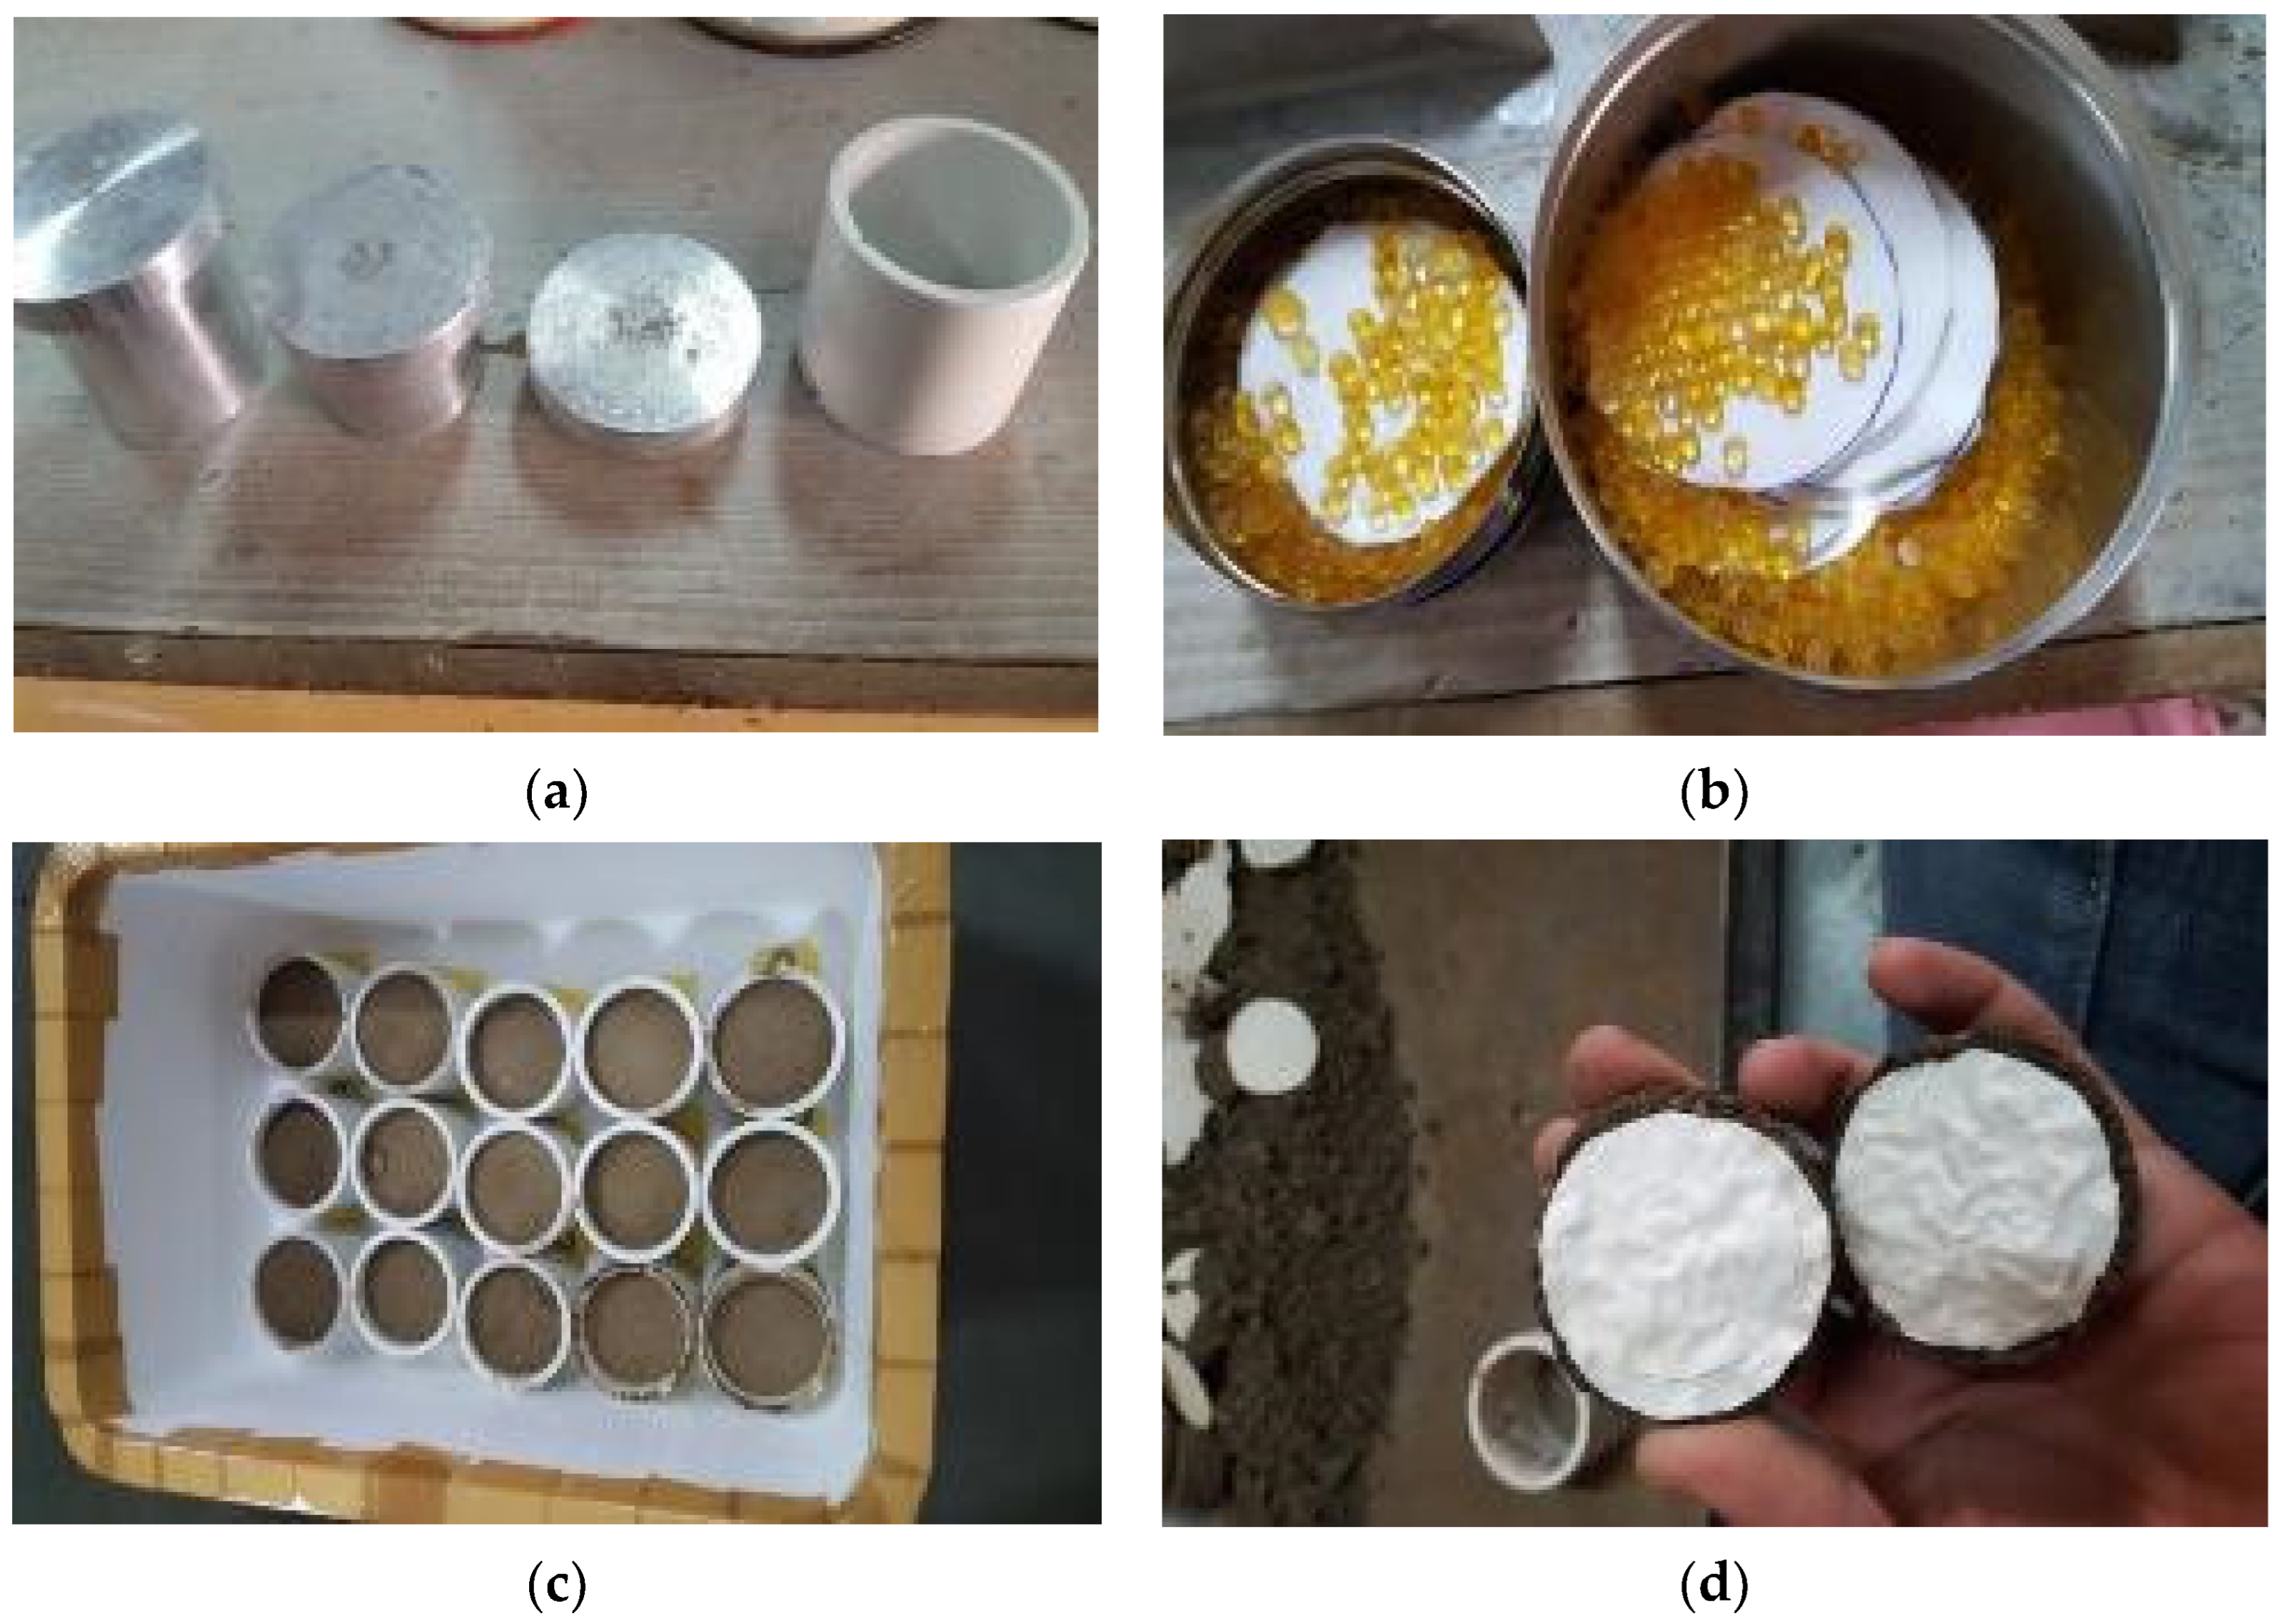
Figure 7 (a) depicts aluminium plungers, chosen for their resistance to corrosion and reactivity, alongside PVC moulds used for assessing soil suction. Both aluminium and PVC material for plunger and molds are favored for its chemical inertness, ensuring no alteration in the filter paper moisture content, soil-water interaction, or compromise to the measurement
’s accuracy due to material interference. Figure (7b) demonstrates the storage of Whatman No. 42 filter paper alongside silica pearls, ensuring the paper is kept dry until needed. Figure (7c) reveals the prepared remoulded soil samples undergoing a resting period. Figure (7d) details the procedure for measuring moisture content in filter paper that has been sandwiched between two sacrificing filter papers in soil samples. Each step of this process complies with the guidelines established by ASTM D5298 - 10 [
49].
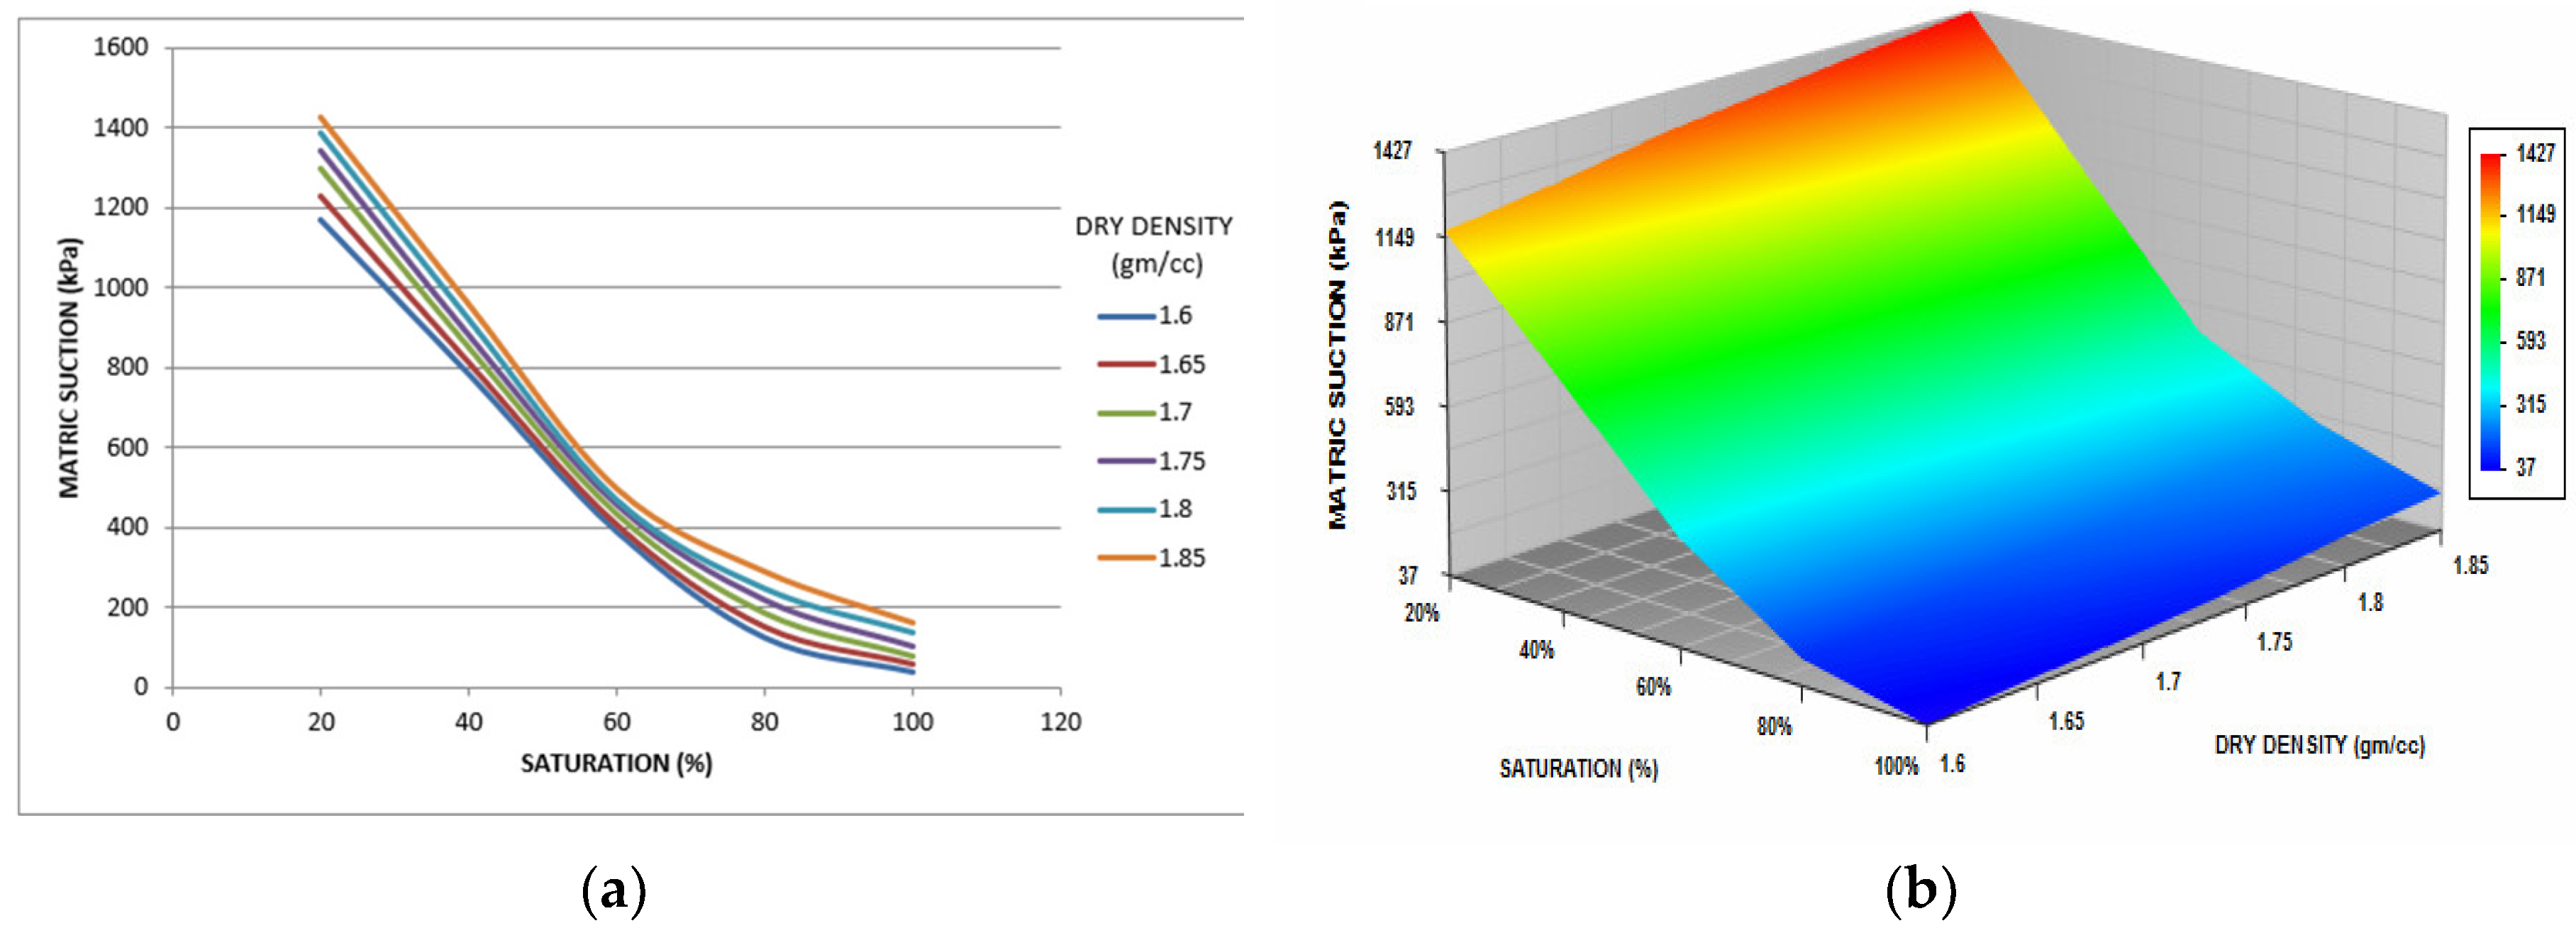
Table 4 shows matric suction results obtained by contact filter paper method at different densities and saturation of the soil samples.
Figure 8 (a) and (b) illustrate how the hydraulic characteristics of a CI soil are profoundly affected by factors such as dry density, moisture content, temperature, and, particularly, its capacity to retain water. The matric suction levels in CI soil are closely linked to its cohesiveness and its index properties. Additionally, these levels are influenced by the soil
’s degree of saturation and the dry density at which the samples have been remolded, where a higher cohesion in the soil contributes to greater matric suction due to the increased pressure needed to extract water. The role of soil density is also significant, with denser soils requiring more pressure for water removal, thereby exhibiting higher matric suction. This analysis brings to light the intricate interplay between the physical and chemical properties of CI soil and its water retention capabilities, emphasizing the critical nature of these elements in shaping the soil
’s response in terms of matric suction.
To verify the soil suction outcomes, the RETC software was utilized [
50]. RETC, or retention curve software, was created by Van Genuchten to facilitate the application of his mathematical models and constitutive equations relating to parameters like water content, diffusivity, soil suction, and conductivity. The software is particularly straightforward to use, with minimal input requirements and a user-friendly interface [
51]. It incorporates soil retention curve data based on the textural classification of soil, utilizing the mathematical framework developed by Van Genuchten in collaboration with colleagues including Burdin, Gardner, Van Genuchten, and Maulem. For the validation of the Soil Water Characteristic Curve (SWCC) of CI soil, the Van Genuchten model, optimized with Mualem
’s enhancements, was chosen. This model is renowned for its precision in modelling soil moisture retention by employing soil-specific parameters for a comprehensive analysis of hydraulic characteristics [
3,
50,
51].
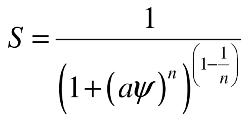
In Equation 1 for SWCC curve, parameter “a” is restricted to 0.000001(1/kPa) to 0.1 (1/kPa), “n” is restricted to minimum 1.05 to maximum 20.0, and the value of “m” parameter is restricted to 0.5 to 10.0, parameter “m”, and “n” are limited as like as vG model, and ψ is from 103 kPa to 106 kPa [
51]. The high effectiveness of R² values for different soil densities makes them a valuable design parameter for future research. RETC is particularly useful for validating soil specific SWCC curves using neural prediction [
3,
51]. Below are the user interface and steps of the RETC software and SWCC validation inputs [
50].
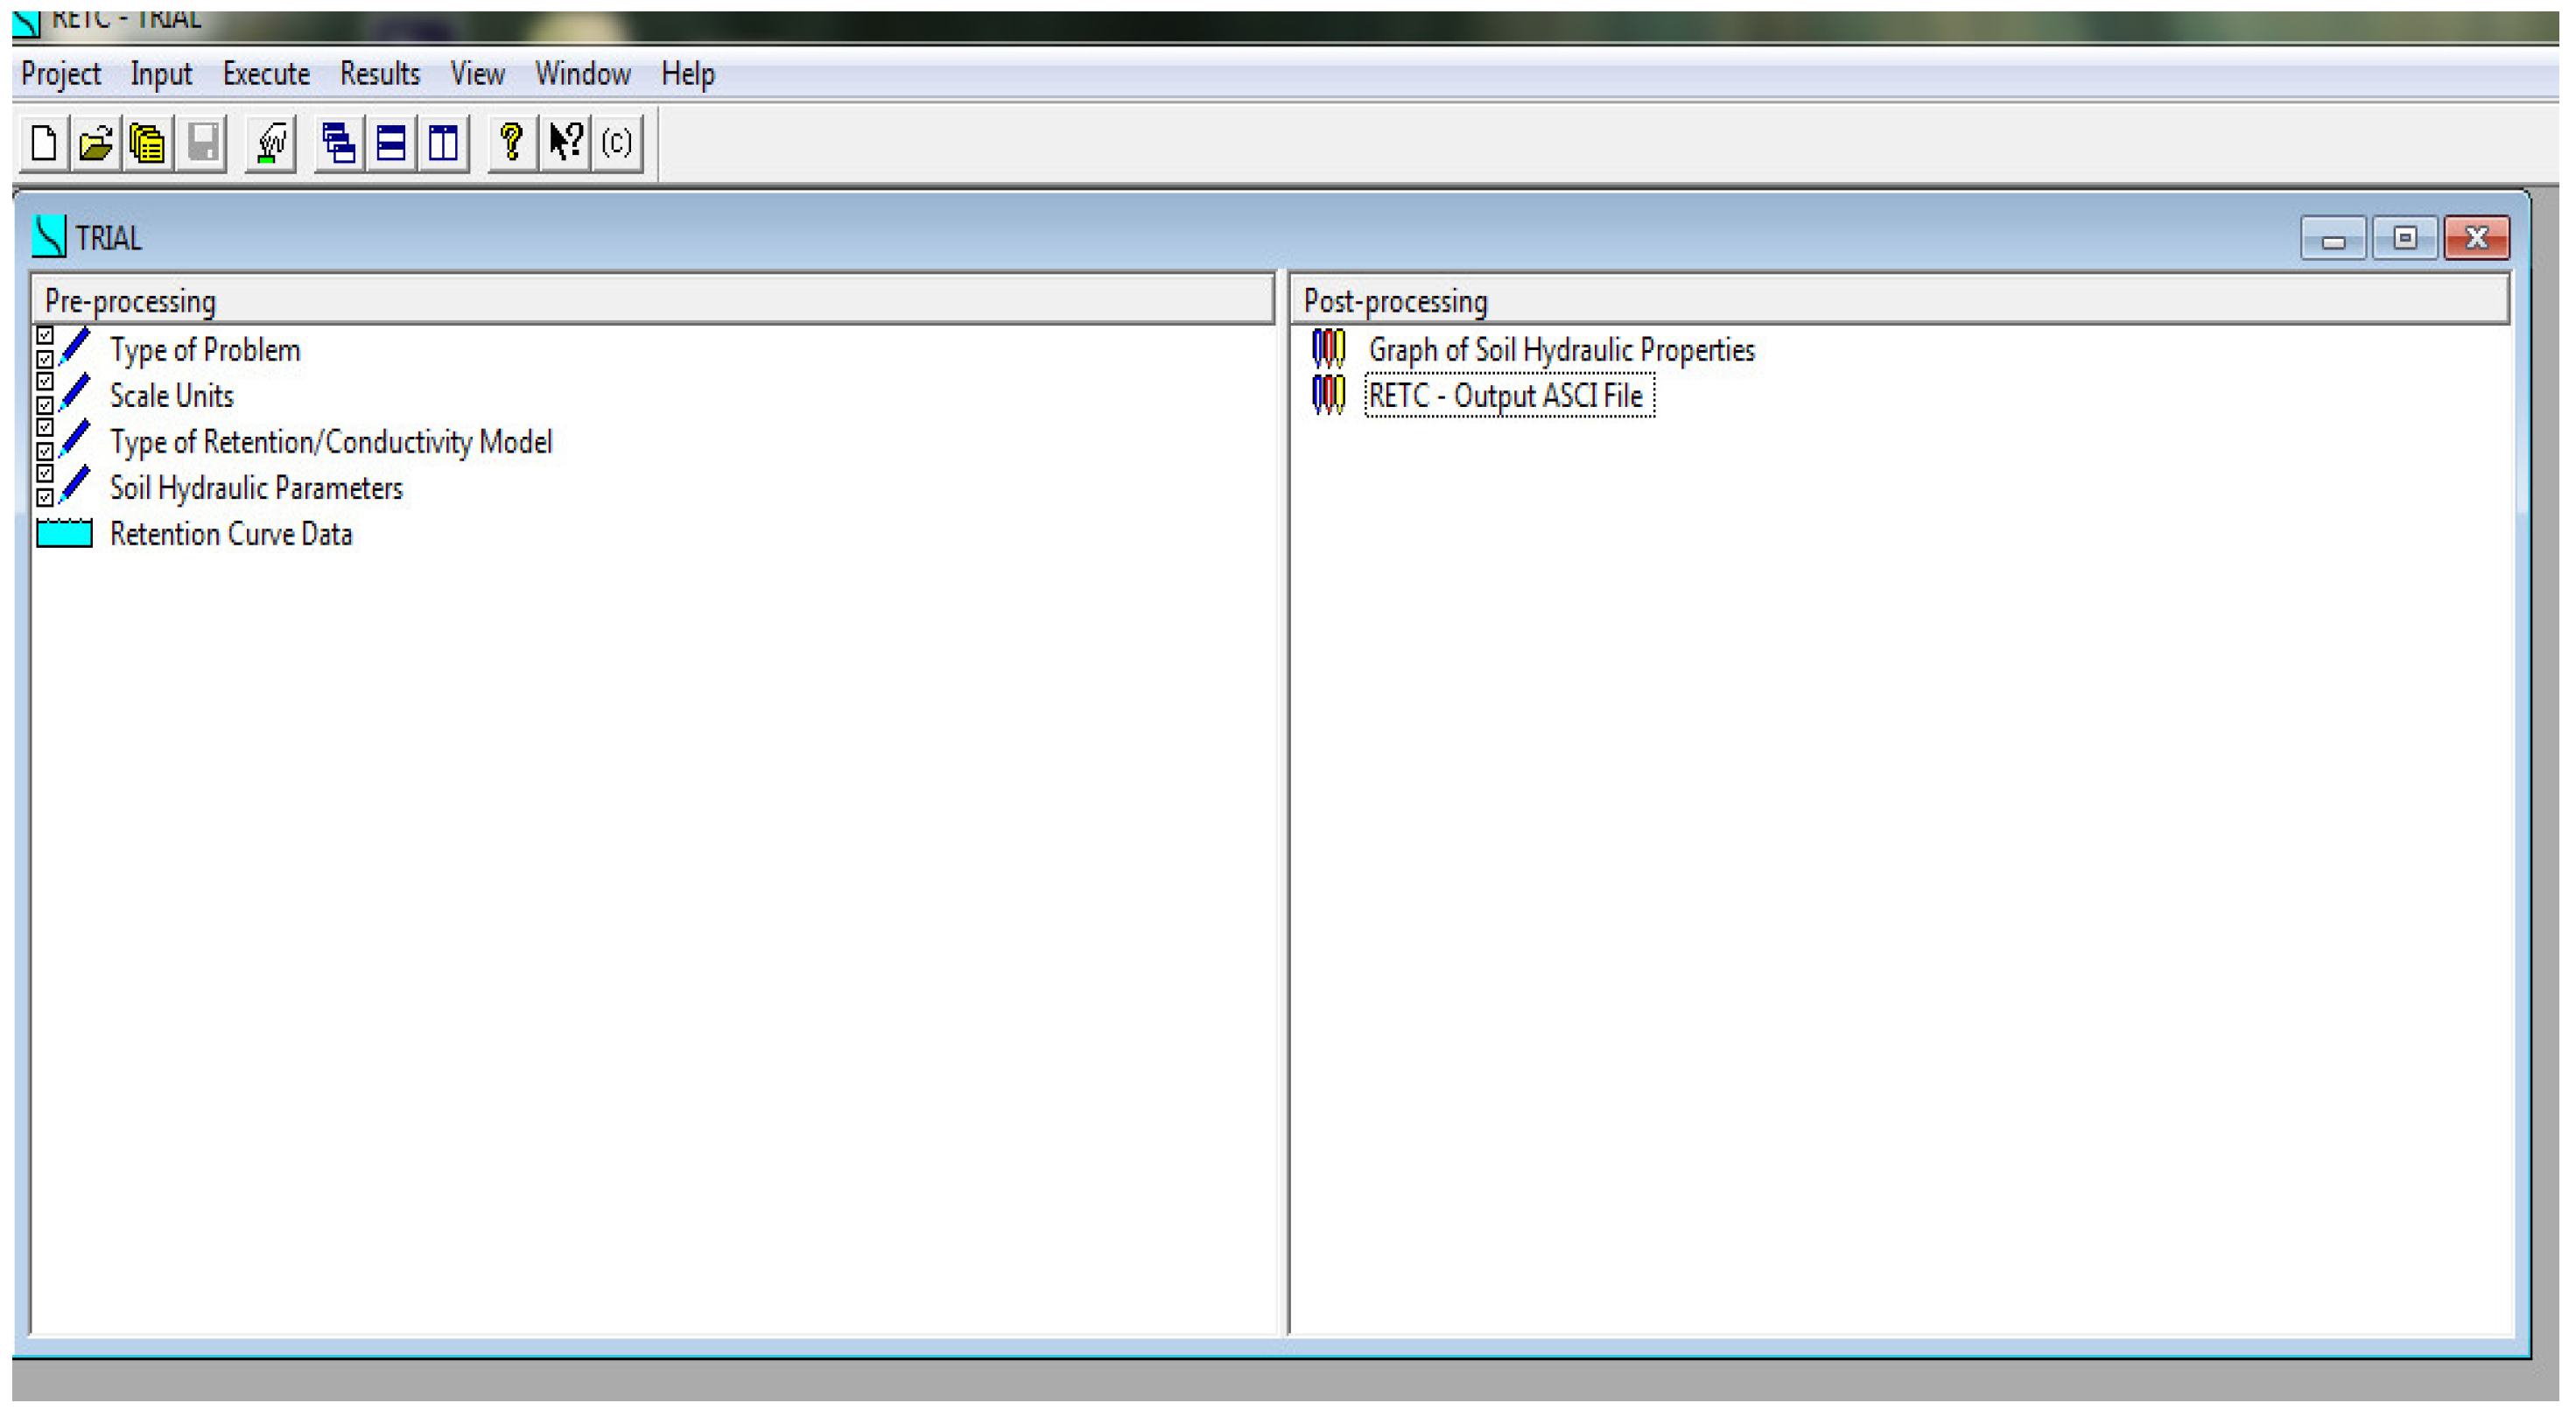
Figure 9 shows simple and basic look of RETC with its fewer input options.
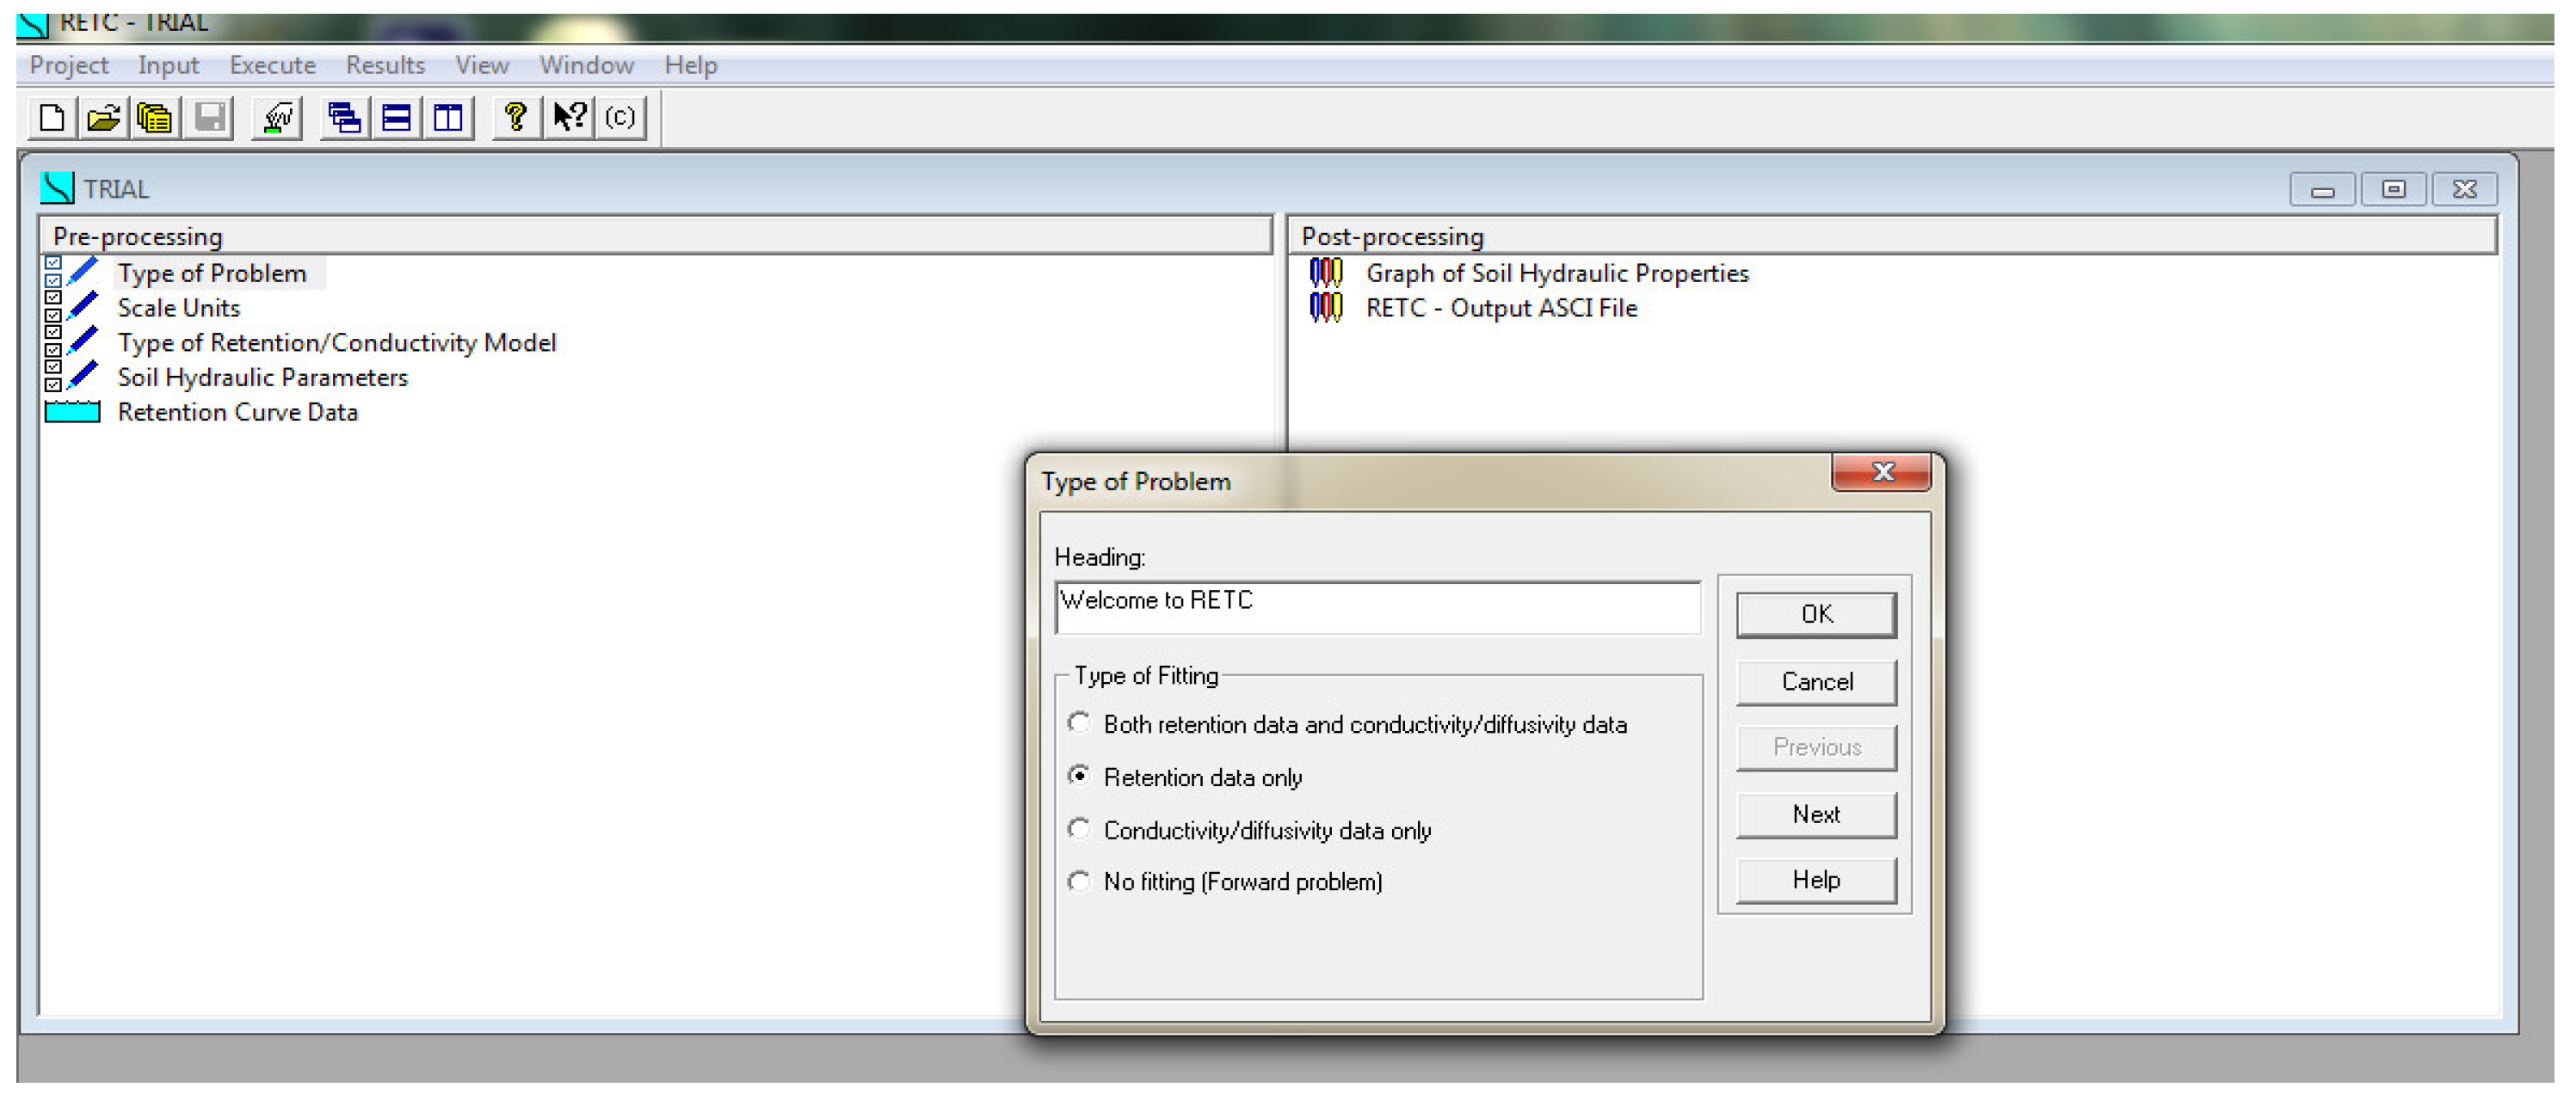
Figure 10 shows need of defining the problem such as retention data and conductivity data etc. [
50,
51].
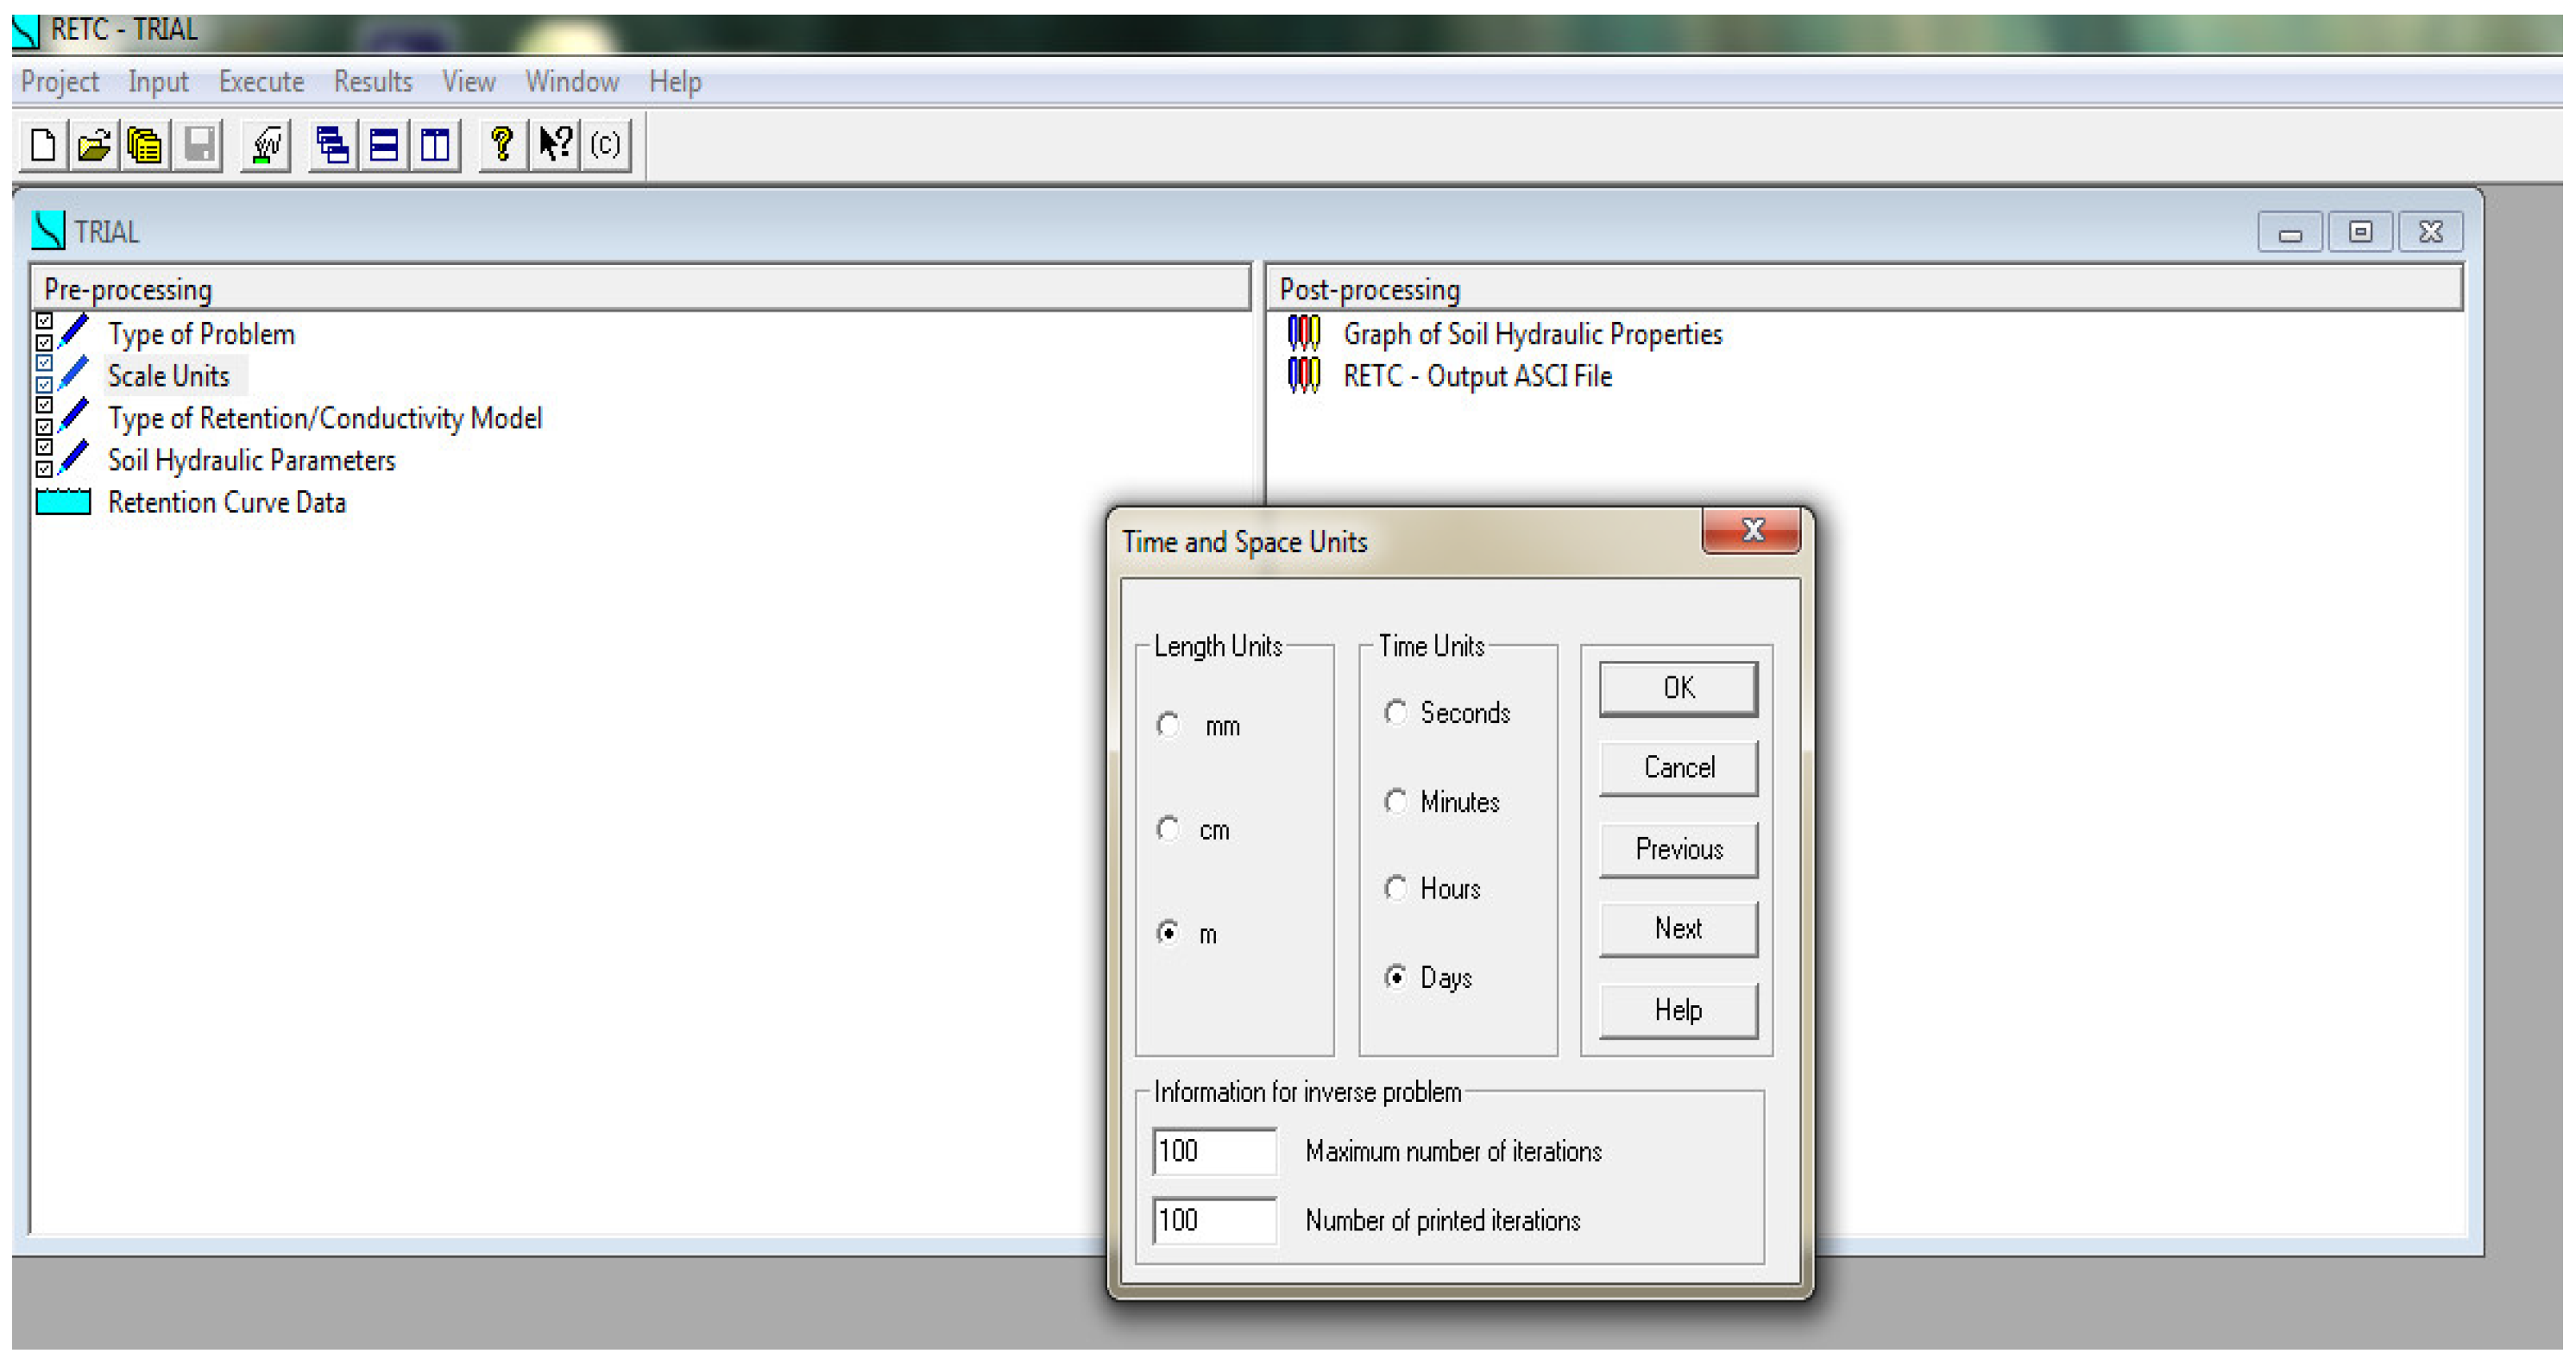
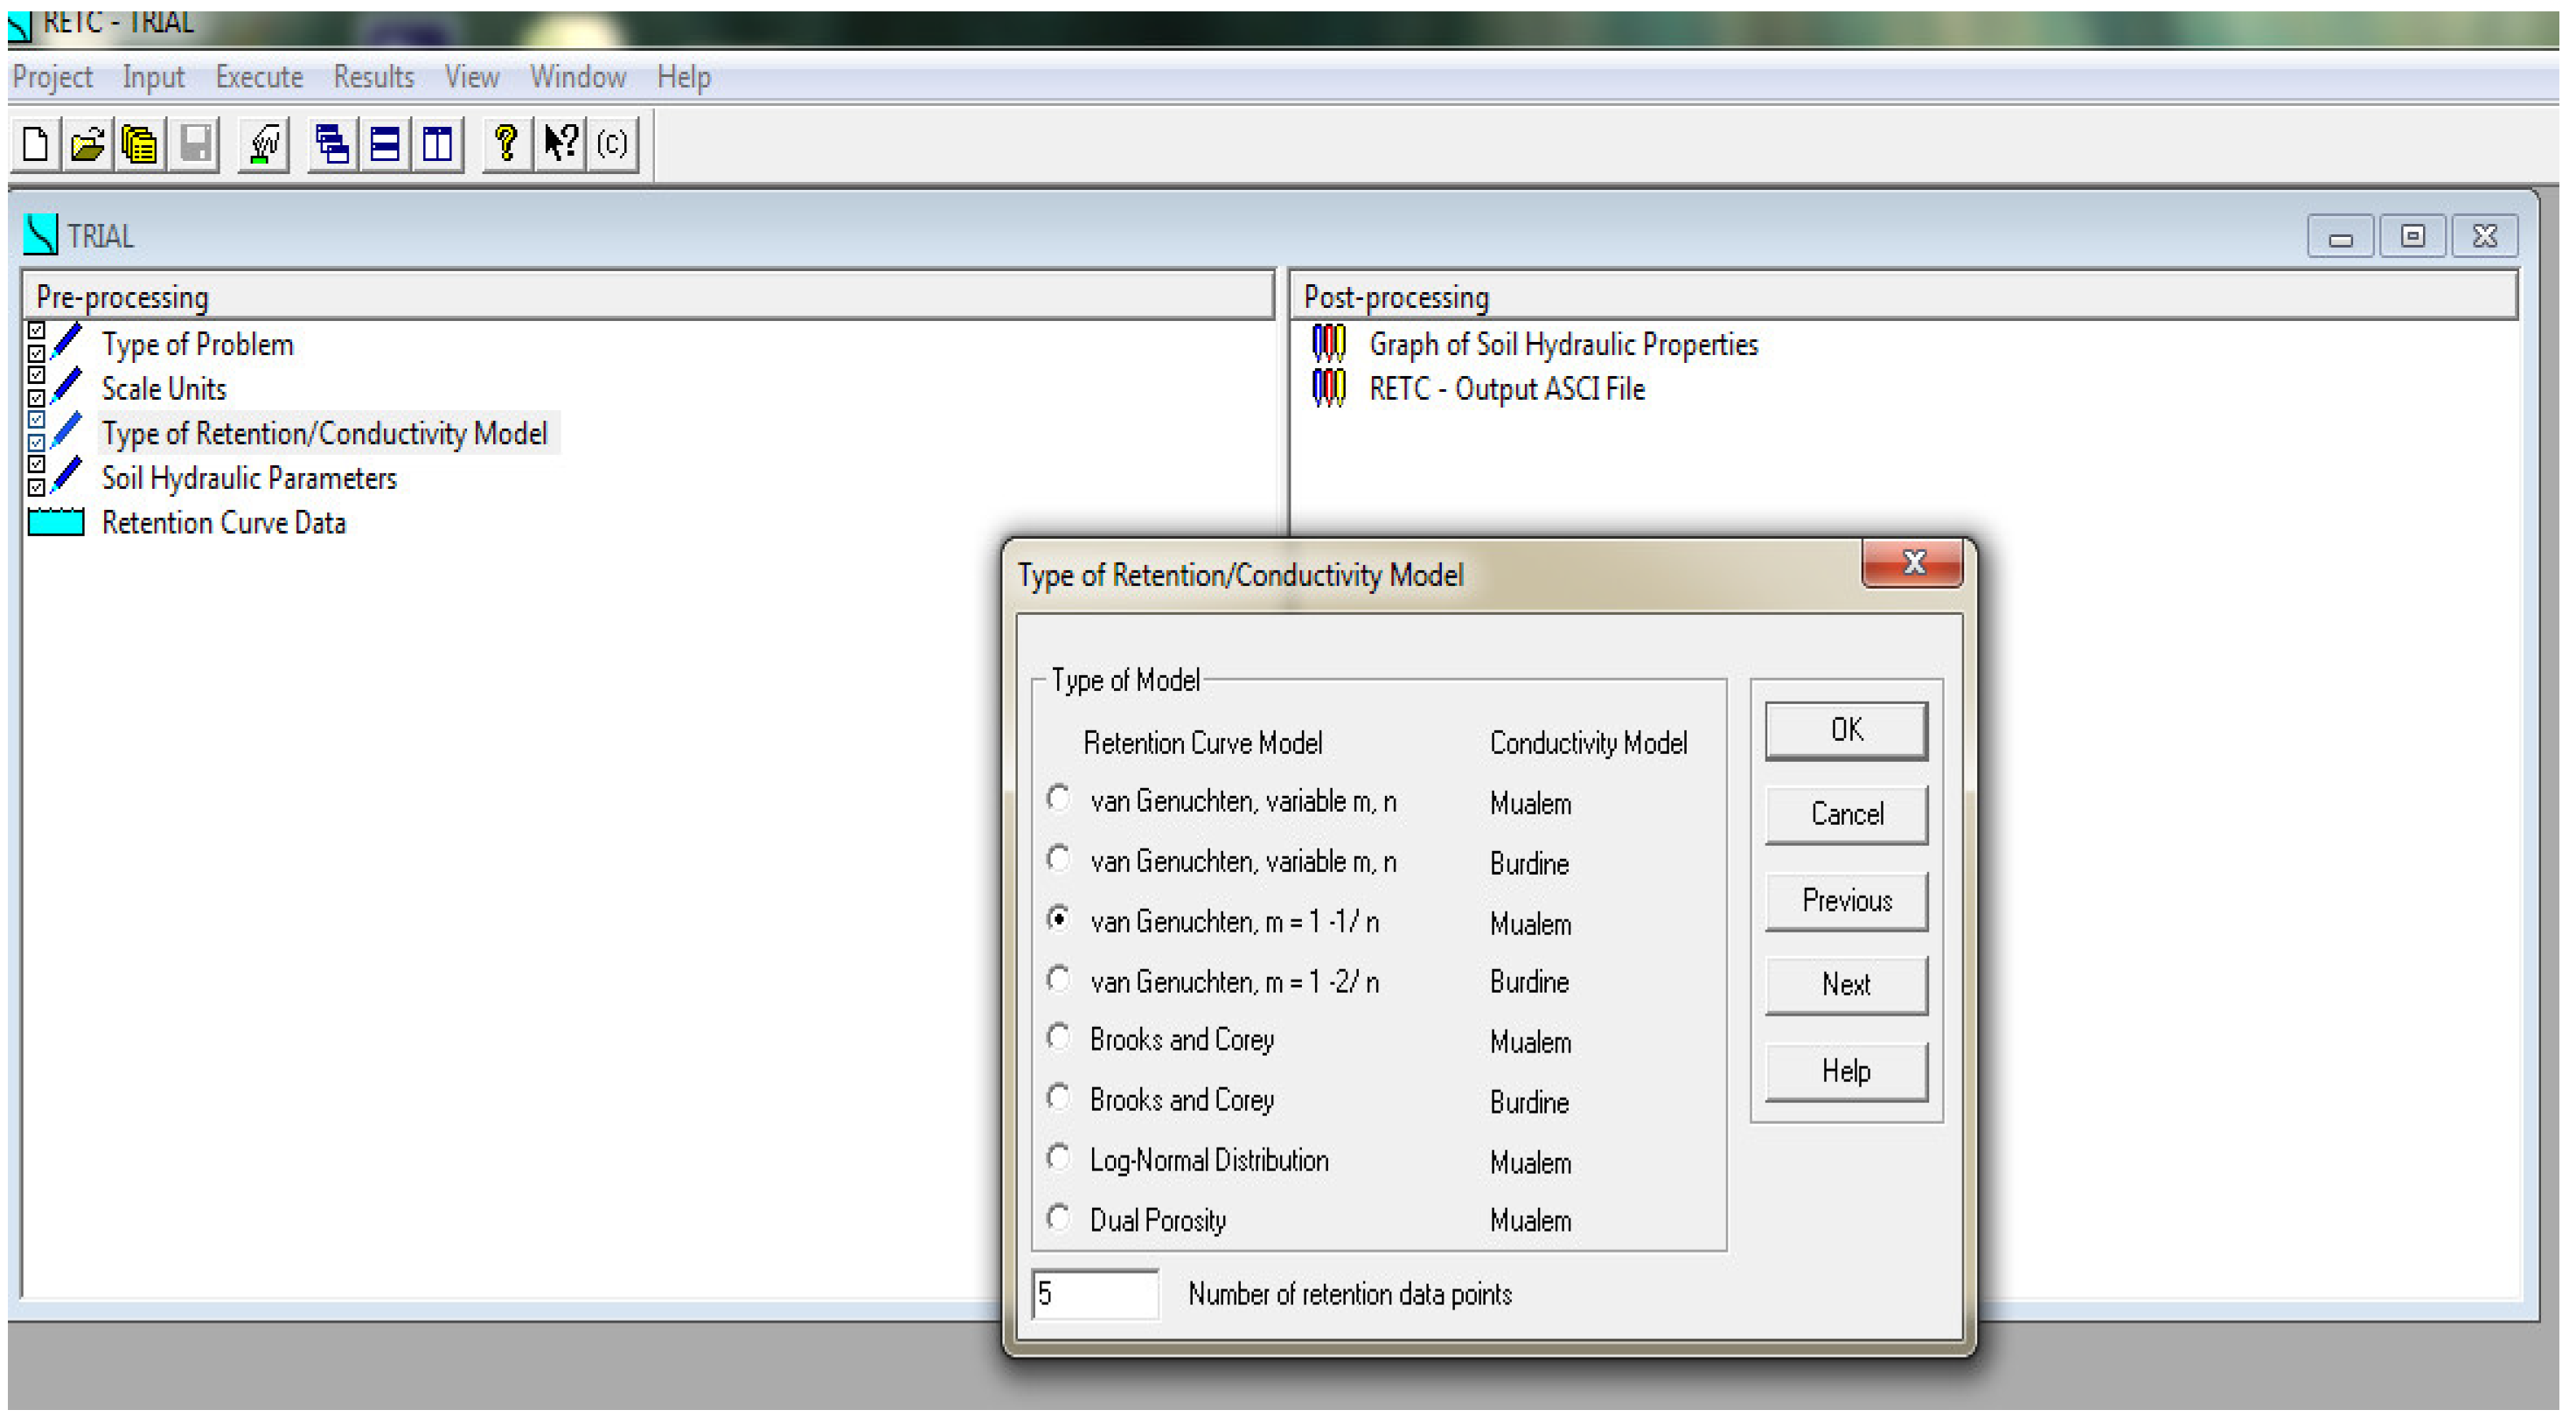
Figure 11 shows the selection of the scale parameters and
Figure 12 shows selection of the retention or conductivity models such as van Genuchten model with different fitting parameters and Brooks and Corey models. It gives all models that Van Genuchten developed such as vG - Maulem Model, vG – Burdine models in terms of best fitting of fitting parameters. Additionally, the number of data points that one can have is input into the software [
50,
51].
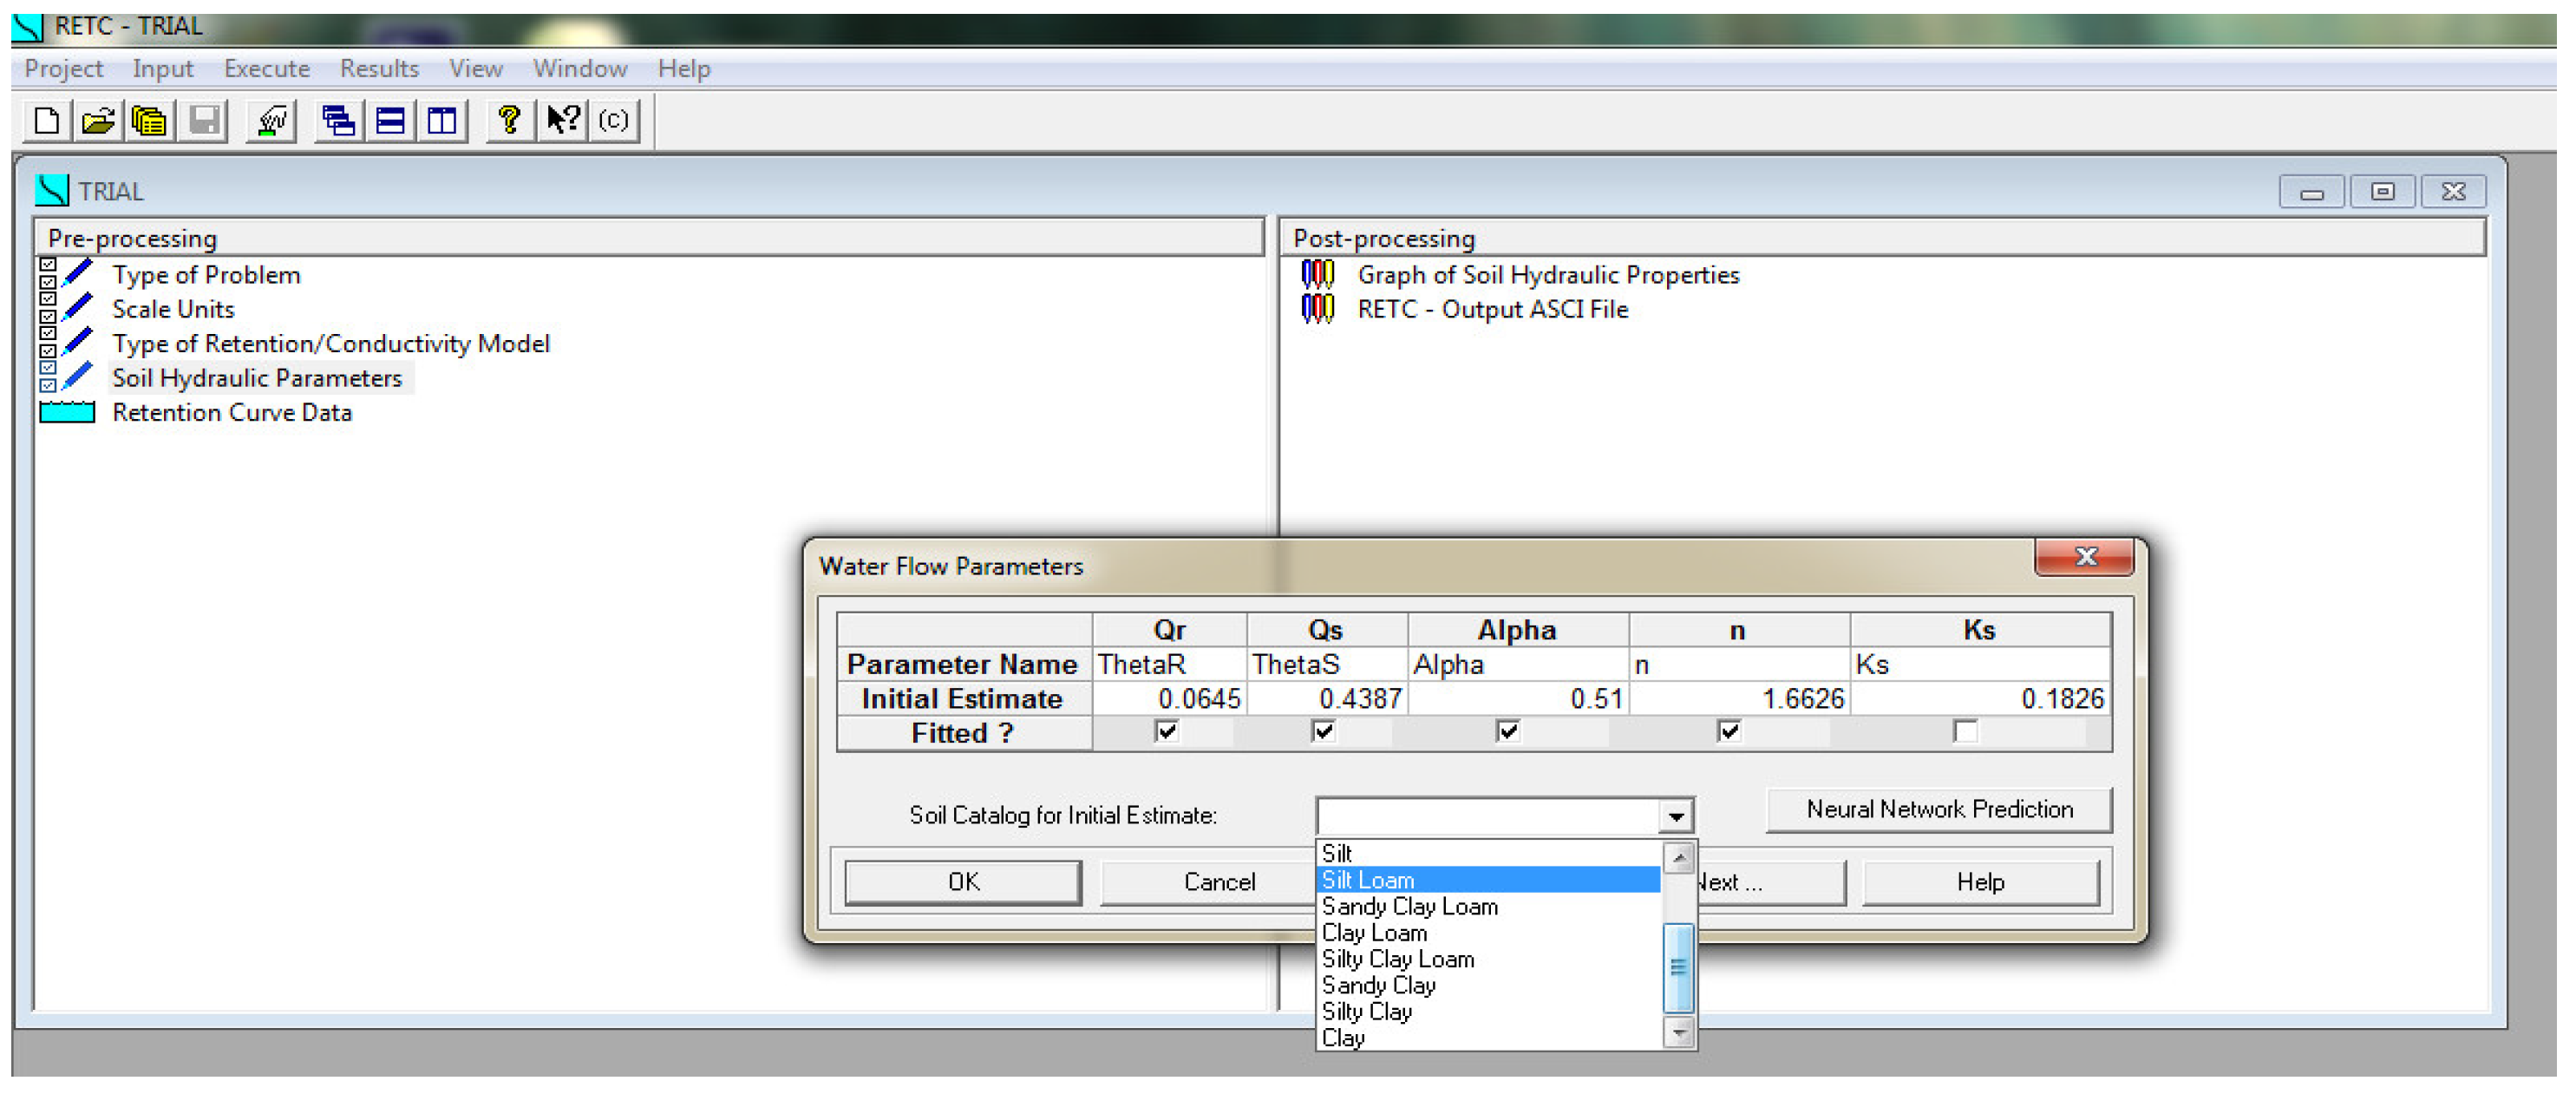
Figure 13 indicates the process of choosing soil according to its textural classification for which Soil Water Characteristic Curve (SWCC) validations are required. It automatically selects all necessary fitting parameters based on the input data provided.
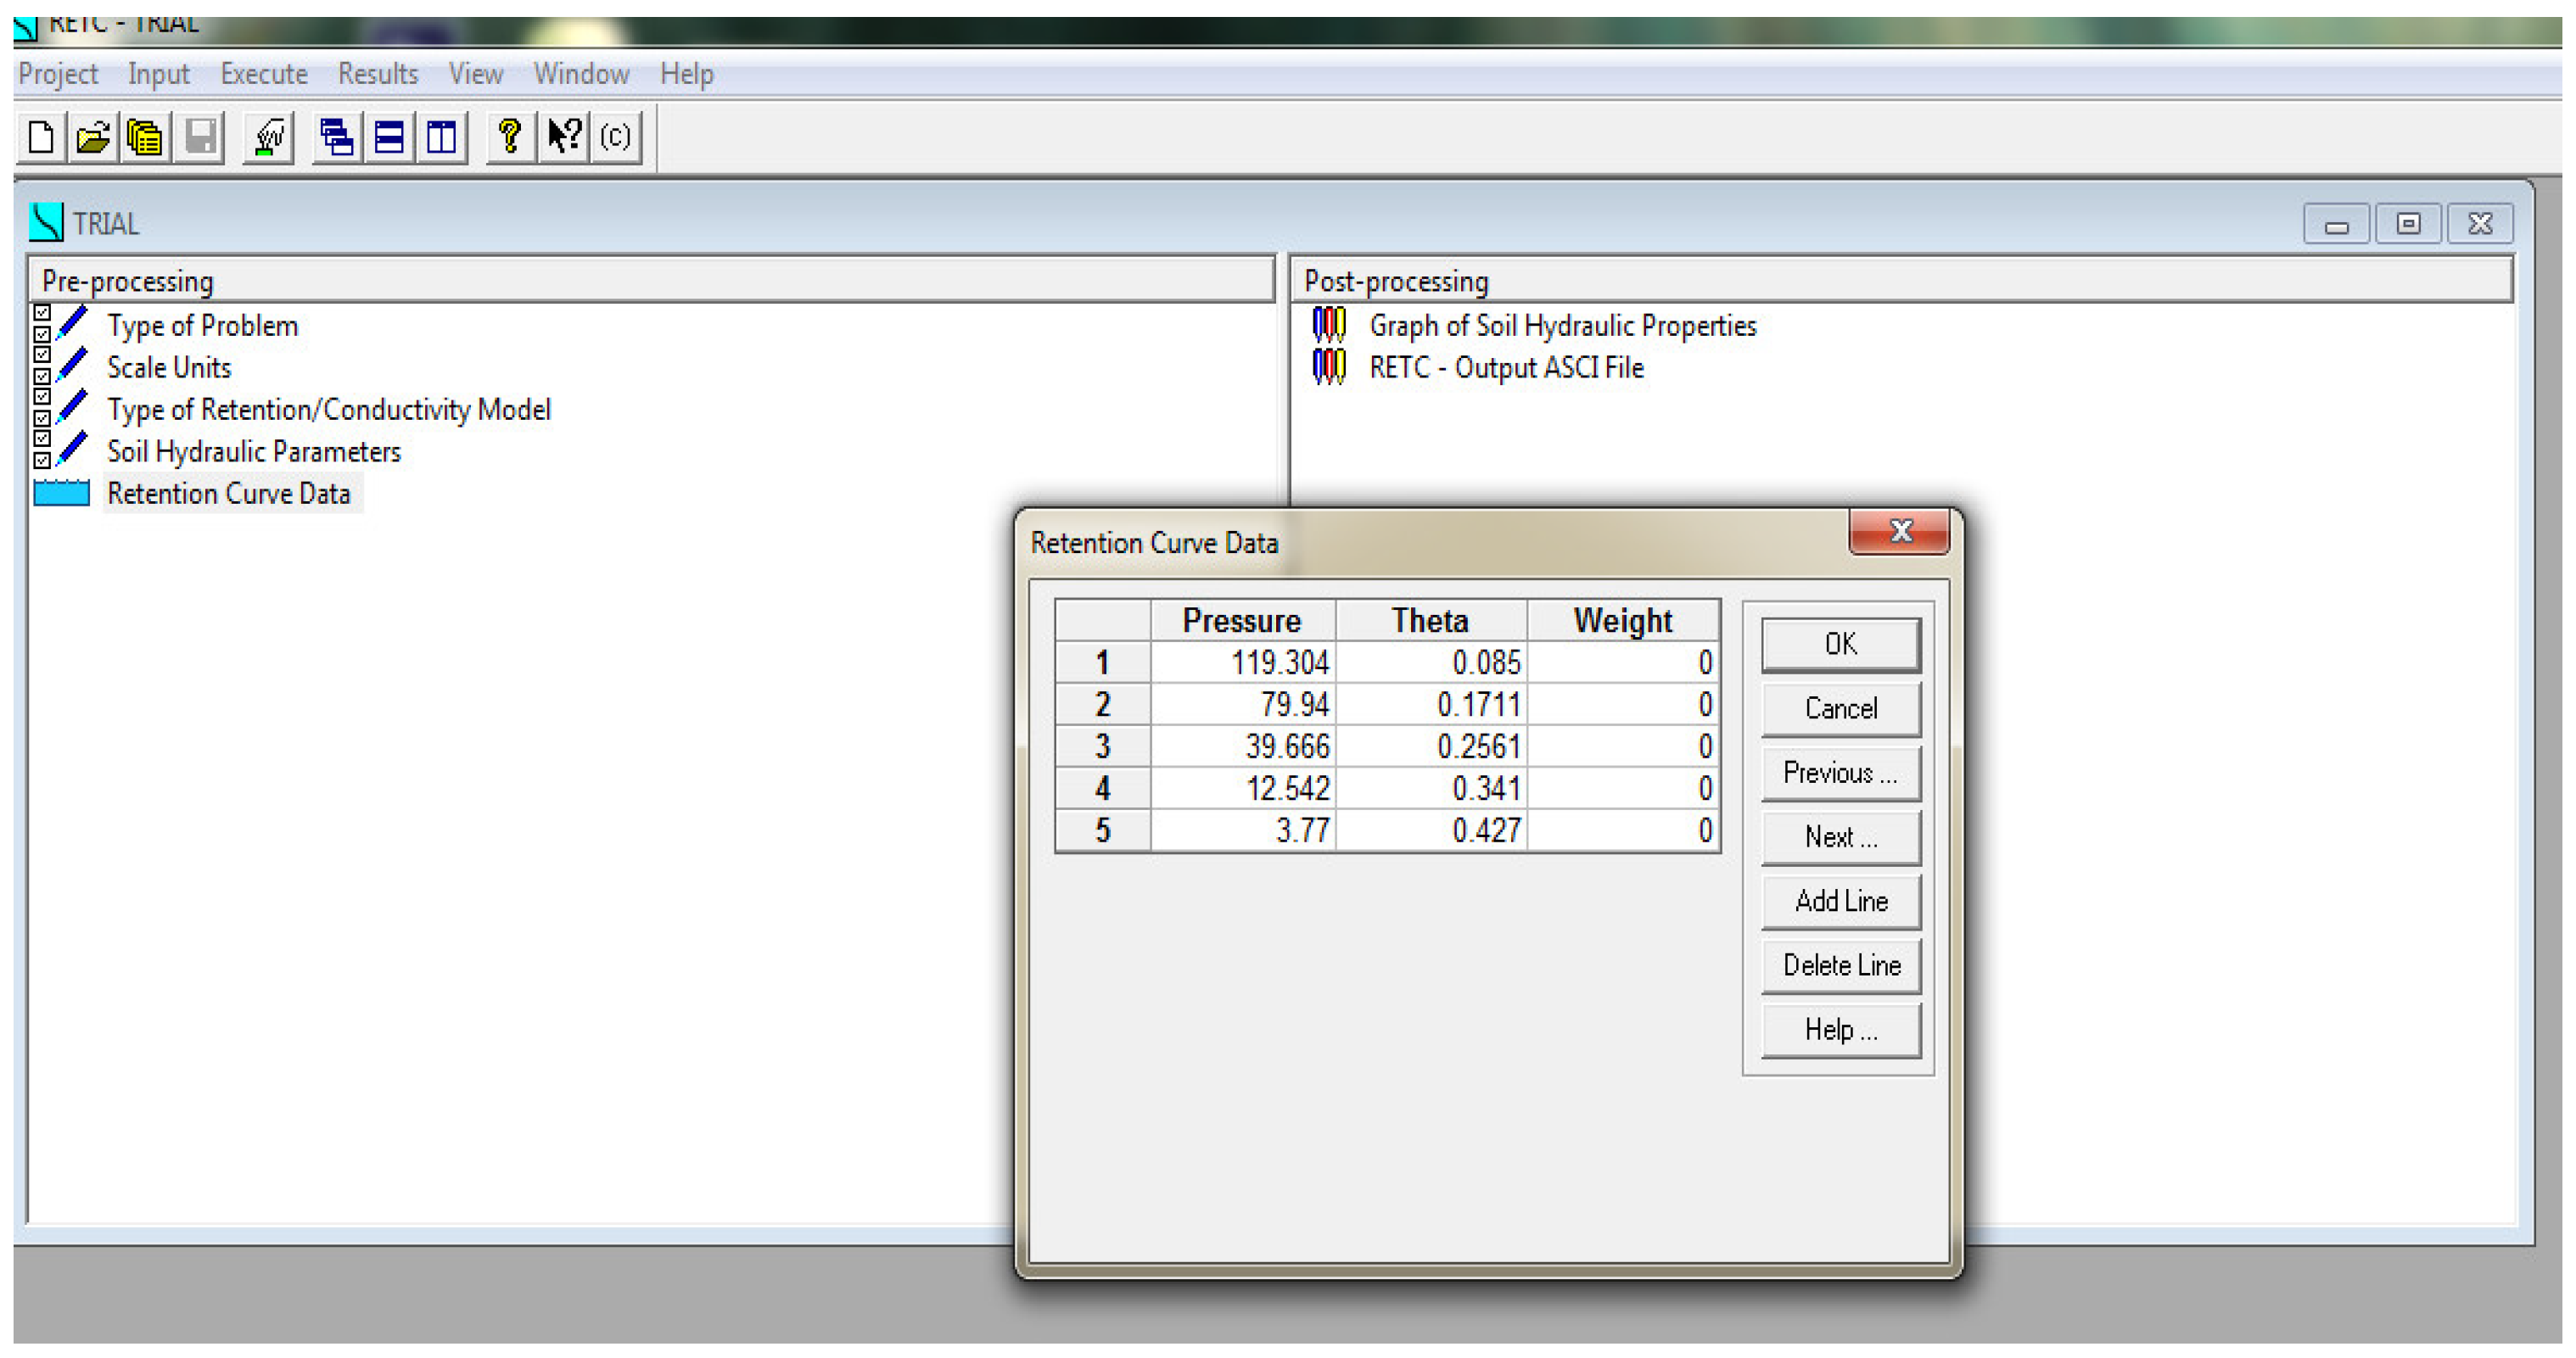
Figure 14 shows the data that is needed to be input in terms of soil suction and volumetric water content [
50,
51].
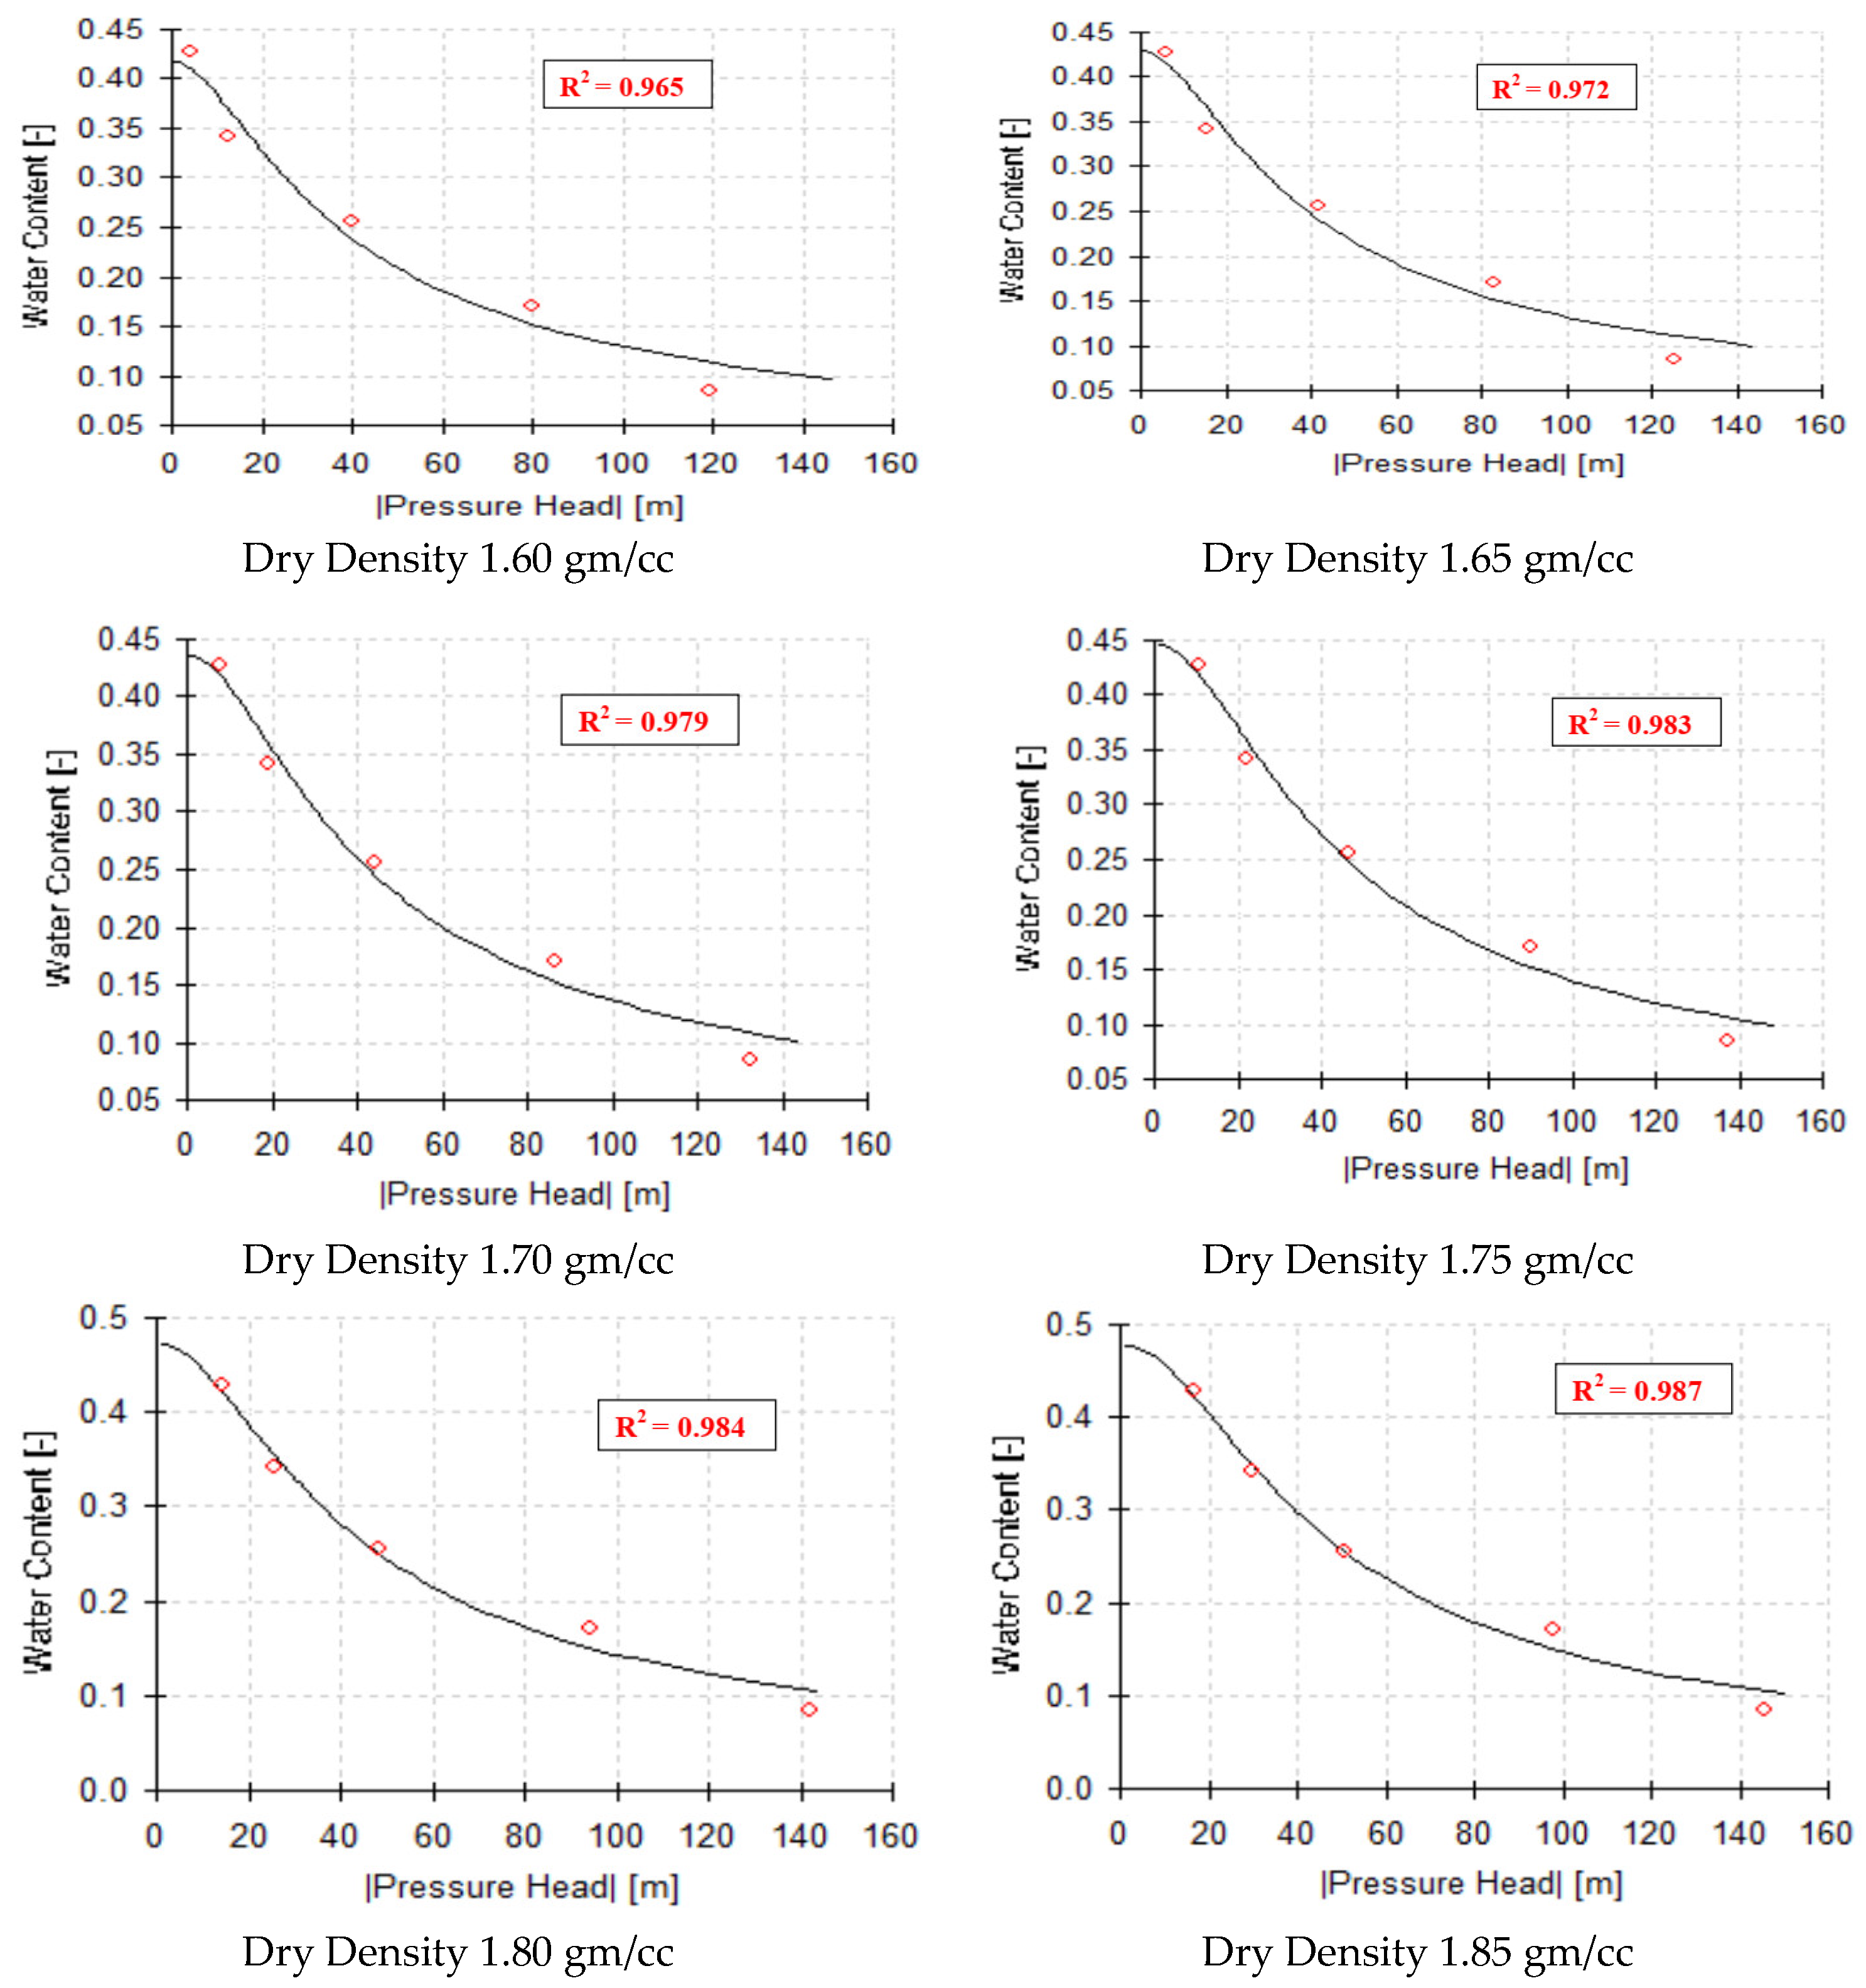
Figure 15 shows the validation results with corresponding R
2 values for each SWCC curves at different densities and saturation. An R
2 value approaching 1.0 indicates higher precision in soil suction measurements conducted in the laboratory. The presented graphs reveal R
2 values ranging from 0.96 to 0.98, suggesting that the Soil-Water Characteristic Curves (SWCC) derived from soil suction tests across various densities and saturation levels are approximately 96%-98% precise. Such graphs serve as reliable SWCC curves for subsequent analyses in unsaturated soil mechanics.
3.2. Preparation of Unsaturated soil Specimens for UCS Tests
To investigate the effect of microwave drying on soil specimens, a comprehensive series of tests were conducted using the collected soil samples. These specimens were exposed to microwave heating at different temperature settings (40 ˚C, 100 ˚C, 140 ˚C, 180 ˚C) and without any pre-heating, to observe their reactions. The initial phase involved using ceramic teacups filled with soil to replicate field moisture conditions, aiming to study the microwave oven heating behavior. Subsequent experiments focused on remolded soil specimens with specific dimensions (38 mm diameter and 76 mm height) and mixed soil and water at least 24 hours before casting in 27 °C controlled chamber to ensure uniform moisture distribution. An average bulk weight of between 172 and 190 grams is used. The goal was to establish a correlation between the desaturation process of the specimen and the duration of microwave exposure.
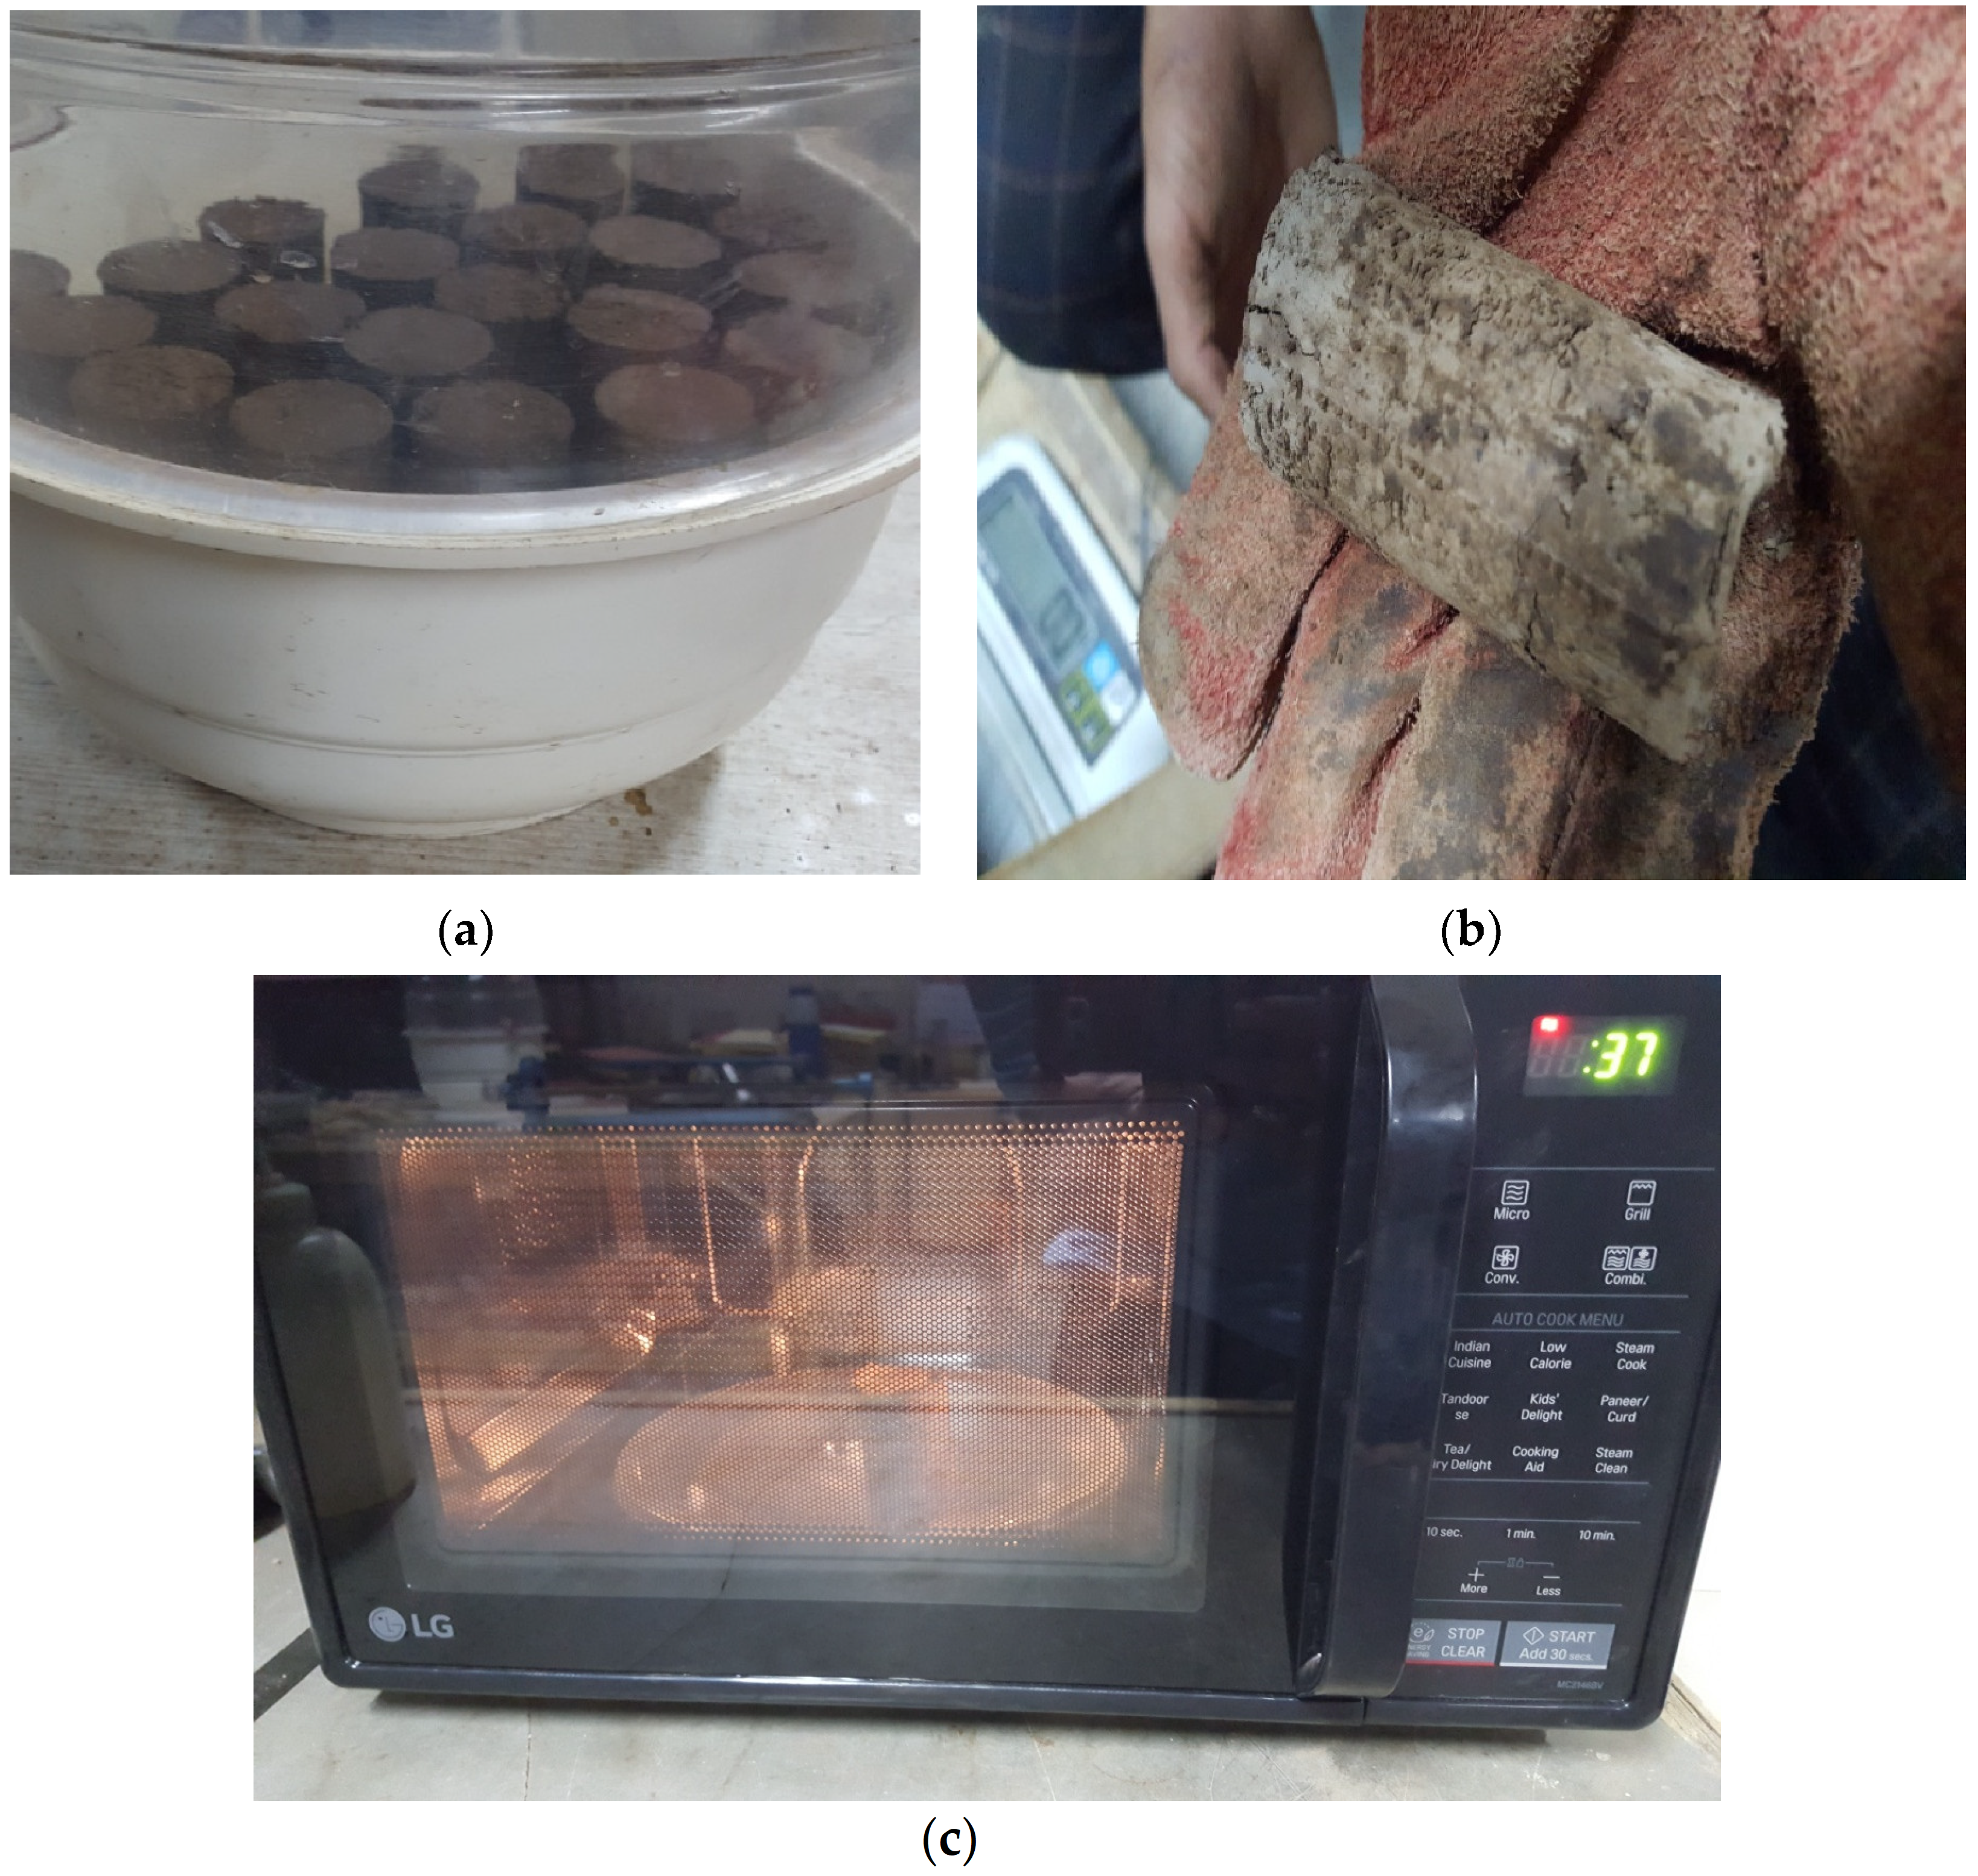
Figure 16 (a) shows the soil specimens prepared for the microwave drying in a desiccator to maintain soil moisture conditions.
Figure 16 (b) shows the microwave-dried soil specimens of acceptable quality.
Figure 16 (c) shows the soil specimen in a microwave oven for even drying. Tests were also extended to test around 2000 specimens conforming to standard triaxial test dimensions to evaluate uniform drying, the penetration depth of microwave radiation into the soil sample, and optimal specimen placement in the microwave oven. Optimal results from microwave oven drying are achieved when the soil sample is positioned at the centre of the microwave’s turntable. Results indicated that microwaves could uniformly dry the specimens, both at the surface and internally. The mechanism involves microwave radiation penetrating the specimen, heating the water molecules, which then evaporate, leaving behind vacuumed pores that allow atmospheric air to enter, preparing the soil for subsequent shear tests.
The study meticulously recorded the weight loss due to desaturation to identify the time required to achieve the desired unsaturation level. Moreover, extensive trials examined the influence of the specimen’s shape, size, and volume on the effectiveness of microwave penetration and heating, aiming to understand the fundamental principles of microwave soil drying.
The experimentation adopted two main microwaving approaches: the one-point microwaving method, where each of several specimens was subjected to a predefined microwaving time, and the cumulative microwaving method, where a single specimen was progressively dried to achieve complete desaturation. The latter method was found to be more accurate and effective. Through these meticulous efforts, a direct relationship between the rates of desaturation of CI soil specimens and the microwaving duration was established, providing valuable insights for preparing soil samples for detailed analysis of their shear strength properties.
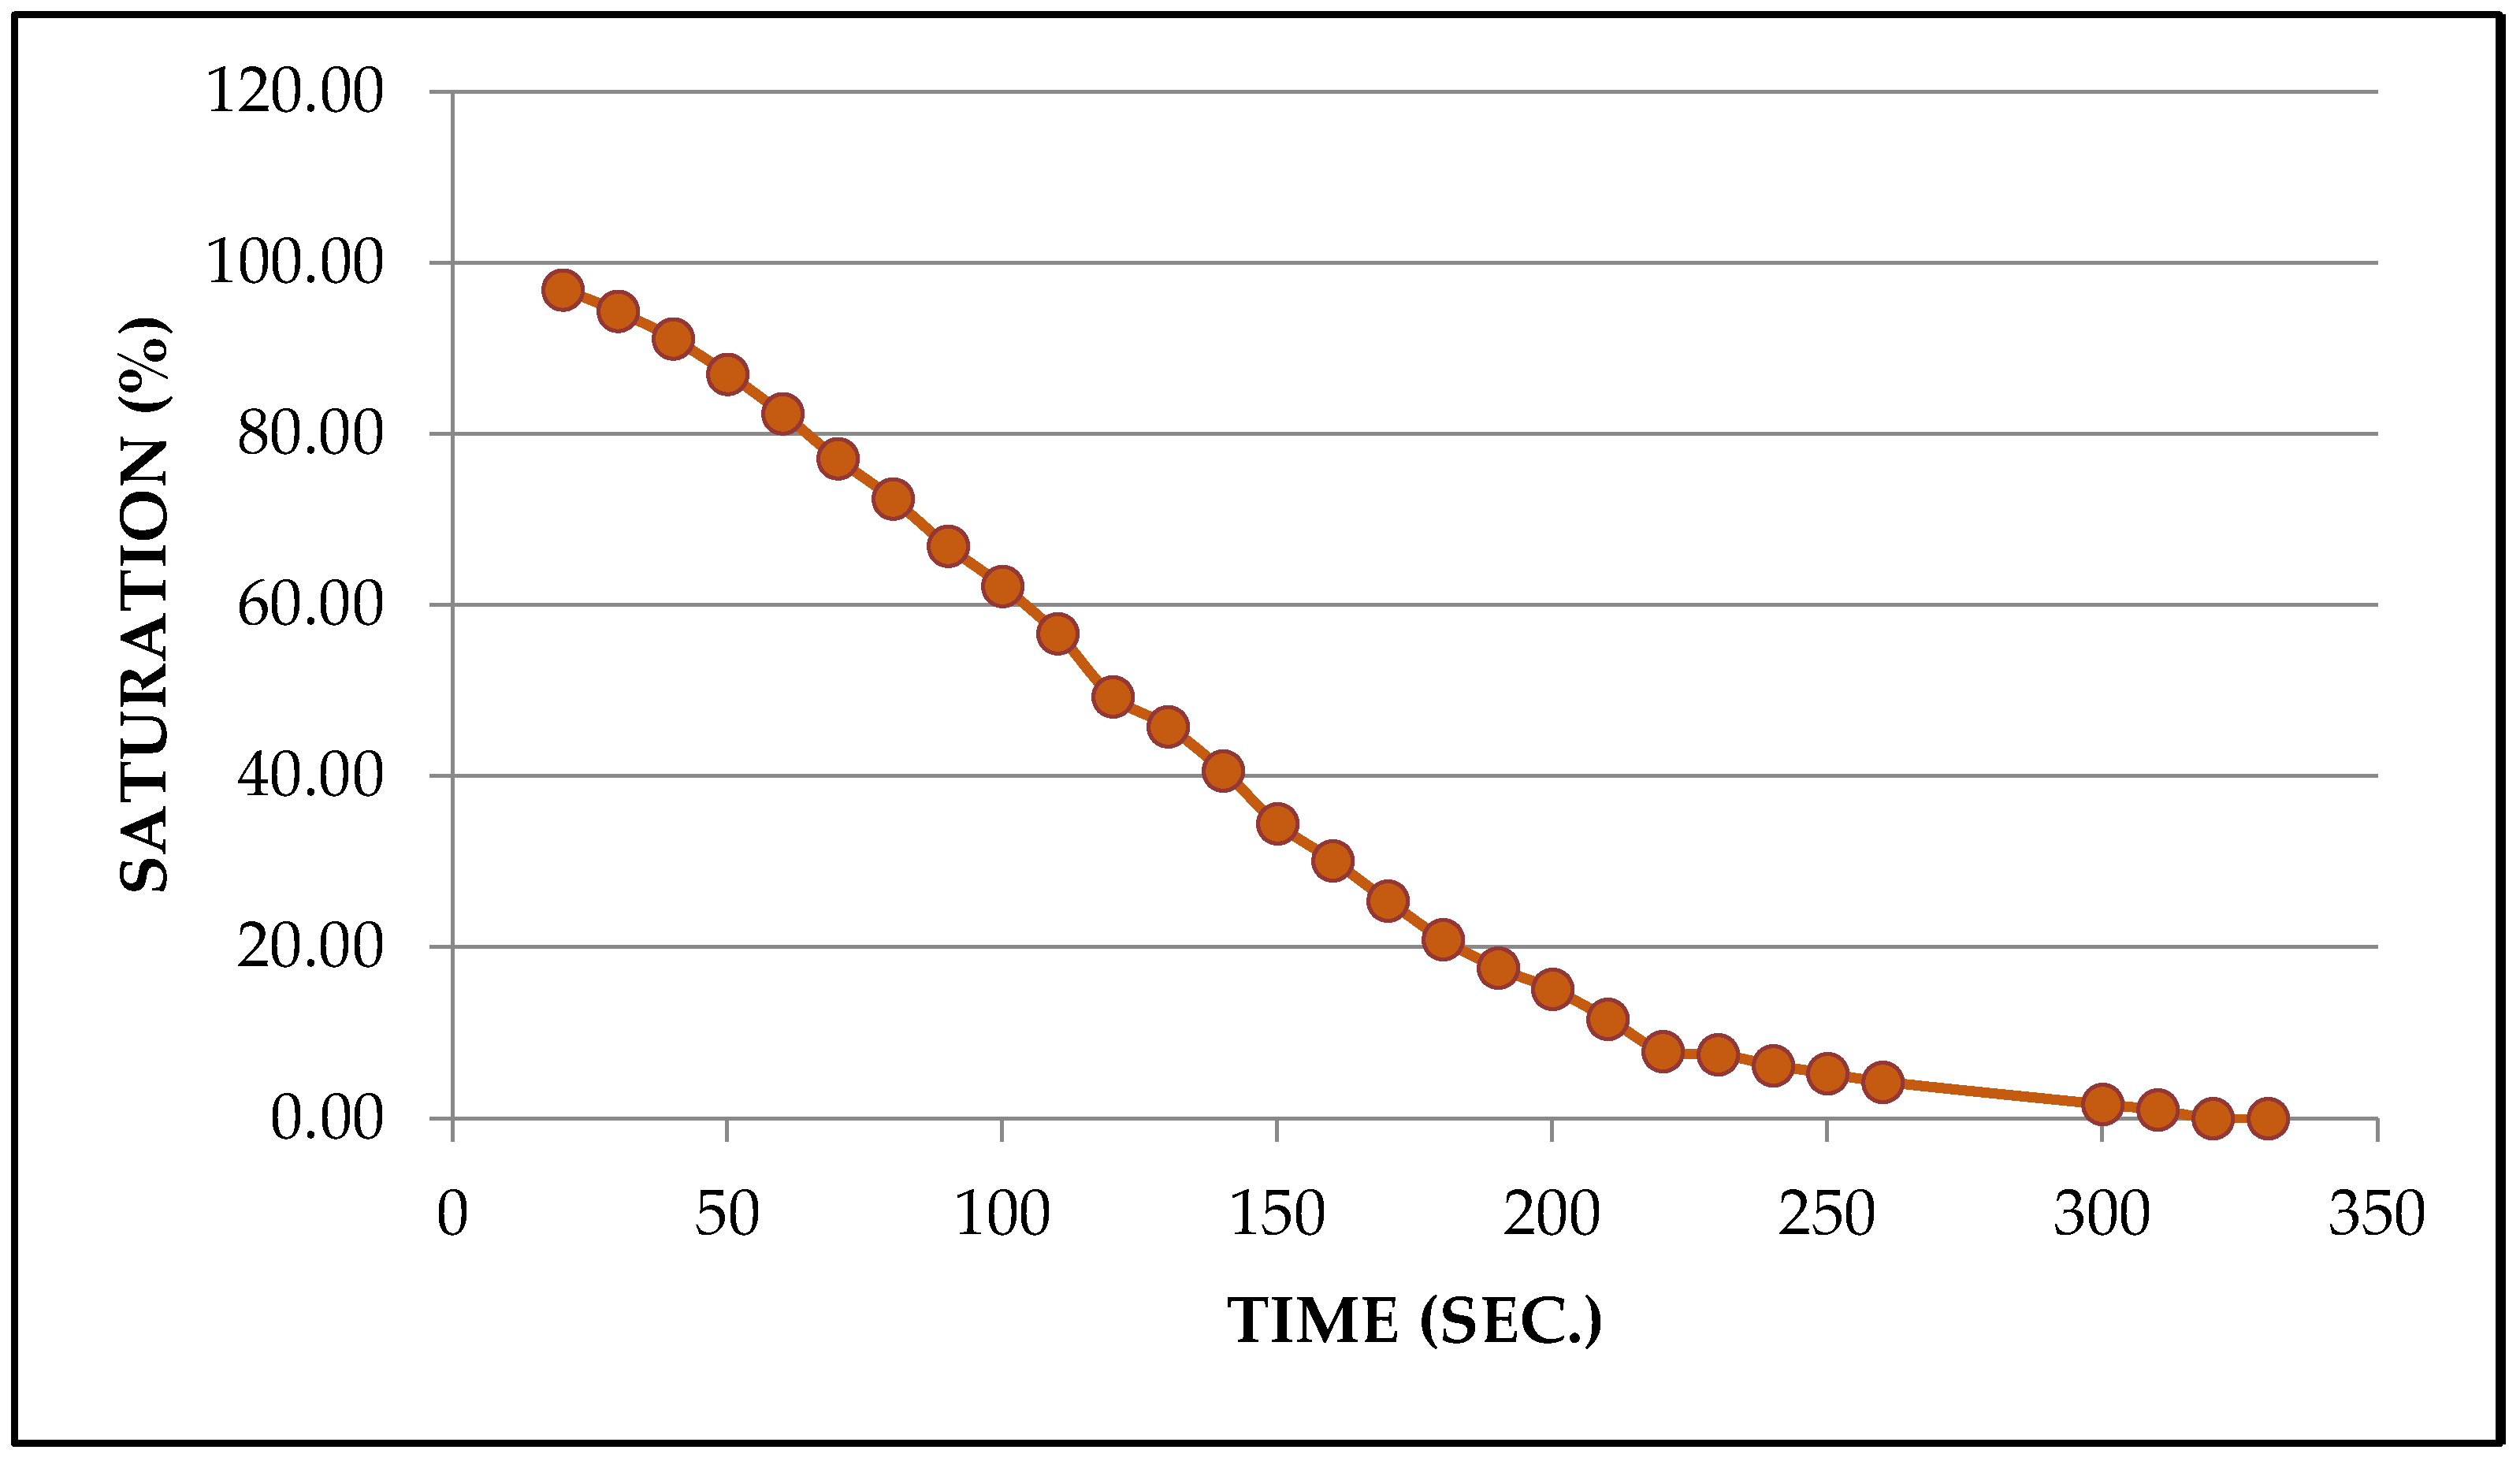
Figure 17 shows the relation between loss of moisture content and time taken for drying for soil specimens used for unconfined compressive strength tests. Based on the SWCC curve produced from soil suction assessments, alongside the confirmation through RETC validation and the linkage between the loss of moisture and the time required for drying, the accuracy of the obtained drying SWCC curve is convincingly demonstrated.
The relationship mentioned above was established under the operating conditions specified in
Table 5 for the microwave oven, in accordance with ASTM D4643 – 08 [
20].
3.3. Preparation of Unsaturated soil Specimens for UCS Tests
The tools and equipment utilized are detailed in
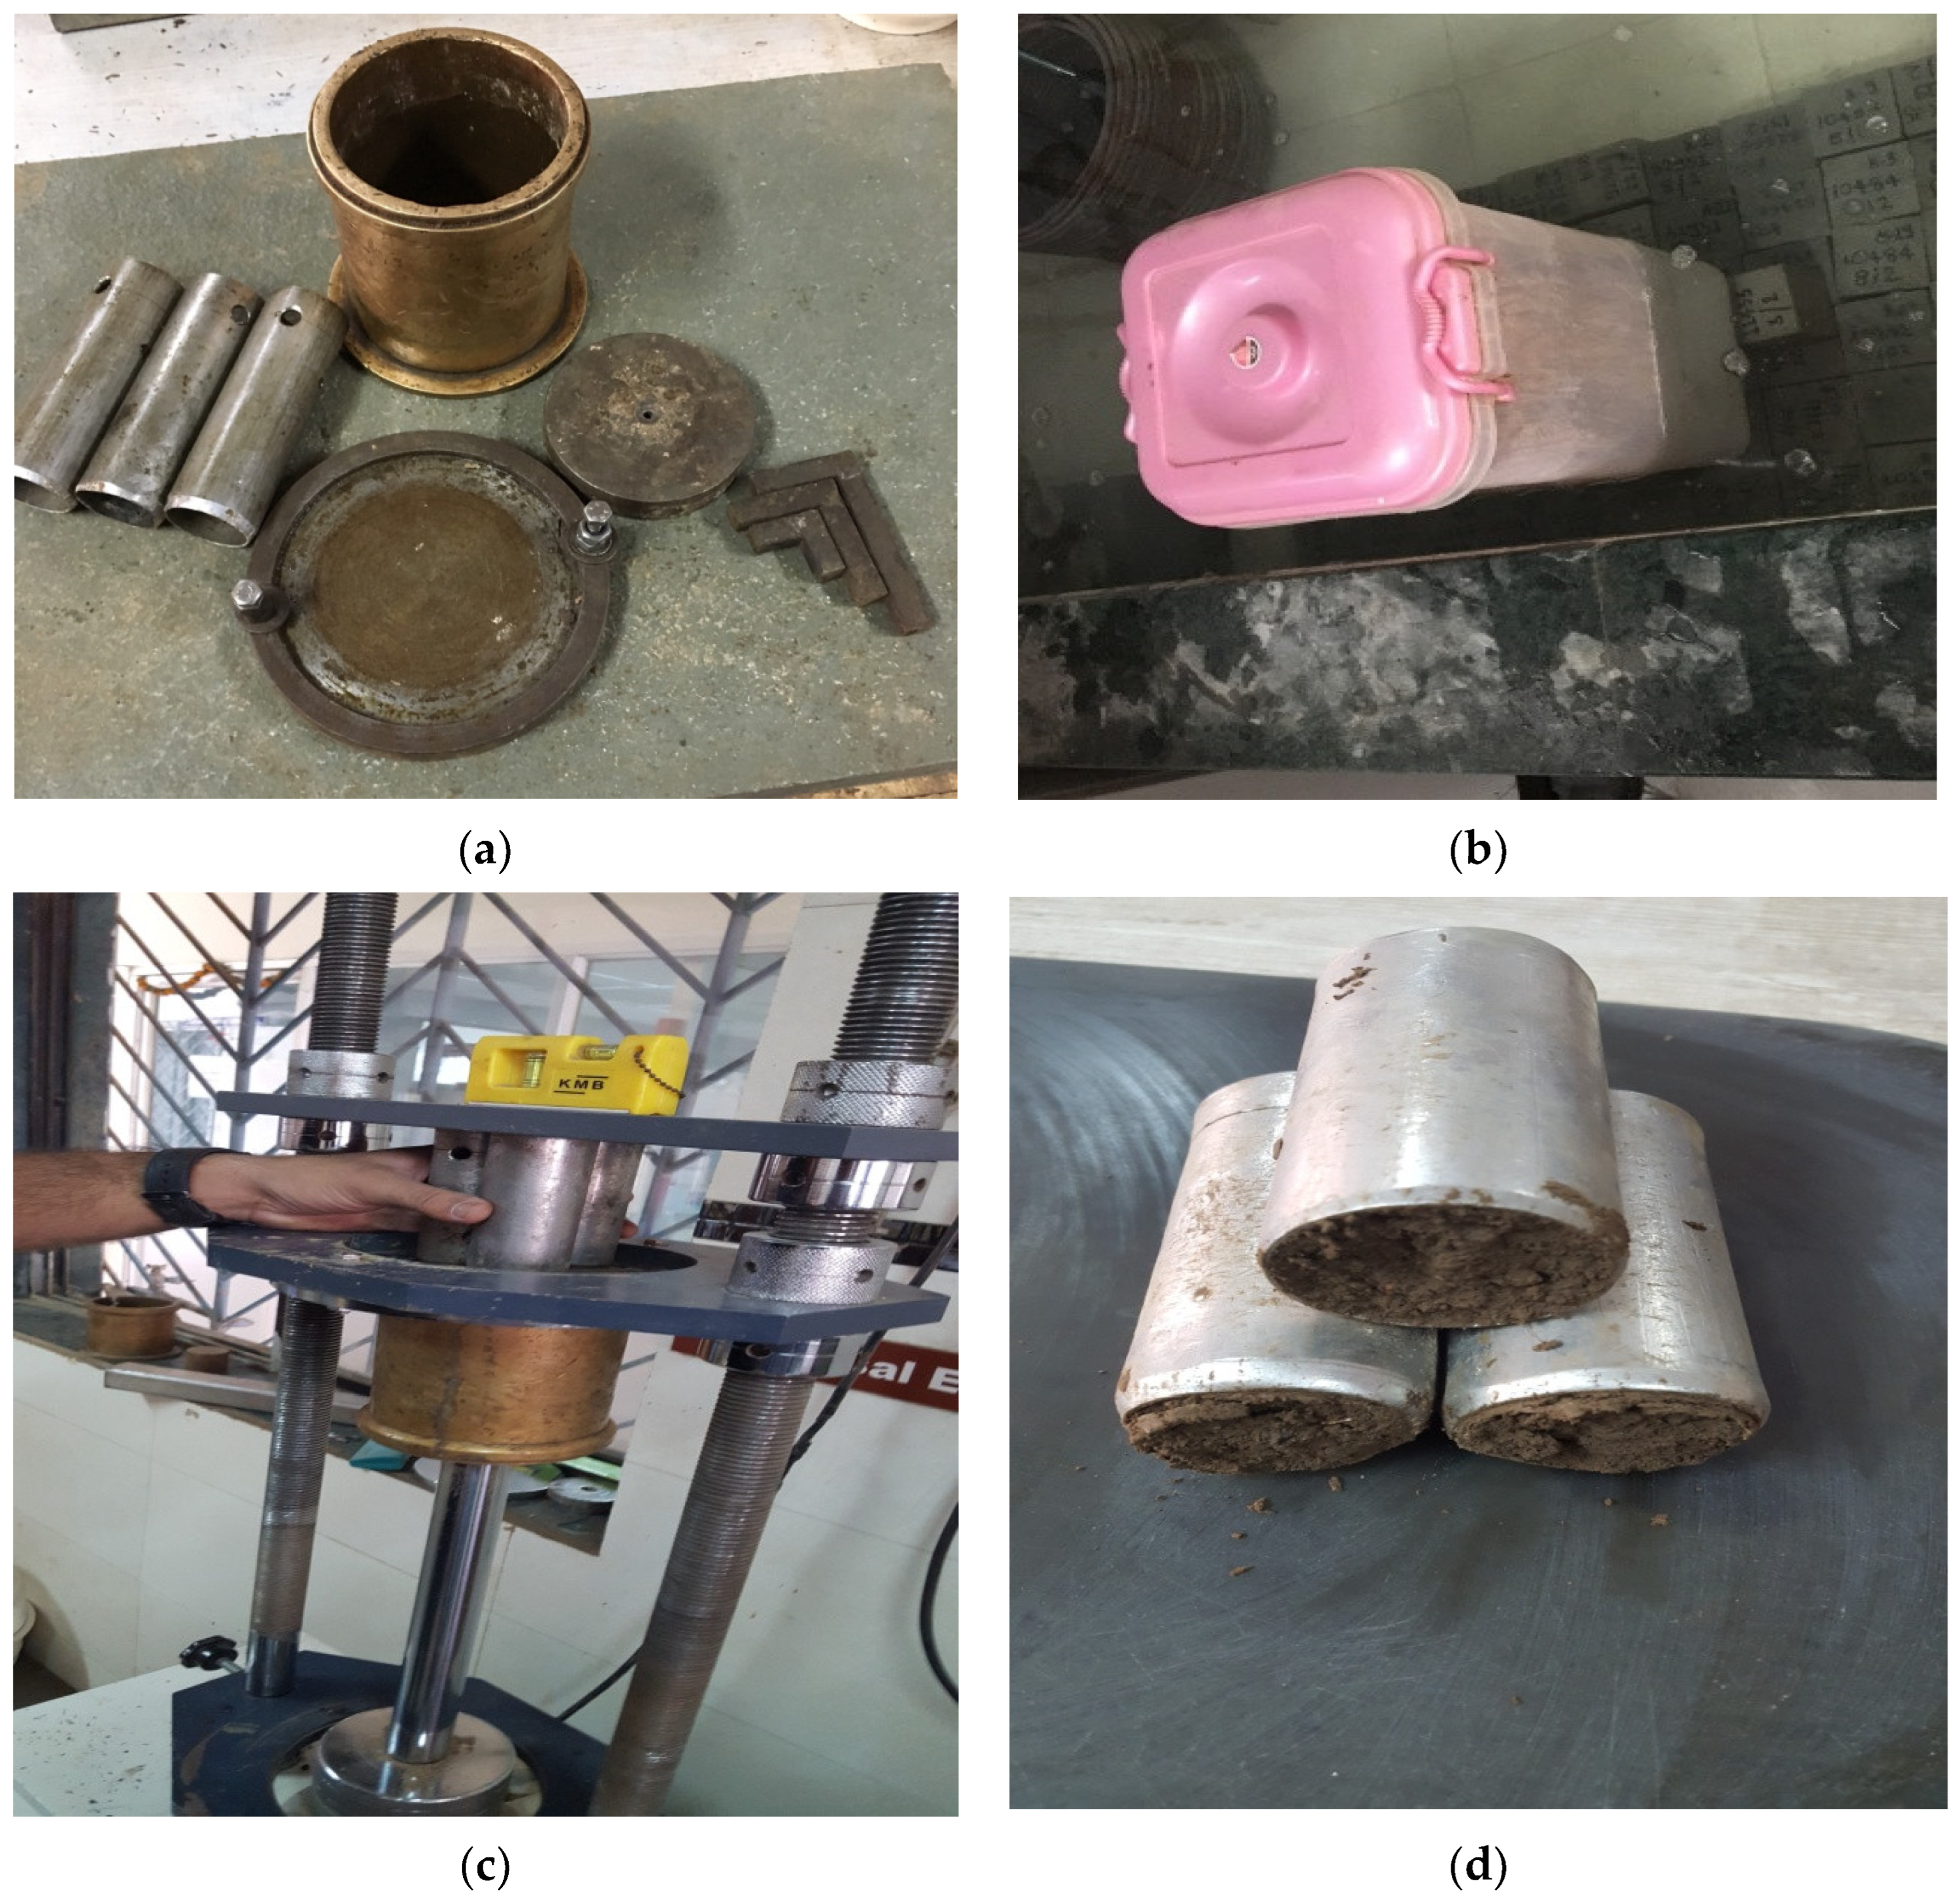
Figure 18 (a), featuring a mold with dimensions of 100 mm in diameter and 125 mm in height. There are three sample tubes, each 38 mm in diameter and 130 mm tall, along with a sampler of the same diameter but shorter, at 76 mm in height. A plunger, designed with a 20 mm thickness and a 98 mm diameter, is also part of the setup.
Figure 18 (b) shows that the soil sample mixed with water for 100 % degree of saturation in constant temperature chamber for soaking prior to specimen preparation [
52]. To facilitate both the compression and extraction of the sample from the mould, a hydraulic sample extractor is employed which is shown in
Figure 18 (c). Additionally,
Figure 18 (d) shows 3 specimens in separate tubes which were later extracted and dried up to the desired saturation in microwave. To prepare the test specimens for testing, they were mechanically extracted from the molds at 100% initial saturation. To ensure the moisture added was evenly and uniformly distributed throughout the soil samples, the predetermined volume of soil was placed in a desiccator for a period of 24 hours. These desiccated soils were subsequently soaked in a water tank set at a steady temperature of 27 ˚C [
52].
The results in terms of unconfined compressive strengths are evaluated as mentioned in Table 6.
6. Methodology
The soil matric suction is evaluated using a contact filter paper technique as per ASTM D5298-10. It is an effort towards understanding how natural soil slopes have behaved after its construction while they are exposed to the natural environment. A series of laboratory tests have been conducted on unsaturated clay samples with unconfined compressive strength measured at various degrees of saturation in accordance with IS 2720 (Part X) - 2006 [
52]. As per the results showed in Table 6 and
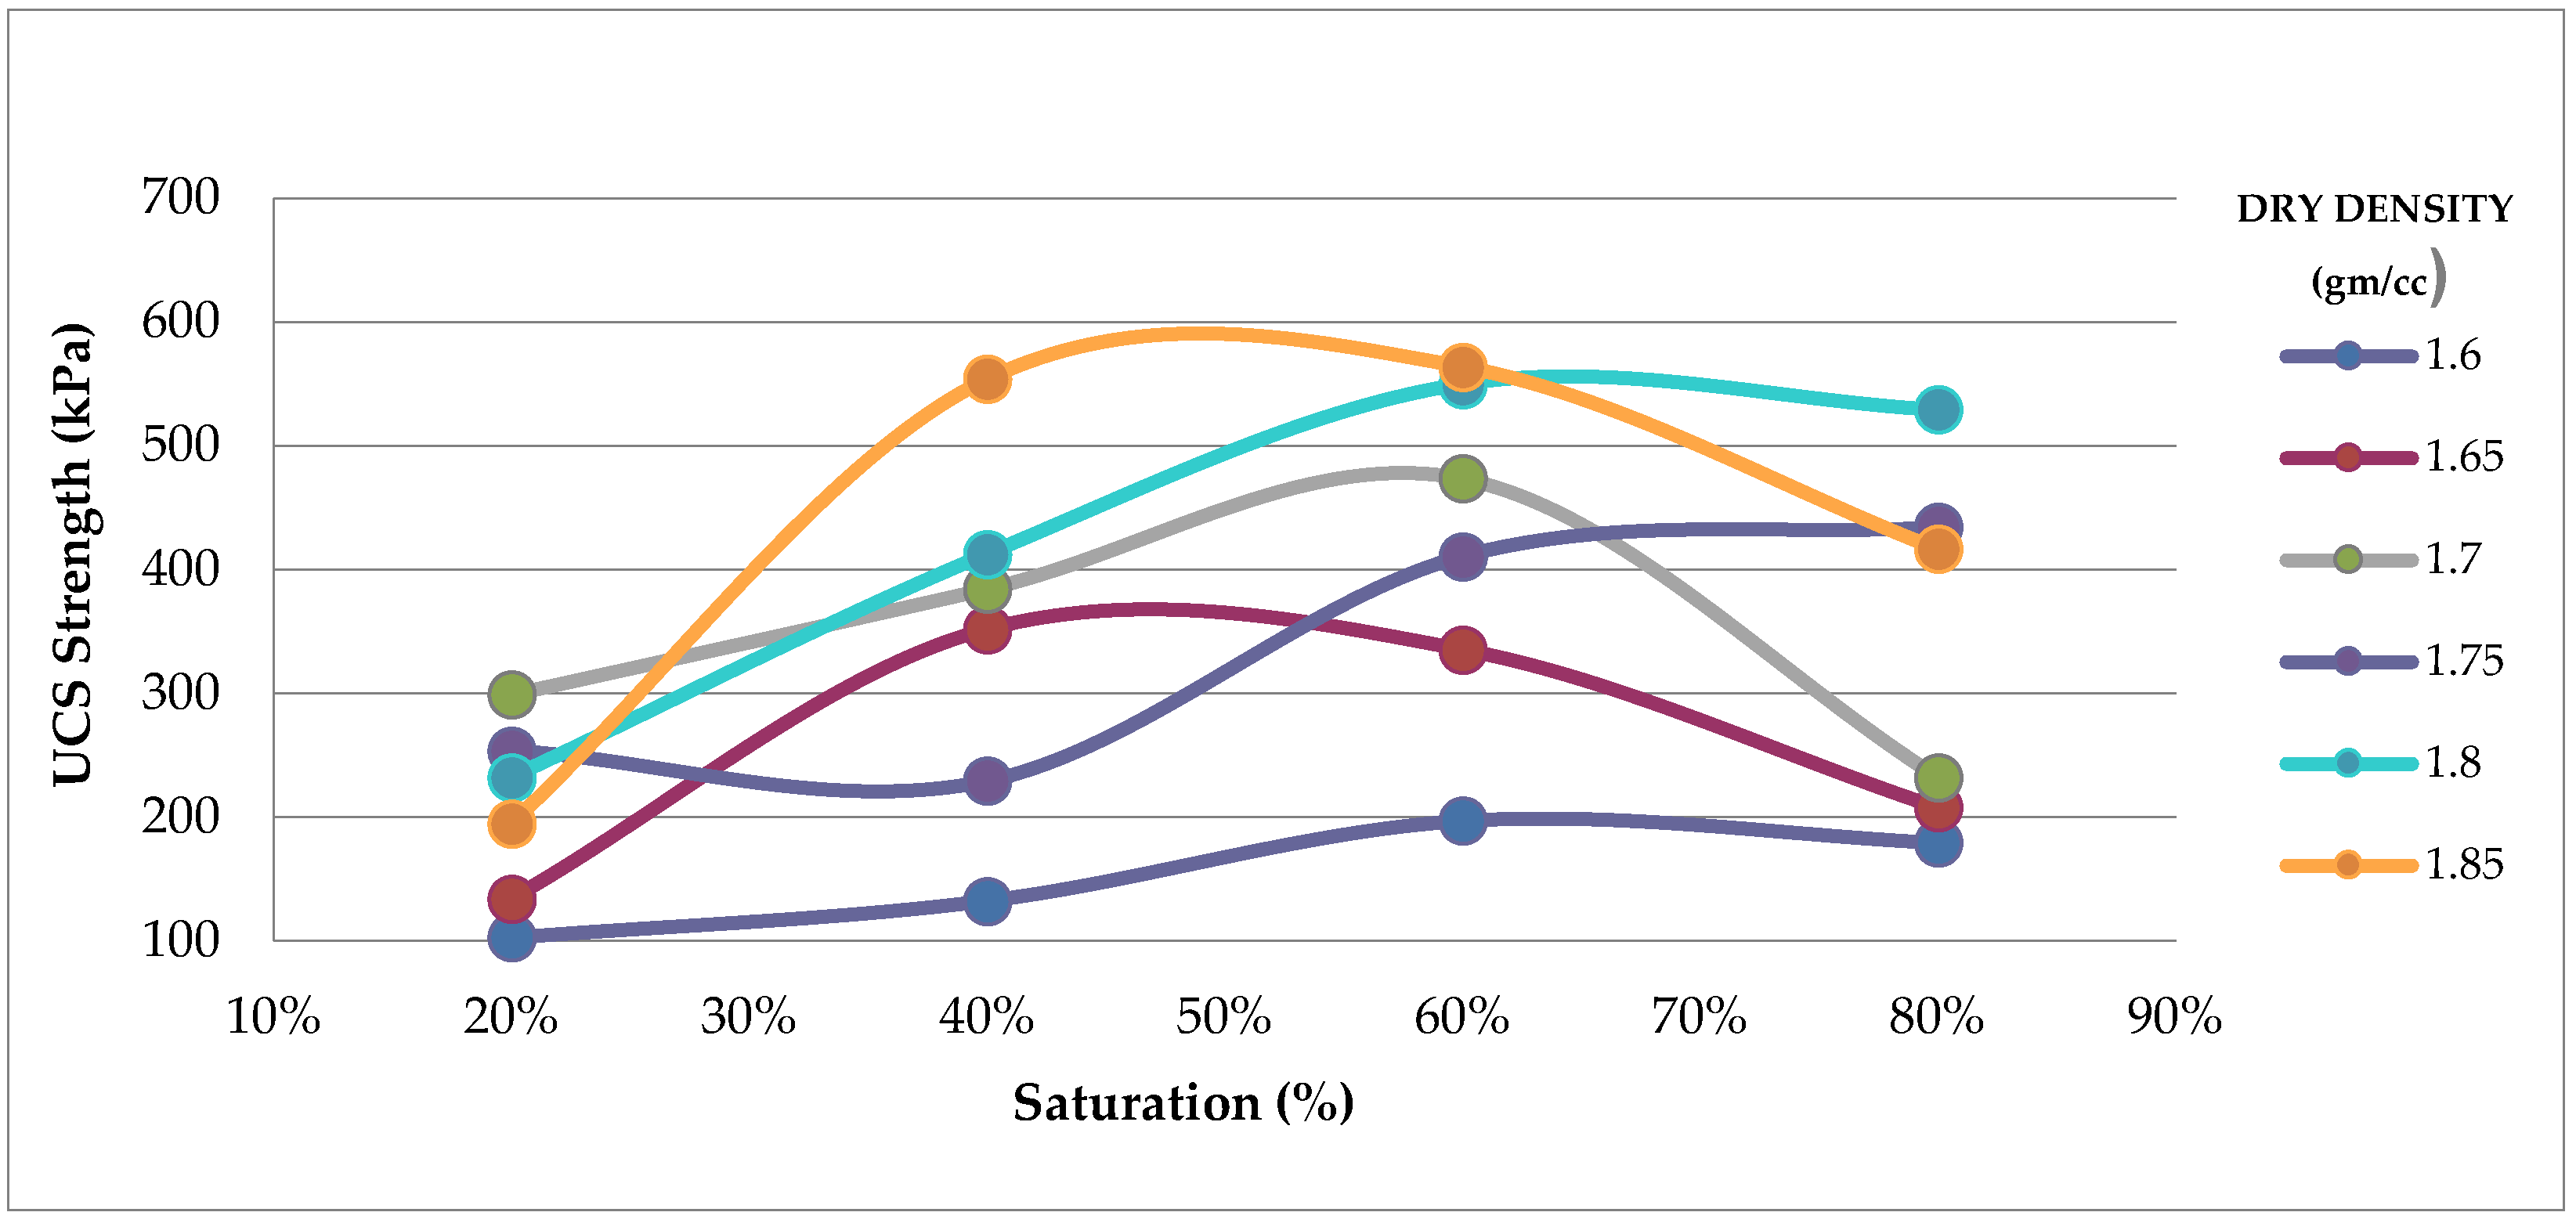
Figure 21 that the unconfined compressive strength of unsaturated clay increased with increasing saturation until reaching a maximum value, after which it decreased. The degree of saturation of the specimens ranges from 20%, 40%, 60% and 80%, and the dry density ranges as per standard Proctor density and modified Proctor density of soil type. CI soils is used in this study which is commonly found in Lunglei District.
For numerical analysis, the finite-element modeling software PLAXIS 2D [
55] was employed, incorporating a fully coupled flow-deformation analysis. In the fully coupled analysis phase, parameters such as actual permeabilities and soil suction are meticulously considered, along with the dimension of time. This approach allows for a dynamic understanding of how groundwater flow varies over time, leading to changes in the (total) active pore pressures. Such an analysis inherently incorporates suction, recognizing it as an integral element that interlinks deformation, pore pressure, and groundwater flow. This ensures a comprehensive evaluation of the soil
’ behavior, where suction plays a pivotal role in the interaction between these factors.
The shear strength of the soil under unsaturated conditions was defined using the Hardening Soil constitutive model. To replicate transient flow through unsaturated soil, the hydrological process was simulated using Richard’s equation for unsaturated flow which is based on Raynold’s transport theorem and continuity equation [
56].
Richards
’ equation is versatile and can be presented in several variations, such as the water content form, the mixed water content and capillary head form, and the head form. Specifically, in a one-dimensional context, the variant known as the “mixed water content form” combines the water content (θ) with the capillary head (ψ(θ)), illustrating the interplay between these two parameters as mentioned below in Equation (2) [
57].
where, z is vertical coordinate (positive downward)[L]; t is time [T]; q equals q(z,t) equals volumetric soil moisture content
[–]; y(q) is empirical soil hydraulic capillary head function [L]; K(q) = empirical unsaturated hydraulic conductivity function [L T–1] [
57].
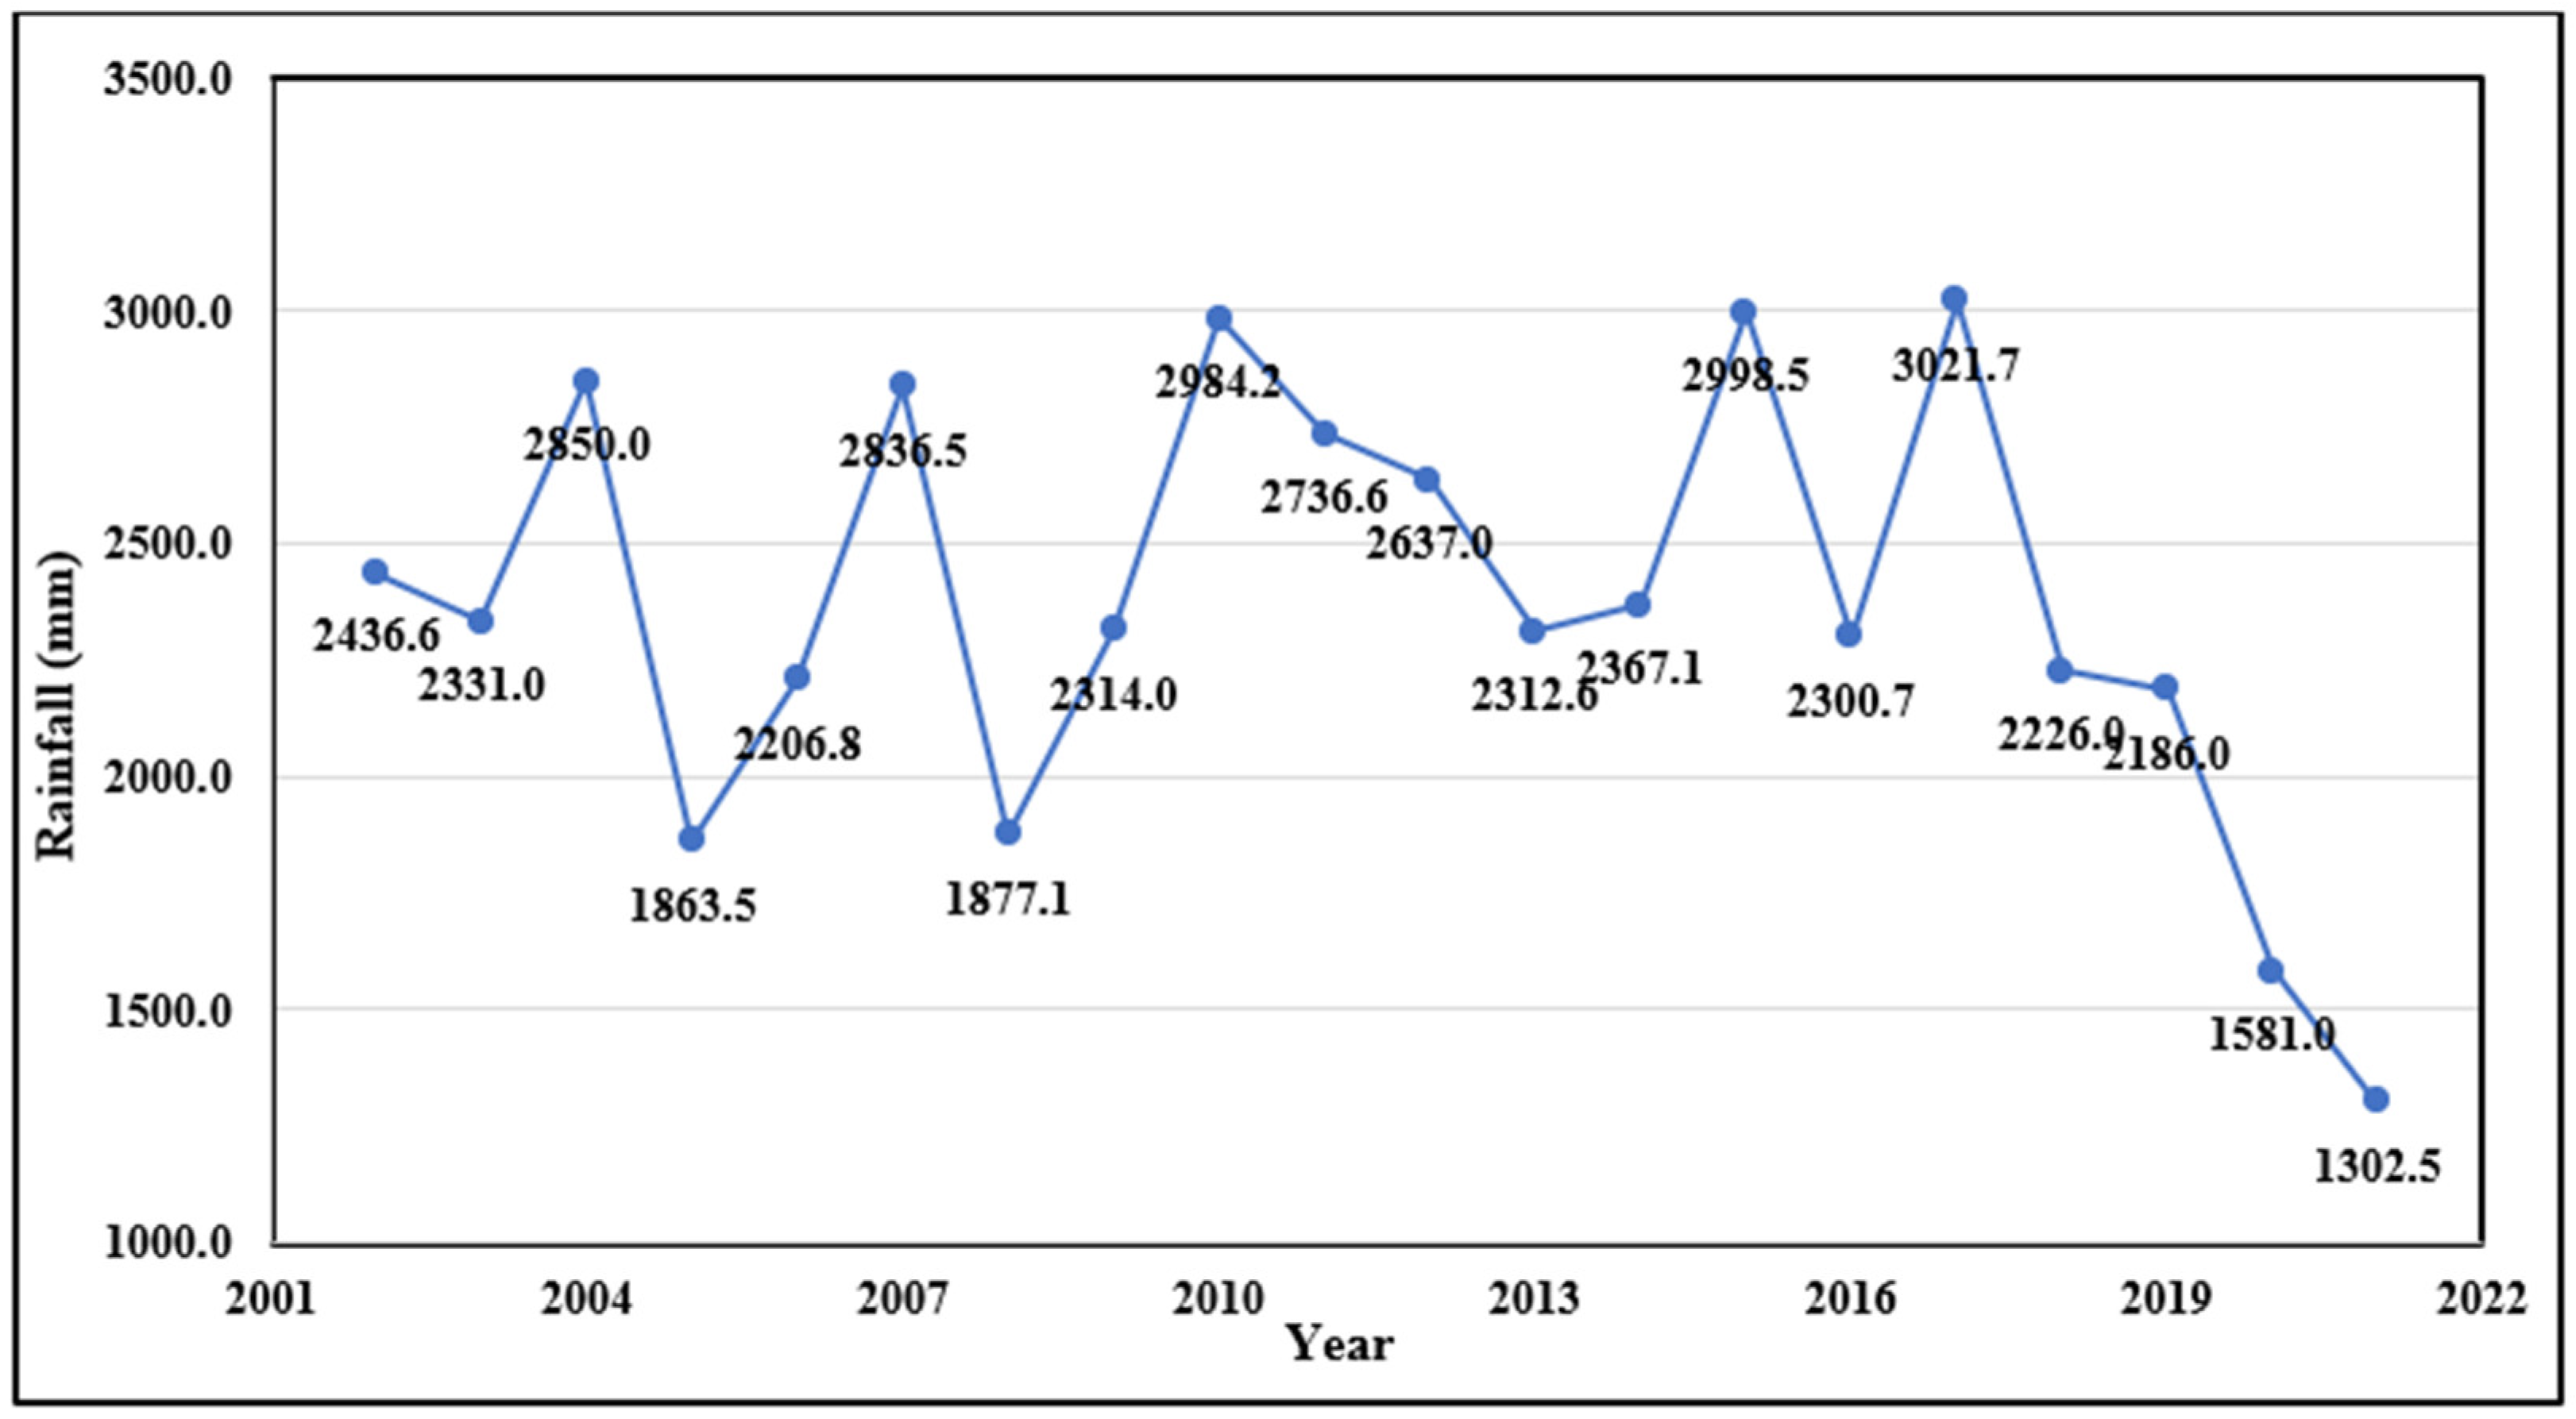
The soil strength model adopted for this analysis was the Mohr-Coulomb model, while the hydraulic behavior model considered was the Van Genuchten model. The material type under consideration was identified as CI clay. The duration of rainfall was standardized at 24 hours for both variations in rainfall intensity. The groundwater table was established at a depth of 15.0 meters from the top of the slope as per normal site observation. The analysis comprised a total of six stages, with the initial two stages representing the dry period, devoid of rainfall, and providing the baseline factor of safety. The subsequent two stages incorporated the lowest daily rainfall intensity observed in Lunglei district, set at 80 mm/day for 24 hours, and the associated factor of safety was examined. The final two stages involved the highest daily rainfall intensity recorded in Lunglei district, amounting to 190 mm/day for 24 hours, and the safety factor was calculated accordingly. The rainfall intensities are adopted from the rainfall data of year 2017 in Lunglei district of Mizoram as shown in
Figure 20.
7. Results and Discussion
7.1. Soil suction and the Properties of the Soil
Considering the SWCC curve generated from measurements of soil suction, validated further by RETC software, and the established correlation between moisture loss and drying time, the precision of the resulting drying SWCC curve is effectively affirmed. The drying time in a microwave is longer for specimens of heavier density compared to those of lighter density soil. Soil matric suction is primarily influenced by the soil properties, such as its water retention capacity, cohesion, index properties of soil, soil mineral composition and temperature conditions, but it also varies with the soil density and saturation levels. It has been noted that soils with higher plasticity require greater pressure to remove water from the soil mass results more soil suction.
7.2. Unconfined Compressive Strength Test Results
Figure 21 shows UCS strengths at different densities and variation of unsaturated soil samples. At a modified Proctor density, the CI soil reaches its peak UCS value when the moisture content is at 40% saturation. This level of moisture optimizes the soil
’s structural arrangement and cohesion, thereby enhancing its load-bearing capacity. The presence of water at this specific saturation level contributes positively to the soil matrix, facilitating particle cohesion and improving the overall strength of the soil.
However, when the saturation level drops to 20%, CI soil shows a significant decrease in strength. At lower moisture levels, there is insufficient water to facilitate optimal particle bonding, leading to weaker soil cohesion and, consequently, reduced UCS values. This illustrates that overly dry conditions can compromise the structural integrity of CI soil, making it unsuitable for supporting loads and increasing the risk of slope instability.
Conversely, as the saturation level increases beyond the optimal 40%—at 60% and 80% saturation—the UCS strength of CI soil begins to decline gradually. This reduction in strength with increasing moisture content beyond the optimal point is attributed to the lubricating effect of excess water, which causes soil particles to slide past each other more easily under load, reducing the soil overall strength and stability. This phenomenon highlights that fully saturated conditions, where soil suction approaches zero, also pose a risk to slope stability, as the increased water content compromises the soil shear strength.
The implications of these findings are significant for the understanding of natural slope failures. They indicate that not only are fully saturated conditions hazardous for slopes, due to the elimination of soil suction and the resultant decrease in shear strength, but conditions of under-saturation (below 40%) also pose a threat. In such dry conditions, the lack of adequate moisture leads to reduced particle cohesion and soil strength, making slopes vulnerable to failure. This underscores the importance of maintaining an optimal moisture level in CI soil, not only to enhance its load-bearing capacity but also to ensure the stability of natural slopes and prevent failure under varying moisture conditions.
7.3. Reduction in Factor of Safety during Numerical Analysis
The critical factors influencing slope failures triggered by rainfall are the intensity and duration of the rainfall. The conventional and uniform slope inclined at 30 degrees was examined under various rainfall intensities over a 24-hour period.
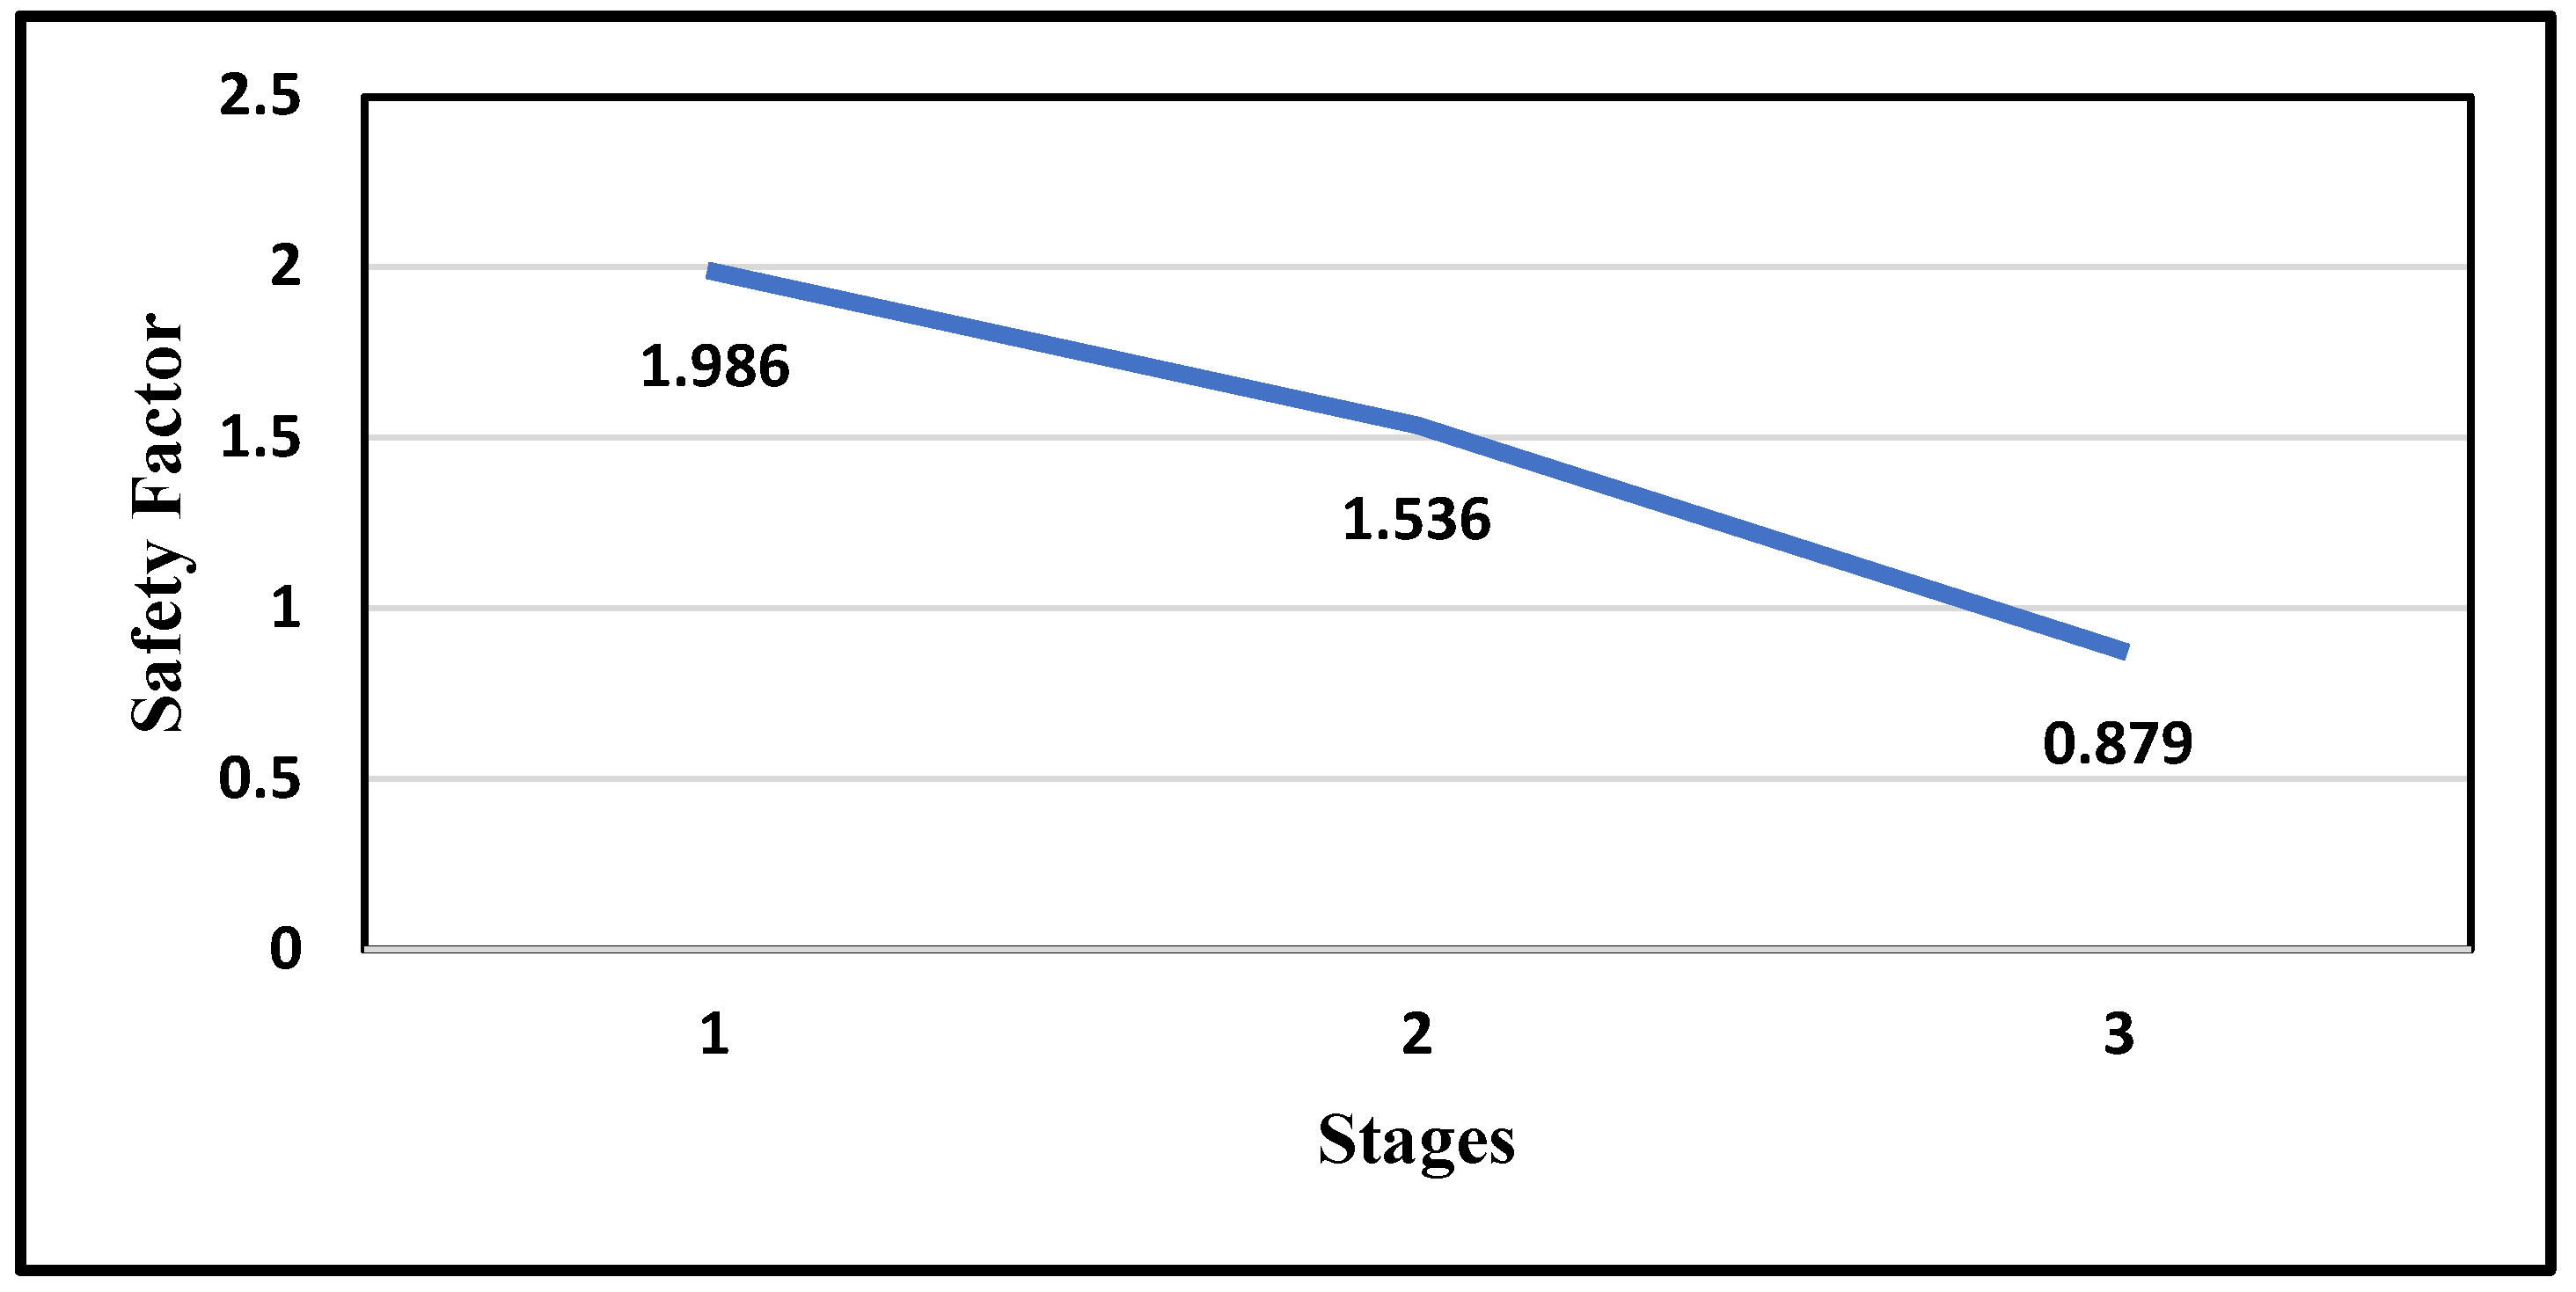
Figure 22 illustrates the applied rainfall intensity on the slope for 24 hours and the corresponding variations in the factor of safety. Rainfall intensity of 80 mm/day is considered low, while 190 mm/hr is classified as high intensity. Prolonged rainfall reduces the factor of safety to a critical condition, mainly due to soil permeability facilitating water infiltration into the slope. Initial factor of safety was close to 2.0.
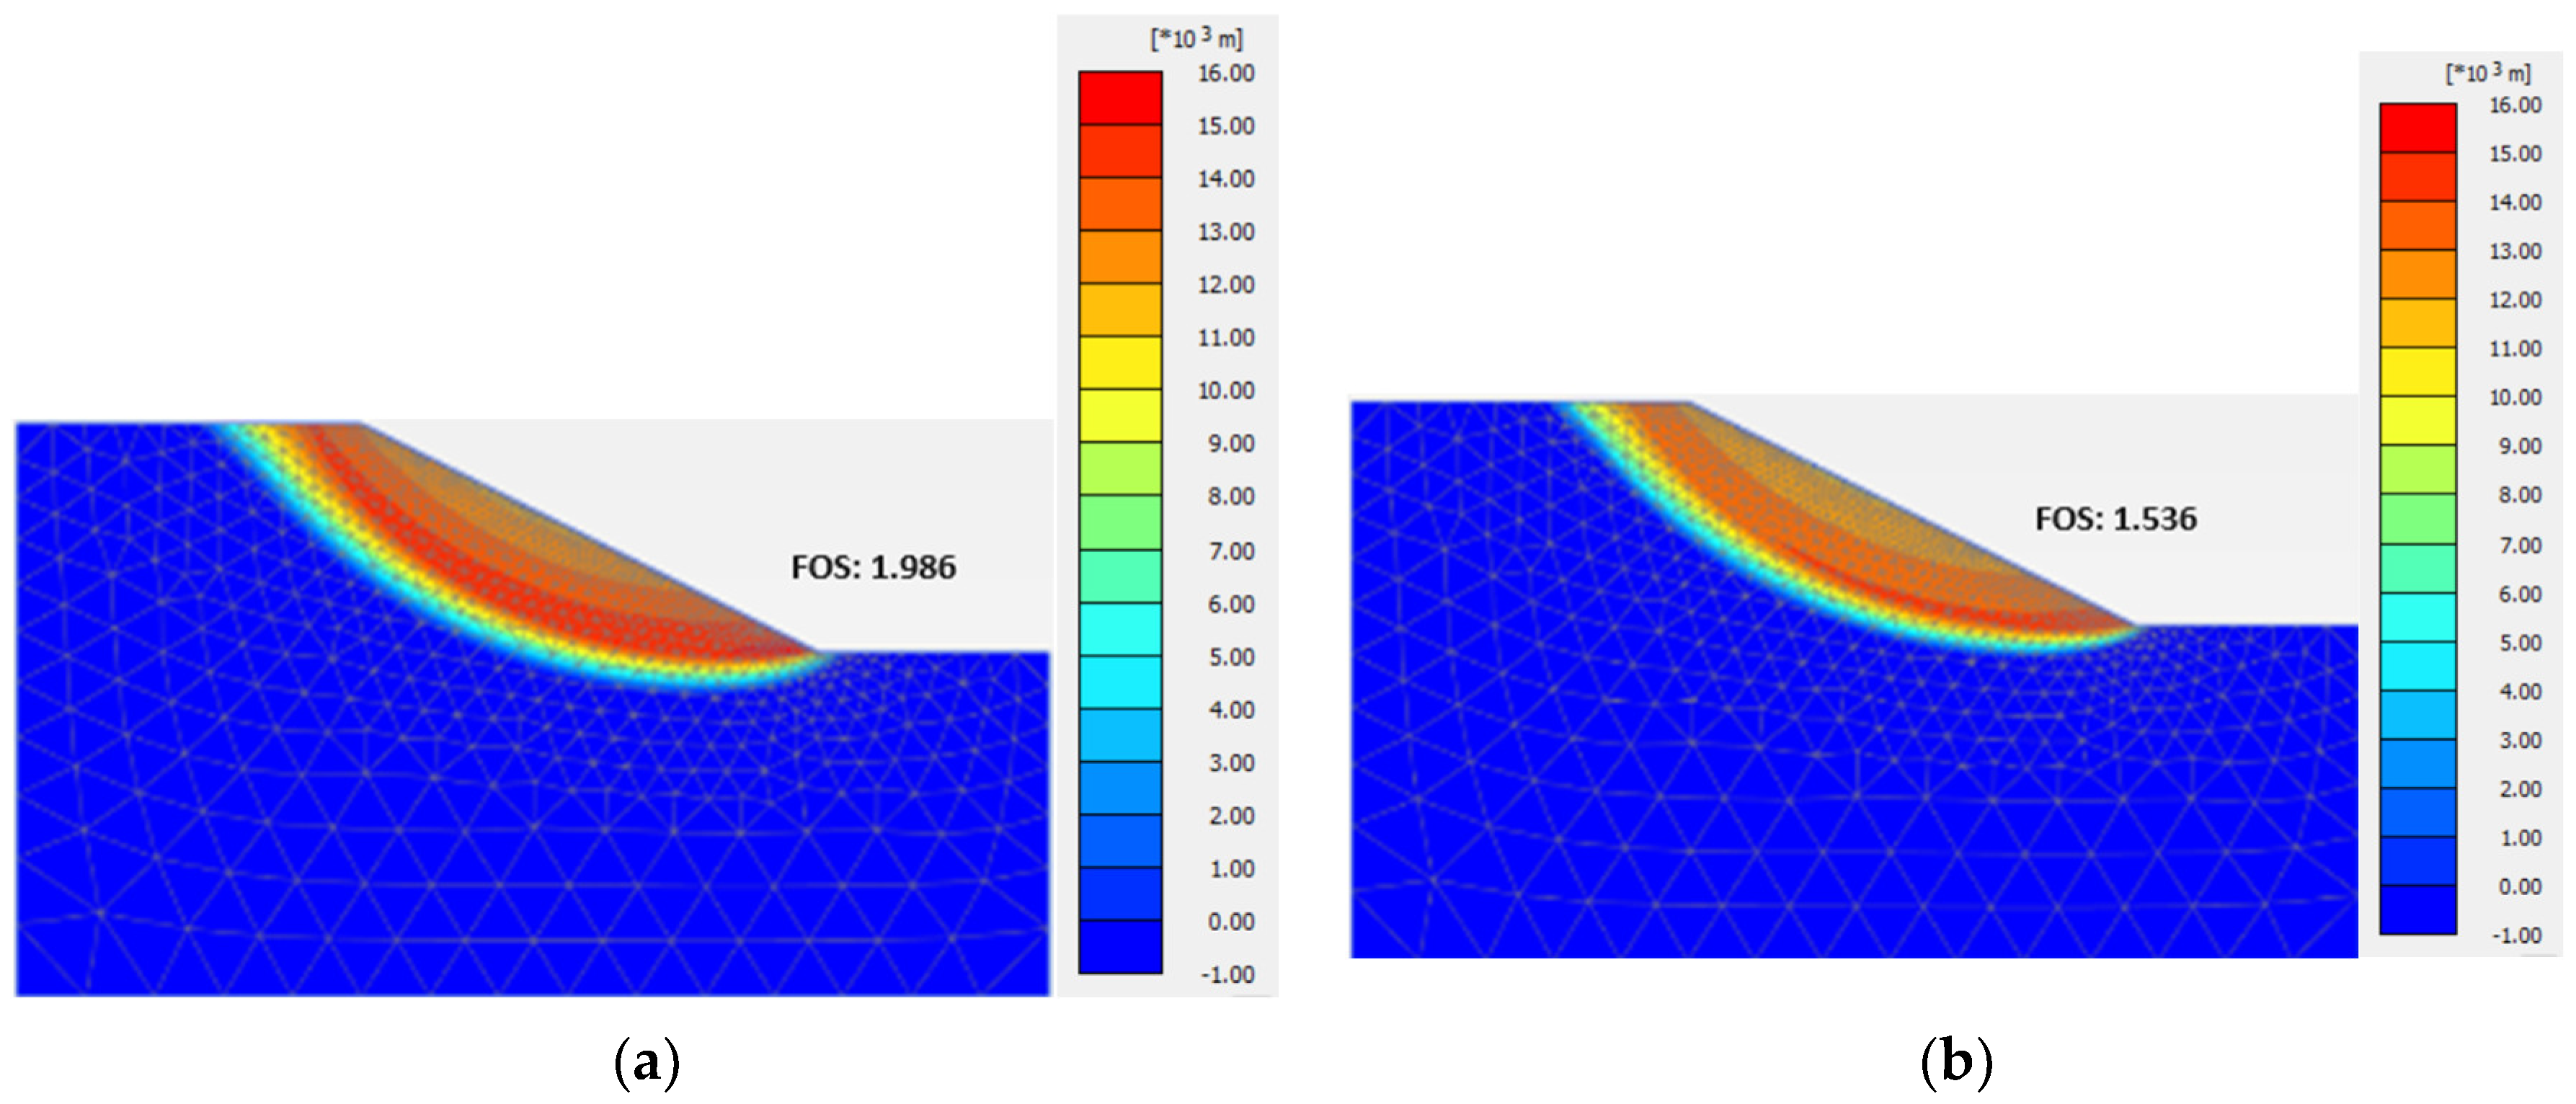
Figure 23 (a) shows initial factor of safety before rainfall which is close to 2.0.
Figure 23 (b) shows that in the case of 80 mm/day rainfall intensity, it was found to be crucial for slope stability, as the safety factor decreased to 1.536, approaching the point of failure.
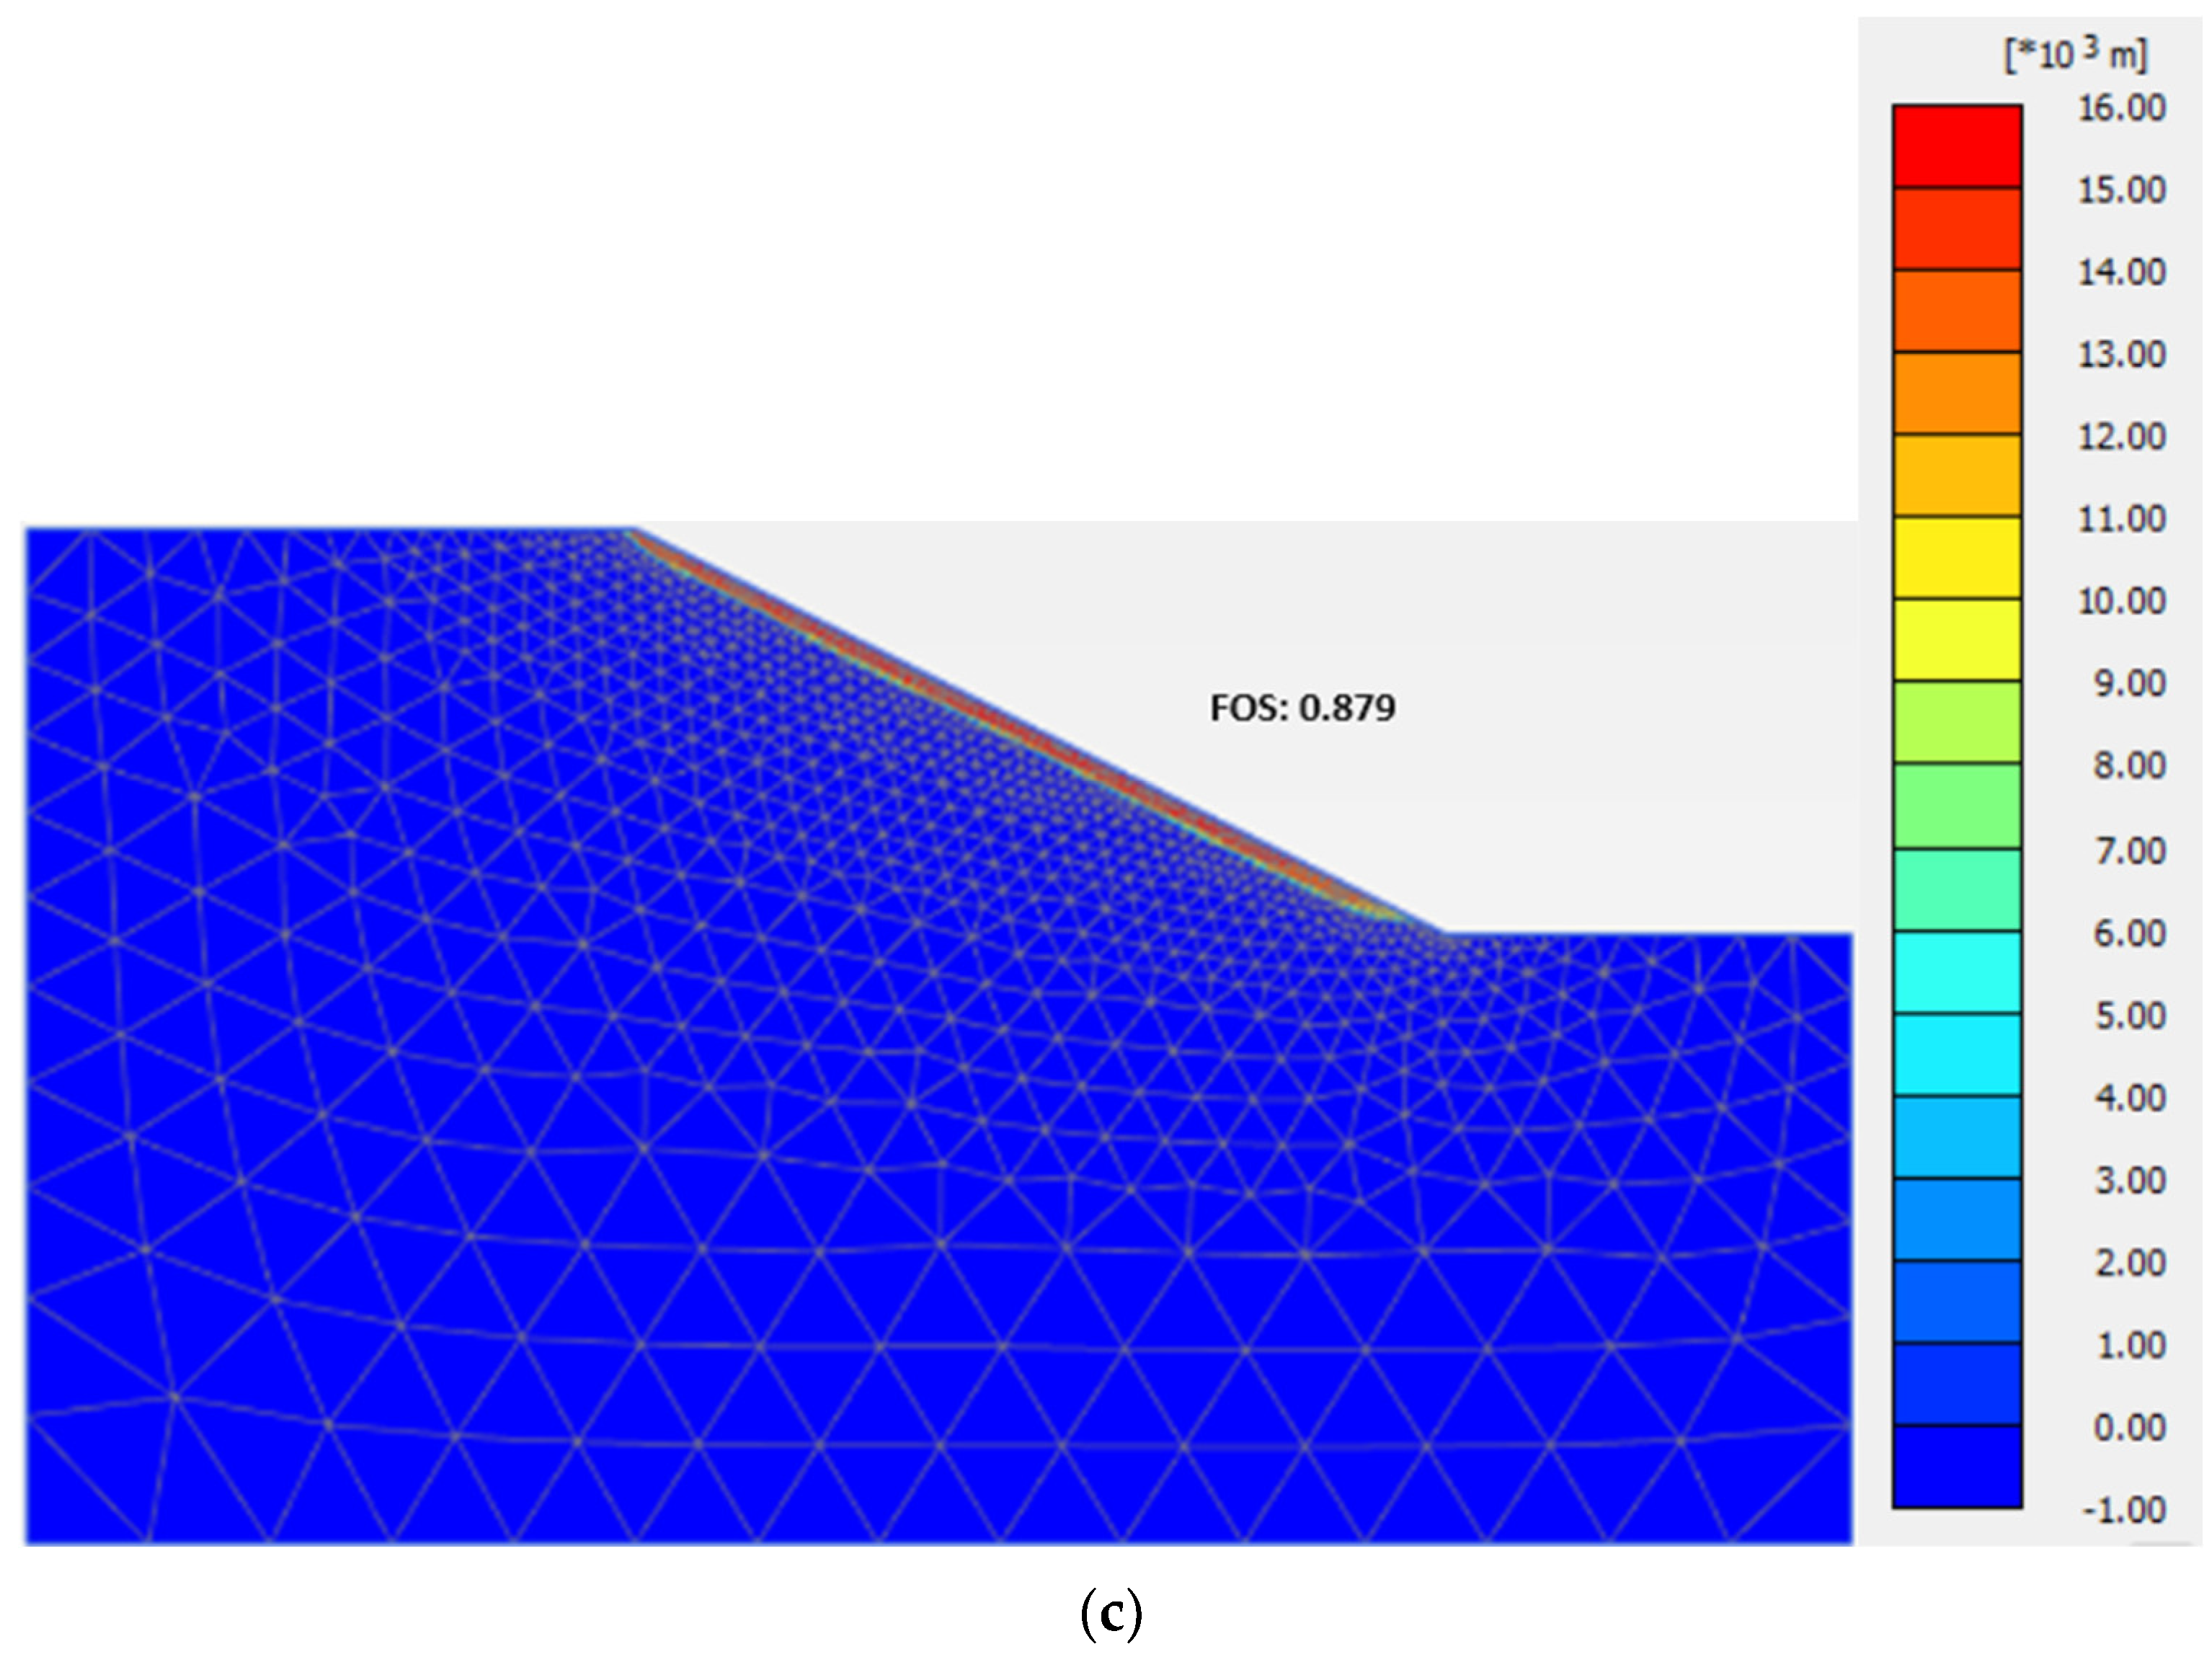
Figure 23 (c) a rainfall intensity of 190 mm/day for 24 hours induces excess pore water pressure, significantly reducing the safety factor 0.879. The infiltration of rainfall into the soil leads to a decrease in the factor of safety, attributed to the reduction in matric suction and an increase in pore water pressure [
23,
58,
59].
7.4. Variation in Pore Water Pressure and Matric Suction
The existing evidence strongly supports the notion that slope failure stems from a decrease in matric suction and the subsequent increase in pore water pressure. Matric suction emerges as the critical variable essential for evaluating the susceptibility of slope failures induced by rainfall [
58]. The likelihood of slope failure is notably tied to the initial matric suction conditions of soils, both at the surface and subsurface. As illustrated in
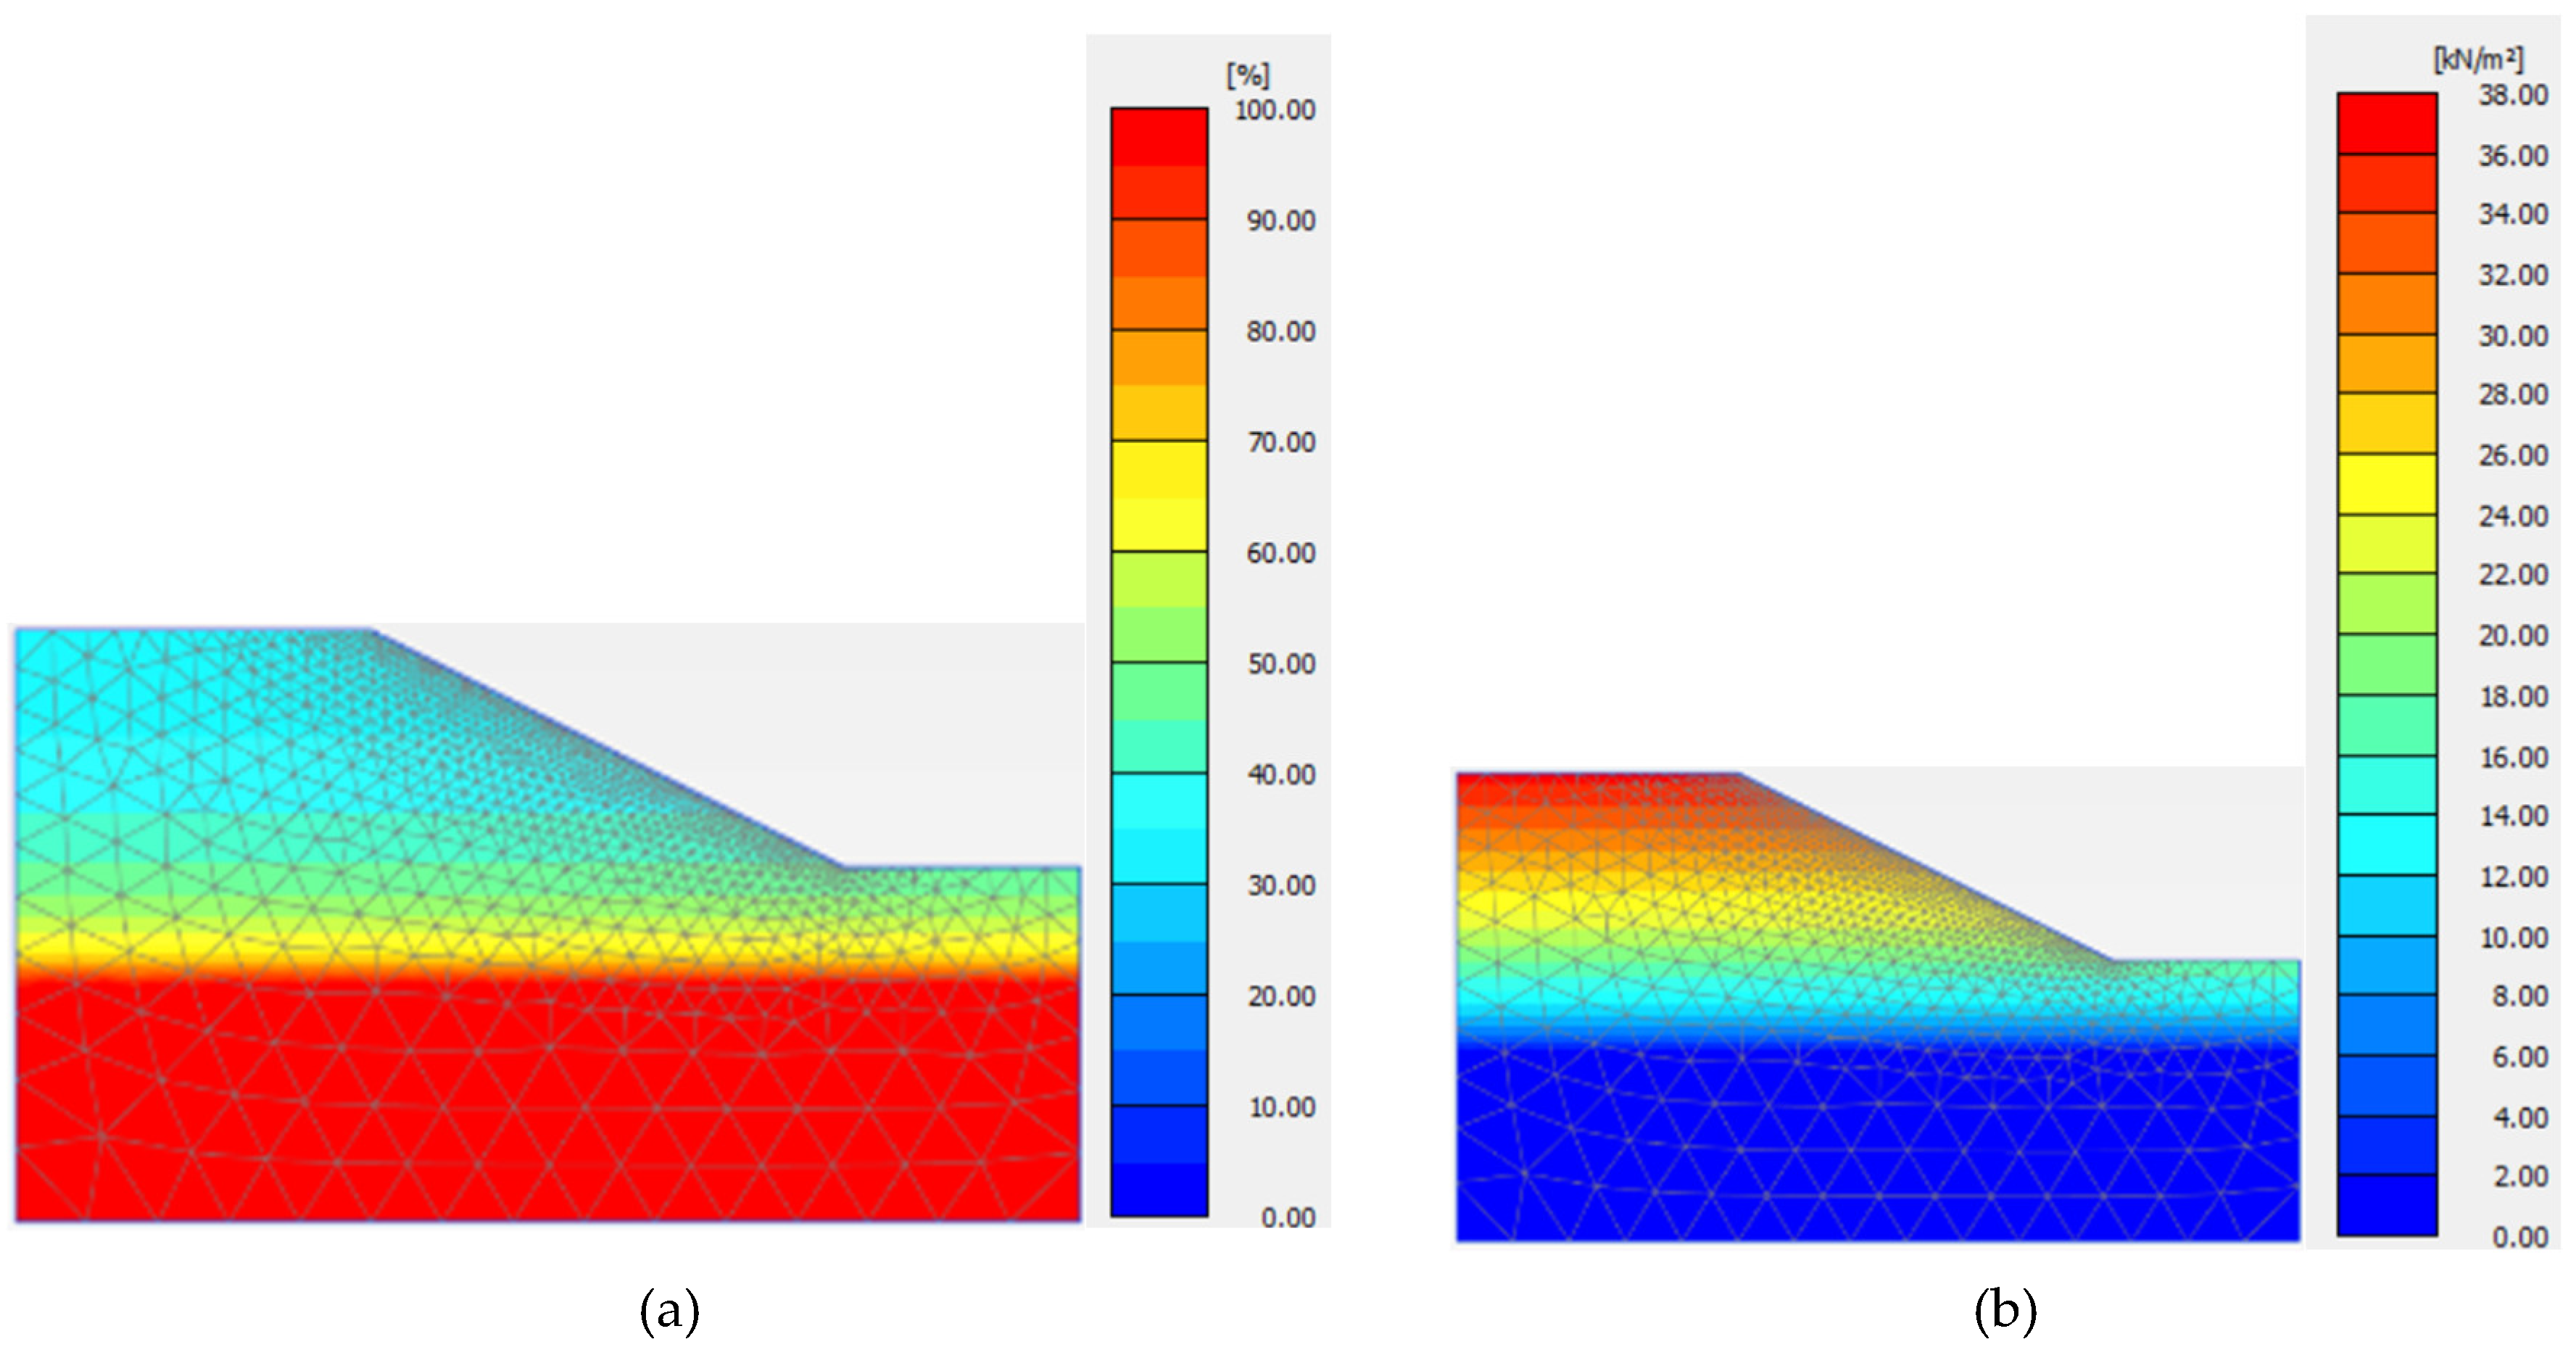
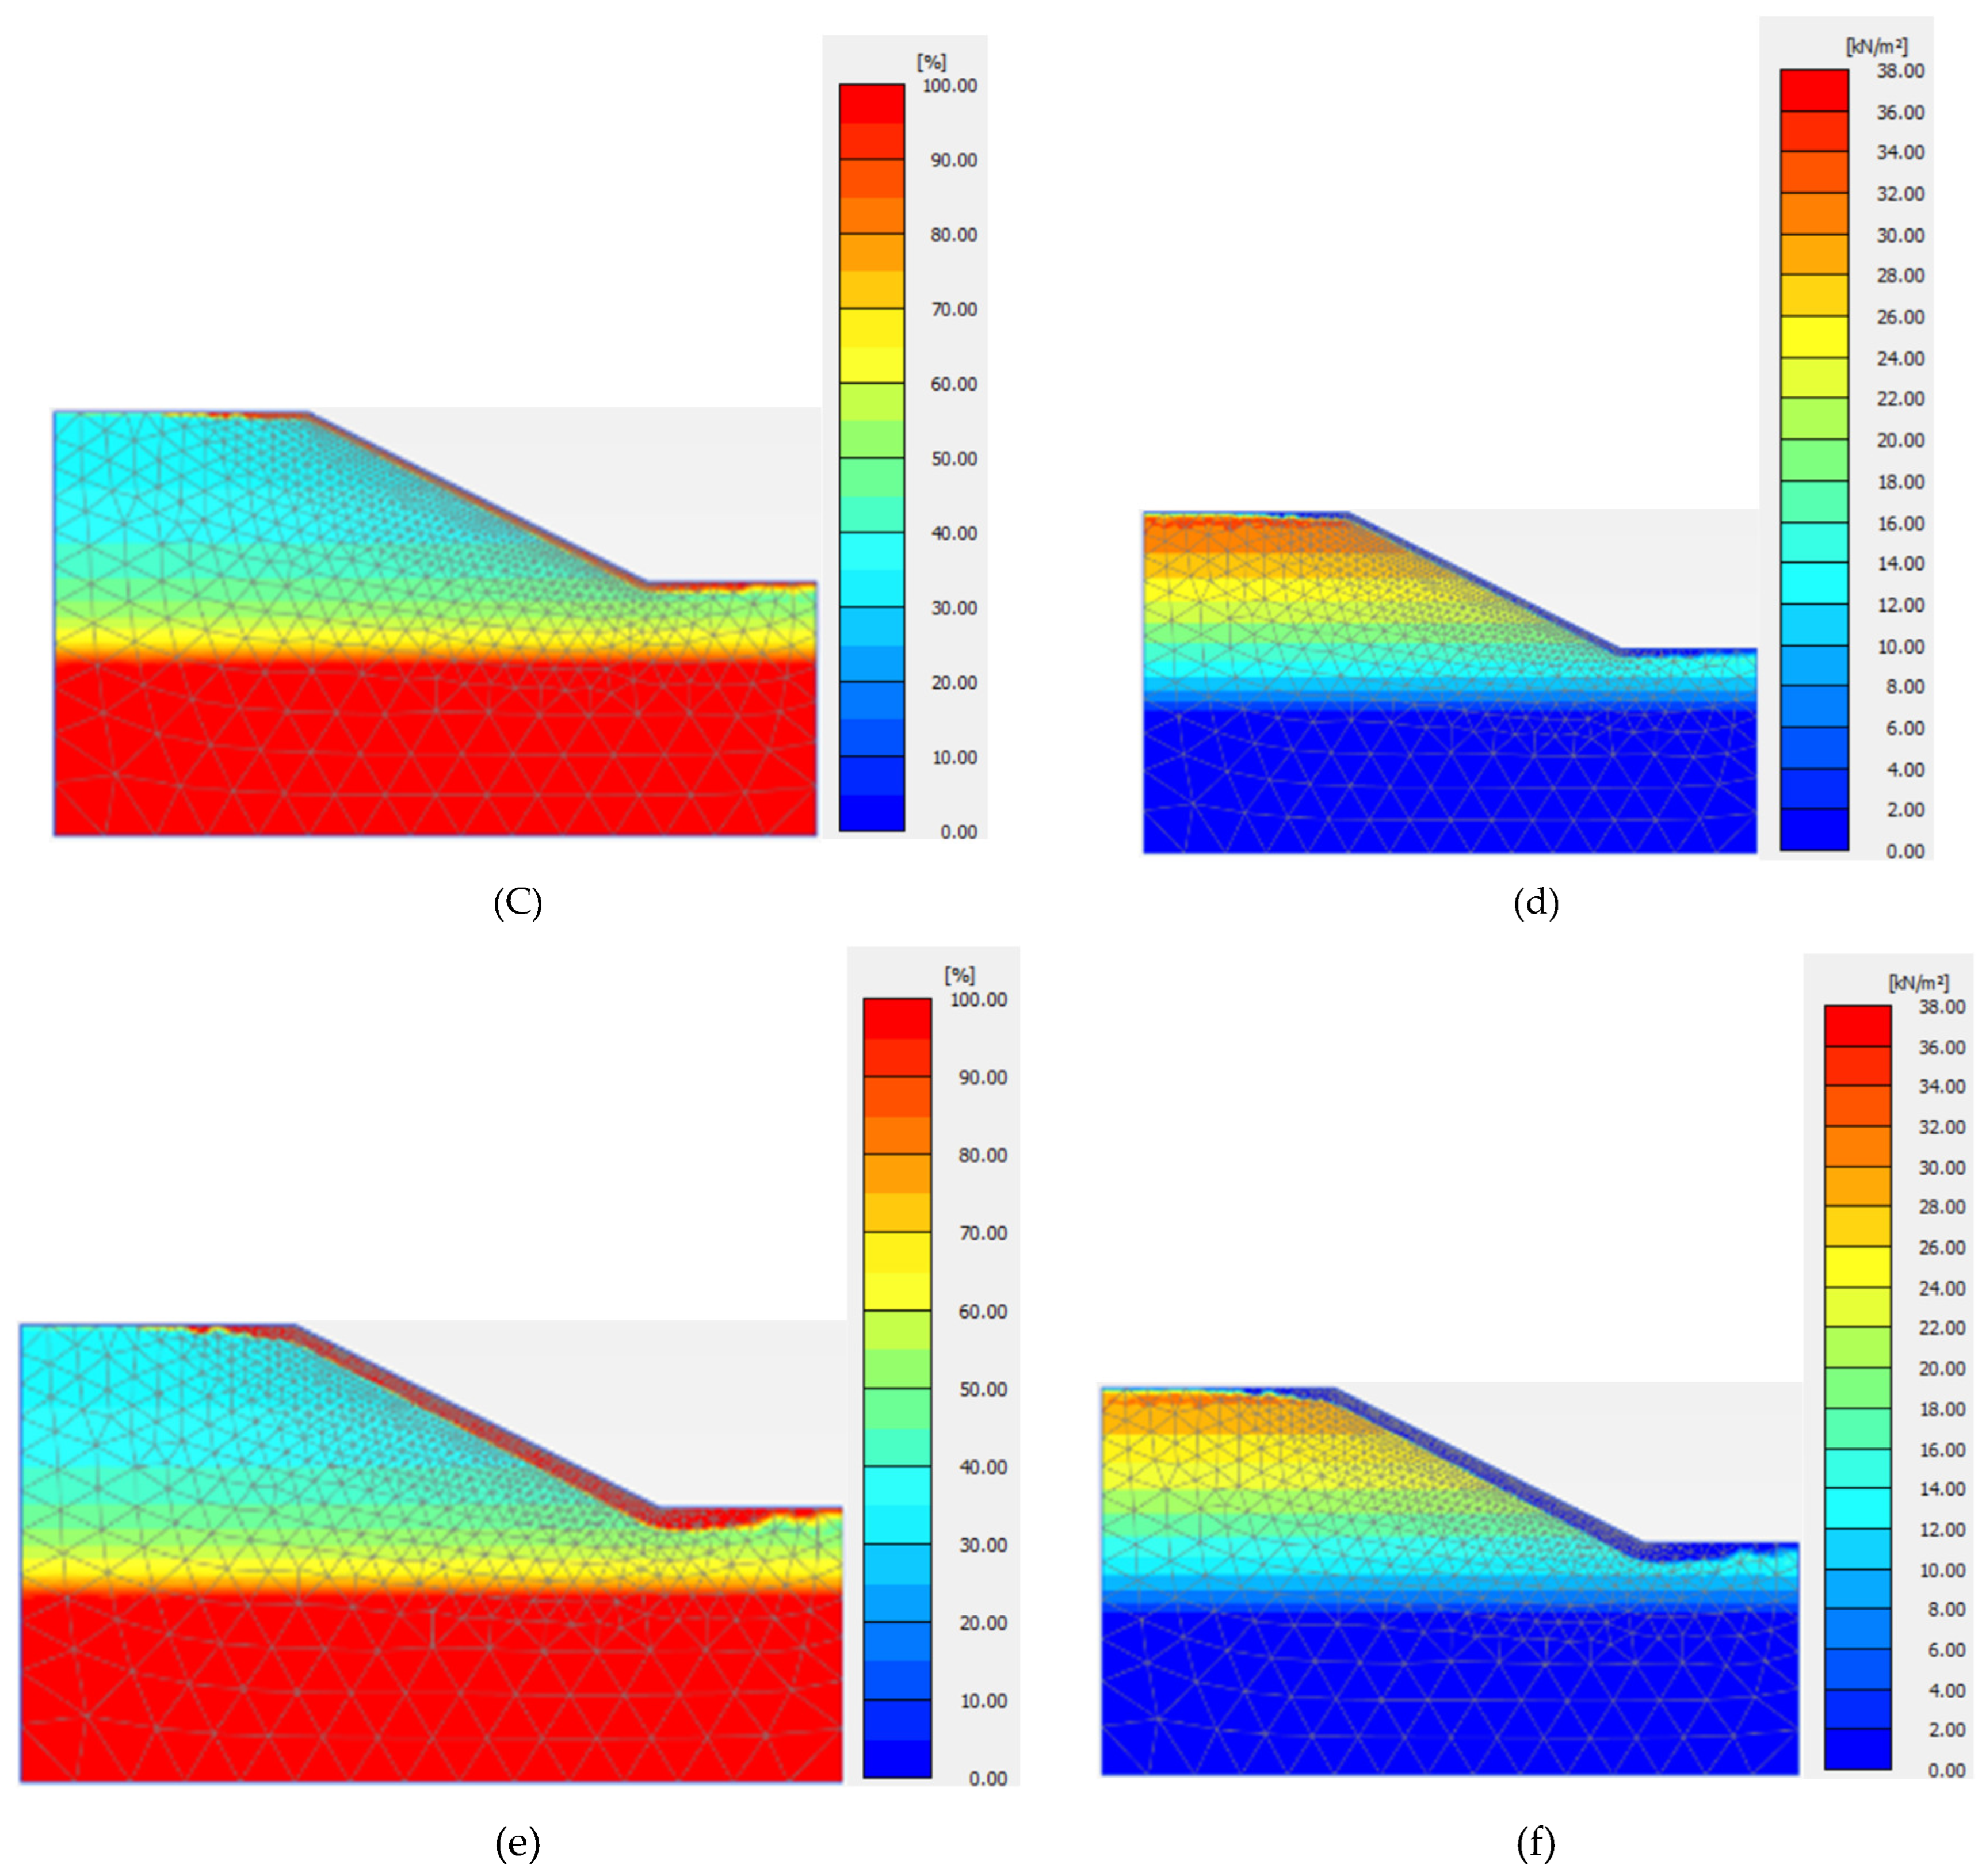
Figure 24, observable fluctuations in pore water pressure and matric suction due to rainfall infiltration reveal significant patterns. Notably, rainfall with a longer-duration rainfall and more intensity has a more pronounced influence [
58,
59].
Collectively,
Figure 24 shows after the 80 mm/day rainfall for 24 hours matric suction along the slope surface started to reduce significantly after the 190 mm/day rainfall. On the other hand, excess pore pressure started to increase along the slope surface after 80 mm/day and 190 mm/day rainfall infiltration respectively [
23]. Moreover, the reduction in matric suction becomes less prominent with increasing slope depth. The maximum reduction of suction is observed near the slope’s face, gradually diminishing with greater depth, a phenomenon associated with the presence of a groundwater table at elevated depths [
58,
59].
8. Conclusions
The aims of this study are to (i) develop the SWCC curve for the sampled soils, (ii) reliably measure the UCS strength of the soils and (iii) evaluate numerically the influences of both rainfall duration and intensity on slopes characterized by initially elevated soil matric suction resulting from an extended dry period. Soil suction measurement, its validation and microwave drying are have been demonstrated to be reliable in developing the SWCC curves at different densities and degrees of saturation. A numerical analysis, utilizing finite element methods, was conducted on an idealized slope with a 30° angle. The analysis involved a coupled flow-deformation approach, enabling simultaneous examination of seepage and deformation behaviors. From the outcomes of this investigation, the following conclusions can be drawn:
Microwave drying times vary based on soil density, with specimens of higher density taking longer to dry than those with lower density.
Matric suction in soil is primarily determined by several soil properties, including water retention capacity, cohesion, mineral composition, temperature conditions and index properties of soil such Atterberg’s limit, free swell index, specific gravity.
Soils with higher plasticity are observed to require more pressure for water extraction, leading to increased soil suction. This highlights the relationship between soil plasticity and the effort needed to reduce moisture content, directly impacting the soil’s suction capabilities.
CI soil attains its highest Unconfined Compressive Strength (UCS) at a moisture saturation of 40% when compacted to its modified Proctor density. This moisture level is key to optimizing the soil structure and cohesion, enhancing its ability to support loads.
A decline in moisture content to 20% leads to a notable drop in CI soil strength. This decrease is due to inadequate water for proper particle bonding, resulting in weaker cohesion and lower UCS values, showing how dry conditions undermine the soil’s integrity.
Beyond the optimal saturation of 40%, at levels of 60% and 80% saturation, there is a progressive weakening of CI soil’s UCS. The additional moisture lubricates the soil particles, easing their movements under pressure and thus diminishing the soil strength and stability, especially as soil suction is reduced.
The findings reveal that extreme moisture conditions—both overly saturated and significantly under-saturated—threaten slope stability. While saturated conditions decrease soil suction and shear strength, insufficient moisture undermines particle cohesion and overall soil strength, increasing the risk of slope failure.
Maintaining CI soil around the 40% saturation level is crucial for maximizing its load-bearing properties and ensuring slope stability. This balance is vital for preventing slope failures, emphasizing the importance of monitoring, and managing soil moisture levels in geotechnical engineering and construction projects.
Apart from soil strength properties and slope geometry, the stability of slopes is significantly influenced by the duration and intensity of rainfall. The extent of infiltration is contingent upon the hydraulic characteristics of the soil. The fluctuation in simulated climate led to changes in the matric suction profile over different time periods. During a 24-hour period of 80 mm/day rainfall, the factor of safety began to reach a critical point, resulting in a reduction in the factor of safety.
Rainfall characterized by low intensity and extended duration is more critical when compared to high intensity and short-duration rainfall.
Slope failure originates from a decline in matric suction followed by an increase in pore water pressure. Matric suction becomes the crucial variable necessary for assessing the vulnerability of slope failures induced by rainfall.
In regions such as Mizoram, a six-to-eight-month dry season induces substantial soil matric suction. Subsequently, heavy monsoonal activity reduces matric suction, and rainfall infiltration leads to an increase in pore water pressure. This increase in pore water pressure results in a notable mobilization of shear strength. Ultimately, the mobilized shear strength surpasses the resisting shear strength, particularly during the monsoon season, leading to the occurrence of shallow transitional landslides widely observed in the Lunglei district.
Maintaining an appropriate level of soil moisture becomes essential for ensuring the stability of structures, especially during extreme conditions characterized by pore fluid fluctuation zones. Consequently, assessing the soil-structure interaction necessitates a comprehensive understanding of saturation conditions. By prioritizing the evaluation of saturation conditions, we can effectively address the challenges posed by climate change and altered environmental loading, thereby promoting the stability and resilience of various structures.
Therefore, matric suction plays a crucial role in the stability of slopes, particularly following an extended dry period. This research can be utilized to develop real-time early warning systems employing soil matric suction reduction sensors and pore pressure sensors. Implementing such systems allows for proactive measures to be taken before landslides and slope failures, thereby minimizing potential damage, loss of property, and casualties.
Figure 1.
(a) Definition of the Vadose or Unsaturated Soil Zone; (b) Moisture flux components associated with the calculation of net moisture flux at ground surface [
3].
Figure 1.
(a) Definition of the Vadose or Unsaturated Soil Zone; (b) Moisture flux components associated with the calculation of net moisture flux at ground surface [
3].
Figure 2.
Typical Soil Water Characteristic Curve [
3].
Figure 2.
Typical Soil Water Characteristic Curve [
3].
Figure 3.
a) Landslide inventory of India. b) Landslides mapped using high-resolution satellite data in Mizoram, which occurred between 2014-2018. (National Remote Sensing Centre, ISRO, Hyderabad, India).
Figure 3.
a) Landslide inventory of India. b) Landslides mapped using high-resolution satellite data in Mizoram, which occurred between 2014-2018. (National Remote Sensing Centre, ISRO, Hyderabad, India).
Figure 4.
a) Pre-image: RESOURCESAT 2 LISS IV Mx (7 Dec. 2013), b) Post-image: RESOURCESAT 2 LISS IV Mx (5 Jan. 2017). Landslide locations from Lunglei, Mizoram. Landslide was triggered in the Lunglei of Mizoram to heavy monsoonal rain in 2017. The landslide is shallow transitional failure.
Figure 4.
a) Pre-image: RESOURCESAT 2 LISS IV Mx (7 Dec. 2013), b) Post-image: RESOURCESAT 2 LISS IV Mx (5 Jan. 2017). Landslide locations from Lunglei, Mizoram. Landslide was triggered in the Lunglei of Mizoram to heavy monsoonal rain in 2017. The landslide is shallow transitional failure.
Figure 5.
Particle size distribution curve of soil sample.
Figure 5.
Particle size distribution curve of soil sample.
Figure 6.
A-line curve for Atterberg’s limit which shows the soil sample is classified as clay with intermediate plasticity (CI).
Figure 6.
A-line curve for Atterberg’s limit which shows the soil sample is classified as clay with intermediate plasticity (CI).
Figure 7.
a) Aluminum plungers and PVC mold; b) Whatman No. 42 filter papers; c) Prepared assembly for soil suction measurement; d) Moisture content of filter paper measurement [
48,
49].
Figure 7.
a) Aluminum plungers and PVC mold; b) Whatman No. 42 filter papers; c) Prepared assembly for soil suction measurement; d) Moisture content of filter paper measurement [
48,
49].
Figure 8.
(a) 2-dimensional and (b) 3-dimensional plots of soil suction at different dry density and saturation conditions for CI Soil (SWCC curve) [
48].
Figure 8.
(a) 2-dimensional and (b) 3-dimensional plots of soil suction at different dry density and saturation conditions for CI Soil (SWCC curve) [
48].
Figure 9.
Look of RETC with its simple and fewer input options.
Figure 9.
Look of RETC with its simple and fewer input options.
Figure 10.
Input Data Steps: Type of Problem.
Figure 10.
Input Data Steps: Type of Problem.
Figure 11.
Input Data Steps: Scale Units.
Figure 11.
Input Data Steps: Scale Units.
Figure 12.
Input Data Steps: Type of Retention / Conductivity Model.
Figure 12.
Input Data Steps: Type of Retention / Conductivity Model.
Figure 13.
Input Data Steps: Input Data Steps: Soil Hydraulic Parameters.
Figure 13.
Input Data Steps: Input Data Steps: Soil Hydraulic Parameters.
Figure 14.
Input Data Steps: Retention Curve Data.
Figure 14.
Input Data Steps: Retention Curve Data.
Figure 15.
SWCC Validation on RETC Software at different densities of Soil samples.
Figure 15.
SWCC Validation on RETC Software at different densities of Soil samples.
Figure 16.
a) Prepared soil specimens (38 mm dia. and 76 mm height) in desiccator; b) Dried soil specimens after microwave process; c) Soil specimens being dried in the microwave oven according to ASTM 4643-8: 2008.
Figure 16.
a) Prepared soil specimens (38 mm dia. and 76 mm height) in desiccator; b) Dried soil specimens after microwave process; c) Soil specimens being dried in the microwave oven according to ASTM 4643-8: 2008.
Figure 17.
Reduction in moisture content vs. time relation for soil specimen dried in microwave oven according to ASTM 4643-8: 2008.
Figure 17.
Reduction in moisture content vs. time relation for soil specimen dried in microwave oven according to ASTM 4643-8: 2008.
Figure 18.
a) Remolding assembly with layer measurement tool; b) 24 hours soaking of sample prior to casting of specimens under temperature-controlled condition; c) Specimen extraction by mechanical sample extractor; d) Three identical soil specimens tested.
Figure 18.
a) Remolding assembly with layer measurement tool; b) 24 hours soaking of sample prior to casting of specimens under temperature-controlled condition; c) Specimen extraction by mechanical sample extractor; d) Three identical soil specimens tested.
Figure 19.
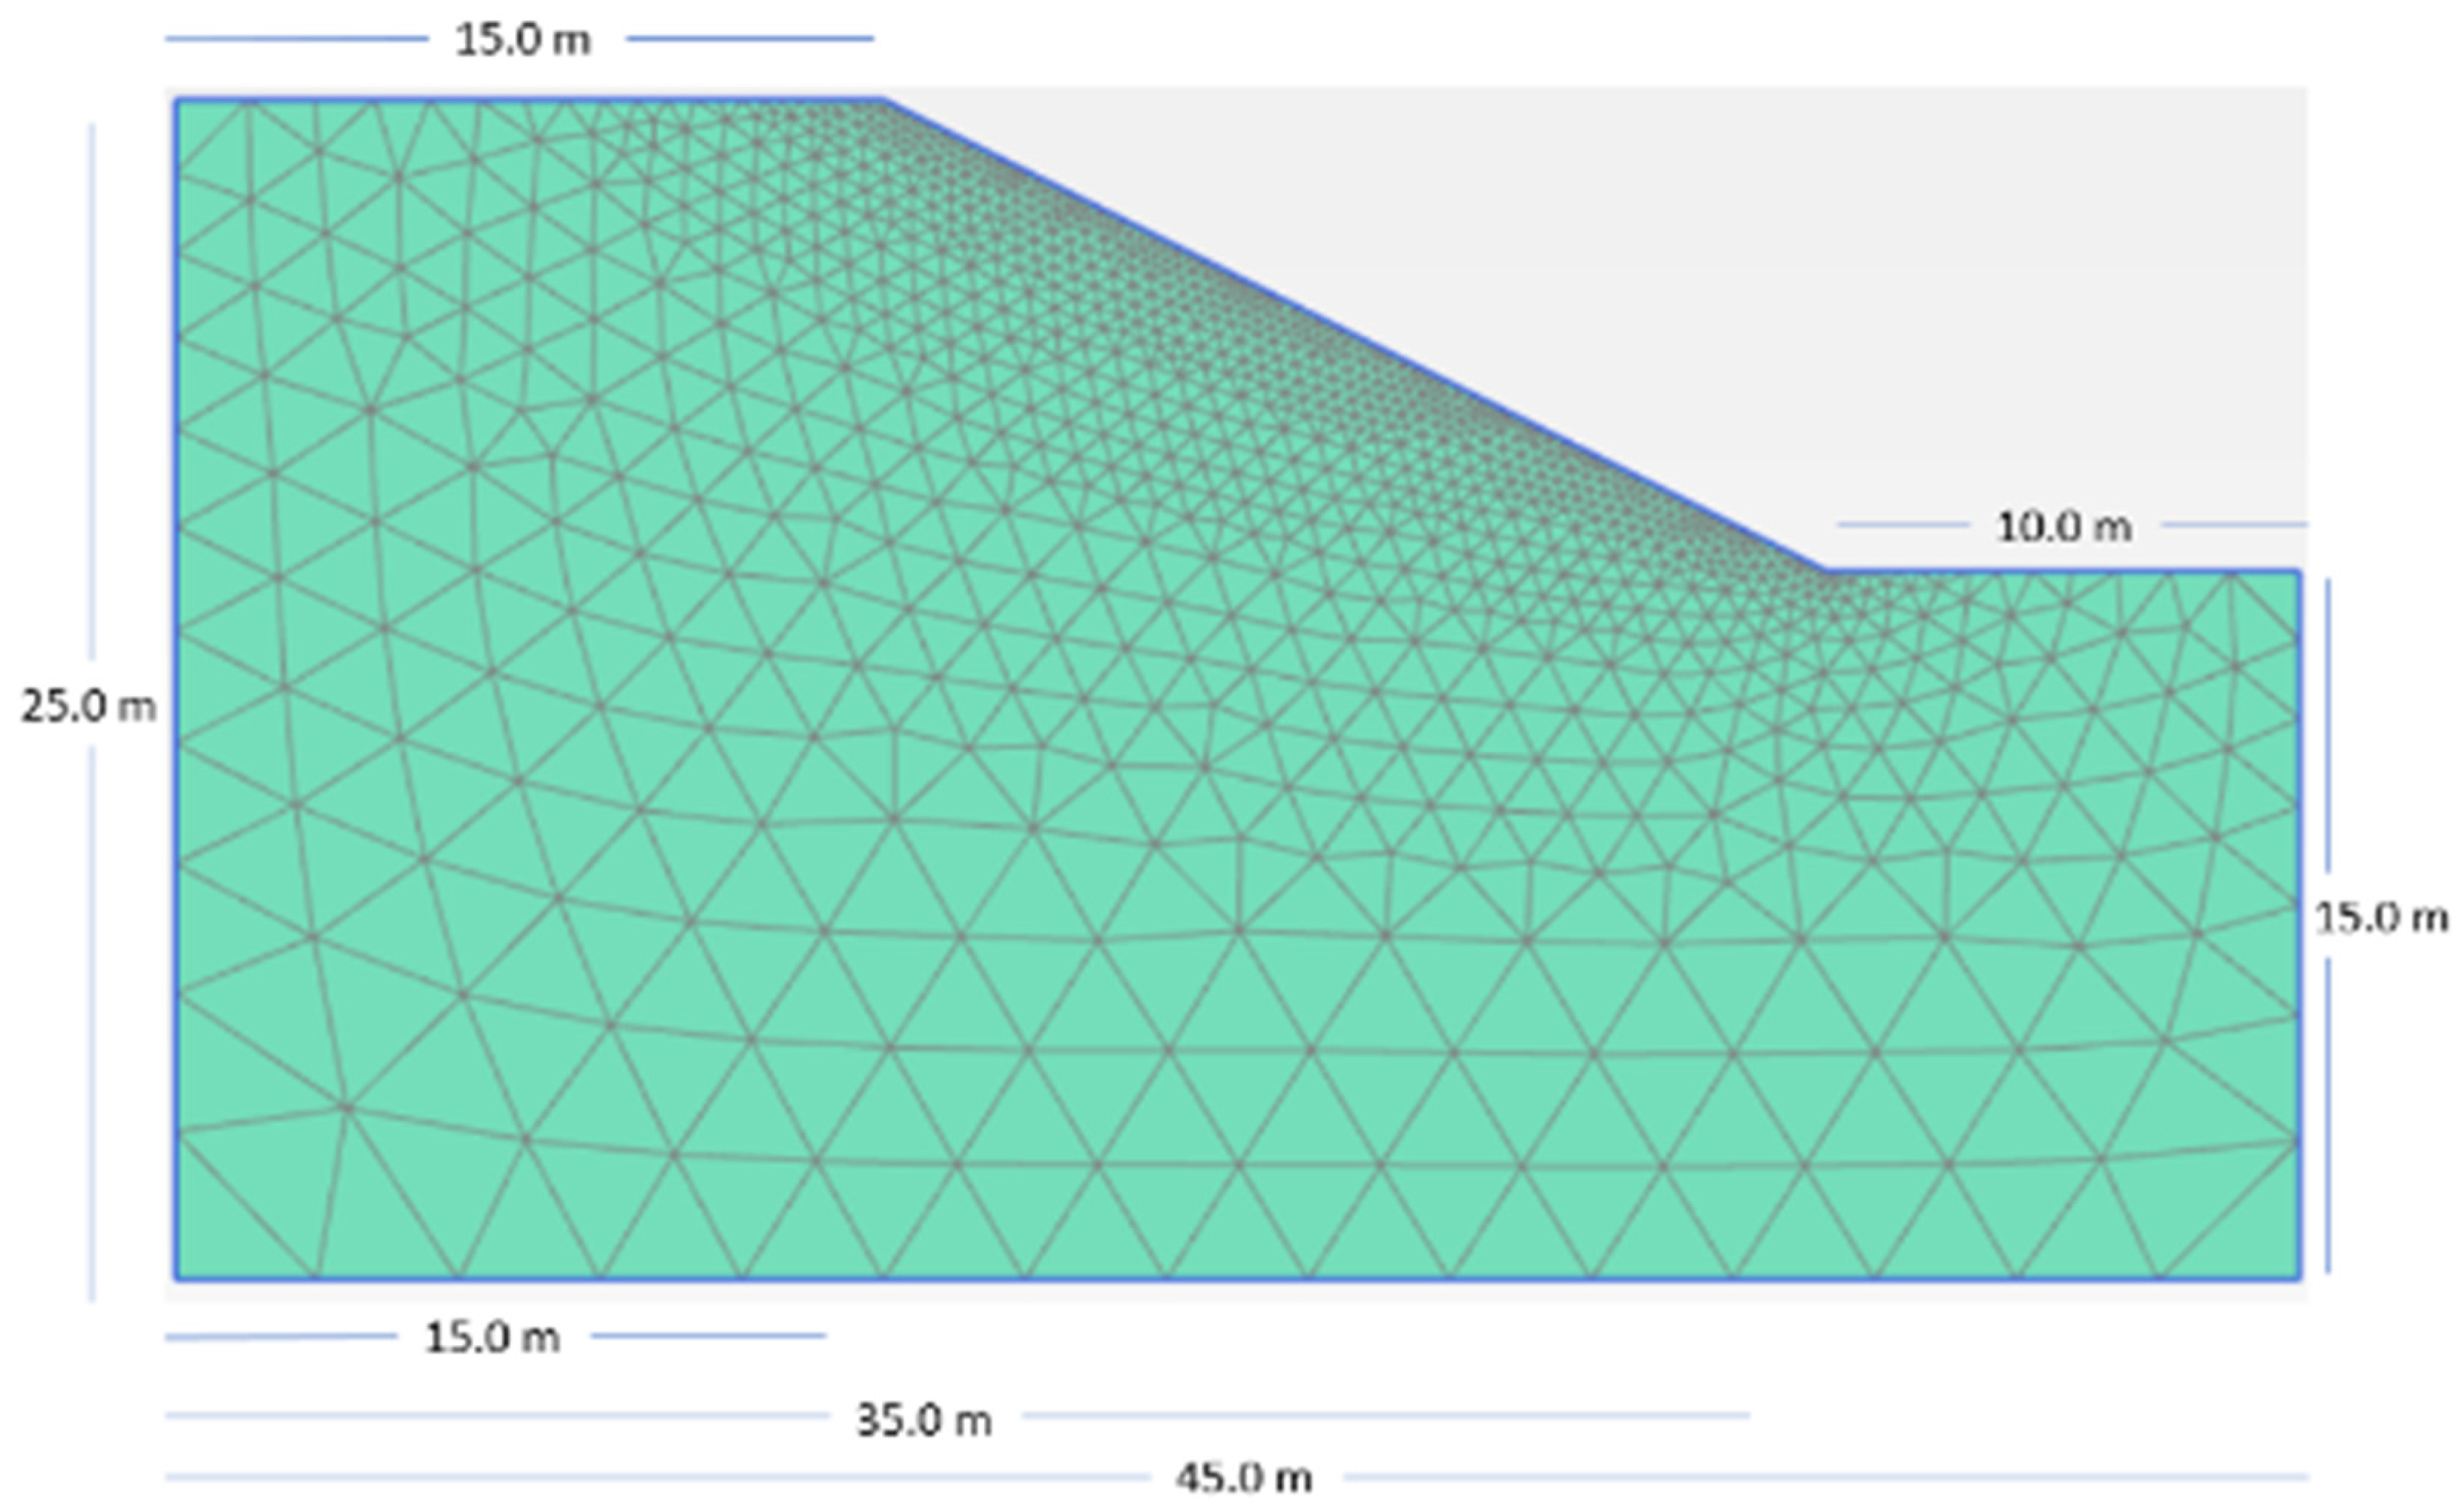
Slope geometry and typical mesh for finite element analysis.
Figure 19.
Slope geometry and typical mesh for finite element analysis.
Figure 20.
Annual Rainfall Trend for the Past 20 Years (2002-2021), Lunglei District (Mizoram Meteorological Department).
Figure 20.
Annual Rainfall Trend for the Past 20 Years (2002-2021), Lunglei District (Mizoram Meteorological Department).
Figure 21.
Unconfined compressive strength at different density and saturation levels.
Figure 21.
Unconfined compressive strength at different density and saturation levels.
Figure 22.
Variation in factor of safety with different rainfall intensity.
Figure 22.
Variation in factor of safety with different rainfall intensity.
Figure 23.
a) Deep critical failure surface without rainfall, b) Deep critical failure surface after 80 mm/day rainfall for 24 hours, c) Critical shallow transitional failure surface after 190 mm/day rainfall for 24 hours.
Figure 23.
a) Deep critical failure surface without rainfall, b) Deep critical failure surface after 80 mm/day rainfall for 24 hours, c) Critical shallow transitional failure surface after 190 mm/day rainfall for 24 hours.
Figure 24.
a & b are the initial pore water pressure and matric suction condition respectively, c & d are the pore pressure and matric suction condition after 80 mm/day rainfall respectively, e & f are the pore pressure and matric suction conditions after 190 mm/day rainfall respectively.
Figure 24.
a & b are the initial pore water pressure and matric suction condition respectively, c & d are the pore pressure and matric suction condition after 80 mm/day rainfall respectively, e & f are the pore pressure and matric suction conditions after 190 mm/day rainfall respectively.
Table 1.
Landslide hazard class and their corresponding area [
13].
Table 1.
Landslide hazard class and their corresponding area [
13].
| Hazard Class |
Area (Sq. km) |
Percentage (%) |
| Very high |
1822.48 |
8.65 |
| High |
4263.79 |
20.22 |
| Moderate |
8903.47 |
42.24 |
| Low |
5011.57 |
23.77 |
| Very low |
968.72 |
4.60 |
| Water body |
111.97 |
0.53 |
Table 2.
Index properties of the soil used for this study.
Table 2.
Index properties of the soil used for this study.
| Index properties of Soil |
|---|
| Gravel % |
1.5 |
| Coarse Sand % |
1.5 |
| Medium Sand % |
5 |
| Fine Sand % |
22 |
| Silt + Clay % |
70 |
| Silt % |
59.72 |
| Clay % |
10.28 |
| Liquid Limit % |
40 |
| Plastic Limit % |
08 |
| Plasticity Index % |
32 |
| Specific Gravity |
2.794 |
| Free Swell Index |
15 |
| Standard Proctor Optimum Moisture Content (%) |
17.50 |
| Standard Proctor Maximum Dry Density (gm/cc) |
1.755 |
| Modified Proctor Optimum Moisture Content (%) |
16.82 |
| Modified Proctor Optimum Dry Density (gm/cc) |
1.853 |
| IS Classification |
CI |
| Textural Classification |
Silt Loam |
Table 3.
Matric Suction at Different Density and Saturation of Soil sample.
Table 3.
Matric Suction at Different Density and Saturation of Soil sample.
| Dry Density (gm/cc) |
Saturation (%) |
Water Content (%) |
VWC |
Matric Suction (kPa) |
| 1.6 |
20 |
5.342 |
0.085 |
1170 |
| 40 |
10.684 |
0.171 |
784 |
| 60 |
16.025 |
0.256 |
389 |
| 80 |
21.367 |
0.342 |
123 |
| 100 |
26.709 |
0.427 |
37 |
| 1.65 |
20 |
4.963 |
0.082 |
1227 |
| 40 |
9.926 |
0.164 |
812 |
| 60 |
14.889 |
0.246 |
407 |
| 80 |
19.852 |
0.328 |
152 |
| 100 |
24.815 |
0.409 |
59 |
| 1.7 |
20 |
4.607 |
0.078 |
1296 |
| 40 |
9.213 |
0.157 |
849 |
| 60 |
13.820 |
0.235 |
432 |
| 80 |
18.426 |
0.313 |
184 |
| 100 |
23.033 |
0.392 |
76 |
| 1.75 |
20 |
4.270 |
0.075 |
1342 |
| 40 |
8.541 |
0.149 |
881 |
| 60 |
12.811 |
0.224 |
456 |
| 80 |
17.082 |
0.299 |
217 |
| 100 |
21.352 |
0.374 |
101 |
| 1.8 |
20 |
3.953 |
0.071 |
1389 |
| 40 |
7.906 |
0.142 |
823 |
| 60 |
11.859 |
0.213 |
471 |
| 80 |
15.812 |
0.285 |
249 |
| 100 |
19.765 |
0.356 |
139 |
| 1.85 |
20 |
3.653 |
0.068 |
1427 |
| 40 |
7.305 |
0.135 |
959 |
| 60 |
10.958 |
0.203 |
497 |
| 80 |
14.610 |
0.270 |
289 |
| 100 |
18.263 |
0.338 |
161 |
Table 4.
Microwave operating conditions as per ASTM D4643-08 [
20].
Table 4.
Microwave operating conditions as per ASTM D4643-08 [
20].
| Method Adopted |
Cumulative Drying Using Single Specimen |
| Soil Type |
CI Soil |
| Dry Density: |
1.60 gm/cc to 1.85 gm/cc |
| Initial Saturation (%) |
100% |
| Diameter of Specimens |
38 mm |
| Height of Specimens |
76 mm |
| Average Weight of Spcimens |
Ranges between 172 to 190 gm |
| Microwave Condition |
Microwaving without pre-heat and power saving mode (At 700 w) [20] |
Table 5.
Unconfined Compressive Strength of CI Soil at Different Degree of Saturation & Dry Density Combinations.
Table 5.
Unconfined Compressive Strength of CI Soil at Different Degree of Saturation & Dry Density Combinations.
| Dry Density (gm/cc) |
1.60 |
1.65 |
1.70 |
1.75 |
1.80 |
1.85 |
| Degree of Saturation (%) |
Unconfined Compressive Strength (kPa) |
| 20 |
103 |
134 |
299 |
254 |
232 |
195 |
| 40 |
132 |
352 |
384 |
229 |
413 |
554 |
| 60 |
197 |
335 |
474 |
411 |
550 |
564 |
| 80 |
179 |
208 |
232 |
434 |
530 |
417 |
| |
|
|
|
|
|
|
