Preprint
Article

Ligand-based pharmacophore modeling, virtual screening, and 2D quantitative structure-activity relationship performance on anti-Hepatitis B virus flavonols

Altmetrics

Downloads

181

Views

79

Comments

0

Submitted:

28 March 2024

Posted:

28 March 2024

You are already at the latest version

Alerts
Abstract
Background: Targeting Hepatitis B virus (HBV) infection in human is crucial due to its adverse. Herbal medicine has long been significant in this regard, with flavonoids demonstrating promising results. Hence, establishing a way of identifying flavonoids with anti-HBV activities is the aim of the present study. Methods: Flavonoid structures with anti-HBV activities were retrieved. A flavonol-based pharmacophore model was established using LigandScout v4.4. Screening was performed using the PharmIt server. A QSAR equation was developed and validated with independent sets of compounds. Applicability domain (AD) was defined using Euclidean distance calculations for model validation. Results: The best model, consisting of 57 features was generated. HTS using the flavonol-based model resulted in 509 unique hits. The model's sensitivity and specificity were 71% and 100%, respectively. The QSAR model with two predictors, x4a and qed, exhibited strong predictive performance with an adjusted-R² value of 0.85 and 0.90 of Q2. Conclusion: The QSAR model has been validated with two separate chemical sets, guaranteeing the model's reproducibility and usefulness for other flavonols by utilizing the predictive characteristics of X4A and qed. These results provide new possibilities for discovering future anti-HBV drugs by integrating modeling and experimental research.
Keywords: 
Subject: Biology and Life Sciences  -   Virology

1. Introduction

Hepatitis B virus (HBV) is a significant worldwide health problem because it can lead to acute and chronic liver infections [1,2]. HBV is a DNA virus with partial double-stranded characteristics, and a member of the Hepadnaviridae family. The global health impact is significant, affecting more than 300 million individuals with chronic HBV (CHB) [3] infections and causing approximately 820,000 deaths each year from complications such as cirrhosis and hepatocellular carcinoma [4]. One major obstacle presented by HBV is its ability to persist in the hepatocytes of the host, which can result in the development of chronic infection from an initial acute infection [5,6,7,8,9]. It is also associated with miscarriage and premature birth in pregnant women who are infected [10,11]. In long-term, CHB condition raises the chance of serious liver diseases, such as liver cirrhosis, liver failure, and a higher probability of developing hepatocellular carcinoma (HCC). HBV mainly spreads through contact with infected blood or bodily fluids, posing a risk for healthcare workers, drug users, and those having unprotected sex [12]. Moreover, HBV can be passed from mother to child during childbirth [8,9]. HBV deceptively can stay symptomless for long periods, causing gradual immune-mediated damage to the liver, and its detection is limited to the sensitivity of the currently available techniques. This feature, combined with the potential for transmission by asymptomatic carriers, highlights the crucial need for effective prevention, early detection, and control of HBV infections worldwide.
Currently available HBV treatment strategies focus on inhibiting viral replication, decreasing liver inflammation, and avoiding future complications [3,13,14]. Nucleoside analogs (such as lamivudine, tenofovir) and nucleotide analogs (such as entecavir) are essential components of HBV treatment. These antiviral drugs function by blocking the reverse transcriptase enzyme, which is necessary for HBV DNA replication. Pegylated interferon-alpha, along with other interferon-based treatments, provides both antiviral and immunomodulatory benefits. Recently, there have been promising developments with direct-acting antivirals (DAAs) like Bulevirtide (Myrcludex-B) [15,16,17,18] and capsid assembly modulators (CAMs) [19,20,21,22] that are progressing in different clinical trial phases, targeting specific stages in the HBV life cycle. The development of innovative therapeutic advancements in treating CHB infection is primarily driven by the need to overcome several challenges that hinder the achievement of successful and persistent virological responses with current FDA-approved medications. Accordingly, the emergence of drug resistance is a major expected concern in viral infection, especially when nucleos(t)ide analogs are used for an extended period of time [23]. Patients may need continuous treatment throughout their lives to ensure that the virus remains suppressed, which may result in challenges with adherence and possible side effects [24]. Interferon-based treatments frequently lead to flu-like symptoms, tiredness, and depression [25], which reduce their tolerability. Therefore, there is still a crucial demand for effective treatment approaches that are strong, safe, and able to achieve long-lasting virological response without the emergence of resistance. In this regard, nature always offers potential sources of yet remained to be discovered antiviral chemicals.
Flavonoids are a varied category of natural substances that are plentifully present in fruits, vegetables, and medicinal plants [26]. These compounds are being noticed for their possible antiviral effects, displaying potential in blocking different phases of HBV life cycle as we have reviewed before [27]. Research has shown that flavonoids can disrupt viral entry, replication, and assembly, making them promising options for antiviral treatment. A variety of different flavonoid subclasses are introduced with different mechanisms of action against HBV. Accordingly, Quercetin is distinguished among flavonoids for its capacity to block the production of HBsAg and HBeAg, important indicators of HBV replication [28,29,30]. Moreover, Baccharis species like B. spicata contain 5-caffeoylquinic acid (5-CQA) and 3,5-dicaffeoylquinic acid (3,5-DCQA) which have shown antiviral effects against HBV [31]. These compounds exhibit potential in decreasing viral DNA synthesis and viral reproduction, making them possible contenders for additional investigation in creating new antiviral treatments for HBV. Ongoing research in this field reveals that the wide variety of flavonoids discovered in the natural world could offer a valuable resource of possible antiviral treatments for fighting against HBV and other viral infections.
Due to diversification of flavonoids from different herbal species they probably possess different pharmacological activities that might be preserved among flavonoids from same subclass of different plant species. In this regard, a pharmacophore-based model was generated with 100% specificity to discovery novel flavonoids with potent anti-HBV activities. Furthermore, the flavonoids with antiviral activities against HBV used for establishing a robust and reliable QSAR model for predicting the probable activities of novel compounds. The findings of the present study also can be deployed for creating the stand-alone applications, and to highlight plants with potent flavonoids from diverse herbariums.

2. Materials and Methods

Retrieving Flavonoids’ Structures

The flavonoid compounds experimentally approved for their anti HBV activities were reviewed before [27], and the 3D structures of them were obtained from chemical databases, PubChem (https://pubchem.ncbi.nlm.nih.gov/) [32] and ChEMBL (https://www.ebi.ac.uk/chembl) [33].

Establishing Pharmacophore Model

The flavonol-based pharmacophore model was created with LigandScout v4.4 [34] as described before [35]. The compounds were grouped into the flavonoid subclasses as reviewed before [27]. Accordingly, a set of nine flavonols with anti-HBV activities, including Kaempferol [29,36], Isorhamnetin [36], Icaritin [37], Hexamethoxyflavone (Hex) [38], Chrysoeriol-6-C-b-D-boivinopyranosyl-41-O-b-D-glucopyranoside [39], Hyperoside (quercetin-3-O-galactoside) [40,41], Quercetin-3-O-glucuronide (Q3G) [29], [28,36], and Myricetin 3-rhamnoside [30] was used to train the model.
Furthermore, eight flavones (Luteolin 7-O-glucuronide [42], Isovitexin [43], Isoorientin [44], [45,46], [47], Swertisin [48], 4K [49], and Robustaflavone [50]), three flavanones ((-)-Epigallocatechin-3-gallate [51,52,53,54,55,56], oolonghomobisflavan C (OHBF-C) [57], and sikokianin A [58]), one anthocyanin (proanthocyanidin [57]), one chalcones (rosmarinic acid [59]), one biflavonoid ([60]), and one isoflavone (compound 8f [61]) were used to test and validate the model. Further polyphenols and triterpenes with anti-HBV activities, including PHAP [62], Nobiletin, Linalool [63], Betulinic acid [64], Ursolic acid [65], Taraxasterol [66], and Solamargine [67] were also included as decoys.
The compounds were clustered according to the pharmacophore RDF-code similarity measure with maximum cluster distance calculation methods. To generate the flavonol-based pharmacophore model, the conformers were generated according to the software iCon best setting. Briefly, maximum number of conformers value was set to 200 with energy window of 20.0 and max pool size of 4000. The model was created based on pharmacophore fit and atom overlap scoring function. Also, pharmacophore type was based on Merged Feature Pharmacophore to assure each feature is scored and those that do not match all input molecules are removed. Further settings were kept as its default. The best developed model based on the higher score was adopted for virtual screening.

Screening Large Chemical Database

According to our previous study on screening chemicals in a large database of natural and herbal products for the discovery of novel antiviral compounds [68], the PharmIt server (https://pharmit.csb.pitt.edu/search.html) was used for high-throughput screening (HTS) of the flavonol-derived pharmacophore model. In this regard, eleven built-in libraries comprised of 1,652,702,330 conformations of 347,839,756 compounds, including CHEMBL32, ChemDiv, ChemSpace, Enamin, MCULE, MCULE_ULTIMATE, MolPort, NCI_Open, PubChem, WuXi LabNetwork, and ZINC were screened. No filter was applied on the screening process. Moreover, the hit that matched all the pharmacophore features was preserved to provide a library for assessing the precision of the model.

Creating Chemical Libraries and Assessing Model Precision

Two datasets of chemical libraries were made to evaluate the accuracy of the established flavonol-based pharmacophore model. The relatively fitted hits (with diverse RMSD values) from the PharmIt screening results was employed to establish the first library set of compounds relatively matched to the model. As reported before, the hits from the built-in datasets might composed of duplications. The duplications were removed with Open Babel command line as described before [69]. The second decoy set was derived from the previous study consisting 1.7K Lipinski's rule of five-filtered FDA approved drugs to evaluate the specificity of the model [70]. The accuracy is reported in a receiver operating characteristic (ROC) curve.

Establishing a Predictive QSAR Equation

Same combinations that used to develop the pharmacophore model, used to establish a reliable predictive 2D quantitative structure-activity relationship (QSAR). Accordingly, RDKit (http://www.rdkit.org/), Mordred [71], and Dragon [72] tools were used to calculate 202, 1348, and 2489 descriptors for each molecule, respectively, in the setting of UseGalaxy server (https://usegalaxy.eu/) [73,74]. The calculated descriptors were checked to identify and remove duplications and constant or near-constant variables. The rest of the descriptors were retained to predict the biological activity (IC50 μM) of flavonol compounds and the response variable. The response biological activity variable was extracted from literature. The activity of compounds that was reported as g.L-1 was converted to μM according to the following formula:
µ M = µ g M L / M W × 1000
Where µM is the concentration in micromolar, µg/mL is the concentration in micrograms per milliliter, and MW is the predicted molecular weight.
Microsoft Excel (MS-Excel) v2019 was used to perform the QSAR modeling with multiple linear regression (MLR) as we have reported before [75,76]. Accordingly, the model was built using a 95% confidence interval (CI) and a tolerance level of 0.0001. The model was validated using two separate sets of test observations: one with random samples of non-flavonol flavonoids, and another with non-flavonoid compounds. This method enabled assessing the model's replicability by conducting two separate runs of the multiple linear regression (MLR) test with the same explanatory variables.
The process of selecting the model involved finding the best model based on the adjusted R². The number of predictor variables in the models were considered within a range of 2 to 4. HC0 was utilized for applying covariance adjustments through the Newey West (adjusted) method of heteroscedasticity. Cook's distances threshold > 1 was used to identify outliers or leverage observations in the statistical model. The established model was also tested on a set of anti-HBV flavonols rather than those used for model training. The Goodness of Fit statistics, including coefficient of determination (R2), adjusted R2, mean squared error (MSE), root mean squared error (RMSE), and mean absolute percentage error (MAPE). Furthermore, the consistency between the predicted and actual observations in the external flavonol set was determined by squared cross-validated coefficient (Q2).

Multicollinearity Measurement

To evaluate multicollinearity in the QSAR model, the Variance Inflation Factor (VIF) was calculated among the independent variables. The following formula was used to calculate the VIF values for each included predictor.
V I F i = 1 1 R i 2
Where ​ R i 2 represents the coefficient of determination achieved by performing a regression of the i th independent variable on all other independent variables. If VIF was greater than 10, it was considered as a multicollinearity. This was carried out to assurance the stability and credibility of the model's predictions.

Principal Component Analysis

The training flavonols set and selected predictors was used for PCA analysis. This was carried out in order to reduce the dimensionality of data, visualize connections between variables, and identify trends in compounds through their molecular properties. Additionally, the exact molecular weight (ExactMolWt) was incorporated as a dummy variable [76]. This indicated the weight of each molecule in the data set. A PCA was carried out using Pearson correlation to investigate the relationship between variables. Additionally, the variables were not standardized before conducting PCA. This means that in the PCA analysis the original scale of the variables was maintained. The principal components (PCs) were subjected Varimax rotation with Kaiser normalization. Five PCs were identified within the dataset to offer an overview of the underlying framework. The findings consisted of a symmetrical biplot that displayed the connections between compounds and features in one graph. The coefficients of the biplot were automatically calculated for visualization. Furthermore, a Bootstrap (on 50 samples) observation chart was developed to assess the reliability of the PCA results.

Applicability Domain (AD) Assessment

The Euclidean distance ( d ) was determined for each compound in both the training and external prediction sets using MS-Excel v2019 using the formula described below. A threshold for determining the validity range was calculated by summing the mean d in the training set and the standard deviation, multiplied by two. This limit represents the maximum distance at which a compound is judged to be within the model's AD. The d value of each chemical in the external prediction set was also calculated. If a compound's distance surpassed the threshold, it was categorized as 'Outlier'; otherwise, it was labeled as 'Inlier'.
d = P r e d i c t e d   I C 50 O b s e r v e d   I C 50 2 T h r e s h o u l d = M e a n   o f   d + 2 × S t d . d e v   o f   d

3. Results

Flavonol-Based Pharmacophore Models

Among the generated pharmacophore models, the best one with the score of 130.7671 was selected (Figure 1). The model was comprised of 57 features, including 1 hydrophobic center, 3 aromatic rings, 7 H bond acceptor regions (HBA), 4 H bond donors, and 42 exclusive volumes. Different range of conformer (1 to 200) was generated for each ligand to find the best matched conformation. The mean of pharmacophore score for training set was 121.01 ± 11.96 (minimum and maximum of 103.4 and 132.54, respectively). Also, the score for the validation set was 49.35 ± 31.36 (minimum of 30.23 and maximum of 106.24). The established model was used for HT screening.

Virtual Screening

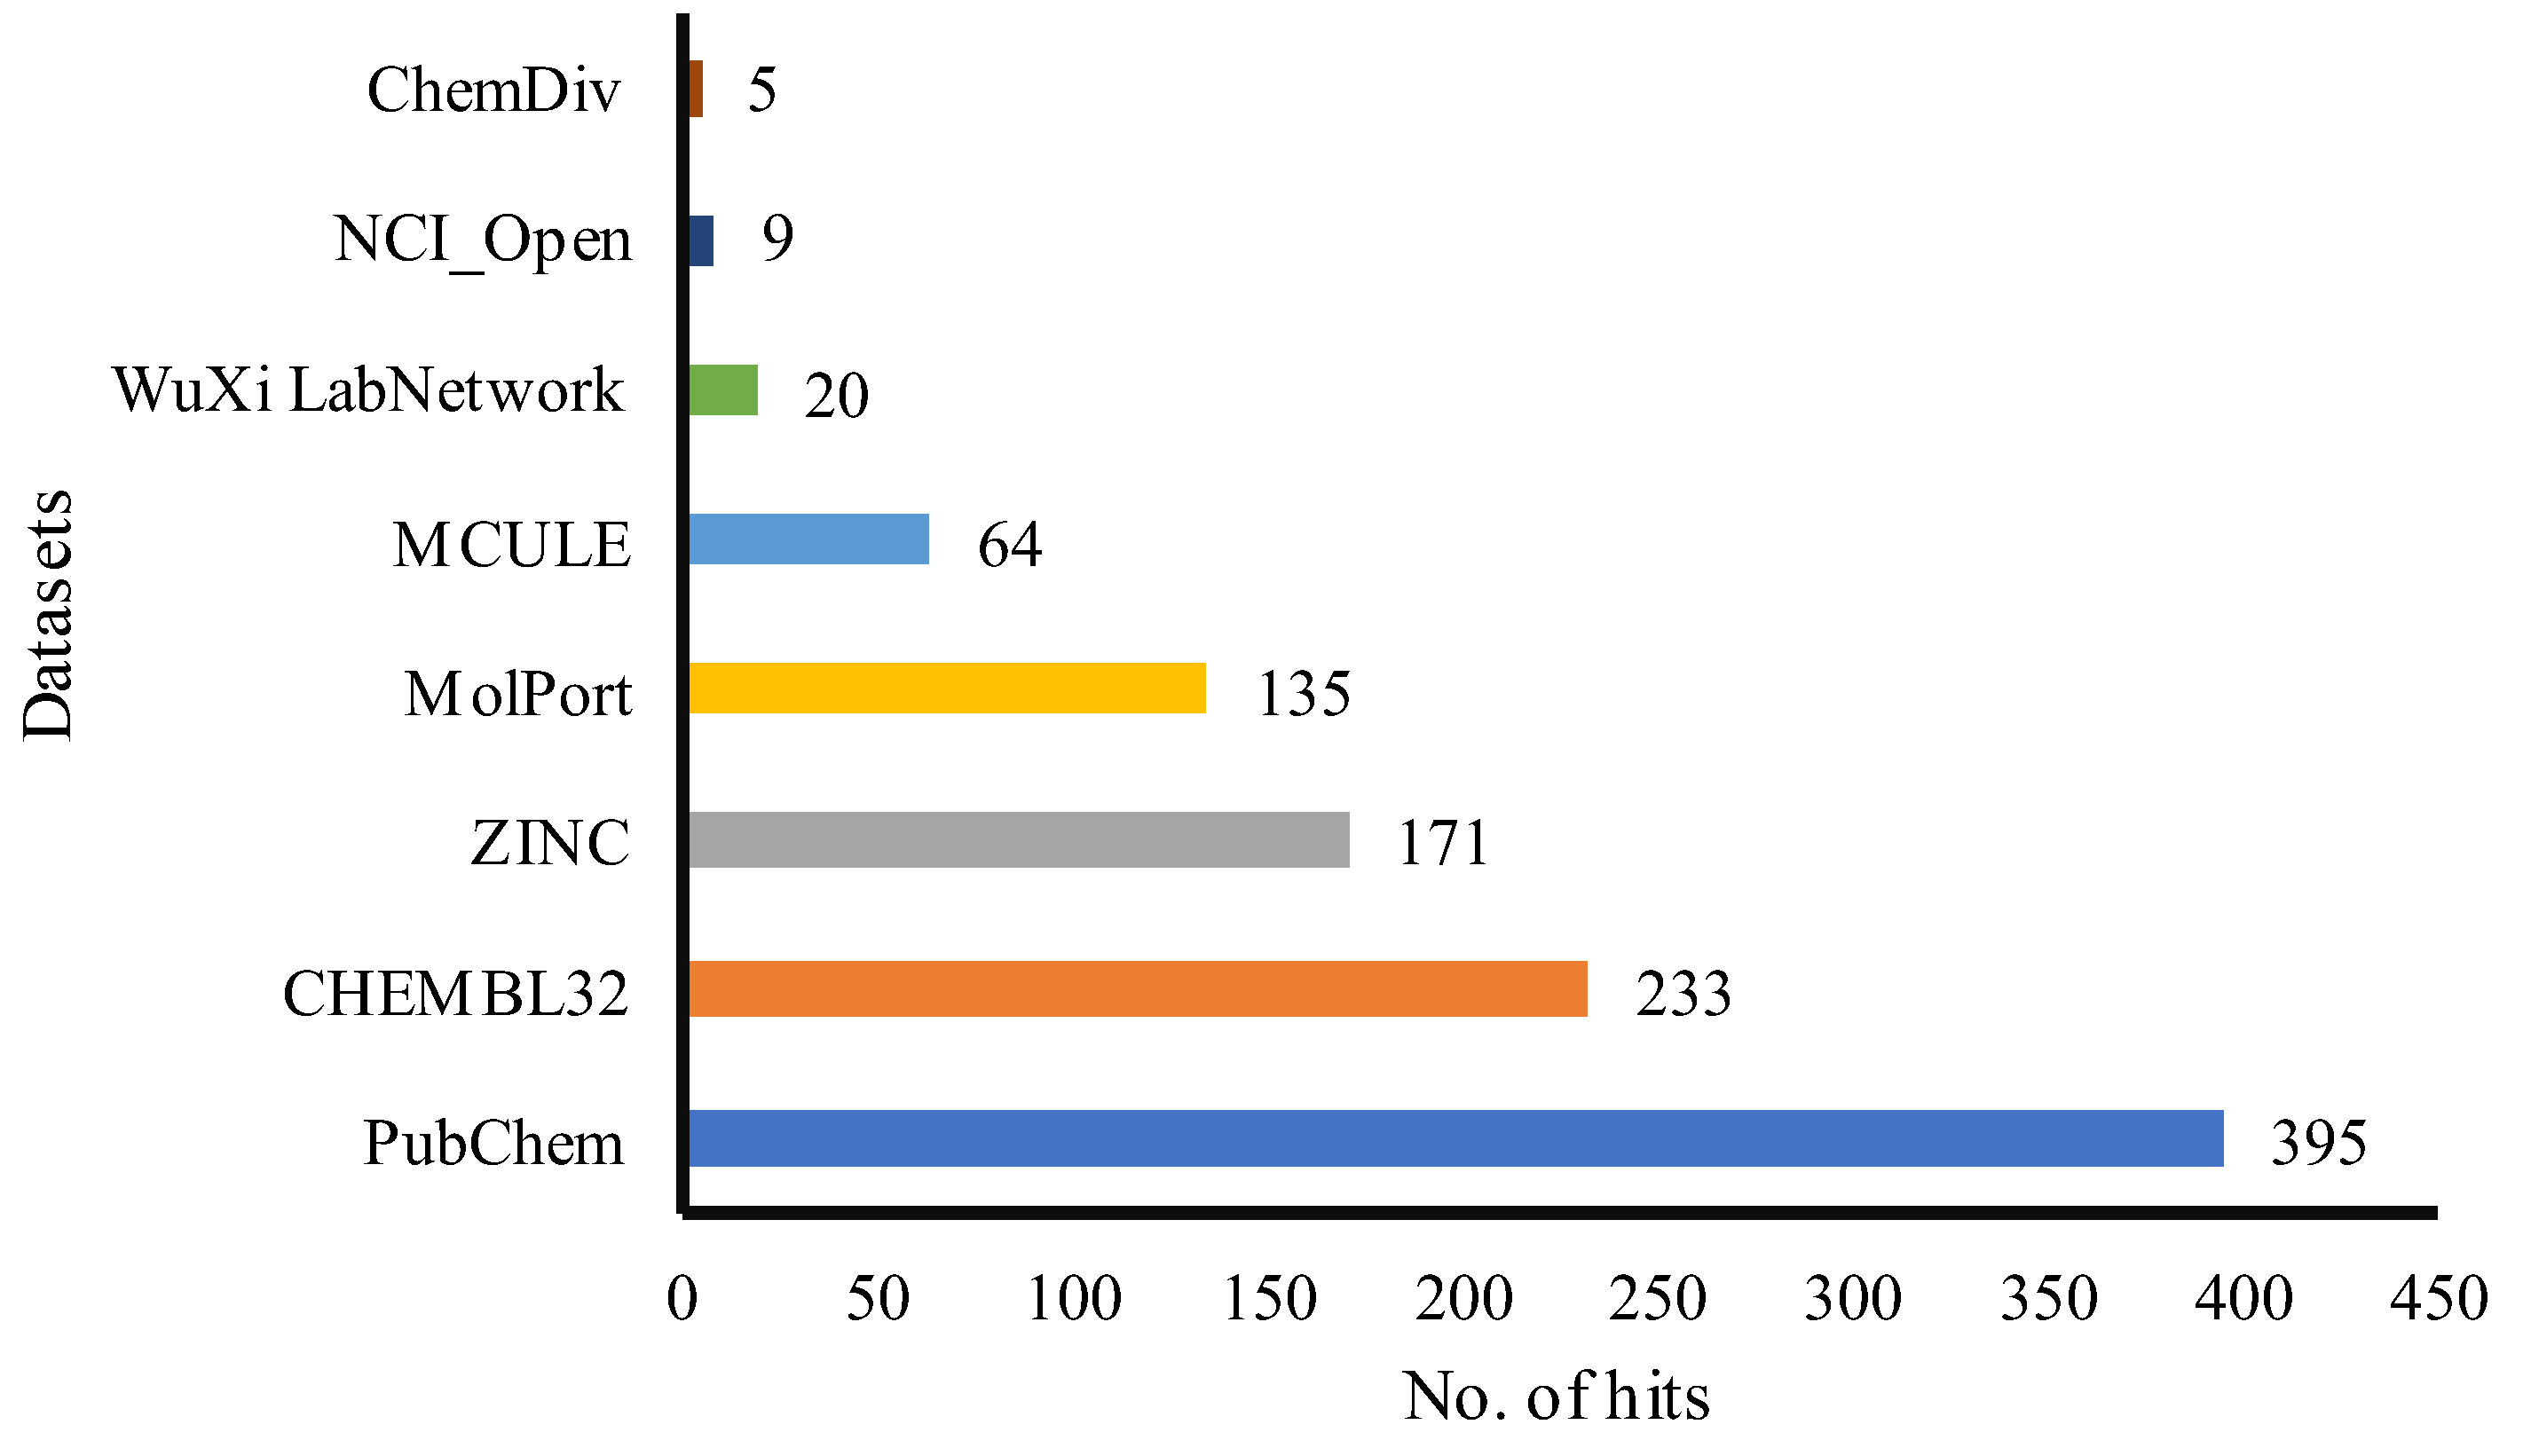
The flavonol-based model was deployed for a high-throughput screening (HTS) in the PharmIt database, resulting in 1,032 hits. Figure 2 shows that more hits were found in the PubChem dataset. After removing repeated entries, 509 distinct hits were discovered and used for establishing of a library of active compounds to evaluate the model's precision. To further confirm the accuracy of the model, another set of FDA-approved chemicals was used. The validation process assumed that the library from HTS primarily had active compounds, which were then matched with the pharmacophore model using an algorithm that only chose those with a strong pharmacophore feature correspondence. On the other hand, even though the FDA database may not have enough flavonoids for specific model comparison, it was still used to test the overall performance of the model as a decoy set.
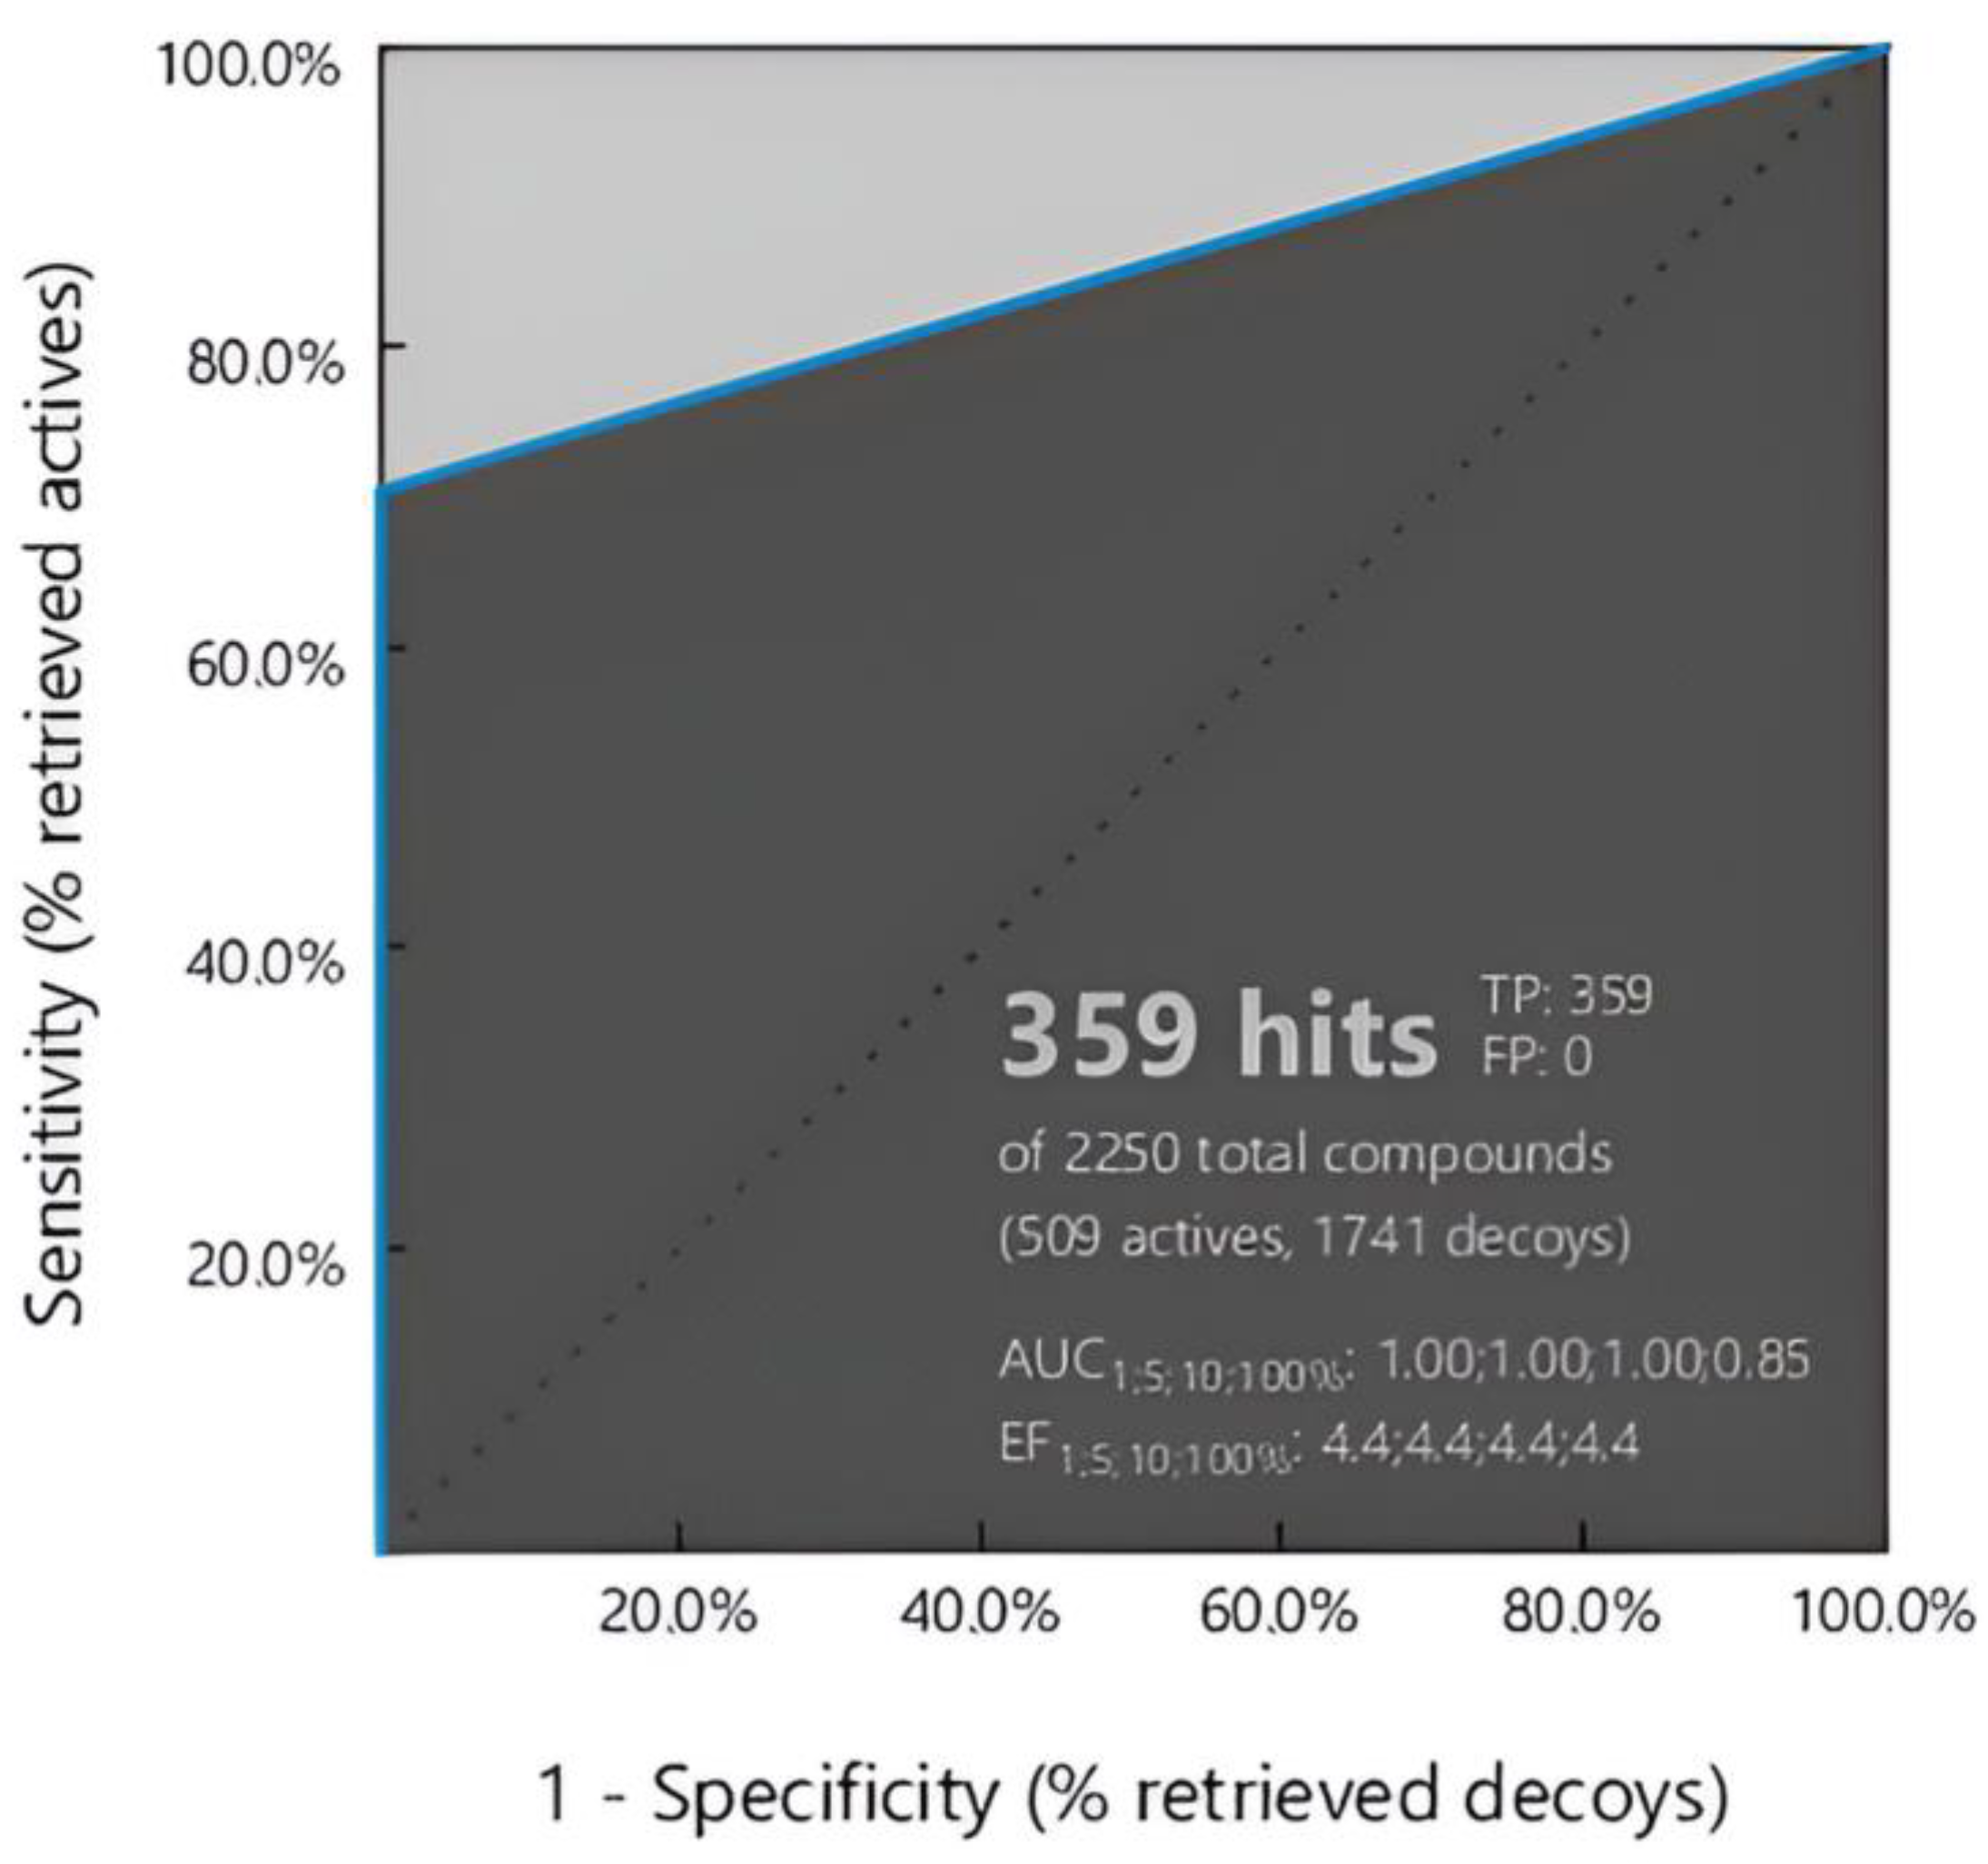
According to Figure 3, the model was assessed using ROC curve analysis, showing a sensitivity of 71% and a specificity of 100%. The discriminative ability of the model was highlighted by the Area Under the Curve (AUC) values, which were 1.00, 1.00, 1.00, and 0.85 for cutoffs of 1%, 5%, 10%, and 100%, respectively. Furthermore, the Enrichment Factor (EF) measurements highlighted the effectiveness of the model in detecting true positives, showing EF values of 4.4 at the tested thresholds. Most importantly, the model showed zero false positives (FP), validating its accuracy and reliability in identifying active compounds. Taken together, these findings show the strength and possible usefulness of the flavonol-based model in identifying compounds that match pharmacophores, providing important information for future drug discovery efforts.

The QSAR Model

The QSAR model was established to reliably predict the biological properties of the flavonols used in constructing the pharmacophore model. However, two observations were randomly separated to be used as the external validation set. Different models were created using varying numbers of random internal validation sets of the non-flavonol flavonoids or non-flavonoids. The best model with the highest adjusted R2 was selected for the report. The selected model was trained using Kaempferol, Isorhamnetin, Icaritin, Hexamethoxyflavone, Chrysoeriol-6-C-b-D-boivinopyranosyl-41-O-b-D-glucopyranoside, Hyperoside, and Q3G. Also, the random validation test sets were consisted of matched numbers of flavonoids (Proanthocyanidin, Amentoflavone, Rosmarinic acid, Sakuranetin, OHBF-C, Luteolin 7-O-glucuronide and Isovitexin) or non-flavonoids (PHAP, Nobiletin, Linalool, Betulinic acid, Ursolic acid, Taraxasterol, and Solamargine). This was due to the limited number of training set, and preventing from bias in the model.
Three sets of 2D descriptors were generated using RDKit, Dragon, and Mordred. After removing duplications and constant or near-constant variables the final number of predictor variables was 759. The results of the variable selection of modeling process are summarized in Table 1. Based on the Type III sum of squares, only two variables, the average connectivity index of order 4 (X4A) and the quantitative estimate of drug-likeness (qed) had significant information to explain the variability of the biological activities. Among the explanatory variables, based on the Type III sum of squares (Table 2), X4A was more influential. No multicollinearity was observed for these predictors (VIFs < 10). It was also observed that same predictors are adequate for establishing the model either with non-flavonol flavonoids as the internal validation test set or non-flavonoids compounds. This suggests that same variables distinguish flavonols from other compounds, and determine the specificity of the model.
The fitness and performance of the selected model was also further measured in training- and test-sets by Goodness-of-fit statistics (see Table 3). Accordingly, the model achieved a R² value of 0.87 for the training set. The Adjusted R² value of 0.85 further confirmed the robustness of the model, indicating that the inclusion of descriptors appropriately balances model complexity and goodness of fit. As a findings the model’s error metrics were small, suggesting a relatively good accuracy of the trained model in predicting the observations. Also, Q2 (0.9) was significantly high, indicating a good prediction power of the model on the external prediction set (see AD analysis results). Furthermore, the model error parameters in the validation sets were interestingly differ. MSE, RMSE, and MAPE were substantially lower in the model validated by the non-flavonol flavonoids than that validated by non-flavonoids. This suggests the association between all flavonoids, and yet discriminative power of the model on the flavonol compounds.
Further analysis of variance (ANOVA) results showed that the model is statistically significant (95%CI F = 36.91 df(2), p < 0.0001), indicating that the selected descriptors collectively have a significant impact on the biological activities of the compounds. The model explains a significant amount of the variability in the data, as indicated by the high sum of squares associated with the model (7589.40). The model over fitness was checked by the standardized coefficients measured for the variables in the mode (Table 4). Furthermore, the robustness of predictive strength of the model was evaluated by the analysis of residuals (Table 5 and Table 6).
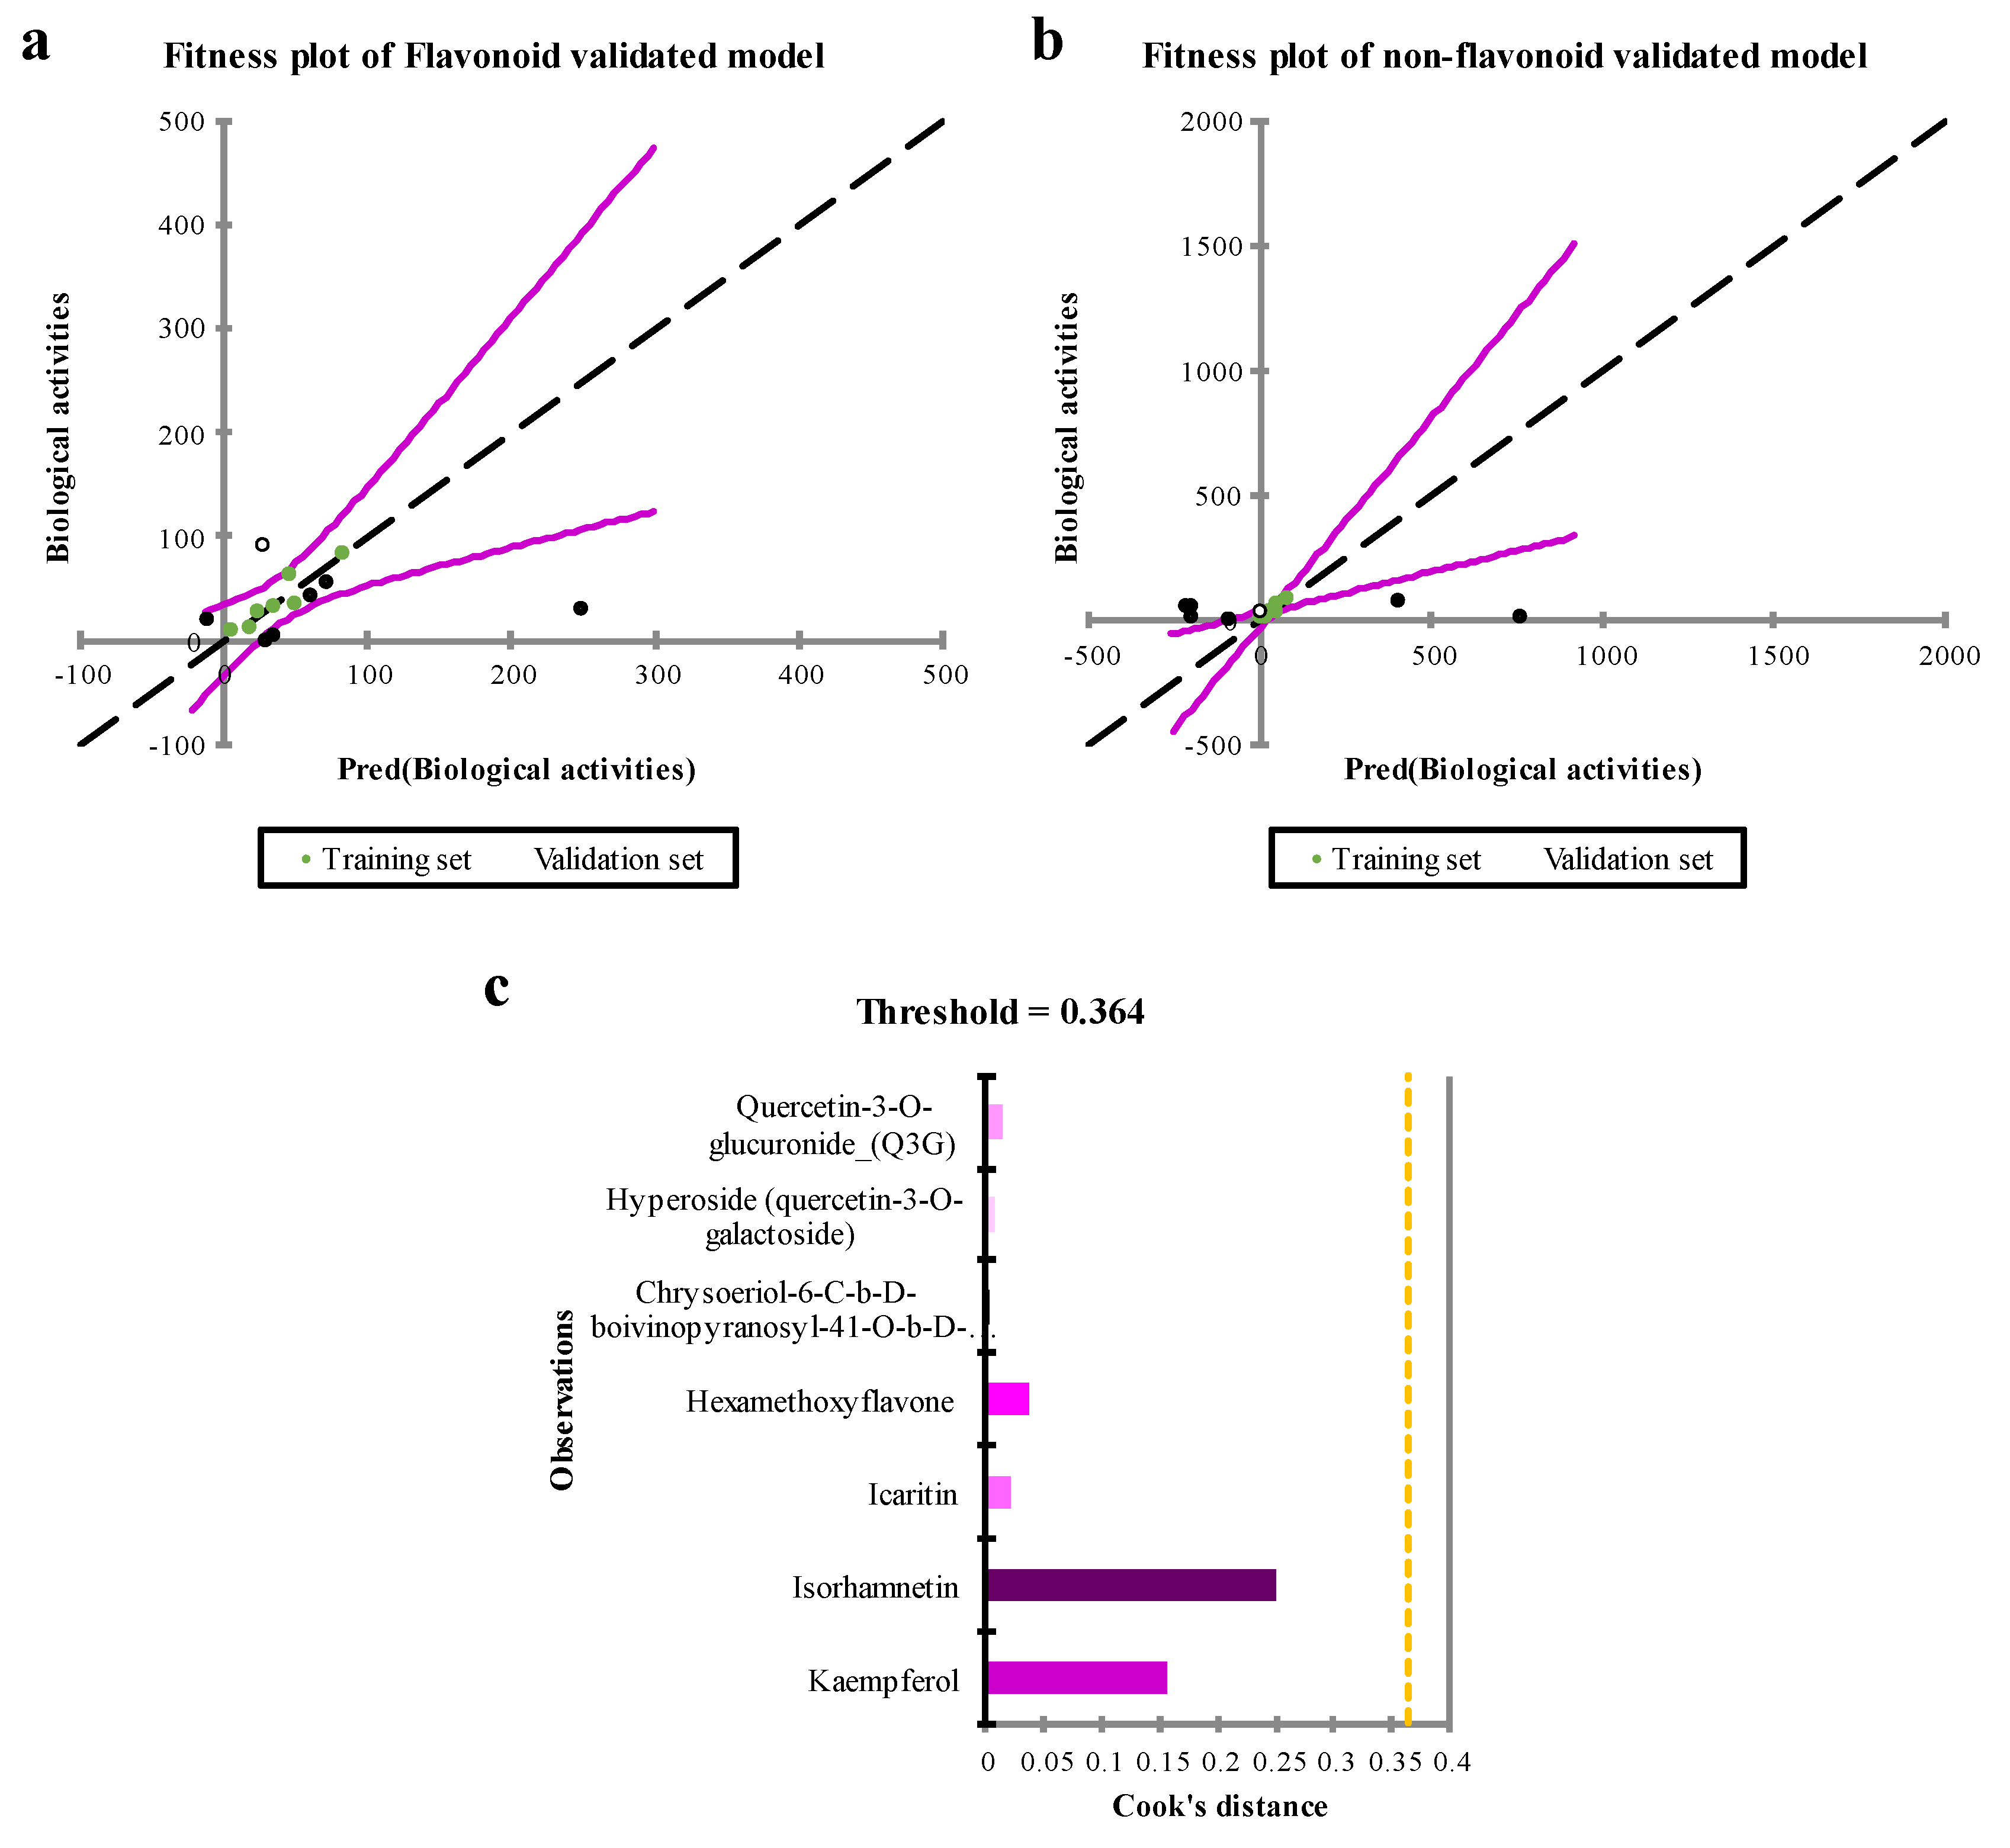
The fitness plot (Figure 4a,c) also shows the best fitted linear regression of predicted observations within training set. Comparing models validated with non-flavonol flavonoids and non-flavonoids highlights unique features in the linearity and fitness of their training sets. The model tested with chemicals that are not flavonoids shows a stronger level of linearity and fitness (Figure 4b) when compared to the training set. However, the model confirmed using flavonoids also shows significant fitting ability. These results emphasize the importance of using distinct validation sets to thoroughly investigate structural variations in flavonoids. Furthermore, the Cook’s distance metrics (Figure 4b) was checked, and no outliers were observed (Cook’s distance < 1).

Applicability Domain (AD) Analysis

AD analysis was performed to determine the range of chemical space where the QSAR model can make reliable predictions, and to identify the boundaries of the training data in which predicted biological activities of the external set fall within, ensuring that the model is applicable to predict for same compounds. Unfortunately, the number of flavonols were limited. Of nine compounds, seven were randomly used to train the QSAR model, and the rest were used to perform Euclidian distance (d) calculation and determining AD of the model. Two flavonols, Quercetin and Myricetin 3-rhamnoside, used as an external validation set. The compounds' predicted biological activities were measured in terms of distance, and if it fell within the specified threshold, it was considered an inlier, indicating the model's applicability.
The mean calculated d for the training set was 7.06 ± 5.56. As described above, the threshold was measured as 2x St.dev plus mean d . Accordingly, the threshold was set as 18.178. As showed in Figure 3, the calculated d for both compounds were inlier, indicating the applicability of the model for other flavonols with anti-HBV activities.
Figure 5. AD of the predicted external validation set. The size of the circle is based on the calculated d
Preprints 102475 g005

PCA Measure of the Predictors

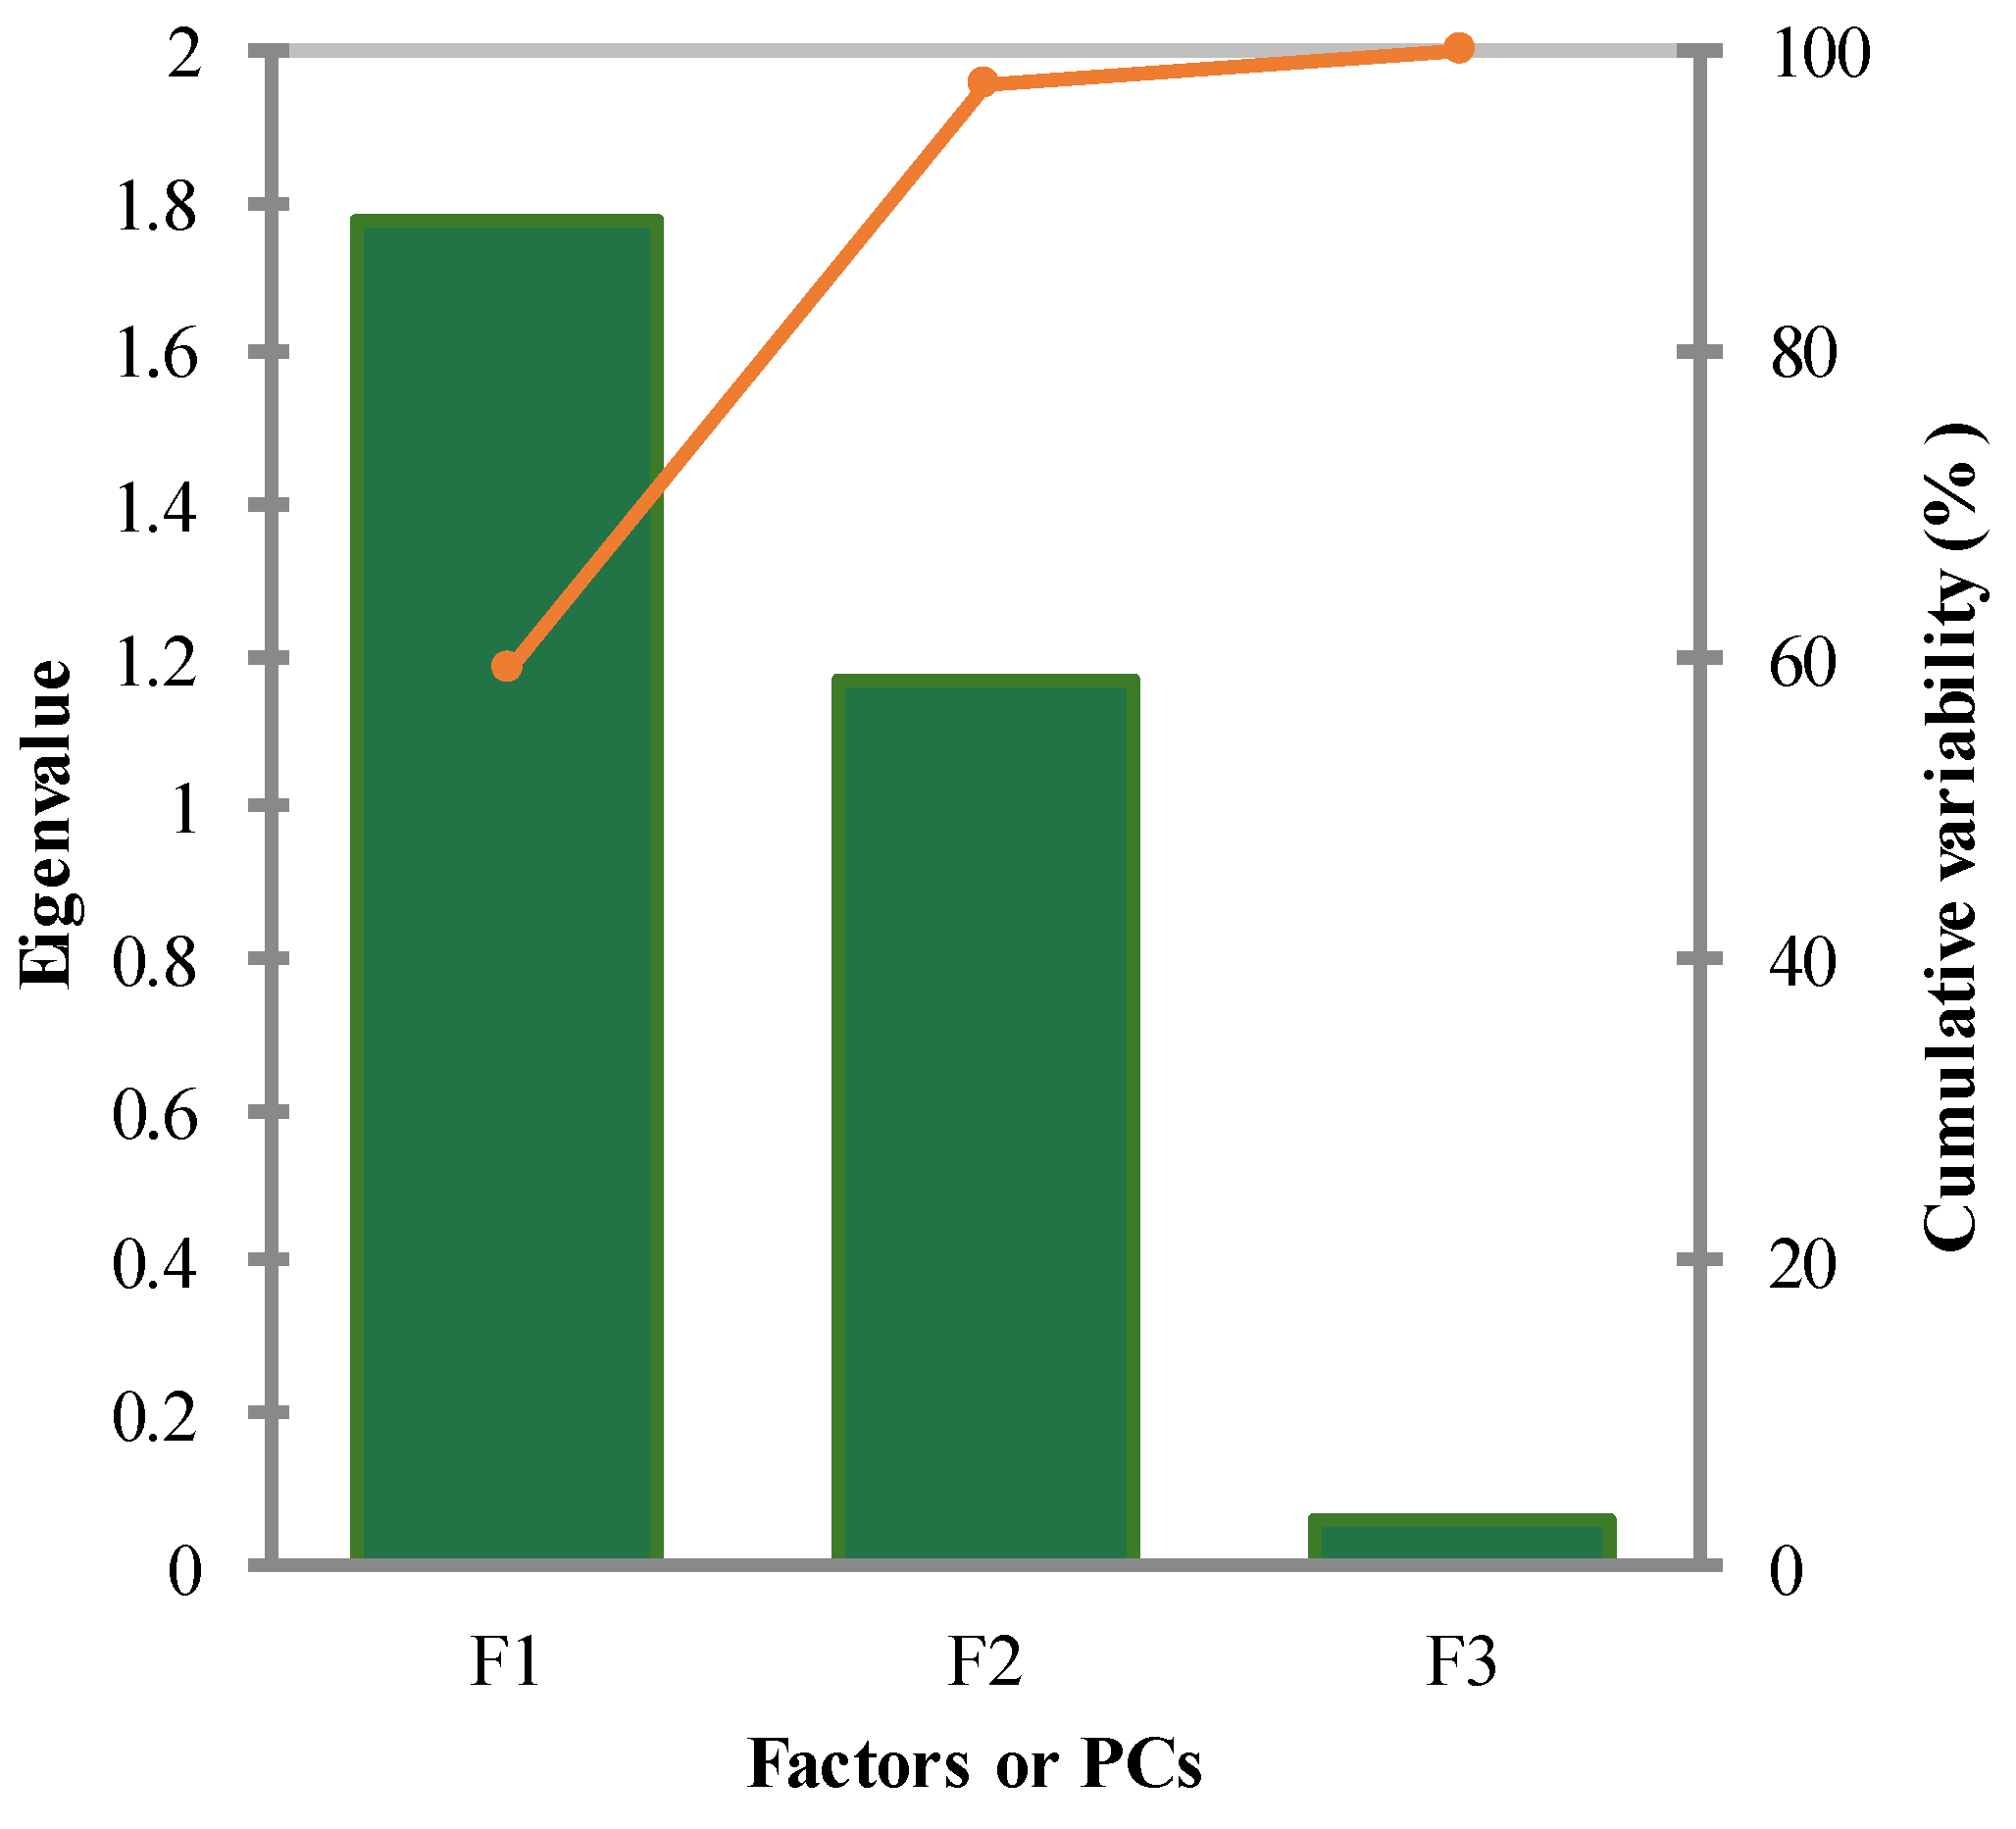
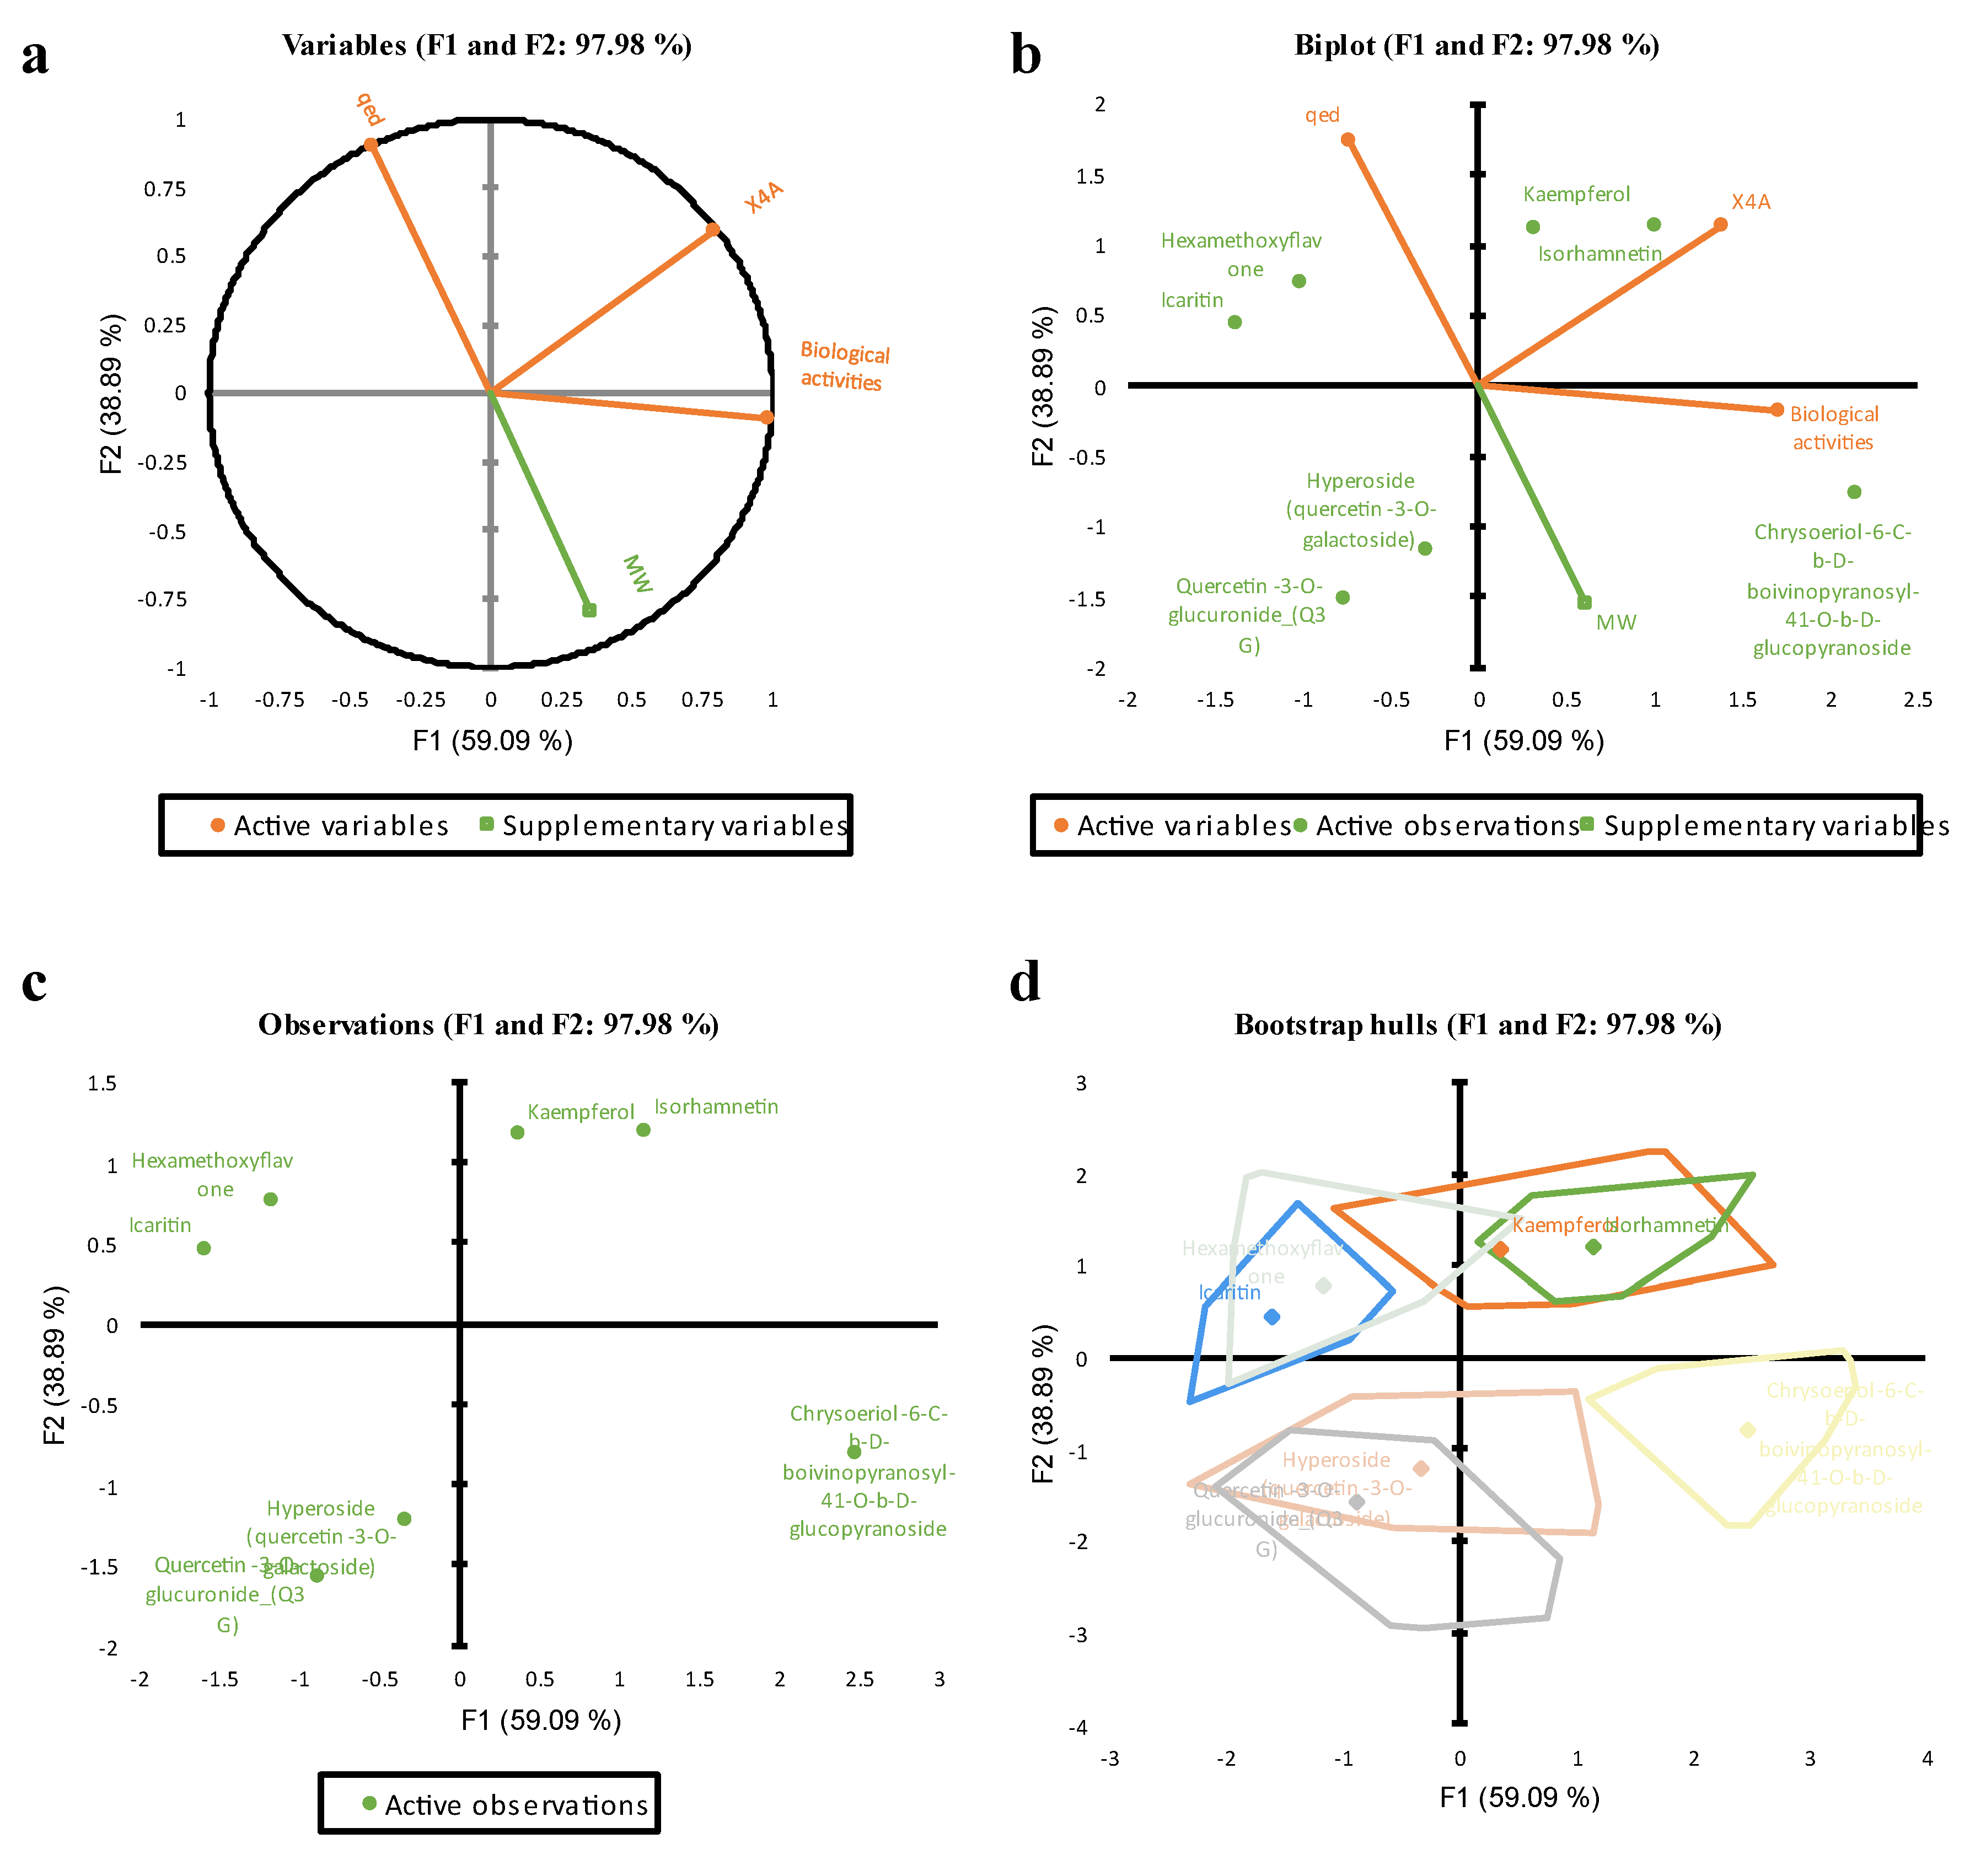
The principal component analysis (PCA) was conducted on the training set’s variables, including Biological activities, X4A, qed, and MW as a supplementary dummy variable. According to the Pearson correlation matrix, Biological activities exhibited a strong positive correlation with X4A (r = 0.70) and a moderate negative correlation with qed (r = -0.48). Bartlett's sphericity test indicated that the variables were not independent (Chi-square = 8.65, p = 0.03), supporting the significancy of the correlation between variables, and the need for PCA analysis. The eigenvalues of the components revealed that the first three components (F1 to F3) explained 59.09%, 38.89%, and 2.02% of the total variability, respectively. The cumulative percentage of variance explained by the first two components was 97.98% (Figure 6), suggesting that these components capture the majority of the dataset's variability.
It was found that the first component (F1) had a significant loading for Biological activities (0.74), X4A (0.60), and qed (-0.32), indicating their strong influence on this component. The second component (F2) exhibited significant loadings for X4A (0.55), qed (0.83), and MW (-0.80), suggesting their association with this dimension (see Figure 7a). In contrast, the third component (F3) had a minor eigenvalue of 0.06, indicating its marginal role in explaining the dataset's variance. Considering the scree plot method and the Kaiser criterion, the analysis supports retaining the first two principal components. These components, F1 and F2, cumulatively explain nearly 98% of the total variance in the dataset, making them suitable for further analysis and interpretation. Therefore, based on the proportion of variance explained and eigenvalues, these two PCs were retained to capture the essential patterns and relationships within the data.
As showed in Figure 7b, PC1 primarily measures the bioactivity of compounds. The second principal component (PC2) shows large positive associations with qed (0.90) and X4A (0.59), while negatively associated with MW (-0.80). PC2 primarily measures qed and structural complexity (X4A) of compounds.
As showed in Figure 7c, the factor scores from the PCA revealed distinct patterns among the flavonols. F1 showed a positive association with Kaempferol, Isorhamnetin, and Chrysoeriol-6-C-b-D-boivinopyranosyl-41-O-b-D-glucopyranoside, indicating these compounds have higher scores on this factor. In contrast, Factor 2 is negatively associated with Chrysoeriol-6-C-b-D-boivinopyranosyl-41-O-b-D-glucopyranoside, Hyperoside, and Q3G, suggesting these compounds have lower scores on this factor. This pattern was further confirmed with Bootstrap sampling analysis with a minor variation (Figure 7d).

4. Discussion

The development of effective therapeutic interventions against HBV infection is importance given its significant global health burden and potential for severe complications. Flavonoids, a broad range of natural substances present in many plants, are being studied for their possible antiviral effects, such as their capacity to disrupt different phases of the HBV lifecycle [27]. The variety of flavonoids offers an interesting chance to find new antiviral drugs, leading to the creation of models based on pharmacophores and QSAR to help identify and predict compounds with strong anti-HBV effects through virtual HTS. Previous studies have also highlighted the potential of utilizing computational modeling like QSAR to offer potential compounds with anti-HBV activities [75,76,77,78]. The present study not only adds to our knowledge of flavonoid pharmacology but also has implications for creating new antiviral treatments and finding plants with high levels of bioactive flavonoids.
The development and validation of pharmacophore models are essential in contemporary drug discovery endeavors [35,69,79,80,81]. In this study, a validated pharmacophore model based on flavonols was carefully developed, consisting of 57 features such as hydrophobic centers, aromatic rings, HBA and HBD regions, and exclusive volumes. The accuracy of the top model showed its potential to precisely screen compounds with pharmacophore characteristics related to flavonols. In this regard, The ROC curve analysis showed encouraging performance metrics, including a sensitivity of 71% and a specificity of 100%. The discriminative ability of the model was also confirmed by the AUC values. Accordingly, a curated collection of 359 distinct compounds was highlighted as active true positive chemicals with potential anti-HBV activities. These findings provide a great opportunity for vast number of research on these compounds in vitro. Also, since the training set of flavonols showed different anti-HBV mechanisms of action, the hits resulted of the screening potentially can display different anti-HBV activities. Also, future efforts on discovery of such compounds provide further chance of developing more sensitive model. The screening results were not focus of this study, yet the required information can be found in the supplementary material.
The QSAR model was constructed to predict the biological properties of flavonols utilized in the pharmacophore model. Noteworthy is the model's level of predictive power with no sign of collinearity or overfitting penalties, achieving an R² value of 0.87 in the training dataset. The model's explanatory capability was significantly due to the predictors X4A and qed. The model's robust performance was further confirmed by its ability to generalize well to external validation set, demonstrated by the 90% Q² value and inlier AD that was calculated for the external validation set. The developed model benefits from the biological activity of compounds in inhibiting the secretion of HBsAg. Therefore, the prediction is applicable on flavonoids with anti-HBsAg activities. This provides a further opportunity to investigate and reconstruct another model to search for variables predictive for biological activities of flavonols on other aspect of viral infection like HBeAg. In the present study, modeling different QSARs were not possible due to the limited number of flavonols that affecting other part of viral components. The presented model, was reevaluated with different number of input variables and other affirmatory statistics, and also revalidated with different number of validation sets, yet, the results were the same. In this regard, the validated models based on non-flavonol flavonoids and non-flavonoids are reported for the sake of comparison. Accordingly, one intriguing finding was the varying success of the model when tested with non-flavonol flavonoids compared to non-flavonoids. Although both models demonstrated good fit, the non-flavonoid model displayed stronger linearity and fitness with the training data. This implies that the model can accurately differentiate between flavonoids and other compounds by analyzing their structural characteristics. Nevertheless, the model that was verified with flavonoids also showed significant predictive ability, emphasizing the distinct structural differences found in flavonol substances. This might be attribute to the predictors. The average connectivity index of order 4 (X4A) is a topological index, and has been showed to have an influence in the binding affinities of Per- and polyfluoroalkyl substances (PFAS) ligand to Human serum albumin (HSA) receptor, and is significantly influential score in establishing QSAR model [77]. In a QSAR study by Hădărugă [82], X4A was identified as a significant structural parameter related to the inhibitory action of flavonoids against cytochrome P450. The study found that the biological activity increased with the decrease in the X4A parameter value. Specifically, higher X4A values were associated with lower inhibitory activity against cytochrome P450. This indicates that X4A plays a role in describing the hydrophilic-hydrophobic properties or polarizabilities of the flavonoid molecules in relation to their inhibitory activity against cytochrome P450. These suggest that X4A is a major contributor to topological structure of flavonoids that facilitate the binding of the chemical to the target. Here, the PCA results showed a significant positive correlation between biological activity of compounds with X4A, suggesting the increase in X4A will resulted in enhancing flavonols’ IC50. Another effected predictor that was quantitative estimate of drug-likeness (qed). It was found that qed has orthogonal association with biological activity, and the variables are not redundant and each contributes unique information. qed is a measure used to assess the drug-likeness of chemical compounds, and combines several molecular properties associated with drug-like behavior into a single score. The mean qed calculated for flavonols was 0.41 ± 0.19, highlighting a minor trend toward druglike compounds. Accordingly, Lee et al, showed that flavonoids with qed ≥ 0.35 have a higher likelihood of exhibiting drug-like behavior, making them promising candidates for studies related to drug development or therapeutic effects [83]. Additionally, it was observed that the strategy of establishing a QSAR model with the qed score provides an efficient approach to discover flavonoid derivatives with potent anti- dipeptidyl peptidase-IV (DPP-IV) activity [84]. Taken together, features selected for developing a QSAR model in the present study is confirmed by the previous studies, suggesting both structural and drug likeness properties of flavonoids strength the predictive power of the models.
Although the pharmacophore and QSAR models have been largely successful, it is important to recognize their various limitations. The belief that the HTS library was mostly made up of active compounds may not completely represent the diversity of existing chemical libraries, particularly specialized flavonoid libraries, which could further improve the model's accuracy. Also, only flavonols were used to train both pharmacophore and QSAR models. This contributed to advancing the existing understanding of flavonols' effectiveness against HBV, however, utilizing models trained with different subclasses of flavonoids could be essential. We are currently studying models trained with flavonoids for uncovering anti-HBV drugs, particularly using different machine learning algorithms other than MLR to assess the accuracy of the models. Additionally, the results of the current research offer a way for identifying plants that contain flavonoids with anti-HBV properties by tracking the screened hits.

5. Conclusions

Druglike flavonoids with anti-HBV activities are possessed a yet to discover potentials. In the present study, an accurate flavonol-based pharmacophore model was validated for screening large chemical libraries, highlighting novel hits for further experimental studies. Also, a QSAR model was validated by two independent sets of chemicals for the sake of reproducibility of the model. In addition, the model was found to be applicable on other flavonols due to the predictive selected features, x4a and qed. Findings pave a great way of future anti-HBV drug discovery modeling, and experimental studies. Discoveries provide a promising path for future modeling and experimental research on anti-HBV drug development. This study built upon existing research on flavonoids as potential treatments for HBV, showing promising prospects for future HBV therapeutics.

Supplementary Materials

The following supporting information can be downloaded at: www.mdpi.com/xxx/s1, Figure S1: title; Table S1: title; Video S1: title.

Author Contributions

Conceptualization, A.M.; methodology, A.M. and S.J.K; software, A.M., F.S.A, and P.A; validation, A.M.; formal analysis, F.S.A. and P.A.; investigation, A.M. and P.A.; data curation, A.M. F.S.A., and S.J.K.; writing—original draft preparation, F.S.A. and P.A.; writing—review and editing, A.M.; visualization, A.M. and S.J.K.; supervision, A.M.; project administration, A.M. All authors have read and agreed to the published version of the manuscript.

Funding

Please add: This research received no external funding.

Data Availability Statement

The original contributions presented in the study are included in the article/supplementary material, further inquiries can be directed to the corresponding author.

Acknowledgments

Not applicable.

Conflicts of Interest

The authors declare no conflicts of interest.

References

  1. Khani, H.; Ghorbani, M.; Nojoomi, F.; Mohebbi, A. Honey Bee Dry Venom Reduces Hepatitis B Virus Surface Antigen Secretion in PLC/PRF/5 Cell Line. International Journal of Medical Laboratory 2019. [Google Scholar] [CrossRef]
  2. Mohebbi, A.; Lorestani, N.; Tahamtan, A.; Kargar, N.L.; Tabarraei, A. An Overview of Hepatitis B Virus Surface Antigen Secretion Inhibitors. Front Microbiol 2018, 9, 1–9. [Google Scholar] [CrossRef]
  3. Jeng, W.J.; Papatheodoridis, G. V.; Lok, A.S.F. Hepatitis B. The Lancet 2023, 401, 1039–1052. [Google Scholar] [CrossRef]
  4. Cao, G.; Liu, J.; Liu, M. Trends in Mortality of Liver Disease Due to Hepatitis B in China from 1990 to 2019: Findings from the Global Burden of Disease Study. Chin Med J (Engl) 2022, 135, 2049. [Google Scholar] [CrossRef]
  5. Bhat, S.A.; Kazim, S.N. HBV CccDNA A Culprit and Stumbling Block for the Hepatitis B Virus Infection: Its Presence in Hepatocytes Perplexed the Possible Mission for a Functional Cure. ACS Omega 2022, 7, 24066–24081. [Google Scholar] [CrossRef]
  6. Zerbato, J.M.; Avihingsanon, A.; Singh, K.P.; Zhao, W.; Deleage, C.; Rosen, E.; Cottrell, M.L.; Rhodes, A.; Dantanarayana, A.; Tumpach, C.; et al. HIV DNA Persists in Hepatocytes in People with HIV-Hepatitis B Co-Infection on Antiretroviral Therapy. EBioMedicine 2023, 87. [Google Scholar] [CrossRef]
  7. Nevola, R.; Beccia, D.; Rosato, V.; Ruocco, R.; Mastrocinque, D.; Villani, A.; Perillo, P.; Imbriani, S.; Delle Femine, A.; Criscuolo, L.; et al. HBV Infection and Host Interactions: The Role in Viral Persistence and Oncogenesis. Int J Mol Sci 2023, 24. [Google Scholar] [CrossRef]
  8. Naderi, M.; Hosseini, S.M.; Behnampour, N.; Shahramian, I.; Moradi, A. Association of HLADQ-B1 Polymorphisms in Three Generations of Chronic Hepatitis B Patients. Virus Res 2023, 325. [Google Scholar] [CrossRef]
  9. Naderi, M.; Hosseini, S.M.; Behnampour, N.; Shahramian, I.; Moradi, A. Mutations in the S Gene of Hepatitis B Virus in Three Generations of Patients with Chronic Hepatitis B. Virus Genes 2023, 59, 662–669. [Google Scholar] [CrossRef] [PubMed]
  10. Afraie, M.; Moradi, G.; Zamani, K.; Azami, M.; Moradi, Y. The Effect of Hepatitis B Virus on the Risk of Pregnancy Outcomes: A Systematic Review and Meta-Analysis of Cohort Studies. Virol J 2023, 20, 1–19. [Google Scholar] [CrossRef] [PubMed]
  11. Ruan, L.L.; Chen, M.X.; Adu-Gyamfi, E.A.; Geng, L.H.; Fu, L.J.; Wan, Q.; Ding, Y. Bin Maternal Hepatitis B Virus Infection and Pregnancy Outcomes of Freeze-Thaw Embryo Transfer. JAMA Netw Open 2023, 6, e2323495–e2323495. [Google Scholar] [CrossRef] [PubMed]
  12. Tufon, K.A.; Meriki, H.D.; Kwenti, T.E.; Tony, N.J.; Malika, E.; Bolimo, A.F.; Kouanou, Y.S.; Nkuo-Akenji, T.; Anong, D.N. HBV Transmission Risk Assessment in Healthcare Workers, Household and Sexual Contacts of HBV Infected Patients in the Southwest Region of Cameroon. Oman Med J 2019, 34, 313. [Google Scholar] [CrossRef] [PubMed]
  13. Feld, J.J.; Lok, A.S.; Zoulim, F. New Perspectives on Development of Curative Strategies for Chronic Hepatitis B. Clinical Gastroenterology and Hepatology 2023, 21, 2040–2050. [Google Scholar] [CrossRef] [PubMed]
  14. Ogunnaike, M.; Das, S.; Raut, S.S.; Sultana, A.; Nayan, M.U.; Ganesan, M.; Edagwa, B.J.; Osna, N.A.; Poluektova, L.Y. Chronic Hepatitis B Infection: New Approaches towards Cure. Biomolecules 2023, Vol. 13, Page 1208 2023, 13, 1208. [Google Scholar] [CrossRef] [PubMed]
  15. Wedemeyer, H.; Schöneweis, K.; Bogomolov, P.; Blank, A.; Voronkova, N.; Stepanova, T.; Sagalova, O.; Chulanov, V.; Osipenko, M.; Morozov, V.; et al. Safety and Efficacy of Bulevirtide in Combination with Tenofovir Disoproxil Fumarate in Patients with Hepatitis B Virus and Hepatitis D Virus Coinfection (MYR202): A Multicentre, Randomised, Parallel-Group, Open-Label, Phase 2 Trial. Lancet Infect Dis 2023, 23, 117–129. [Google Scholar] [CrossRef] [PubMed]
  16. Cheng, D.; Han, B.; Zhang, W.; Wu, W. Clinical Effects of NTCP-Inhibitor Myrcludex B. J Viral Hepat 2021, 28, 852–858. [Google Scholar] [CrossRef] [PubMed]
  17. Blank, A.; Markert, C.; Hohmann, N.; Carls, A.; Mikus, G.; Lehr, T.; Alexandrov, A.; Haag, M.; Schwab, M.; Urban, S.; et al. First-in-Human Application of the Novel Hepatitis B and Hepatitis D Virus Entry Inhibitor Myrcludex B. J Hepatol 2016, 65, 483–489. [Google Scholar] [CrossRef]
  18. Bogomolov, P.; Alexandrov, A.; Voronkova, N.; Macievich, M.; Kokina, K.; Petrachenkova, M.; Lehr, T.; Lempp, F.A.; Wedemeyer, H.; Haag, M.; et al. Treatment of Chronic Hepatitis D with the Entry Inhibitor Myrcludex B: First Results of a Phase Ib/IIa Study. J Hepatol 2016, 65, 490–498. [Google Scholar] [CrossRef] [PubMed]
  19. Janssen, H.L.A.; Hou, J.; Asselah, T.; Chan, H.L.Y.; Zoulim, F.; Tanaka, Y.; Janczewska, E.; Nahass, R.G.; Bourgeois, S.; Buti, M.; et al. Randomised Phase 2 Study (JADE) of the HBV Capsid Assembly Modulator JNJ-56136379 with or without a Nucleos(t)Ide Analogue in Patients with Chronic Hepatitis B Infection. Gut 2023, 72, 1385–1398. [Google Scholar] [CrossRef]
  20. Burdette, D.; Hyrina, A.; Song, Z.; Beran, R.K.; Cheung, T.; Gilmore, S.; Kobayashi, T.; Li, L.; Liu, Y.; Niedziela-Majka, A.; et al. Characterization of a Novel Capsid Assembly Modulator for the Treatment of Chronic Hepatitis B Virus Infection. Antimicrob Agents Chemother 2023, 67. [Google Scholar] [CrossRef]
  21. Amblard, F.; Chen, Z.; Wiseman, J.; Zhou, S.; Liu, P.; Salman, M.; Verma, K.; Azadi, N.; Downs-Bowen, J.; Tao, S.; et al. Synthesis and Evaluation of Highly Potent HBV Capsid Assembly Modulators (CAMs). Bioorg Chem 2023, 141. [Google Scholar] [CrossRef] [PubMed]
  22. Yang, L.; Gong, Y.; Liu, F.; Chen, W.; Wang, X.; Long, G.; Li, H.; Xiao, F.; Lu, M.J.; Hu, Y.; et al. A Novel Phthalazinone Derivative as a Capsid Assembly Modulator Inhibits Hepatitis B Virus Expression. Antiviral Res 2024, 221, 105763. [Google Scholar] [CrossRef] [PubMed]
  23. Rezanezhadi, M.; Mohebbi, A.; Askari, F.S.; Hosseini, S.D.; Tabarraei, A. Hepatitis B Virus Reverse Transcriptase Polymorphisms between Treated and Treatment-Naïve Chronically Infected Patients. Virusdisease 2019, 30, 219–226. [Google Scholar] [CrossRef] [PubMed]
  24. Conners, E.E.; Panagiotakopoulos, L.; Hofmeister, M.G.; Spradling, P.R.; Hagan, L.M.; Harris, A.M.; Rogers-Brown, J.S.; Wester, C.; Nelson, N.P. Screening and Testing for Hepatitis B Virus Infection: CDC Recommendations — United States, 2023. MMWR. Recommendations and Reports 2023, 72, 1–25. [Google Scholar] [CrossRef] [PubMed]
  25. Zareifopoulos, N.; Lagadinou, M.; Karela, A.; Kyriakopoulou, O.; Velissaris, D. Neuropsychiatric Effects of Antiviral Drugs. Cureus 2020, 12. [Google Scholar] [CrossRef] [PubMed]
  26. Panche, A.N.; Diwan, A.D.; Chandra, S.R. Flavonoids: An Overview. J Nutr Sci 2016, 5. [Google Scholar] [CrossRef] [PubMed]
  27. Naderi, M.; Salavatiha, Z.; Gogoi, U.; Mohebbi, A. An Overview of Anti-Hepatitis B Virus Flavonoids and Their Mechanisms of Action. Front Cell Infect Microbiol 2024, 14, 1356003. [Google Scholar] [CrossRef] [PubMed]
  28. Cheng, Z.; Sun, G.; Guo, W.; Huang, Y.; Sun, W.; Zhao, F.; Hu, K. Inhibition of Hepatitis B Virus Replication by Quercetin in Human Hepatoma Cell Lines. Virol Sin 2015, 30, 261–268. [Google Scholar] [CrossRef] [PubMed]
  29. Parvez, M.K.; Ahmed, S.; Al-Dosari, M.S.; Abdelwahid, M.A.S.; Arbab, A.H.; Al-Rehaily, A.J.; Al-Oqail, M.M. Novel Anti-Hepatitis B Virus Activity of Euphorbia Schimperi and Its Quercetin and Kaempferol Derivatives. ACS Omega 2021, 6, 29100–29110. [Google Scholar] [CrossRef]
  30. Parvez, M.K.; Al-Dosari, M.S.; …, A.H.A.-S.P. Bioassay-Guided Isolation of Anti-Hepatitis B Virus Flavonoid Myricetin-3-O-Rhamnoside along with Quercetin from Guiera Senegalensis Leaves; Elsevier, 2020. [Google Scholar]
  31. Ortega, J.T.; Agudelo, I.; Alejandro Ricco, R.; Vicenta Cavallaro, L.; Campos, R.; Parlar, A.; Mex Alvarez, R. The Infusion of Baccharis Spicata (Lam.) Baill (Asteraceae) Has Antiviral Activity against Hepatitis B Virus without Cytotoxic Effects against Several Cell Lines. In blacpma.ms-editions.clJT Ortega, I Agudelo, RA Ricco, LV Cavallaro, RH CamposBoletín Latinoamericano y del Caribe de Plantas Medicinales y, 2024•blacpma.ms-editions.cl. [CrossRef]
  32. Kim, S.; Thiessen, P.A.; Bolton, E.E.; Chen, J.; Fu, G.; Gindulyte, A.; Han, L.; He, J.; He, S.; Shoemaker, B.A.; et al. PubChem Substance and Compound Databases. Nucleic Acids Res 2016, 44, D1202–D1213. [Google Scholar] [CrossRef]
  33. Gaulton, A.; Hersey, A.; Nowotka, M.L.; Patricia Bento, A.; Chambers, J.; Mendez, D.; Mutowo, P.; Atkinson, F.; Bellis, L.J.; Cibrian-Uhalte, E.; et al. The ChEMBL Database in 2017. Nucleic Acids Res 2017, 45, D945–D954. [Google Scholar] [CrossRef] [PubMed]
  34. Wolber, G.; Langer, T. LigandScout: 3-D Pharmacophores Derived from Protein-Bound Ligands and Their Use as Virtual Screening Filters. J Chem Inf Model 2005, 45, 160–169. [Google Scholar] [CrossRef] [PubMed]
  35. Mohebbi, A. Ligand-Based 3D Pharmacophore Modeling, Virtual Screening, and Molecular Dynamic Simulation of Potential Smoothened Inhibitors. J Mol Model 2023, 29. [Google Scholar] [CrossRef] [PubMed]
  36. Parvez, M.K.; Al-Dosari, M.S.; Basudan, O.A.; Herqash, R.N. The Anti-Hepatitis B Virus Activity of Sea Buckthorn Is Attributed to Quercetin, Kaempferol and Isorhamnetin. Biomed Rep 2022, 17, 1–7. [Google Scholar] [CrossRef] [PubMed]
  37. Zhang, C.; Li, H.; Jiang, W.; Zhang, X.; Li, G. Icaritin Inhibits the Expression of Alpha-Fetoprotein in Hepatitis B Virus-Infected Hepatoma Cell Lines through Post-Transcriptional Regulation. Oncotarget 2016, 7, 83755. [Google Scholar] [CrossRef] [PubMed]
  38. Tan, M.; Ren, F.; Yang, X. Anti-HBV Therapeutic Potential of Small Molecule 3, 5, 6, 7, 3′, 4′-Hexamethoxyflavone in Vitro and in Vivo. Virology 2021, 560, 66–75. [Google Scholar] [CrossRef] [PubMed]
  39. Li, B.; Guo, Q.; Tian, Y.; Liu, S.; Wang, Q.; Chen, L.; Dong, J.-X. New Anti-HBV C-Boivinopyranosyl Flavones from Alternanthera Philoxeroides. Molecules 2016, 21, 336. [Google Scholar] [CrossRef] [PubMed]
  40. Shen, B.; Wu, N.; Shen, C.; Zhang, F.; Wu, Y.; Xu, P.; Zhang, L.; Wu, W.; Lu, Y.; Han, J.; et al. Hyperoside Nanocrystals for HBV Treatment: Process Optimization, in Vitro and in Vivo Evaluation. Drug Dev Ind Pharm 2016, 42, 1772–1781. [Google Scholar] [CrossRef] [PubMed]
  41. Wu, L.; Yang, X.; Huang, Z.; Liu, H.; Wu, G. In Vivo and in Vitro Antiviral Activity of Hyperoside Extracted from Abelmoschus Manihot (L) Medik. Acta Pharmacol Sin 2007, 28, 404–409. [Google Scholar] [CrossRef]
  42. Cui, X.X.; Yang, X.; Wang, H.J.; Rong, X.Y.; Jing, S.; Xie, Y.H.; Huang, D.F.; Zhao, C. Luteolin-7-O-Glucoside Present in Lettuce Extracts Inhibits Hepatitis B Surface Antigen Production and Viral Replication by Human Hepatoma Cells in Vitro. Front Microbiol 2017, 8. [Google Scholar] [CrossRef]
  43. Cao, T.W.; Geng, C.A.; Jiang, F.Q.; Ma, Y.B.; He, K.; Zhou, N.J.; Zhang, X.M.; Zhou, J.; Chen, J.J. Chemical Constituents of Swertia Yunnanensis and Their Anti-Hepatitis B Virus Activity. Fitoterapia 2013, 89, 175–182. [Google Scholar] [CrossRef]
  44. Geng, C.A.; Chen, J.J. The Progress of Anti-HBV Constituents from Medicinal Plants in China. Nat Prod Bioprospect 2018, 8, 227–244. [Google Scholar] [CrossRef] [PubMed]
  45. Huang, R.L.; Chen, C.C.; Huang, H.L.; Chang, C.G.; Chen, C.F.; Chang, C.; Hsieh, M.T. Anti-Hepatitis B Virus Effects of Wogonin Isolated from Scutellaria Baicalensis. Planta Med 2000, 66, 694–698. [Google Scholar] [CrossRef]
  46. Guo, Q.; Zhao, L.; You, Q.; Yang, Y.; Gu, H.; Song, G.; research, N.L.-A. Anti-Hepatitis B Virus Activity of Wogonin in Vitro and in Vivo. Antiviral Res 2007, 74, 16–24. [Google Scholar] [CrossRef]
  47. Ahmed, S.; Parvez, M.K.; Al-Dosari, M.S.; Abdelwahid, M.A.S.; Alhowiriny, T.A.; Al-Rehaily, A.J. Novel Anti-hepatitis B Virus Flavonoids Sakuranetin and Velutin from Rhus Retinorrhoea. Mol Med Rep 2023, 28. [Google Scholar] [CrossRef]
  48. Xu, H.Y.; Ren, J.H.; Su, Y.; Ren, F.; Zhou, Y.J.; Jiang, H.; Cheng, S.T.; Zhang, C.R.; Chen, J. Anti-Hepatitis B Virus Activity of Swertisin Isolated from Iris Tectorum Maxim. J Ethnopharmacol 2020, 257, 112787. [Google Scholar] [CrossRef]
  49. Ma, J.; Li, T.; Han, X.; Yuan, H.; Liang, H.; Wang, Y.; Virology, X.W.-. Discovery and Mechanism of Action of Novel Baicalein Modified Derivatives as Potent Antihepatitis Agent. Virology 2017, 507, 199–205. [Google Scholar] [CrossRef]
  50. Zembower, D.E.; Lin, Y.M.; Flavin, M.T.; Chen, F.C.; Korba, B.E. Robustaflavone, a Potential Non-Nucleoside Anti-Hepatitis B Agent. Antiviral Res 1998, 39, 81–88. [Google Scholar] [CrossRef]
  51. Wang, Z.; Li, Y.; Guo, Z.; Zhou, X.; Lu, M.; Xue, T.C. ; Gao B ERK1/2-HNF4α Axis Is Involved in Epigallocatechin-3-Gallate Inhibition of HBV Replication. Acta Pharmacol Sin 2020, 41, 278–285. [Google Scholar] [CrossRef] [PubMed]
  52. Zhong, L.; Hu, J.; Shu, W.; Gao, B.; Disease, S.X.-C.D. Epigallocatechin-3-Gallate Opposes HBV-Induced Incomplete Autophagy by Enhancing Lysosomal Acidification, Which Is Unfavorable for HBV Replication. nature.comL Zhong, J Hu, W Shu, B Gao, S XiongCell Death & Disease, 2015•nature.com 2015. [Google Scholar]
  53. Pang, J.Y.; Zhao, K.J.; Wang, J.B.; Ma, Z.J.; Xiao, X.H. Green Tea Polyphenol, Epigallocatechin-3-Gallate, Possesses the Antiviral Activity Necessary to Fight against the Hepatitis B Virus Replication in Vitro. J Zhejiang Univ Sci B 2014, 15, 533–539. [Google Scholar] [CrossRef]
  54. Xu, J.; Gu, W.; Li, C.; Li, X.; Xing, G.; Li, Y.; Song, Y.; Zheng, W. Epigallocatechin Gallate Inhibits Hepatitis B Virus via Farnesoid X Receptor Alpha. J Nat Med 2016, 70, 584–591. [Google Scholar] [CrossRef]
  55. Lai, Y.H.; Sun, C.P.; Huang, H.C.; Chen, J.C.; Liu, H.K.; Huang, C. Epigallocatechin Gallate Inhibits Hepatitis B Virus Infection in Human Liver Chimeric Mice. BMC Complement Altern Med 2018, 18, 1–7. [Google Scholar] [CrossRef] [PubMed]
  56. Huang, H.C.; Tao, M.H.; Hung, T.M.; Chen, J.C.; Lin, Z.J.; Huang, C. (−)-Epigallocatechin-3-Gallate Inhibits Entry of Hepatitis B Virus into Hepatocytes. Antiviral Res 2014, 111, 100–111. [Google Scholar] [CrossRef] [PubMed]
  57. Tsukuda, S.; Watashi, K.; Hojima, T.; Isogawa, M.; Iwamoto, M.; Omagari, K.; Suzuki, R.; Aizaki, H.; Kojima, S.; Sugiyama, M.; et al. A New Class of Hepatitis B and D Virus Entry Inhibitors, Proanthocyanidin and Its Analogs, That Directly Act on the Viral Large Surface Proteins. Hepatology 2017, 65, 1104–1116. [Google Scholar] [CrossRef] [PubMed]
  58. Yang, G.; Chen, D. Biflavanones, Flavonoids, and Coumarins from the Roots of Stellera Chamaejasme and Their Antiviral Effect on Hepatitis B Virus. Chem Biodivers 2008, 5, 1419–1424. [Google Scholar] [CrossRef] [PubMed]
  59. Tsukamoto, Y.; Ikeda, S.; Uwai, K.; Taguchi, R.; Chayama, K.; Sakaguchi, T.; Narita, R.; Yao, W.L.; Takeuchi, F.; Otakaki, Y.; et al. Rosmarinic Acid Is a Novel Inhibitor for Hepatitis b Virus Replication Targeting Viral Epsilon RNA-Polymerase Interaction. PLoS One 2018, 13. [Google Scholar] [CrossRef] [PubMed]
  60. Aoki-Utsubo, C.; Indrasetiawan, P.; Fukano, K.; Muramatsu, M.; Artanti, N.; Hanafi, M.; Hotta, H.; Kameoka, M. Amentoflavone Inhibits Hepatitis B Virus Infection via the Suppression of PreS1 Binding to Host Cells. Microbiol Immunol 2023, 67, 281–292. [Google Scholar] [CrossRef]
  61. Zhang, Y.; Zhong, H.; Lv, Z.; Zhang, M.; Zhang, T.; Li, Q. ; Li K Anti-Hepatitis B Virus and Anti-Cancer Activities of Novel Isoflavone Analogs. Eur J Med Chem 2013, 62, 158–167. [Google Scholar] [CrossRef]
  62. Huang, T.J.; Liu, S.H.; Kuo, Y.C.; Chen, C.W.; Chou, S. Antiviral Activity of Chemical Compound Isolated from Artemisia Morrisonensis against Hepatitis B Virus in Vitro. Antiviral Res 2014, 101, 97–104. [Google Scholar] [CrossRef]
  63. Hu, Z.; Hu, J.; Ren, F.; Xu, H.; Tan, M.; Wang, Q.; Ren, J. Nobiletin, a Novel Inhibitor, Inhibits HBsAg Production and Hepatitis B Virus Replication. Biochem Biophys Res Commun 2020, 523, 802–808. [Google Scholar] [CrossRef]
  64. Huang, H.; Zhou, W.; Zhu, H.; Zhou, P.; Shi, X. Baicalin Benefits the Anti-HBV Therapy via Inhibiting HBV Viral RNAs. Toxicol Appl Pharmacol 2017, 323, 36–43. [Google Scholar] [CrossRef]
  65. Chiang, L.C.; Ng, L.T.; Cheng, P.W.; Chiang, W.; Lin, C.C. Antiviral Activities of Extracts and Selected Pure Constituents of Ocimum Basilicum. Clin Exp Pharmacol Physiol 2005, 32, 811–816. [Google Scholar] [CrossRef]
  66. Yang, Y.; Ying, G.; Wu, S.; Wu, F.; Chen, Z. In Vitro Inhibition Effects of Hepatitis B Virus by Dandelion and Taraxasterol. Infect Agent Cancer 2020, 15, 1–10. [Google Scholar] [CrossRef] [PubMed]
  67. Chou, S.C.; Huang, T.J.; Lin, E.H.; Huang, C.H.; Chou, C.H. Antihepatitis B Virus Constituents of Solanum Erianthum. Nat Prod Commun 2012, 7, 153–156. [Google Scholar] [CrossRef]
  68. Sunseri, J.; Koes, D.R. Pharmit: Interactive Exploration of Chemical Space. Nucleic Acids Res 2016, 44, W442–W448. [Google Scholar] [CrossRef] [PubMed]
  69. Mohebbi, A.; Askari, F.S.; Sammak, A.S.; Ebrahimi, M.; Najafimemar, Z. Druggability of Cavity Pockets within SARS-CoV-2 Spike Glycoprotein and Pharmacophore-Based Drug Discovery. Future Virol 2021, 16, 389–397. [Google Scholar] [CrossRef]
  70. Mohebbi, A.; Naderi, M.; Sharifian, K.; Behnezhad, F.; Mohebbi, M.; Gholami, A.; Askari, F.S.; Mirarab, A.; Monavari, S.H. Computational-Aided Reproposing Drug(s) and Discovery for Potential Antivirals Targeting Hepatitis B Virus Capsid Protein; 2023. [Google Scholar] [CrossRef]
  71. Moriwaki, H.; Tian, Y.S.; Kawashita, N.; Takagi, T. Mordred: A Molecular Descriptor Calculator. J Cheminform 2018, 10, 1–14. [Google Scholar] [CrossRef] [PubMed]
  72. Mauri, A.; Consonni, V.; Pavan, M.; Todeschini, R. DRAGON Software: An Easy Approach to Molecular Descriptor Calculations. Match 2006, 56, 237–248. [Google Scholar]
  73. Afgan, E.; Nekrutenko, A.; Grüning, B.A.; Blankenberg, D.; Goecks, J.; Schatz, M.C.; Ostrovsky, A.E.; Mahmoud, A.; Lonie, A.J.; Syme, A.; et al. The Galaxy Platform for Accessible, Reproducible and Collaborative Biomedical Analyses: 2022 Update. Nucleic Acids Res 2022, 50, W345–W351. [Google Scholar] [CrossRef]
  74. Blankenberg, D.; Team, on behalf of T.G.; Coraor, N.; Team, on behalf of T.G.; Von Kuster, G.; Team, on behalf of T.G.; Taylor, J.; Team, on behalf of T.G.; Nekrutenko, A.; Team, on behalf of T.G. Integrating Diverse Databases into an Unified Analysis Framework: A Galaxy Approach. Database 2011, 2011. [CrossRef]
  75. Mohebbi, A.; Ebrahimi, M.; Askari, F.S.; Shaddel, R.; Mirarab, A.; Oladnabi, M. QSAR Modeling of a Ligand-Based Pharmacophore Derived from Hepatitis B Virus Surface Antigen Inhibitors. Acta Microbiol Bulg 2022, 38. [Google Scholar]
  76. Mohebbi, A.; Ghorbanzadeh, T.; Naderifar, S.; Khalaj, F.; Askari, F.S.; Salehnia Sammak, A. A Fragment-Based Drug Discovery Developed on Ciclopirox for Inhibition of Hepatitis B Virus Core Protein: An in Silico Study. PLoS One 2023, 18, e0285941. [Google Scholar] [CrossRef] [PubMed]
  77. Gallagher, A.; Kar, S.; Sepúlveda, M.S. Computational Modeling of Human Serum Albumin Binding of Per- and Polyfluoroalkyl Substances Employing QSAR, Read-Across, and Docking. Molecules 2023, 28. [Google Scholar] [CrossRef]
  78. Soni, P. Das; Tripathi, I.P.; Dwivedi, M.K. QSAR Study of Some Anti-Hepatitis B Virus Agents Comprising 4-Aryl-6-Chloro-Quinolin-2-Ones and 5-Aryl-7-Chloro-1, 4-Benzodiazepines; 2017. [Google Scholar]
  79. Nasution, M.A.F.; Stephanie, F.; Tambunan, U.S.F. Pharmacophore-Based Virtual Screening and Molecular Docking Simulation of Flavonoids as Smoothened Protein Inhibitor of Hedgehog Signaling Pathways. AIP Conf Proc 2019, 2168. [Google Scholar] [CrossRef]
  80. Askari, F.S.; Ebrahimi, M.; Parhiz, J.; Hassanpour, M.; Mohebbi, A.; Mirshafiey, A. Digging for the Discovery of SARS-CoV-2 Nsp12 Inhibitors: A Pharmacophore-Based and Molecular Dynamics Simulation Study. Future Virol 2022. [Google Scholar] [CrossRef]
  81. Ekawati, M.M.; Fardiansyah Nasution, M.A.; Siregar, S.; Rizki, I.F.; Tambunan, U.S.F. Pharmacophore-Based Virtual Screening and Molecular Docking Simulation of Terpenoid Compounds as the Inhibitor of Sonic Hedgehog Protein for Colorectal Cancer Therapy. IOP Conf Ser Mater Sci Eng 2019, 509. [Google Scholar] [CrossRef]
  82. Hădărugă, D.I. Quantitative Structure–Activity Relationships (QSAR) in Flavonoid Compound Class. Journal of Agroalimentary Processes and Technologies 2009, 15, 403–407. [Google Scholar]
  83. Lee, W.Y.; Lee, C.Y.; Lee, J.S.; Kim, C.E. Identifying Candidate Flavonoids for Non-Alcoholic Fatty Liver Disease by Network-Based Strategy. Front Pharmacol 2022, 13, 892559. [Google Scholar] [CrossRef]
  84. Lu, G.; Pan, F.; Li, X.; Zhu, Z.; Zhao, L.; Wu, Y.; Tian, W.; Peng, W.; Liu, J. Virtual Screening Strategy for Anti-DPP-IV Natural Flavonoid Derivatives Based on Machine Learning. J Biomol Struct Dyn 2023. [Google Scholar] [CrossRef]
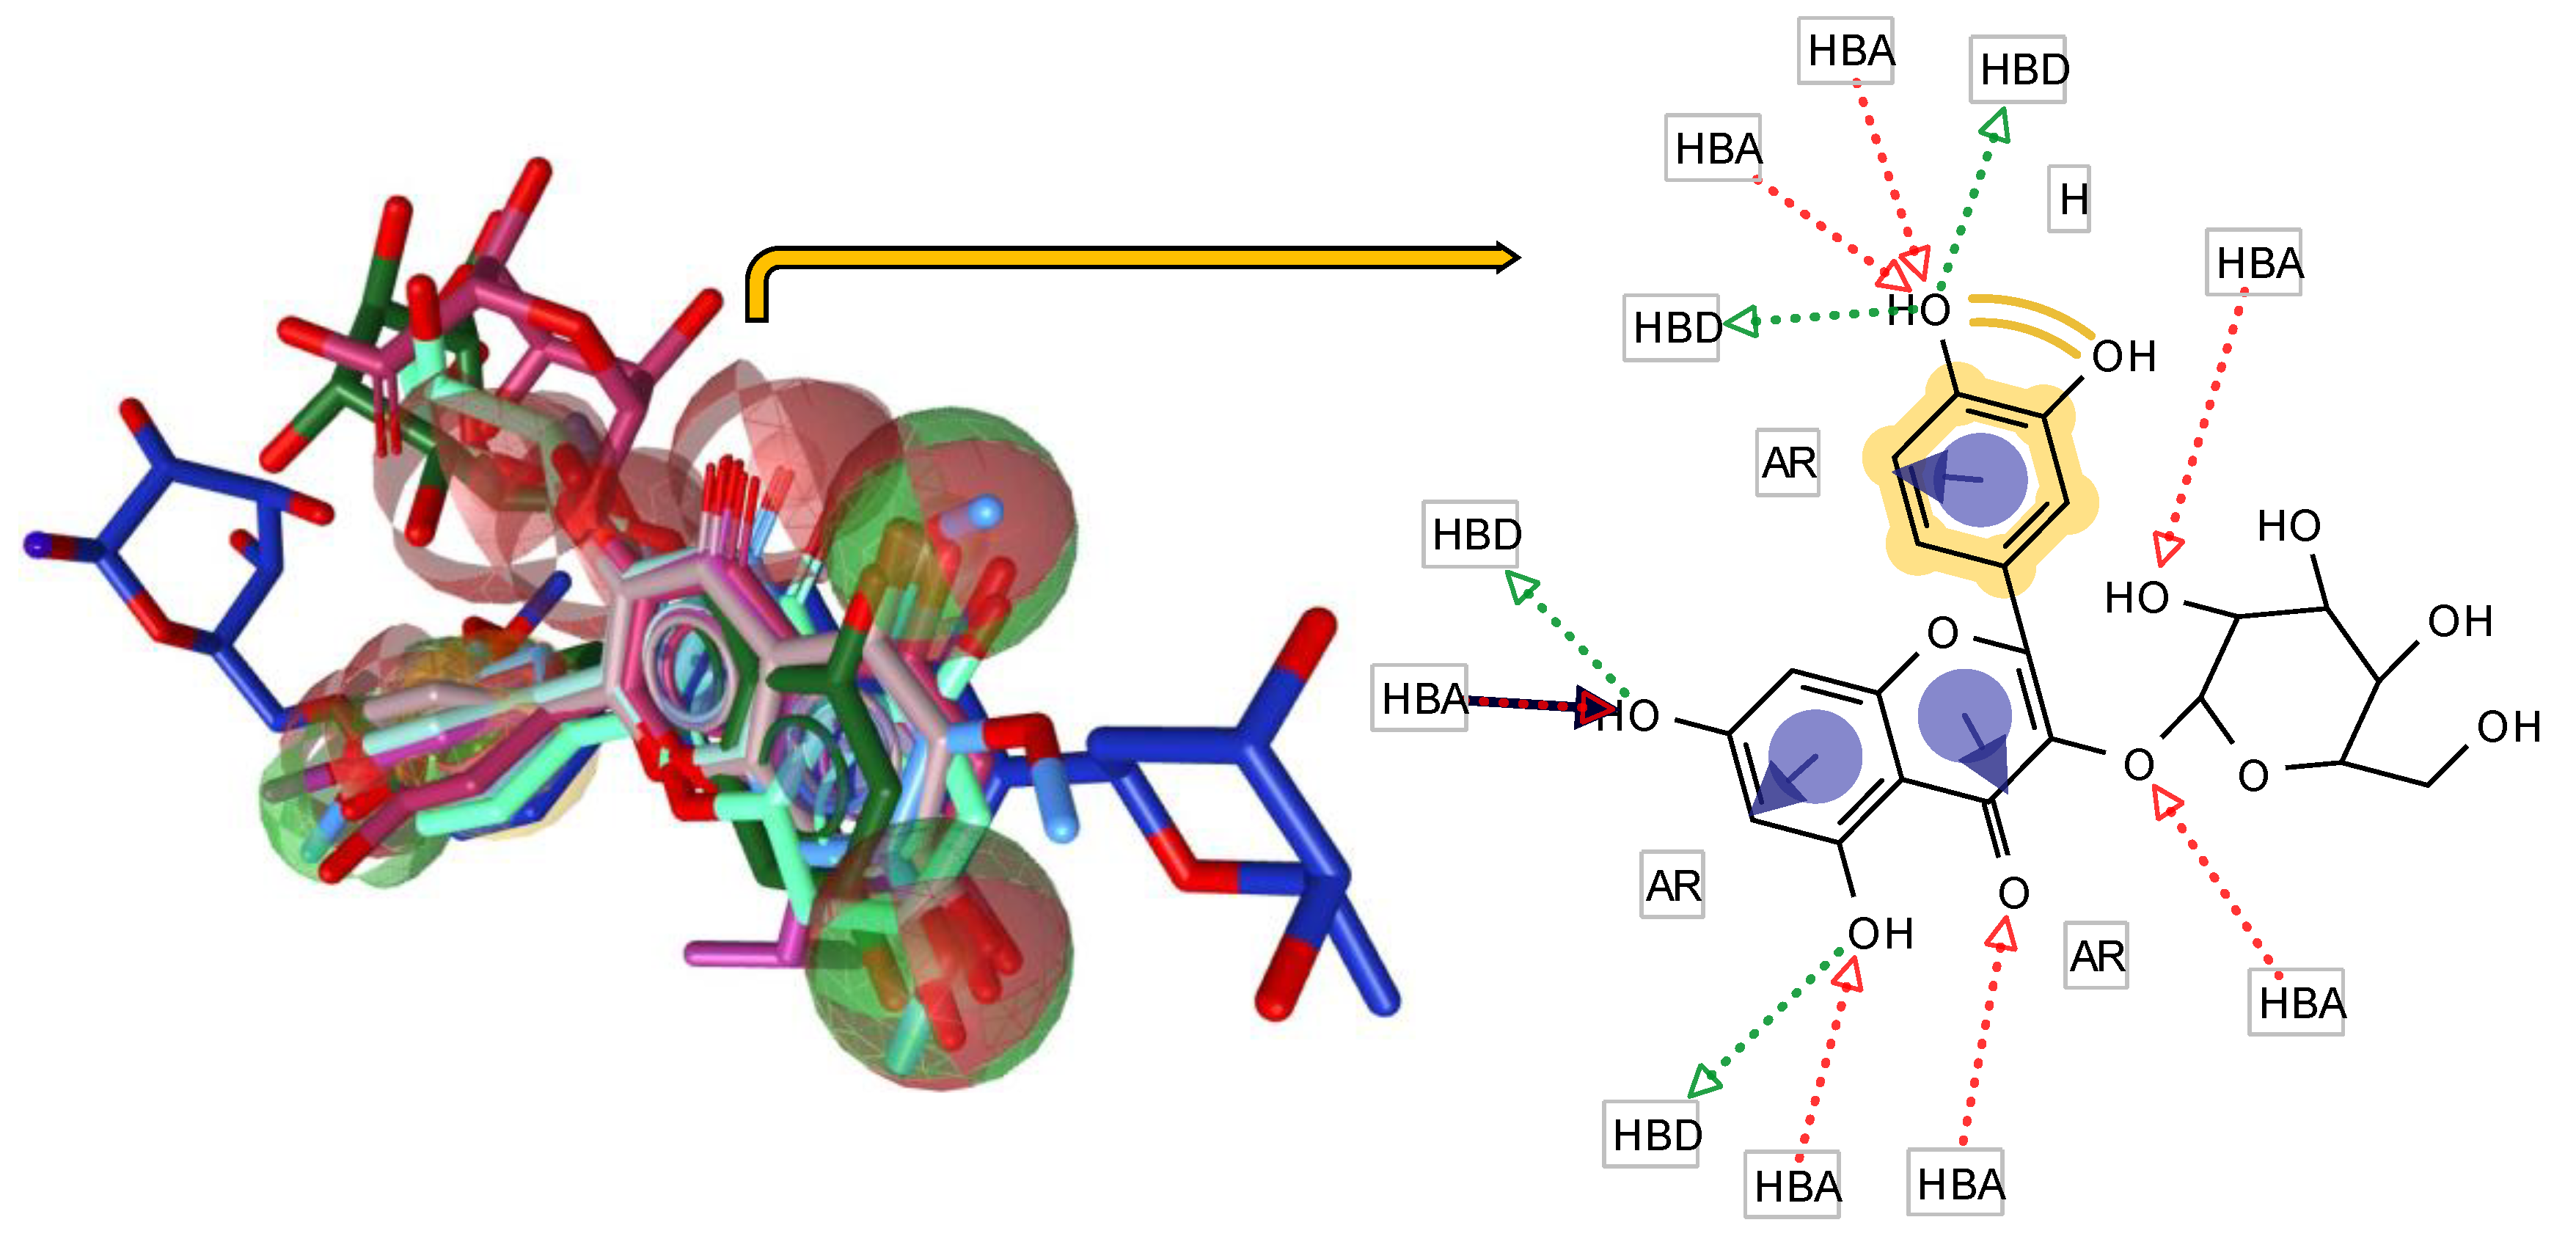
Figure 1. The flavonol-derived pharmacophore model. In the left, the compounds are shown in alignment with the pharmacophore. A schematic representation of the alignment is illustrated in the right panel. HBA, Hydrogen-bond donor; HBA, HB acceptor; AR, aromatic ring; H, Hydrophobic center. The exclusive volumes are not shown for clarity of the figure.
Preprints 102475 g001
Figure 2. The hit numbers as a result of PharmIt database screening. It is worth noting that no hits were retrieved from ChemSpace, Enamin, and MCULE_ULTIMATE.
Preprints 102475 g002
Figure 3. ROC curve analysis of the flavonol-derived pharmacophore model. 359/509 hits (70.53%) of hits were retrieved, suggesting the strength of the model to specifies the potentially active compounds.
Preprints 102475 g003
Figure 4. Fitness and Cook’s distance plots of actual biological activities vs predicted values. Panels a & b show the fitness plots for QSAR models validated with non-flavonol flavonoids and non-flavonoids, respectively. The result demonstrated that more flavonols with anti-HBV activities will strength the model validated with flavonoids. Cook’s distance metric is also depicted in panel c.
Preprints 102475 g004
Figure 6. Scree plot. Whole variance of the model’s data is explained in three factors. Accordingly, ~98% of data are displayed with two first F1 and F2 components that are used to explain the variables of the QSAR model.
Preprints 102475 g006
Figure 7. The PCA plots representing the variables relationships (a & b), and the score plots of distribution patterns (c) and variation of compounds (d) in two PCs.
Preprints 102475 g007
Table 1. Summary of the variables selection to predict biological activities of the flavonoids with anti-HBV activities.
Nbr. of variables Variables MSE Adjusted R² Akaike's AIC Schwarz's SBC Amemiya's PC
2 X4A / qed 102.80 0.87 0.85 67.48 69.40 0.17
The best model for the selected selection criterion is displayed in blue
Table 2. Type III Sum of Squares analysis (Biological activities).
Source DF Sum of squares Mean squares F Pr > F
X4A 1 5610.79 5610.79 54.58 < 0.0001
qed 1 3280.34 3280.34 31.91 0.00
Table 3. Goodness of fit statistics (Biological activities).
Non-flavonoid test set Flavonoid validation test set
Statistic Training set Validation set Statistic Training set Validation set
Observations 14.00 7.00 Observations 14.00 7.00
Sum of weights 14.00 7.00 Sum of weights 14.00 7.00
DF 11.00 4.00 DF 11.00 4.00
0.87 0.00 0.87 0.03
Adjusted R² 0.85 Adjusted R² 0.85
MSE 102.80 217498.45 MSE 102.80 13862.97
RMSE 10.14 466.37 RMSE 10.14 117.74
MAPE 28.44 2971.25 MAPE 28.44 4965.21
DW 1.19 DW 1.19
AIC 67.48 AIC 67.48
SBC 69.40 SBC 69.40
PC 0.20 PC 0.20
Press 838.87 Press 838.87
0.90 0.00 0.90 0.00
Table 4. Standardized coefficients of predictive variables in the QSAR model.
Validation set Descriptor Coefficient Std. Error t-value P-value Lower Bound Upper Bound
Flavonoid X4A 0.82 0.03 25.93 < 0.0001 0.75 0.88
qed -0.62 0.03 -19.17 < 0.0001 -0.70 -0.55
Non-flavonoid X4A 0.82 0.03 25.93 < 0.0001 0.75 0.88
qed -0.62 0.03 -19.17 < 0.0001 -0.70 -0.55
Table 5. Predictions and residuals (Biological activities) from the model validated by non-flavonol flavonoids.
Observation Biological activities Pred(Biological activities) Residual Std. residual Std. dev. on pred. (Mean) Adjusted Pred.
Kaempferol 34.96 48.75 -13.79 -1.36 4.22 51.64
Isorhamnetin 63.28 46.64 16.64 1.64 4.36 42.87
Icaritin 10.00 5.73 4.27 0.42 4.65 4.59
Hexamethoxyflavone 11.37 19.13 -7.76 -0.77 3.83 20.42
Chrysoeriol-6-C-b-D-boivinopyranosyl-41-O-b-D-glucopyranoside 83.26 82.51 0.75 0.07 6.11 82.08
Hyperoside (quercetin-3-O-galactoside) 32.30 35.47 -3.17 -0.31 4.13 36.10
Quercetin-3-O-glucuronide_(Q3G) 26.13 23.08 3.05 0.30 5.16 22.01
Proanthocyanidin 20.00 -11.17 31.17 3.07 9.65 -11.17
Amentoflavone 90.20 26.77 63.43 6.26 5.45 26.77
Rosmarinic acid 30.00 249.24 -219.24 -21.62 27.91 249.24
Sakuranetin 43.69 60.05 -16.36 -1.61 10.03 60.05
Oolonghomobisflavan C (OHBF-C) 4.30 35.25 -30.95 -3.05 6.31 35.25
Luteolin 7-O-glucuronide 55.51 72.27 -16.76 -1.65 4.89 72.27
Isovitexin 0.09 29.80 -29.71 -2.93 3.69 29.80
Table 6. Predictions and residuals (Biological activities) from the model validated by non-flavonoids.
Observation Biological activities Pred(Biological activities) Residual Std. residual Std. dev. on pred. (Mean) Adjusted Pred.
Kaempferol 34.96 48.75 -13.79 -1.36 4.22 51.64
Isorhamnetin 63.28 46.64 16.64 1.64 4.36 42.87
Icaritin 10.00 5.73 4.27 0.42 4.65 4.59
Hexamethoxyflavone 11.37 19.13 -7.76 -0.77 3.83 20.42
Chrysoeriol-6-C-b-D-boivinopyranosyl-41-O-b-D-glucopyranoside 83.26 82.51 0.75 0.07 6.11 82.08
Hyperoside (quercetin-3-O-galactoside) 32.30 35.47 -3.17 -0.31 4.13 36.10
Quercetin-3-O-glucuronide_(Q3G) 26.13 23.08 3.05 0.30 5.16 22.01
PHAP 73.50 405.98 -332.48 -32.79 51.55 405.98
Nobiletin 33.90 6.23 27.67 2.73 4.59 6.23
Linalool 7.10 765.39 -758.29 -74.79 100.32 765.39
Betulinic acid 50.00 -213.33 263.33 25.97 33.84 -213.33
Ursolic acid 7.10 -198.67 205.77 20.29 32.05 -198.67
Taraxasterol 56.29 -196.63 252.92 24.95 31.98 -196.63
Solamargine 1.57 -88.09 89.66 8.84 19.57 -88.09
Disclaimer/Publisher’s Note: The statements, opinions and data contained in all publications are solely those of the individual author(s) and contributor(s) and not of MDPI and/or the editor(s). MDPI and/or the editor(s) disclaim responsibility for any injury to people or property resulting from any ideas, methods, instructions or products referred to in the content.
Copyright: This open access article is published under a Creative Commons CC BY 4.0 license, which permit the free download, distribution, and reuse, provided that the author and preprint are cited in any reuse.
Prerpints.org logo

Preprints.org is a free preprint server supported by MDPI in Basel, Switzerland.

Subscribe

© 2024 MDPI (Basel, Switzerland) unless otherwise stated