Preprint
Article

Study on the Impact of Delayed Retirement on the Sustainability of Basic Pension Insurance Fund for Urban Employees in China

Altmetrics

Downloads

133

Views

67

Comments

0

A peer-reviewed article of this preprint also exists.

This version is not peer-reviewed

Submitted:

28 March 2024

Posted:

29 March 2024

You are already at the latest version

Alerts
Abstract
With the aging of China's population, the problem of pension security has become more and more prominent, and whether delayed retirement can effectively alleviate the pension fund gap and ensure the sustainability of the pension fund has become the focus of social concern. This study predicts the income and expenditure of urban workers' basic pension insurance fund from 2021 to 2050 by constructing an actuarial model of pension insurance fund income and expenditure, and simulates the effect of delayed retirement policy. The prediction results show that under the existing system, the basic pension insurance fund for urban workers will have a shortfall for the first time in 2027, and the shortfall will expand year by year. Compared with the non-implementation of delayed retirement policy, the simulation of the implementation of delayed retirementt program delayed the emergence of the fund gap until 2029, and the forecast period of the pension fund gap significantly narrowed, indicating that delayed retirement policy has a certain positive impact on alleviating the pressure of pension payments, but delayed retirementt can not completely eliminate the pension fund gap. In view of this, this paper suggests that a progressive and flexible delayed retirement policy should be introduced as soon as possible to better adapt to the needs of different groups. At the same time, differentiated policies should be formulated for different groups of people and a pension incentive mechanism for delayed retirement should be set up to improve public acceptance of delayed retirement policy. In addition, delayed retirement policy should be combined with other measures, such as lowering the corporate contribution rate and enhancing the value-added capacity of the pension fund, so as to ensure the sustainability of the pension fund.
Keywords: 
Subject: Social Sciences  -   Decision Sciences

1. Introduction

As China's aging population continues to increase, the degree of population aging is becoming increasingly severe [1]. At the same time, the average life expectancy of the population is increasing year by year, and urban workers, as the main expenditure object of the basic pension insurance, make the payment pressure of the pension fund more and more intense [2,3], thus affecting the sustainability of the fund [4]. In recent years, China's urban workers' pension insurance fund gradually appeared the income and expenditure gap [5], and the growth rate of accumulated balance also appeared the trend of a sharp decline [6]. In this case, the study of the impact of delayed retirement on the sustainability of the pension fund is of urgent and very important practical significance. The Notice on the Issuance of the Fourteenth Five-Year Plan for the Development of the National Aging Career and the Pension Service System, issued by the State Council in February 2022, explicitly proposes the implementation of a gradual delay in the mandatory retirement age, in order to alleviate the pressure on pension payments. The report of the 20th Party Congress also proposed to improve the national coordination system of basic pension insurance and implement a gradual delay of the statutory retirement age.
Many scholars have long studied and explored the issue of delayed retirement, and most scholars believe that delayed retirement can effectively reduce the pension gap and improve the sustainability of the pension fund [7,8,9]. They believe that with the aging of the population, lengthening the working life of workers can increase pension income [10], reduce pension expenditures [11], and narrow the pension fund gap [12], thus easing the pressure faced by the pension system [13,14,15,16]. Börsch-Supan and Berkel (2004) argues that the increasing ageing of the population and the precarious financial situation of the public pension system will lead to a serious financial crisis of the pension funds. In order to avoid a crisis, the extension of the retirement age must be used as an adjustment factor in pension reform [17]. Some scholars have further investigated the internal and external motivations and motivational hierarchy of the elderly to continue working after being eligible for retirement [18]. In addition, there are significant differences in extending time differently, extending retirement differently, and among different socioeconomic groups, industries, and occupations [19]. Based on the extended time perspective, Tian and Zhao (2016) found that if the statutory retirement age is delayed by five years, the emergence of the basic pension fiscal gap may be delayed by about 20 years, and the median basic pension deficit will be reduced by about 64.25% in 2087 [6]. Based on the empirical data of the United States, Biggs (2010) used a demographic microsimulation model to estimate that the retirement age extension from 62 to 65 would extend the life of the trust fund by five years; increase Social Security benefits by 16 percent and private pensions by $7,500 per year when individuals retire; and raise GDP by about 5 percent, adding billions of dollars to the economy and tax revenues [20]. Based on the retirement approach perspective, Hu, et al. (2023) argued that a rolling retirement age adjustment policy is more appropriate for a healthy economy than one-step retirement age adjustment program [21].
Another group of scholars hold a different view, Chen, et al. (2020) argued that delayed retirement may not achieve the desired effect, the implementation of policies is limited and treats the symptoms rather than the root cause, and cannot be the main method to bridge the gap [22]. Precarious working conditions, family care responsibilities, poor health and age discrimination make it difficult or impossible for many people to work into their 60s or beyond, making it more difficult to implement delayed retirement policies [23,24]. In addition, retirees with lower levels of education are more likely to stop working for medical reasons [25]. Some scholars also believe that delayed retirement policies may also lead to increased competition in the labor market, making it more difficult for young people to find employment and also increasing the employment pressure on the elderly, which may have a negative impact on economic development and social stability, and thus affect the sustainability of the pension system [26]. However, Munnell and Wu (2012), using U.S. data, found that increased employment of older people does not reduce employment opportunities or wages for younger people. On the contrary, the employment of older people may also help to increase the employment rate of younger people [27]. Burtless (2013) also used U.S. data to demonstrate that workers between the ages of 60 and 74 are more productive than the younger average worker, and that the more productive workers remain in the labor force for longer periods of time the more productive they are [28]. Oyaro, et al. (2015) found that through an empirical study of the transport and logistics industry in Australia, found that the supply of older workers is not the main barrier to young people gaining employment, but rather the recruitment practices and strategies used by employers to avoid the cost of training younger workers [29].
Overall, the impact of delayed retirement policy on the sustainability of pension funds is a complex issue that requires comprehensive consideration of various factors. The research results of scholars provide different perspectives and analyses, which provide reference and decision-making basis for policymakers. But most of the existing results study the impact of delayed retirement on the coordinated account of the pension fund. In fact, delayed retirement also has an impact on the personal account, and the study is not comprehensive enough. In addition, when conducting the modeling of pension income and expenditure, the existing studies less consider the factor of government financial subsidy, which leads to biased research results.
Based on this, this paper contributes in the following three aspects. Firstly, the financial subsidies are included in the actuarial model of the income and expenditure of the urban workers' pension insurance fund. The prediction results are closer to the reality. Secondly, it expands the research scope. When this paper studies the impact of delayed retirement on the sustainability of the pension fund, the sources of the pension fund include not only the co-ordinated account, but also the individual account, and take into account the factor of the government's financial subsidies, which makes the study more comprehensive. Thirdly, we construct an actuarial model of the income and expenditure of the urban workers' pension insurance fund, including the coordinated account, individual account and government subsidies, to predict and compare the income and expenditure and surplus of the pension insurance under the two policies of delayed retirement and non-delayed retirement, to explore the impact of delayed retirement on the sustainability of the urban workers' pension insurance fund, and to provide a scientific basis for the government to formulate a more accurate retirement policy to ensure the sustainability and stability of the pension fund.

2. Theoretical Analysis

Delaying the retirement age is a policy measure that is being considered or has already been implemented in several countries around the world to respond to population ageing, lengthen the duration of labour market participation, alleviate the financial pressure on pension systems, and improve the sustainability of pension funds. Theoretically, delaying retirement has an impact on the sustainability of pension funds through pension system adjustments, the labor market, and fertility rates.

2.1. Delayed Retirement Policy Affects the Sustainability of Pension Funds through Pension System Adjustments

Firstly, the implementation of delayed retirement policy makes the contribution period longer and the number of contributors increases, thus increasing the accumulated size of the pension insurance fund. The expansion of the accumulated size of the pension insurance fund helps to improve the pension payment ability, reduce the payment pressure of the pension system, and ensure the sustainability of the pension system [30]; secondly, the delay in the retirement age makes the number of years of contribution increase. If the number of years of receipt remains unchanged or grows by a small amount, it will help to improve the sustainability of the pension fund. Lastly, the implementation of delayed retirement policy prolongs the employees' contribution years, increasing the accumulation of personal accounts [14], thus increasing the pension replacement rate. A high pension replacement rate helps to protect the basic living standards of retirees and improve their quality of life. delayed retirement policy has a positive impact on the sustainability of the pension fund [31].

2.2. Delayed Retirement Policies Affect the Sustainability of Pension Funds by Changing the Structure of the Labor Market

The implementation of delayed retirement policy has helped to optimize the structure of the labour market. On the one hand, delayed retirement policy makes the supply of elderly labor increase in the labor market, which helps to alleviate the contradiction between supply and demand in China's labor market; on the other hand, delayed retirement policy helps to improve the vocational skills and experience accumulation of workers, and improves the overall quality of the labor market. Optimizing the structure of the labor market helps to increase the rate of economic growth, increase social wealth, and provide strong support for the sustainability of the pension system [32]. However, the older labor force may also cause some pressure on the employment of the younger labor force [26]. However, this impact can be mitigated if labor market policies can be rationally adjusted, for example, by improving the quality of education and vocational training and promoting the structural optimization of the workforce.

2.3. Delayed Retirement Policies Affect the Sustainability of Pension Funds by Changing Fertility Rates

Delayed retirement may prompt families to make closer trade-offs between childbearing and career development. In general, women, especially those in the workplace, may delay childbearing or have fewer children as a result of delayed retirement in order to maintain career advancement and social status. This trade-off may lead to a decline in fertility. Although delaying retirement can increase the time and amount of money accumulated in the pension fund, the financial pressure on the pension system may be exacerbated if the fertility rate continues to decline and the number of young workers is insufficient [9]. As the number of contributors decreases, the pressure to pay pensions may shift to fewer and fewer workers, which could negatively affect the sustainability of the pension system [33]. However, this negative impact could also be mitigated to some extent if society provides better support measures for childcare.

3. Construction of Theoretical Model

China's current basic pension insurance system for urban workers is based on a combination of a unified account, i.e., a combination of a social coordinating account and an individual account. In reality, the income of the basic pension insurance fund for urban workers in China mainly consists of three parts, the income from the social integrated account, the income from the individual account, and the financial subsidies from the government. Therefore, in this paper, the income of the basic pension insurance fund for urban workers is measured by the three parts of the integrated account, individual account and financial subsidies. For the sake of simplicity of calculation, the cases of early retirement and mid-term withdrawal are not taken into account.

3.1. Pension Fund Income Modeling

3.1.1. Model of Income from Pension Insurance Benefits in Social Integration Accounts

The growth of the average annual wage income of urban workers is influenced by the social and economic growth and the improvement of the comprehensive ability of individuals, so the urban workers' pension contribution wages will also be affected. This paper assumes that the average wage level of employees due to the social and economic growth of the growth rate of χ, so that the average wage level of urban in-service workers at the age of i in the year of t can be represented as:
W i t = W i − 1 t − 1 × ( 1 + χ )
Among them:
W i − 1 t − 1 = W i − 2 t − 2 × ( 1 + χ )
And so on can be obtained:
W i t = W b t − i + b × ( 1 + χ ) i − b × ( 1 + δ ) i − b
where W i t denotes the average wage level of urban active workers aged i in the year t; W i − 1 t − 1 denotes the average wage level of urban active workers aged i − 1 in the year t − 1 ; W b t − i + b denotes the average wage level of urban active workers aged b in the year t − i + b , i.e., the average wage level of urban active workers aged i in the first year of their employment in the year t; and b denotes the initial age of the worker's enrollment in the program.
The number of contributors to the pension fund of urban active workers at the age of i in the year t can be expressed as the average of the number of contributors at the beginning of the year t (i.e. at the end of the year t − 1 ) and the number of contributors at the end of the year t. It can be expressed by the formula:
N e i t = I i , t + I i − 1 , t − 1 2
where N e i t represents the number of contributors to the pension fund of urban active workers at the age of i in the year t ; I i , t represents the number of contributors at the end of the year t; and I i − 1 , t − 1 represents the number of contributors at the beginning of the year t.
Then, starting from the base period, the income of the pension insurance premium on the social coordinated account in the year t is equal to the number of contributors to the pension insurance premiums of urban active workers at different ages in that year multiplied by the corresponding average wage level multiplied by the pension insurance premium contribution rate on the coordinated account multiplied by the pension insurance premium compliance rate on the coordinated account. The model can be represented as:
R ( t ) = ∑ i = b M − 1 N e i ( t ) × W i ( t ) × C r 2 × O t
where: R ( t ) is the income of pension insurance premiums of the social co-ordination account in the year t ; b represents the initial age of participation of the employees; M represents the retirement age of the employees; N e i ( t ) represents the number of contributors to the pension insurance premiums of the urban active employees at the age of i in the year t; W i ( t ) represents the average level of wages of the urban active employees at the age of i in the year t; C r 2 represents the rate of pension insurance premiums contributions to the co-ordination account; and O t represents the rate of pension insurance premiums compliance of the co-ordination account.
By substituting Formulas (3) and (4) into Formula (5) and arranging the terms, we get:
R ( t ) = ∑ i = b M − 1 I i , t + I i − 1 , t − 1 2 × W b ( t − i + b ) × ( 1 + χ ) i − b × C r 2 × O t
And due to the differences in the statutory retirement age for men and women currently set in China, this model can be further refined as:
R t = ∑ i = b M m − 1 [ I m , i , t + I m , i − 1 , t − 1 2 × W b t − i + b × 1 + χ ) i − b × C r 2 × O t + ∑ i = b M f − 1 [ I f , i , t + I f , i − 1 , t − 1 2 × W b t − i + b × 1 + χ i − b × C r 2 × O t ]
In this case, variables with m in the lower corner indicate males and those with f indicate females.

3.1.2. Individual Account Pension Income Model

From the base period, the income of the individual account pension insurance premiums in the year t is the product of the number of urban active workers of different ages who contributed to the pension insurance premiums in that year, the corresponding average salary level, the growth rate of the premiums in the individual account since the participation in the program, the rate of contribution to the pension insurance premiums in the individual account, as well as the rate of compliance with the contribution to the pension insurance premiums in the individual account. The model can be represented as:
R ( t ) ′ = ∑ i = b M − 1 N e i ( t ) × W i ( t ) × ( 1 + r ) M − i × C r 1 × V t
where: R ( t ) ′ is the income of individual account pension insurance premiums in the year t; b represents the initial age of employees' enrollment; M represents the retirement age of employees; N e i ( t ) represents the number of contributors to the pension insurance premiums of urban active employees at the age of i in the year t; W i ( t ) represents the average level of wages of urban active employees at the age of i in the year t; r represents the rate of return on the fund; C r 1 represents the rate of contribution to pension insurance premiums in individual accounts; and V t represents the rate of compliance with the pension insurance premiums in individual accounts.
BY substituting Formulas (3) and (4) into Formula (8) and arranging the terms, we get:
R ( t ) ′ = ∑ i = b M − 1 I i , t + I i − 1 , t − 1 2 × W b t − i + b × 1 + χ i − b × 1 + δ i − b × 1 + r M − i × C r 1 × V t
And due to the differences in the statutory retirement age for men and women currently set in China, this model can be further refined as:
R ( t ) ′ = ∑ i = b M m − 1 [ I m , i , t + I m , i − 1 , t − 1 2 × W b t − i + b × 1 + χ i − b × 1 + δ i − b × 1 + r M − i × C r 1 × V t ] + ∑ i = b M f − 1 [ I f , i , t + I f , i − 1 , t − 1 2 × W b t − i + b × 1 + χ i − b × 1 + δ i − b × 1 + r M − i × C r 1 × V t ]
In this case, variables with m in the lower corner indicate males and those with f indicate females.

3.1.3. Financial Subsidies

Considering the government's financial subsidies as one of the important sources of urban workers' pensions, the proportion of financial subsidies in the annual income of the basic pension insurance fund for urban workers is relatively stable, so the proportion of financial subsidies in the income of the basic pension insurance fund for urban workers can be used to make a prediction of the future government's financial subsidies. Take G ( t ) as the government's financial subsidy to the basic pension insurance fund for urban workers in the year t, and n as the proportion of the financial subsidy to the total income of the pension insurance fund for urban workers. Then the government's financial subsidy to the basic pension fund for urban workers in the year t will be:
n = G ( t ) R ( t ) + R ( t ) ′ + G ( t )
Morphing the above equation gives us the government's financial subsidy to the basic pension fund for urban workers in the year t:
G ( t ) = n [ R ( t ) + R ( t ) ′ ] 1 − n
Then the total income of the basic pension insurance fund for urban workers is equal to the income from the social co-ordination account plus the income from the individual account plus the government's financial subsidy, so the income of the pension insurance fund for urban workers is:
F ( t ) = R ( t ) + R ( t ) ′ + G ( t ) = R ( t ) + R ( t ) ′ 1 − n

3.2. Model of Social Pension Expenditure

The number of retired people receiving pensions at the age of i in the year t can be expressed as the average of the number of people at the beginning of the year t (i.e. at the end of the year t − 1) and the number of people at the end of the year t. It can be expressed by the formula:
N r i ( t ) = U i , t + U i − 1 , t − 1 2
where N r i ( t ) represents the number of pensioners who retired at age i in year t, U i , t represents the number at the end of year t, and U i − 1 , t − 1 represents the number at the beginning of year t.
Expenditures for social pension benefits were:
E ( t ) = ∑ i = M w − 1 N r i ( t ) × P t , i
where E ( t ) denotes social pension expenditures; ω denotes the average age of death of workers; and P t , i denotes the pension of workers who retired at age i in year t.
Adjust the pension level according to the state of economic development, where α represents the annual adjustment rate of the pension, then:
P i , t = P M , t − i + M ( 1 + α ) ( i − M )
where P M , t − i + M denotes the average pension received by a retired worker aged M in year t – i + M, i.e. the average pension received by a retired worker aged i in year t at the beginning of the first year of his/her retirement.
Also because the pension replacement rate is the ratio of the pension of a participant in the first year of retirement to the level of the participant's average wage in the year before the year in which he or she retired, denoted by R, then:
R = p M , t − i + M W M − 1
where W M − 1 denotes the average salary of retired urban workers in the year before their retirement.
Equations (14), (16), and (17) are obtained by bringing in (15) and organizing:
E ( t ) = ∑ i = M w − 1 U i , t + U i − 1 , t − 1 2 × R × W M − 1 × 1 + α i − M
This model can be further refined due to the different statutory retirement ages for male and female workers and average life expectancy for men and women currently set in China:
E ( t ) = ∑ i = M m w m − 1 [ U m , i , t + U m , i − 1 , t − 1 2 × R × W M − 1 × 1 + α i − M ] + ∑ i = M f w f − 1 [ U f , i , t + U f , i − 1 , t − 1 2 × R × W M − 1 × 1 + α i − M ]

3.3. Urban Workers' Basic Pension Insurance Pension Revenue and Expenditure Gap Measurement Model

3.3.1. Current Urban Workers' Basic Pension Insurance Pension Income and Expenditure Gap

The current urban workers' basic pension insurance pension income and expenditure gap is equal to the current urban workers' basic pension insurance pension income minus pension expenditure, and the current urban workers' basic pension insurance pension income is equal to the current urban workers' basic pension insurance social coordination part of the fund income plus the current urban workers' basic pension insurance individual account fund income plus the current government's basic pension insurance fund for urban workers. The calculation formula is:
Q ( t ) = F ( t ) − E ( t ) = R t + R t ′ 1 − n − E ( t )
where Q ( t ) indicates the difference between the income and expenditure of the basic pension fund for urban workers in the current period.

3.3.2. Accumulated Balance of Urban Workers' Basic Pension Insurance Pensions

The accumulated balance of the current Urban Employees' Basic Pension Insurance Fund is equal to the current income and expenditure of the current Urban Employees' Basic Pension Insurance Fund plus the accumulated balance of the Urban Employees' Basic Pension Insurance Fund of the previous period, which is expressed by the formula:
A ( t ) = Q ( t ) + A ( t - 1 )
where A ( t ) denotes the accumulated balance of the basic pension fund for urban workers in year t.

4. Parameter Setting and Data Selection Parameter Setting and Data Selection

4.1. Total Population and Population by Sex

Based on the data from the Seventh National Population Census in 2020, using PADIS-INT population projection software, the starting and ending years are set as 2020 and 2050 respectively, with a parameter adjustment interval of 1 year. The United Nations model life table is used. Setting relevant parameters is an essential step in the process. Firstly, the number of the starting population. The Seventh National Population Census in 2020 is the closest one to the present in every ten years. The data are new and can reflect the reality more accurately, so the parameter of starting population number is selected as the base period data of the age-specific and sex-specific population number in the Seventh National Population Census in 2020. Secondly, Setting of Fertility Patterns. Generally, the age-specific fertility rate is relatively stable and will not undergo large fluctuations. The fertility pattern selects the fertility rate of women of childbearing age in each age group 15-49 years in 2020. Thirdly, setting of fertility level. The National Population Development Plan (2016-2030) mentions that China's total fertility rate is expected to reach about 1.8 by 2030, and according to the relevant surveys by the National Bureau of Statistics, the number of children of childbearing age women in China who wishes to have children is also 1.8. Therefore, this article assumes that China may introduce policies to encourage childbirth, stimulating the fertility potential of women of childbearing age, so that the total fertility rate will rise to 1.80 by 2030 (the level of willingness to bear children), and then remain at 1.80 by 2050. Fourthly, Setting of Birth Sex Ratio. Under normal circumstances, the sex ratio at birth is determined by biological laws, with a normal range of 102-107. China's sex ratio at birth has been on the high side for a long period of time, and the government and related departments have taken many positive measures to intervene, and in recent years the rising trend of China's sex ratio at birth has slowed down or even begun to gradually decline, and China's sex ratio at birth will return to normal levels by about 2050 [34]. In this paper, the sex ratio at birth is based on the viewpoint of Chao et al. (2021) [30] that China's sex ratio at birth will reach 106 in 2050, and the sex ratio at birth in the intermediate years is smoothed. Fifthly, the migration pattern and the migration level. Since the level of in-migration and out-migration in China is not large, the prediction of future population can be regarded as operating in a closed environment, so the population migration is not considered, and the relevant parameters for each year are set to 0 [35,36]. Sixthly, life expectancy. According to the experience of developed countries, it is known that the life expectancy of the population will continue to increase with the improvement of the standard of living. In this paper, the population life expectancy is based on the projection of China's population life expectancy in 2050 in World Population Prospects 2019, which is 78.8 for males and 82.9 for females, with smoothing of the data in the intermediate years. Based on the parameters set above, the total population by age and by sex, as well as the annual total population and population size by sex, are projected for the next 30 years in China, and the projection results are shown in Figure 1.

4.2. Working Age and Retirement Age

The minimum age of employment stipulated in China's labor law is 16 years old, but according to data from the 2020 China Population and Employment Statistical Yearbook, the proportion of China's employed persons aged 16-19 years old to all employed persons is only 1%, so this paper assumes that an urban worker participates in the workforce at the age of 20, and after enrolling in the insurance, he/she continuously pays the contributions until his/her retirement with no breaks in the middle of the period, of which the retirement age for males is The retirement age for men is 60 years old, the retirement age for female workers is 50 years old, and the retirement age for female cadres (including civil servants, career organizations, etc.) is 55 years old. Considering the retirement regulations for female cadres, this paper assumes that the proportion of female cadres among women aged 50-54 is γ, and that they retire at the age of 55. There will be a total of 7.1 million civil servants and 31 million career employees, both totaling 38.1 million people, accounting for about 8.29% of the 459.31 million people employed in cities and towns nationwide in 2022. Assuming γ = 10% in this paper, the number of employed and retired women per year is shown below.
I f , t = ∑ i = 20 49 F f , i , t 1 + β × ∑ i = 50 54 F f , i , t 2
U f , t = 1 − β × ∑ i = 50 54 F f , i , t 2 + β × ∑ i = 55 100 F f , i , t 3
where I f , t denotes the number of employed women in year t, U f , t denotes the number of retired women in year t, and F f , i , t 1 , F f , i , t 2 , and F f , i , t 3 denote the number of employed women aged 20-49, 50-54, and retired women aged 55-100, respectively. β denotes the proportion of female cadres among women aged 50-54.

4.3. Maximum Age of Survival

With the development of science and technology, the life expectancy of human beings in the future will be slowly extended to a certain extent, but this growth is very slow, especially when it reaches a certain point, the room for growth will gradually become smaller. Therefore, according to the China Life Insurance Industry Experience Life Tables (2000-2003), this paper assumes that the maximum age of survival for urban worker retirees is 100 years old.

4.4. Average Annual Wage Growth Rate

The annual average wage growth rate is the growth rate of the average wage level of urban workers as a result of social and economic growth. According to the relevant data from the National Bureau of Statistics, the trend of China's average wage growth rate is the same as the trend of GDP. This paper refers to Liu, et al.'s (2022) [37] prediction of China's future GDP, and sets the future average annual growth rate of urban workers at 7.9% in 2021-2025, 7.0% in 2026-2030, 6.4% in 2031-2035, 5.5% in 2036-2040, 4.4% in 2041-2045, and 3.5% in 2046-2050.

4.5. Population Urbanization Rate

The population urbanization rate is a measure of urbanization, expressed as the proportion of the urban population to the total population. According to the China Statistical Yearbook of past years, China's urbanization rate from 2010 to 2020 will be 49.68%, 51.27%, 52.57%, 53.73%, 54.77%, 56.10%, 57.35%, 58.52%, 59.58%, 60.60%, and 63.89% respectively. From the Northam curve, it can be seen that the urbanization process is divided into three parts, the initial stage for the urbanization rate is less than 30%, the growth of urbanization rate in this stage is slow; in the middle stage for the urbanization rate is at 30%~70%, the growth of urbanization rate in this stage is rapid, and China is currently in this stage; in the late stage, the growth of the urbanization rate is very slow, and when the urbanization rate is around 80%, it will be in a state of near convergence. Since the current process of China's urbanization has entered the middle and late stages, the growth rate of urbanization rate is bound not to maintain the previous trend, so regarding the value of the future urbanization rate, we refer to the prediction of China's urbanization rate by Gu, et al. (2017) [38], and set the urbanization rate of 2030 and 2050 to 70% and 80%. The average annual urbanization rate growth in China from 2020 to 2030 is 1.33%, and from 2031 to 2050, it is projected to be 0.67%. Based on this, we can calculate the urbanization rate for the period from 2021 to 2050.

4.6. Employment Rate of the Urban Population

The employment rate is an indicator of the degree of employment of the labor force, referring to the percentage of employed persons in the sum of employed persons and persons awaiting employment. According to the Statistical Bulletin on the Development of Human Resources and Social Security of Past Years, the urban unemployment rate from 2010 to 2020 can be obtained as 4.10%, 4.10%, 4.10%, 4.05%, 4.09%, 4.05%, 4.02%, 3.90%, 3.80%, 3.62%, and 4.24% respectively, with an average of 4.01% urban unemployment rate. The unemployment rate is 4.01%. Accordingly this paper sets the unemployment rate of urban workers in 2021-2050 at 4.00% and keeps it unchanged, then the employment rate of urban workers in 2021-2050 is 96.00%.

4.7. Compliance Rate for Basic Pension Insurance for Urban Workers

Compliance rate refers to the proportion of urban workers' basic pension insurance who actually pays contributions to the insured. Many enterprises in China have the behavior of fee evasion, and the phenomenon of non-payment, underpayment, and delinquency of social security fees is very common. The compliance rate of basic pension insurance for urban workers in China in 2020 is 72.03%. This paper combines the assumption of Xie, et al. (2020) [39] that the coverage of China's pension insurance system will realize full coverage in 2020, and that social security fees will be collected by the tax department from 2019, the collection rate of urban workers' basic pension insurance fund has increased. So this paper assumes that the collection rate of urban workers' basic pension insurance fund is 85% from 2021 to 2050.

4.8. Contribution Rate for Basic Pension Insurance for Urban Workers

In order to adapt to the economic and social development situation, the government has continued to increase its efforts to reduce taxes and fees. Since May 1, 2019, the Notice of the General Office of the State Council on Issuing a Comprehensive Program to Reduce the Rate of Social Insurance Fees shows that the part of the unit's contribution will continue to be reduced to 16%, and the individual will remain unchanged at 8%. Therefore, in this article, the contribution rate for the social integration part is set at 16%, and the contribution rate for the individual account part is 8%.

4.9. Pension Replacement Rate

In the Convention on Minimum Standards of Social Security, a minimum pension replacement rate of 55 per cent is stipulated, with a rate of less than 50 per cent implying a significant decline in the standard of living of workers after retirement. According to the Decision of the State Council on the Establishment of a Unified Basic Pension Insurance System for Enterprise Employees in 1997, China's current basic pension insurance system has a target pension replacement rate of 58.5%, while the actual level has shown a downward trend in recent years. According to the relevant data on the National Bureau of Statistics, the pension replacement rate of China's basic pension insurance for urban workers from 2010 to 2020 was calculated to be 57.05%, 55.37%, 54.69%, 52.91%, 53.33%, 51.96%, 51.35%, 57.48%, 57.34%, 55.50% and 53.74%, respectively. The trend of pension replacement rate changes in the past ten years is relatively stable, and the overall trend is low. This article refers to the International Labor Organization's provision on the minimum standard of 55% for the basic pension replacement rate for urban workers, and assumes that the pension replacement rate of China's basic pension insurance fund for urban workers will be 55% from 2021 to 2050.

4.10. Pension Adjustment Rate

In the long run, the pension adjustment rate is subject to changes in pension benefit adjustment policies, economic growth and other factors. According to the Notice of the Ministry of Human Resources and Social Security and the Ministry of Finance on the Adjustment of Retirees' Basic Pension in 2022, issued by the Ministry of Human Resources and Social Security [2022] No. 27, the adjustment rate of China's urban workers' basic pension will be 4% from 2021, so this paper assumes that the adjustment rate of China's urban workers' basic pension will be 4% in the period of 2021-2050.

4.11. Pension Crediting Rate

As an important part of the pension insurance system, the individual account fund has the obvious attributes of individual property rights and the characteristic of complete accumulation. In the design of the State's individual account system for pension insurance, there are clear provisions for the management of individual account funds, namely, that interest must be credited to individual account funds. Prior to 2005, due to the imperfect interest rate mechanism, in most cases, the interest credited to individual accounts was determined by reference to the one-year time deposit rate, which often resulted in lower interest earnings. However, since 2005, localities have begun to gradually improve the mechanism of booked interest rates for pension individual accounts by adopting the method of calculating interest rates linked to the rate of return on investments, which has led to a significant improvement in the booked interest rates, which is usually in the range of 3% to 5% or more. From 2016 to 2020, China's Ministry of Human Resources and Social Security and Ministry of Finance jointly and uniformly issued individual account crediting rates of 8.31%, 7.12%, 8.29%, 7.61%, and 6.04%, respectively. The average crediting rate for these five years is 7.47%. Based on this, this paper sets the individual account crediting rate at 7.47% in the subsequent analysis.

4.12. Average Social Wage

The average social wage is the contribution base for urban workers' pension insurance. In the past, the contribution base for urban workers' pension insurance was the average annual salary of urban non-private sector employees in the previous year. In April 2019, the Circular of the General Office of the State Council on the Issuance of a Comprehensive Plan for Reducing the Rate of Social Insurance Premiums adjusted the contribution base to be the weighted average annual salary of urban private sector and urban non-private sector employees to get the full-caliber average salary of the employed persons. However, at present, China does not have a unified weighted calculation method, and each province decides according to the actual situation of the basic old-age insurance for urban workers and employees. The average wage of urban workers in China is roughly equal to the sum of the average annual wage of urban private sector employees and the average annual wage of urban non-private sector employees, divided by 2.3. Therefore, this paper calculates the average social wage of urban workers in 2020 to be 67,437.39 yuan based on the weighted calculation of the data from the National Bureau of Statistics (NBS).

4.13. Government Financial Subsidies as a Proportion of Urban Workers' Basic Pension Income

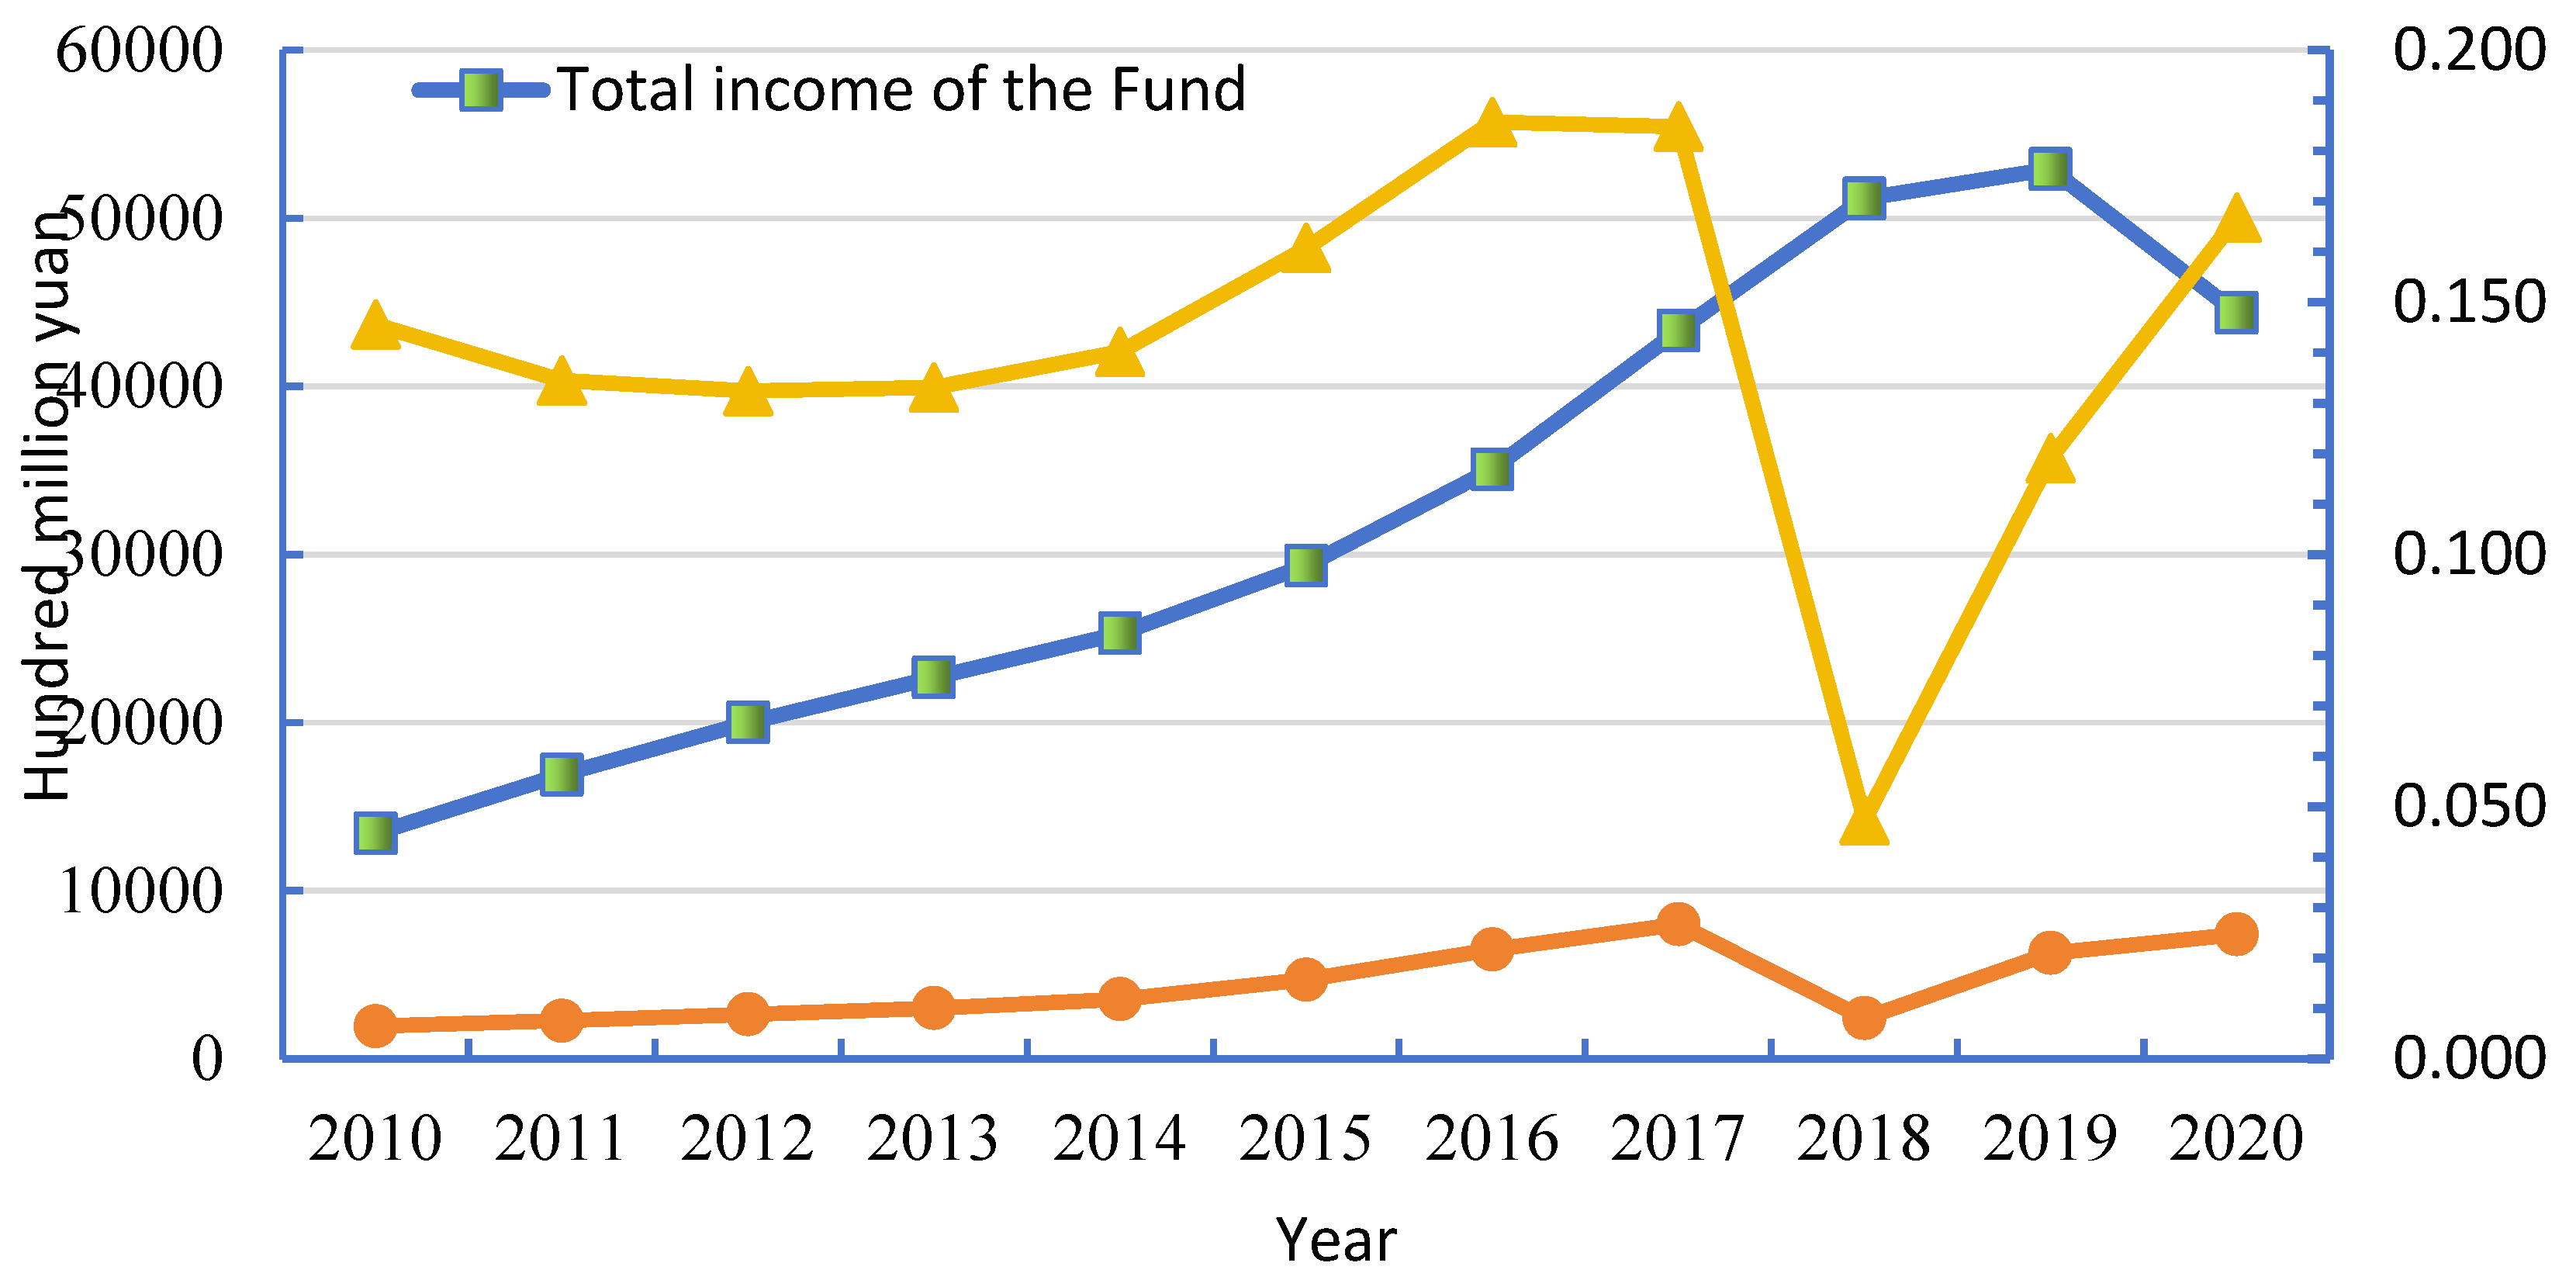
Based on the data from the 2010-2020 Statistical Bulletin on the Development of Human Resources and Social Security, we can calculate the total value of financial subsidies to the basic pension insurance fund as a proportion of the total income of the urban basic pension insurance fund for the period 2010-2020. First, we extract the data from the statistical bulletin on the amount of financial subsidies and the total income of the urban basic pension insurance fund for each year. Then, for each year's data, the proportion of the financial subsidy to the total income of the fund is calculated, and the results of the calculation are shown in Figure 2. Last, these 11 weights are added together to find the average, and we can get the average weight of 14.09% for 2010-2020. We can assume that the proportion of financial subsidy income of China's urban workers' basic pension insurance fund to the fund's total income is guaranteed to remain unchanged from 2021 to 2050, and will still be 14.09%.

5. Calculation Results and the Analysis

5.1. Results and Analysis of the Forecast of Income and Expenditure of the Urban Workers' Pension Insurance Fund

The setting of each parameter above is brought into the model of pension income in the social coordination part, the model of pension income in the individual account part, the model of pension income with financial subsidy, the model of urban workers' pension expenditure and the model of income and expenditure gap of urban workers' pension, and at the same time, combined with the data of China's population projections for the years of 2021-2050 in the previous section, we get the 2021 -2050 China's urban workers' pension income and expenditure as shown in Table 1.
From the data in Table 1, we can see that from 2021 to 2050, China's urban workers' pension insurance fund's contribution revenue, the government's financial subsidies and the fund's expenditures are all in a state of gradual increase. Due to the aging of Chinese society, the increase of pension fund expenditure is larger than the increase of fund income, and it is expected that the basic pension fund of urban workers will not be able to cover its expenses in the future. According to the data in Table 1, the current period balance of income and expenditure for the urban workers’ basic old-age insurance fund in 2021 was positive, with a surplus of 430.205 billion yuan. The data in the 2021 Annual Statistical Bulletin on the Development of Human Resources and Social Security shows that the current balance of the basic pension insurance fund for urban workers will be 397.400 billion yuan in 2021, which is comparable to the forecast of the basic pension insurance fund for urban workers in 2021 as shown in Table 1. Comparing the predicted current period revenue and expenses of the urban workers’ basic old-age insurance fund in 2021 from Table 1, the error rate is 8.25%. Therefore, this article’s forecast of the financial situation of the urban workers’ basic old-age insurance fund is relatively accurate.
The deepening aging of China's population and the low willingness of the society to give birth have brought great challenges to the basic pension insurance system for urban workers. In order to maintain the "balance of income and expenditure" of the basic pension insurance fund for urban workers in the future, the government, as an important part of the fund's income, will need to increase the financial subsidies to the basic pension insurance fund for urban workers. The government's finances will face a heavy subsidy pressure in the future. From the data in Table 1, we can see that the government's financial subsidy to the basic pension insurance fund for urban workers will increase year by year from 2021 to 2050, from 1110.086 billion yuan in 2021 to 5084.496 billion yuan in 2050, with an average annual growth rate of 5.10%. The difference between the revenue and expenses of the current period fund has changed from a slight surplus of 430.205 billion yuan in 2021 to a fund gap of -35726.372 billion yuan in 2050, with an average annual growth rate of 16.27%. The growth rate of fiscal subsidies has always failed to keep up with the pace of the growth in the gap of the urban workers’ basic old-age insurance fund. According to the Statistical Bulletin on Human Resources and Social Security Development in 2020, as of the end of 2020, the accumulated balance of the Chinese urban workers’ basic old-age insurance fund was 4831.700 billion yuan. Due to the negative balance of the fund’s current revenue and expenses from 2023 to 2050, the accumulated balance of the fund has been continuously decreasing and will be depleted in 2027, resulting in an accumulated surplus gap of -1296.607 billion yuan. The continuous increase in the current period’s fund revenue and expense gap leads to the annual expansion of the fund’s accumulated gap, reaching -393864.943 billion yuan by 2050.

5.2. Analysis of the Effect of Delayed Retirement on Pension Sustainability

5.2.1. Delayed Retirement Program Design
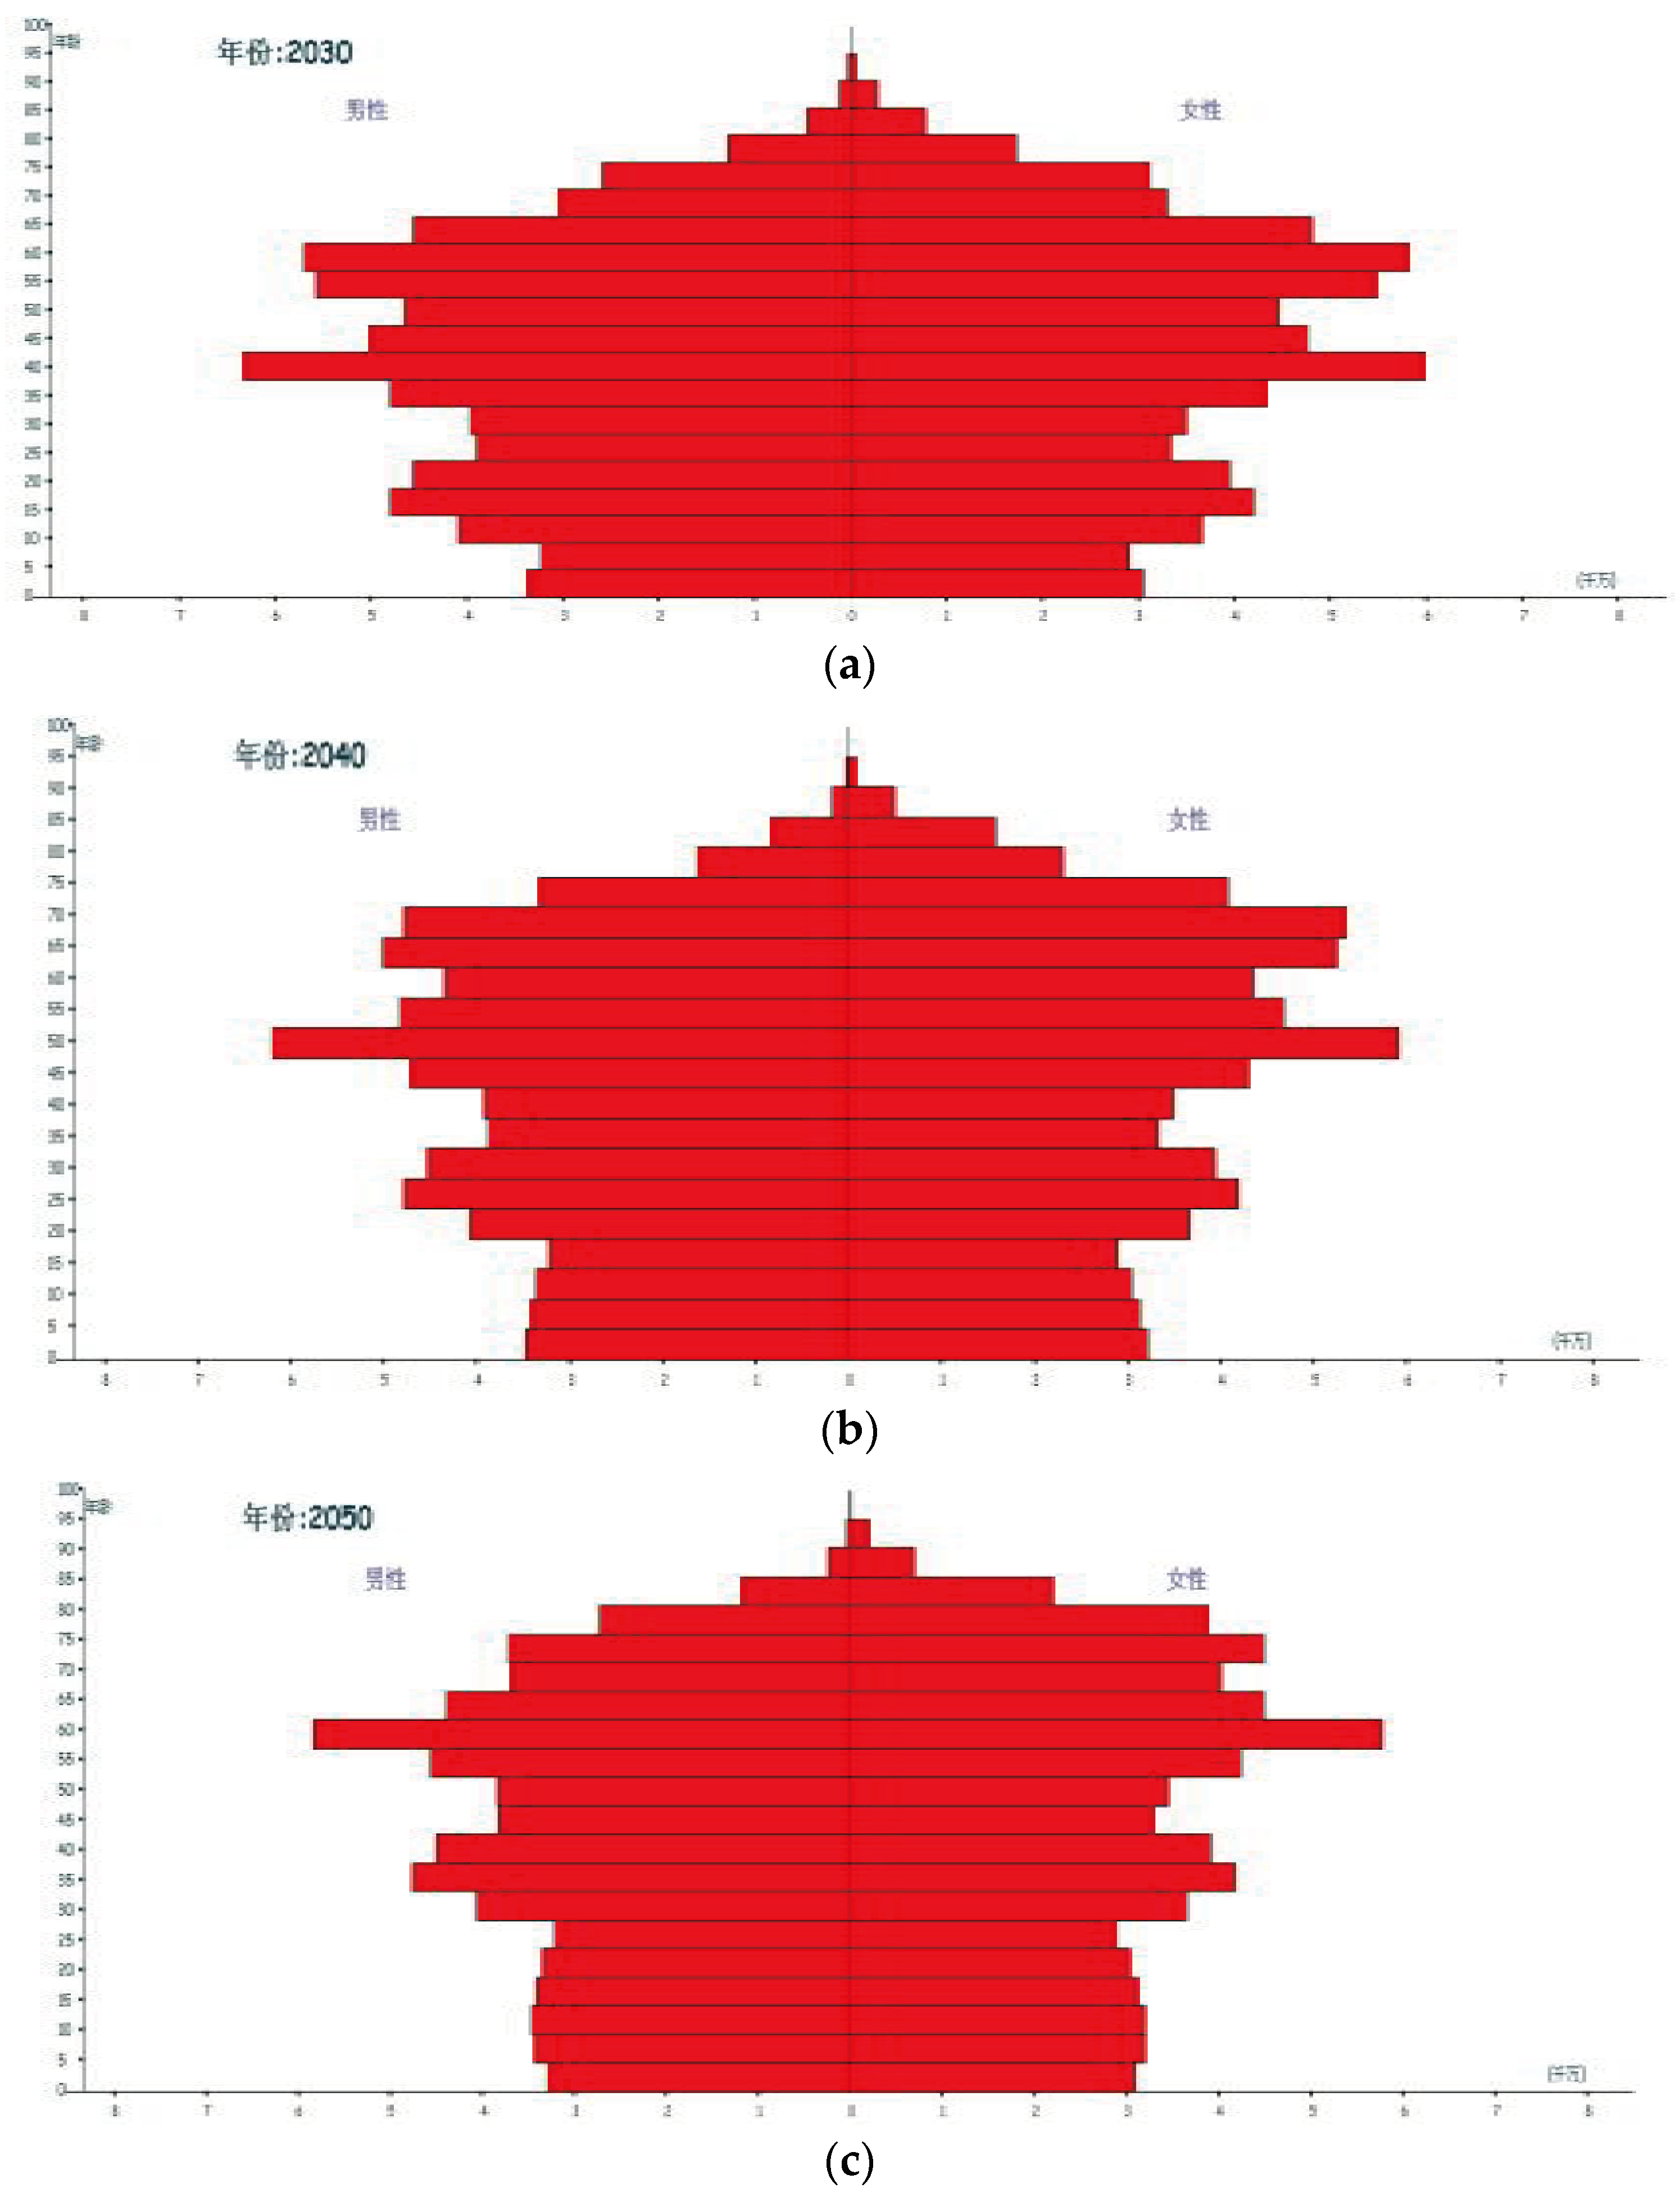
Under the currently implemented pension insurance system, the retirement age of male and female workers is not the same, so the gender structure of men and women is to a certain extent also affecting the income and expenditure of pensions. To directly visualize the proportion of population by gender and age groups, population pyramid was generated using demographic forecasting software based on the previously mentioned parameters. Looking at a decade as a stage, the population projection data of the three years 2030, 2040 and 2050 were selected to make a population pyramid graphic, according to the combination of male left and female right, upper old and lower young, as shown in Figure 3. It shows that over time, the elderly population gradually increases, the youth population gradually decreases, the aging of the population intensifies, and the labor force population declines. The number of male population is higher than that of female before the age of 60, but with the increase of age, the number of female population gradually catches up with the number of male, which means that female life expectancy is relatively longer compared with that of male. However, the retirement age of women is earlier than that of men, and the higher number of women and their earlier retirement will have a higher demand for pensions, and the difference in the gender ratio will have a certain impact on the income and expenditure of the pension fund.
As early as 2012, China put forward the policy of "delaying the pension age" in the Outline of the 12th Five-Year Plan for Social Security, making "delayed retirement" a focus of constant discussion. The Decision of the Central Committee of the Communist Party of China on a Number of Major Issues Concerning Comprehensively Deepening Reform formally put forward the need to study and formulate a strategy for gradual delay of retirement in 2013. The Outline of the Fourteenth Five-Year Plan for the National Economic and Social Development of the People's Republic of China and the Visionary Objectives of the 23rd Five-Year Plan explicitly put forward the need for gradual delay of the retirement age in 2021. In February 2022, the State Council issued the Circular on the Issuance of the 14th Five-Year Plan for the Development of the National Aging Career and the Pension Service System, which explicitly proposed the implementation of a gradual delay in the statutory retirement age. This paper draws on Yu & Zeng's (2015) adjustment of the statutory retirement age and divides delayed retirementt program into three parts. In the first part, 2022-2031, the retirement age of female workers at this stage will be gradually delayed from 50 to 55 (i.e., a two-year delay of one year), which is in line with that of female cadres. In the second part, 2032-2041, the retirement age of women will be gradually delayed from 55 to 60 years of age for retirement (i.e., two-year delay of one year), in line with the retirement age of men. In the third part, from 2042 to 2050, delaying the retirement age of men and women together, until the retirement age of men and women is delayed to 65 years old in 2049, and the retirement age will remain at 65 years old in 2050 [40].
Figure 3. China's population pyramid. (a) China's population pyramid in 2030; (b) China's population pyramid in 2040; (c) China's population pyramid in 2050.
Preprints 102535 g003

5.2.2. Impact of Delayed Retirement on Pension Sustainability

(1) Impact of delayed retirement on pension fund income
Based on the above assumption of delayed retirement, the income of the basic pension insurance fund for urban workers after delayed retirementt is now measured. The changes in the fund's income before and after delayed retirementt are compared as shown in Table 2.
The implementation of delayed retirement policy will slowly eliminate the distinction between female cadres and female workers, and gradually realize the same retirement age for both men and women, which means that the period for urban workers to pay pension insurance will be extended, which means that the income of the basic pension insurance fund for urban workers will increase, and correspondingly the time for receiving pension will be shortened, which means that the expenditure of the basic pension insurance fund for urban workers will decrease. As can be seen from the trend of changes in the income of the basic pension insurance fund for urban workers before and after delayed retirementtt in Table 2. After the implementation of delayed retirement policy, the retirement age of female workers is delayed to 51 years old starting from 2023, resulting in a small increase in the pension income in that year compared with the initial forecast value of 9194.771 billion yuan, which is 63.371 billion yuan higher than the comparison with the period before delayed retirement policy. Afterwards, with the gradual increase in the retirement age of female workers to 2031, the retirement age of women was unified at 55 years old, and to 2041, the retirement age of urban workers was unified at 60 years old, realizing the retirement of men and women at the same age. The difference in the fund income of the basic pension insurance for urban workers before and after the implementation of delayed retirement policy has also continued to expand, and to 2050, after the implementation of delayed retirement policy, compared with the income of the fund before the implementation of the policy, fund income has increased by 9808.557 billion yuan. Therefore, delayed retirement has a significant positive impact on the income of the basic pension insurance fund for urban workers.
(2) Impact of delayed retirement on pension fund expenditures
In accordance with the assumption of delayed retirement mentioned above, the expenditure of the basic pension insurance fund for urban workers after delayed retirementtt is now measured, and the changes in the fund's expenditure before and after delayed retirementtt are compared as shown in Table 3.
After the implementation of delayed retirement policy, the prolongation of urban workers' working time also means the shortening of the time to receive the urban workers' pension insurance fund. From the changes in urban workers' basic pension insurance fund expenditures before and after delayed retirementtt in Table 3, it can be seen that the pension fund expenditures decrease after the simulated implementation of delayed retirement policy. After the implementation of the policy in 2023 the retirement age of female workers is delayed to 51 years old, and the expenditure of the basic pension insurance fund for urban workers in that year is 9235.604 billion yuan, which is 136.572 billion yuan less than the pension expenditure before the implementation of the policy. In subsequent years, as the retirement age increases, the reduction in expenditures of the urban workers’ basic pension insurance fund before and after the implementation of delayed retirement policy also gradually increases, reaching as high as 22037.507 billion yuan by 2050. This shows that delayed retirement policy has a significant inhibitory effect on the expenditures of the urban workers’ basic pension insurance fund.
(3) Impact of delayed retirement on the sustainability of pension funds
Based on the assumptions of delayed retirement policy, the difference between current income and expenditure. The cumulative surplus of the urban workers’ basic old-age insurance fund will change as shown in Table 4. Starting from 2022, delayed retirement policy of gradually realizing the abolition of the difference between the retirement age of female cadres and female workers and gradually realizing the retirement at the same age for men and women is gradually realized, the difference between current income and expenditure of the basic pension insurance fund for urban workers before 2022 is in line with the difference between current income and expenditure of the pension before the implementation of delayed retirement policy. Starting from 2023, the gap between the current income and expenditure of the pension after the implementation of delayed retirement policy is smaller than the gap between the current income and expenditure of the pension before the implementation of delayed retirement policy. The current pension revenue and expenditure gap has been narrowed by 199.943 billion yuan between the implementation of delayed retirement policy in 2023 and its subsequent period, and by 31846.064 billion yuan in 2050. This indicates that delayed retirement policy has eased the fund’s current "income not covering expenses" situation to some extent and has a certain impact on the sustainability of the pension fund. However, the cumulative surplus gap appeared in 2027 before delayed retirement policy, and after the policy’s implementation, the gap appeared in 2029. This suggests that delayed retirement does not eliminate the gap but only delays its occurrence by two years.
According to the previous analysis, we can understand that at present, China's basic pension insurance system for urban workers has certain problems, which is mainly manifested in the unsustainable balance of income and expenditure of the fund itself. Specifically, the current pension income and expenditure gap continues to be negative, and the future accumulated pension deficit is huge, which undoubtedly adversely affects the sustainability of China's pension fund. The design of delayed retirementtt program and the simulation of delayed retirement found that delaying the retirement age can narrow the current income and expenditure gap of China's urban workers' pensions and alleviate the pressure on pensions, but it can't completely eliminate the gap, and it needs to be combined with other ways to solve the problem together.

6. Discussion and Conclusions

6.1. Discussion

The sustainability of pension funds has become a major concern for governments around the world in the context of an aging population and economic downturn. This paper reveals the sustainability of China's basic pension fund for urban workers by studying the role of delayed retirement reform. By building an actuarial model of pension fund income and expenditure, the sustainability of China's basic pension fund for urban workers is assessed under a series of assumptions for the period from 2021 to 2050. The results show that China's basic pension insurance for urban workers will face severe pressure on pension payments. The calculations found that if China maintains the current statutory retirement age, the pension fund will be out of balance by early 2027. This situation is a bit later than previous studies found [15]. This is because most of the previous studies have ignored the role of financial subsidies, and the share of total pension income accounted for by government financial subsidies has been as high as 14% on average over the past 10 years. Therefore, in this paper, by considering the social pooling account, the individual account, and the financial subsidies as a whole in the total pension income, our findings may be more in line with the reality. The simulation of delayed retirement finds that the implementation of delayed retirementtt strategy gap occurs in 2029, two years later than before the delay, and significantly reduces the annual pension gap. Delaying retirement improves the solvency of the basic pension fund system for urban workers, but the pension gap does not disappear. In the long run, the retirement delay cannot fundamentally solve the pension payment crisis. The results of the general trend of the widening pension gap are consistent with the findings of Zhao et al [41] and Tian and Zhao [6]. Based on the above empirical analysis, we suggest that the government should implement the retirement system reform as soon as possible. This study assumes that some designs of retirement policy options have not yet been realized in practice. In future studies, the scenario assumptions should be adjusted according to the actual situation. In addition, the income of the pension fund is closely related to pension contributions, pension bookkeeping rate and socio-economic development [2]. Influences such as the labor market and government revenues can increase the complexity of pension fund sustainability projections [42]. Therefore, other factors affecting pension fund sustainability should be further considered in future research.

6.2. Conclusions

This paper studies the impact of delayed retirement on the sustainability of urban workers' pension insurance fund from an actuarial perspective. Firstly, the number of population by age and gender in the country from 2021 to 2050 is predicted by PADIS-INT software, on the basis of which an actuarial model of the income and expenditure of the urban workers' pension insurance fund is constructed, and the income and expenditure of the urban workers' pension insurance in the next thirty years is measured. Next, the impact of delayed retirementtt scheme on the income and expenditure of urban workers’ pensions was calculated. Finally, a comparative analysis was conducted on the pension income, expenditure, and annual surplus before and after the implementation of delayed retirement policy. The results of the study show that: delayed retirementtt program makes full use of labor resources, extends the employment years of workers, expands the fund's sources of funds, reduces the pressure on the payment of funds in the pension insurance system, significantly reduces the size of the pension insurance fund gap in the measured years, plays an important role in stopping the expansion of the gap size each year, and effectively alleviates the problem of the pension insurance fund gap, but it doesn't completely eliminate the pension fund gap within the measurement interval.
Based on the findings of this study, we make the following policy recommendations.
Firstly, the policy of delaying retirement is an important measure to improve the sustainability of the pension fund and should be introduced as soon as possible. Measurements show that delaying retirement can narrow the gap between pension income and expenditure in the forecast years, playing a very important role in easing the pressure on pension expenditure in the face of increasing ageing, and should be introduced as soon as possible. The "14th Five-Year Plan" also explicitly proposes to implement a gradual delay in the statutory retirement age. However, once delayed retirement policy is formally launched, not only affects the income and expenditure of the pension fund, will also affect the labor market, so the implementation of the policy needs to be cautious. At the present time, consideration can be given to a flexible delayed retirement system, which would change the statutory age of retirement into a flexible interval, allowing workers to choose on their own to retire or not to retire within that interval, according to their own circumstances.
Secondly, delayed retirement should be a differentiated policy for different groups of people. The age for delayed retirement should be determined based on different occupations, varying health conditions, and other segmented populations. Taking into account the characteristics of different occupations, different delayed retirement policies can be formulated for manual labor-intensive industries and knowledge workers. For example, for manual laborers, the number of years of delayed retirement can be appropriately lowered to reduce their work pressure, while for knowledge workers, a slight extension of the retirement age can be allowed to retain their knowledge and experience. Taking into account the health conditions of individuals, differentiated delayed retirement policies can be formulated. For those in better health, more options for delayed retirement can be provided, while for those in poorer health, more flexible retirement arrangements can be provided.
Thirdly, a pension incentive mechanism for delayed retirement should be established. The establishment of pension incentives for delayed retirement can encourage people to delay receiving their pensions in order to reduce the pressure on pension payments. Establishing a pension incentive mechanism for delayed retirement can encourage people to defer claiming their pensions, thereby alleviating the pressure on pension payments. First, increase the pension percentage. For individuals who choose to delay retirement, their annual pension percentage can be gradually increased, thus motivating them to delay retirement in order to receive a higher pension benefit. Second, offer a one-time bonus. A one-time retirement bonus can be provided for those who choose to delay retirement. This will increase the incentive for people to delay retirement. Third, implement differentiated treatments. Establish different levels of pension incentives based on the number of years of delayed retirement and individual contributions, providing differentiated treatments. This will incentivize individuals to choose to delay their retirement for a longer period.
Fourthly, delayed retirement should be used in conjunction with other methods to ensure the continued effective operation of the pension insurance system. Within the measurement interval, delayed retirementtt program can only narrow the annual pension income and expenditure gap of urban workers' pension insurance and ease the payment pressure on the pension fund in that year, but it cannot safely eliminate the gap. In order to effectively address the serious impact of population aging on pension fund expenditures, a combination of methods should be used to ensure the continued effective operation of the urban workers' pension insurance system, such as lowering the rate of corporate contributions, reducing the burden of corporate contributions, and at the same time increasing the rate of compliance with corporate contributions, expanding investment channels, and increasing the rate of return on the pension insurance fund.

Author Contributions

Conceptualization, Z.G., F.Y. and Z.D.; methodology, Z.G. and F.Y.; software, Z.D.; validation, Z.G., F.Y. and Z.D.; formal analysis, Z.G. and F.Y.; investigation, Z.G. and Z.D.; resources, Z.G. and Z.D.; data curation, Z.D.; writing—original draft preparation, Z.G., F.Y. and Z.D.; writing—review and editing, Z.G. and Z.D.; visualization, Z.G., F.Y. and Z.D.; supervision, Z.G., F.Y. and Z.D.; project administration, Z.G. and Z.D.; funding acquisition, Z.G. and F.Y. All authors have read and agreed to the published version of the manuscript.

Funding

This research was funded by the National Social Science Fund of China, grant number 18BRK027 and the Basic Project of Liaoning Provincial Department of Education, grant number LJC202019.

Institutional Review Board Statement

Not applicable.

Informed Consent Statement

Not applicable.

Data Availability Statement

The data used in our study are from the Seventh National Population Census of China, the China Population and Employment Statistics Yearbook, the China Statistical Yearbook, the Statistical bulletin on the development of human resources and social security, the China Life Insurance Experience Tables, and the National Bureau of Statistics of China.

Conflicts of Interest

The authors declare no conflicts of interest.

References

  1. Li, H.; Huang, J.; Liu, J. External support for elderly care social enterprises in China: A government-society-family framework of analysis. International Journal of Environmental Research and Public Health 2022, 19, 8244. [Google Scholar] [CrossRef] [PubMed]
  2. Zhao, Q.; Mi, H. Evaluation on the sustainability of urban public pension system in China. Sustainability 2019, 11, 1418. [Google Scholar] [CrossRef]
  3. Lee, R.; Edwards, R. The fiscal effects of population aging in the US: Assessing the uncertainties. Tax Policy and the Economy 2002, 16, 141–180. [Google Scholar] [CrossRef]
  4. Pecchenino, R.A.; Pollard, P.S. The effects of annuities, bequests, and aging in an overlapping generations model of endogenous growth. The Economic Journal 1997, 107, 26–46. [Google Scholar] [CrossRef]
  5. Xie, Y.; et al. The new fertility policy and the actuarial balance of China urban employee basic endowment insurance fund based on stochastic mortality model. Mathematical Problems in Engineering 2020, 1–12. [Google Scholar] [CrossRef]
  6. Tian, Y.; Zhao, X. Stochastic forecast of the financial sustainability of basic pension in China. Sustainability 2016, 8, 46. [Google Scholar] [CrossRef]
  7. Börsch-Supan, A.; Berkel, B. Pension reform in Germany: The impact on retirement decisions. Finanz Archiv/Public Finance Analysis 2004, 60, 393–421. http://www.nber.org/papers/w9913. [CrossRef]
  8. Hu, J.; Stauvermann, P.J.; Sun, J. The impact of the two-child policy on the pension shortfall in China: A case study of Anhui province. Sustainability 2022, 14, 8128. [Google Scholar] [CrossRef]
  9. Wu, Y.; Xu, C.; Yi, M. The optimal choice of delayed retirement policy in China. Sustainability 2022, 14, 12841. [Google Scholar] [CrossRef]
  10. Bielecki, M.; Goraus, K.; Hagemejer, J.; et al. Decreasing fertility vs increasing longevity: Raising the retirement age in the context of ageing processes. Economic Modelling 2016, 52, 125–143. [Google Scholar] [CrossRef]
  11. Vogel, E.; Ludwig, A.; Börsch-Supan, A. Aging and pension reform: Extending the retirement age and human capital formation. Journal of Pension Economics & Finance 2017, 16, 81–107. [Google Scholar] [CrossRef]
  12. Hsu, Y.H. The welfare effects of pension reforms in an aging economy. American Journal of Industrial and Business Management 2017, 7, 652–670. [Google Scholar] [CrossRef]
  13. Hu, Z.; Yang, J. Does delayed retirement crowd out workforce welfare? Evidence in China. SAGE Open 2021, 11, 1–14. [Google Scholar] [CrossRef]
  14. Ren, X.H.; Zhai, S.; Zhou, M. Research on the accumulation effect of pension income and payments caused by progressive retirement age postponement policy in China. Journal of aging & social policy 2019, 31, 155–169. [Google Scholar] [CrossRef]
  15. Wang, H.; Huang, J.; Yang, Q. Assessing the financial sustainability of the pension plan in China: The role of fertility policy adjustment and retirement delay. Sustainability 2019, 11, 883. [Google Scholar] [CrossRef]
  16. Lalive, R.; Magesan, A.; Staubli, S. How social security reform affects retirement and pension claiming. American Economic Journal: Economic Policy 2023, 15, 115–150. [Google Scholar] [CrossRef]
  17. Börsch-Supan, A.H.; Berkel, B. Pension reform in Germany: The impact on retirement decisions. Finanz Archiv / Public Finance Analysis 2004, 60, 393–421. http://www.nber.org/papers/w9913. [CrossRef]
  18. Bratun, U.; Zurc, J. The motives of people who delay retirement: An occupational perspective. Scandinavian Journal of Occupational Therapy 2022, 29, 482–494. [Google Scholar] [CrossRef] [PubMed]
  19. Levanon, G.; Cheng, B. US workers delaying retirement: Who and why and implications for businesses. Business Economics 2011, 46, 195–213. [Google Scholar] [CrossRef]
  20. Biggs, A.G. The case for raising social security’s early retirement age. Retirement Policy Outlook 2010, 3, 1. http://www.aei.org/.
  21. Hu, J.; Stauvermann, P.J.; Nepal, S.; Zhou, Y. Can the policy of increasing retirement age raise pension revenue in China—A case study of Anhui province. International Journal of Environmental Research and Public Health 2023, 20, 1096. [Google Scholar] [CrossRef] [PubMed]
  22. Chen, X.; Zhong, S.; Qi, T. Delaying retirement and China’s pension payment dilemma: Based on a general analysis framework. IEEE Access 2020, 8, 126559–126572. [Google Scholar] [CrossRef]
  23. Berkman, L.F.; Truesdale, B.C. Working longer and population aging in the US: Why delayed retirement isn’t a practical solution for many. The Journal of the Economics of Ageing 2023, 24, 100438. [Google Scholar] [CrossRef]
  24. Zulkarnain, A.; Rutledge, M.S. How does delayed retirement affect mortality and health? Center for retirement research at Boston College, CRR WP 2018, 11. http://hdl.handle.net/2345/bc-ir:108178. [CrossRef]
  25. König, S.; Lindwall, M.; Johansson, B. Involuntary and delayed retirement as a possible health risk for lower educated retirees. Journal of Population Ageing 2019, 12, 475–489. [Google Scholar] [CrossRef]
  26. Dai, T.; Fan, H.; Liu, X.; Ma, C. Delayed retirement policy and unemployment rates. Journal of Macroeconomics 2022, 71, 103387. [Google Scholar] [CrossRef]
  27. Munnell, A.H.; Wu, A.Y. Will delayed retirement by the baby boomers lead to higher unemployment among younger workers? Boston College Center for Retirement Research Working Paper. 2012-22. http://crr.bc.edu.
  28. Burtless, G. The impact of population aging and delayed retirement on workforce productivity. Available at SSRN. 2013, 2275023. http://hdl.handle.net/2345/bc-ir:104764.
  29. Oyaro Gekara, V.; Snell, D.; Chhetri, P. Are older workers ‘crowding out’ the young? A study of the Australian transport and logistics labour market. Labour & Industry: a Journal of the Social and Economic Relations of Work 2015, 25, 321–336. [Google Scholar] [CrossRef]
  30. Cremer, H.; Pestieau, P. The double dividend of postponing retirement. International Tax and Public Finance 2003, 10, 419–434. [Google Scholar] [CrossRef]
  31. Laun, T.; Wallenius, J. A life cycle model of health and retirement: The case of Swedish pension reform. Journal of Public Economics 2015, 127, 127–136. http://hdl.handle.net/10419/56215. [CrossRef]
  32. Yang, H.; Wu, Y.; Shen, Y.; Shen, Z. Delaying retirement, the burden of working population, subjective well being. Journal of Guizhou University of Finance and Economics 2020, 38, 69. https://gcxb.gufe.edu.cn/EN/Y2020/V38/I04/69.
  33. Boado-Penas, M.C.; Eisenberg, J.; Korn, R. Transforming public pensions: A mixed scheme with a credit granted by the state. Insurance: Mathematics and Economics 2021, 96, 140–152. [Google Scholar] [CrossRef]
  34. Chao, F.; et al. Projecting sex imbalances at birth at global, regional and national levels from 2021 to 2100: Scenario-based bayesian probabilistic projections of the sex ratio at birth and missing female births based on 3.26 billion birth records. BMJ Global Health 2021, 6, 1–12. [Google Scholar] [CrossRef] [PubMed]
  35. Tong, J.; Jing, Z.; Cheng, J.; et al. National and provincial population projected to 2100 under the shared socioeconomic pathways in China. Advances in Climate Change Research 2017, 13, 128. [Google Scholar] [CrossRef]
  36. Chen, X.; Yang, Z. Stochastically assessing the financial sustainability of individual accounts in the urban enterprise employees’pension plan in China. Sustainability 2019, 11, 3568. [Google Scholar] [CrossRef]
  37. Liu, Y.; Chen, X.; Wang, Q.; Zhu, L.; Zhou, Z. Forecast and analysis of national GDP in China based on Arima model. Academic Journal of Science and Technology 2022, 3, 78–83. [Google Scholar] [CrossRef]
  38. Gu, C.; Guan, W.; Liu, H. Chinese urbanization 2050: SD modeling and process simulation. Science China Earth Sciences 2017, 60, 1067–1082. [Google Scholar] [CrossRef]
  39. Xie, Y.; Zhang, X.; Lv, H.; et al. The new fertility policy and the actuarial balance of China urban employee basic endowment insurance fund based on stochastic mortality model. Mathematical Problems in Engineering 2020, 1–12. [Google Scholar] [CrossRef]
  40. Yu, H.; Zeng, Y. Retirement age, fertility policy and the sustainability of China’s basic pension insurance fund. Finance Research 2015, 41, 46–57+69. [Google Scholar] [CrossRef]
  41. Zhao, Y.; Bai, M.; Feng, P.; Zhu, M. Stochastic assessments of urban employees’ pension plan of China. Sustainability 2018, 10, 1028. [Google Scholar] [CrossRef]
  42. Curtis, C.C.; Lugauer, S.; Mark, N.C. Demographics and aggregate household saving in Japan, China and India. J. Macroecon. 2017, 51, 175–191. [Google Scholar] [CrossRef]
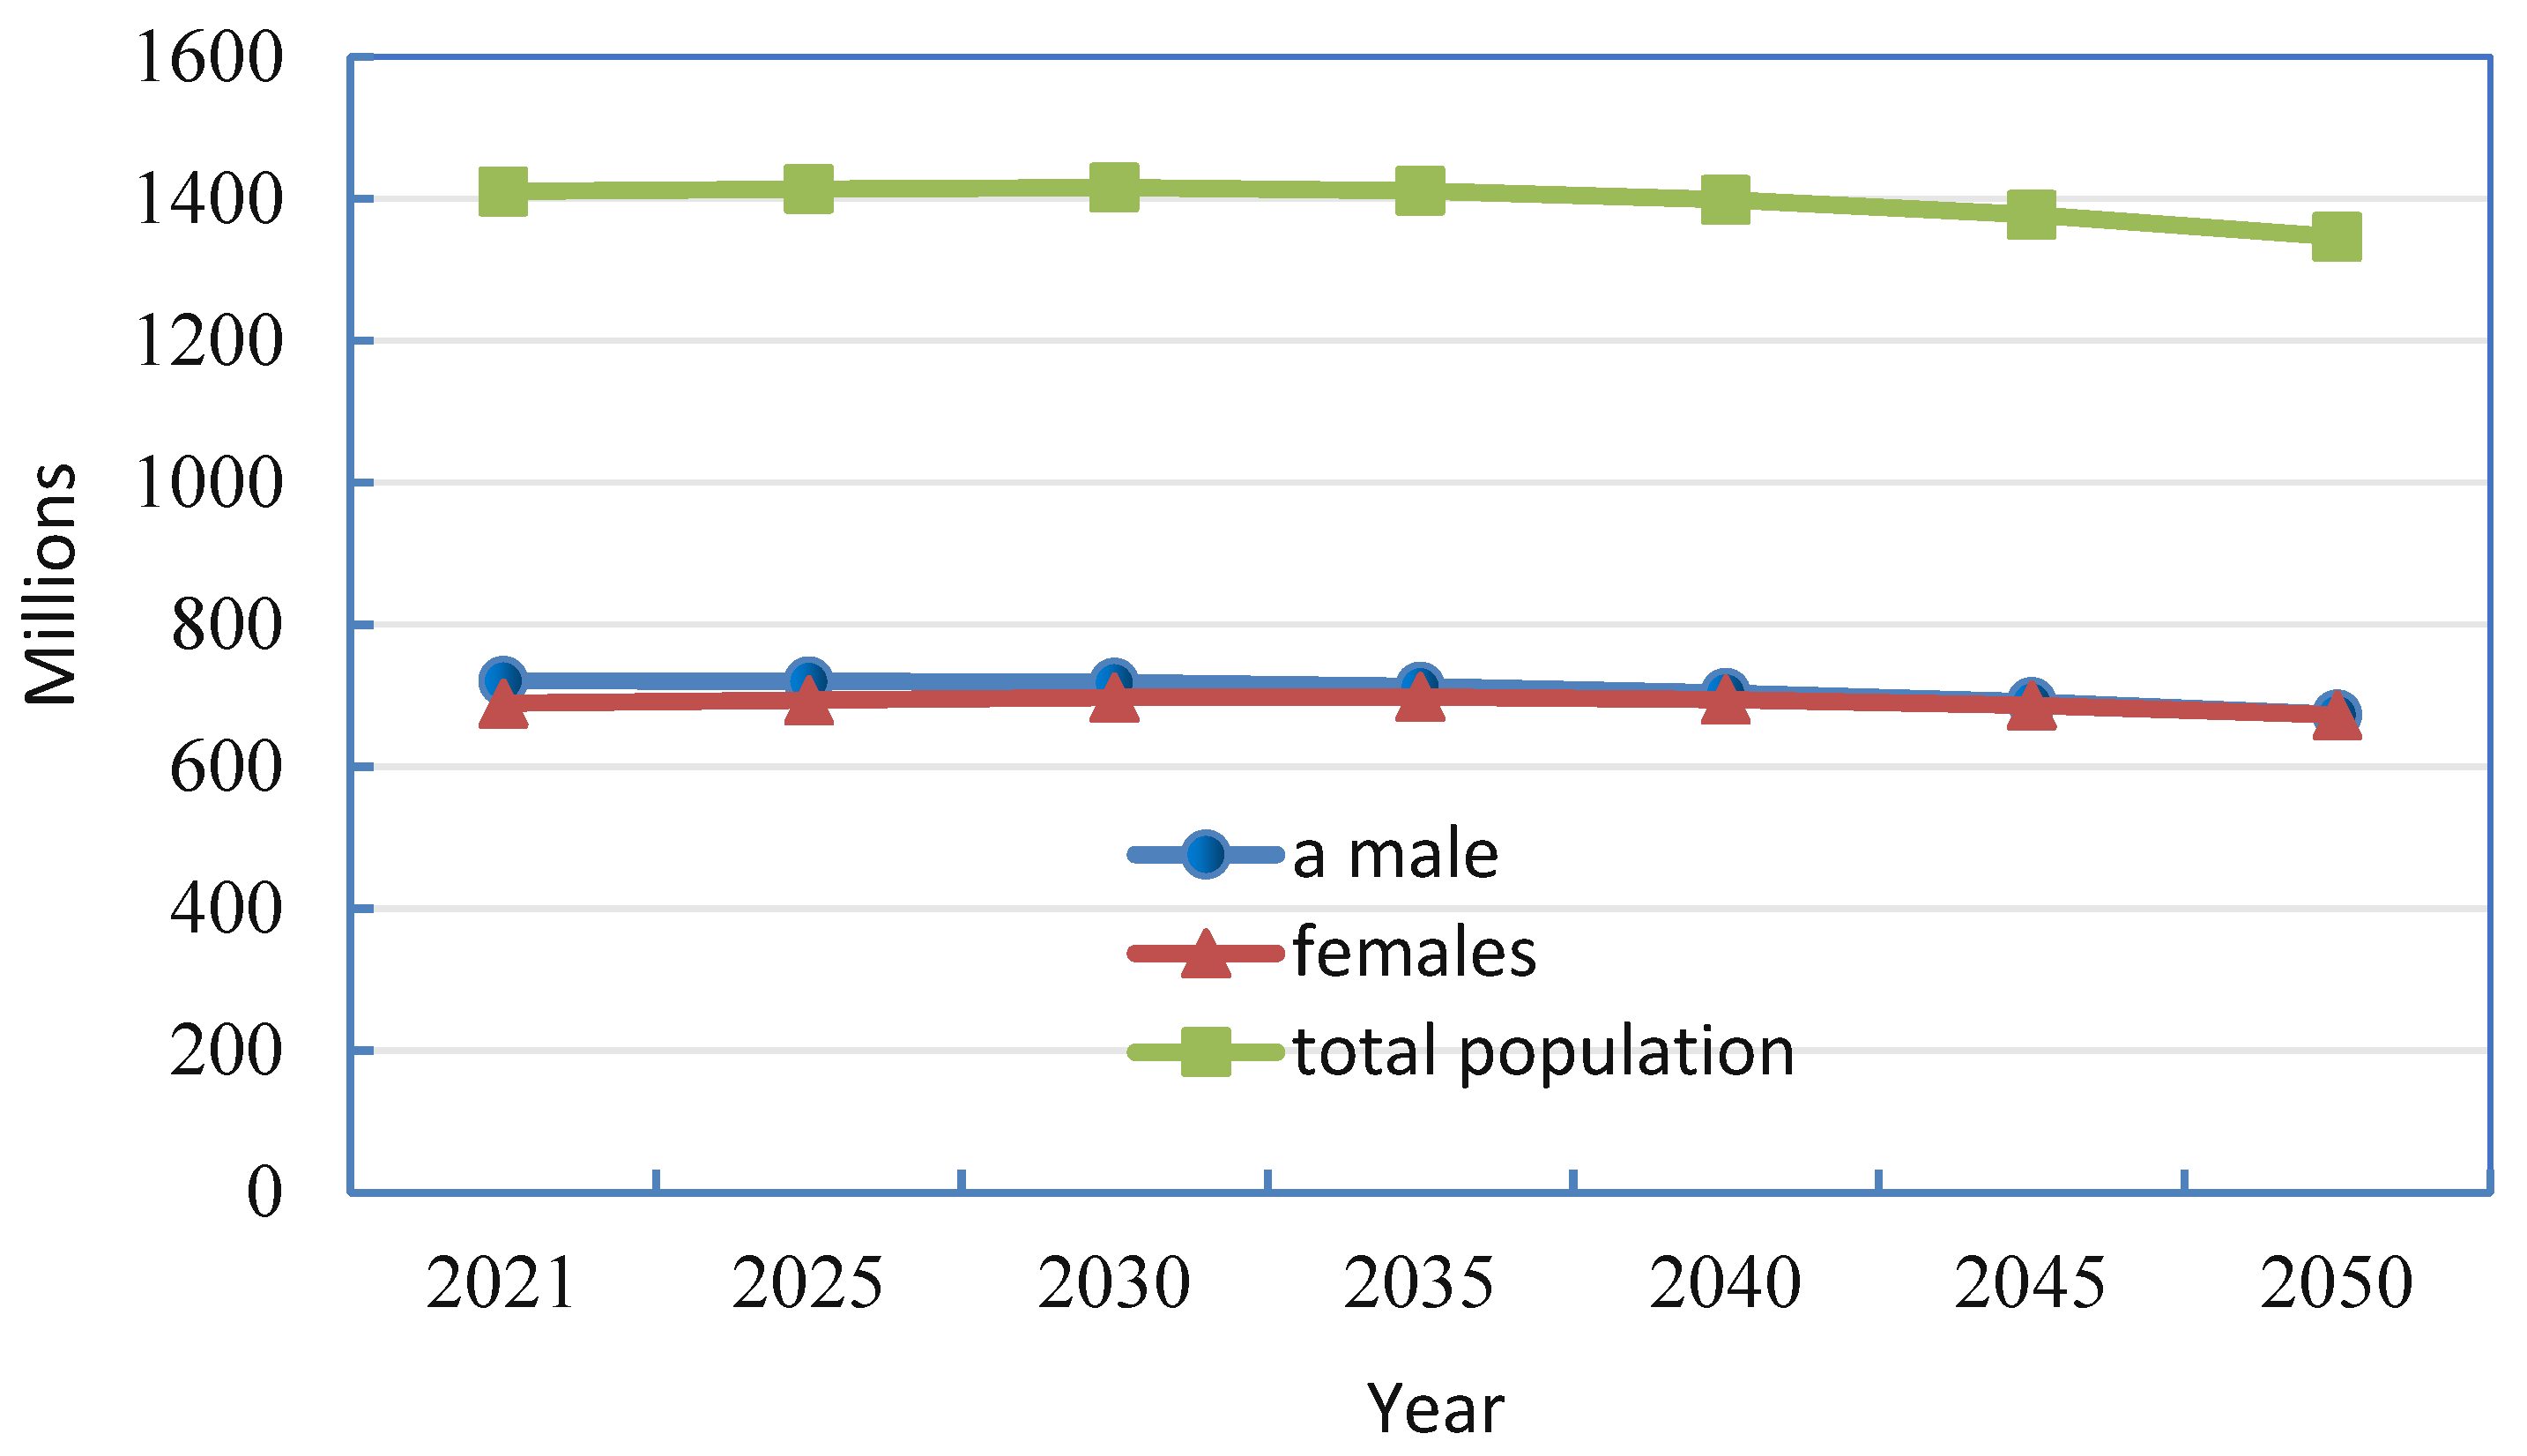
Figure 1. Annual total population, population size by sex, China, 2021-2050.
Preprints 102535 g001
Figure 2. Government's financial subsidies, urban workers' basic pension income and the share of financial subsidies, 2010-2020.
Preprints 102535 g002
Table 1. Income and Expenditures of the Basic Pension Fund for Urban Employees (hundred million yuan).
particular year Levy income financial subsidy Pension income Pension expenditure Current income and expenditure Cumulative balance
2021 67684.52 11100.86 78785.38 74483.33 4302.05 52619.05
2022 73098.53 11988.81 85087.34 83155.23 1932.11 54551.16
2023 78447.86 12866.14 91314.00 93721.76 -2407.76 52143.40
2024 84202.00 13809.87 98011.88 105533.92 -7522.04 44621.36
2025 90621.32 14862.70 105484.02 118289.79 -12805.78 31815.58
2026 96839.13 15882.47 112721.61 132239.11 -19517.50 12298.08
2027 103745.24 17015.14 120760.38 146024.54 -25264.16 -12966.07
2028 111212.13 18239.77 129451.90 161089.26 -31637.36 -44603.43
2029 119111.65 19535.36 138647.02 177893.78 -39246.76 -83850.19
2030 127624.15 20931.49 148555.64 196054.06 -47498.43 -131348.62
2031 135851.90 22280.91 158132.81 215453.02 -57320.21 -188668.83
2032 144800.08 23748.49 168548.57 235219.12 -66670.55 -255339.38
2033 154370.53 25318.13 179688.66 256459.68 -76771.02 -332110.40
2034 164712.63 27014.33 191726.96 278772.70 -87045.74 -419156.14
2035 175751.27 28824.76 204576.03 302271.35 -97695.32 -516851.46
2036 185797.92 30472.50 216270.42 327498.29 -111227.87 -628079.33
2037 196411.85 32213.28 228625.13 352134.37 -123509.23 -751588.57
2038 207211.53 33984.52 241196.06 378244.60 -137048.55 -888637.11
2039 217812.47 35723.17 253535.64 406079.49 -152543.85 -1041180.96
2040 228244.31 37434.09 265678.39 435721.20 -170042.80 -1211223.77
2041 236411.52 38773.58 275185.10 466587.41 -191402.31 -1402626.08
2042 244924.54 40169.79 285094.33 493779.98 -208685.66 -1611311.74
2043 253917.11 41644.65 295561.76 521579.91 -226018.14 -1837329.88
2044 263550.18 43224.56 306774.74 549671.96 -242897.23 -2080227.11
2045 273554.41 44865.34 318419.75 578712.82 -260293.07 -2340520.17
2046 281322.76 46139.42 327462.18 609126.28 -281664.10 -2622184.27
2047 288729.71 47354.23 336083.93 636392.76 -300308.82 -2922493.09
2048 296219.03 48582.54 344801.57 664598.74 -319797.17 -3242290.27
2049 304112.74 49877.18 353989.92 693085.36 -339095.45 -3581385.72
2050 310013.49 50844.96 360858.45 718122.17 -357263.72 -3938649.43
Table 2. Comparison of pension income before and after the implementation of delayed retirement policy (hundred million yuan).
particular year Pre-delayed retirement Post-delayed retirement particular year Pre-delayed retirement Post-delayed retirement
2021 78785.38 78785.38 2036 216270.42 233077.76
2022 85087.34 85087.34 2037 228625.13 248565.41
2023 91314.00 91947.71 2038 241196.06 264813.88
2024 98011.88 99361.95 2039 253535.64 281134.45
2025 105484.02 107573.56 2040 265678.39 297670.74
2026 112721.61 115591.01 2041 275185.10 311394.51
2027 120760.38 124421.06 2042 285094.33 325057.23
2028 129451.90 134045.13 2043 295561.76 341254.67
2029 138647.02 143641.04 2044 306774.74 358864.32
2030 148555.64 155516.11 2045 318419.75 377325.02
2031 158132.81 166427.67 2046 327462.18 393160.74
2032 168548.57 176885.12 2047 336083.93 409524.73
2033 179688.66 189939.73 2048 344801.57 426536.11
2034 191726.96 203934.83 2049 353989.92 444281.19
2035 204576.03 218958.40 2050 360858.45 458944.02
Table 3. Comparison of pension expenditures before and after the implementation of delayed retirement policy (hundred million yuan).
particular year Pre-delayed retirement Post-delayed retirement particular year Pre-delayed retirement Post-delayed retirement
2021 74483.33 74483.33 2036 327498.29 290452.05
2022 83155.23 83155.23 2037 352134.37 308182.60
2023 93721.76 92356.04 2038 378244.60 326186.90
2024 105533.92 102624.31 2039 406079.49 345247.01
2025 118289.79 113786.54 2040 435721.20 365204.60
2026 132239.11 126003.12 2041 466587.41 385934.77
2027 146024.54 138068.88 2042 493779.98 404766.84
2028 161089.26 151106.93 2043 521579.91 419803.78
2029 177893.78 165474.95 2044 549671.96 433647.91
2030 196054.06 180927.06 2045 578712.82 447507.53
2031 215453.02 197324.39 2046 609126.28 461517.18
2032 235219.12 216999.38 2047 636392.76 471388.68
2033 256459.68 234055.70 2048 664598.74 480960.57
2034 278772.70 252092.08 2049 693085.36 490222.27
2035 302271.35 270838.30 2050 718122.17 497747.10
Table 4. Income and Expenditure of the Basic Pension Insurance Fund for Urban Workers before and after the Delay in Retirement (hundred million yuan).
particular year Pre-delayed retirement Post-delayed retirement
Difference between current income and expenditure Cumulative balance Current income and expenditure Cumulative balance
2021 4302.05 52619.05 4302.05 52619.05
2022 1932.11 54551.16 1932.11 54551.16
2023 -2407.76 52143.40 -408.33 54142.83
2024 -7522.04 44621.36 -3262.36 50880.47
2025 -12805.78 31815.58 -6212.98 44667.49
2026 -19517.50 12298.08 -10412.11 34255.38
2027 -25264.16 -12966.07 -13647.81 20607.57
2028 -31637.36 -44603.43 -17,061.80 3545.77
2029 -39246.76 -83850.19 -21833.91 -18288.15
2030 -47498.43 -131348.62 -25410.94 -43699.09
2031 -57320.21 -188668.83 -30896.72 -74595.81
2032 -66670.55 -255339.38 -40114.25 -114710.07
2033 -76771.02 -332110.40 -44115.97 -158826.04
2034 -87045.74 -419156.14 -48157.26 -206983.29
2035 -97695.32 -516851.46 -51879.89 -258863.19
2036 -111227.87 -628079.33 -57374.29 -316237.48
2037 -123509.23 -751588.57 -59617.18 -375854.66
2038 -137048.55 -888637.11 -61373.02 -437227.68
2039 -152543.85 -1041180.96 -64112.56 -501340.24
2040 -170042.80 -1211223.77 -67533.86 -568874.09
2041 -191402.31 -1402626.08 -74540.26 -643414.35
2042 -208685.66 -1611311.74 -79709.61 -723123.96
2043 -226018.14 -1837329.88 -78549.11 -801673.07
2044 -242897.23 -2080227.11 -74783.59 -876456.65
2045 -260293.07 -2340520.17 -70182.51 -946639.16
2046 -281664.10 -2622184.27 -68356.44 -1014995.61
2047 -300308.82 -2922493.09 -61863.95 -1076859.56
2048 -319797.17 -3242290.27 -54424.45 -1131284.01
2049 -339095.45 -3581385.72 -45941.08 -1177225.09
2050 -357263.72 -3938649.43 -38803.08 -1216028.17
Disclaimer/Publisher’s Note: The statements, opinions and data contained in all publications are solely those of the individual author(s) and contributor(s) and not of MDPI and/or the editor(s). MDPI and/or the editor(s) disclaim responsibility for any injury to people or property resulting from any ideas, methods, instructions or products referred to in the content.
Copyright: This open access article is published under a Creative Commons CC BY 4.0 license, which permit the free download, distribution, and reuse, provided that the author and preprint are cited in any reuse.
Prerpints.org logo

Preprints.org is a free preprint server supported by MDPI in Basel, Switzerland.

Subscribe

© 2024 MDPI (Basel, Switzerland) unless otherwise stated