Submitted:
28 March 2024
Posted:
29 March 2024
You are already at the latest version
Abstract
Keywords:
1. Introduction
2. Results and Discussion
2.1. Antimicrobial Susceptibility Testing
2.1.1. Agar Well Diffusion Assay
| Selected herbal plant extracts with different concentrations | Inhibition zones diameter against tested organisms(mm) | |||
| S. aureus | P. aueroginosa | Salmonella spp. | E-coli | |
| 1.Katupila (Flueggea leucopyrus) | ||||
| 400 mg/dl | 0.6 | 0.6 | 2.0 | |
| 200 mg/dl | 1.0 | 0.6 | - | 0.6 |
| 100 mg/dl | 1.0 | - | 2.0 | |
| 50 mg/dl | 1.0 | 0.6 | - | |
| 25 mg/dl | 0.6 | - | - | 1.5 |
| 12.5 mg/dl | 0.0 | - | - | 0.6 |
| Positive control | 0.6 | 0.6 | 2.1 | 0.6 |
| Negative control | - | - | - | - |
| 2.Kapparawalliya (Plectranthus amboinicus) | ||||
| 400 mg/dl | 0.6 | 0.6 | 1.2 | 4.2 |
| 200 mg/dl | 2.5 | 0.6 | - | - |
| 100 mg/dl | 4.4 | - | - | - |
| 50 mg/dl | - | - | - | - |
| 25 mg/dl | - | - | - | - |
| 12.5 mg/dl | - | - | - | - |
| Positive control | 0.6 | 0.6 | 0.6 | |
| Negative control | - | - | - | - |
| 3.Lunuwila (Bacopa monnieri) | ||||
| 400 mg/dl | 0.6 | 0.6 | 0.6 | |
| 200 mg/dl | 1.0 | 0.6 | 1.2 | 0.6 |
| 100 mg/dl | 0.6 | 0.6 | 1.0 | 0.0 |
| 50 mg/dl | 0.6 | - | - | |
| 25 mg/dl | 0.6 | - | - | - |
| 12.5 mg/dl | - | - | - | - |
| Positive control | 0.6 | 0.6 | 2.1 | 0.6 |
| Negative control | - | - | - | - |
| 4.Sera (Cymbopogan citratus) | ||||
| 400 mg/dl | 1.0 | 0.6 | 0.6 | 2.0 |
| 200 mg/dl | 0.6 | 0.6 | - | 0.6 |
| 100 mg/dl | 1.0 | 0.0 | - | 2.0 |
| 50 mg/dl | - | - | - | 1.0 |
| 25 mg/dl | - | - | - | 1.5 |
| 12.5 mg/dl | - | - | - | 0.6 |
| Positive control | 0.6 | 2.1 | 2.1 | 0.6 |
| Negative control | - | - | - | - |

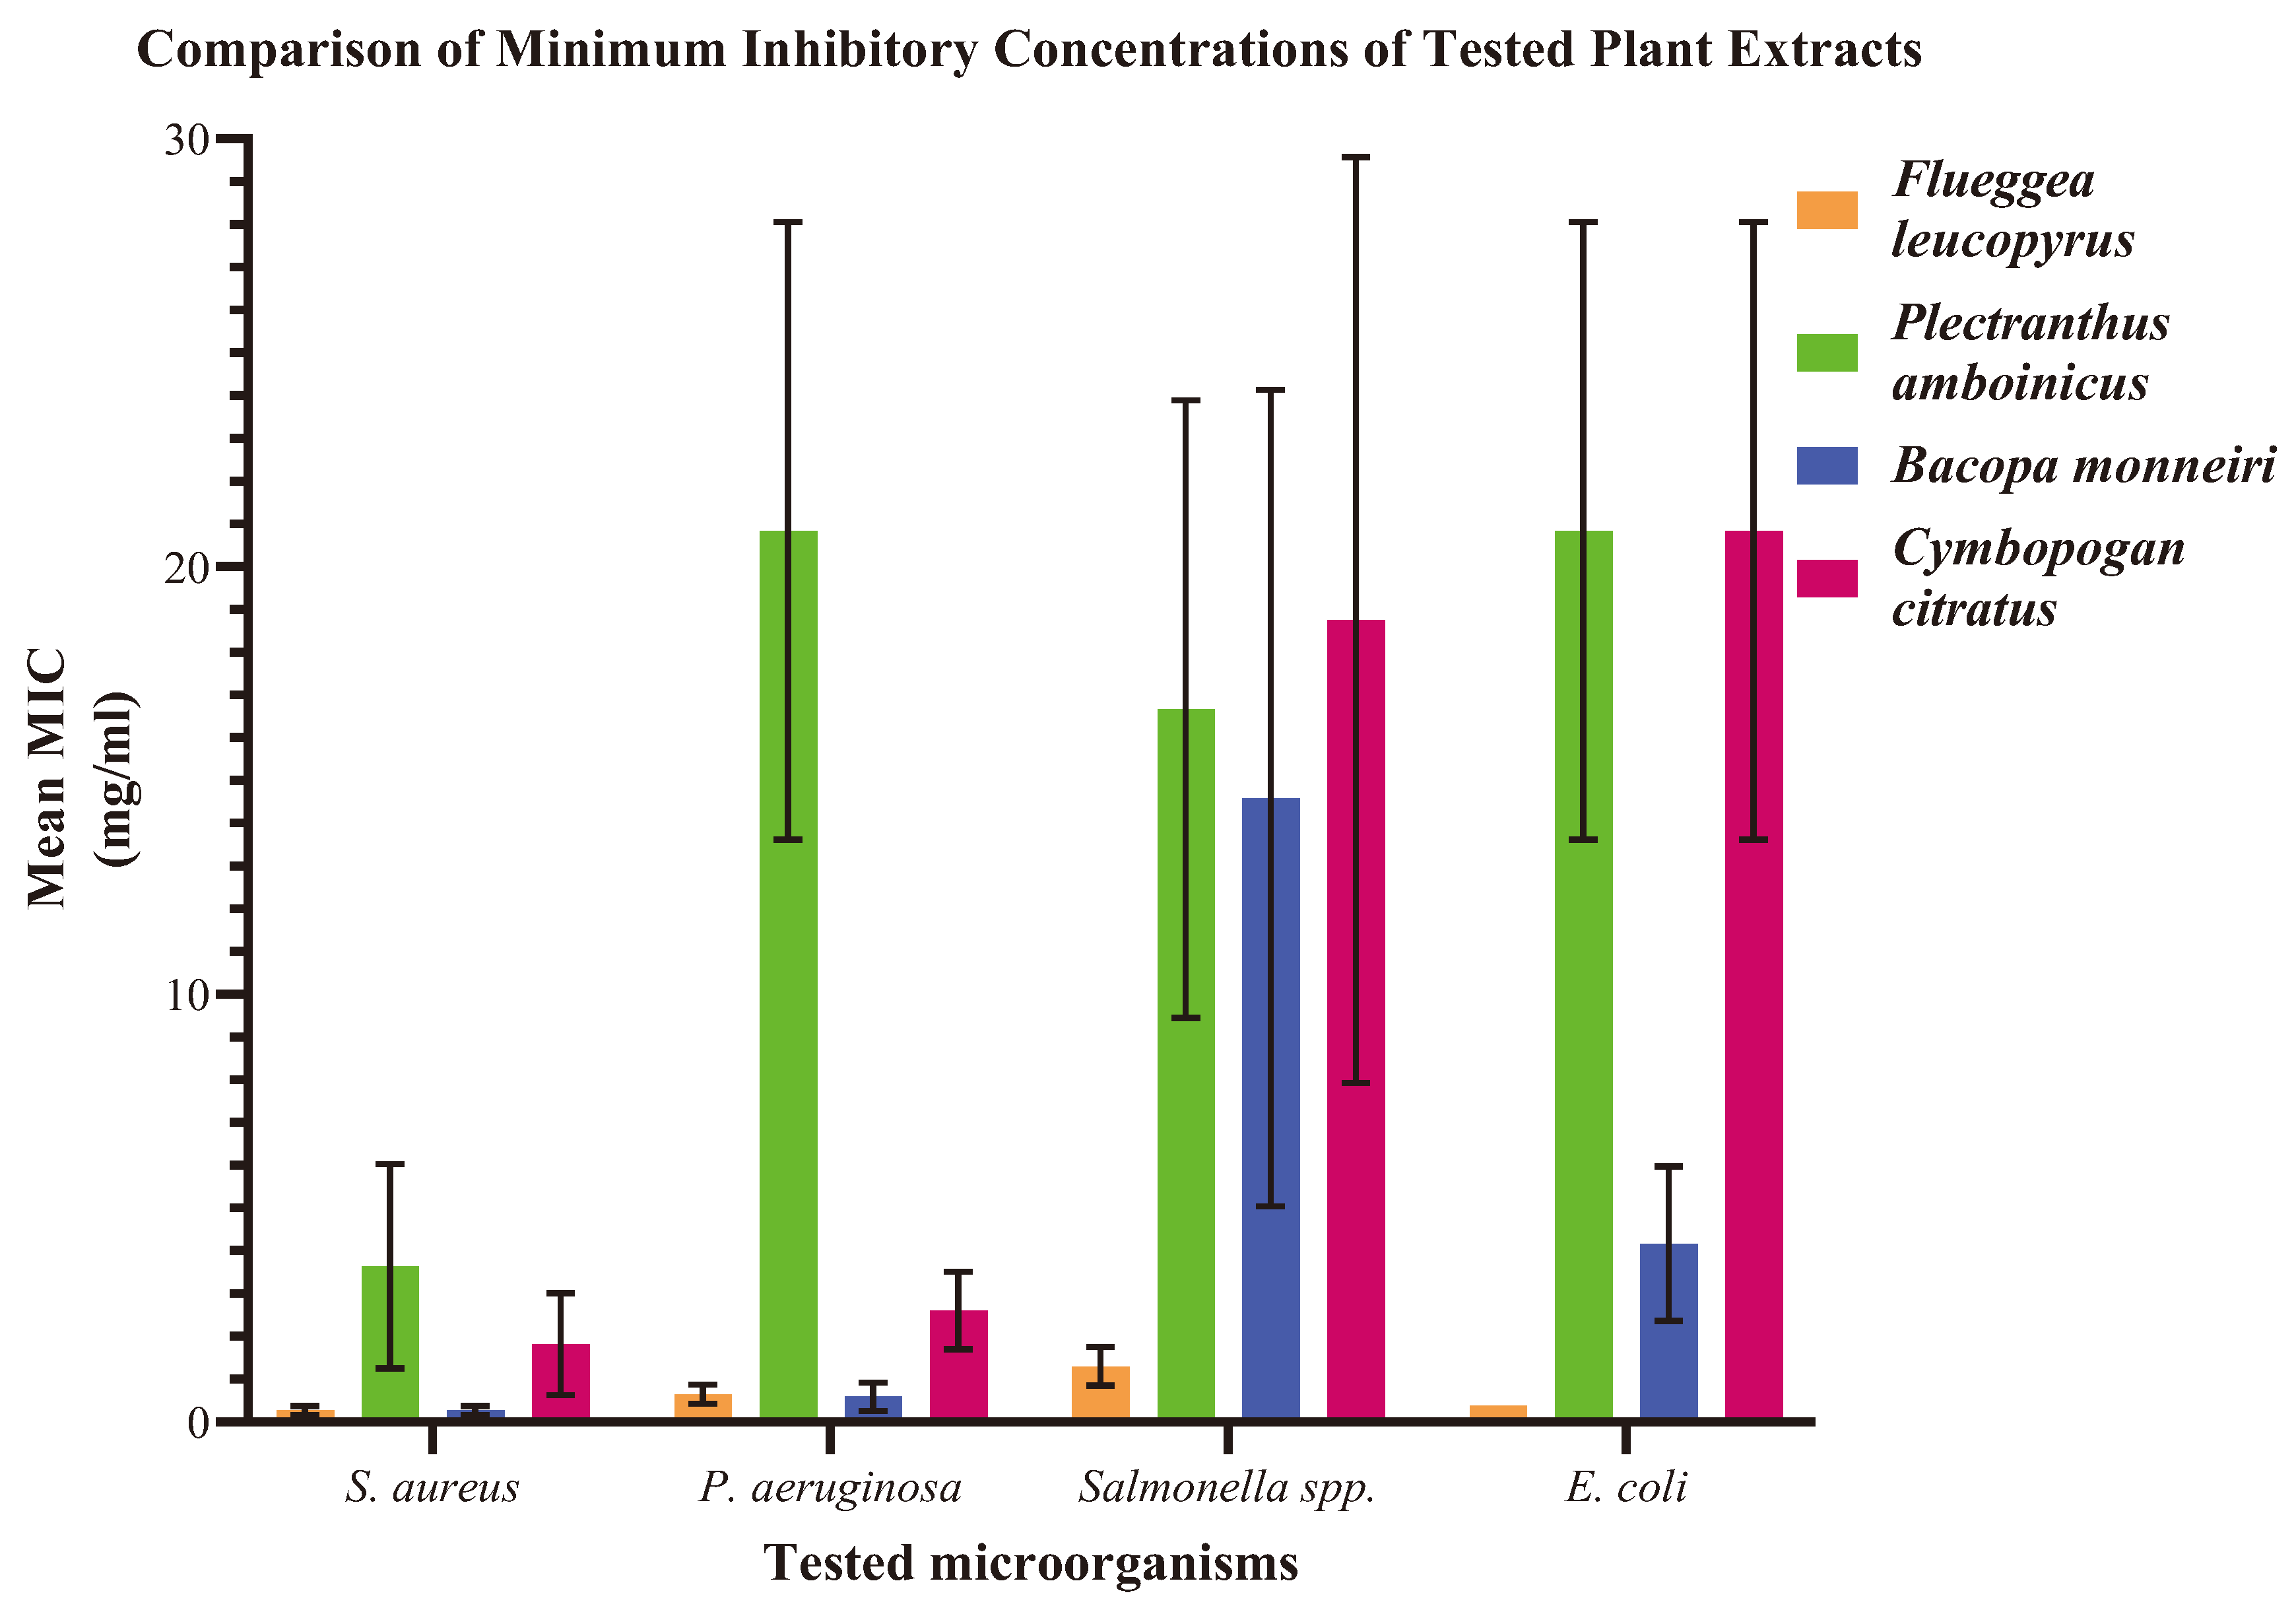
2.1.2. Minimum Inhibitory Concentration (MIC)
| Observation of the growth results of the microorganisms at different concentrations | ||||
| S. aureus | P. aeruginosa | E. coli | Salmonella spp. | |
| Katupila (Flueggea leucopyrus) | ||||
| Mean MIC (mg/ml) | 0.3 | 0.7 | 1.3 | 0.4 |
| SD | 0.1 | 0.2 | 0.5 | 0.0 |
| Kapparawalliya (Plectranthus amboinicus) | ||||
| Mean MIC (mg/ml) | 3.7 | 20.8 | 16.7 | 20.8 |
| SD | 2.4 | 7.2 | 10.2 | 7.2 |
| Lunuwila (Bacopa monnieri) | ||||
| Mean MIC (mg/ml) | 0.3 | 0.6 | 14.6 | 4.2 |
| SD | 0.1 | 0.3 | 9.5 | 1.8 |
| Sera (Cymbopogon citratus) | ||||
| Mean MIC (mg/ml) | 1.8 | 2.6 | 18.75 | 20.8 |
| SD | 1.2 | 0.9 | 10.8 | 7.2 |
2.1.3. Minimum Bactericidal Concentration (MBC)
| Observation of the growth results of the microorganisms at different concentrations | ||||
| S. aureus | P. aeruginosa | E. coli | Salmonella spp. | |
| Katupila (Flueggea leucopyrus) | ||||
| Mean MBC (mg/ml) | 16.7 | 66.7 | 400 | 20.8 |
| SD | 7.2 | 28.9 | 0.0 | 7.2 |
| Kapparawalliya (Plectranthus amboinicus) | ||||
| Mean MBC (mg/ml) | 200 | 266.7 | 400 | 400 |
| SD | 0.0 | 115.5 | 0.0 | 0.0 |
| Lunuwila (Bacopa monnieri) | ||||
| Mean MBC (mg/ml) | 41.7 | 116.7 | 83.3 | 83.3 |
| SD | 14.4 | 76.4 | 28.9 | 28.9 |
| Sera (Cymbopogon citratus) | ||||
| Mean MBC (mg/ml) | 83.3 | 133.3 | 400 | 266.7 |
| SD | 28.7 | 57.7 | 0.0 | 115.5 |
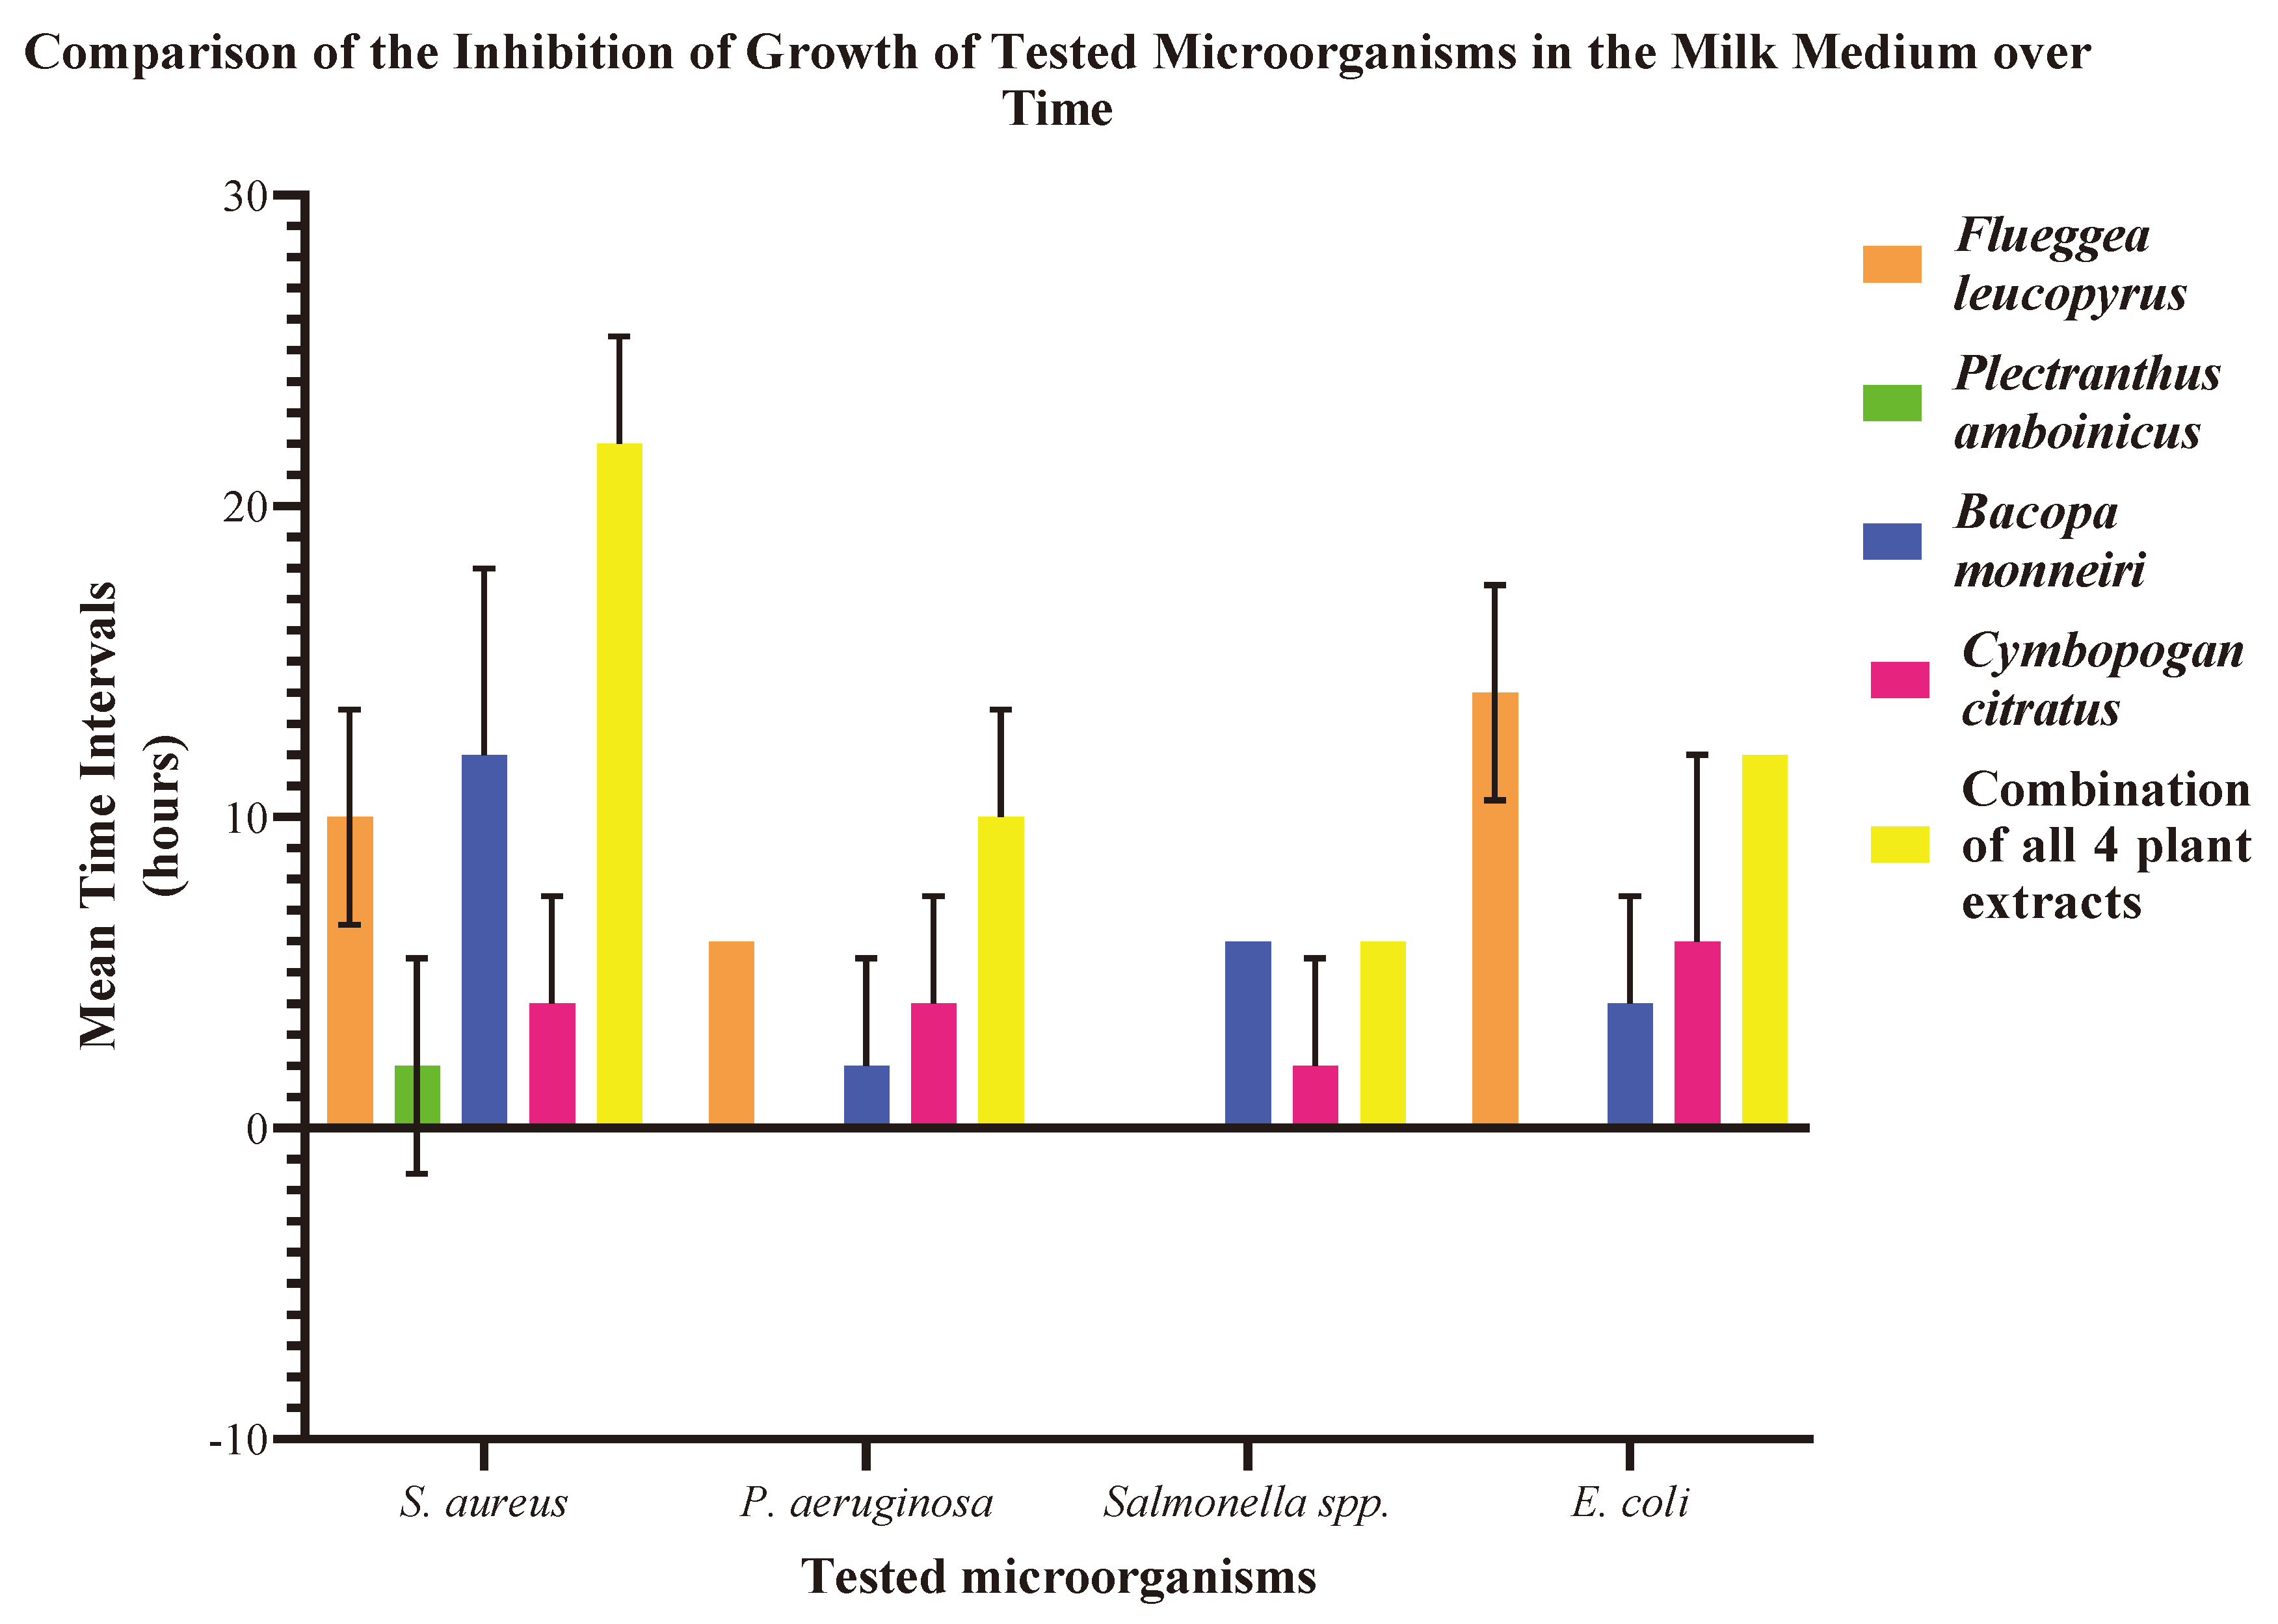
2.2. Preservative Activity in Sterilized Milk Medium
| Plant Extract | Mean time durations with standard deviation up to which the growth of microorganisms is inhibited (hours) | |||
| S. aureus | P. aeruginosa | Salmonella spp. | E. coli | |
| Flueggea leucopyrus | 10.0 ± 3.5 | 6.0 ± 0.0 | 0.0 ± 0.0 | 14 ± 3.5 |
| Plectranthus amboinicus | 2.0 ± 3.5 | 0.0 ± 0.0 | 0.0 ± 0.0 | 0.0 ± 0.0 |
| Bacopa monnieri | 12.0 ± 6.0 | 2.0 ± 3.5 | 6.0 ± 0.0 | 4.0 ± 3.5 |
| Cymbopogan citratus | 4.0 ± 3.5 | 4.0 ± 3.5 | 2 ± 3.5 | 6.0 ± 6.0 |
| Combination of all 4 plant extracts | 22 ± 3.5 | 10.0 ± 3.5 | 6.0 ± 0.0 | 12.0 ± 0.0 |
2.3. Assessment of Biocompatibility and Toxicity
2.3.1. Brine Shrimp Lethality Assay
- 1.
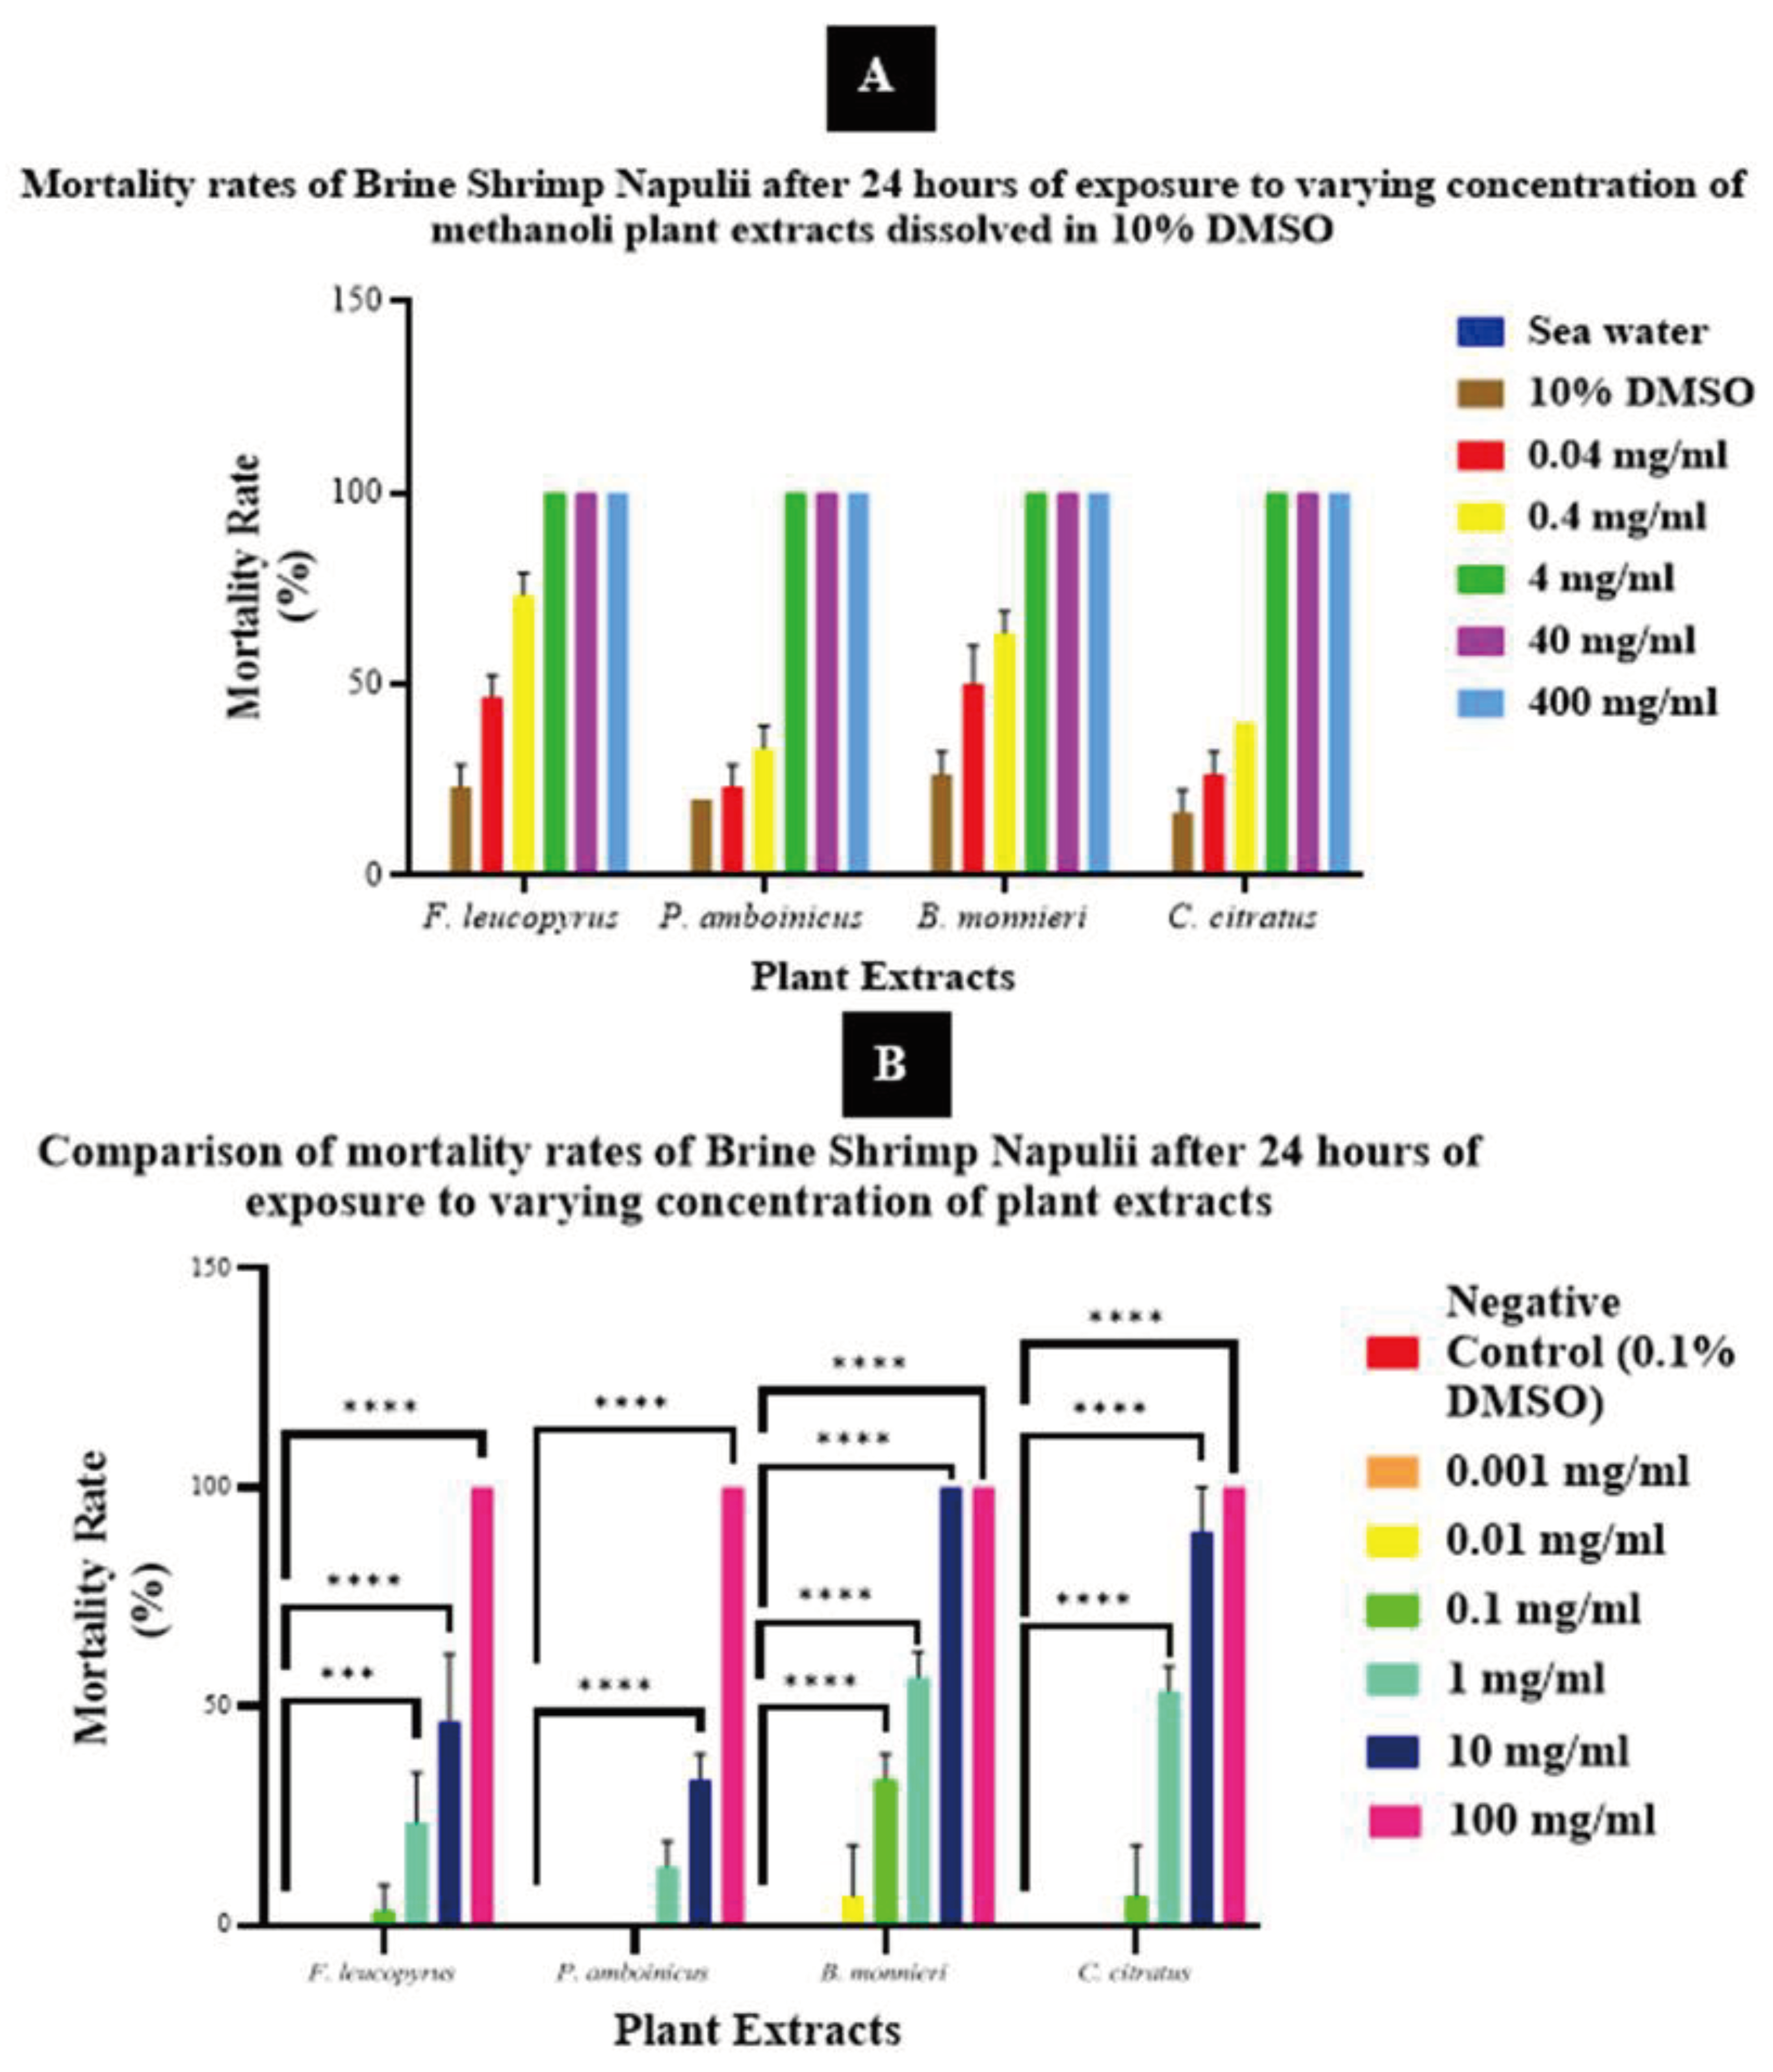
- Evaluation of the Toxicity of Methanolic Plant Extracts Dissolved in 10% DMSO
| Concentration(mg/ml) | Mortality rate of Brine Shrimp after 24 hours of plant treatment (Mean% ± SD) | |||
| Flueggea leucopyrus | Plectranthus amboinicus | Bacopa monnieri | Cymbopogan citratus | |
| 400 | 100 ± 0.0 | 100 ± 0.0 | 100 ± 0.0 | 100 ± 0.0 |
| 40 | 100 ± 0.0 | 100 ± 0.0 | 100 ± 0.0 | 100 ± 0.0 |
| 4 | 100 ± 0.0 | 100 ± 0.0 | 100 ± 0.0 | 100 ± 0.0 |
| 0.4 | 73.3 ± 5.8 | 33.3 ±5.8 | 63.3 ± 5.8 | 40.0 ± 0.0 |
| 0.04 | 46.7 ± 5.8 | 23.3 ± 5.8 | 50.0 ± 10 | 26.7 ± 5.8 |
| 10% DMSO | 23.3 ± 5.8 | 20.0 ± 0.0 | 26.7 ± 5.8 | 16.7 ± 5.8 |
| Sea water | 0.0 ± 0.0 | 0.0 ± 0.0 | 0.0 ± 0.0 | 0.0 ± 0.0 |
- 2.
- Evaluation of the Toxicity of Methanolic Plant Extracts Dissolved in 0.1% DMSO
| Concentration(mg/ml) | Mortality rate of Brine Shrimp after 24 hours of plant treatment (Mean% ± SD) | |||
| Flueggea leucopyrus | Plectranthus amboinicus | Bacopa monnieri | Cymbopogan citratus | |
| 100 | 100.0 ± 0.0 | 100.0 ± 0.0 | 100.0 ± 0.0 | 100.0 ± 0.0 |
| 10 | 46.7 ± 15.3 | 33.3 ± 5.8 | 100.0 ± 0.0 | 90.0 ± 10.0 |
| 1 | 23.3 ± 11.5 | 13.3 ± 5.8 | 56.7 ± 5.8 | 53.3 ± 5.8 |
| 0.1 | 3.3 ± 5.8 | 0.0 ± 0.0 | 33.3 ± 5.8 | 6.7 ± 11.5 |
| 0.01 | 0.0 ± 0.0 | 0.0 ± 0.0 | 6.7 ± 11.5 | 0.0 ± 0.0 |
| 0.001 | 0.0 ± 0.0 | 0.0 ± 0.0 | 0.0 ± 0.0 | 0.0 ± 0.0 |
| Negative Control (0.1% DMSO) | 0.0 ± 0.0 | 0.0 ± 0.0 | 0.0 ± 0.0 | 0.0 ± 0.0 |
| Plant Extract | Mean LC50 (mg/ml) ± SD |
| Flueggea leucopyrus | 12.7 ± 9.1 |
| Plectranthus amboinicus | 26.9 ±15.6 |
| Bacopa monnieri | 0.8 ± 0.1 |
| Cymbopogan citratus | 0.9 ± 0.2 |
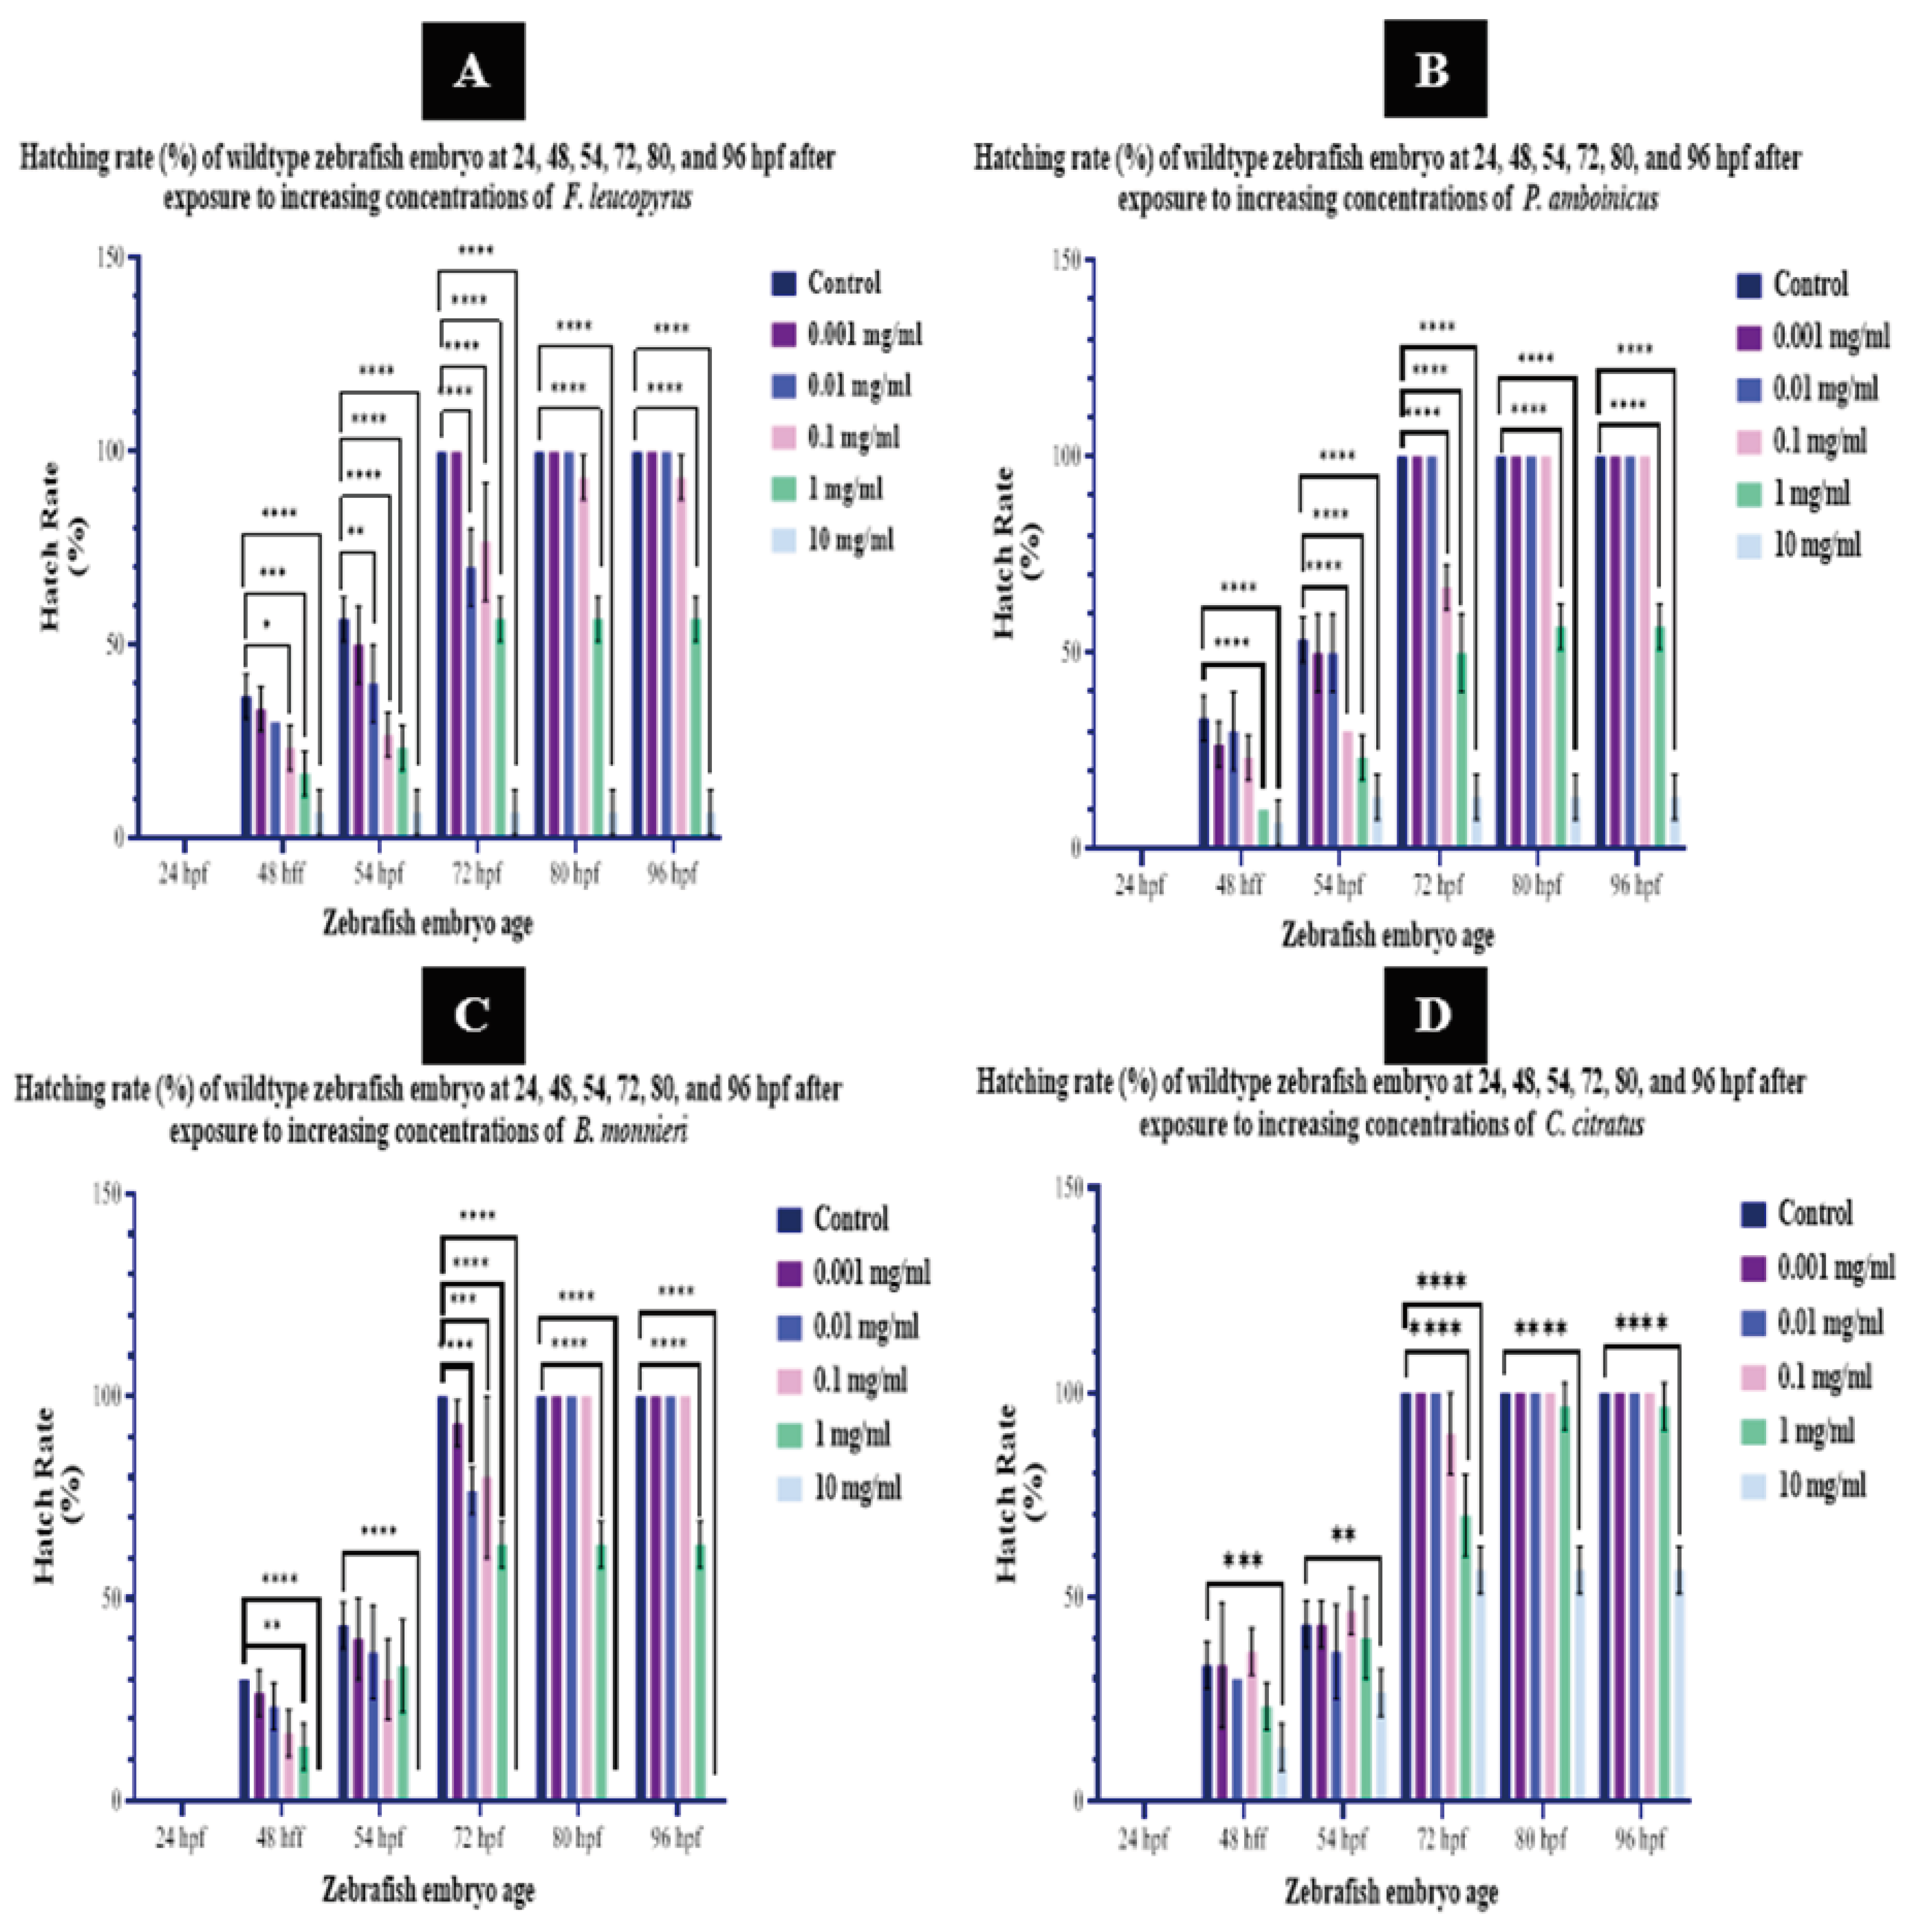
2.3.2. Zebrafish FET293 Bioassay
- Hatch Rate
- 2.
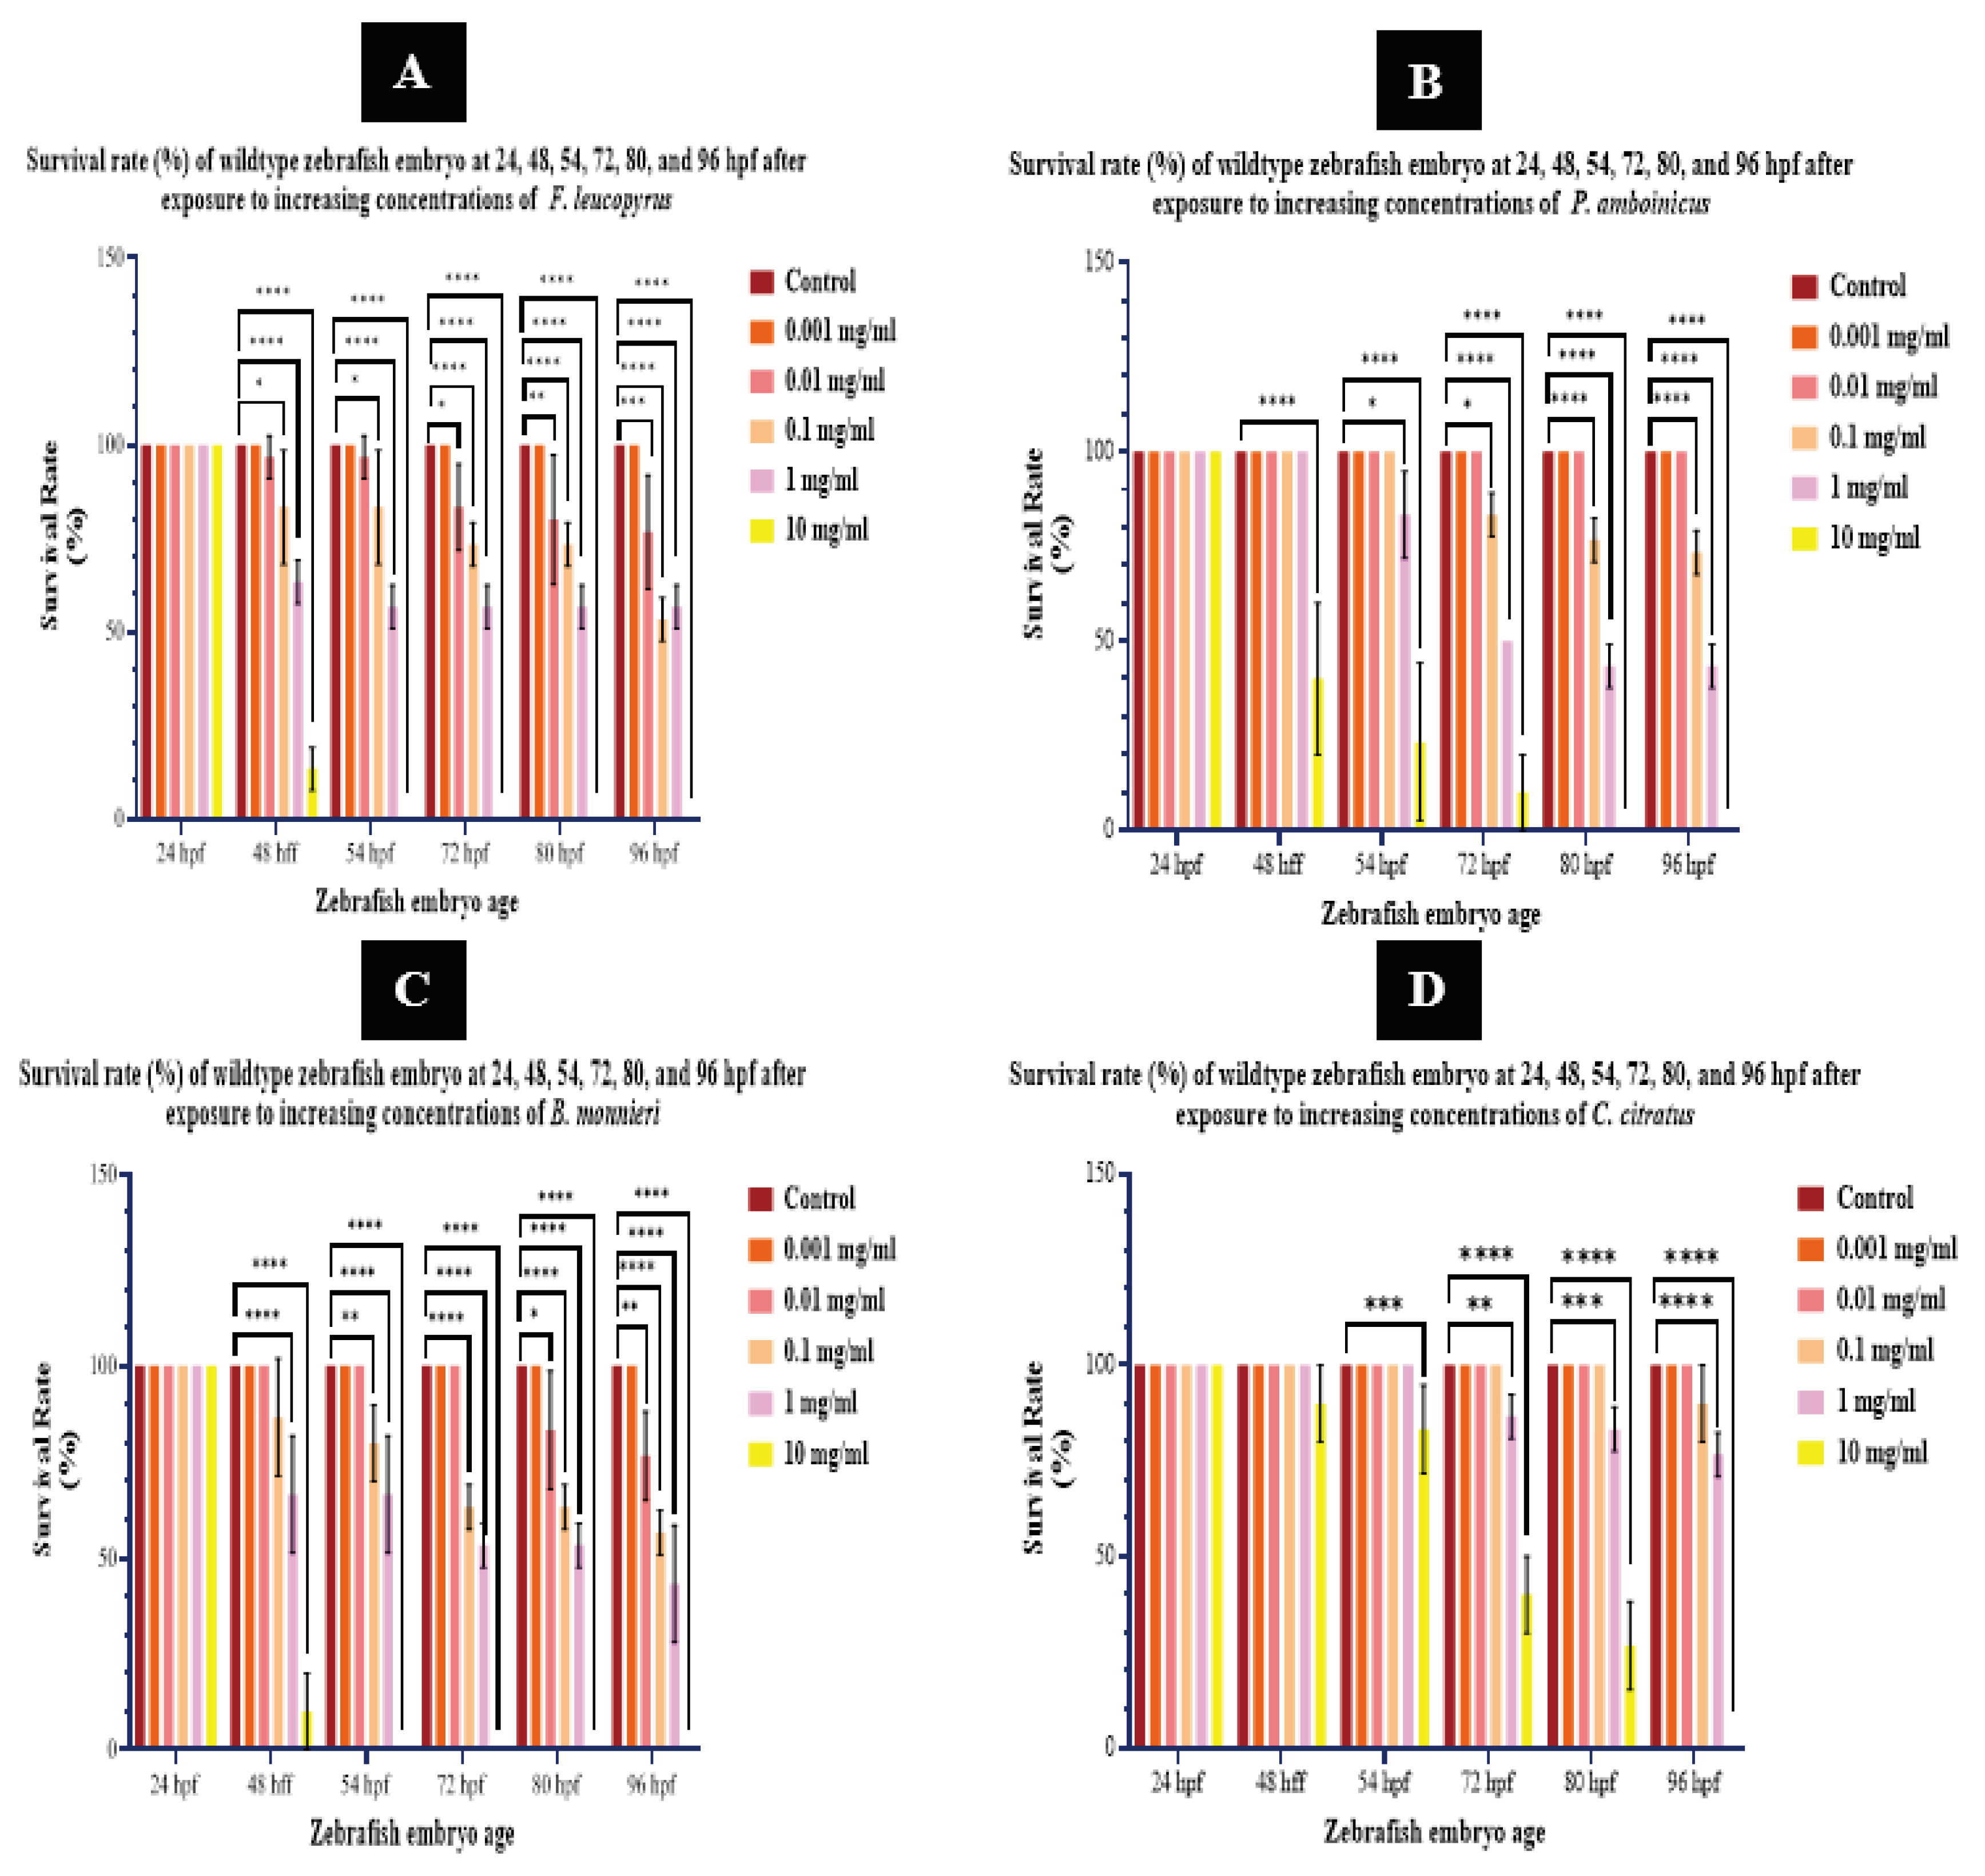
- Survival Rate
- 3.
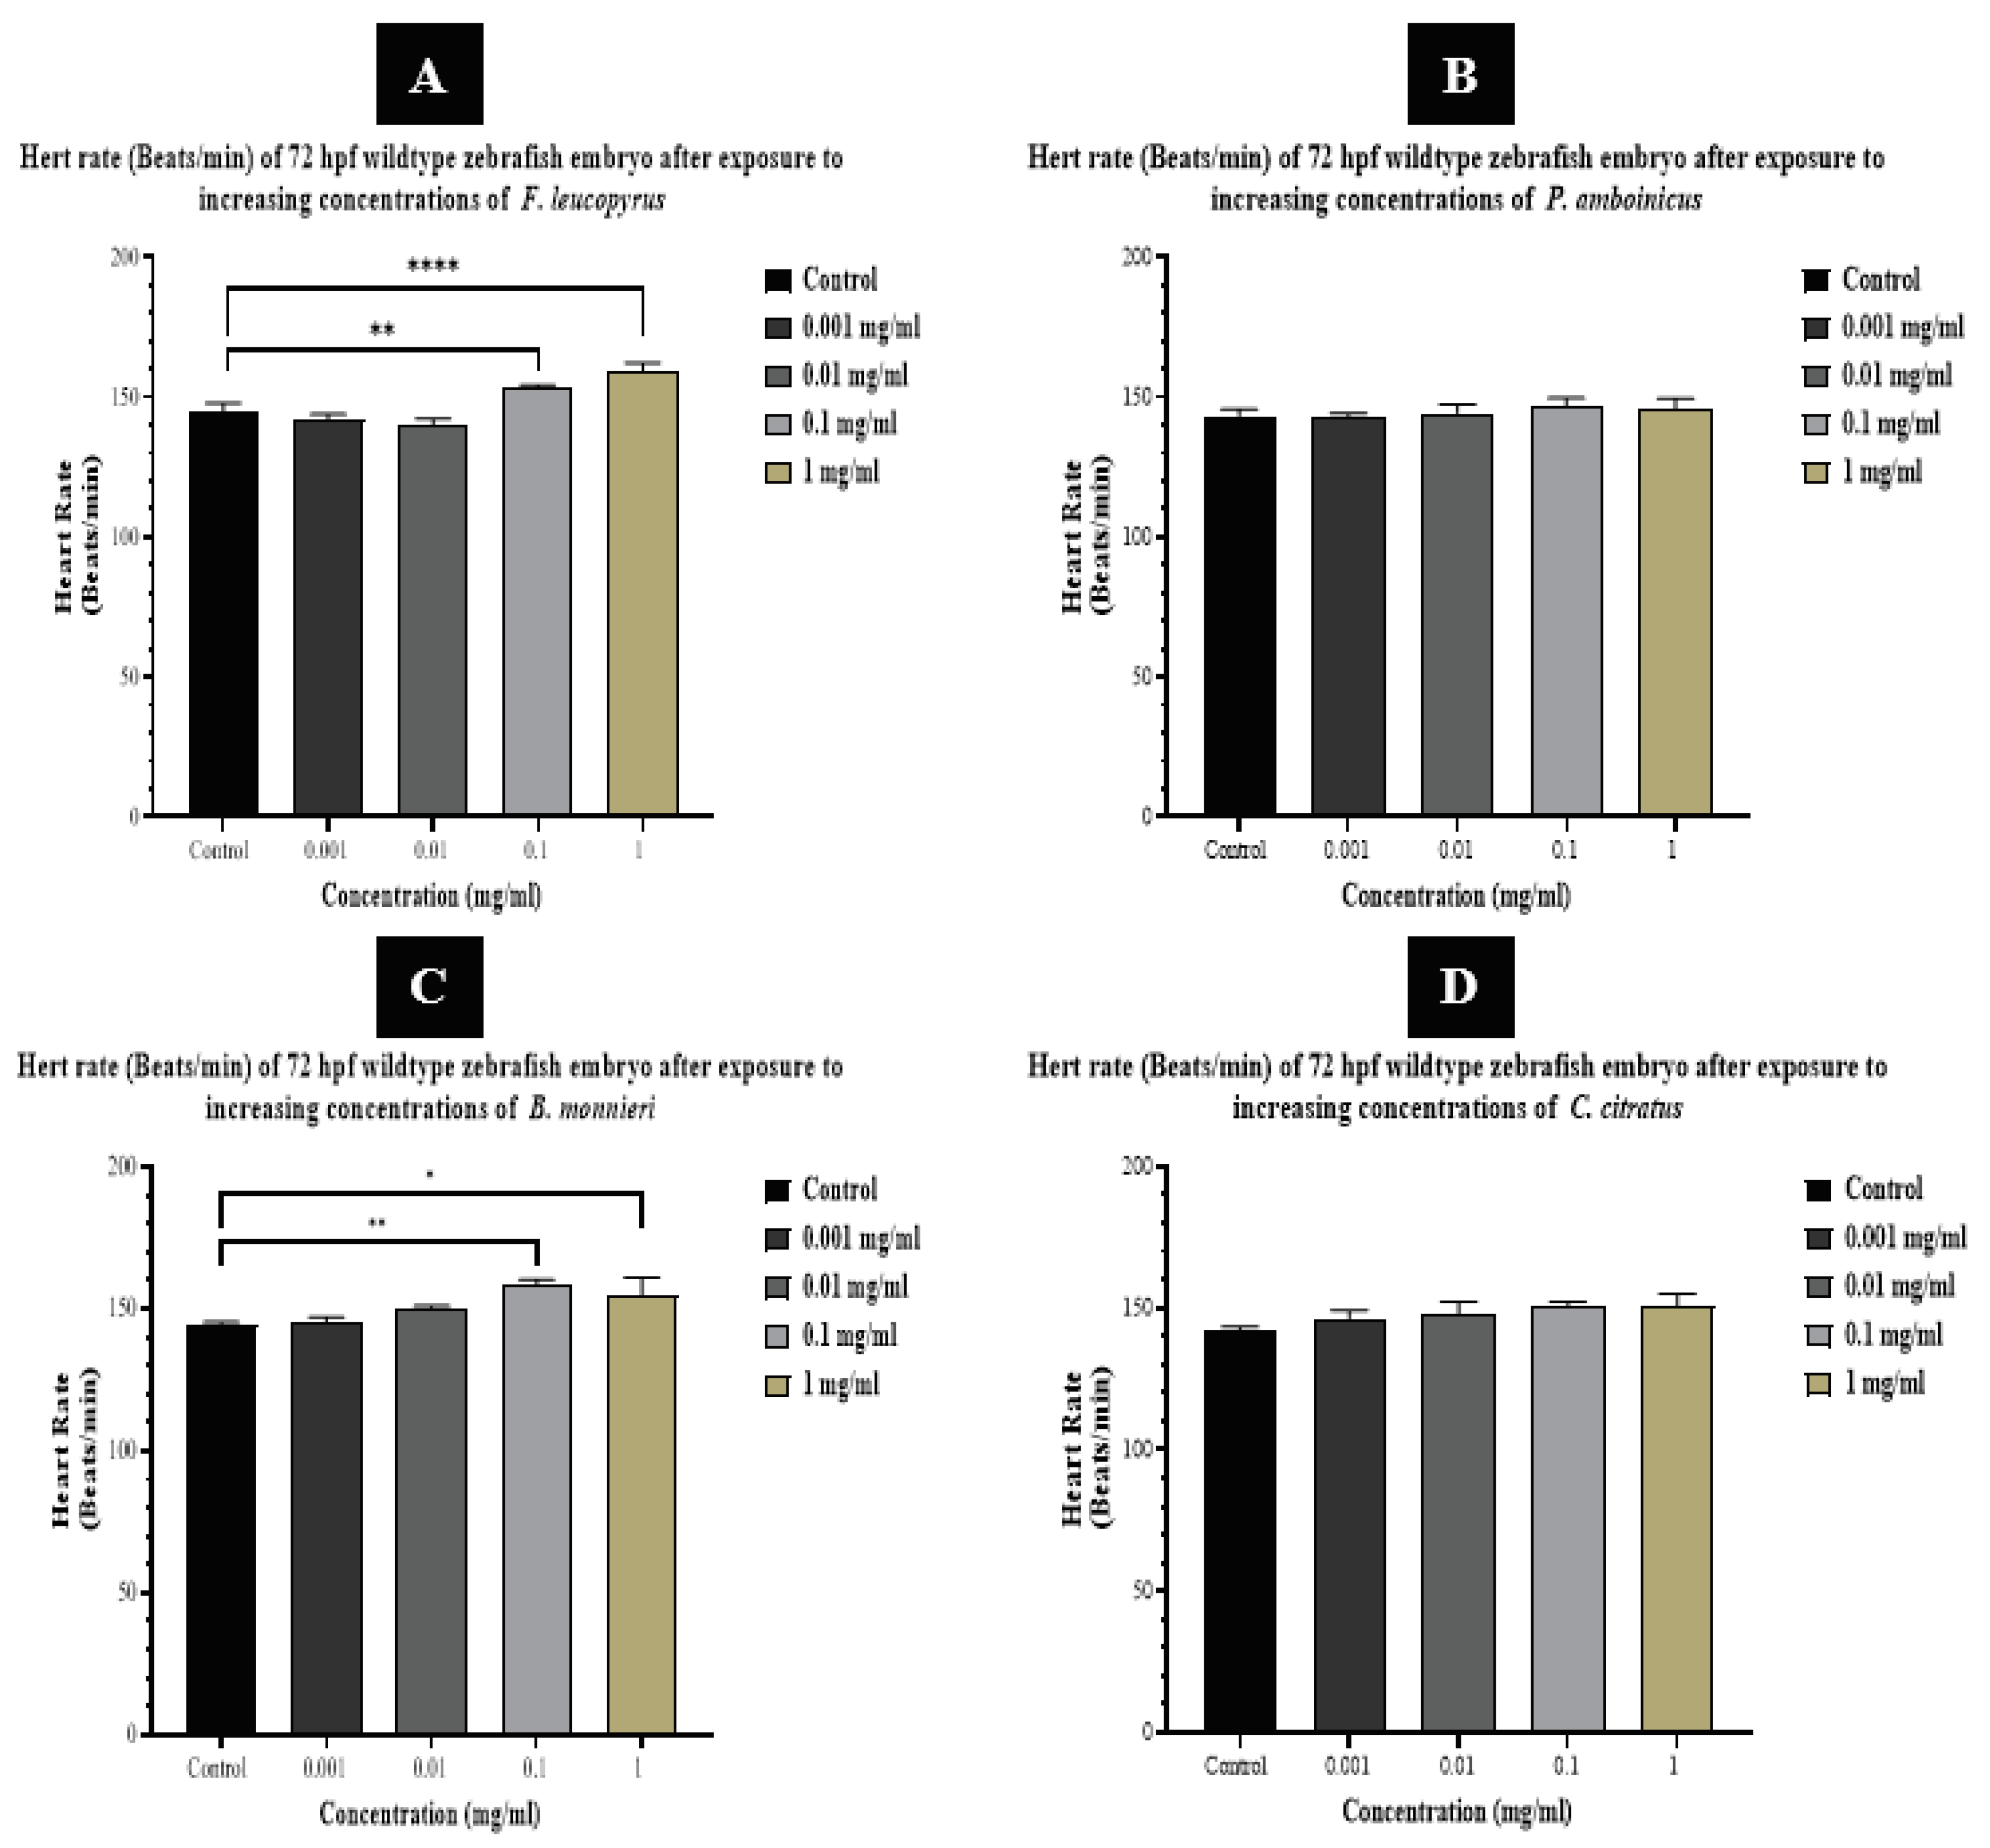
- Heart Rate
- 4.
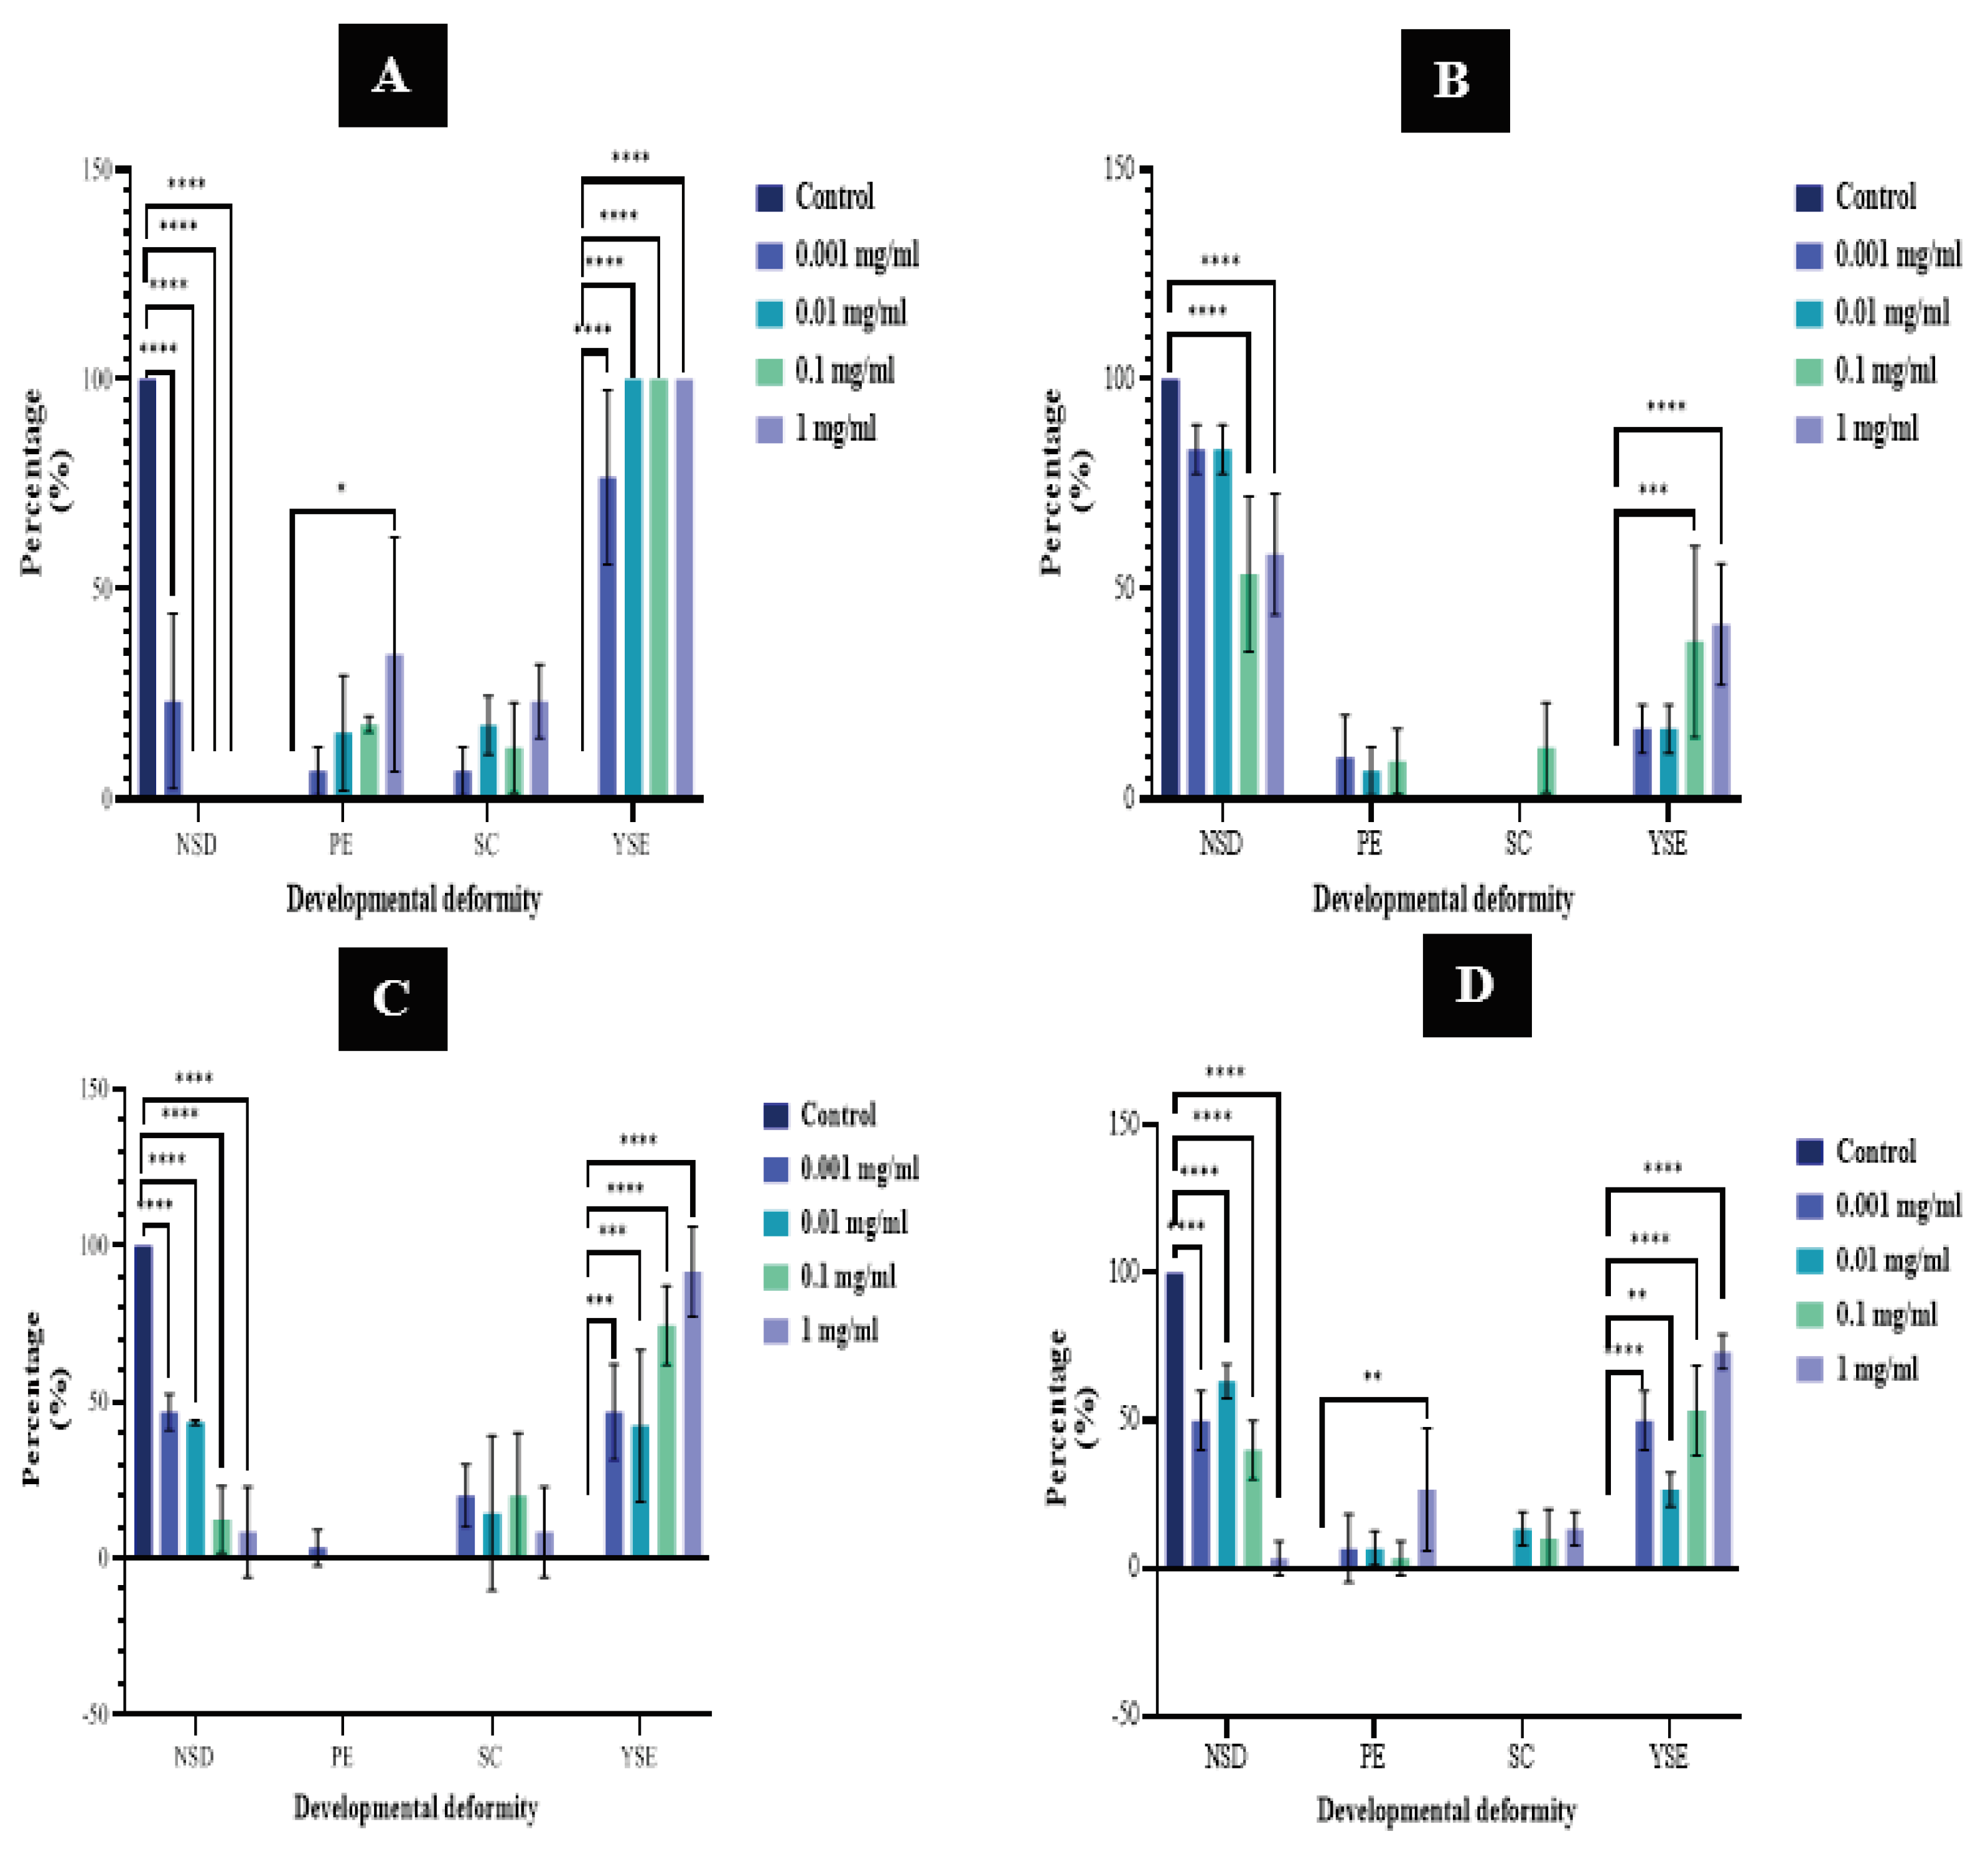
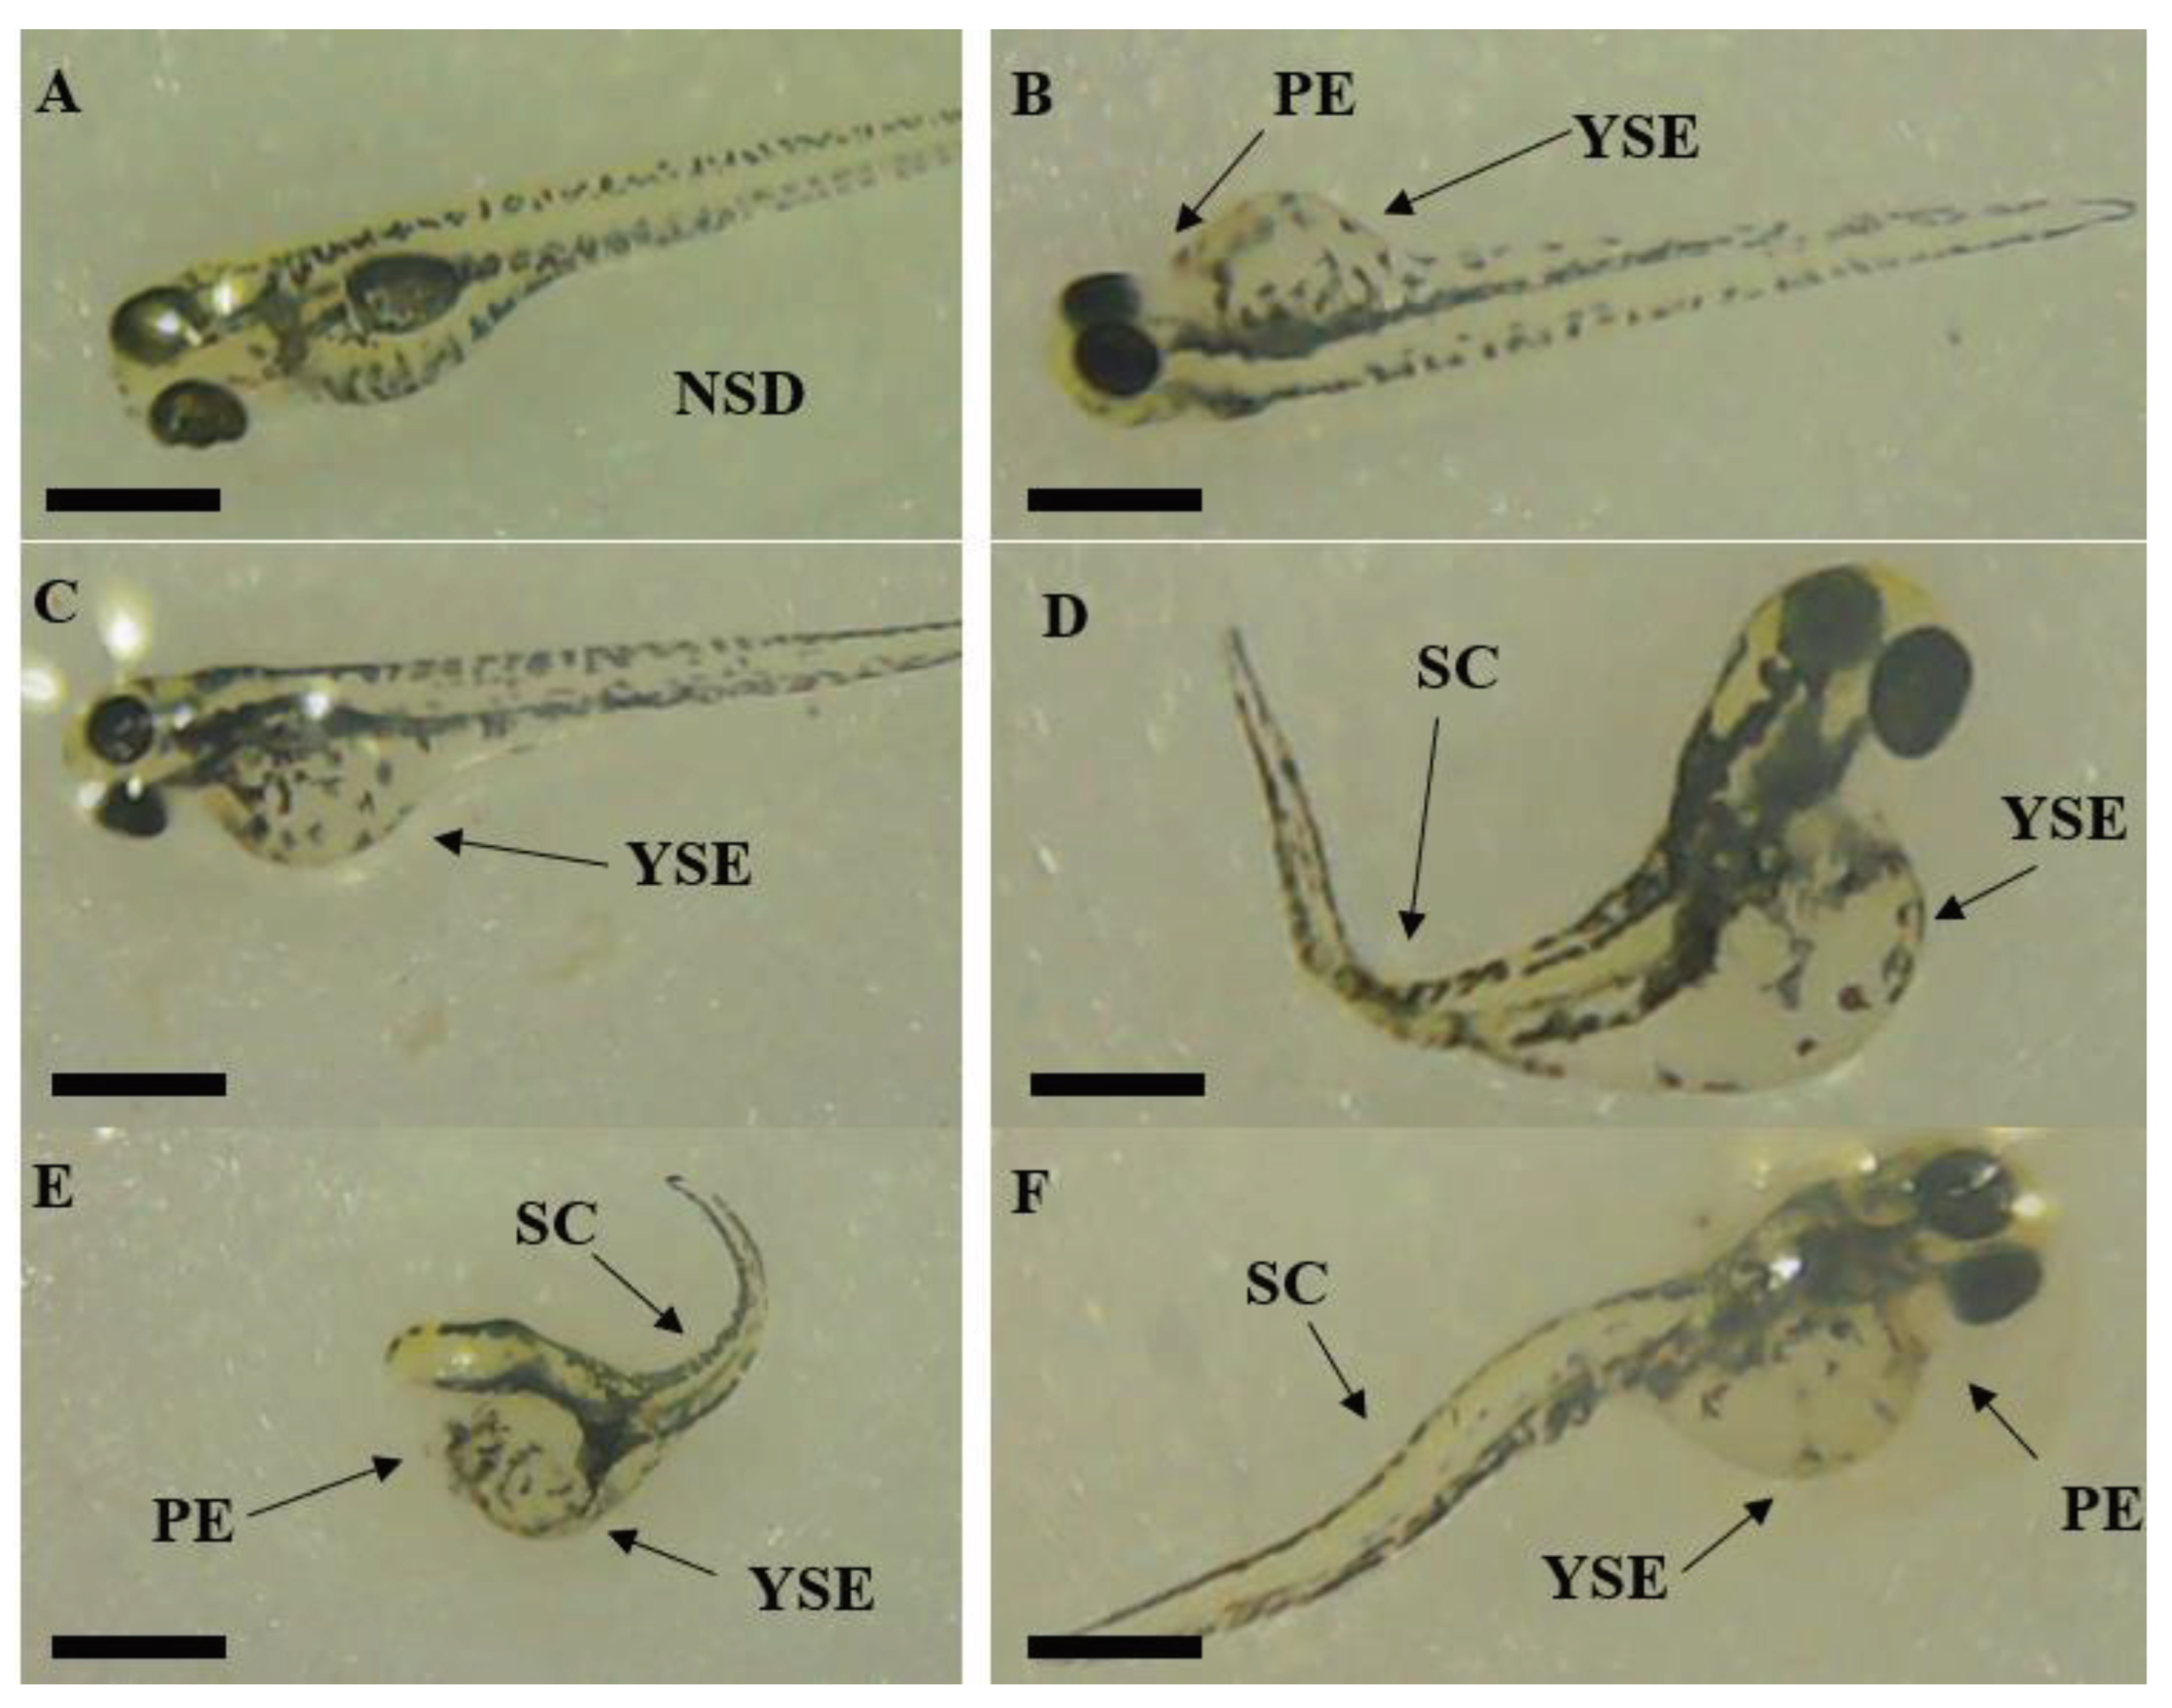
- Developmental Deformities
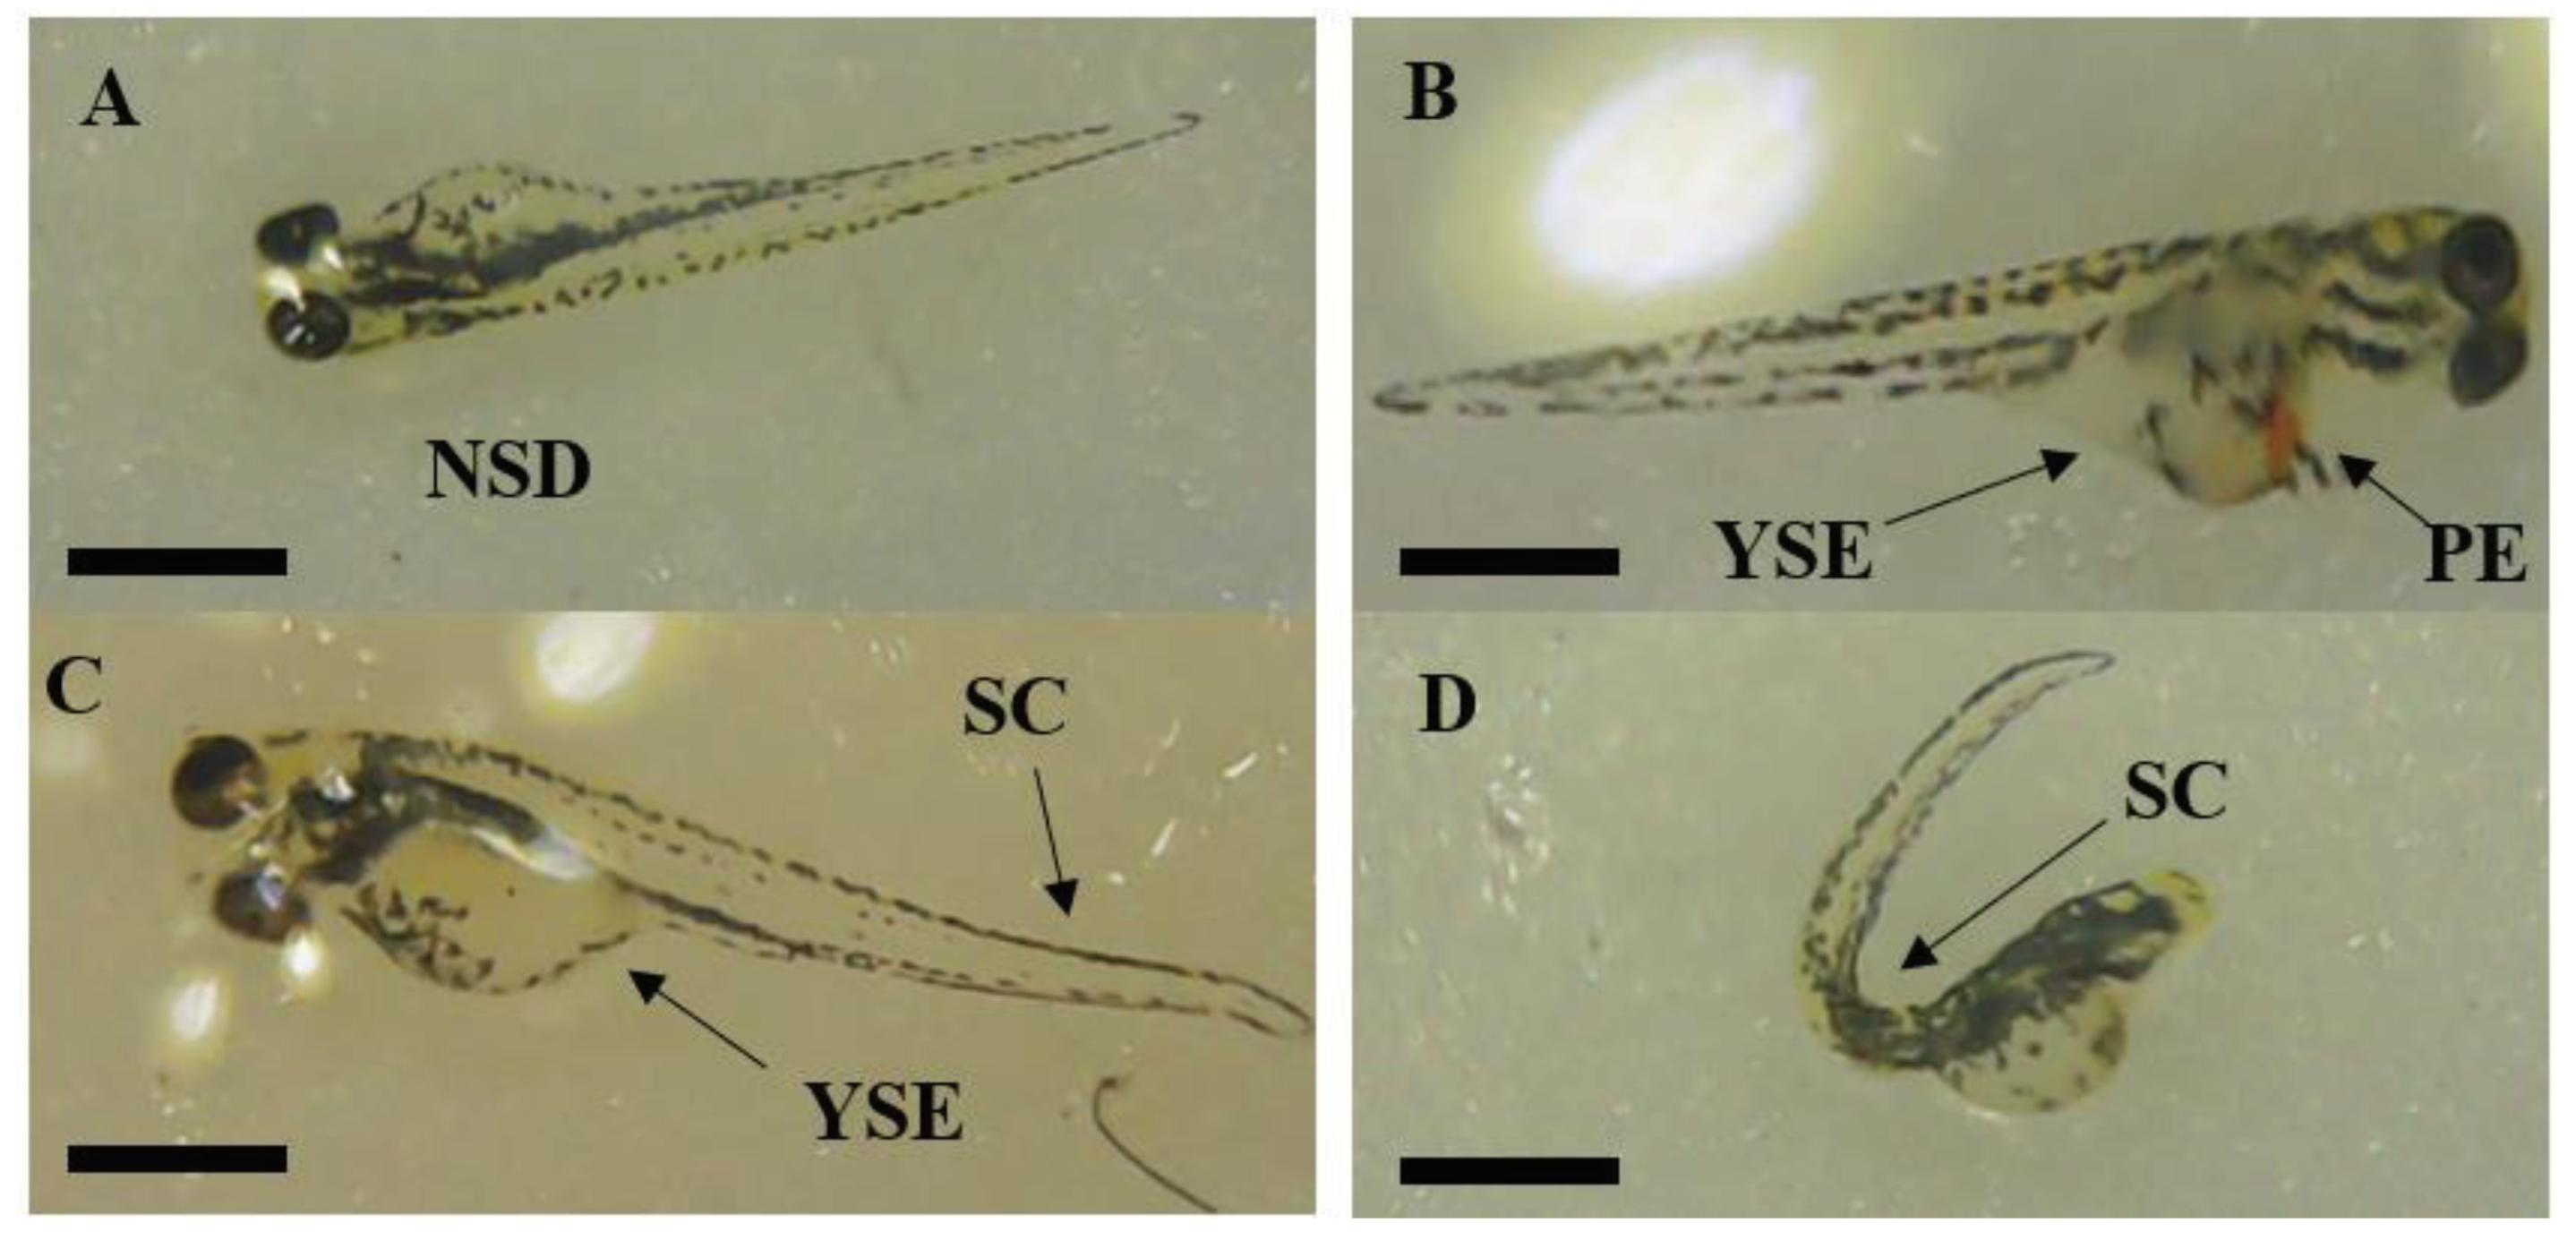
3. Materials and Methods
3.1. Chemicals and Reagents
3.2. Plant Extraction
| Family | Species |
Local name1 English name2 |
Voucher Specimena | Part (S) of the plant used | Traditional uses |
| Lamiaceae | Plectranthus amboinicus (Lour.) Spreng | Kapparawalliya1 Country borage2 |
4103 | Leaves | Treatment of skin infections, mouth ulcers, hiccups, indigestion, and colic asthma. Often eaten raw or used as flavoring agents or incorporated as ingredients in the preparation of traditional food [62] |
| Plantaginaceae | Bacopa monnieri (L.) Wettst. | Lunuwila1 Water hyssop2 |
4104 | Whole plant | As a neuronal booster and cognitive enhancer [20]. As a curry [63]. |
| Phyllanthaceae | Flueggea leucopyrus Willd. | Katupila1 Spinous fluggea2 |
4105 | Leaves | Healing of chronic and non-healing wounds [64]. Treatment for cancers [37]. |
| Poaceae | Cymbopogan citratus (DC.) Stapf | Sera1 Lemon Grass2 |
4106 | Natural flavoring agents for food [65] |
3.2.1. Methanolic Plant Extract Preparation
3.2.2. Freeze-dried Aqueous Extract Preparation
3.3. Microbial Inoculum Preparation
3.4. Antimicrobial Susceptibility Test
3.4.1. Agar Well Diffusion Assay
3.4.2. Minimum Inhibitory Concentration (MIC)
3.4.3. Minimum Bactericidal Concentration (MBC)
3.5. Testing on Isolated Milk Pathogenic Strains in Sterilized Milk Medium
3.6. Assessment of Biocompatibility and Toxicity
3.6.1. Brine Shrimp Lethality Assay
3.6.2. Zebrafish FET293 Embryo Assay
- Fish Fertilization Preparation
- 2.
- Eggs Production and Differentiation
- 3.
- Start of Exposure and Embryo Treatment
- 4.
- Embryo Observation
3.7. Data Analysis
4. Conclusions
Supplementary Materials
Author Contributions
Funding
Institutional Review Board Statement
Informed Consent Statement
Data Availability Statement
Acknowledgments
Conflicts of Interest
Abbreviations
| MIC | Minimum inhibitory concentration |
| MBC | Minimum bactericidal concentration |
| LC50 | Lethal concentration 50 |
| DMSO | Dimethyl sulfoxide |
| MHA | Mueller Hinton agar |
| MHB | Mueller Hinton broth |
| ZOI | Zone of inhibition |
| FET | Fish embryo toxicity |
| hpf | hours post fertilization |
| NSD | No structural deformity |
| YSE | Yolk sac edema |
| PE | Pericardial edema |
| SCC | Spinal cord curvature |
| SD | Standard deviation |
| AgNPs | Silver nano particles |
| OECD | Organization for Economic Co-operation and Development |
References
- Bezie, A. The Effect of Different Heat Treatment on the Nutritional Value of Milk and Milk Products and Shelf-Life of Milk Products. A Review. J. Dairy Vet. Sci. 2019, 11. [Google Scholar] [CrossRef]
- Fischer, W. J.; Schilter, B.; Tritscher, A. M.; Stadler, R. H. Contaminants of Milk and Dairy Products: Contamination Resulting from Farm and Dairy Practices. Encycl. Dairy Sci. Second Ed. 2011, 887–897. [Google Scholar] [CrossRef]
- R. Singh. Principles and Applications of Environmental Biotechnology for a Sustainable Future. Environ. Sci. 2017. [Google Scholar] [CrossRef]
- Berhe, G.; Wasihun, A. G.; Kassaye, E.; Gebreselasie, K. Milk-Borne Bacterial Health Hazards in Milk Produced for Commercial Purpose in Tigray, Northern Ethiopia. BMC Public Health 2020, 20, 1–8. [Google Scholar] [CrossRef]
- Kongo, J. M.; Gomes, A. P.; Malcata, F. X. Monitoring and Identification of Bacteria Associated with Safety Concerns in the Manufacture of São Jorge, a Portuguese Traditional Cheese from Raw Cow’s Milk. J. Food Prot. 2008, 71, 986–992. [Google Scholar] [CrossRef] [PubMed]
- Martin, N. H.; Torres-Frenzel, P.; Wiedmann, M. Invited Review: Controlling Dairy Product Spoilage to Reduce Food Loss and Waste. J. Dairy Sci. 2021, 104, 1251–1261. [Google Scholar] [CrossRef] [PubMed]
- Siddique, F.; Latif, A.; Arshad, M.; Lashari, M. H. Antimicrobial Activity of Certain Herbal Plant Extracts against Pathogenic Microbes and Their Application in Sterilized Milk Medium. Pure Appl. Biol. 2021, 10, 378–387. [Google Scholar] [CrossRef]
- Velázquez-Sámano, G.; Collado-Chagoya, R.; Cruz-Pantoja, R. A.; Velasco-Medina, A. A.; Rosales-Guevara, J. Hypersensitivity Reactions to Food Additives. Rev. Alerg. Mex. 2019, 66, 329–339. [Google Scholar] [CrossRef] [PubMed]
- Negi, P. S. Plant Extracts for the Control of Bacterial Growth: Efficacy, Stability and Safety Issues for Food Application. Int. J. Food Microbiol. 2012, 156, 7–17. [Google Scholar] [CrossRef]
- El-Sayed, S. M.; Youssef, A. M. Potential Application of Herbs and Spices and Their Effects in Functional Dairy Products. Heliyon 2019, 5. [Google Scholar] [CrossRef]
- Atanu, J. Application of Herbs in Functional Dairy Products – A Review. J. Dairy, Vet. Anim. Res. 2017, 5, 109–115. [Google Scholar] [CrossRef]
- Vaou, N.; Stavropoulou, E.; Voidarou, C.; Tsigalou, C.; Bezirtzoglou, E. Towards Advances in Medicinal Plant Antimicrobial Activity: A Review Study on Challenges and Future Perspectives. Microorganisms 2021, 9, 1–28. [Google Scholar] [CrossRef] [PubMed]
- Álvarez-Martínez, F. J.; Barrajón-Catalán, E.; Herranz-López, M.; Micol, V. Antibacterial Plant Compounds, Extracts and Essential Oils: An Updated Review on Their Effects and Putative Mechanisms of Action. Phytomedicine 2021, 90, 153626. [Google Scholar] [CrossRef] [PubMed]
- Marjorie Murphy Cowan. Plant Products as Antimicrobial Agents. Am. Soc. Microbiol. 2007, 14, 128–130. [Google Scholar] [CrossRef]
- Ardalan, M.-R.; Rafieian-Kopaei, M. Is the Safety of Herbal Medicines for Kidneys under Question? J. nephropharmacology 2013, 2, 11–12. [Google Scholar]
- Oloya, B.; Namukobe, J.; Ssengooba, W.; Afayoa, M.; Byamukama, R. Phytochemical Screening, Antimycobacterial Activity and Acute Toxicity of Crude Extracts of Selected Medicinal Plant Species Used Locally in the Treatment of Tuberculosis in Uganda. Trop. Med. Health 2022, 50. [Google Scholar] [CrossRef] [PubMed]
- Ekor, M. The Growing Use of Herbal Medicines: Issues Relating to Adverse Reactions and Challenges in Monitoring Safety. Front. Neurol. 2014, 4, 1–10. [Google Scholar] [CrossRef] [PubMed]
- Mohamed, A. Evaluation of Antimicrobial Activity of Different Solvent Extracts of Saussurea Lappa. World J. Pharm. Pharm. Sci. 2017, 4, 12–18. [Google Scholar] [CrossRef]
- Mehta, J.; Utkarsh, K.; Fuloria, S.; Singh, T.; Sekar, M. Bioactive Molecules against Uropathogens — An In Silico Study to Identify Potential Lead Molecule ( s ) for the Development of New Drugs to Treat Urinary Tract Infections. 2022, No. Md.
- Fazlul, M. K. K.; Deepthi, S. P.; Irfan, M.; Farzana, Y.; Munira, B.; Nazmul, M. H. M. Antibacterial and Antifungal Activity of Various Extracts of Bacopa Monnieri. Int. J. Pharm. Res. 2019, 11, 1698–1702. [Google Scholar] [CrossRef]
- Karunarathnne, E. D. C.; Lokuwalpola, D. V; Sandaruwan, K. P. A. M.; Dabarera, M. D.; Wanigasekara, D. N. Antibacterial Activity of Flueggea Leucopyrus Willd. Int. Conf. Appl. Pure Sci. 2021, 31. [Google Scholar]
- Subramaniam, G.; Yew, X. Y.; Sivasamugham, L. A. Antibacterial Activity of Cymbopogon Citratus against Clinically Important Bacteria. South African J. Chem. Eng. 2020, 34, 26–30. [Google Scholar] [CrossRef]
- Sivaranjani, D.; Saranraj, P.; Manigandan, M.; Amala, K. Antimicrobial Activity of Plectranthus Amboinicus Solvent Extracts against Human Pathogenic Bacteria and Fungi. J. Drug Deliv. Ther. 2019, 9, 36–39. [Google Scholar] [CrossRef]
- Rowell, R. M.; Pettersen, R.; Han, J. S.; Rowell, J. S.; Tshabalala, M. A.; Service, F. - Cell Wall Chemistry; 2012. [CrossRef]
- Oskay, M.; Sari, D. Antimicrobial Screening of Some Turkish Medicinal Plants. Pharm. Biol. 2007, 45, 176–181. [Google Scholar] [CrossRef]
- Ginovyan, M.; Petrosyan, M.; Trchounian, A. Antimicrobial Activity of Some Plant Materials Used in Armenian Traditional Medicine. BMC Complement. Altern. Med. 2017, 17, 1–9. [Google Scholar] [CrossRef] [PubMed]
- Pinto, L.; Tapia-Rodríguez, M. R.; Baruzzi, F.; Ayala-Zavala, J. F. Plant Antimicrobials for Food Quality and Safety: Recent Views and Future Challenges. Foods 2023, 12. [Google Scholar] [CrossRef]
- Falya, Y.; Sumiwi, S. A.; Levita, J. Mini Review: Toxicity Study Of Plant Extracts. J. Pharm. Biol. Sci. 2020, 15, 25–32. [Google Scholar] [CrossRef]
- Chao, Wu. An Important Player in Brine Shrimp Lethality Bioassay: The Solvent. J. Adv. Pharm. Technol. Res. 2014, 5, 57–58. [Google Scholar]
- Sousa, M. I.; Correia, B.; Branco, A. F.; Rodrigues, A. S.; Ramalho-Santos, J. Effects of DMSO on the Pluripotency of Cultured Mouse Embryonic Stem Cells (MESCs). Stem Cells Int. 2020, 2020. [Google Scholar] [CrossRef]
- Geethaa, S.; Thavamany, P. J.; Chiew, S. P.; Thong, O. M. Interference from Ordinarily Used Solvents in the Outcomes of Artemia Salina Lethality Test. J. Adv. Pharm. Technol. Res. 2013, 4, 179–182. [Google Scholar] [CrossRef]
- George, M.; Josekumar, V. S. In Vitro Cytotoxicity Screening , Phytochemical Profile and Heavy Metal Analysis of Different Extracts of Acrostichum Heterophyllum L . 2016, 7 (March), 19–24.
- Sarah, Q. S.; Anny, F. C.; Misbahuddin, M. Brine Shrimp Lethality Assay. Bangladesh J. Pharmacol. 2017, 12, 186–189. [Google Scholar] [CrossRef]
- Meyer, B. N.; Ferrigni, N. R.; Putnam, J. E.; Jacobsen, L. B.; Nichols, D. E.; McLaughlin, J. L. Brine Shrimp: A Convenient General Bioassay for Active Plant Constituents. Planta Med. 1982, 45, 31–34. [Google Scholar] [CrossRef] [PubMed]
- Clarkson, C.; Maharaj, V. J.; Crouch, N. R.; Grace, O. M.; Pillay, P.; Matsabisa, M. G.; Bhagwandin, N.; Smith, P. J.; Folb, P. I. In Vitro Antiplasmodial Activity of Medicinal Plants Native to or Naturalised in South Africa. J. Ethnopharmacol. 2004, 92, 177–191. [Google Scholar] [CrossRef]
- Chalo, D. M.; Lukhoba, C.; Fidahuessein, D. S.; Nguta, J. M. Antimicrobial Activity, Toxicity and Phytochemical Screening of Selected Medicinal Plants of Losho, Narok County, Kenya. Biofarmasi J. Nat. Prod. Biochem. 2017, 15, 29–43. [Google Scholar] [CrossRef]
- Bulugahapitiya, V. P.; Munasinghe, M. M. A. B.; Hettihewa, L. M.; Kihara, N. Anti-Cancer Activity of <em>Fluggea Leucopyrus</Em> Willd (Katupila) against Human Ovarian Carcinoma and Characterization of Active Compounds. J. Sci. 2020, 11. [Google Scholar] [CrossRef]
- Sasidharan, S.; Chen, Y.; Saravanan, D.; Sundram, K. M.; Latha, L. Y. EXTRACTION, ISOLATION AND CHARACTERIZATION OF BIOACTIVE COMPOUNDS FROM PLANTS’ EXTRACTS. African J. Tradit. Complement. Altern. Med. 2011, 8, 93–130. [Google Scholar] [CrossRef]
- Paramasivam, D.; Balasubramanian, B.; Park, S.; Alagappan, P.; Kaul, T.; Liu, W.; Pachiappan, P. Phytochemical Profiling and Biological Activity of Plectranthus Amboinicus (Lour.) Mediated by Various Solvent Extracts against Aedes Aegypti Larvae and Toxicity Evaluation. Asian Pac. J. Trop. Med. 2020, 13, 494–502. [Google Scholar] [CrossRef]
- Charoenphon, N.; Kangwanrangsan, N.; Jiraungkoorskul, W. Artemia Salina Lethality and Histopathological Studies on Bacopa Monnieri Leaf Extract. Indian J. Anim. Res. 2018, 52, 610–614. [Google Scholar] [CrossRef]
- Mendes Hacke, A. C.; D’Avila da Silva, F.; Lima, D.; Rebuglio Vellosa, J. C.; Teixeira Rocha, J. B.; Marques, J. A.; Pereira, R. P. Cytotoxicity of Cymbopogon Citratus (DC) Stapf Fractions, Essential Oil, Citral, and Geraniol in Human Leukocytes and Erythrocytes. J. Ethnopharmacol. 2022, 291, 115147. [Google Scholar] [CrossRef]
- Chahardehi, A. M.; Arsad, H.; Lim, V. Zebrafish as a Successful Animal Model for Screening Toxicity of Medicinal Plants. Plants 2020, 9, 1–35. [Google Scholar] [CrossRef]
- McGrath, P.; Li, C. Q. Zebrafish: A Predictive Model for Assessing Drug-Induced Toxicity. Drug Discov. Today 2008, 13, (9–10). [Google Scholar] [CrossRef]
- Parng, C.; Seng, W. L.; Semino, C.; McGrath, P. Zebrafish: A Preclinical Model for Drug Screening. Assay Drug Dev. Technol. 2002, 1 Pt 1, 41–48. [Google Scholar] [CrossRef] [PubMed]
- Muller, E. B.; Lin, S.; Nisbet, R. M. Quantitative Adverse Outcome Pathway Analysis of Hatching in Zebrafish with CuO Nanoparticles. Environ. Sci. Technol. 2015, 49, 11817–11824. [Google Scholar] [CrossRef]
- Schoots, A. F. M.; Meijer, R. C.; Denucé, J. M. Dopaminergic Regulation of Hatching in Fish Embryos. Dev. Biol. 1983, 100, 59–63. [Google Scholar] [CrossRef] [PubMed]
- Korwin-Kossakowski, M. Fish Hatching Strategies: A Review. Rev. Fish Biol. Fish. 2012, 22, 225–240. [Google Scholar] [CrossRef]
- Jansi, P. C. J.; Padua, J.; Freeda, R. In Vivo Toxic and Teratogenic Effects of Biologically Synthesized Silver Nanoparticles in The Embryos of the Zebrafish, Danio Rerio. Egypt. Acad. J. Biol. Sci. B. Zool. 2020, 12, 81–92. [Google Scholar] [CrossRef]
- Kent, M. L.; Buchner, C.; Barton, C.; Tanguay, R. L. Toxicity of Chlorine to Zebrafish Embryos. Dis. Aquat. Organ. 2014, 107, 235–240. [Google Scholar] [CrossRef]
- Wu, S. M.; Tsai, P. J.; Chou, M. Y.; Wang, W. Der. Effects of Maternal Cadmium Exposure on Female Reproductive Functions, Gamete Quality, and Offspring Development in Zebrafish (Danio Rerio). Arch. Environ. Contam. Toxicol. 2013, 65, 521–536. [Google Scholar] [CrossRef] [PubMed]
- Piasecki, B.; Biernasiuk, A.; Skiba, A.; Skalicka-Woźniak, K.; Ludwiczuk, A. Composition, Anti-Mrsa Activity and Toxicity of Essential Oils from Cymbopogon Species. Molecules 2021, 26, 1–16. [Google Scholar] [CrossRef]
- Lawson, N. D.; Weinstein, B. M. In Vivo Imaging of Embryonic Vascular Development Using Transgenic Zebrafish. Dev. Biol. 2002, 248, 307–318. [Google Scholar] [CrossRef]
- Herbert, S. P.; Stainier, D. Y. R. Molecular Control of Endothelial Cell Behaviour during Blood Vessel Morphogenesis. Nat. Rev. Mol. Cell Biol. 2011, 12, 551–564. [Google Scholar] [CrossRef]
- Rossant, J.; Howard, L. Signaling Pathways in Vascular Development. Annu. Rev. Cell Dev. Biol. 2002, 18, 541–573. [Google Scholar] [CrossRef] [PubMed]
- Massarsky, A.; Jayasundara, N.; Bailey, J. M.; Oliveri, A. N.; Levin, E. D.; Prasad, G. L.; Di Giulio, R. T. Teratogenic, Bioenergetic, and Behavioral Effects of Exposure to Total Particulate Matter on Early Development of Zebrafish (Danio Rerio) Are Not Mimicked by Nicotine. Neurotoxicol. Teratol. 2015, 51, 77–88. [Google Scholar] [CrossRef] [PubMed]
- Huang, D.; Li, H.; He, Q.; Yuan, W.; Chen, Z.; Yang, H. Developmental Toxicity of Diethylnitrosamine in Zebrafish Embryos/Juveniles Related to Excessive Oxidative Stress. Water. Air. Soil Pollut. 2018, 229. [Google Scholar] [CrossRef] [PubMed]
- Kiener, T. K.; Selptsova-Friedrich, I.; Hunziker, W. Tjp3/Zo-3 Is Critical for Epidermal Barrier Function in Zebrafish Embryos. Dev. Biol. 2008, 316, 36–49. [Google Scholar] [CrossRef] [PubMed]
- Yan, G.; Zhang, Y.; Yu, J.; Yu, Y.; Zhang, F.; Zhang, Z.; Wu, A.; Yan, X.; Zhou, Y.; Wang, F. Slc39a7/Zip7 Plays a Critical Role in Development and Zinc Homeostasis in Zebrafish. PLoS One 2012, 7, 1–11. [Google Scholar] [CrossRef] [PubMed]
- Hill, A. J.; Bello, S. M.; Prasch, A. L.; Peterson, R. E.; Heideman, W. Water Permeability and TCDD-Induced Edema in Zebrafish Early-Life Stages. Toxicol. Sci. 2004, 78, 78–87. [Google Scholar] [CrossRef] [PubMed]
- Lieschke, G. J.; Currie, P. D. Animal Models of Human Disease: Zebrafish Swim into View. Nat. Rev. Genet. 2007, 8, 353–367. [Google Scholar] [CrossRef] [PubMed]
- Joshua Garces, J. C.; Picardal, J. P.; Raymond, C. D.; Raymond Consuegra, C. D.; Michelle Custodio, F. B.; Paolo Pananganan, J. L.; Jean Ramirez, W. D. Teratogenicity and Acute Toxicity of Selected Philippine Indigenous Spices Using Brine Shrimp Lethality Assay and Zebrafish Assay. Pharmacophore 2020, 11, 88–105. [Google Scholar]
- Wickramaarachchi, D. L. C. K. F. W. W. U. I. Plectranthus Ambonicus and Plectranthus Zeylanicus: As Promising Medicinal Plants. Int. J. Sci. Res. 2018, 7, 1343–1347. [Google Scholar] [CrossRef]
- Barberyn Ayurveda Resorts. Ayurvedic Medicinal Plants of Sri Lanka Compendium. Barberyn Ayurveda Resorts and The Univhttps://herbssrilanka.com/rosemary/https://herbssrilanka.com/rosemary/ersity of Ruhuna. http://www.instituteofayurveda.org/plants/plants_detail.php?i=772&s=English_name.
- Sambhaji, D. T.; Shahan, A. A.; Kumar, V. In-Vitro Antimicrobial and Antioxidant Activity of Securinega Leucopyrus ( Willd ) Muell. 2020, 13 (September), 1251–1260.
- Cino Ceylon. Sera-Leaves-Lemon-Grass-Cymbopogon-Citratus. 2022. https://www.cinoceylon.com/cinoceylon-products/spices/sera-leaves-lemon-grass-cymbopogon-citratus.html.
- Nandapala, J. H. Y. P.; Napagoda, M. T.; Weerasinghe, N. P. Anticandidal Activity of Ten Selected Medicinal Plants from Southern and North Central Provinces of Sri Lanka. Int. J. KIU 2022, 3, 32–40. [Google Scholar] [CrossRef]
- Begashaw, B.; Mishra, B.; Tsegaw, A.; Shewamene, Z. Methanol Leaves Extract Hibiscus Micranthus Linn Exhibited Antibacterial and Wound Healing Activities. BMC Complement. Altern. Med. 2017, 17, 1–11. [Google Scholar] [CrossRef] [PubMed]
- Sánchez, E.; Rivas Morales, C.; Castillo, S.; Leos-Rivas, C.; García-Becerra, L.; Ortiz Martínez, D. M. Antibacterial and Antibiofilm Activity of Methanolic Plant Extracts against Nosocomial Microorganisms. Evidence-based Complement. Altern. Med. 2016, 2016. [Google Scholar] [CrossRef] [PubMed]
- Alipoor, J.; Dabirzadeh, M.; Marofi, Y.; Sefidgar, S. A. A. Effects of Methanolic Extract of Ficus Carica Leaves on Cystic Echinococcosis. Med. Lab. J. 2017, 11, 15–20. [Google Scholar]
- Handa, S. S.; Khanuja, S. P. S.; Longo, G.; Dutt, D. Extraction Technologies for Medicinal and Aromatic Plants. United Nations Ind. Dev. Organ. Int. Cent. Sci. High Technol. 2008.
- Randima, K. A. D. K.; Perera, P. K.; Arawwawala, L. D. A. M. Comparative Analysis of Phytochemical and Antioxidant Activities of the Nishatipal Decoction and It ’ s Freeze Dried Powder. SLJIM 2020, 05, 329–339. [Google Scholar]
- How, Y. K.; Siow, L. F. Effects of Convection-, Vacuum-and Freeze-Drying on Antioxidant, Physicochemical Properties, Functional Properties and Storage Stability of Stink Bean (Parkia Speciosa) Powder. J. Food Sci. Technol. 2020, 57, 4637–4648. [Google Scholar] [CrossRef] [PubMed]
- Debalke, D.; Birhan, M.; Kinubeh, A.; Yayeh, M. Assessments of Antibacterial Effects of Aqueous-Ethanolic Extracts of Sida Rhombifolia’s Aerial Part. Sci. World J. 2018, 2018. [Google Scholar] [CrossRef]
- Rakholiya, K. D.; Kaneria, M. J.; Chanda, S. V. In Vitro Assessment of Novel Antimicrobial from Methanol Extracts of Matured Seed Kernel and Leaf of Mangifera Indica L. (Kesar Mango) for Inhibition of Pseudomonas Spp. and Their Synergistic Potential. Am. J. Drug Discov. Dev. 2015, 5, 13–23. [Google Scholar] [CrossRef]
- Parvekar, P.; Palaskar, J.; Metgud, S.; Maria, R.; Dutta, S. The Minimum Inhibitory Concentration (MIC) and Minimum Bactericidal Concentration (MBC) of Silver Nanoparticles against Staphylococcus Aureus. Biomater. Investig. Dent. 2020, 7, 105–109. [Google Scholar] [CrossRef]
- OECD. Test No. 236: Fish Embryo Acute Toxicity (FET) Test. OECD Guidel. Test. Chem. Sect. 2, OECD Publ. 2013, No. July, 1–22.
- Almeida, A. R.; Salimian, M.; Ferro, M.; Marques, P. A.; Goncalves, G.; Titus, E.; Domingues, I. Biochemical and Behavioral Responses of Zebrafish Embryos to Magnetic Graphene/Nickel Nanocomposites. Ecotoxicol. Environ. Saf. 2019, 186, 109760. [Google Scholar] [CrossRef]
Disclaimer/Publisher’s Note: The statements, opinions and data contained in all publications are solely those of the individual author(s) and contributor(s) and not of MDPI and/or the editor(s). MDPI and/or the editor(s) disclaim responsibility for any injury to people or property resulting from any ideas, methods, instructions or products referred to in the content. |
© 2024 by the authors. Licensee MDPI, Basel, Switzerland. This article is an open access article distributed under the terms and conditions of the Creative Commons Attribution (CC BY) license (http://creativecommons.org/licenses/by/4.0/).


