Submitted:
28 March 2024
Posted:
29 March 2024
You are already at the latest version
Abstract
Keywords:
1. Introduction
2. Materials and Methods
3. Results
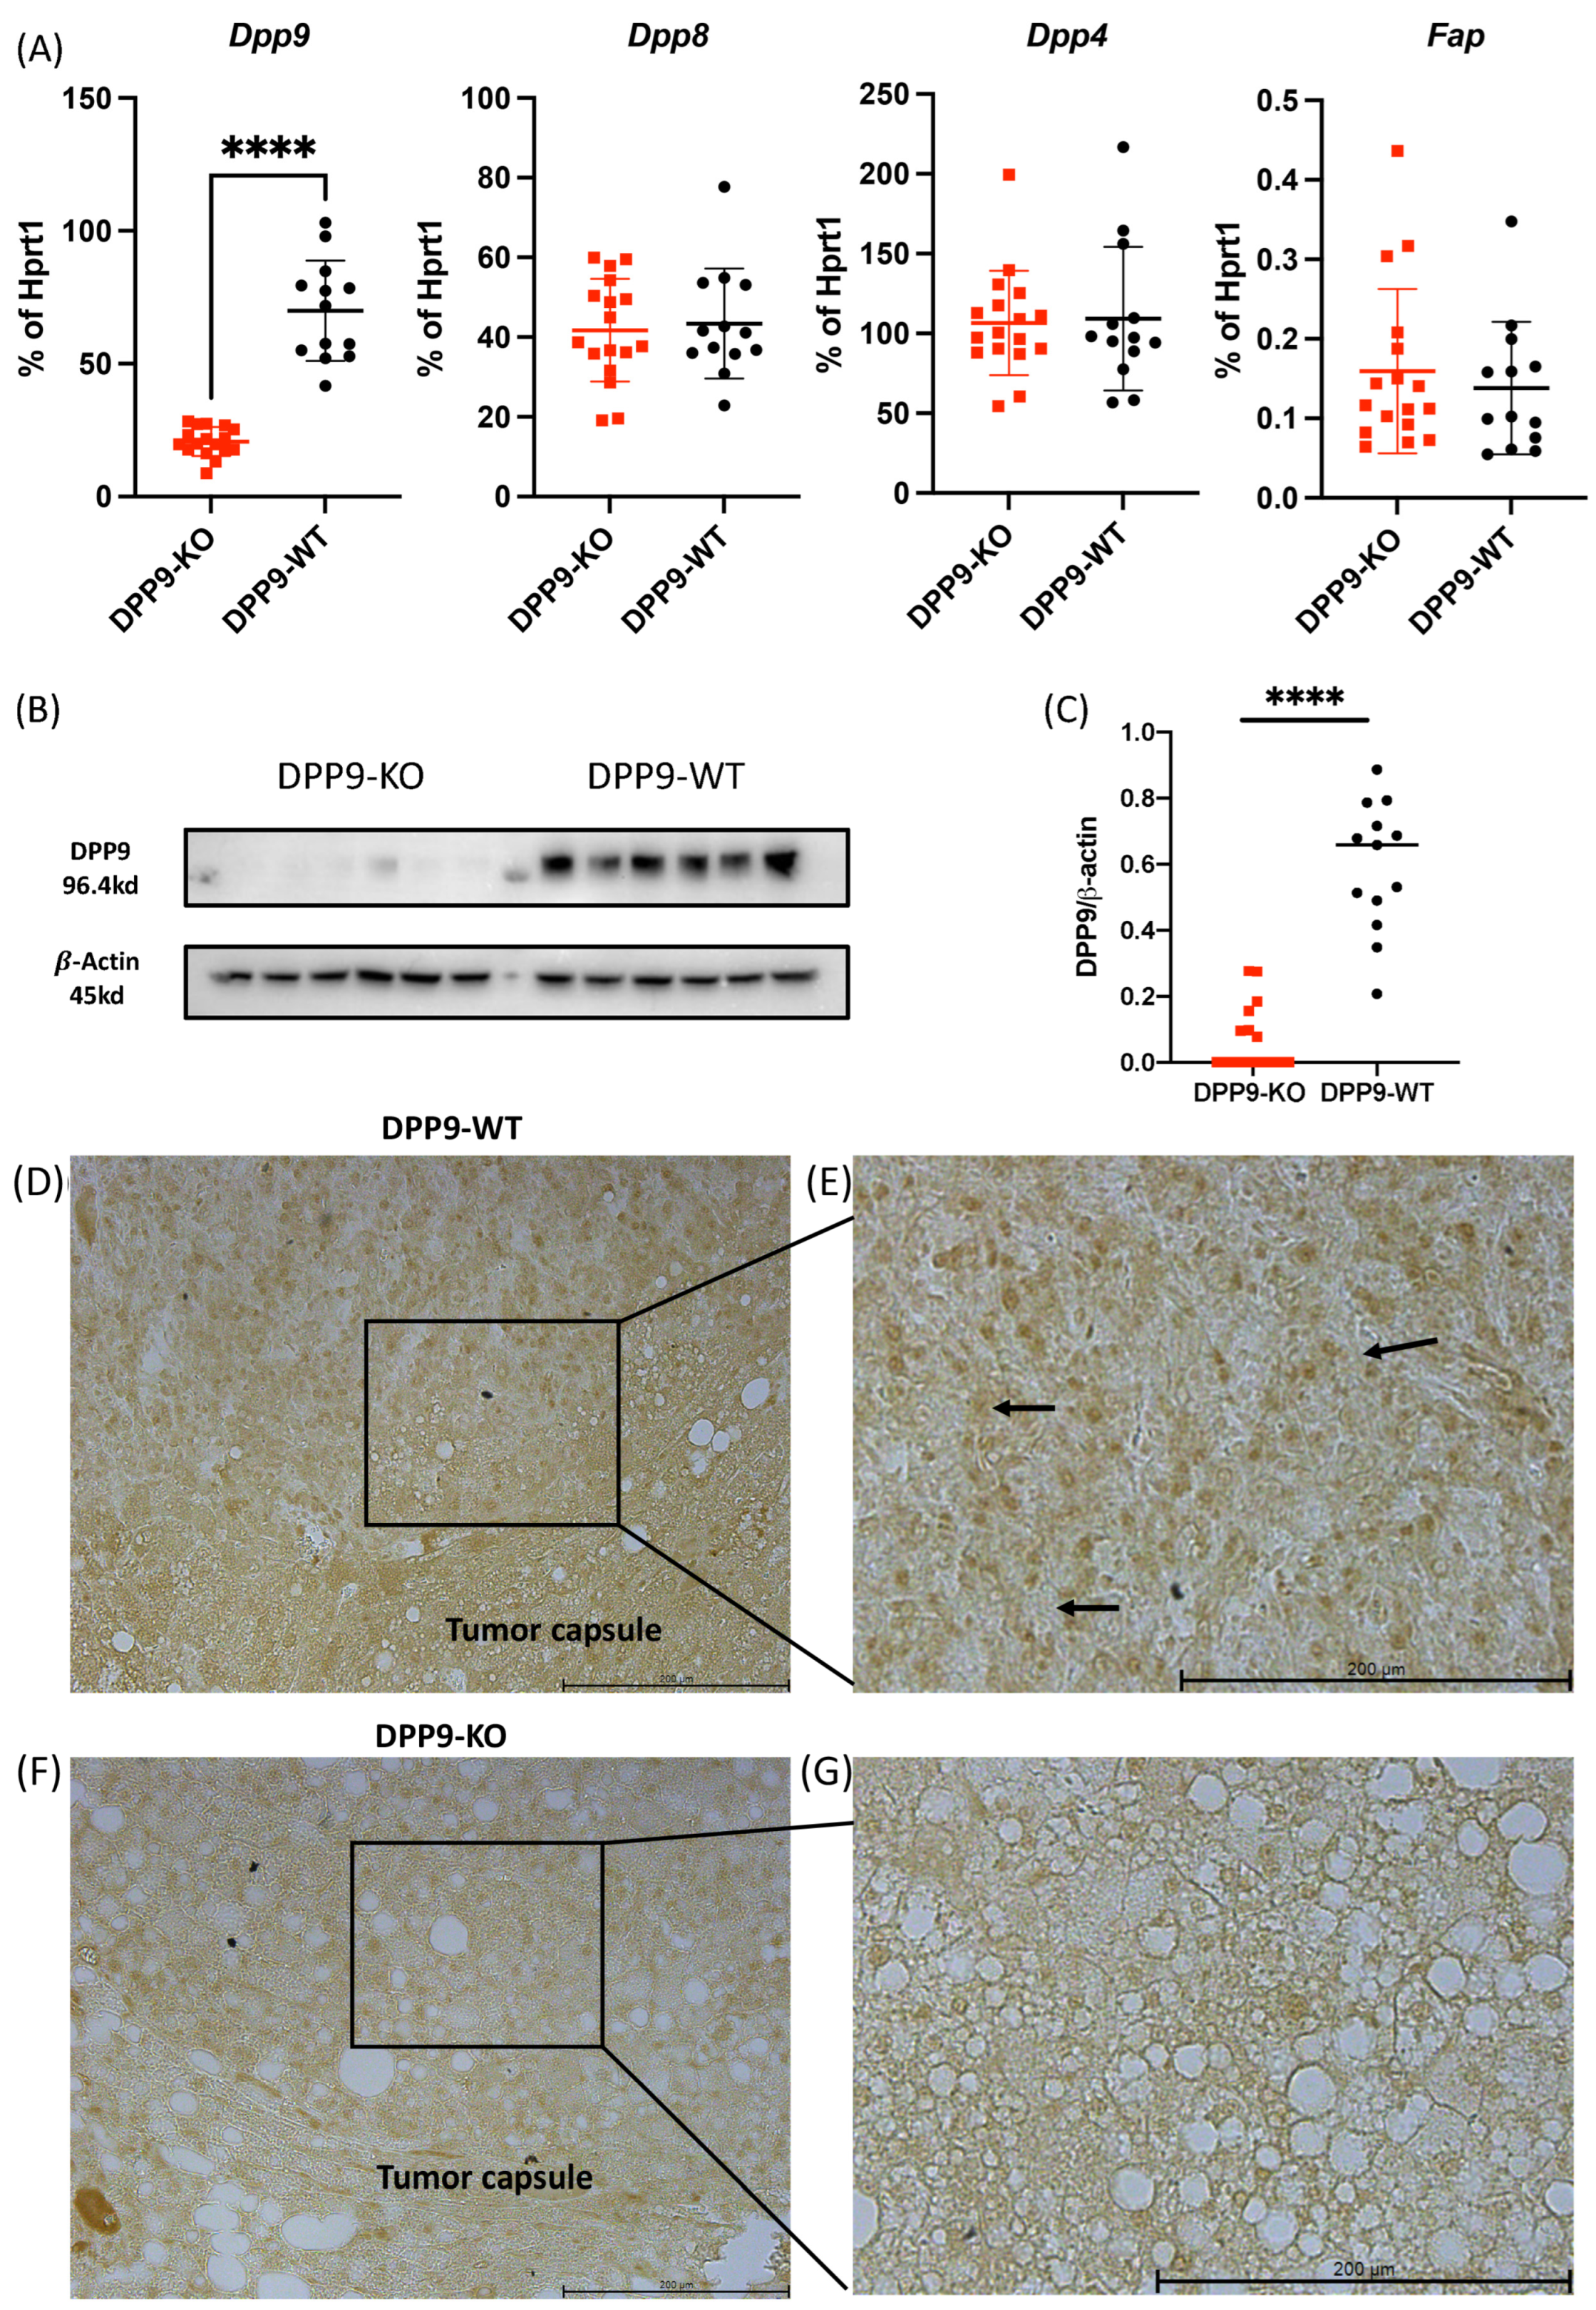
3.1. Hepatocyte-Specific DPP9 Knockout Primary HCC Mouse Model Validation
3.2. DPP9 and Glucose Metabolism
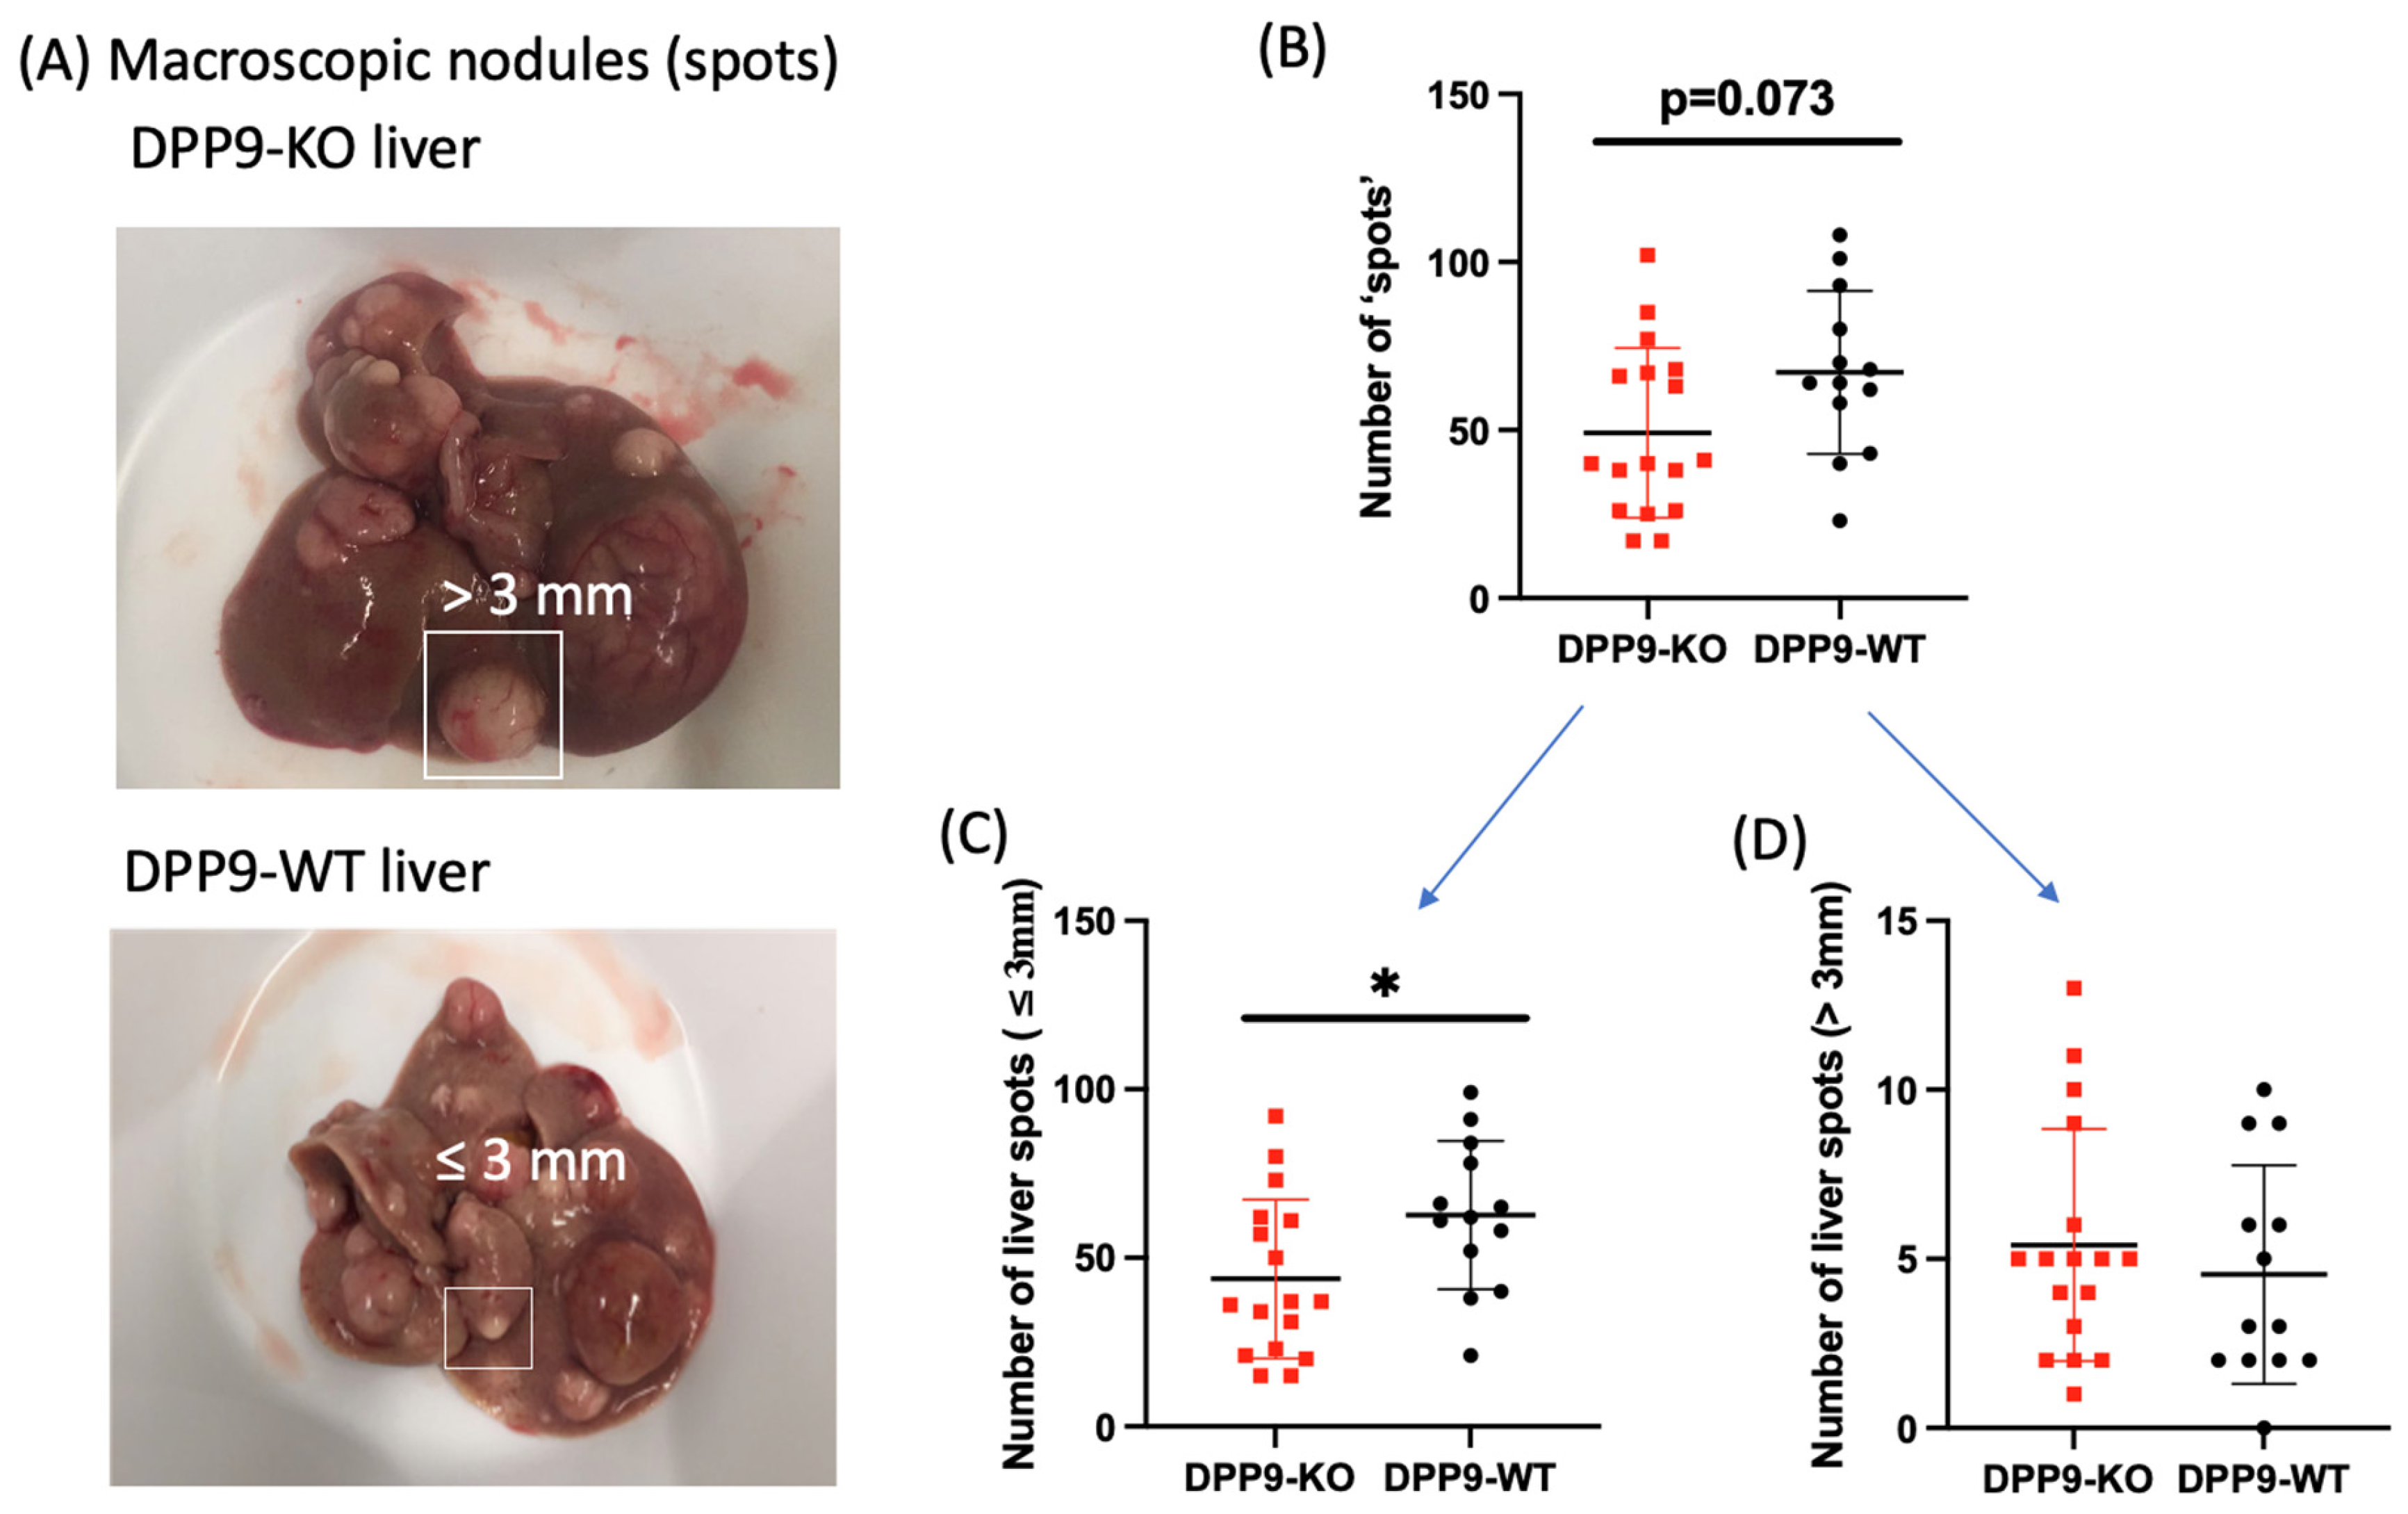
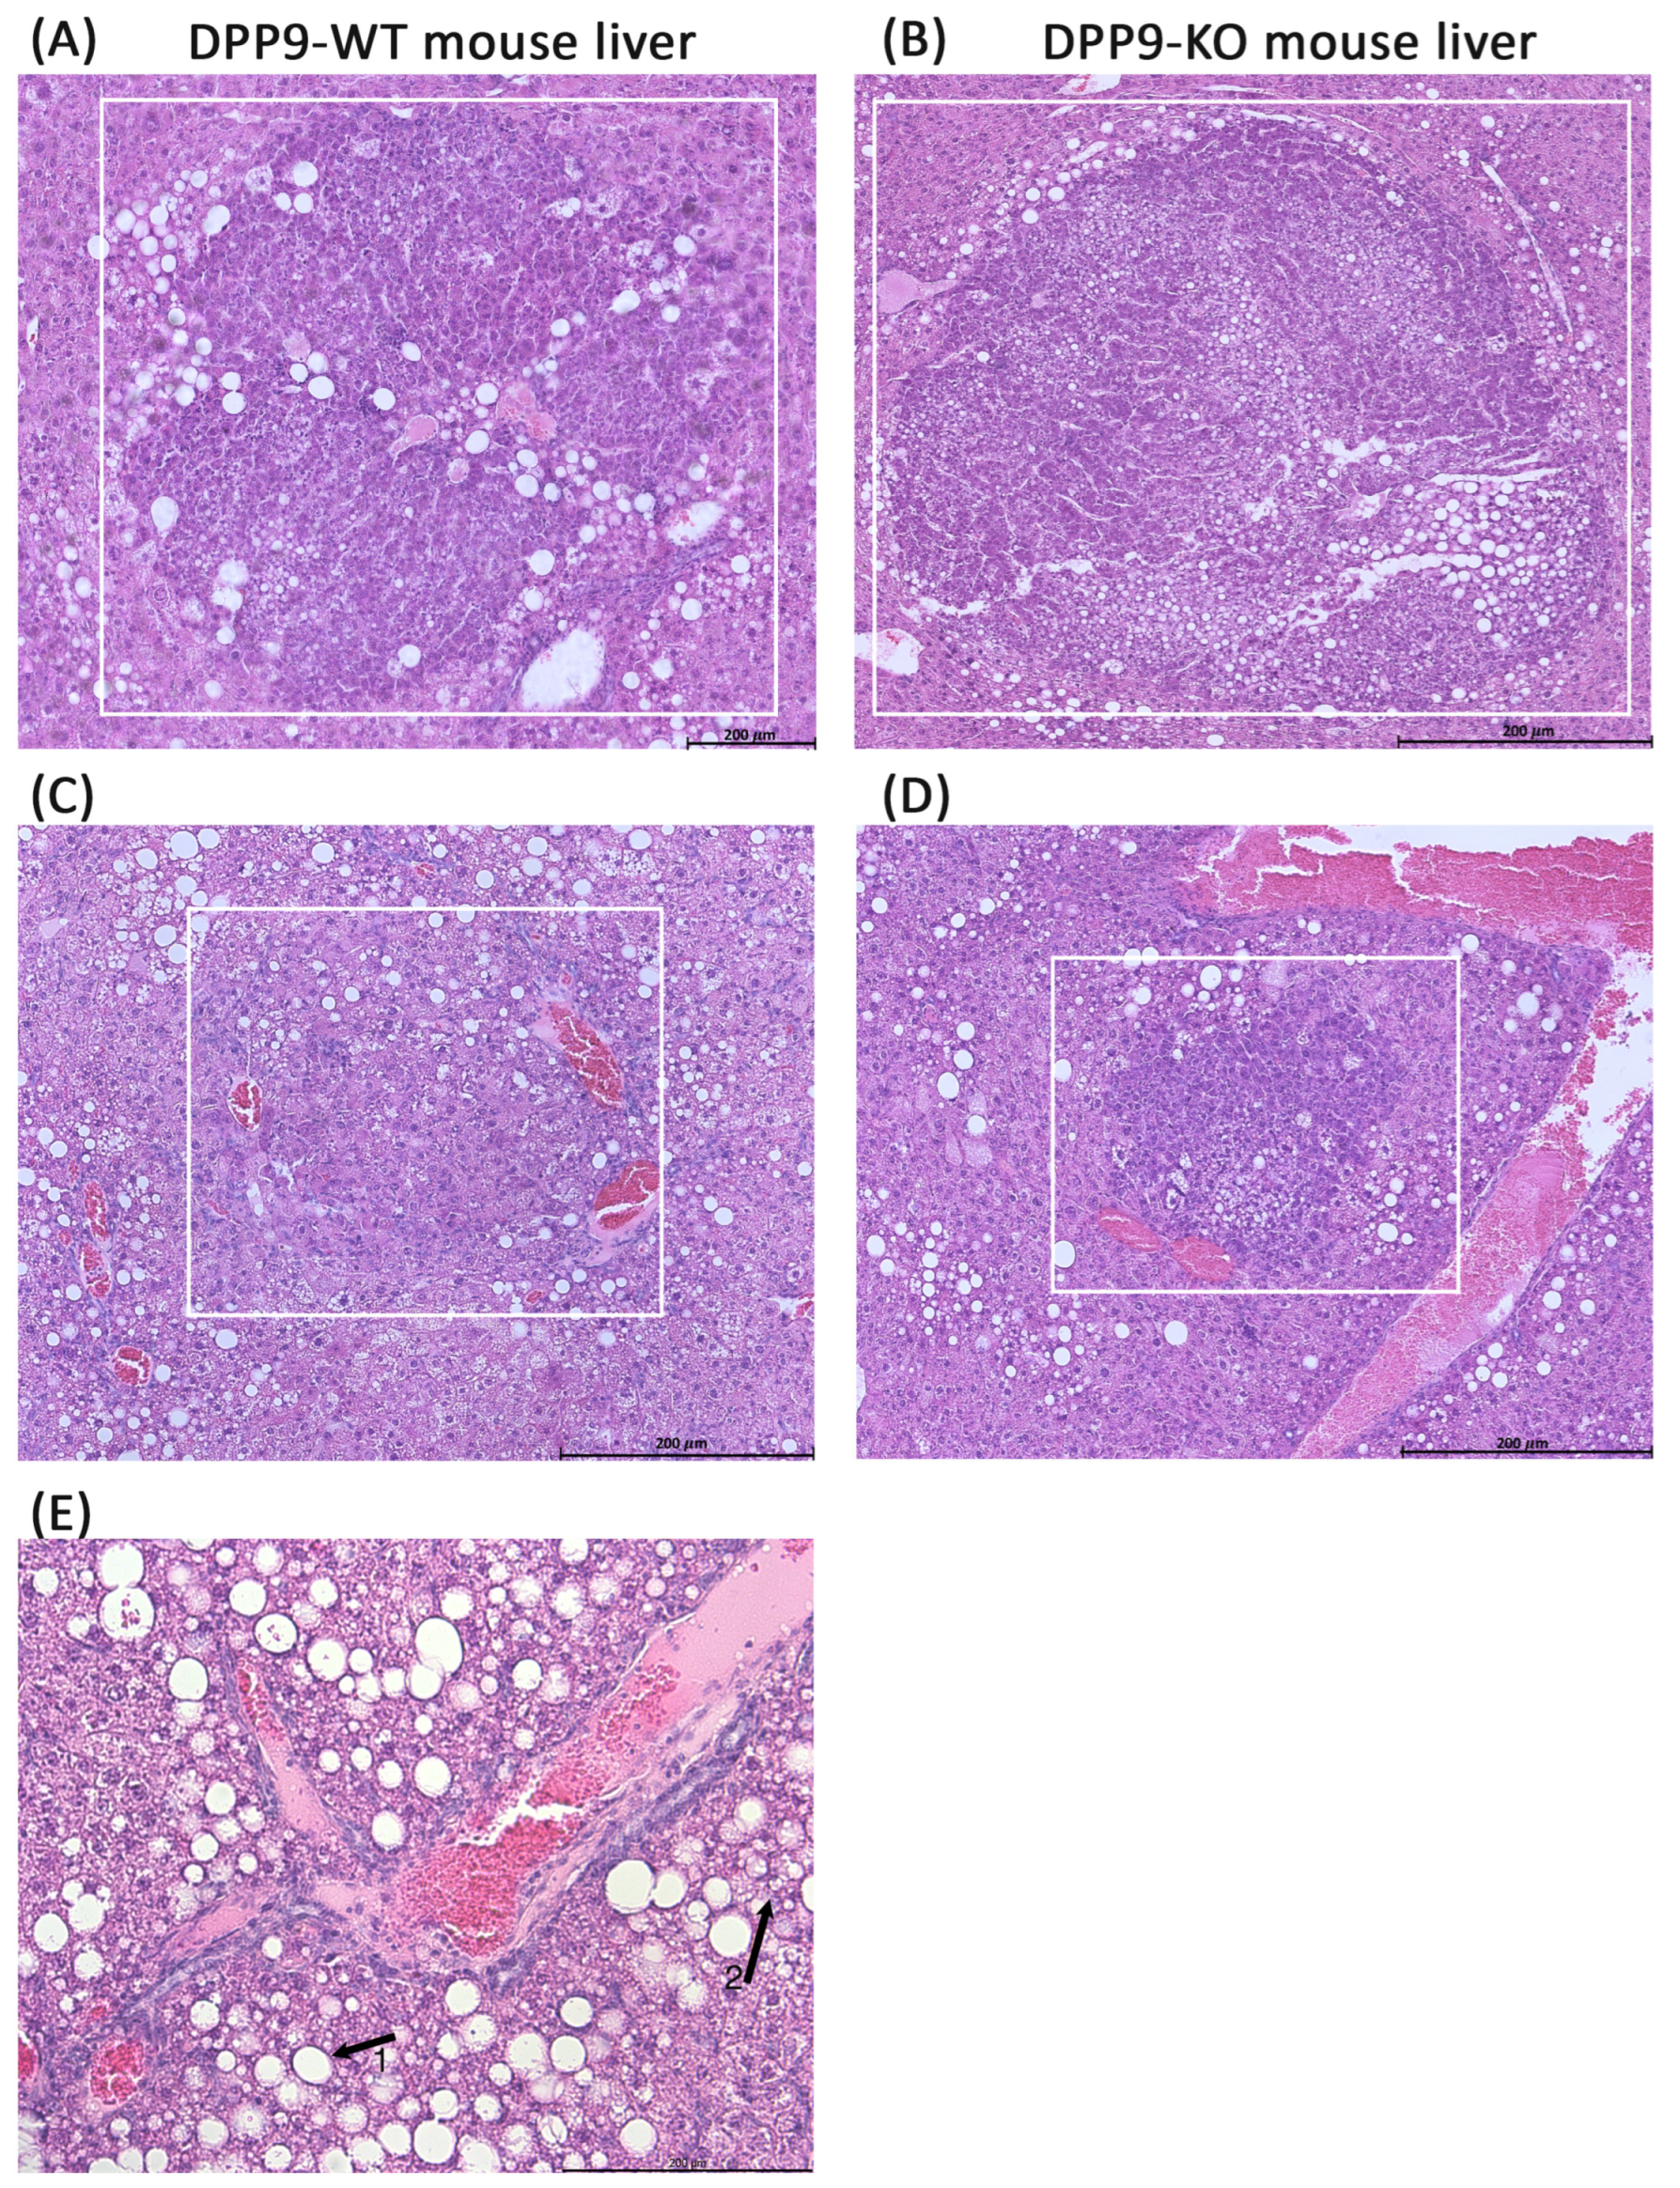
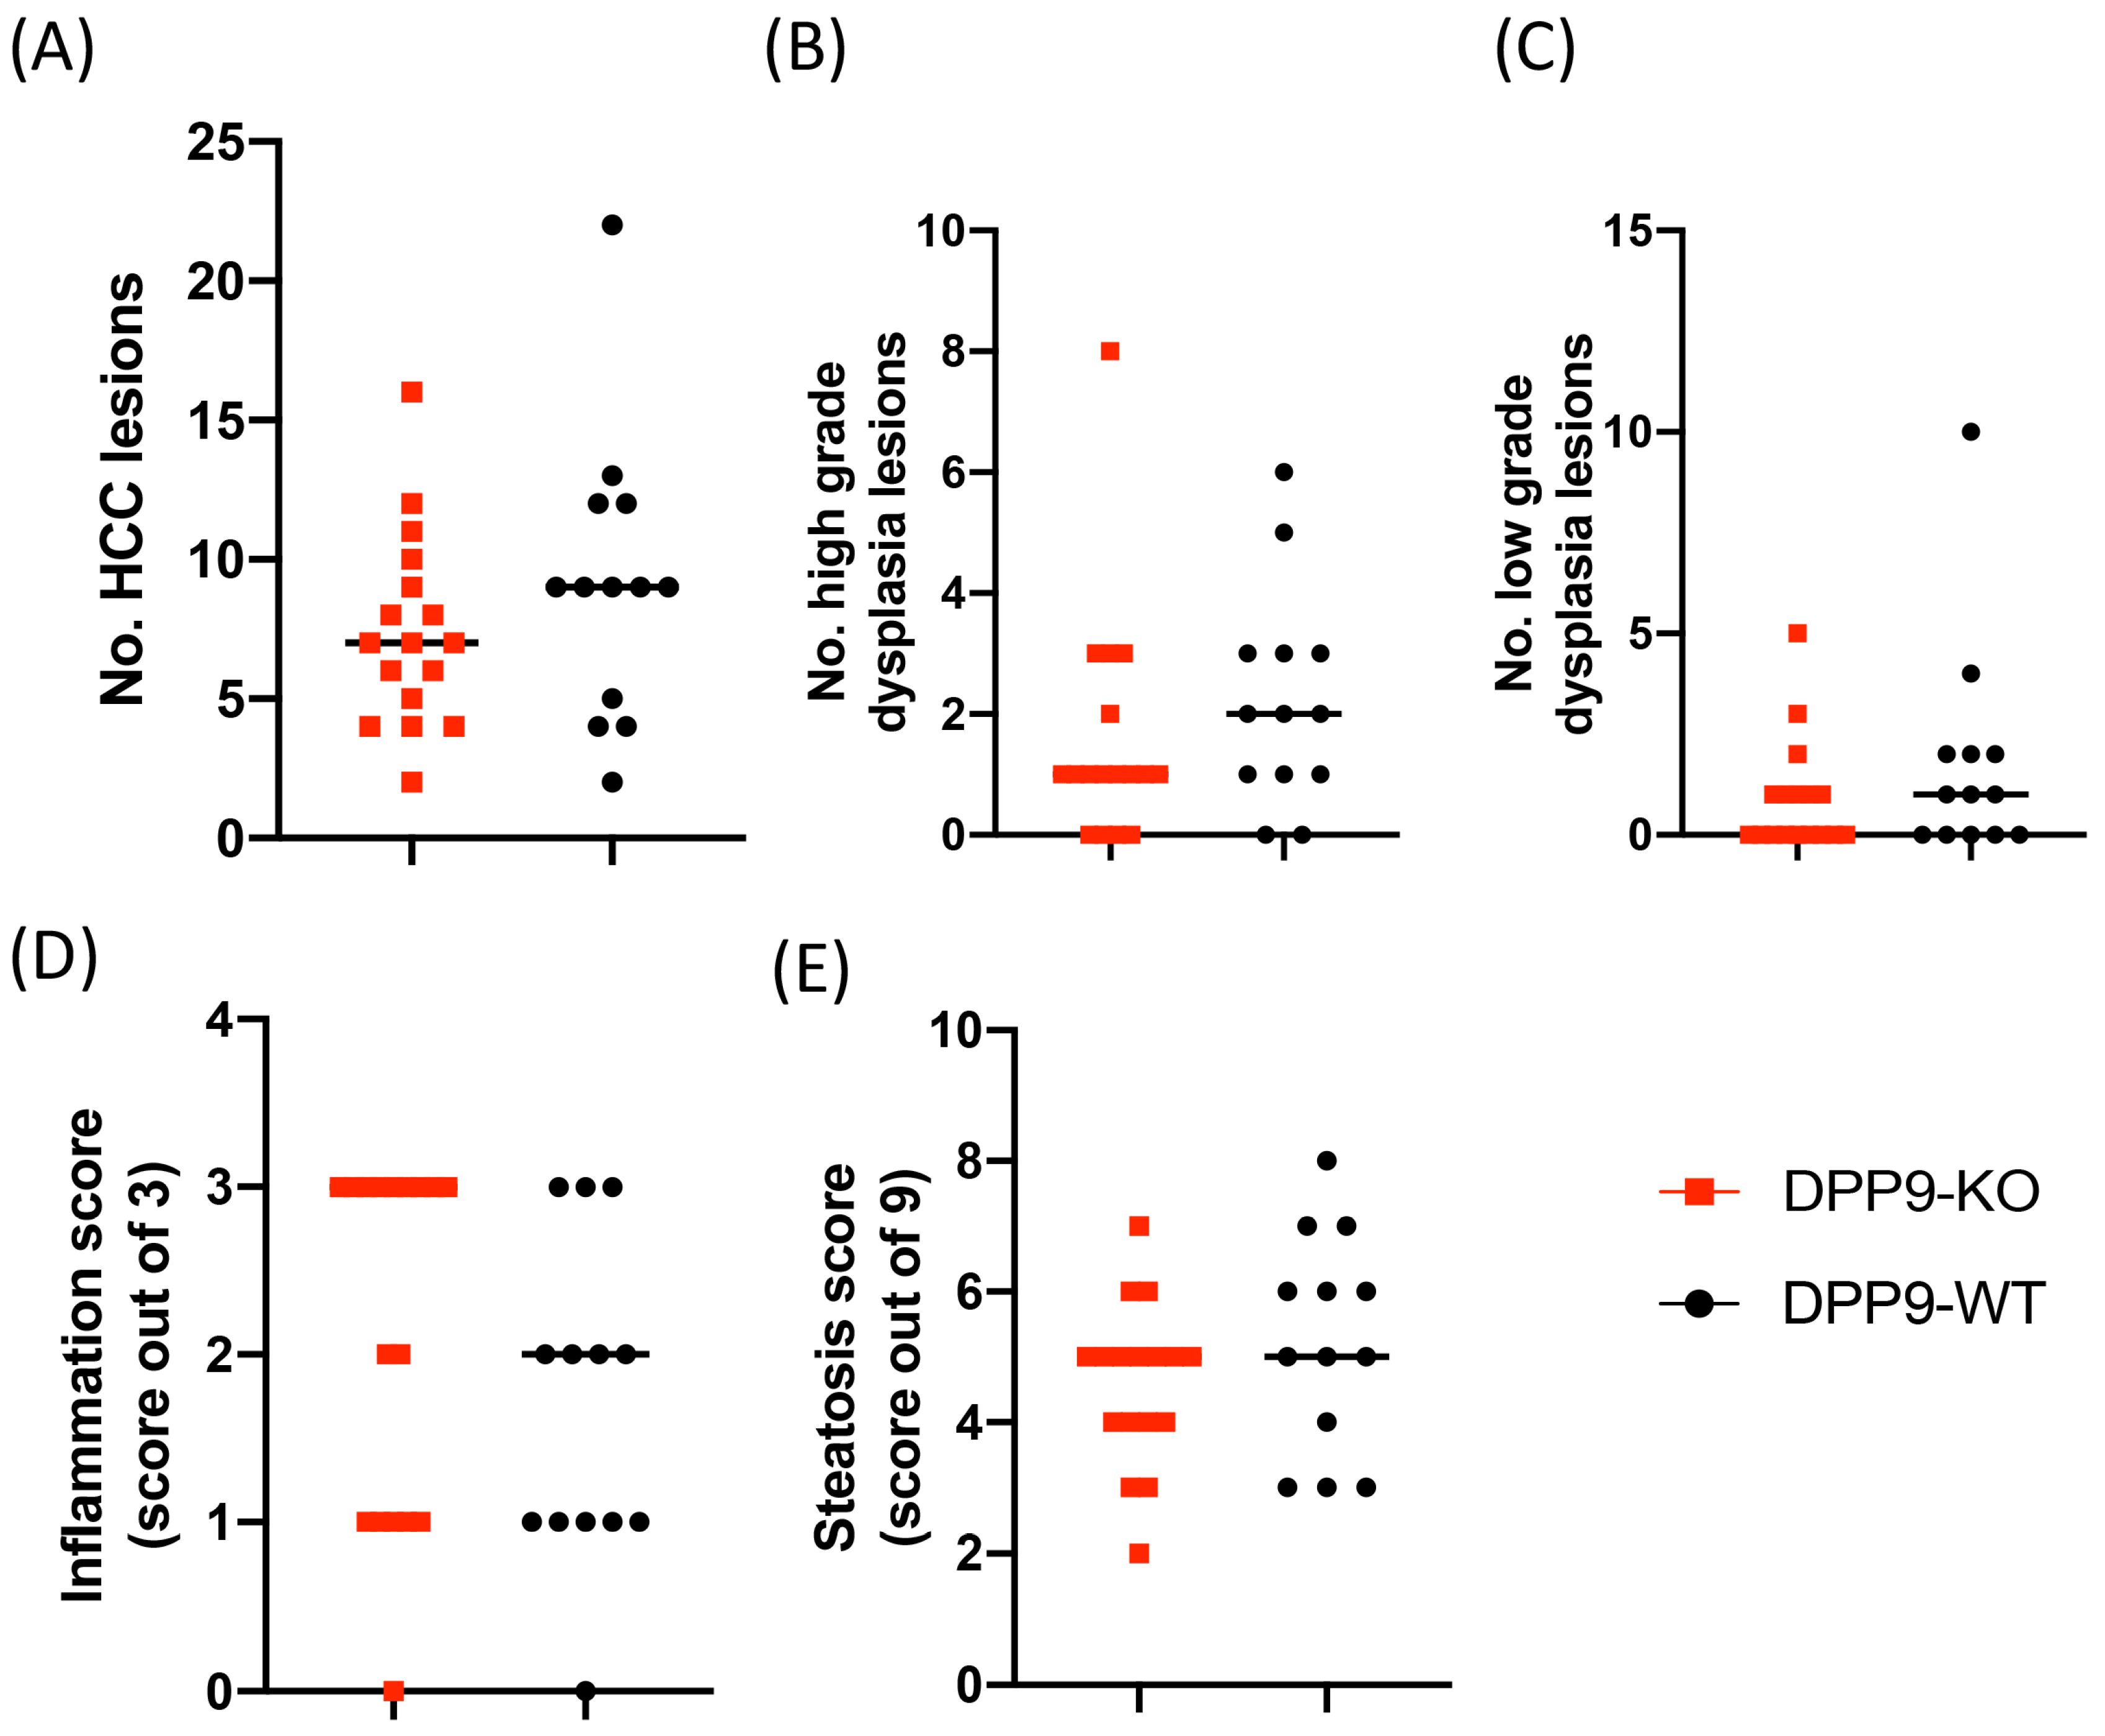
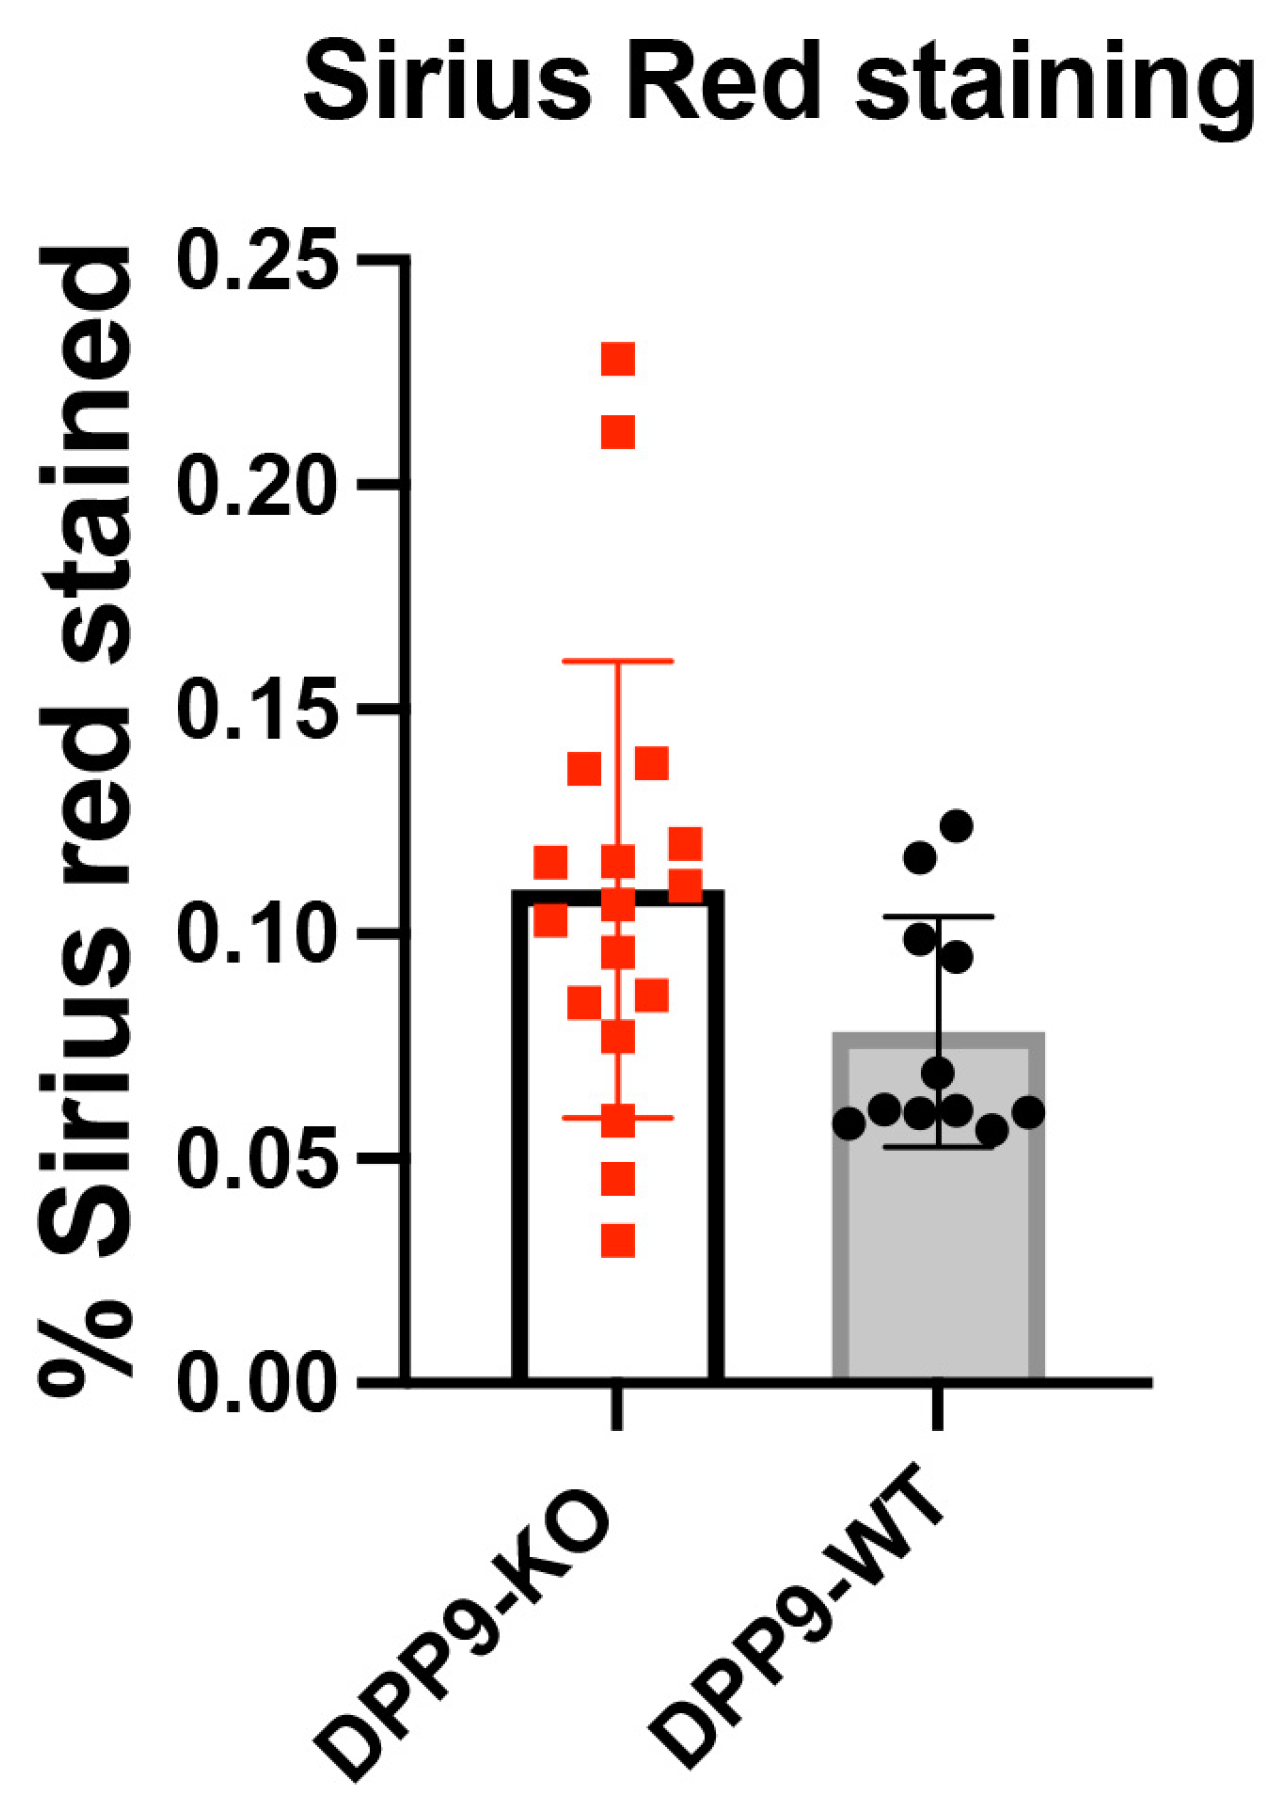
3.3. DPP9 and Cancer Burden
3.4. DPP9 and Inflammasomes Regulation
3.5. Intrahepatic Gene Expression Other than Inflammasome Related Genes
3.6. Autophagy and DNA Repair
4. Discussion
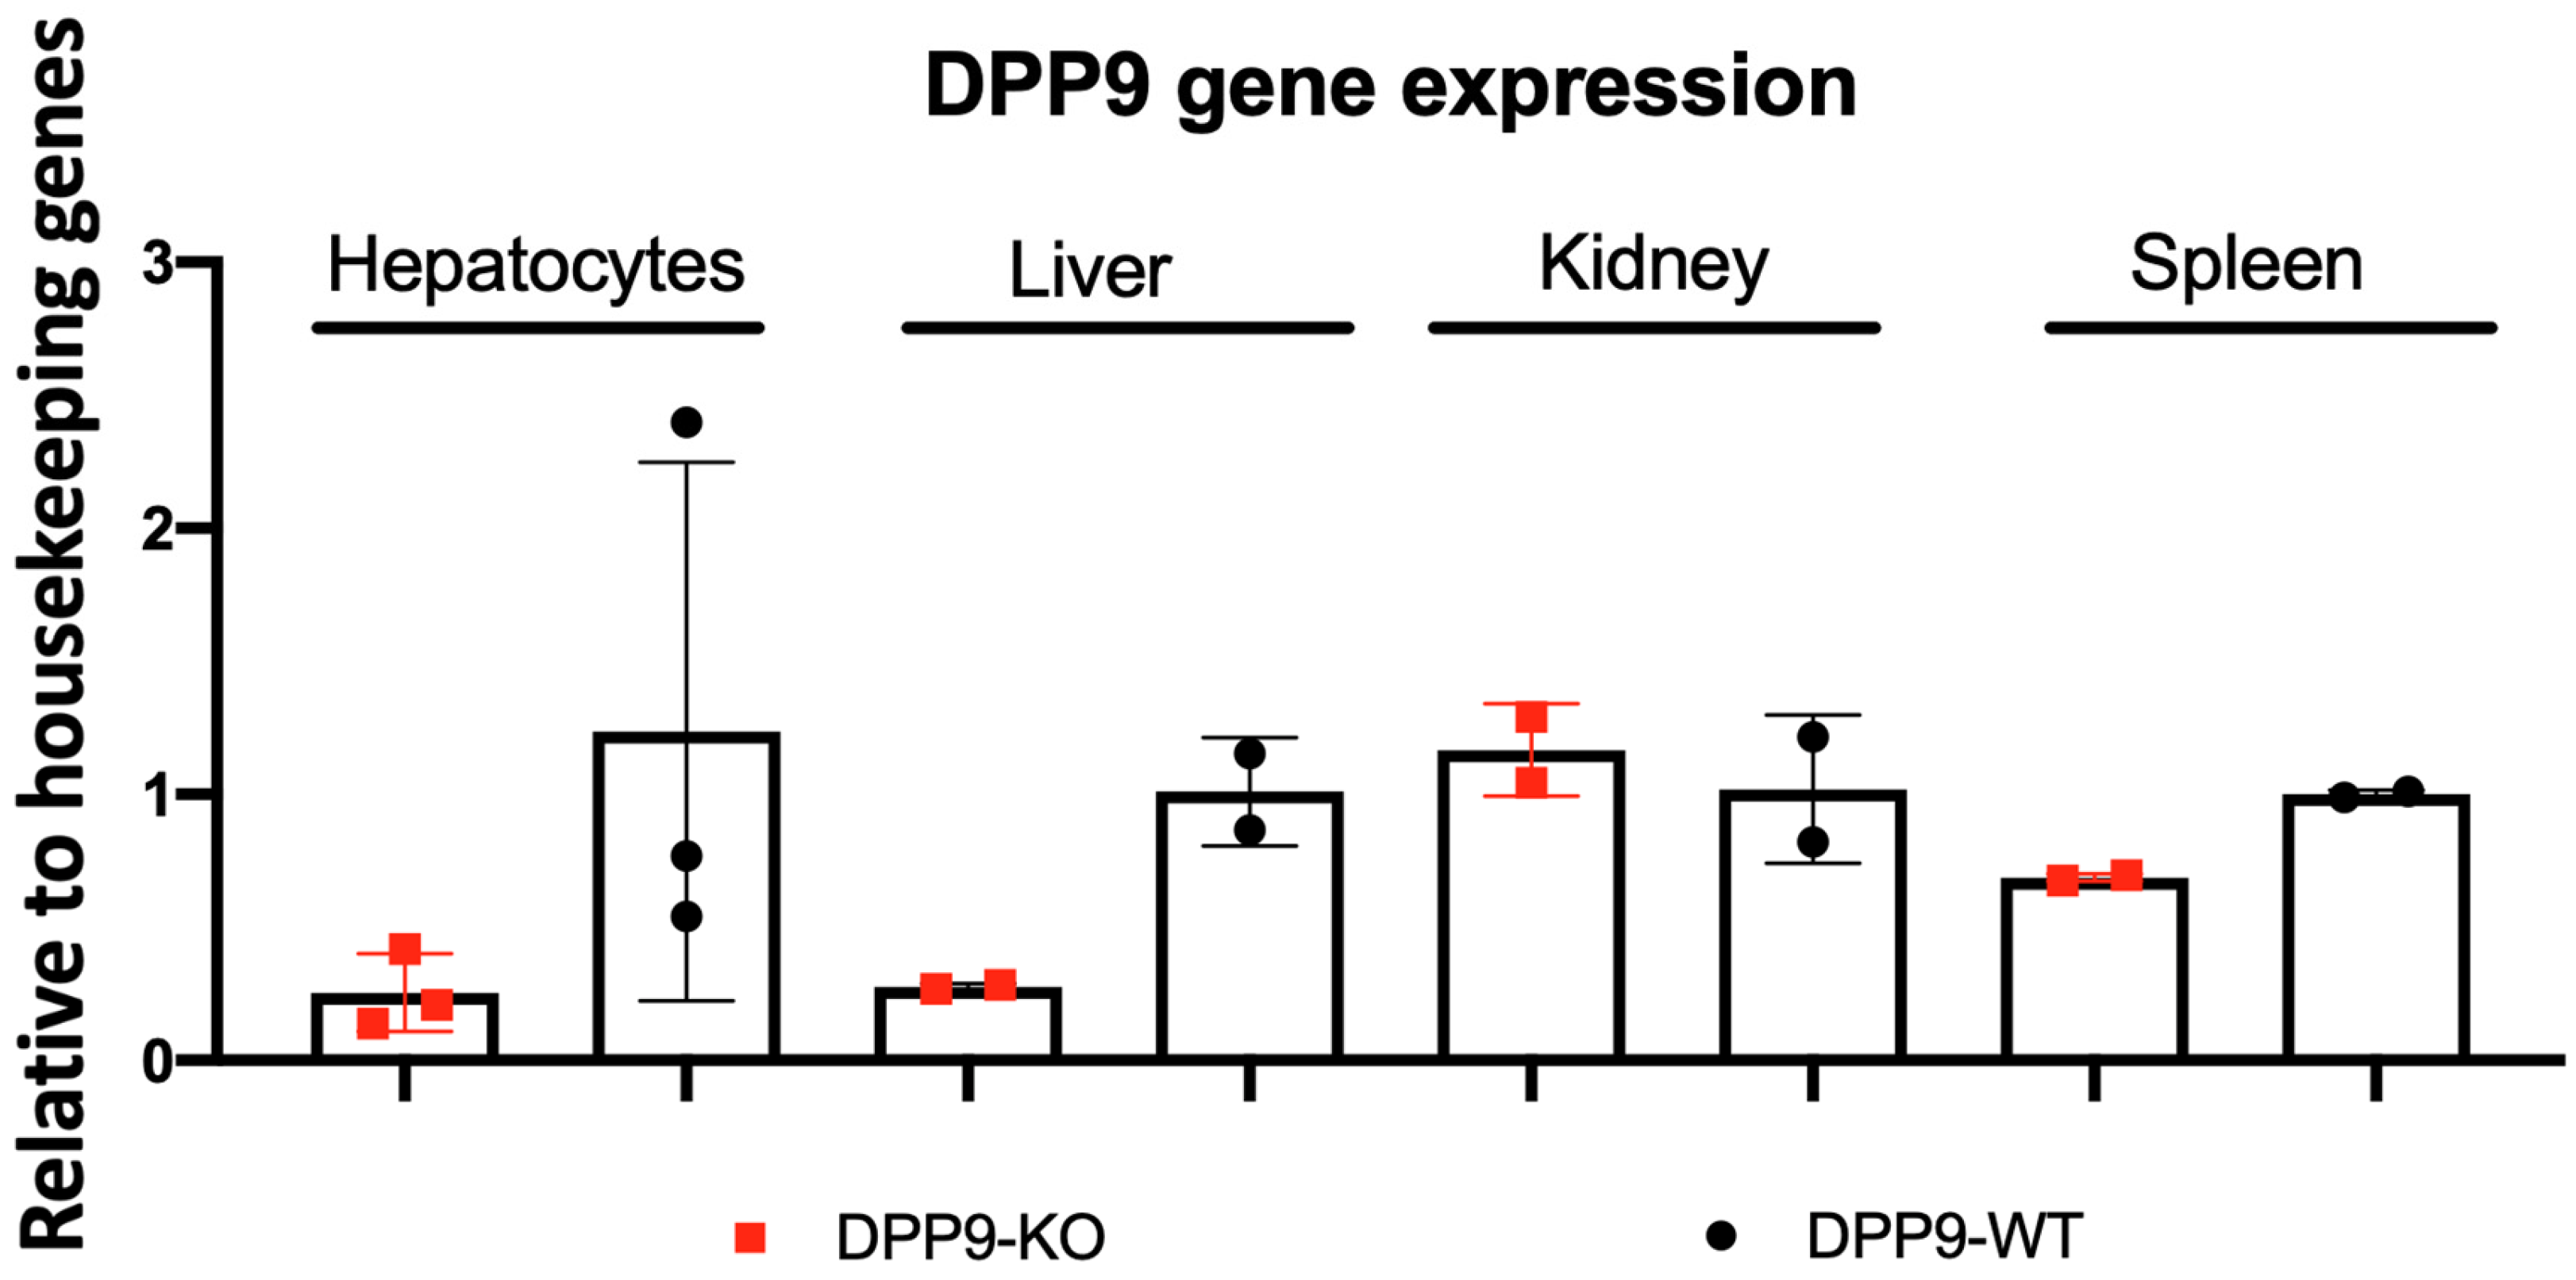
Validation of DPP9-KO Model
DPP9 and Liver Inflammation
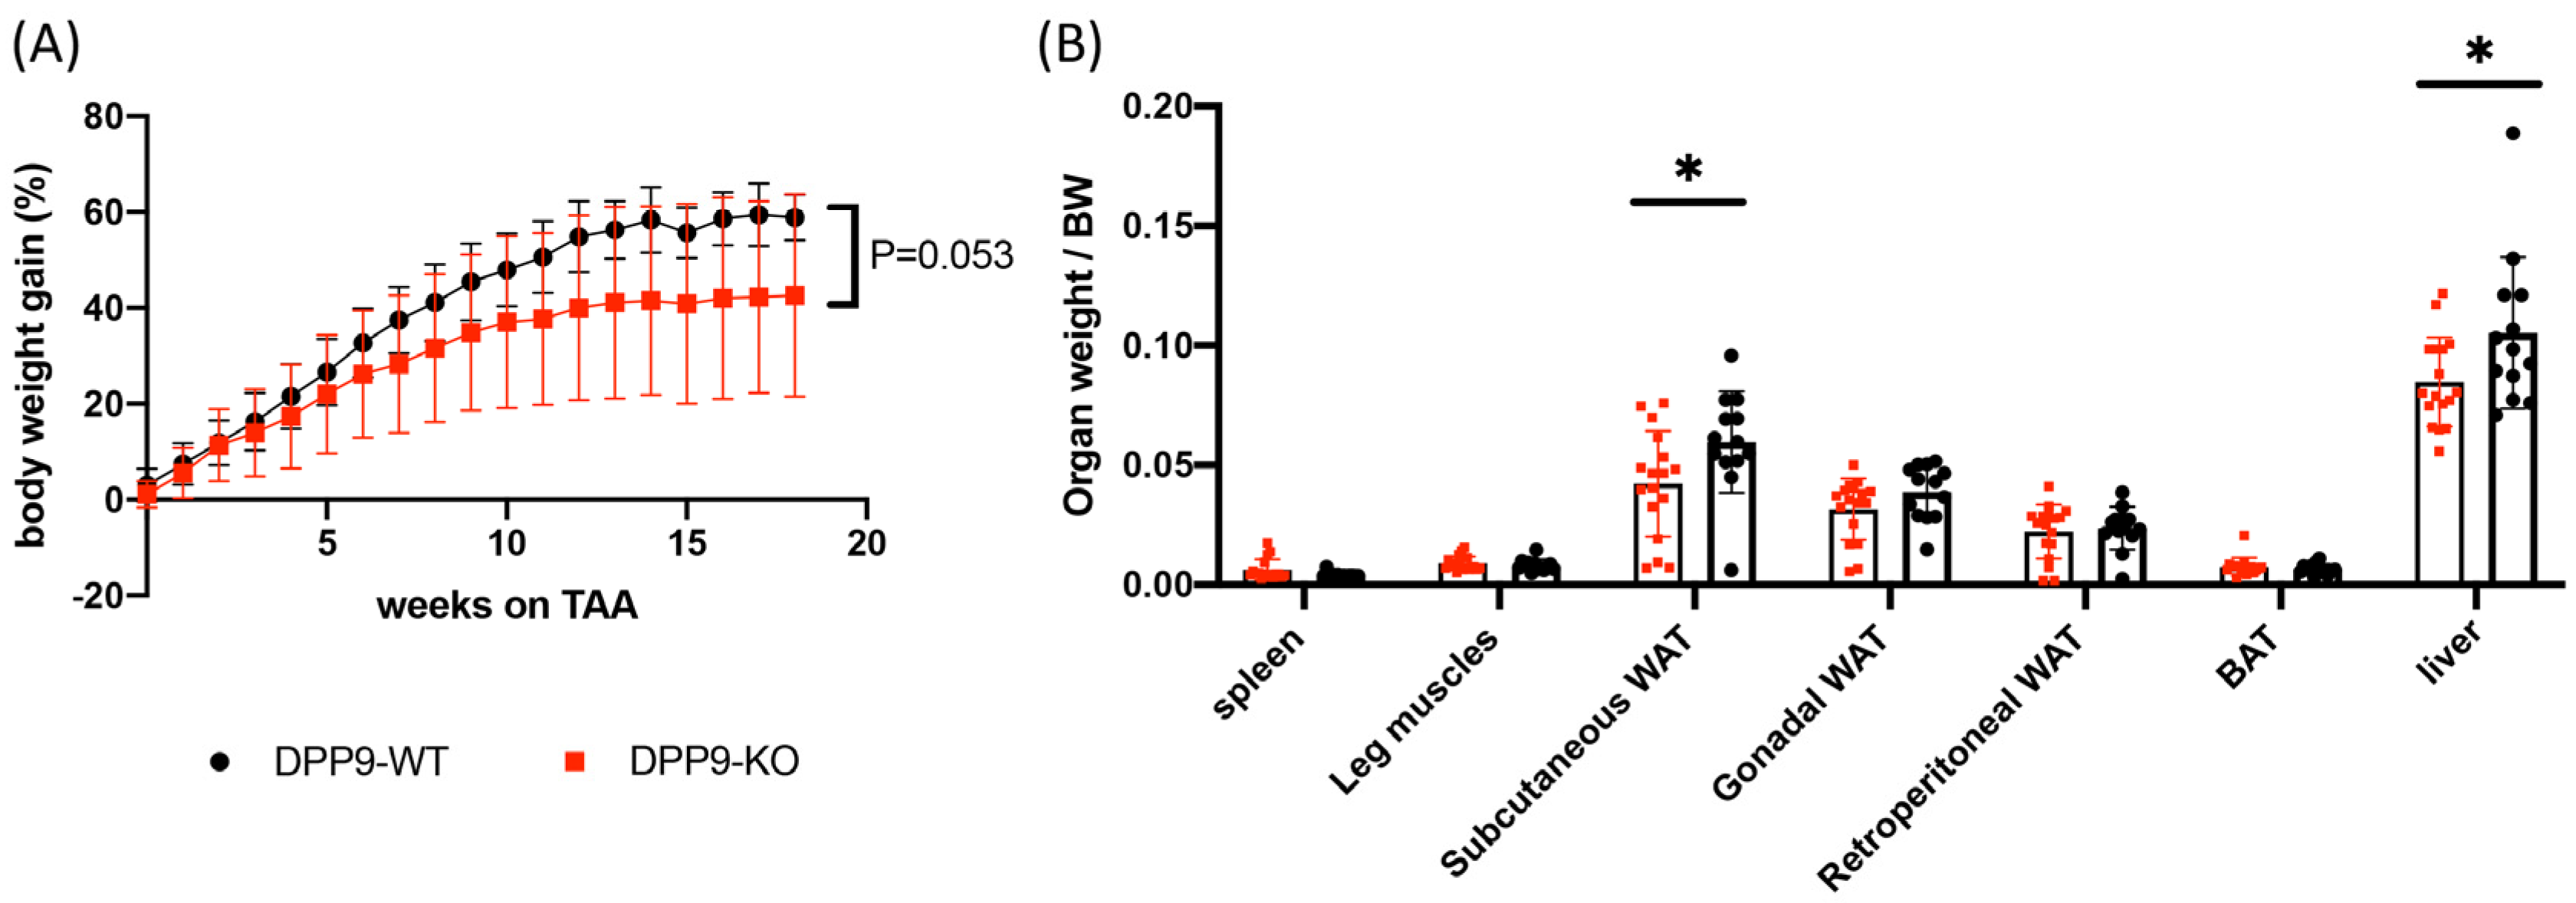
DPP9 and Adipose Tissue
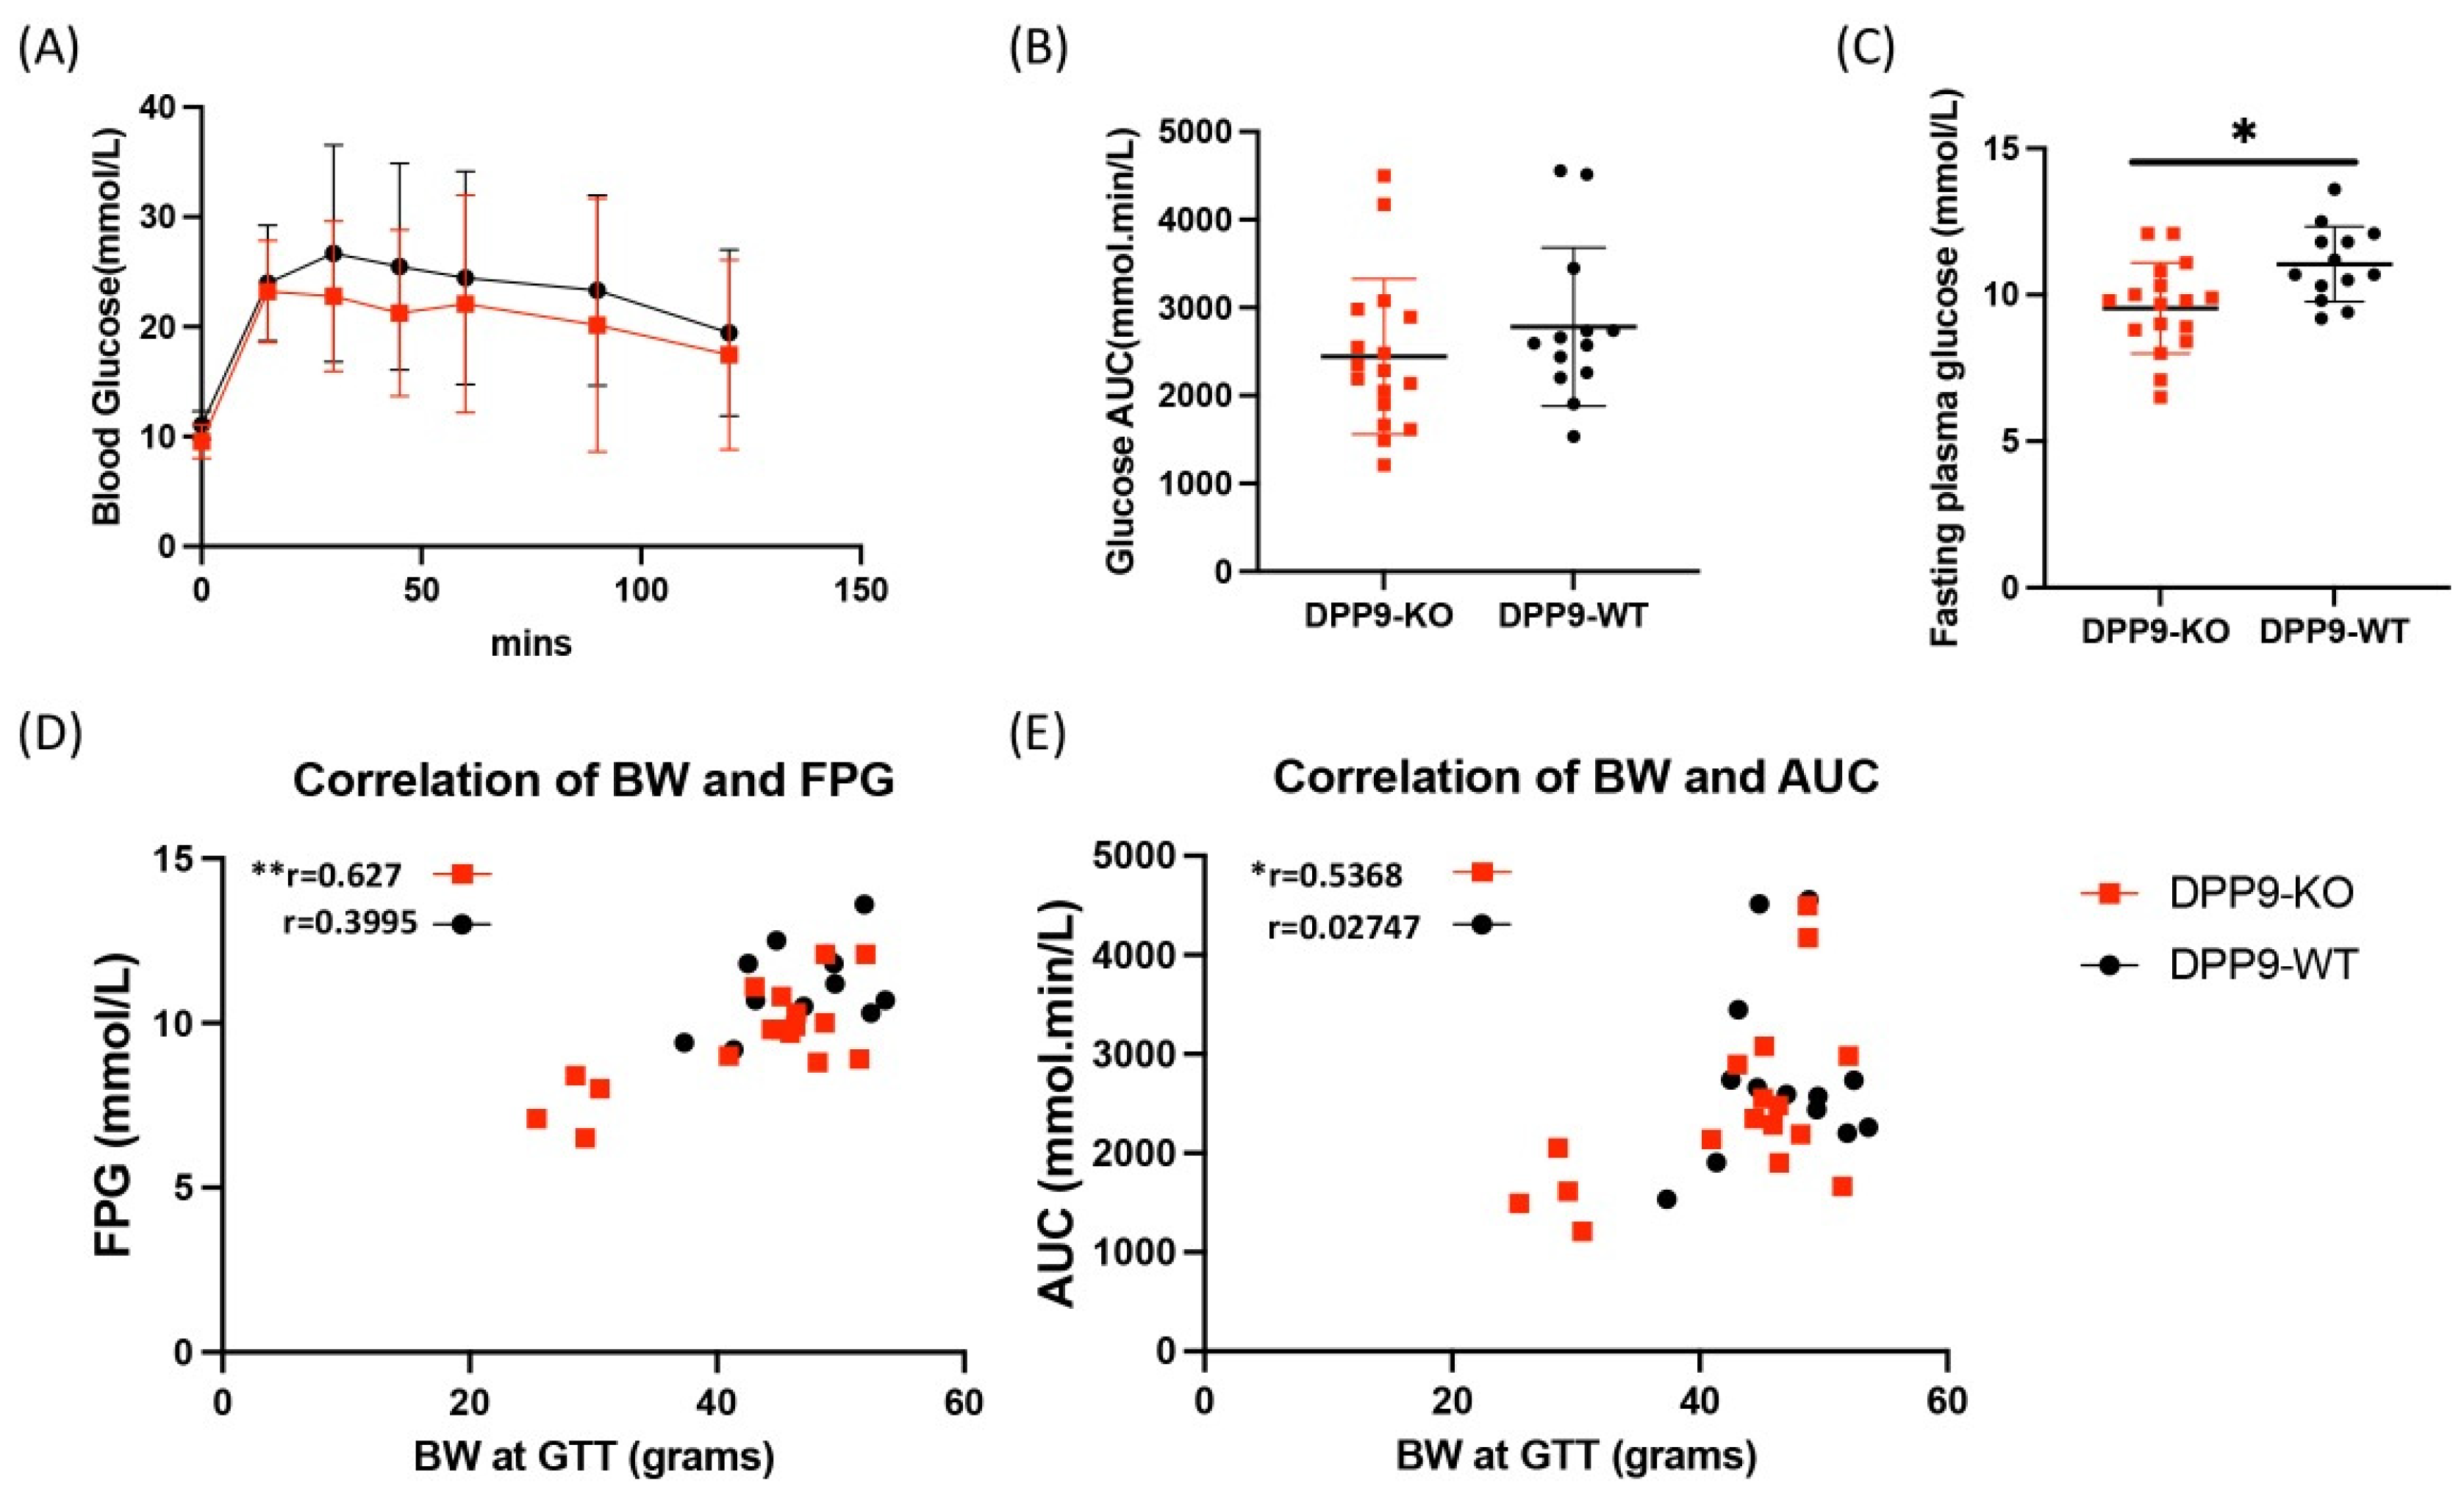
DPP9 and Glucose Metabolism
DPP9 and Beclin-1
DPP9 and Liver Tumor Growth
5. Conclusions
Author Contributions
Funding
Institutional Review Board Statement
Data Availability Statement
Acknowledgments
Conflicts of Interest
References
- Bray, F.; Ferlay, J.; Soerjomataram, I.; Siegel, R.L.; Torre, L.A.; Jemal, A. Global cancer statistics 2018: GLOBOCAN estimates of incidence and mortality worldwide for 36 cancers in 185 countries. CA Cancer J Clin 2018, 68, 394-424. [CrossRef]
- Chhikara, B.S.; Parang, K. Global Cancer Statistics 2022: the trends projection analysis. Chemical Biology Letters 2023, 10, 451-451.
- Wallace, M.C.; Preen, D.B.; Short, M.W.; Adams, L.A.; Jeffrey, G.P. Hepatocellular carcinoma in Australia 1982-2014: Increasing incidence and improving survival. Liver Int 2019, 39, 522-530. [CrossRef]
- Brar, G.; Greten, T.F.; Graubard, B.I.; McNeel, T.S.; Petrick, J.L.; McGlynn, K.A.; Altekruse, S.F. Hepatocellular carcinoma survival by etiology: a SEER-Medicare database analysis. Hepatology communications 2020, 4, 1541-1551. [CrossRef]
- Chrysavgis, L.; Giannakodimos, I.; Diamantopoulou, P.; Cholongitas, E. Non-alcoholic fatty liver disease and hepatocellular carcinoma: Clinical challenges of an intriguing link. World Journal of Gastroenterology 2022, 28, 310. [CrossRef]
- Llovet, J.M.; Decaens, T.; Raoul, J.-L.; Boucher, E.; Kudo, M.; Chang, C.; Kang, Y.-K.; Assenat, E.; Lim, H.-Y.; Boige, V. Brivanib in patients with advanced hepatocellular carcinoma who were intolerant to sorafenib or for whom sorafenib failed: results from the randomized phase III BRISK-PS study. Journal of Clinical Oncology 2013, 31, 3509-3516. [CrossRef]
- Kudo, M.; Finn, R.S.; Qin, S.; Han, K.-H.; Ikeda, K.; Cheng, A.-L.; Piscaglia, F.; Ueshima, K.; Aikata, H.; Vogel, A. Analysis of survival and objective response (OR) in patients with hepatocellular carcinoma in a phase III study of lenvatinib (REFLECT). 2019. [CrossRef]
- El-Khoueiry, A.B.; Sangro, B.; Yau, T.; Crocenzi, T.S.; Kudo, M.; Hsu, C.; Kim, T.-Y.; Choo, S.-P.; Trojan, J.; Welling, T.H.; et al. Nivolumab in patients with advanced hepatocellular carcinoma (CheckMate 040): an open-label, non-comparative, phase 1/2 dose escalation and expansion trial. The Lancet 2017, 389, 2492-2502. [CrossRef]
- Finn, R.S.; Qin, S.; Ikeda, M.; Galle, P.R.; Ducreux, M.; Kim, T.-Y.; Kudo, M.; Breder, V.; Merle, P.; Kaseb, A.O.; et al. Atezolizumab plus Bevacizumab in Unresectable Hepatocellular Carcinoma. New England Journal of Medicine 2020, 382, 1894-1905. [CrossRef]
- Dunaevsky, Y.E.; Tereshchenkova, V.F.; Oppert, B.; Belozersky, M.A.; Filippova, I.Y.; Elpidina, E.N. Human proline specific peptidases: A comprehensive analysis. Biochimica et Biophysica Acta (BBA) - General Subjects 2020, 1864, 129636. [CrossRef]
- Man, K.-F.; Ma, S. Mechanisms of resistance to tyrosine kinase inhibitors in liver cancer stem cells and potential therapeutic approaches. Essays in biochemistry 2022, 66, 371-386. [CrossRef]
- Zhang, C.h.; Cheng, Y.; Zhang, S.; Fan, J.; Gao, Q. Changing epidemiology of hepatocellular carcinoma in Asia. Liver International 2022, 42, 2029-2041. [CrossRef]
- Brunt, E.M. Histopathologic features of hepatocellular carcinoma. Clinical liver disease 2013, 1, 194-199. [CrossRef]
- WHO Classification of Tumours Editorial Board. Digestive System Tumours in WHO Classification of Tumours, 5th Edition; IARC Publications: Lyon, France, 2019; Chapter 8, pp. 235-237, ISBN 978-92-832-4499-8.
- Dhanasekaran, R.; Bandoh, S.; Roberts, L. Molecular pathogenesis of hepatocellular carcinoma and impact of therapeutic advances [version 1; peer review: 4 approved]. F1000Research 2016, 5. [CrossRef]
- Libbrecht, L.; Desmet, V.; Roskams, T. Preneoplastic lesions in human hepatocarcinogenesis. Liver International 2005, 25, 16-27. [CrossRef]
- Thoolen, B.; Ten Kate, F.J.W.; van Diest, P.J.; Malarkey, D.E.; Elmore, S.A.; Maronpot, R.R. Comparative histomorphological review of rat and human hepatocellular proliferative lesions. Journal of toxicologic pathology 2012, 25, 189-199. [CrossRef]
- Röhrborn, D.; Eckel, J.; Sell, H. Shedding of dipeptidyl peptidase 4 is mediated by metalloproteases and up-regulated by hypoxia in human adipocytes and smooth muscle cells. FEBS Letters 2014, 588, 3870-3877. [CrossRef]
- Sakamoto, Y.; Mafune, K.; Mori, M.; Shiraishi, T.; Imamura, H.; Mori, M.; Takayama, T.; Makuuchi, M. Overexpression of MMP-9 correlates with growth of small hepatocellular carcinoma. Int J Oncol 2000, 17, 237-243. [CrossRef]
- Zhang; Chen, X.; Zhou, J.; Zhang, L.; Zhao, Q.; Chen, G.; Xu, J.; Qian, F.; Chen, Z. Zhang Q, Chen X, Zhou J, Zhang L, Zhao Q, Chen G, Xu J, Qian F, Chen ZNCD147, MMP-2, MMP-9 and MVD-CD34 are significant predictors of recurrence after liver transplantation in hepatocellular carcinoma patients. Cancer Biol Ther 5: 808-814. Cancer biology & therapy 2006, 5, 808-814. [CrossRef]
- Santos, A.M.; Jung, J.; Aziz, N.; Kissil, J.L.; Puré, E. Targeting fibroblast activation protein inhibits tumor stromagenesis and growth in mice. J Clin Invest 2009, 119, 3613-3625. [CrossRef]
- Williams, K.H.; Viera de Ribeiro, A.J.; Prakoso, E.; Veillard, A.S.; Shackel, N.A.; Bu, Y.; Brooks, B.; Cavanagh, E.; Raleigh, J.; McLennan, S.V.; et al. Lower serum fibroblast activation protein shows promise in the exclusion of clinically significant liver fibrosis due to non-alcoholic fatty liver disease in diabetes and obesity. Diabetes Res Clin Pract 2015, 108, 466-472. [CrossRef]
- Zhang; Chen; Wadham, C.; McCaughan, G.W.; Keane, F.M.; Gorrell, M.D. Dipeptidyl peptidase 9 subcellular localization and a role in cell adhesion involving focal adhesion kinase and paxillin. Biochim Biophys Acta 2015, 1853, 470-480. [CrossRef]
- Zhang; Maqsudi, S.; Rainczuk, A.; Duffield, N.; Lawrence, J.; Keane, F.M.; Justa-Schuch, D.; Geiss-Friedlander, R.; Gorrell, M.D.; Stephens, A.N. Identification of novel dipeptidyl peptidase 9 substrates by two-dimensional differential in-gel electrophoresis. Febs j 2015, 282, 3737-3757. [CrossRef]
- Abbott, C.A.; Gorrell, M.D. Dipeptidyl peptidases. 2001.
- Ajami; Abbott, C.A.; McCaughan, G.W.; Gorrell, M.D. Dipeptidyl peptidase 9 has two forms, a broad tissue distribution, cytoplasmic localization and DPIV-like peptidase activity. Biochim Biophys Acta 2004, 1679, 18-28. [CrossRef]
- Qi; Riviere, P.J.; Trojnar, J.; Junien, J.L.; Akinsanya, K.O. Cloning and characterization of dipeptidyl peptidase 10, a new member of an emerging subgroup of serine proteases. Biochem J 2003, 373, 179-189. [CrossRef]
- Abbott, C.A.; Yu, D.M.; Woollatt, E.; Sutherland, G.R.; McCaughan, G.W.; Gorrell, M.D. Cloning, expression and chromosomal localization of a novel human dipeptidyl peptidase (DPP) IV homolog, DPP8. Eur J Biochem 2000, 267, 6140-6150. [CrossRef]
- Olsen, C.; Wagtmann, N. Identification and characterization of human DPP9, a novel homologue of dipeptidyl peptidase IV. Gene 2002, 299, 185-193. [CrossRef]
- Zhang; Chen; Keane, F.M.; Gorrell, M.D. Advances in understanding the expression and function of dipeptidyl peptidase 8 and 9. Mol Cancer Res 2013, 11, 1487-1496. [CrossRef]
- Postic, C.; Magnuson, M.A. DNA excision in liver by an albumin-Cre transgene occurs progressively with age. Genesis 2000, 26, 149-150. [CrossRef]
- Zhang, H.; Chen, Y.; Keane, F.M.; Gorrell, M.D. Advances in understanding the expression and function of dipeptidyl peptidase 8 and 9. Molecular Cancer Research 2013, 11, 1487-1496. [CrossRef]
- Kurokawa; Matoba, R.; Takemasa, I.; Nakamori, S.; Tsujie, M.; Nagano, H.; Dono, K.; Umeshita, K.; Sakon, M.; Ueno, N.; et al. Molecular features of non-B, non-C hepatocellular carcinoma: a PCR-array gene expression profiling study. J Hepatol 2003, 39, 1004-1012. [CrossRef]
- Chowdhury, S.; Chen, Y.; Yao, T.W.; Ajami, K.; Wang, X.M.; Popov, Y.; Schuppan, D.; Bertolino, P.; McCaughan, G.W.; Yu, D.M.; et al. Regulation of dipeptidyl peptidase 8 and 9 expression in activated lymphocytes and injured liver. World J Gastroenterol 2013, 19, 2883-2893. [CrossRef]
- Tang; Li, J.; Shen, Q.; Feng, J.; Liu, H.; Wang, W.; Xu, L.; Shi, G.; Ye, X.; Ge, M.; et al. Contribution of upregulated dipeptidyl peptidase 9 (DPP9) in promoting tumoregenicity, metastasis and the prediction of poor prognosis in non-small cell lung cancer (NSCLC). Int J Cancer 2017, 140, 1620-1632. [CrossRef]
- Fitzgerald, A.A.; Wang, S.; Agarwal, V.; Marcisak, E.F.; Zuo, A.; Jablonski, S.A.; Loth, M.; Fertig, E.J.; MacDougall, J.; Zhukovsky, E.; et al. DPP inhibition alters the CXCR3 axis and enhances NK and CD8+ T cell infiltration to improve anti-PD1 efficacy in murine models of pancreatic ductal adenocarcinoma. Journal for ImmunoTherapy of Cancer 2021, 9, e002837. [CrossRef]
- Duncan, B.B.; Highfill, S.L.; Qin, H.; Bouchkouj, N.; Larabee, S.; Zhao, P.; Woznica, I.; Liu, Y.; Li, Y.; Wu, W.; et al. A pan-inhibitor of DASH family enzymes induces immune-mediated regression of murine sarcoma and is a potent adjuvant to dendritic cell vaccination and adoptive T-cell therapy. J Immunother 2013, 36, 400-411. [CrossRef]
- Finger, Y.; Habich, M.; Gerlich, S.; Urbanczyk, S.; van de Logt, E.; Koch, J.; Schu, L.; Lapacz, K.J.; Ali, M.; Petrungaro, C.; et al. Proteasomal degradation induced by DPP9-mediated processing competes with mitochondrial protein import. EMBO Journal 2020, e103889. [CrossRef]
- Suski, M.; Wiśniewska, A.; Kuś, K.; Kiepura, A.; Stachowicz, A.; Stachyra, K.; Czepiel, K.; Madej, J.; Olszanecki, R. Decrease of the pro-inflammatory M1-like response by inhibition of dipeptidyl peptidases 8/9 in THP-1 macrophages – quantitative proteomics of the proteome and secretome. Molecular Immunology 2020, 127, 193-202. [CrossRef]
- Chen, Y.; Gall, M.G.; Zhang, H.; Keane, F.M.; McCaughan, G.W.; Yu, D.M.; Gorrell, M.D. Dipeptidyl peptidase 9 enzymatic activity influences the expression of neonatal metabolic genes. Experimental Cell Research 2016, 342, 72-82. [CrossRef]
- Bachovchin, D.A. NLRP1: a jack of all trades, or a master of one? Molecular Cell 2021, 81, 423-425. [CrossRef]
- Bolgi, O.; Silva-Garcia, M.; Ross, B.; Pilla, E.; Kari, V.; Killisch, M.; Spitzner, M.; Stark, N.; Lenz, C.; Weiss, K.; et al. Dipeptidyl peptidase 9 triggers BRCA2 degradation and promotes DNA-damage repair. EMBO Reports 2022, 23, e54136. [CrossRef]
- Duncan, B.B.; Highfill, S.L.; Qin, H.; Bouchkouj, N.; Larabee, S.; Zhao, P.; Woznica, I.; Liu, Y.; Li, Y.; Wu, W.; et al. A pan-inhibitor of DASH family enzymes induces immune-mediated regression of murine sarcoma and is a potent adjuvant to dendritic cell vaccination and adoptive T-cell therapy. Journal of Immunotherapy 2013, 36, 400-411. [CrossRef]
- Henderson; Polak, N.; Chen, J.; Roediger, B.; Weninger, W.; Kench, J.G.; McCaughan, G.W.; Zhang, H.E.; Gorrell, M.D. Multiple liver insults synergize to accelerate experimental hepatocellular carcinoma. Sci Rep 2018, 8, 10283. [CrossRef]
- Griswold, A.R.; Huang, H.-C.; Bachovchin, D.A. The NLRP1 Inflammasome Induces Pyroptosis in Human Corneal Epithelial Cells. Investigative Ophthalmology & Visual Science 2022, 63, 2-2. [CrossRef]
- He, H.; Wang, W.; Li, L.; Zhang, X.; Shi, H.; Chen, J.; Shi, D.; Xue, M.; Feng, L. Activation of the NLRP1 Inflammasome and Its Role in Transmissible Gastroenteritis Coronavirus Infection. J Virology 2023, e0058923. [CrossRef]
- Benramdane, S.; De Loose, J.; Filippi, N.; Espadinha, M.; Beyens, O.; Rymenant, Y.V.; Dirkx, L.; Bozdag, M.; Feijens, P.-B.; Augustyns, K.; et al. Highly Selective Inhibitors of Dipeptidyl Peptidase 9 (DPP9) Derived from the Clinically Used DPP4-Inhibitor Vildagliptin. Journal of Medicinal Chemistry 2023, in press. [CrossRef]
- Gall, M.G.; Chen, Y.; Ribeiro, A.J.V.d.; Zhang, H.; Bailey, C.G.; Spielman, D.; Yu, D.M.; Gorrell, M.D. Targeted inactivation of Dipeptidyl Peptidase 9 enzyme activity causes mouse neonate lethality. PLOS ONE 2013, 8, e0078378. [CrossRef]
- Harapas, C.R.; Robinson, K.S.; Lay, K.; Wong, J.; Moreno Traspas, R.; Nabavizadeh, N.; Rass-Rothschild, A.; Boisson, B.; Drutman, S.B.; Laohamonthonkul, P.; et al. DPP9 deficiency: An inflammasomopathy that can be rescued by lowering NLRP1/IL-1 signaling. Science Immunology 2022, 7, eabi4611. [CrossRef]
- Huang, J.C.; Emran, A.A.; Endaya, J.M.; McCaughan, G.W.; Gorrell, M.D.; Zhang, H.E. DPP9: Comprehensive In Silico Analyses of Loss of Function Gene Variants and Associated Gene Expression Signatures in Human Hepatocellular Carcinoma. Cancers 2021, 13, 1637. [CrossRef]
- Rodríguez, C.I.; Buchholz, F.; Galloway, J.; Sequerra, R.; Kasper, J.; Ayala, R.; Stewart, A.F.; Dymecki, S.M. High-efficiency deleter mice show that FLPe is an alternative to Cre-loxP. Nature Genetics 2000, 25, 139-140. [CrossRef]
- Henderson, J.M.; Xiang, M.S.W.; Huang, J.C.; Wetzel, S.; Jiang, L.; Lai, J.H.; Wu, W.; Kench, J.G.; Bachovchin, W.W.; Roediger, B.; et al. Dipeptidyl Peptidase Inhibition Enhances CD8 T Cell Recruitment and Activates Intrahepatic Inflammasome in a Murine Model of Hepatocellular Carcinoma. Cancers 2021, 13, 5495. [CrossRef]
- Nunemaker, C.S.; Chen, M.; Pei, H.; Kimble, S.D.; Keller, S.R.; Carter, J.D.; Yang, Z.; Smith, K.M.; Wu, R.; Bevard, M.H.; et al. 12-Lipoxygenase-knockout mice are resistant to inflammatory effects of obesity induced by Western diet. Am J Physiol Endocrinol Metab 2008, 295, E1065-E1075. [CrossRef]
- Warren, A.; Le Couteur, D.G.; Fraser, R.; Bowen, D.G.; McCaughan, G.W.; Bertolino, P. T lymphocytes interact with hepatocytes through fenestrations in murine liver sinusoidal endothelial cells. Hepatology 2006, 44, 1182-1190. [CrossRef]
- Gall; Chen, Y.; Vieira de Ribeiro, A.J.; Zhang, H.; Bailey, C.G.; Spielman, D.S.; Yu, D.M.; Gorrell, M.D. Targeted inactivation of dipeptidyl peptidase 9 enzymatic activity causes mouse neonate lethality. PLoS One 2013, 8, e78378. [CrossRef]
- Wang; Holz, L.E.; Chowdhury, S.; Cordoba, S.P.; Evans, K.A.; Gall, M.G.; Vieira de Ribeiro, A.J.; Zheng, Y.Z.; Levy, M.T.; Yu, D.M.; et al. The pro-fibrotic role of dipeptidyl peptidase 4 in carbon tetrachloride-induced experimental liver injury. Immunol Cell Biol 2017, 95, 443-453. [CrossRef]
- Bergsbaken, T.; Fink, S.L.; Cookson, B.T. Pyroptosis: host cell death and inflammation. Nature Reviews. Microbiology 2009, 7, 99-109. [CrossRef]
- Zhong, F.L.; Robinson, K.; Teo, D.E.T.; Tan, K.-Y.; Lim, C.; Harapas, C.R.; Yu, C.-H.; Xie, W.H.; Sobota, R.M.; Au, V.B.; et al. Human DPP9 represses NLRP1 inflammasome and protects against autoinflammatory diseases via both peptidase activity and FIIND domain binding. J Biol Chem 2018, 293, 18864-18878. [CrossRef]
- Johnson, D.C.; Okondo, M.C.; Orth, E.L.; Rao, S.D.; Huang, H.-C.; Ball, D.P.; Bachovchin, D.A. DPP8/9 inhibitors activate the CARD8 inflammasome in resting lymphocytes. Cell Death & Disease 2020, 11, 628. [CrossRef]
- Biswas; Mantovani, A. Macrophage plasticity and interaction with lymphocyte subsets: cancer as a paradigm. Nature Immunology 2010, 11, 889-896. [CrossRef]
- Franchi; Amer, A.; Body-Malapel, M.; Kanneganti, T.D.; Ozören, N.; Jagirdar, R.; Inohara, N.; Vandenabeele, P.; Bertin, J.; Coyle, A.; et al. Cytosolic flagellin requires Ipaf for activation of caspase-1 and interleukin 1beta in salmonella-infected macrophages. Nat Immunol 2006, 7, 576-582. [CrossRef]
- de Vasconcelos, N.M.; Vliegen, G.; Gonçalves, A.; De Hert, E.; Martín-Pérez, R.; Van Opdenbosch, N.; Jallapally, A.; Geiss-Friedlander, R.; Lambeir, A.-M.; Augustyns, K.; et al. DPP8/DPP9 inhibition elicits canonical Nlrp1b inflammasome hallmarks in murine macrophages. Life Science Alliance 2019, 2, e201900313. [CrossRef]
- Wei, Q.; Mu, K.; Li, T.; Zhang, Y.; Yang, Z.; Jia, X.; Zhao, W.; Huai, W.; Guo, P.; Han, L. Deregulation of the NLRP3 inflammasome in hepatic parenchymal cells during liver cancer progression. Laboratory Investigation 2014, 94, 52-62. [CrossRef]
- Dickey, J.S.; Redon, C.E.; Nakamura, A.J.; Baird, B.J.; Sedelnikova, O.A.; Bonner, W.M. H2AX: functional roles and potential applications. Chromosoma 2009, 118, 683-692. [CrossRef]
- Kang; Zeh, H.J.; Lotze, M.T.; Tang, D. The Beclin 1 network regulates autophagy and apoptosis. Cell Death & Differentiation 2011, 18, 571-580. [CrossRef]
- Henderson, J.M.; Polak, N.; Chen, J.; Roediger, B.; Weninger, W.; Kench, J.G.; McCaughan, G.W.; Zhang, H.E.; Gorrell, M.D. Multiple liver insults synergize to accelerate experimental hepatocellular carcinoma. Scientific Reports 2018, 8, 10283. [CrossRef]
- Postic, C.; Shiota, M.; Niswender, K.D.; Jetton, T.L.; Chen, Y.; Moates, J.M.; Shelton, K.D.; Lindner, J.; Cherrington, A.D.; Magnuson, M.A. Dual roles for glucokinase in glucose homeostasis as determined by liver and pancreatic beta cell-specific gene knock-outs using Cre recombinase. J Biol Chem 1999, 274, 305-315.
- Okondo, M.C.; Johnson, D.C.; Sridharan, R.; Go, E.B.; Chui, A.J.; Wang, M.S.; Poplawski, S.E.; Wu, W.; Liu, Y.; Lai, J.H.; et al. DPP8 and DPP9 inhibition induces pro-caspase-1-dependent monocyte and macrophage pyroptosis. Nature Chemical Biology 2017, 13, 46-53. [CrossRef]
- Schroder, K.; Tschopp, J. The inflammasomes. Cell 2010, 140, 821-832. [CrossRef]
- Martinon, F.; Burns, K.; Tschopp, J. The inflammasome: a molecular platform triggering activation of inflammatory caspases and processing of proIL-beta. Mol Cell 2002, 10, 417-426. [CrossRef]
- Lamkanfi, M.; Dixit, V.M. Mechanisms and functions of inflammasomes. Cell 2014, 157, 1013-1022. [CrossRef]
- Ajami, K.; Abbott, C.A.; McCaughan, G.W.; Gorrell, M.D. Dipeptidyl peptidase 9 has two forms, a broad tissue distribution, cytoplasmic localization and DPIV-like peptidase activity. Biochimica et Biophysica Acta (BBA) - Gene Structure and Expression 2004, 1679, 18-28. [CrossRef]
- Yu, D.M.T.; Ajami, K.; Gall, M.G.; Park, J.; Lee, C.S.; Evans, K.A.; McLaughlin, E.A.; Pitman, M.R.; Abbott, C.A.; McCaughan, G.W.; et al. The in vivo expression of dipeptidyl peptidases 8 and 9. Journal of Histochemistry and Cytochemistry 2009, 57, 1025-1040. [CrossRef]
- Taabazuing, C.Y.; Okondo, M.C.; Bachovchin, D.A. Pyroptosis and apoptosis pathways engage in bidirectional crosstalk in monocytes and macrophages. Cell Chemical Biology 2017, 24, 507-514.e504. [CrossRef]
- Hayden, M.S.; Ghosh, S. Shared principles in NF-kappaB signaling. Cell 2008, 132, 344-362. [CrossRef]
- Perkins, N.D. Integrating cell-signalling pathways with NF-kappaB and IKK function. Nat Rev Mol Cell Biol 2007, 8, 49-62. [CrossRef]
- Sun, S.C. Non-canonical NF-κB signaling pathway. Cell Res 2011, 21, 71-85. [CrossRef]
- Oeckinghaus, A.; Ghosh, S. The NF-kappaB family of transcription factors and its regulation. Cold Spring Harb Perspect Biol 2009, 1, a000034. [CrossRef]
- Ohmori, Y.; Hamilton, T.A. The interferon-stimulated response element and a kappa B site mediate synergistic induction of murine IP-10 gene transcription by IFN-gamma and TNF-alpha. J Immunol 1995, 154, 5235-5244. [CrossRef]
- Tian, B.; Nowak, D.E.; Jamaluddin, M.; Wang, S.; Brasier, A.R. Identification of direct genomic targets downstream of the nuclear factor-kappaB transcription factor mediating tumor necrosis factor signaling. J Biol Chem 2005, 280, 17435-17448. [CrossRef]
- Zlotnik, A.; Yoshie, O. Chemokines: a new classification system and their role in immunity. Immunity 2000, 12, 121-127. [CrossRef]
- Groom, J.R.; Luster, A.D. CXCR3 ligands: redundant, collaborative and antagonistic functions. Immunol Cell Biol 2011, 89, 207-215. [CrossRef]
- Griffith, J.W.; Sokol, C.L.; Luster, A.D. Chemokines and chemokine receptors: positioning cells for host defense and immunity. Annu Rev Immunol 2014, 32, 659-702. [CrossRef]
- Chen, Y.; Gall, M.G.; Zhang, H.; Keane, F.M.; McCaughan, G.W.; Yu, D.M.T.; Gorrell, M.D. Dipeptidyl peptidase 9 enzymatic activity influences the expression of neonatal metabolic genes. Experimental Cell Research 2016, 342, 72-82. [CrossRef]
- Ke, R.; Xu, Q.; Li, C.; Luo, L.; Huang, D. Mechanisms of AMPK in the maintenance of ATP balance during energy metabolism. Cell Biol Int 2018, 42, 384-392. [CrossRef]
- Han, R.; Wang, X.; Bachovchin, W.; Zukowska, Z.; Osborn, J.W. Inhibition of dipeptidyl peptidase 8/9 impairs preadipocyte differentiation. Scientific Reports 2015, 5, 12348. [CrossRef]
- Siersbaek, R.; Nielsen, R.; Mandrup, S. PPARgamma in adipocyte differentiation and metabolism--novel insights from genome-wide studies. FEBS Lett 2010, 584, 3242-3249. [CrossRef]
- Shirakawa, J.; Fujii, H.; Ohnuma, K.; Sato, K.; Ito, Y.; Kaji, M.; Sakamoto, E.; Koganei, M.; Sasaki, H.; Nagashima, Y.; et al. Diet-induced adipose tissue inflammation and liver steatosis are prevented by DPP-4 inhibition in diabetic mice. Diabetes 2011, 60, 1246-1257. [CrossRef]
- Zhang, H.; Maqsudi, S.; Rainczuk, A.; Duffield, N.; Lawrence, J.; Keane, F.M.; Justa-Schuch, D.; Geiss-Friedlander, R.; Gorrell, M.D.; Stephens, A.N. Identification of novel dipeptidyl peptidase 9 substrates by two-dimensional differential in-gel electrophoresis. FEBS Journal 2015, 282, 3737 -3757. [CrossRef]
- Yamada, M.; Horiguchi, K.; Umezawa, R.; Hashimoto, K.; Satoh, T.; Ozawa, A.; Shibusawa, N.; Monden, T.; Okada, S.; Shimizu, H.; et al. Troglitazone, a ligand of peroxisome proliferator-activated receptor-{gamma}, stabilizes NUCB2 (Nesfatin) mRNA by activating the ERK1/2 pathway: isolation and characterization of the human NUCB2 gene. Endocrinology 2010, 151, 2494-2503. [CrossRef]
- Lu, C.; Tilan, J.U.; Everhart, L.; Czarnecka, M.; Soldin, S.J.; Mendu, D.R.; Jeha, D.; Hanafy, J.; Lee, C.K.; Sun, J.; et al. Dipeptidyl Peptidases as Survival Factors in Ewing Sarcoma Family of Tumors: IMPLICATIONS FOR TUMOR BIOLOGY AND THERAPY *<sup> </sup>. Journal of Biological Chemistry 2011, 286, 27494-27505. [CrossRef]
- Ajami, K.; Pitman, M.R.; Wilson, C.H.; Park, J.; Menz, R.I.; Starr, A.E.; Cox, J.H.; Abbott, C.A.; Overall, C.M.; Gorrell, M.D. Stromal cell-derived factors 1alpha and 1beta, inflammatory protein-10 and interferon-inducible T cell chemo-attractant are novel substrates of dipeptidyl peptidase 8. FEBS Lett 2008, 582, 819-825. [CrossRef]
- Bjelke, J.R.; Christensen, J.; Nielsen, P.F.; Branner, S.; Kanstrup, A.B.; Wagtmann, N.; Rasmussen, H.B. Dipeptidyl peptidases 8 and 9: specificity and molecular characterization compared with dipeptidyl peptidase IV. Biochem J 2006, 396, 391-399. [CrossRef]
- Burkart, A.; Shi, X.; Chouinard, M.; Corvera, S. Adenylate kinase 2 links mitochondrial energy metabolism to the induction of the unfolded protein response. J Biol Chem 2011, 286, 4081-4089. [CrossRef]
- Dzeja, P.; Terzic, A. Adenylate kinase and AMP signaling networks: metabolic monitoring, signal communication and body energy sensing. Int J Mol Sci 2009, 10, 1729-1772. [CrossRef]
- Bettecken, A.; Hess, L.; Hoelzen, L.; Reinheckel, T. Dipeptidyl-Aminopeptidases 8 and 9 Regulate Autophagy and Tamoxifen Response in Breast Cancer Cells. Cells 2023, 12, 2031. [CrossRef]
- Kang, R.; Zeh, H.J.; Lotze, M.T.; Tang, D. The Beclin 1 network regulates autophagy and apoptosis. Cell Death & Differentiation 2011, 18, 571-580. [CrossRef]
- Matsunaga, K.; Saitoh, T.; Tabata, K.; Omori, H.; Satoh, T.; Kurotori, N.; Maejima, I.; Shirahama-Noda, K.; Ichimura, T.; Isobe, T.; et al. Two Beclin 1-binding proteins, Atg14L and Rubicon, reciprocally regulate autophagy at different stages. Nat Cell Biol 2009, 11, 385-396. [CrossRef]
- Funderburk, S.F.; Wang, Q.J.; Yue, Z. The Beclin 1-VPS34 complex--at the crossroads of autophagy and beyond. Trends Cell Biol 2010, 20, 355-362. [CrossRef]
- Ma, B.; Cao, W.; Li, W.; Gao, C.; Qi, Z.; Zhao, Y.; Du, J.; Xue, H.; Peng, J.; Wen, J.; et al. Dapper1 promotes autophagy by enhancing the Beclin1-Vps34-Atg14L complex formation. Cell Research 2014, 24, 912-924. [CrossRef]
- Levine, B.; Sinha, S.; Kroemer, G. Bcl-2 family members: dual regulators of apoptosis and autophagy. Autophagy 2008, 4, 600-606. [CrossRef]
- Erlich, S.; Mizrachy, L.; Segev, O.; Lindenboim, L.; Zmira, O.; Adi-Harel, S.; Hirsch, J.A.; Stein, R.; Pinkas-Kramarski, R. Differential interactions between Beclin 1 and Bcl-2 family members. Autophagy 2007, 3, 561-568. [CrossRef]
- Liu, J.; Xia, H.; Kim, M.; Xu, L.; Li, Y.; Zhang, L.; Cai, Y.; Norberg, H.V.; Zhang, T.; Furuya, T.; et al. Beclin1 controls the levels of p53 by regulating the deubiquitination activity of USP10 and USP13. Cell 2011, 147, 223-234. [CrossRef]
- Boutelle, A.M.; Attardi, L.D. p53 and Tumor Suppression: It Takes a Network. Trends Cell Biol 2021, 31, 298-310. [CrossRef]
- Soussi, T. The p53 Tumor Suppressor Gene: From Molecular Biology to Clinical Investigation. Annals of the New York Academy of Sciences 2000, 910, 121-139. [CrossRef]
- Tang, Z.; Li, J.; Shen, Q.; Feng, J.; Liu, H.; Wang, W.; Xu, L.; Shi, G.; Ye, X.; Ge, M.; et al. Contribution of upregulated dipeptidyl peptidase 9 (DPP9) in promoting tumoregenicity, metastasis and the prediction of poor prognosis in non-small cell lung cancer (NSCLC). Int J Cancer 2017, 140, 1620-1632. [CrossRef]

| Ingredient | Quantity | Catalogue No. | Supplier/source |
|---|---|---|---|
| Lard | 175.16 g | Yorkfoods; Goulburn NSW | |
| Casein | 182.88 g | C7078 | Sigma-Aldrich; St Louis, MO |
| Sucrose | 156.96 g | 904713 | MP biomedical |
| Starch | 150.48 g | 102955 | MP biomedical |
| AIN mineral Mix | 35.72 g | 905455 | MP biomedical |
| Bran | 39.92 g | Coles; Bella Vista, NSW | |
| Methionine | 2.4 g | M9625 | Sigma-Aldrich; St Louis, MO |
| Gelatine | 16.12 g | 041941 | McKenzies; Altona, VIC |
| Choline bitartrate | 3.24 g | C1629 | Sigma-Aldrich; St Louis, MO |
| AIN vitamins | 10.36 g | 960098 | MP Biomedical |
| Cholesterol | 4.2 g | 8503 | Sigma-Aldrich; St louis, MO |
| Safflower Oil | 20.8 mL | oil057 | Melrose; Mt Waverly, VIC |
| Natural Strawberry | 2 drops | 646045 | Queens; Aldery, QLD |
| Essence |
| Antibody | Host species | Supplier | Catalogue No. | Working dilution |
|---|---|---|---|---|
| Dipeptidyl peptidase 9 | Rabbit | Abcam | Ab42080 | 1:100 |
| Dipeptidyl peptidase 9 | Mouse | Origene | TA504019 | 1:1000 |
| Rabbit IgG-HRP | Goat | Dako | P0448 | 1:5000; 1:200 |
| Mouse IgG-HRP | Rabbit | Dako | P0161 | 1:5000; 1:200 |
| Beta actinHRP | Abcam | Ab49900 | 1:50000 | |
| Caspase1 | Mouse | AdipoGen | AG-20B-0048-C100 | 1:1000 |
| Becin1 | Mouse | Genetex | GTX34055 | 1:1000 |
| NLRP3 | Rabbit | Cell Signalling | 1510S | 1:1000 |
| p53 | Rabbit | Cell Signalling | 9282S | 1:1000 |
| Gene symbol |
Gene name | Primer/probe assay | Gene function | Amplicon length |
|---|---|---|---|---|
| Hprt1 | Hypoxanthine guanine phosphoribosyl transferase1 | Mm00446968_m1 | Housekeeping gene | 65 |
| Afp | Alpha fetoprotein | Mm00431715_m1 | HCC associated | 96 |
| Gpc3 | Glypican 3 | Mm00516722_m1 | HCC associated | 91 |
| Birc5 | Baculoviral IAP repeat-containing 5 | Mm00599749_m1 | HCC associated | 83 |
| Braf | Braf transforming gene | Mm01165837_m1 | HCC associated | 94 |
| Trp53 | Transformation related protein 53 | Mm01731290_g1 | HCC associated | 119 |
| Ccnd1 | Cyclin D1 | Mm00432359_m1 | HCC associated | 58 |
| Il1 | interleukin 1 beta | Mm00434228_m1 | Immune system | 90 |
| Il18 | interleukin 18 | Mm00434226_m1 | Immune system | 141 |
| Nlrp1 | NLR family, pyrin domain containing 1 | Mm01241387_m1 | Immune system | 93 |
| Nlrp3 | NLR family, pyrin domain containing 3 | Mm00840904_m1 | Immune system | 84 |
| TNF | Tumour necrosis factor | Mm00443258_m1 | Immune system | 81 |
| Itgam | Integrin alpha M | Mm00434455_m1 | Immune system | 69 |
| Nfkbia | Nuclear factor of kappa light polypeptide gene enhancer in B cells inhibitor, alpha | Mm00477798_m1 | Immune system | 70 |
| Nfkbib | Nuclear factor of kappa light polypeptide gene enhancer in B cells inhibitor, beta | Mm00456853_m1 | Immune system | 64 |
| Ccl2 | Chemokine (C-C motif) ligand 2 |
Mm99999056_m1 | Immune system | 96 |
| Ccl5 | Chemokine (C-C motif) ligand 5 |
Mm01302427_m1 | Immune system | 103 |
| Cxcr3 | Chemokine (C-C motif) receptor 3 |
Mm99999054_s1 | Immune system | 57 |
| Cx3cr1 | Chemokine (C-X3-X motif) receptor 1 |
Mm02620111_s1 | Immune system | 107 |
| Il6 | Interleukin 6 | Mm00446190_m1 | Immune system | 78 |
| Cxcl10 | Chemokine (C-X-C motif) ligand 10 |
Mm00445235_m1 | Immune system | 59 |
| Ccr2 | Chemokine (C-C motif) receptor 2 |
Mm99999051_gH | Immune system | 60 |
| Itgax | Integrin alpha X | Mm00498701_m1 | Immune system | 93 |
| Tlr7 | Toll-like receptor 7 | Mm00446590_m1 | Immune system | 125 |
| Tlr8 | Toll-like receptor 8 | Mm04209873_m1 | Immune system | 82 |
| Tlr9 | Toll-like receptor 9 | Mm00446193_m1 | Immune system | 60 |
| Nlrp3 | NLR family, pyrin domain containing 3 | Mm00840904_m1 | Inflammasome | 84 |
| Gasdermin D | Gasdermin D | Mm00509958_m1 | Inflammasome | 94 |
| Dpp9 | dipeptidyl peptidase 9 | Mm00841122_m1 | Protease | 61 |
| Dpp8 | dipeptidyl peptidase 8 | Mm00547049_m1 | Protease | 95 |
| Fap | Fibroblast activation protein | Mm00484254_m1 | Protease | 107 |
| Dpp4 | dipeptidyl peptidase 4 | Mm00494538_m1 | Protease | 88 |
| Casp1 | Caspase 1 | Mm00438023_m1 | Apoptosis/pyroptosis | 99 |
| Casp3 | Caspase 3 | Mm01195085_m1 | Apoptosis | 100 |
| Cd163 | CD163 antigen | Mm00474091_m1 | Macrophage associated | 83 |
| Cd47 | CD47 antigen | Mm00495011_m1 | Macrophage associated | 77 |
| CD64/Fcgr1 | Fc receptor, IgG, high affinity I | Mm00438874_m1 | Macrophage associated | 58 |
| Cd68 | CD68 antigen | Mm00839636_g1 | Macrophage associated | 86 |
| Col1a2 | Collagen, type I, alpha 2 | Mm00483888_m1 | ECM | 67 |
| Col3a1 | Collagen, type III, alpha 1 | Mm00802300_m1 | ECM | 88 |
Disclaimer/Publisher’s Note: The statements, opinions and data contained in all publications are solely those of the individual author(s) and contributor(s) and not of MDPI and/or the editor(s). MDPI and/or the editor(s) disclaim responsibility for any injury to people or property resulting from any ideas, methods, instructions or products referred to in the content. |
© 2024 by the authors. Licensee MDPI, Basel, Switzerland. This article is an open access article distributed under the terms and conditions of the Creative Commons Attribution (CC BY) license (http://creativecommons.org/licenses/by/4.0/).


