1. Introduction
Pure copper exhibits excellent electrical and thermal conductivity, high ductility, and exceptional processability, making it extensively utilized in various fields such as the electronic industry, electric power sector, and military applications [
1,
2,
3,
4]. The attainment of copper material with elevated cleanliness levels, uniform microstructure, and superior properties is crucial to ensure the subsequent processing procedures and product quality.
The application of rare earth in pure copper has been relatively underreported compared to its extensive research and excellent effects observed in iron and steel materials, aluminum, magnesium, and other alloy materials [
5,
6,
7,
8]. Existing studies suggest that rare earth can also enhance the microstructure and properties of copper alloys. Rare earth primarily functions in copper alloys by:(i) exhibiting highly reactive chemical properties that enable it to react with detrimental elements such as oxygen, sulfur, hydrogen, etc., forming high melting point compounds which float on the slag and act as purifying agents [
9,
10,
11]; (ii) dispersing fine high melting point compounds throughout the copper alloy matrix to serve as new crystalline cores for grain refinement [
12,
13,
14]. Due to its reactivity, rare earth readily reacts with impurities in copper to form well-defined shape-rich compounds with high melting points, thereby improving the morphology of original inclusions [
15,
16]. Consequently, rare earth significantly alters the existing forms of impurities within copper alloys while remarkably enhancing their properties.
Considering the advantageous impact of rare earth elements on copper alloys, this study aims to investigate the influence of Ce on the microstructure and mechanical properties of pure copper. The objective is to ascertain whether rare earth elements have a similar effect on pure copper, thereby enhancing the overall characteristics of cast pure copper.
2. Materials and Methods
The copper ingot was smelted in a 25 kg vacuum induction furnace, and rare earth Ce-Cu master alloy was added with a yield of 35%. The content of rare earth in the smelted copper was analyzed for sample numbers 1# and 2#, resulting in values of 0 ppm and 97 ppm respectively. Firstly, thermodynamic calculations were used to analyze the reaction between rare earth Ce and typical harmful elements in copper, determining the reaction products. The microstructure of columnar and equiaxed crystals of the copper ingot after smelting was observed using an Axiocam 105 color microscope, while crystal structure and phase were analyzed by Rigaku SmartLab SE X-ray diffractometer. Microstructure observations were made using a TESCAN MIRA LMS electron microscope (SEM), while mechanical properties such as hardness and tensile force were tested using KSV-2500 microhardness tester and CMT5305 electronic universal testing machine.
3. Results
3.1. Thermodynamic Investigation of Primary Ce-Containing Inclusions in Cast Pure Copper
Although the impurity elements in pure copper are present at very low levels (less than 0.01%), these trace impurities can significantly impact the properties of pure copper. For instance, the formation of brittle compounds such as Cu2O and CuS due to the presence of oxygen and sulfur can greatly reduce its plasticity. Additionally, rare earth elements exhibit a strong affinity for oxygen and sulfur, leading to the formation of high melting point rare earth compounds with excellent thermal stability and low specific gravity, thereby playing a crucial role in purifying liquid copper. Understanding the thermodynamics of rare earth reactions within copper serves as a fundamental basis for investigating their influence on this metal. The occurrence of Ce-containing inclusions in cast pure copper can be explained from a thermodynamic perspective.
3.1.1. Thermodynamic Properties of Cu-Ce-O System
The reaction between rare earth cerium and oxygen in liquid copper at 1200℃ can be described as follows [
17,
18]:
∆G is the change of Gibbs free energy of chemical reaction; ∆Gθ is the standard Gibbs free energy; J is activity quotient; R is the gas constant; T is the Kelvin temperature.
Taking 1% solution by mass as the standard state, the calculation formula of activity α
i is:
Ce
2O
3 is pure material, So
= 1 during the calculations; is the activity interaction coefficient of component j to component i in copper liquid. The interaction coefficient between main elements in copper is shown in
Table 1. At 1200 ℃, because the activity of O is extremely low, it can be considered that
. In the formula
and
, the values were measured in the test and the average value of multiple measurements was taken.
3.1.2. Thermodynamic Properties of Cu-Ce-S System
The reaction between rare earth cerium and sulfur in a copper liquid at 1200 ℃ can be described as follows [
18]:
Taking 1% solution by mass as the standard state, according to formula (2) ~ (4),
3.1.3. Thermodynamic Properties of Cu-Ce-O-S System
The reaction of rare earth cerium with oxygen and sulfur in a copper liquid at 1200 ℃ is depicted as follows [
19]:
Taking 1% solution by mass as the standard state, according to formula (2) ~ (4),
The calculation results reveal that the values of and are both negative, with significant magnitudes. This indicates a pronounced thermodynamic inclination for rare earth Ce to facilitate deoxidation and desulfurization reactions in copper, effectively removing trace amounts of O and S from the system.
3.2. Existing Forms of Rare Earth Ce in Copper
3.2.1. Solid Solution of Ce in Copper
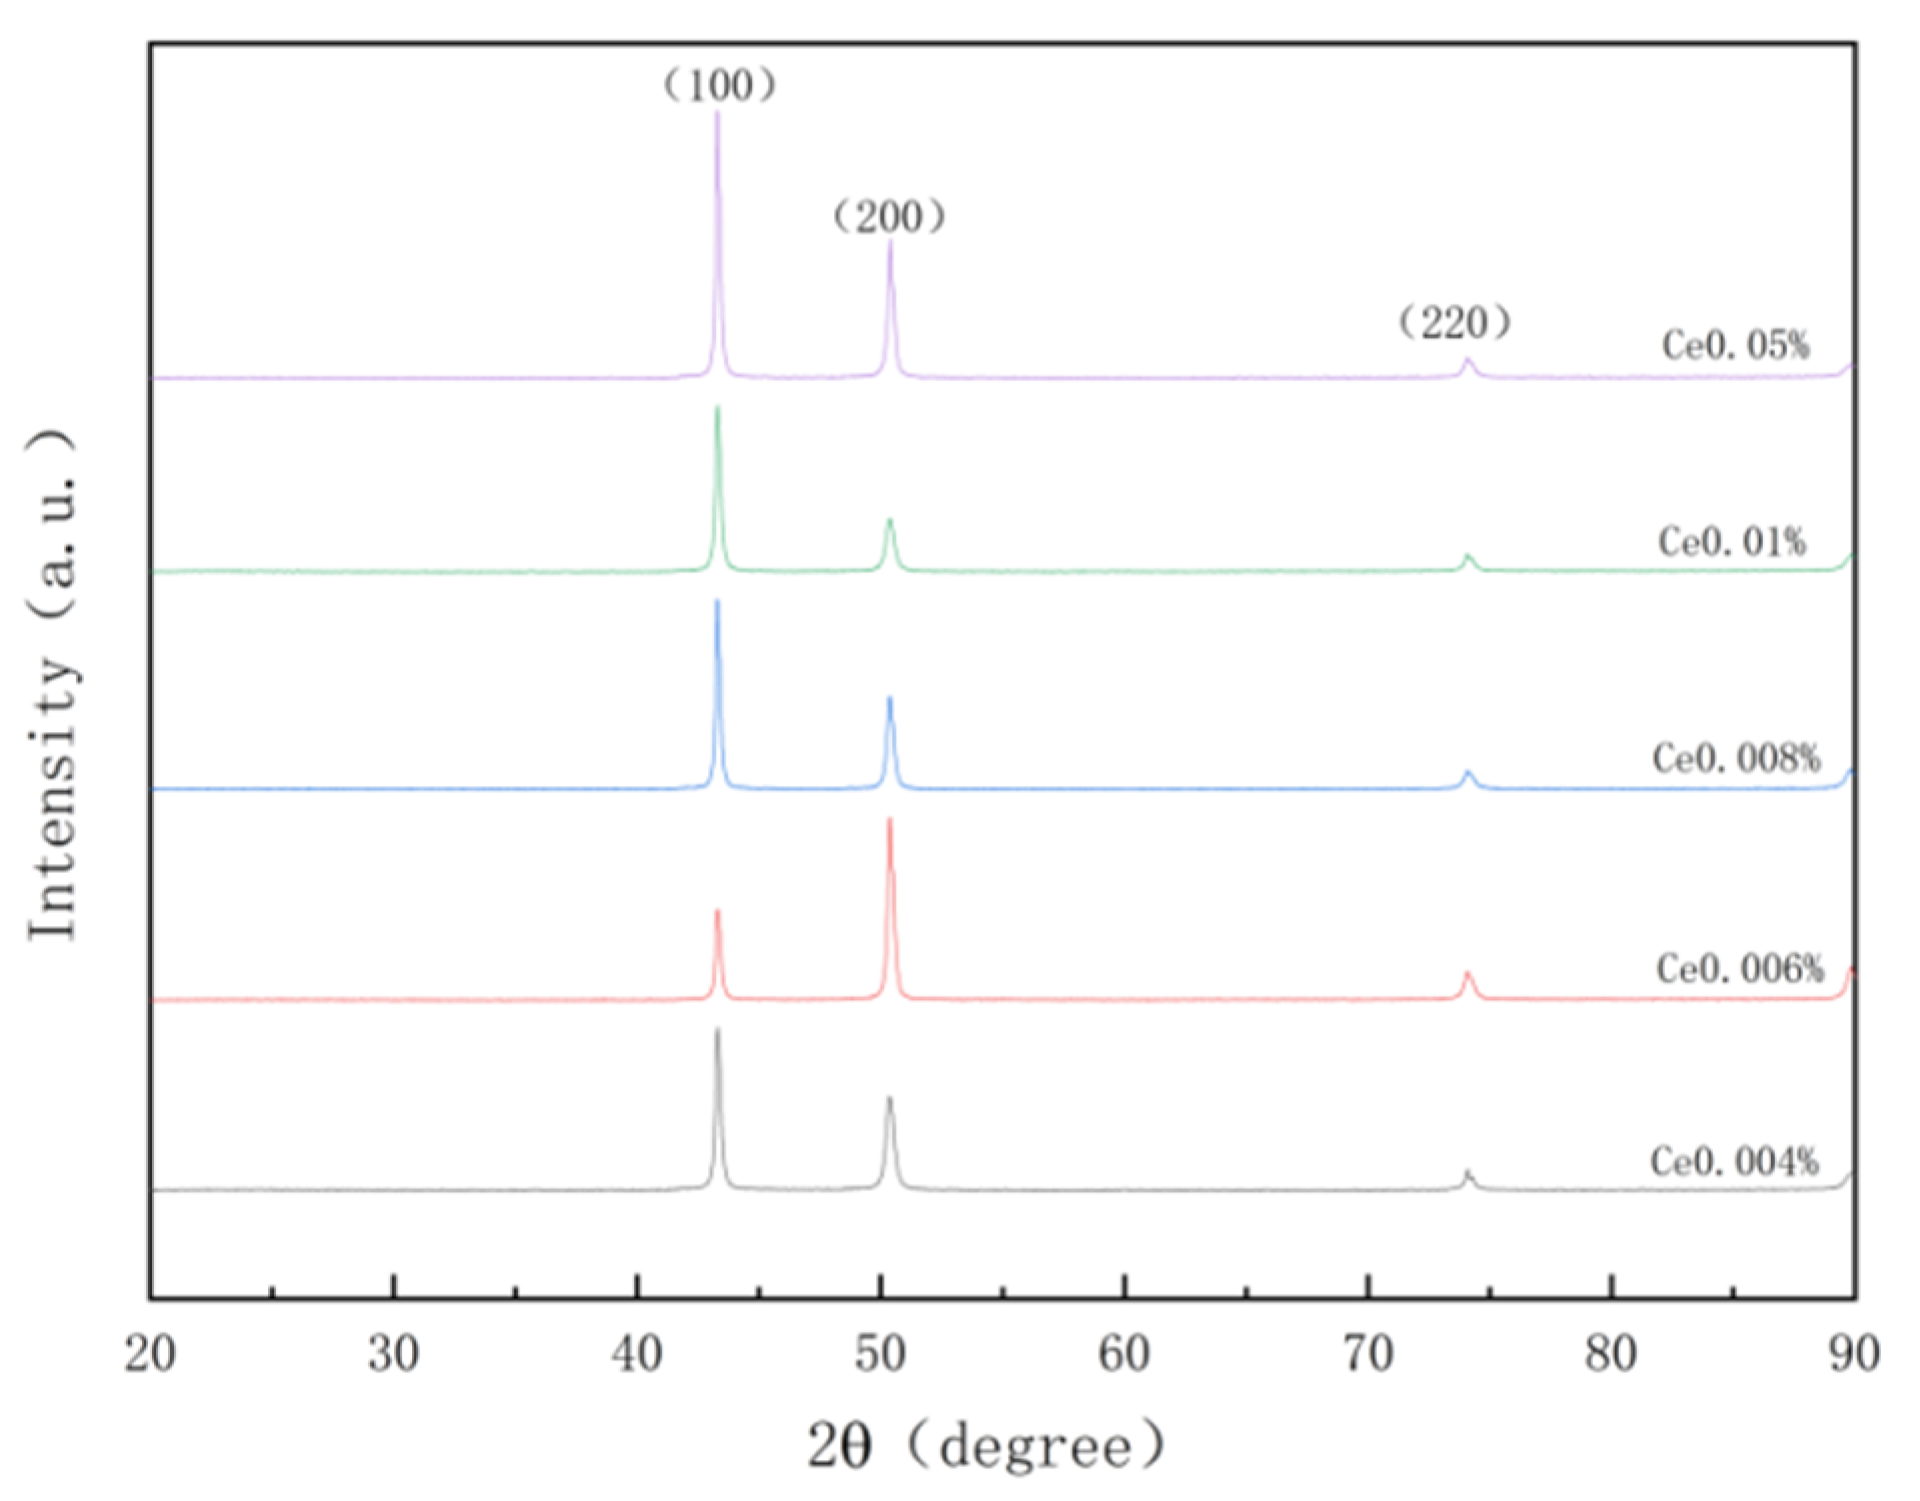
Combined with the author’s previous research data, X-ray diffraction (XRD) analysis was conducted on samples containing varying amounts of Ce to investigate the correlation between diffraction peaks and angles for different elements and Ce addition. The obtained XRD diffraction pattern is presented in
Figure 1. Due to the low concentration of Ce element used in this experiment, only the diffraction peaks corresponding to Cu crystal planes (111), (200), and (220) are observed, while no discernible diffraction peaks related to rare earth Ce element or its compounds are detected.
According to the relationship between diffraction angle and content, a line diagram illustrating the correlation between diffraction angle and content for different crystal planes is constructed.
In
Figure 2, (a) represents the diffraction angle image of crystal plane (100), (b) represents the diffraction angle image of crystal plane (200), and (c) represents the diffraction angle image of crystal plane (220). According to Bragg’s law: 2dsinθ=nλ, the diffraction angle is inversely proportional to the spacing between crystal planes, while the lattice constant is positively correlated with this spacing. Therefore, a larger diffraction angle indicates a smaller lattice constant. Conversely, a larger lattice constant leads to increased solid solubility and leftward shift of the diffraction peak. From
Figure 2, it can be observed that within the Ce concentration range from 0.006% to 0.009%, there is a decrease in diffraction angles with increasing Ce content, accompanied by gradual increase in lattice constant; indicating progressive dissolution of Ce into copper resulting in formation of a solid solution between them. Within the range of 0.009% to 0.01% content, each grain boundary exhibits an upward trend in its respective diffraction angle; suggesting that Ce has reached its maximum solid solubility and started forming supersaturated solid solution with copper leading to precipitation of Ce elements as well. These findings demonstrate that Cu has an approximate maximum solid solubility for Ce within the range of 0.009% ~ 0.01%.
3.2.2. Existing Forms of Ce in Pure Copper
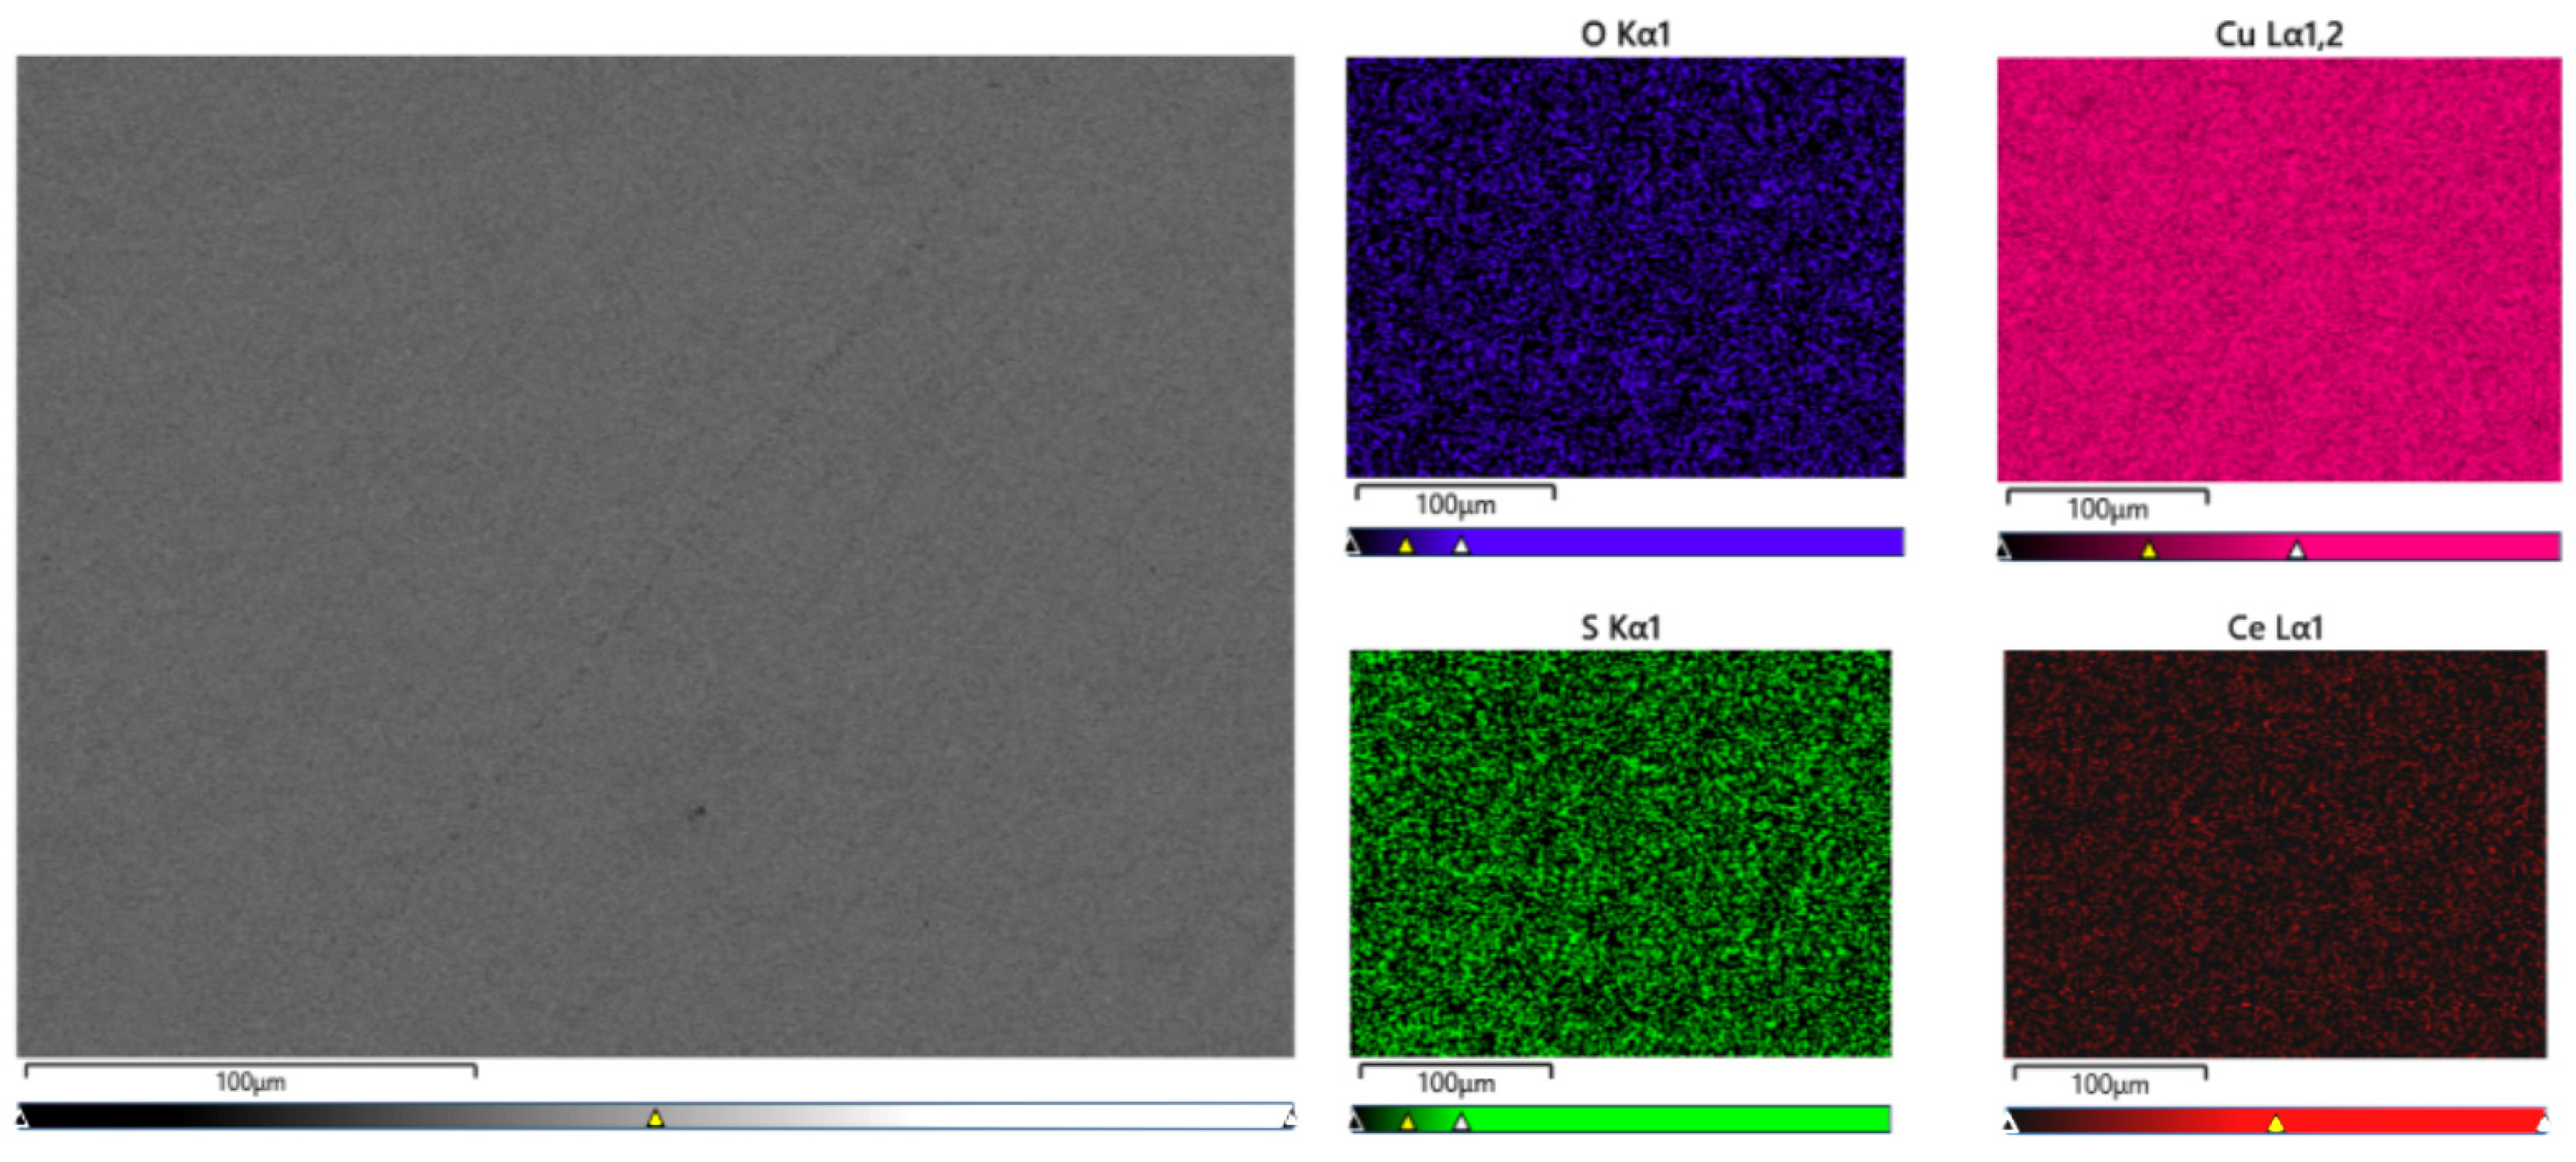
The surface of the sample was analyzed using a scanning electron microscope to further investigate the distribution and existing form of Ce in the matrix. As depicted in
Figure 3, Ce was uniformly distributed within the Cu matrix in the sample with a Ce content of 0.0097%. However, aggregation was observed in the enlarged region indicated by the arrow, as shown in
Figure 4.
EDS energy spectrum analysis was conducted in the region indicated by the arrow in
Figure 4, revealing relatively high contents of Ce, Cu, O and S elements. Thermodynamic calculations and analyses suggest that substances in this area may consist of Ce
2O
3, CeS or Ce
2O
2S compounds; excessive amounts of Ce can also form intermetallic compounds with Cu. Zhang Shihong et al.[
20] used Miedema thermodynamic model to calculate that when rare earth element Ce is added to purple copper, it will preferentially react with O and S elements to form rare earth compounds with high melting point and low density. Meanwhile, rare earth element Ce can also react with copper to produce corresponding copper-rare earth compounds dispersed as second phase particles within copper matrix. The experimental results are consistent with these conclusions. During solidification process, formed compounds serve as nucleation centers which facilitate microstructure refinement while pinning dislocations and improving properties of copper alloy.
3.2.3. Effect of Rare Earth Ce on as-Cast Microstructure of Pure Copper
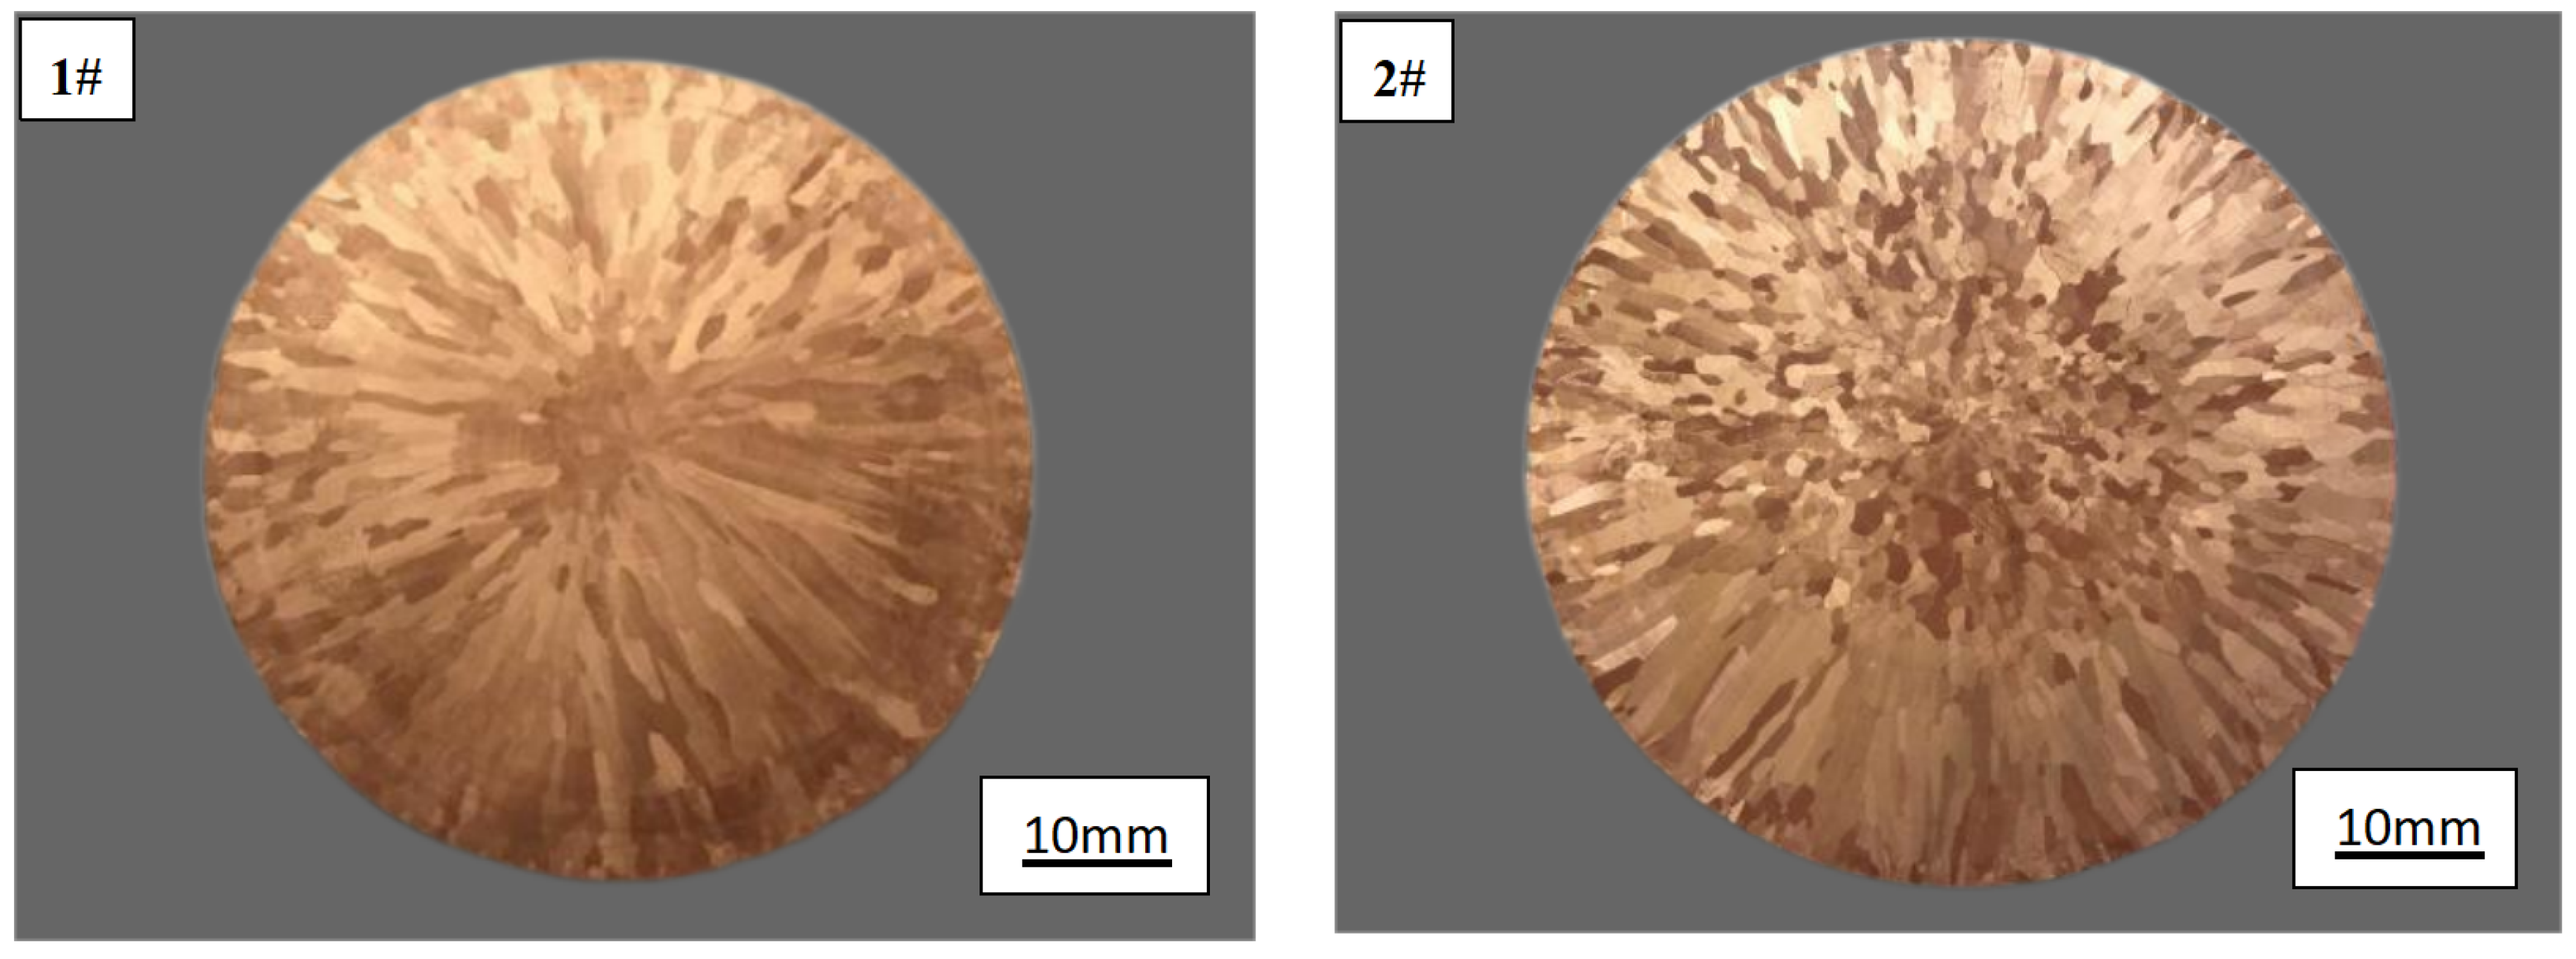
The transverse low power structure of 1# and 2# as-cast copper ingots is depicted in
Figure 5. It can be observed that the addition of rare earth significantly alters the microstructure of the as-cast copper ingot. In
Figure 5, the majority of crystals from the edge to the center of 1# copper ingot are columnar with coarse grains and uneven distribution, while a small number of equiaxed grains are present at the center. Upon adding rare earth, more equiaxed grains emerge at the center with enlarged size, and compared to those without rare earth addition, there is evident refinement in columnar grains at the edge.
The addition of rare earth effectively refines the as-cast grain of copper through a dual mechanism. Firstly, the inclusion of rare earth Ce reduces the melting temperature of pure copper, thereby increasing the undercooling degree of the composition. This increased undercooling promotes nucleation and improves nucleation rate, subsequently inhibiting grain growth. Moreover, heightened undercooling in pure copper intensifies cellular dendrite growth and enhances dendritic development, ultimately resulting in reduced dendrite spacing and refined columnar crystals. Additionally, composition undercooling provides sufficient nucleation conditions for new equiaxed grains to form based on effective nucleation points created by rare earth atoms within this region. These newly formed equiaxed grains continue to grow while solute redistribution during grain growth generates another composition undercooling zone at the solid/liquid interface front surrounding grain growth. This facilitates continuous nucleation and growth at these sites, thus promoting expansion of the equiaxed crystal region [
20]. Secondly, upon adding rare earth to copper, preferential reactions between rare earth elements and other constituents lead to the formation of high melting point compounds which are finely dispersed throughout the molten copper matrix. During solidification, these fine high melting point compounds act as heterogeneous crystal nuclei that increase crystal nucleus density while mechanically impeding grain growth processes. Consequently, this shortens solidification time and contracts the columnar crystal region [
11].
3.2.4. The Influence of Rare Earth Ce on Impurities in Pure Copper
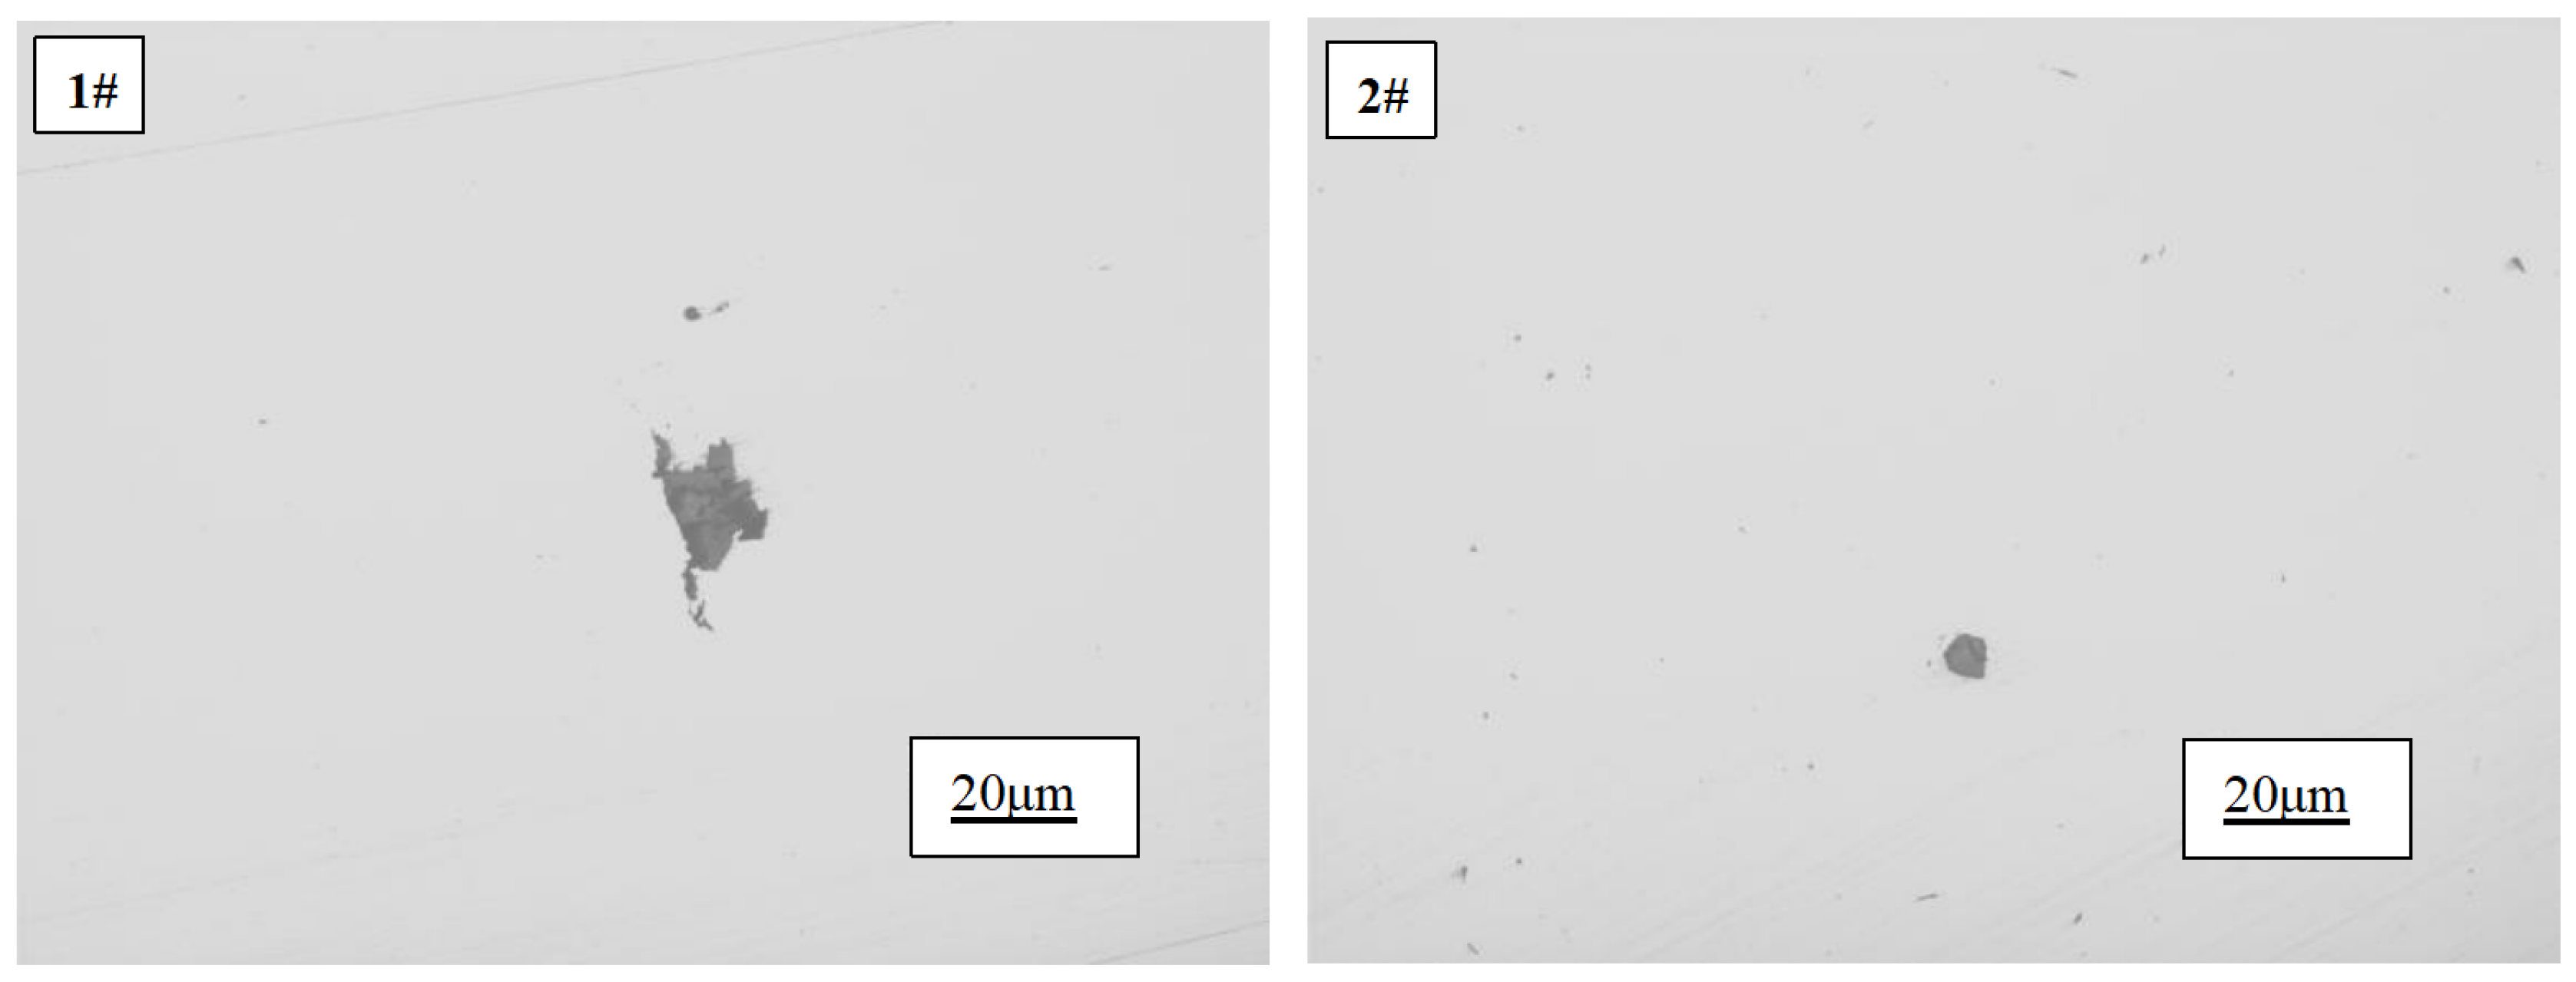
The overall morphology of inclusions in pure copper before and after the addition of rare earth is depicted in
Figure 6. As illustrated by 1#, the inclusions present in pure copper ingots devoid of rare earth exhibit a substantial size and tend to aggregate, displaying an extremely irregular and angular morphology that significantly compromises the properties of copper. Conversely, as demonstrated by 2#, it is evident that the inclusion size becomes noticeably finer upon introducing a rare earth content of 97ppm into the copper ingot. Moreover, their shape transforms from irregular to approximately round, while smaller-sized inclusions are uniformly dispersed throughout, indicating that rare earth has effectively enhanced the morphology of copper’s inclusions.
3.4. Effect of Rare Earth Ce on Mechanical Properties of Copper
3.4.1. Effect of Rare Earth Ce on Mechanical Properties of Copper
The mechanical properties of copper, both before and after the addition of rare earth Ce, are presented in
Table 2. It is evident that the incorporation of Ce leads to enhancements in both tensile strength and elongation of copper. Specifically, the average tensile strength and elongation values for copper with Ce addition are measured at 154 MPa and 33%, respectively, representing an increase of 8.45% compared to pure copper’s tensile strength and a remarkable improvement by 12.1% over its elongation.
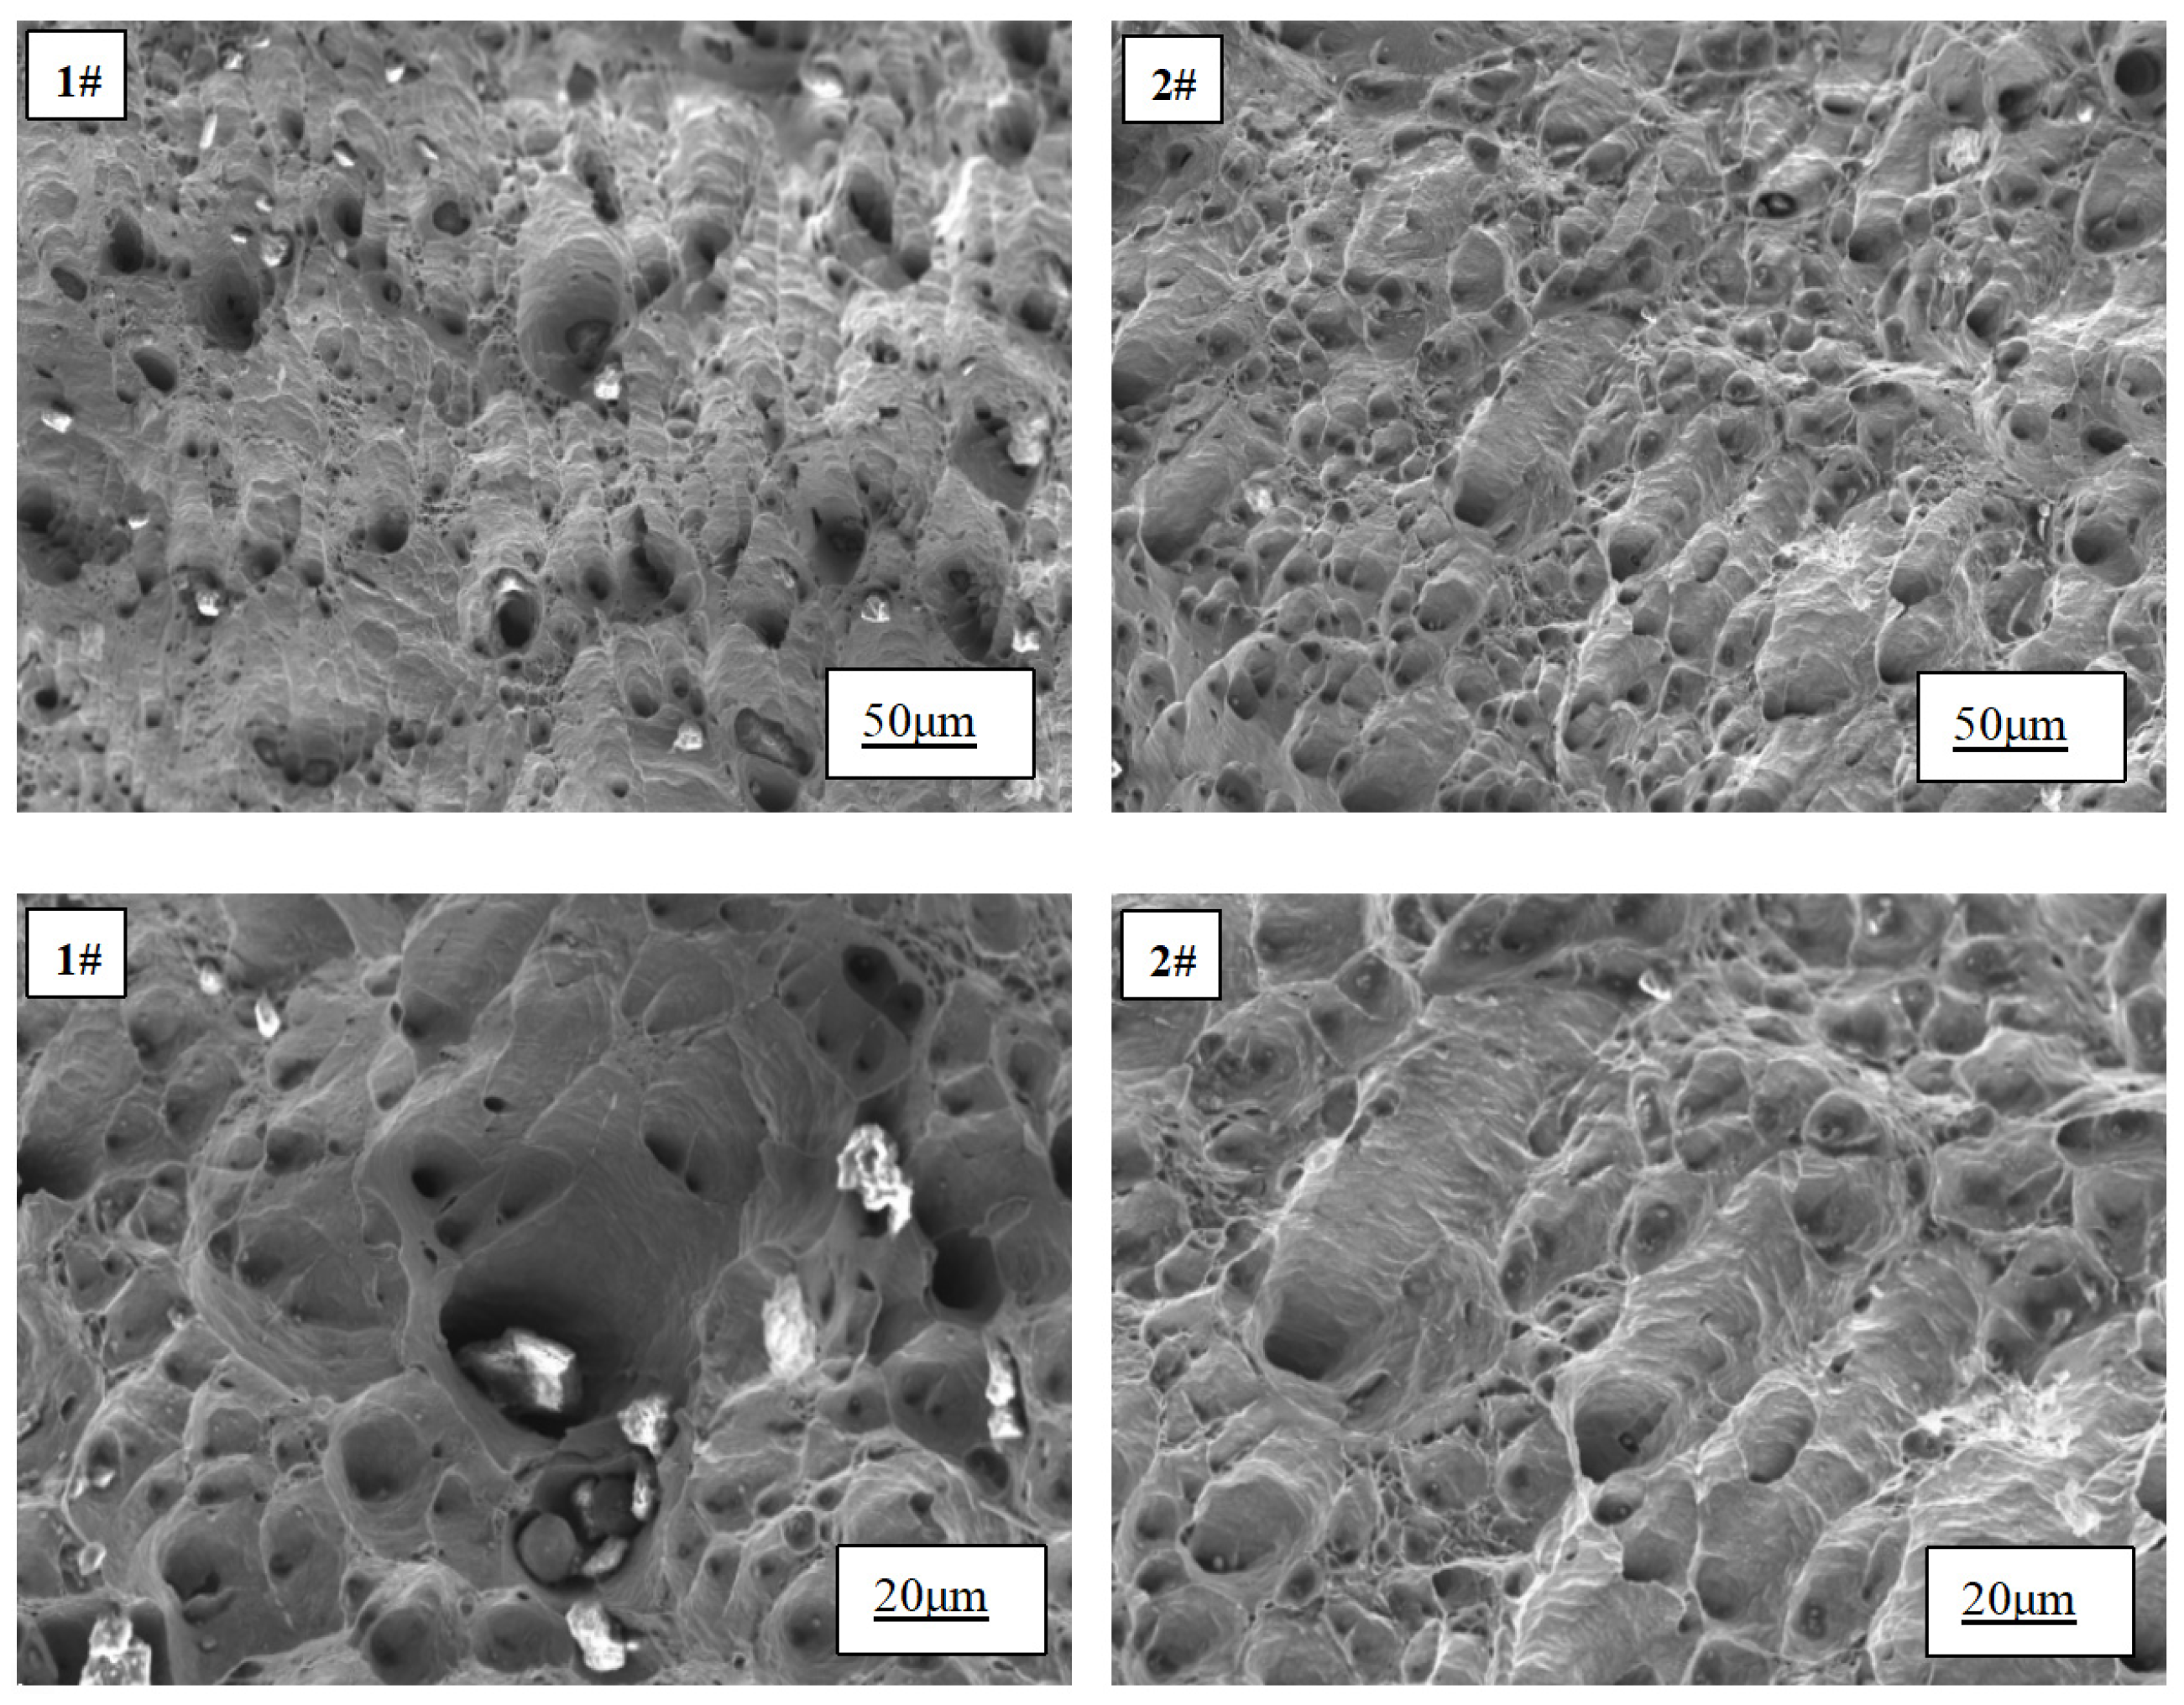
The tensile fracture morphology before and after the addition of Ce is presented in
Figure 7. It can be observed that both samples exhibit ductile fracture characteristics. However, upon the addition of rare earth, an increase in the number of dimples on the fracture surface is evident, accompanied by a reduction in their size and a more uniform distribution. In contrast, without the addition of rare earth, numerous irregularly shaped and large-sized inclusions surround the dimples on the fracture surface. Remarkably, with the incorporation of rare earth, there is a noticeable decrease in inclusion content. Upon magnification, smaller round or oval-shaped inclusions within dimples are uniformly distributed.
When the specimen undergoes tensile deformation, the grain boundary serves as a region of stress concentration. With continuous tensile loading, micro-holes tend to form at the grain boundary. These micro-holes act as nucleation sites for dimples and gradually expand, eventually leading to fracture in the copper grain structure. The presence of larger size inclusions increases the propensity for fracture, which contributes to premature failure in samples without rare earth addition. Upon introducing rare earth Ce, two significant improvements are observed: firstly, refinement of grains occurs due to its addition; according to Hall-Petch relationship [
21], refining grains can substantially enhance material’s tensile strength by negatively correlating it with grain size. Secondly, rare earth Ce enhances inclusion morphology by transforming large-size irregular inclusions into fine and spheroidized ones that are uniformly dispersed throughout the material matrix. These finely distributed inclusions effectively impede dislocation movement and improve deformation resistance, thereby enhancing material strength.
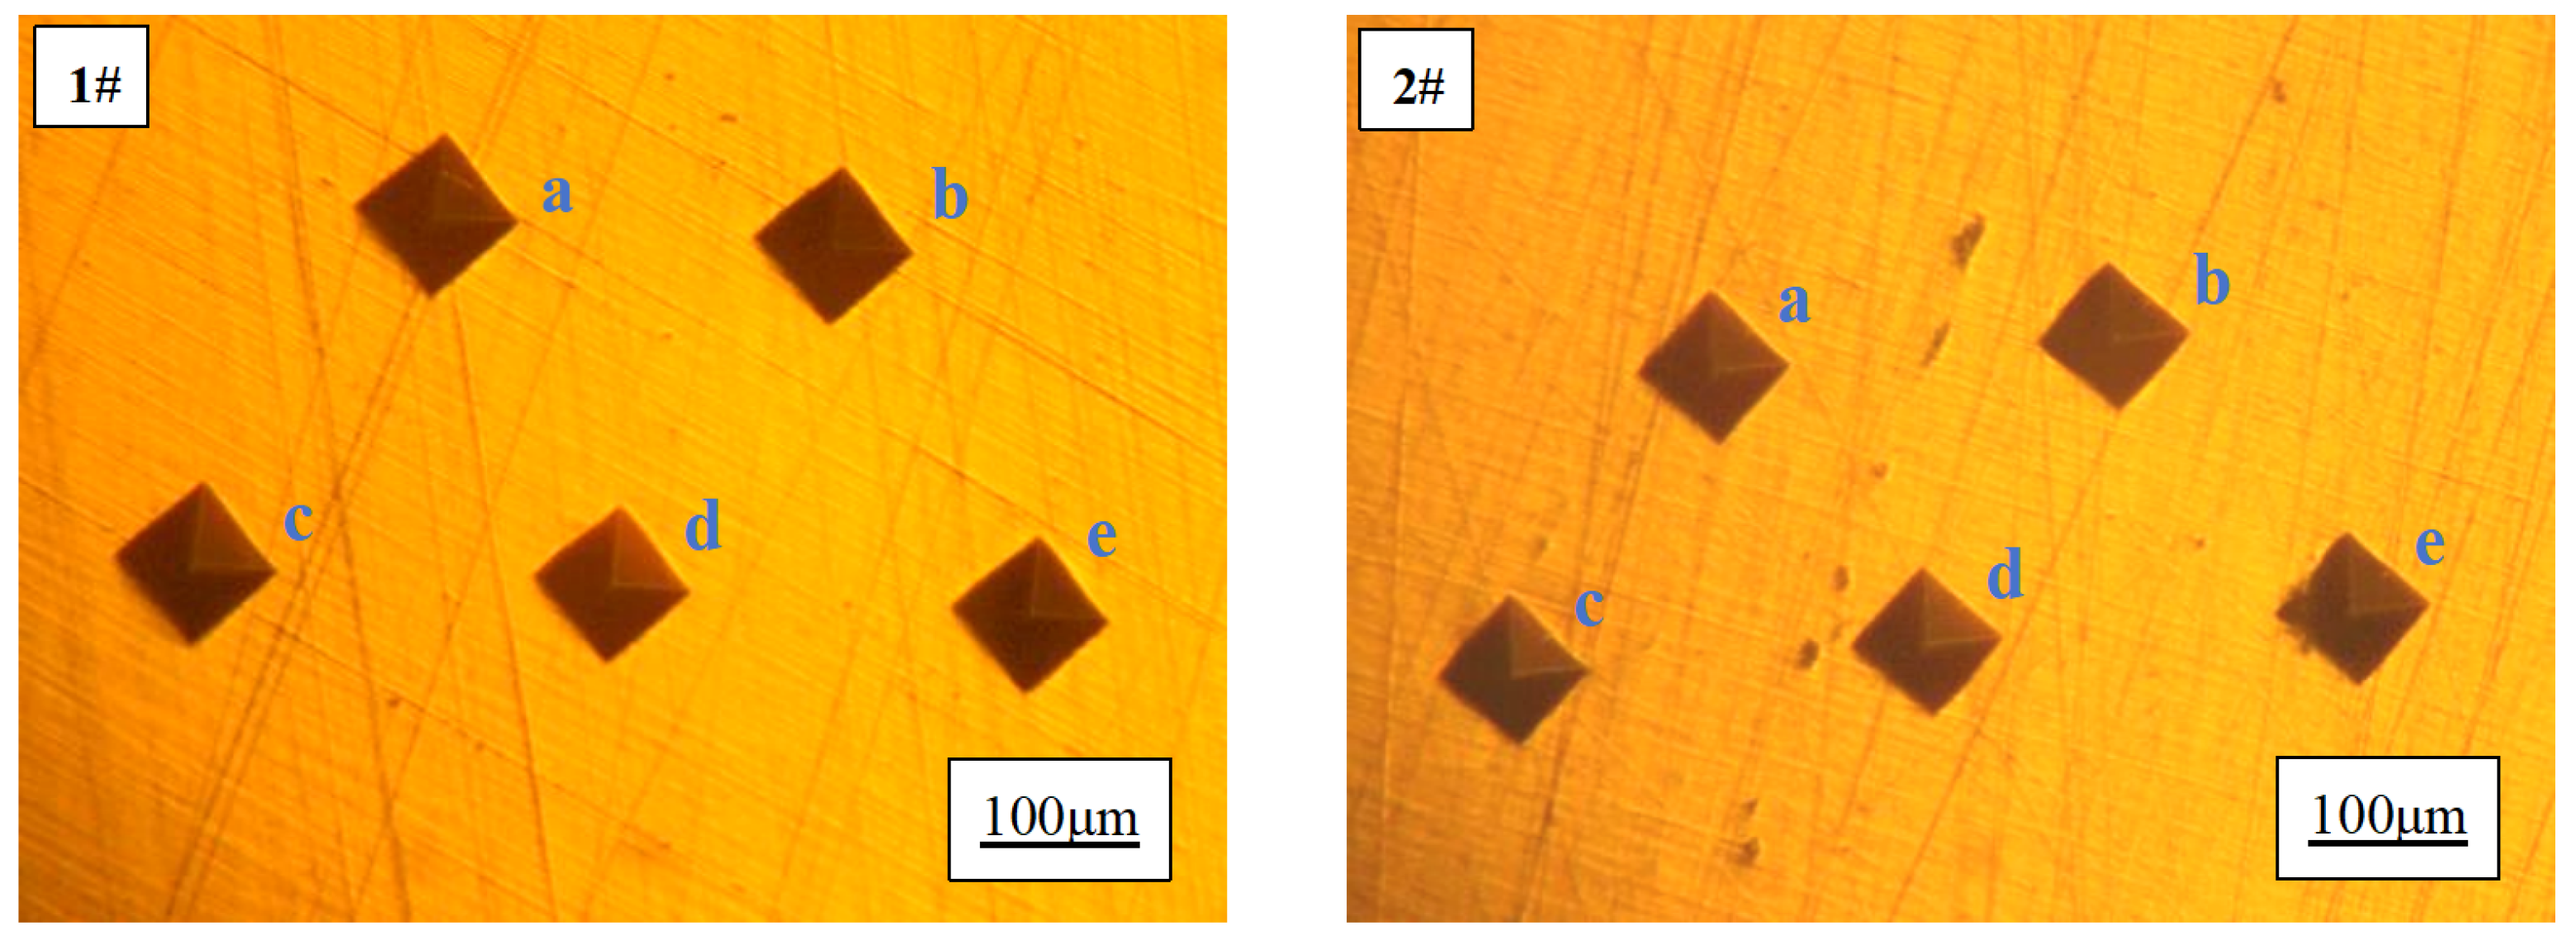
3.4.2. Effect of Ce on Hardness
After the addition of rare earth Ce, the hardness of pure copper samples increased from 73.5 HV to 81.2 HV, representing a significant enhancement of 10.5%. When subjected to pressure load, pure copper undergoes deformation accompanied by extensive movement and slip of dislocations within its structure. The presence of finer grain size results in higher grain boundary density and greater accumulation of additional dislocations at these boundaries, thereby increasing resistance against external forces and elevating material hardness. Additionally, the finely dispersed rare earth inclusions impede dislocation motion and further enhance material deformation resistance. This phenomenon elucidates the rationale behind the observed increase in hardness upon incorporating rare earth Ce into pure copper.
Figure 8.
Microhardness diagram of 1 # and 2 # copper samples.
Figure 8.
Microhardness diagram of 1 # and 2 # copper samples.
Table 3.
Microhardness values of 1 # and 2 # copper samples.
Table 3.
Microhardness values of 1 # and 2 # copper samples.
| Sample number |
Ce contenu, wt.% |
Hardness, HV |
Average, HV |
| 1 # |
0 |
a:75.4; b:75.9; c:71.5; d:72.1; e: 72.8 |
73.5 |
| 2 # |
0.0097 |
a: 80.7; b: 81.8; c: 80.1; d: 81.8; e: 81.5 |
81.2 |
4. Conclusions
(1) The thermodynamic calculations reveal that the Gibbs free energy of the reaction between rare earth element Ce and oxygen (O) as well as sulfur (S) in liquid copper at 1200℃ is negative, indicating a strong thermodynamic driving force for deoxidation and desulfurization of Ce in copper. Consequently, the resulting products include Ce2O3, CeS, and CeSO.
(2) The XRD analysis results demonstrate an increase in the diffraction angle of each grain boundary when the concentration of Ce in Cu ranges from 0.009% to 0.01%. In accordance with Bragg’s Law, the maximum solid solubility of Ce in Cu falls within the range of 0.009% to 0.01%.
(3) After the addition of Ce, equiaxed grains emerge at the core of the as-cast copper ingot, while the columnar grains at the periphery undergo evident refinement. This observation demonstrates that rare earth Ce facilitates the transition from columnar to equiaxed grain morphology and refines the microstructure of as-cast copper.
(4) After the incorporation of rare earth elements, the tensile strength, elongation, and microhardness of pure copper exhibited a significant enhancement by 8.45%, 12.1%, and 10.5% respectively, resulting in an increase from 73.5 HV to 81.2 HV. It is worth noting that the addition of rare earth element Ce demonstrated a pronounced improvement in the mechanical properties of cast pure copper.
Author Contributions
Conceptualization, Mingyi Zhang and Jichun Yang; methodology,Mingyi Zhang; validation, Jichun Yang, HaiXiao Li; formal analysis, Mingyi Zhang; investigation, Mingyi Zhang; resources, Jichun Yang; data curation,Mingyi Zhang; writing—original draft preparation, Mingyi Zhang; writing—review and editing,Jichun Yang; visualization,HaiXiao Li; supervision, Jichun Yang; project administration,Jichun Yang; funding acquisition, Mingyi Zhang. All authors have read and agreed to the published version of the manuscript.
Funding
This research was funded by Inner Mongolia key technology research project (grant number2021GG02730; Listed fund projects, Joint fund project (grant numberNBFJ2022-29).
Conflicts of Interest
Authors Mingyi Zhang were employed by Inner Mongolia Institute of metal materials. Author Jichun Yang and Mingyi Zhang was employed by School of Rare Earth Industry (School of Rare Earth Engineering and Technology).Haixiao Li were employed by Xinzhou Comprehensive inspection and Testing Center. The remaining authors declare that the research was conductedin the absence of any commercial or financial relationships that could be construed as a potentialconflict of interest.
References
- Ren Shuai. Study on grain boundary characteristic distribution of high purity copper during deformation annealing. Fujian Institute of Engineering, 2022.
- Zou Jiancheng. Development status and market demand of high purity copper materials. J. World Nonferrous Metals, 2023 (04): 157-159.
- Hu Zhongwu, Li Zhongkui, Zhang Tingjie, etc. Development of liner materials. J. Journal of Rare Metals Materials and Engineering, 2004, 33 (10): 1009-1012.
- Zhao Teng, Luo Hong, Jia Wanming, etc. Study on the factors affecting the service performance of liner materials. J.Ordnance Materials Science and Engineering, 2007, 30 (5): 82-86.
- Wang M J, Chen L, Wang Z X. Effect of Rare Earth Addition on Continuous Heating Transformation of a High Speed Steel for Rolls. J. Rare Earths, 2012, 30: 84. [CrossRef]
- Hu X W, Jiang F G, Ai F R, Yan H. Effects of rare earth Er additions on microstructure development and mechanical properties of die-cast ADC12 aluminum alloy. J.Alloys Compd., 2012, 538: 21. [CrossRef]
- Stanford N, Atwell D, Beer A, Daviesc C, Barnett M R. Effect of microalloying with rare-earth elements on the texture of extruded magnesium-based alloys. Scripta Mater., 2008, 59: 772. [CrossRef]
- Chen Yan, Cheng Ming, Song Hongwu, Effects of lanthanum addition on microstructure and mechanical properties of as-cast pure copper. J. Journal Of Rare Earths, 2014, 32 (11), 1056-1063. [CrossRef]
- Otto F, Viswanathan G B, Payton E J, frenzel J, Eggeler G. On the effect of green boundary segregation on creep and creep rupture. J.Acta Materialia, 2012, 60: 2982-2998. [CrossRef]
- Dusher G, Chisholm M F, Alber U, Ruhle M. Bismuth-induced embryo of copper grain boundaries. J.Nature Materials, 2004, 3: 621-266. [CrossRef]
- WU J H, ZHANG S H, CHEN Y, et al. Effects of La Microalloying on Microstructure Evolution of Pure Copper. J. Materials Science Forum, 2017, 898: 361-366. [CrossRef]
- LIU H C, TENG X Y, WU W B, et al. Effects of Rare Earth Y Addition on Microstructure and Properties of Pure Copper. J.Materials Science Forum, 2021, 913: 862-869. [CrossRef]
- LI H, Zhang S, CHEN Y, et al. Effects of Small Amount Addition of Rare Earth Ce on Microstructure and Properties of Cast Pure Copper. J. Journal of Materials Engineering and Performance, 2015, 24 (8): 2857-2865. [CrossRef]
- Jiang Jiaxin, Wen Yongqing. Action and Application of Rare Earth in Copper and Copper Alloys. J. Rare Earth Information, 2021 (5): 12-18.
- LIN Gao-yong, LI Kun, FENG Di, FENG Yong-ping, SONG Wei-yuan, XIAO Meng-qiong. Effects of La-Ce addition on microstructure and mechanical properties of Al-18Si-4Cu-0.5 Mg alloy. J.Transactions of Nonferrous Metals Society of China, 2019, 29: 1592-1600. [CrossRef]
- LI Ji-lin, CHANG Li-li, LI Sheng-li, ZHU Xin-de, AN Zhong-xin. Microstructure and properties of as-cast Cu Cr Zr alloys with lanthanum addition. J. Journal of Rare Earths, 2018, 36: 424-429. [CrossRef]
- Hong Lan, Sui Zhitong, Wang Changzhen, Thermodynamics of Cu-Ce-O and Cu-RE-O Systems. J. Chinese Journal of Rare Earth Science, 1995, 13 (12), 111-115.
- Du Ting, Li Guodong, Thermodynamics and Precipitation Diagram of Cu-Ce-O, Cu-Ce-S, Cu-Ce-O-S Solutions. J.Chinese Journal of Metallurgy, 1993, 2 (7), 316-322.
- Du T, Li G D. Thermodynamics and phase equilibriumof Cu-Ce-O, Cu-Ce-S, Cu-Ce-O-S liquid solutions. J.Acta Metallurgica Sinica, 1993, 29 (7): 68.
- Zhang Shihong, Chen Yan, Li Haihong, et al., Thermodynamic research and practice of rare earth impurity removal and microalloying of purple copper. J.Rare Metals, 2017, 41 (5), 589-603.
- Tian Y Z, Ren Y P, Gao S, et al. Two-stage Hall-Petch relationship in Cu with recystallized structure. J. Journal of Materials Science & Technology, 2020, 48 (13): 31-35. [CrossRef]
|
Disclaimer/Publisher’s Note: The statements, opinions and data contained in all publications are solely those of the individual author(s) and contributor(s) and not of MDPI and/or the editor(s). MDPI and/or the editor(s) disclaim responsibility for any injury to people or property resulting from any ideas, methods, instructions or products referred to in the content. |
© 2024 by the authors. Licensee MDPI, Basel, Switzerland. This article is an open access article distributed under the terms and conditions of the Creative Commons Attribution (CC BY) license (http://creativecommons.org/licenses/by/4.0/).
