Submitted:
28 March 2024
Posted:
29 March 2024
You are already at the latest version
Abstract
Keywords:
1. Introduction
- Develop an adjoint-based CFD-PBPK model for vapors and nanomedicines.
- Evaluate the sensitivity of the filtration efficiency to the airway shape.
- Optimize the airway shape for prescribed species-specific filtration efficiencies.
2. Methods
2.1. Study Design
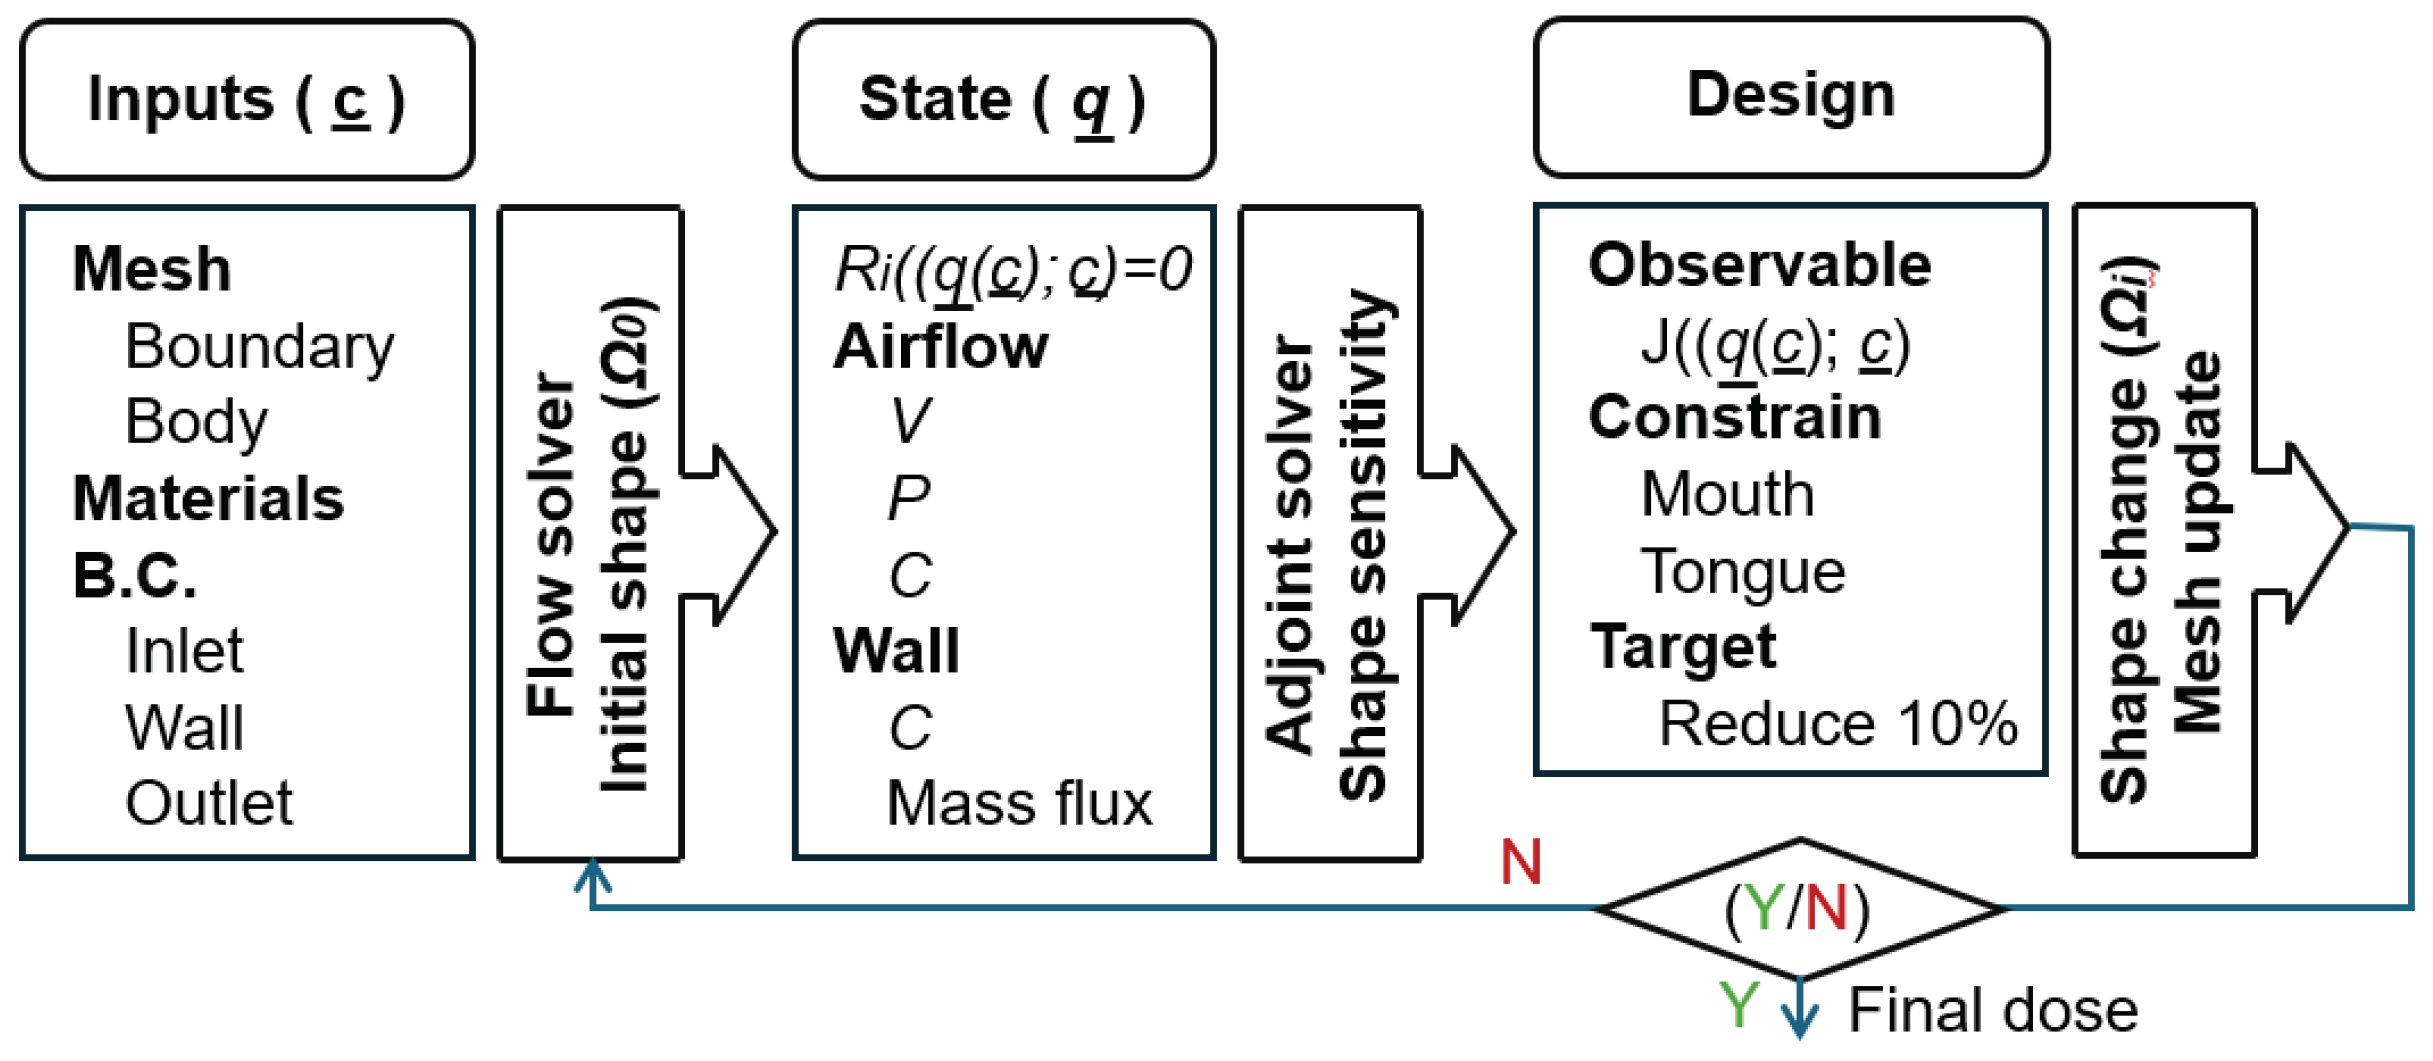
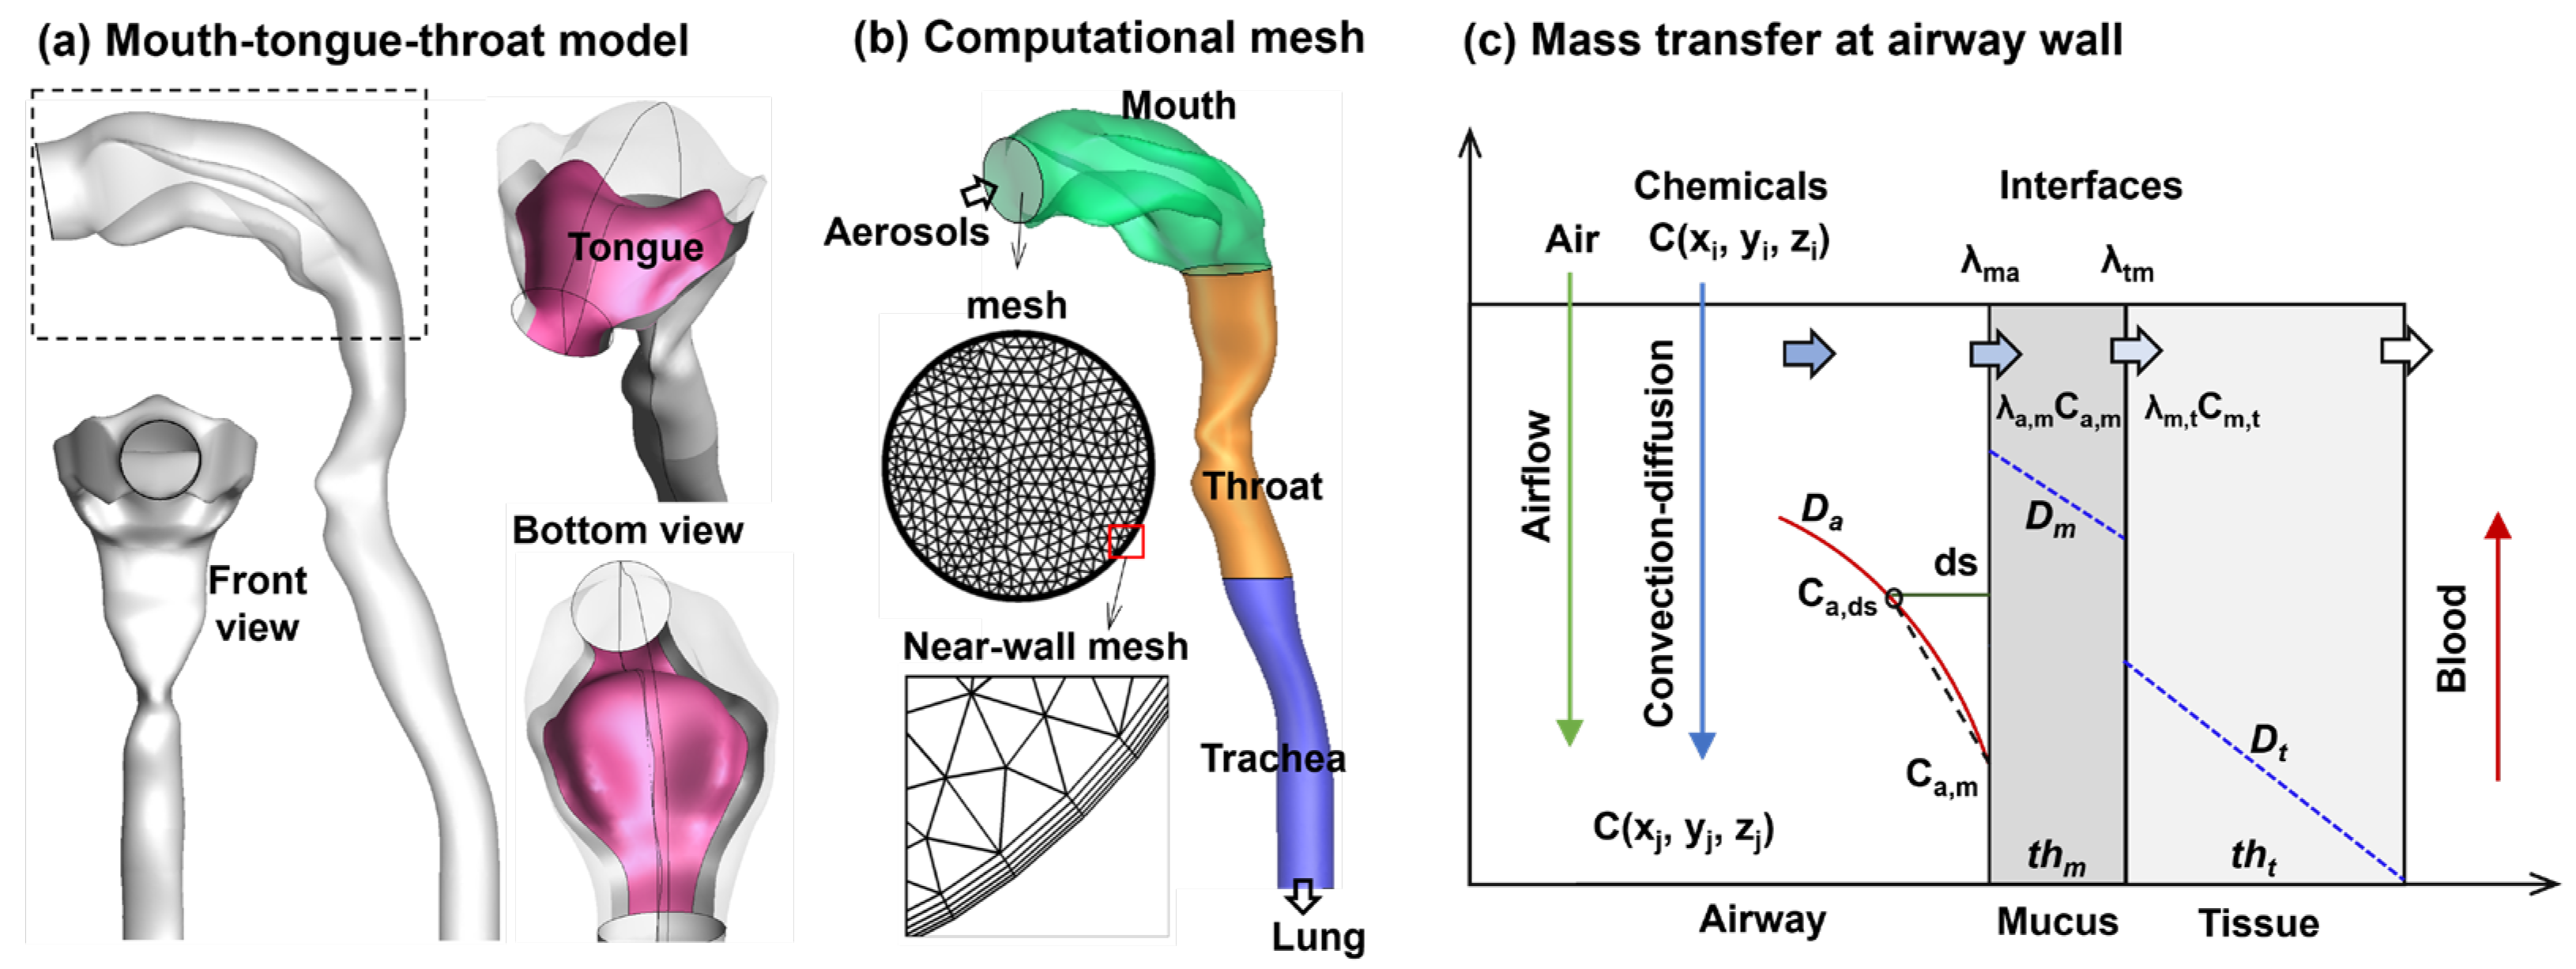
2.2. Airflow and Vapor Transport
2.2. Boundary Conditions at Air-Mucus Interface
2.2. Adjoint State Euqation
2.4. Numerical Methods
3. Results
3.1. Control Cases
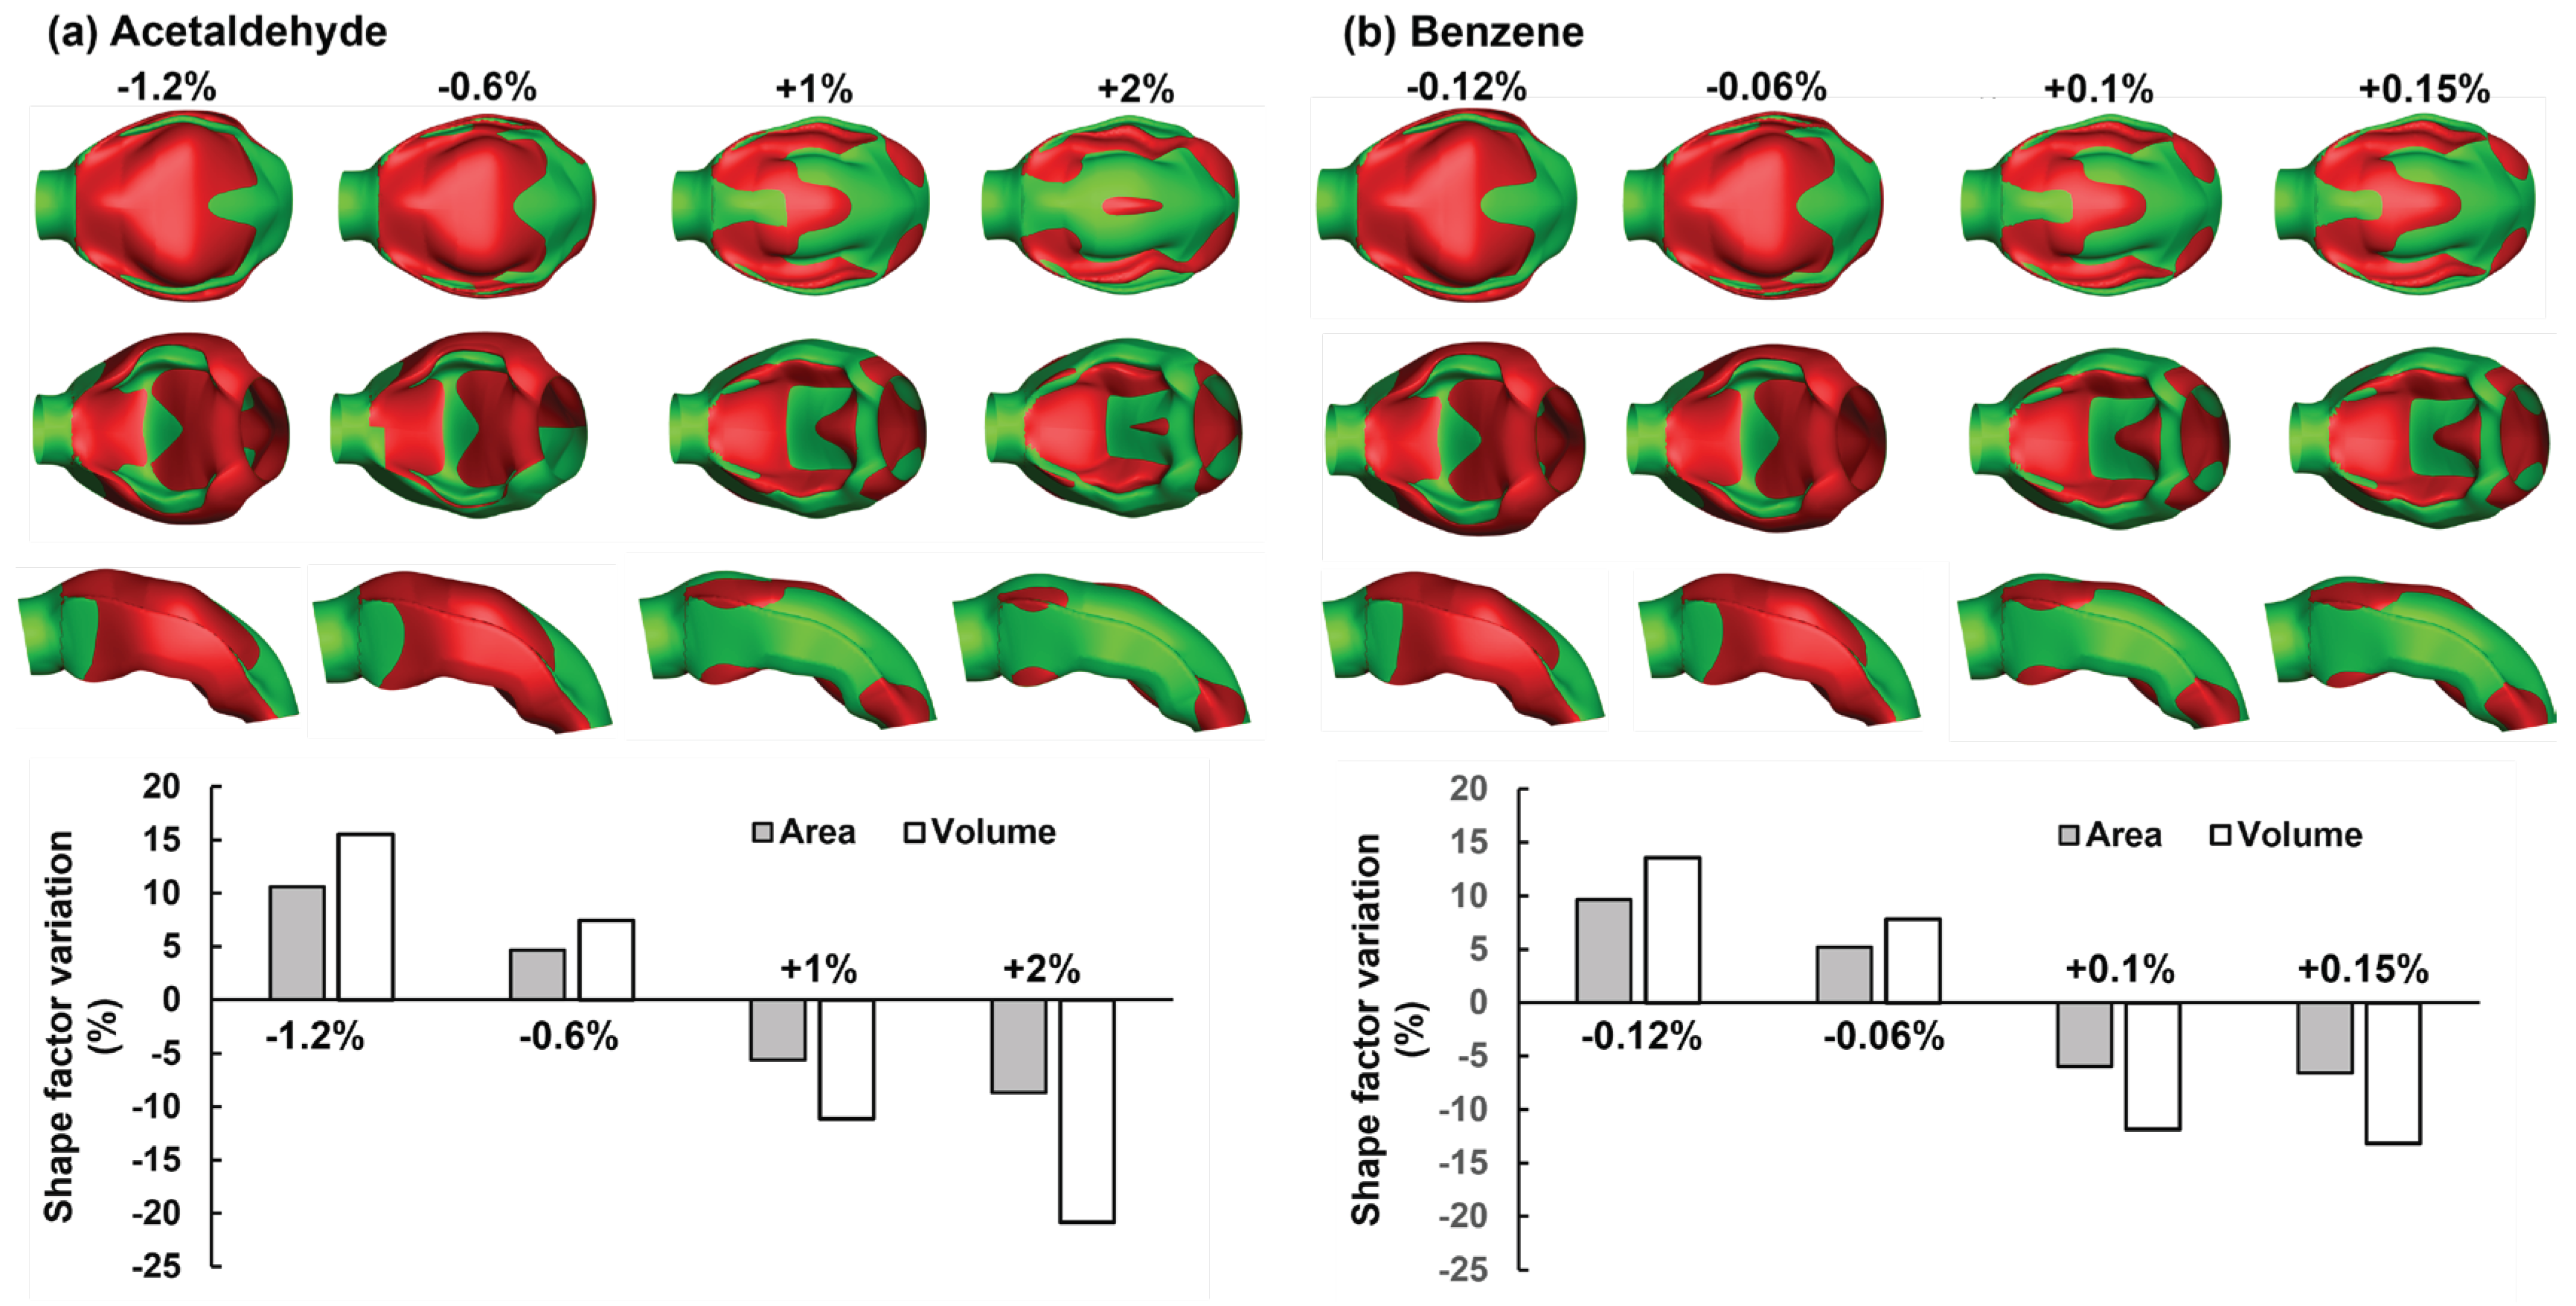
3.2. Adjoint-Modified Aiway Models with varying Observale Targets
3.3. Flow Fields in Adjoint-Modified Airway Models
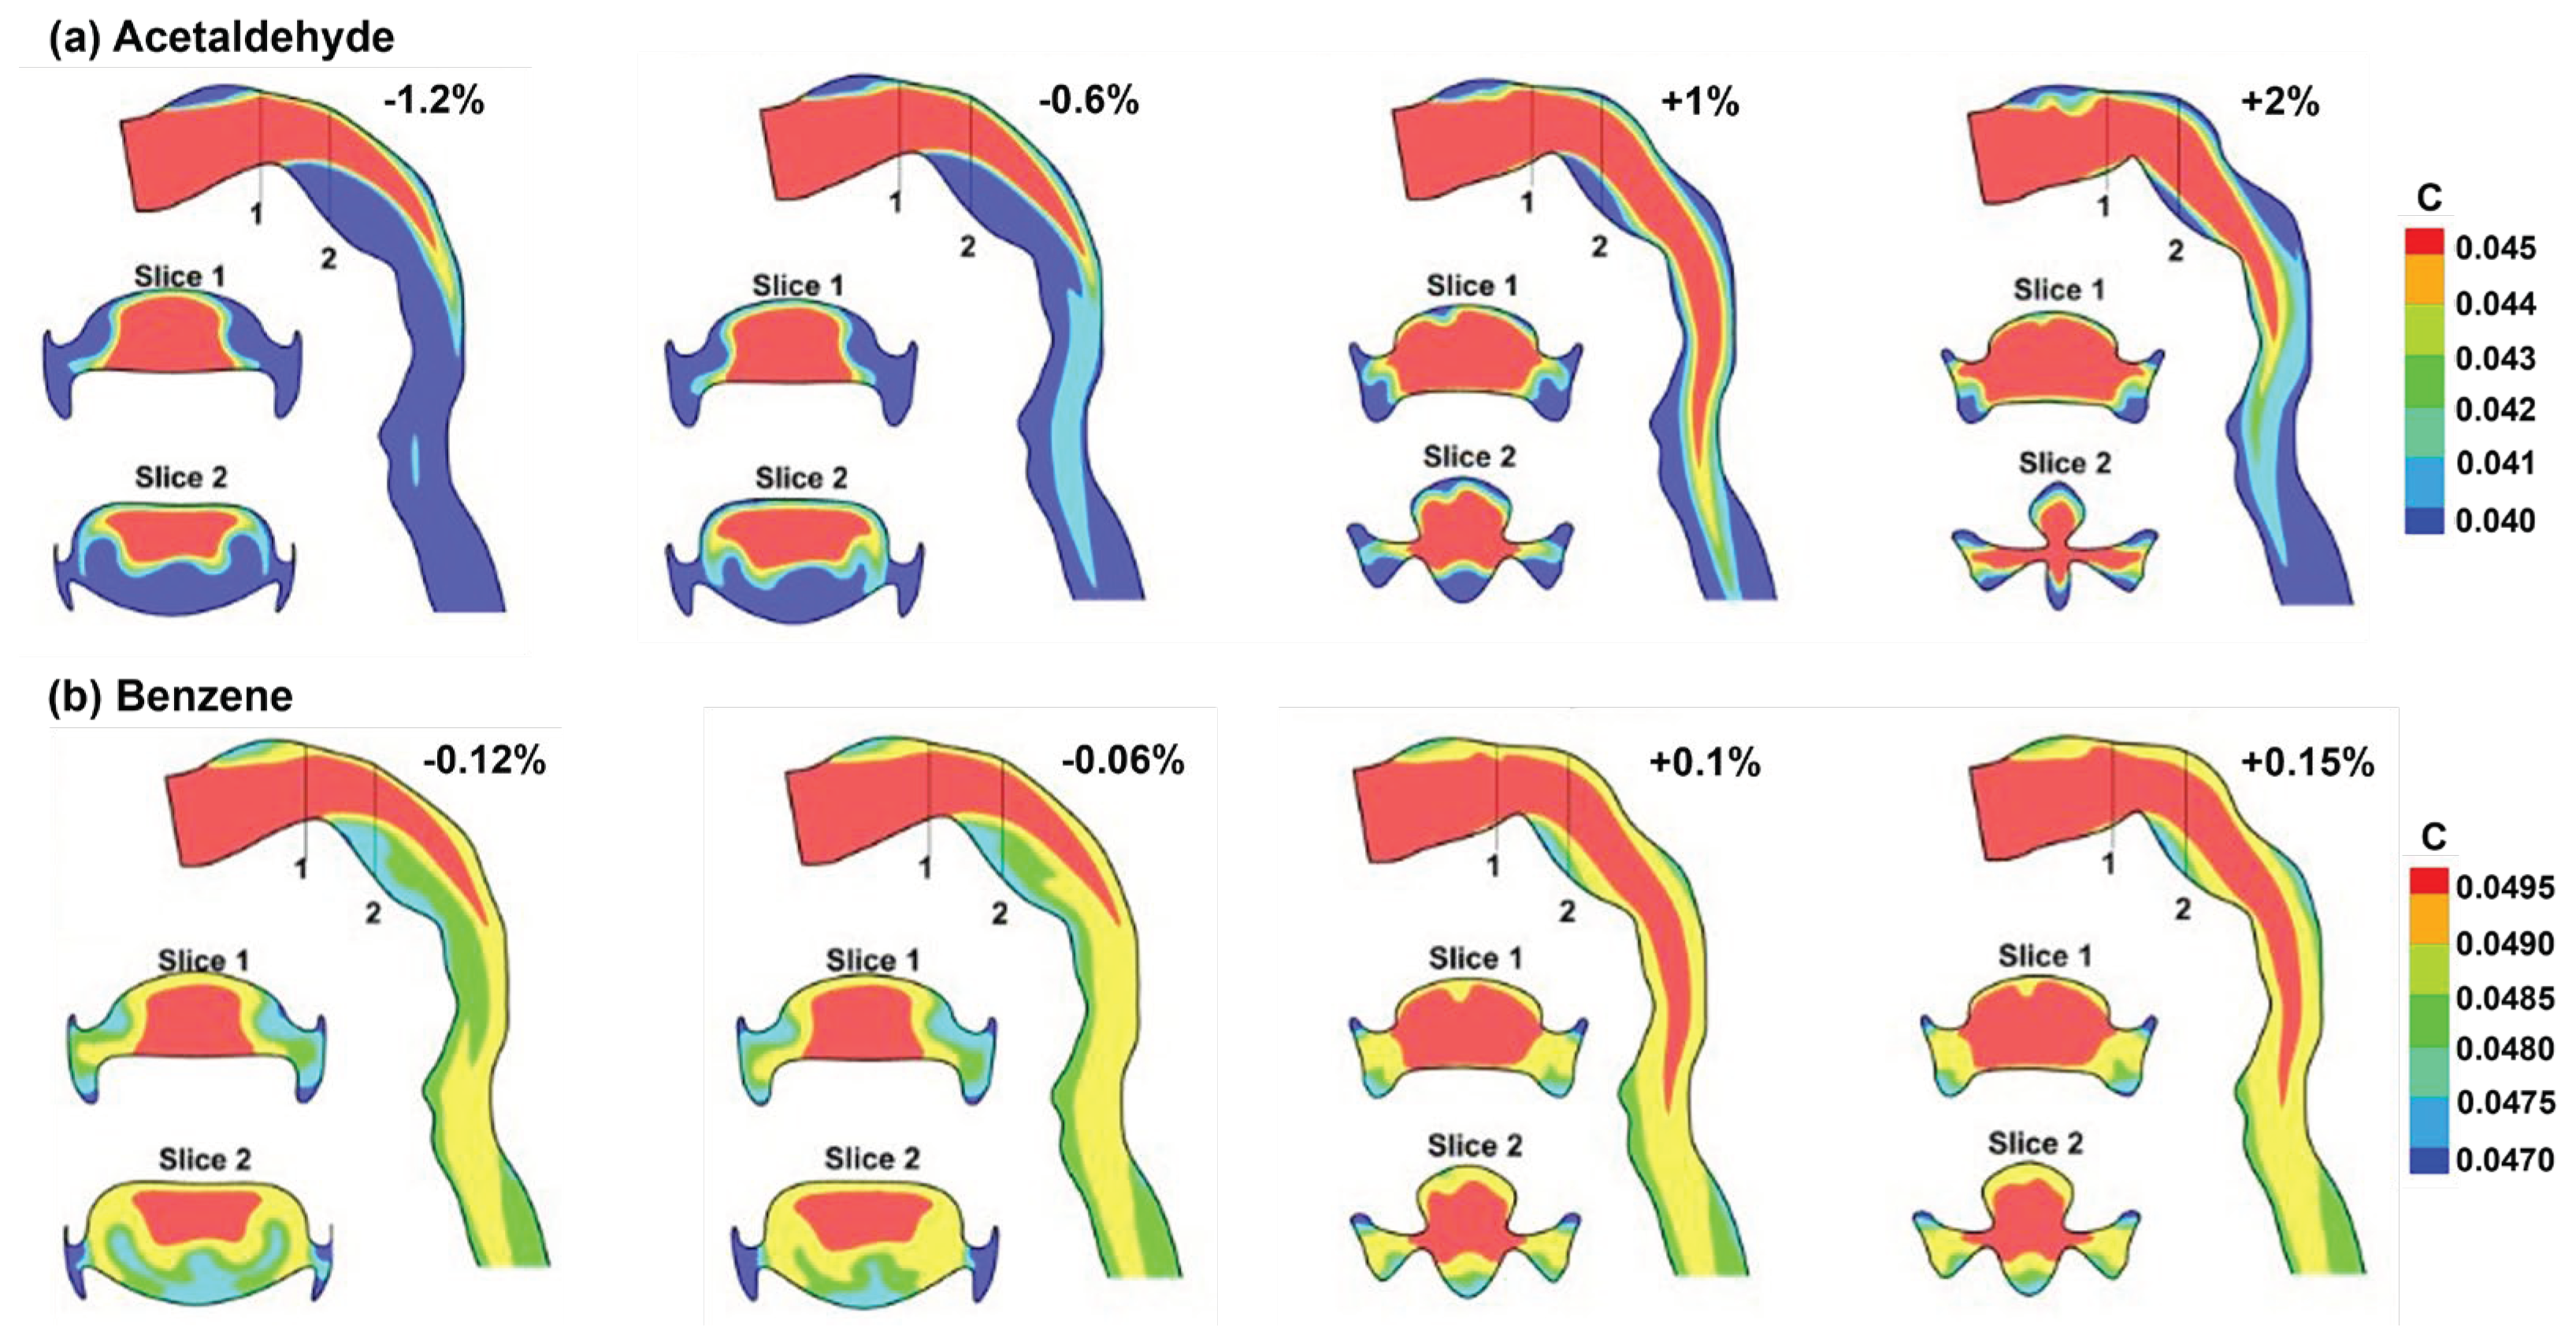
3.4. Vapor Transport and Wall Concentration in Adjoint-Modified Airway Models
4. Discussion
5. Conclusions
Author Contributions
Funding
Data Availability Statement
Acknowledgments
Conflicts of Interest
References
- Labiris, N.R.; Dolovich, M.B. Pulmonary drug delivery. Part I: physiological factors affecting therapeutic effectiveness of aerosolized medications. Br. J. Clin. Pharmacol. 2003, 56, 588–599. [Google Scholar] [CrossRef] [PubMed]
- Xi, J.; Walfield, B.; Si, X.A.; Bankier, A.A. Lung Physiological Variations in COVID-19 Patients and Inhalation Therapy Development for Remodeled Lungs. SciMedicine J. 2021, 3, 198–208. [Google Scholar] [CrossRef]
- Ochs, M.; Nyengaard, J.R.; Jung, A.; Knudsen, L.; Voigt, M.; Wahlers, T.; Richter, J.; Gundersen, H.J.G. The number of alveoli in the human lung. Am. J. Respir. Crit. Care Med. 2004, 169, 120–124. [Google Scholar] [CrossRef]
- Islam, M.S.; Paul, G.; Ong, H.X.; Young, P.M.; Gu, Y.T.; Saha, S.C. A review of respiratory anatomical development, air flow characterization and particle deposition. Int. J. Environ. Res. Public Health 2020, 17. [Google Scholar] [CrossRef] [PubMed]
- Kitaoka, H.; Takaki, R.; Suki, B. A three-dimensional model of the human airway tree. J. Appl. Physiol. 1999, 87, 2207–2217. [Google Scholar] [CrossRef] [PubMed]
- Wang, J.; Wainwright, D.K.; Lindengren, R.E.; Lauder, G.V.; Dong, H. Tuna locomotion: a computational hydrodynamic analysis of finlet function. J R. Soc. Interface 2020, 17, 20190590. [Google Scholar] [CrossRef] [PubMed]
- Zhao, J.; Feng, Y.; Fromen, C.A. Glottis motion effects on the particle transport and deposition in a subject-specific mouth-to-trachea model: A CFPD study. Computers in Biology and Medicine 2020, 116, 103532. [Google Scholar] [CrossRef] [PubMed]
- Talaat, M.; Si, X.A.; Tanbour, H.; Xi, J. Numerical studies of nanoparticle transport and deposition in terminal alveolar models with varying complexities. Med One 2019, 4, e190018. [Google Scholar]
- Wang, J.; Xi, J.; Han, P.; Wongwiset, N.; Pontius, J.; Dong, H. Computational analysis of a flapping uvula on aerodynamics and pharyngeal wall collapsibility in sleep apnea. J. Biomech. 2019, 94, 88–98. [Google Scholar] [CrossRef]
- Zhong, Q.; Dong, H.; Quinn, D.B. How dorsal fin sharpness affects swimming speed and economy. J. Fluid Mech. 2019, 878, 370–385. [Google Scholar] [CrossRef]
- Koehler, C.; Liang, Z.; Gaston, Z.; Wan, H.; Dong, H. 3D reconstruction and analysis of wing deformation in free-flying dragonflies. J. Exp. Biol. 2012, 215, 3018–3027. [Google Scholar] [CrossRef] [PubMed]
- Vinchurkar, S.; De Backer, L.; Vos, W.; Van Holsbeke, C.; De Backer, J.; De Backer, W. A case series on lung deposition analysis of inhaled medication using functional imaging based computational fluid dynamics in asthmatic patients: effect of upper airway morphology and comparison with in vivo data. Inhal. Toxicol. 2012, 24, 81–88. [Google Scholar] [CrossRef] [PubMed]
- Lepley, T.J.; Frusciante, R.P.; Malik, J.; Farag, A.; Otto, B.A.; Zhao, K. Otolaryngologists’ radiological assessment of nasal septum deviation symptomatology. Eur Arch Otorhinolaryngol 2023, 280, 235–240. [Google Scholar] [CrossRef] [PubMed]
- Corley, R.A.; Kabilan, S.; Kuprat, A.P.; Carson, J.P.; Minard, K.R.; Jacob, R.E.; Timchalk, C.; Glenny, R.; Pipavath, S.; Cox, T.; et al. Comparative computational modeling of airflows and vapor Dosimetry in the respiratory tracts of rat, monkey, and human. Toxicol. Sci. 2012, 128, 500–516. [Google Scholar] [CrossRef] [PubMed]
- Amjadimanesh, H.; Faramarzi, M.; Sadrizadeh, S.; Abouali, O. Micro-particle deposition in maxillary sinus for various sizes of opening in a virtual endoscopic surgery. Exp. Comput. Multiph. Flow 2023, 5, 262–271. [Google Scholar] [CrossRef]
- Wedel, J.; Steinmann, P.; Štrakl, M.; Hriberšek, M.; Ravnik, J. Can CFD establish a connection to a milder COVID-19 disease in younger people? Aerosol deposition in lungs of different age groups based on Lagrangian particle tracking in turbulent flow. Comput. Mech. 2021, 67, 1497–1513. [Google Scholar] [CrossRef] [PubMed]
- Shrestha, K.; Wong, E.; Salati, H.; Fletcher, D.F.; Singh, N.; Inthavong, K. Liquid volume and squeeze force effects on nasal irrigation using Volume of Fluid modelling. Exp. Comput. Multiph. Flow 2022, 4, 445–464. [Google Scholar] [CrossRef]
- Craven, B.A.; Neuberger, T.; Paterson, E.G.; Webb, A.G.; Josephson, E.M.; Morrison, E.E.; Settles, G.S. Reconstruction and morphometric analysis of the nasal airway of the dog (Canis familiaris) and implications regarding olfactory airflow. Anat. Rec. 2007, 290, 1325–1340. [Google Scholar] [CrossRef]
- Rygg, A.D.; Van Valkenburgh, B.; Craven, B.A. The influence of sniffing on airflow and odorant deposition in the canine nasal cavity. Chem. Senses 2017, 42, 683–698. [Google Scholar] [CrossRef]
- Corley, R.A.; Minard, K.R.; Kabilan, S.; Einstein, D.R.; Kuprat, A.P.; Harkema, J.R.; Kimbell, J.S.; Gargas, M.L.; Kinzell, J.H. Magnetic resonance imaging and computational fluid dynamics (CFD) simulations of rabbit nasal airflows for the development of hybrid CFD/PBPK models. Inhal. Toxicol. 2009, 21, 512–518. [Google Scholar] [CrossRef]
- Wu, Z.; Jiang, J.; Lischka, F.W.; McGrane, S.J.; Porat-Mesenco, Y.; Zhao, K. Domestic cat nose functions as a highly efficient coiled parallel gas chromatograph. PLOS Comput. Biol. 2023, 19, e1011119. [Google Scholar] [CrossRef] [PubMed]
- Dong, J.; Ma, J.; Tian, L.; Inthavong, K.; Ito, K.; Tu, J. Numerical analysis of nanoparticle transport and deposition in a cynomolgus monkey nasal passage. Int. J. Numer. Method. Biomed. Eng. 2021, 37, e3414. [Google Scholar] [CrossRef] [PubMed]
- Tian, L.; Dong, J.; Shang, Y.; Tu, J. Detailed comparison of anatomy and airflow dynamics in human and cynomolgus monkey nasal cavity. Comput. Biol. Med. 2022, 141, 105150. [Google Scholar] [CrossRef] [PubMed]
- Xi, J.; Si, X.A.; Malvè, M. Nasal anatomy and sniffing in respiration and olfaction of wild and domestic animals. Front Vet Sci 2023, 10, 1172140. [Google Scholar] [CrossRef] [PubMed]
- Tanabe, N.; Hirai, T. Recent advances in airway imaging using micro-computed tomography and computed tomography for chronic obstructive pulmonary disease. Korean J. Intern. Med. 2021, 36, 1294–1304. [Google Scholar] [CrossRef] [PubMed]
- Fernandez-Tena, A.; Fernandez-Francos, J.; Agujetas-Ortiz, R.; Casan-Clara, P. Airway model reconstructed from CT images. Eur. Respir. J. 2016, 48, PA4404. [Google Scholar]
- Xi, J.; Yang, T. Variability in oropharyngeal airflow and aerosol deposition due to changing tongue positions. J. Drug Deliv. Sci. Technol. 2019, 49, 674–682. [Google Scholar] [CrossRef]
- Gurani, S.F.; Di Carlo, G.; Cattaneo, P.M.; Thorn, J.J.; Pinholt, E.M. Effect of head and tongue posture on the pharyngeal airway dimensions and morphology in three-dimensional imaging: a systematic review. J. Oral Maxillofac. Res. 2016, 7, e1. [Google Scholar] [CrossRef] [PubMed]
- Wang, S.H.; Keenan, B.T.; Wiemken, A.; Zang, Y.; Staley, B.; Sarwer, D.B.; Torigian, D.A.; Williams, N.; Pack, A.I.; Schwab, R.J. Effect of weight loss on upper airway anatomy and the apnea-hypopnea index. the importance of tongue fat. Am. J. Respir. Crit. Care Med. 2020, 201, 718–727. [Google Scholar] [CrossRef]
- Horiguchi, T.; Kondo, R. Determination of the preferred tongue position for optimal inhaler use. J. Allergy Clin. Immunol. Pract. 2018, 6, 1039–1041.e1033. [Google Scholar] [CrossRef]
- Zhou, X.; Li, Y.; Miao, H.; Zhang, Y.; Yu, A.; Huang, F.; Li, R.; Tong, Z. Numerical study on the effect of the realistic mouth-inhaler positions on orally inhaled drug delivery in pediatric intersubject upper airways. Powder Technol. 2024, 432, 119163. [Google Scholar] [CrossRef]
- Yang, T.; Si, X.; Xi, J. Sensitivity analysis and uncertainty quantification of nanoparticle deposition from tongue morphological variations. Life 2024, 14, 406. [Google Scholar] [CrossRef] [PubMed]
- Jansen, J.D. Adjoint-based optimization of multi-phase flow through porous media – A review. Comput. Fluids 2011, 46, 40–51. [Google Scholar] [CrossRef]
- Martins, J.R.R.A. Aerodynamic design optimization: Challenges and perspectives. Comput. Fluids 2022, 239, 105391. [Google Scholar] [CrossRef]
- Li, Z.; Zheng, X. Review of design optimization methods for turbomachinery aerodynamics. Prog. Aerosp. Sci. 2017, 93, 1–23. [Google Scholar] [CrossRef]
- Fikl, A.; Le Chenadec, V.; Sayadi, T. Control and optimization of interfacial flows using adjoint-based techniques. Fluids 2020, 5, 156. [Google Scholar] [CrossRef]
- Ancourt, K.; Peter, J.; Atinault, O. Adjoint and direct characteristic equations for two-dimensional compressible euler flows. Aerospace 2023, 10, 797. [Google Scholar] [CrossRef]
- Alexias, P.; Giannakoglou, K.C. Shape optimization of a two-fluid mixing device using continuous adjoint. Fluids 2020, 5, 11. [Google Scholar] [CrossRef]
- Basse, N.T. Flow-based optimization of products or devices. Fluids 2020, 5, 56. [Google Scholar] [CrossRef]
- Russell, T.F.; Celia, M.A. An overview of research on Eulerian–Lagrangian localized adjoint methods (ELLAM). Adv. Water Resour. 2002, 25, 1215–1231. [Google Scholar] [CrossRef]
- Lu, J.; Xi, J.; Langenderfer, J.E. Sensitivity analysis and uncertainty quantification in pulmonary drug delivery of orally inhaled pharmaceuticals. J. Pharm. Sci. 2017, 106, 3303–3315. [Google Scholar] [CrossRef]
- Tian, G.; Longest, P.W. Application of a new dosimetry program TAOCS to assess transient vapour absorption in the upper airways. Inhal. Toxicol. 2010, 22, 1047–1063. [Google Scholar] [CrossRef]
- Tian, G.; Longest, P.W. Transient absorption of inhaled vapors into a multilayer mucus–tissue–blood system. Ann. Biomed. Eng. 2010, 38, 517–536. [Google Scholar] [CrossRef]
- Ghalichi, F.; Deng, X.; Champlain, A.D.; Douville, Y.; King, M.; Guidoin, R. Low Reynolds number turbulence modeling of blood flow in arterial stenoses. Biorheology 1998, 35, 281–294. [Google Scholar] [CrossRef] [PubMed]
- Wilcox, D.C. Turbulence Modeling for CFD, 2nd Ed. ed; DCW Industries, Inc.: California, 1998. [Google Scholar]
- Zhang, Z.; Kleinstreuer, C. Low-Reynolds-number turbulent flows in locally constricted conduits: A comparison study. AIAA Journal 2003, 41, 831–840. [Google Scholar] [CrossRef]
- Zhang, Z.; Kleinstreuer, C. Airflow structures and nano-particle deposition in a human upper airway model. Journal of Computational Physics 2004, 198, 178–210. [Google Scholar] [CrossRef]
- Longest, P.W.; Vinchurkar, S. Validating CFD predictions of respiratory aerosol deposition: effects of upstream transition and turbulence. J. Biomech. 2007, 40, 305–316. [Google Scholar] [CrossRef]
- ICRP. Human respiratory tract model for radiological protection; Elsevier Science Ltd.: New York, 1994; Volume 66. [Google Scholar]
- Tian, G.; Longest, P.W. Development of a CFD boundary condition to model transient vapor absorption in the respiratory airways. J. Biomech. Eng. 2010, 132, 051003. [Google Scholar] [CrossRef]
- Farazmand, M. An adjoint-based approach for finding invariant solutions of Navier–Stokes equations. J. Fluid Mech. 2016, 795, 278–312. [Google Scholar] [CrossRef]
- Gałecki, J.; Szumbarski, J. Adjoint-based optimal control of incompressible flows with convective-like energy-stable open boundary conditions. Computers & Mathematics with Applications 2022, 106, 40–56. [Google Scholar]
- Popovac, M. Continuous adjoint topology optimization of duct flow configurations with explicit volume constraint for design variable update. Energies 2022, 15, 7349. [Google Scholar] [CrossRef]
- Grossberg, S.; Jarman, D.S.; Tabor, G.R. Derivation of the adjoint drift flux equations for multiphase flow. Fluids 2020, 5, 31. [Google Scholar] [CrossRef]
- Sbai, M.A.; Larabi, A. On solving groundwater flow and transport models with algebraic multigrid preconditioning. Ground Water 2021, 59, 100–108. [Google Scholar] [CrossRef]
- Xi, J.; Si, X.; Kim, J.W.; Berlinski, A. Simulation of airflow and aerosol deposition in the nasal cavity of a 5-year-old child. J. Aerosol Sci. 2011, 42, 156–173. [Google Scholar] [CrossRef]
- Stein, L.; Straube, F.; Weinzierl, S.; Lemke, M. Directional sound source modeling using the adjoint Euler equations in a finite-difference time-domain approach. J Acoust Soc Am 2020, 148, 3075. [Google Scholar] [CrossRef]
- Sun, Q.; Dong, J.; Zhang, Y.; Tian, L.; Tu, J. Numerical study of the effect of nasopharynx airway obstruction on the transport and deposition of nanoparticles in nasal airways. Exp. Comput. Multiph. Flow 2022, 4, 399–408. [Google Scholar] [CrossRef]
- Zare, F.; Aalaei, E.; Zare, F.; Faramarzi, M.; Kamali, R. Targeted drug delivery to the inferior meatus cavity of the nasal airway using a nasal spray device with angled tip. Comput. Methods Programs Biomed. 2022, 221, 106864. [Google Scholar] [CrossRef]
- Vinchurkar, S.; Vos, W.; Holsbeke, C.; Backer, J.D.; Poli, G.; Backer, W.D. The effects of extrafine beclomethasone/formoterol on hyperinflation and airway geometry in COPD patients. Eur. Respir. J. 2012, 40, P4833. [Google Scholar]
- Si, X.; Xi, J.S.; Talaat, M.; Donepudi, R.; Su, W.-C.; Xi, J. Evaluation of impulse oscillometry in respiratory airway casts with varying cbstruction phenotypes, locations, and complexities. J. Respir. 2022, 2, 44–58. [Google Scholar] [CrossRef]
- Talaat, M.; Si, X.A.; Dong, H.; Xi, J. Leveraging statistical shape modeling in computational respiratory dynamics: Nanomedicine delivery in remodeled airways. Comput. Methods Programs Biomed. 2021, 204, 106079. [Google Scholar] [CrossRef] [PubMed]
- Xi, J.; Wang, Z.; Si, X.A.; Zhou, Y. Nasal dilation effects on olfactory deposition in unilateral and bi-directional deliveries: In vitro tests and numerical modeling. Eur. J. Pharm. Sci. 2018, 118, 113–123. [Google Scholar] [CrossRef]
- Xi, J.; Zhao, W. Correlating exhaled aerosol images to small airway obstructive diseases: A study with dynamic mode decomposition and machine learning. PLoS One 2019, 14, e0211413. [Google Scholar] [CrossRef]
- Menzer, A.; Gong, Y.; Fish, F.E.; Dong, H. Bio-inspired propulsion: towards understanding the role of pectoral fin kinematics in Manta-like swimming. Biomimetics 2022, 7, 45. [Google Scholar] [CrossRef]
- Gong, Y.; Wang, J.; Zhang, W.; Socha, J.J.; Dong, H. Computational analysis of vortex dynamics and aerodynamic performance in flying-snake-like gliding flight with horizontal undulation. Phys. Fluids 2022, 34. [Google Scholar] [CrossRef]
- Guo, J.; Zhang, W.; Han, P.; Fish, F.E.; Dong, H. Thrust generation and propulsive efficiency in dolphin-like swimming propulsion. Bioinspir. Biomim. 2023, 18, 056001. [Google Scholar] [CrossRef]





| Da (cm2/s) | λma | Dm (cm2/s) | λtm | Dt (cm2/s) | |
|---|---|---|---|---|---|
| Acetaldehyde | 8.0×10⁻² | 3.2×10² | 8.0×10⁻⁶ | 5.9×10⁻¹ | 2.64×10⁻⁶ |
| Benzene | 8.8×10⁻² | 4.4 | 9.8×10⁻⁶ | 4.1 | 3.23×10⁻⁶ |
Disclaimer/Publisher’s Note: The statements, opinions and data contained in all publications are solely those of the individual author(s) and contributor(s) and not of MDPI and/or the editor(s). MDPI and/or the editor(s) disclaim responsibility for any injury to people or property resulting from any ideas, methods, instructions or products referred to in the content. |
© 2024 by the authors. Licensee MDPI, Basel, Switzerland. This article is an open access article distributed under the terms and conditions of the Creative Commons Attribution (CC BY) license (http://creativecommons.org/licenses/by/4.0/).


