1. Introduction
The growth in population density, economic development and the increasing availability of products and services have brought with them the constant challenge of dealing with the management and disposal of urban solid waste [
1,
2]. About 40% of the Municipal Solid Waste (MSW) produced globally is directed to landfills, while approximately 30% is disposed of in open dumps [
3]. According to Sustainable Development Goal 11 (SDG 11) [
4], proper municipal waste management is critically significant for advancing sustainability and ensuring the preservation of natural resources for future generations [
5].
As a result, the proper management of Municipal Solid Waste (MSW) represents a substantial challenge for medium and large cities, as it requires complex considerations related to logistics, safety, environment, and energy aspects to ensure efficient management [
6]. The projection is that, by the year 2030, global waste production will reach the mark of 2.59 billion tons [
3].
In 2021, the Northern Region of Brazil was responsible for generating approximately 35.8% (about 1.773.927 tons per year) of Municipal Solid Waste (MSW) properly disposed of, while 64.4% (approximately 3.209.013 tons per year) had an inadequate destination [
7]. The constant increase on the amount of solid waste entails several problems regarding the transportation, storage, and disposal of these materials, making the efficient management of solid waste challenging [
8]. Despite the pressing needs for more sustainable approaches to waste management in order to address the environmental and public health challenges associated with this growing problem [
9]. In addition, solid waste (SW) covers several categories, including domestic, industrial, commercial, institutional, hospital, urban, agricultural, process, construction and demolition waste, and sweeping services [
10].
Notably, the Sars-covid pandemic has intensified the accumulation of waste, altering the pattern of generation with a significant increase in the production of plastics and household waste [
11]. This increase was driven by the growth in demand for food deliveries, resulting in an increase in the use of common plastic waste in packaging, such as polypropylene, low-density polyethylene, high-density polyethylene, polyethylene terephthalate and polystyrene [
12].
It is a fact that plastics are present everywhere and have become essential components of contemporary society, due to their characteristics of lightness, ease of molding and affordable cost. This scenario has contributed to a remarkable 20-fold increase in annual plastic production over the past five decades [
13]. By the year 2050, it is estimated that this production will consume more than 500 million metric tons of crude oil. Due to the overuse of plastic products and inadequate waste management, about 60% (wt.) of plastic solid waste is disposed of in the environment or destined for landfills [
14,
15]. In addition, Municipal Solid Waste (MSW) has considerable economic potential, and the efficiency of waste management systems plays a crucial role in determining this potential economic value [
16,
17]. The heterogeneous nature of solid waste, which often contains elements that are difficult to degrade and treat, presents challenges to assimilation by the environment, resulting in risks to environmental protection and consequences for public health [
18]. However, in order for MSW to be properly disposed of and treated, several steps are indispensable, following applicable guidelines through the development of solid waste management and management systems. These phases are essential to ensure that the handling, transportation, treatment, and final disposal of waste occur effectively [
19].
Effective implementation of an integrated system for Municipal Solid Waste (MSW) requires an in-depth understanding of the per capita generation and gravimetric composition of this waste. This aspect has been the subject of investigation in recent years by researchers such as [
20,
21,
22]. These studies focus on the sectorization of waste collection routes, gravimetric characterization, and energy valuation of the technological routes of MSW treatment [
8].
Carneiro [
23], one of the pioneers in exploring the economic potential of MSW generated in the municipalities of Belém
, host of COP Conference 30 in 2025, and the municipality of Ananindeua in the state of Pará [
22]. Their research allowed the identification of an average change of 13% in the amount of recycled material between 2000 and 2006, influenced by the social profile of the population [
20]. These significant contributions provide valuable insights for the development of comprehensive strategies in the integrated management of MSW, considering economic, environmental, and social aspects [
24].
In this scenario, it becomes essential to adopt advanced waste management practices to preserve the environment, protect public health, ecosystems, and promote global quality of life in the future [
6,
17]. In recent decades, advances have been made in sustainable waste management, especially in response to the challenges presented by a circular economy [
17,
24]. This paradigm involves the application of thermochemical technologies, such as pyrolysis, gasification, or combustion, to reduce, reuse, recycle, and recover waste [
25,
26]. Among them, municipal solid waste pyrolysis has recently become a hot topic and has gained much more attention as the fundamental and key stage of thermochemical conversion [
14].
Pyrolysis is a process of thermal conversion of a material into energy, where in an inert environment, high temperatures are used to produce gaseous products, liquids called bio-oil and solids called biochar [
27,
28], occurring at temperatures above 400 °C in the absence of oxygen. There are distinct forms of pyrolysis, encompassing 1) slow pyrolysis, 2) fast pyrolysis and 3) ultrafast pyrolysis, also known as flash pyrolysis. These categories encapsulate variations in terms of temperature, heating rate, residence time and the resulting products of each technique [
29,
30].
Slow pyrolysis occurs with a low heating rate (less than 2 ºC/s), a temperature below 500 ºC, and a long residence time, being used to maximize the production of carbon residue (solid fraction). Rapid pyrolysis, on the other hand, features high heating rates (10 to 200 ºC/s), a short residence time (0.5 to 2 s), and a moderate temperature (around 600 ºC), aiming for maximum liquid fraction production, with vapors quickly cooled for condensation. Flash pyrolysis occurs with even higher heating rates (more than 1000 ºC/s) and extremely short residence times, using very small material particles. In the case of municipal solid waste, flash pyrolysis results in a higher proportion of oil compared to rapid pyrolysis. However, this dynamic changes for plastic waste, where rapid pyrolysis generates a greater amount of gas compared to other products [
31,
32].
Catalytic pyrolysis is widely used to process mixtures of hydrocarbons, in controlled composition, to obtain fuels or chemical products. Thus, conventional catalytic cracking uses silica-alumina, zeolites, basic catalysts such as Na
2CO
3 and CaO [
33], or FCC catalysts (fluid catalytic cracking). It is important to highlight that catalytic pyrolysis is one of the most important processes in the refining industry, especially when it comes to the process of obtaining a gasoline of better quality and higher octane (through the optimization of aromatic and olefin contents) [
34,
35].
In recent years, the residual FCC catalyst has been employed in the catalytic pyrolysis of plastics [71–73]. Its moderate acidic resistance has proven effective in minimizing secondary hydrogen transfer reactions, preventing excessive cracking of olefins. Higher levels of acidity have not only increased the conversion and yield of light compounds such as gasoline and petroleum ether, but also the yields of gas and coke [71–73]. Investigating the effect of temperature and the percentage of zeolite-type FCC catalyst on the MSW (Municipal Solid Waste) fraction is crucial for various reasons, including environmental, economic, and technological aspects. Here are some important points: the temperature and the amount of catalyst directly affect the yield and efficiency of converting MSW into valuable products. Determining the optimal conditions can maximize the production of bio-oils. The morphology and crystalline structure of the biochar, as well as the chemical composition and acidity of the bio-oils, are influenced by the pyrolysis conditions. These properties determine the viability of the products for specific applications, such as fuels, chemicals, or adsorbent materials. The use of FCC zeolites can improve the selectivity of the reaction, favoring the formation of desired products and reducing the formation of undesirable compounds. This is essential for producing bio-oils with higher added value and better chemical properties.
To date, no research has investigated the effect of temperature and percentage of FCC zeolite discoveries in the mixture of MSW fractions (organic matter + paper + plastic) and their implications on biochar morphology and crystal structure, as well as on the yield of occurrence products, chemical composition and acidity of bio-oils obtained by pyrolysis and catalytic pyrolysis.
In this context, this work proposes to investigate the thermal and catalytic pyrolysis process using FCC zeolite in mass percentages of 5%, 10% and 15% for MSW fractions (organic matter + paper + plastic). The study will evaluate the quality and yield of the products obtained at temperatures of 400°C, 450°C and 475°C at 1 atm, aiming at obtaining biofuels. Additionally, the liquid organic products (bio-oil) will be analyzed regarding their chemical composition and production yields and the crystallographic and morphological characteristics of the biochars produced will be evaluated.
(Populus nigra x P.
2. Materials and Methods
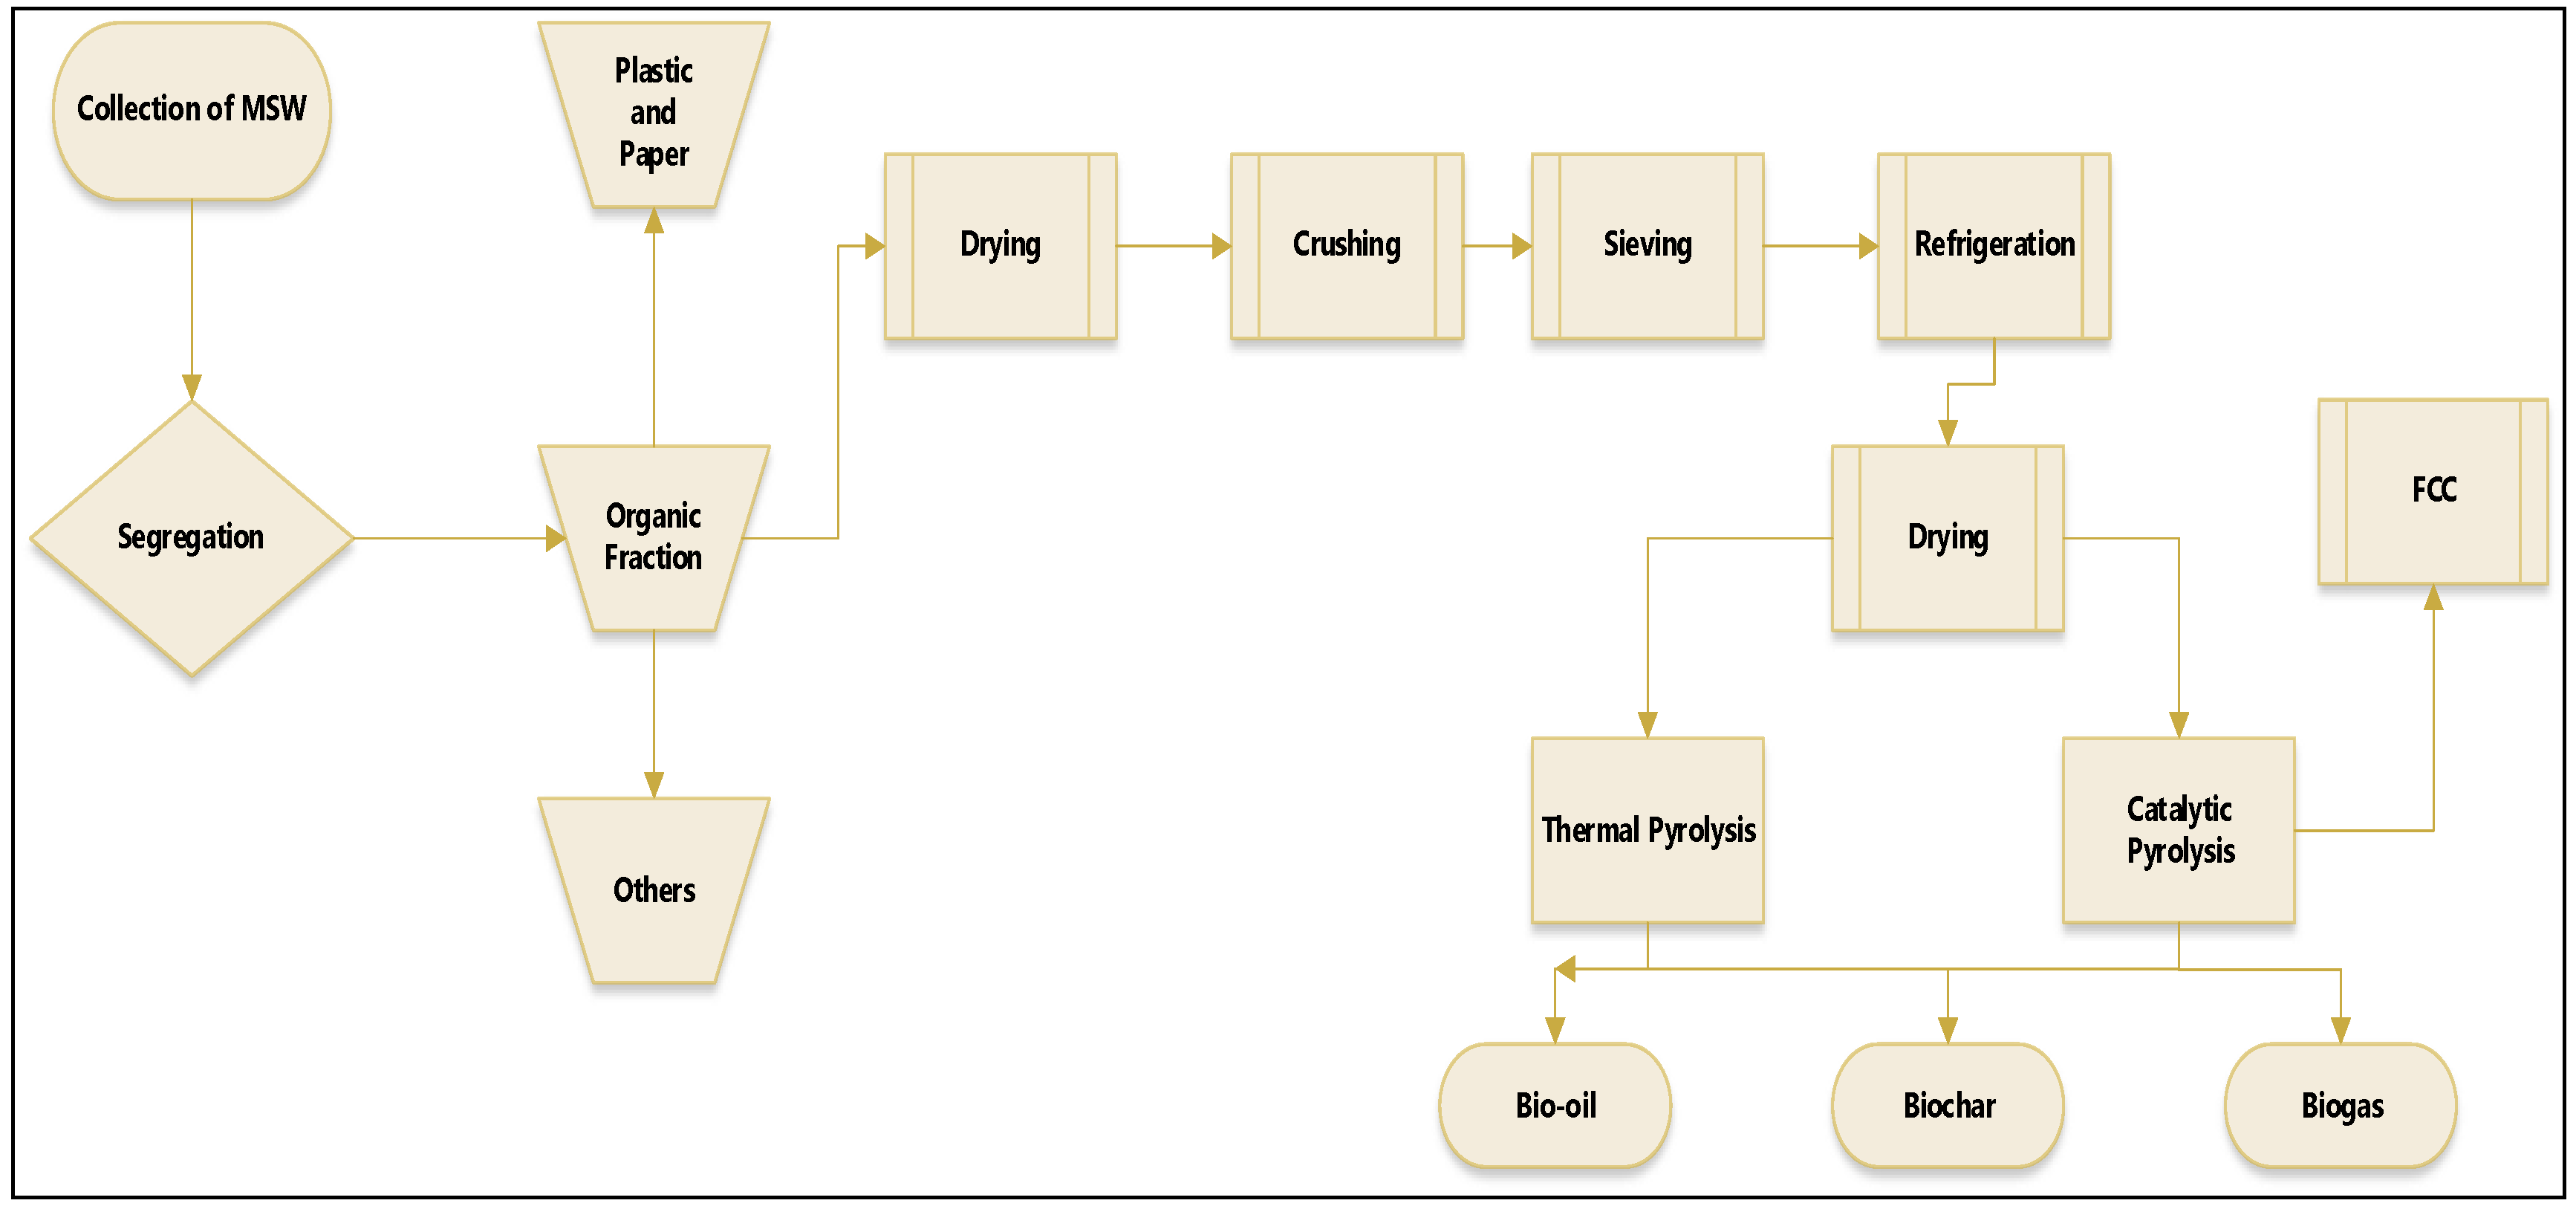
The methodology applied in the research is illustrated in
Figure 1, which summarizes well the methodology of the process, described as a logical sequence of ideas, methods and procedures for sustainable disposal and thermal treatment of Municipal Solid Waste (MSW) to produce biochar and bio-oil from pyrolysis and catalytic pyrolysis on a laboratory scale.
This work uses a methodology similar to Assunção et al. [
37], in which the definition of the study area was the municipality of Belém/Pará, in which the provision of solid waste collection services is carried out by the company TERRAPLENA LTDA is responsible for Lot 1, as presented in the Municipal Basic Sanitation Plan of Belém [
38]. It is crucial to understand the specific context of basic sanitation conditions in this region, 21 neighborhoods are included in this area that cover a significant part of the city and have the presence of 37 routes, indicating the extent of the coverage of the company TERRAPLENA LTDA in the provision of services related to basic sanitation, such as solid waste collection, water and sewage treatment, among others. This information is valuable for assessing the efficiency and comprehensiveness of sanitation services in the region, as well as for identifying any challenges or areas that need improvement.
In addition, the inclusion of neighborhoods with different socioeconomic characteristics can influence the demands and needs of the population in terms of basic sanitation services. The analysis of this distribution can be useful to guide public policies and investments aimed at improving the living conditions and health of the local population. In order to reduce the size of the sample space for collection, route 1202 was randomly chosen, the internal coding of the route, corresponding to the neighborhoods of Cremação and Guamá. The choice of the respective route as a significant representation for the gravimetric analysis of urban solid waste in Belém is justified on the basis of several important criteria: The stratification of the neighborhoods of Cremação and Guamá into classes D and E, according to the 2010 IBGE definition [
10] table 1, suggests that these areas have a predominance of families with lower income, this socioeconomic stratification is relevant to understand how the financial conditions of the population can influence the generation and management of urban solid waste; when considering the average per capita household income of classes D and E in the neighborhoods of Belém, which totals 85.71%, and the population of these classes in the city, which represents 92.01%, the school on route 1202 covers a significant portion of the population that may be more vulnerable to issues related to solid waste; gravimetric analysis of municipal solid waste on route 1202 can provide detailed insights into the generation, composition and distribution patterns of this waste in areas with specific socioeconomic characteristics; The strategic selection of route 1202 allows for a more targeted and efficient approach to data collection, focusing efforts on a representative area, where results can have broader implications for waste management planning in the city.
The Cremação neighborhood is in the developed urban center and its proximity to neighborhoods such as Nazaré, São Brás and Batista Campos indicate significant integration into the urban fabric of Belém. The population of 31,264 inhabitants, with a per capita income of R
$ 1,093.9, according to IBGE data from 2010 [
10], classifies the neighborhood in economic class D.
These data indicate a specific socioeconomic profile, with a predominance of lower-income families. The presence of fairs, shops, schools, residential buildings, and houses highlights the diversity of activities and services available in the neighborhood. This also suggests a certain economic and social vitality in the region. The information that the neighborhood benefits from solid waste collection carried out on alternate days highlights an important basic sanitation service. The efficiency of this service can have significant impacts on quality of life and the local environment.
The information provided about the Guamá neighborhood offers a comprehensive view of its demographic, economic and urban characteristics. Guamá is highlighted as the most populous neighborhood in Belém, with 94,610 inhabitants in 2010. This expressive number highlights the demographic importance of this region within the municipality. The per capita income of R$525.8 and the economic classification as class E indicate that the neighborhood faces socioeconomic challenges, with a predominance of families with lower incomes. The availability of solid waste collection services, which can be frequent, daily, or alternate, is crucial for adequate waste management in the community. This information is vital to understanding the basic sanitation infrastructure in the region. The description of the diverse area of Guamá, which includes the busy Guamá fair, commercial areas, schools, and the Santa Izabel cemetery, highlights the multiplicity of activities and services available in the neighborhood.
2.1. Gravimetric Composition of Urban Solid Waste
To calculate the volume of samples necessary to determine the gravimetric composition of the total mass of waste collected, the STATIDISK 13.0 software was used, which is a tool commonly used for statistical analysis, including sample size calculations. in experiments.
The capacity of the collection truck was considered as fundamental parameters for the simulation, which is essential for understanding the variability and characteristics of the population. A volume of 15m³ was considered as the population size for each route, as well as a significance level of 5% was adopted in the statistical tests and the confidence level of 95% was chosen, indicating the desired confidence in the results. Finally, the margin of error was set at 10%. Based on the parameters adopted, the simulation resulted in a sample mass of approximately 100 kg [
40].
The calculated sample mass is the representative quantity required to perform an accurate and reliable analysis of the gravimetric composition of the waste. The choice of significance level, confidence level and margin of error reflects the concern with the statistical validity of the results Assunção et al. [
37] and Pereira et al. [
39].
The gravimetric analysis approach considering the separation of solid waste into different fractions is a valuable practice to understand the detailed composition of the waste generated. Fractions identified included: Paper, Cardboard, Tetrapak, Rigid Plastic, Malleable Plastic, Glass, Metal, Organic Matter, Fabrics, Sanitary Waste and Rejects/Others. This approach allows for a more refined and specific analysis compared to a broader characterization. Each fraction can be associated with different sources of waste and has different implications for waste management. The process begins with measuring the total mass of waste, which is crucial to guide the gravimetry process and ensure the representativeness of the sample. The reference to the work of Assunção et al. [
37] suggests the use of a specific methodology or protocol for gravimetric characterization.
By characterizing each fraction of waste, it is possible to obtain a more precise view of the proportions of each type of material in the total mass, identifying specific areas of intervention to optimize waste management. This information is valuable for recycling strategies, composting, and other waste treatment and disposal approaches. Furthermore, by detailing specific waste, such as sanitary waste, the analysis can contribute to the development of more targeted solutions, aiming to reduce or adequately treat these specific waste Guérin et al. [
41].
Four collections were carried out following the schedule of internal routes of the company TERRAPLENA LTDA on days (Monday, Wednesday, and Friday) and time (morning), in the month of October 2021. The sampling process was carried out in accordance with Solid Waste Sampling [
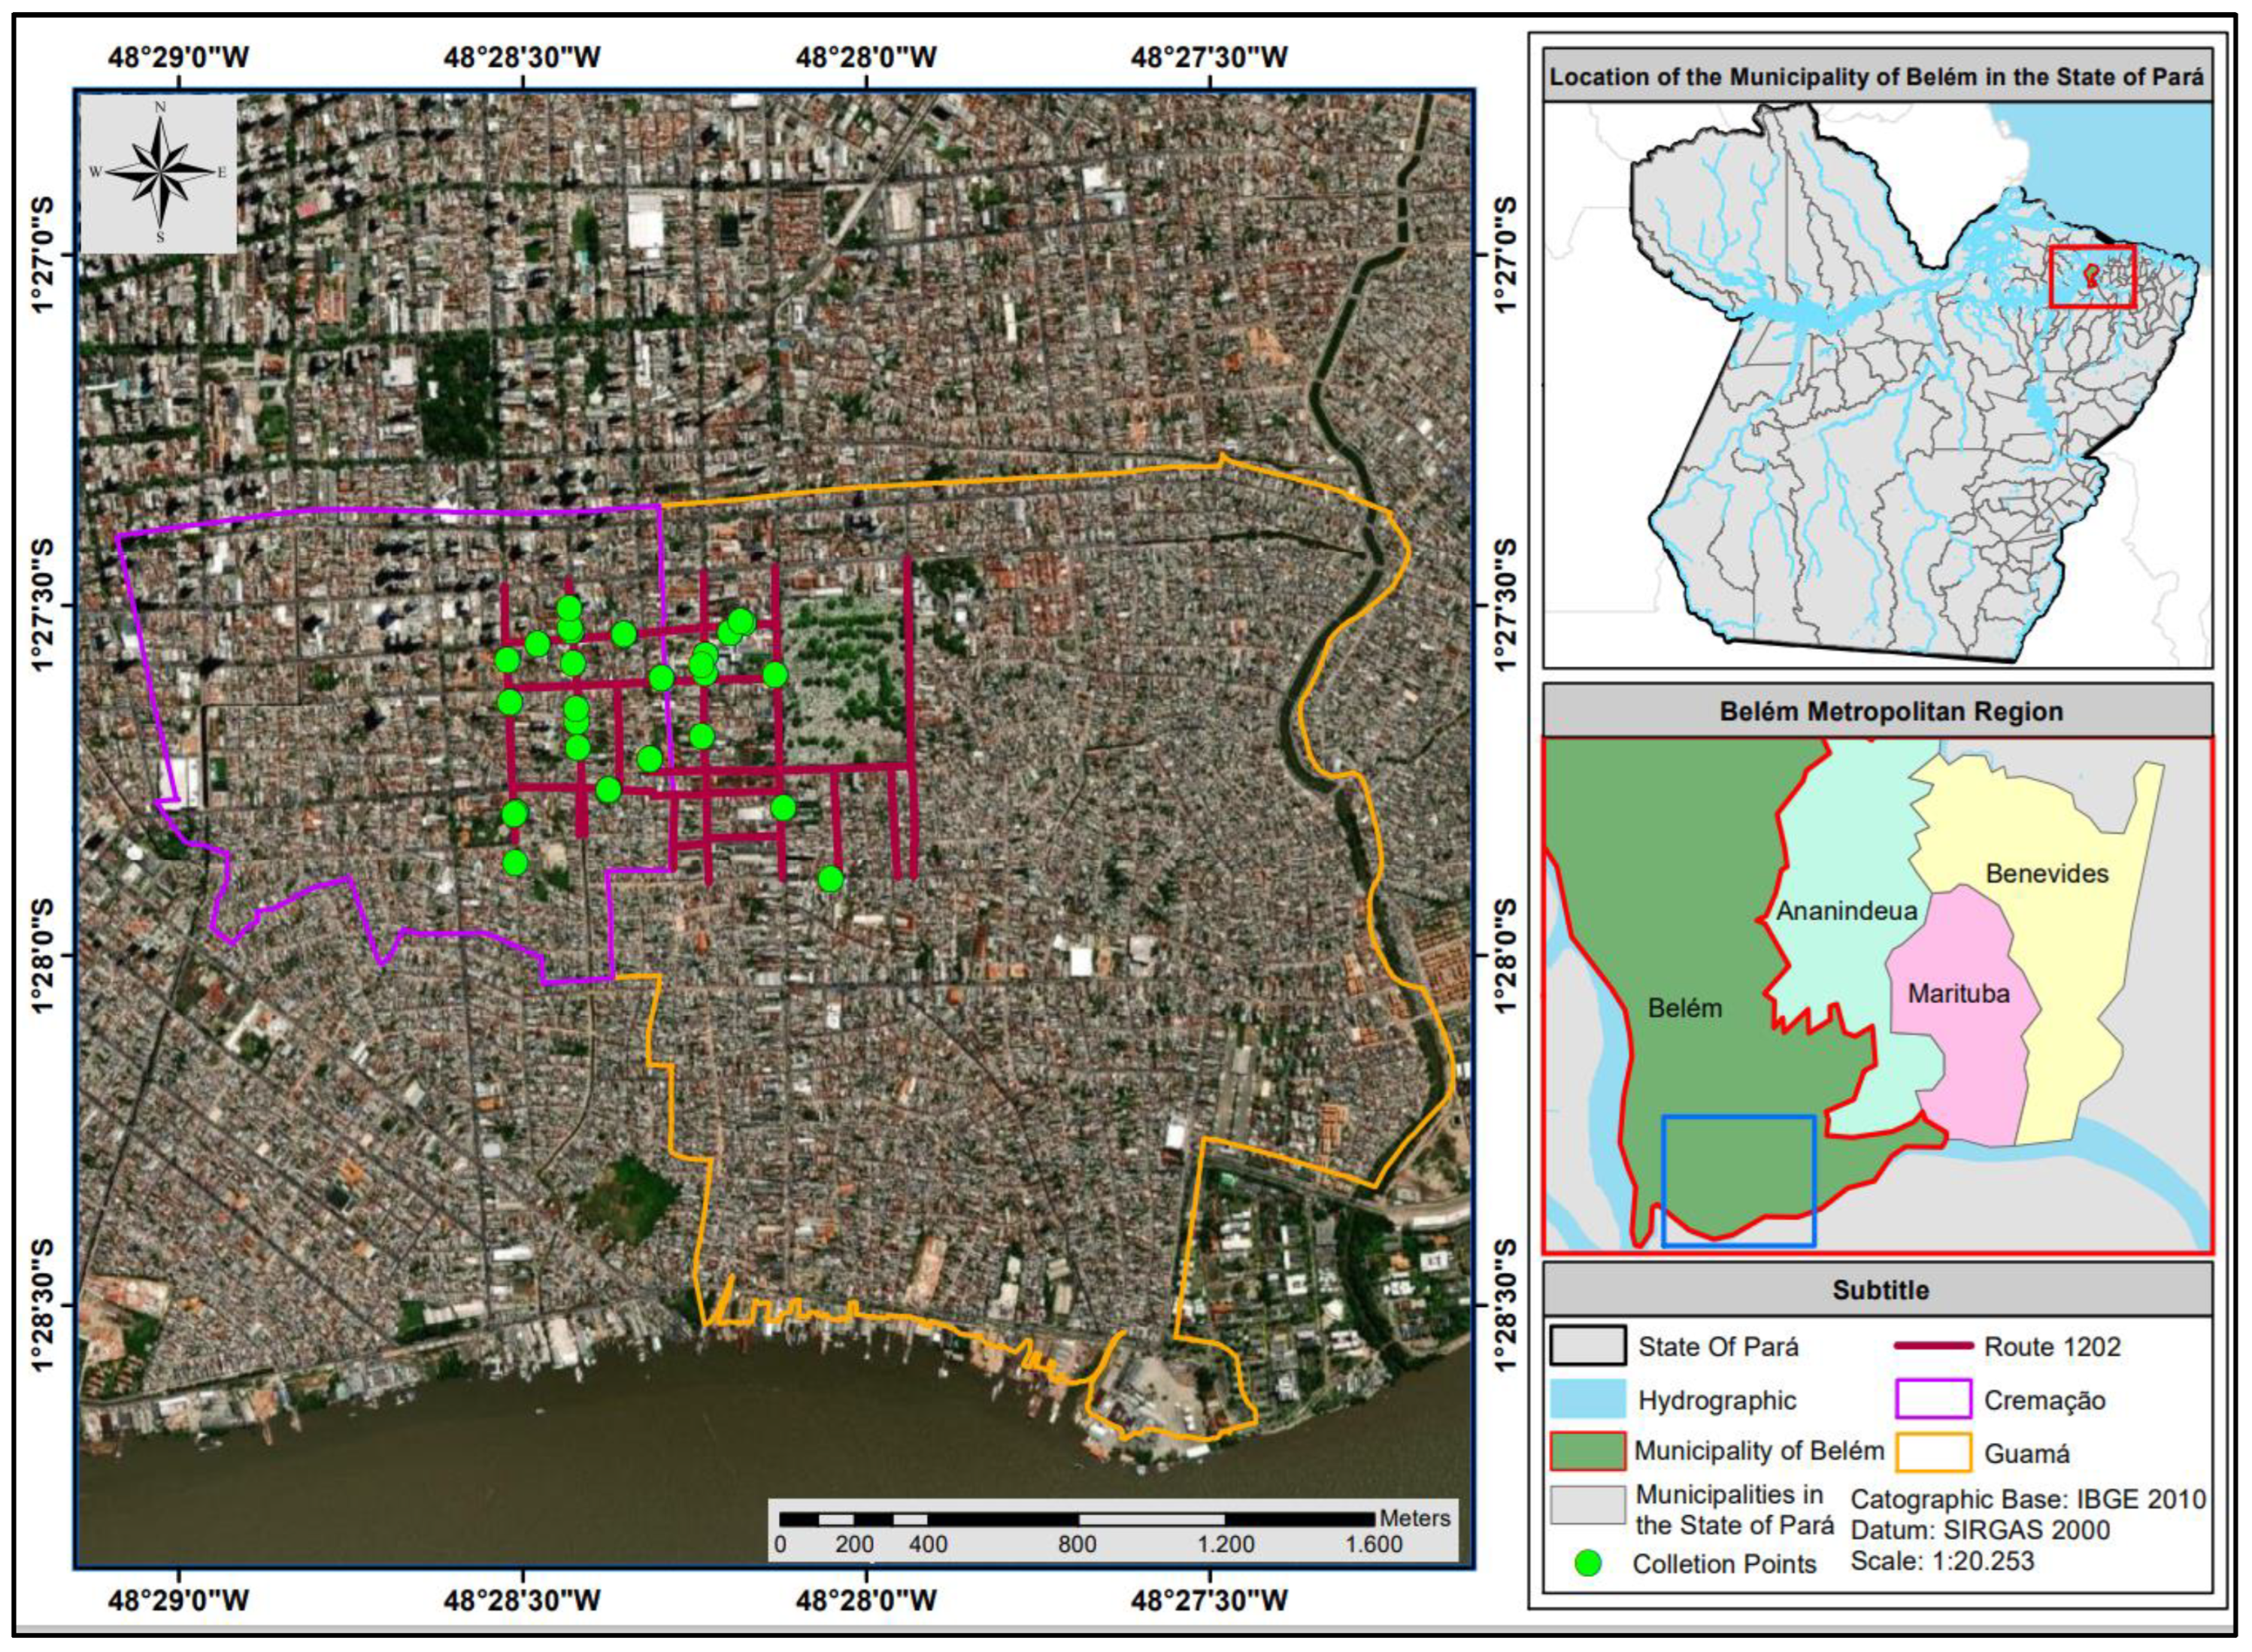
42]. The process described for monitoring the route of the Urban Solid Waste (RSU) compactor truck from the company TERRAPLENA LTDA involved a well-structured methodological approach. Here are some notable points: following the route with a support vehicle is an efficient practice to ensure that the compactor truck follows the planned route and to facilitate data collection along the way, use of a GPS device Garmin Montana 600 for georeferencing is an effective tool for accurately mapping collection locations. The photographic record complements this information, providing visual documentation of the sampling points (
Figure 2).
The samples were collected in plastic bags with a capacity of 200 kg, at random points along the route of the solid waste compactor truck, which sought to demonstrate careful planning to obtain representative data on the composition of household waste. Sampling at random points is an important practice to avoid bias in collection by ensuring that data will reflect a variety of conditions along the route. Prioritizing residential locations is an effective approach to obtain a more comprehensive range of household waste. This is crucial for understanding disposal practices and informing waste management in these contexts Botti et al. [
43].
The material was then transported to the Sludge and Composting experiment area at UFPA (100 m²), which is flat and free from moisture. The waste was weighed and deposited on a surface waterproofed by tarpaulins (6 x 6 m). Finally, the MSW was segregated/classified manually into fractions of Paper, Cardboard, Tetrapak, Rigid Plastic, Malleable Plastic, Glass, Metal, Organic Matter, Fabrics, Sanitary Waste and Rejects/Others and weighed on a digital scale (Welmy, São Paulo -Brazil, Model: W200/50).
Figure 1.
General flowchart of the methodological procedure adopted by collecting, segregating and pre-treating MSW and thermal processing of pre-treated (organic matter + paper + plastic) at 400, 450 and 475 °C, 1.0 atm, 0.0.5.0, 10.0 and 15.0% (by mass) of FCC, on a laboratory scale, adapted from Assunção et al. [
37].
Figure 2.
Door-to-door collection points for Urban Solid Waste in the Cremação and Guamá neighborhoods of the city of Belém-PA.
Figure 2.
Door-to-door collection points for Urban Solid Waste in the Cremação and Guamá neighborhoods of the city of Belém-PA.
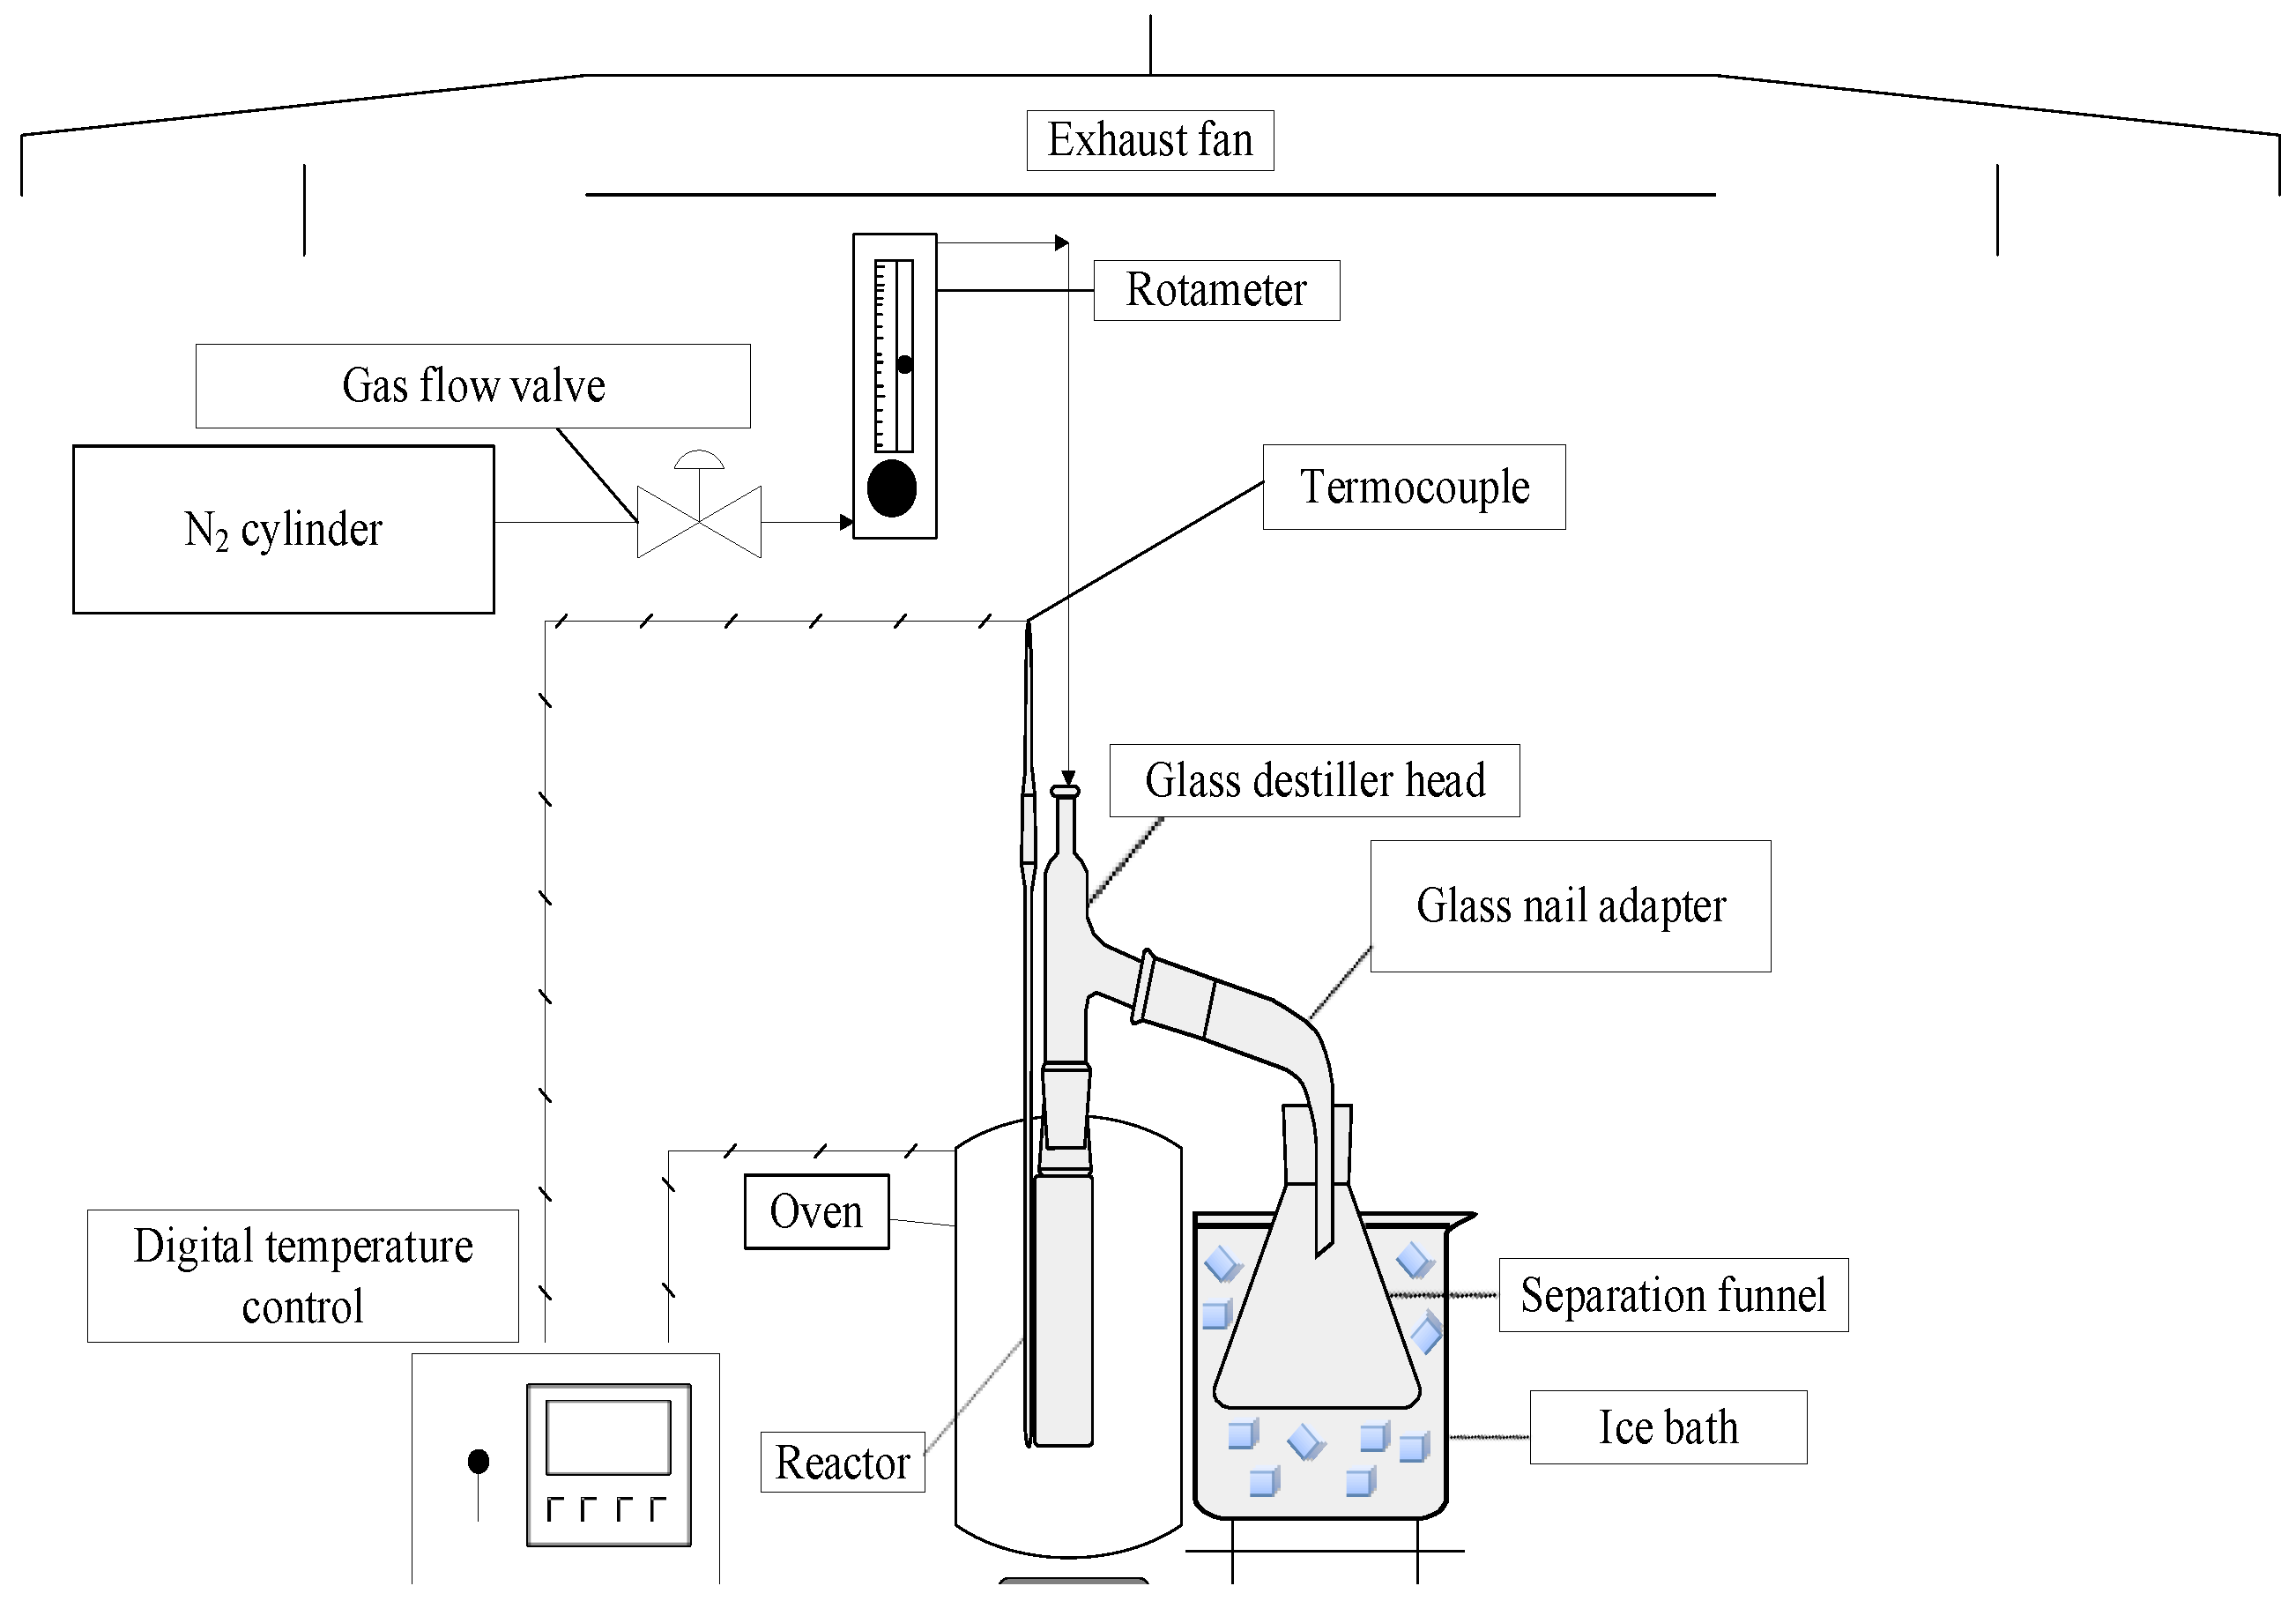
Figure 3.
Schema of laboratory scale borosilicate glass reactor.
Figure 3.
Schema of laboratory scale borosilicate glass reactor.
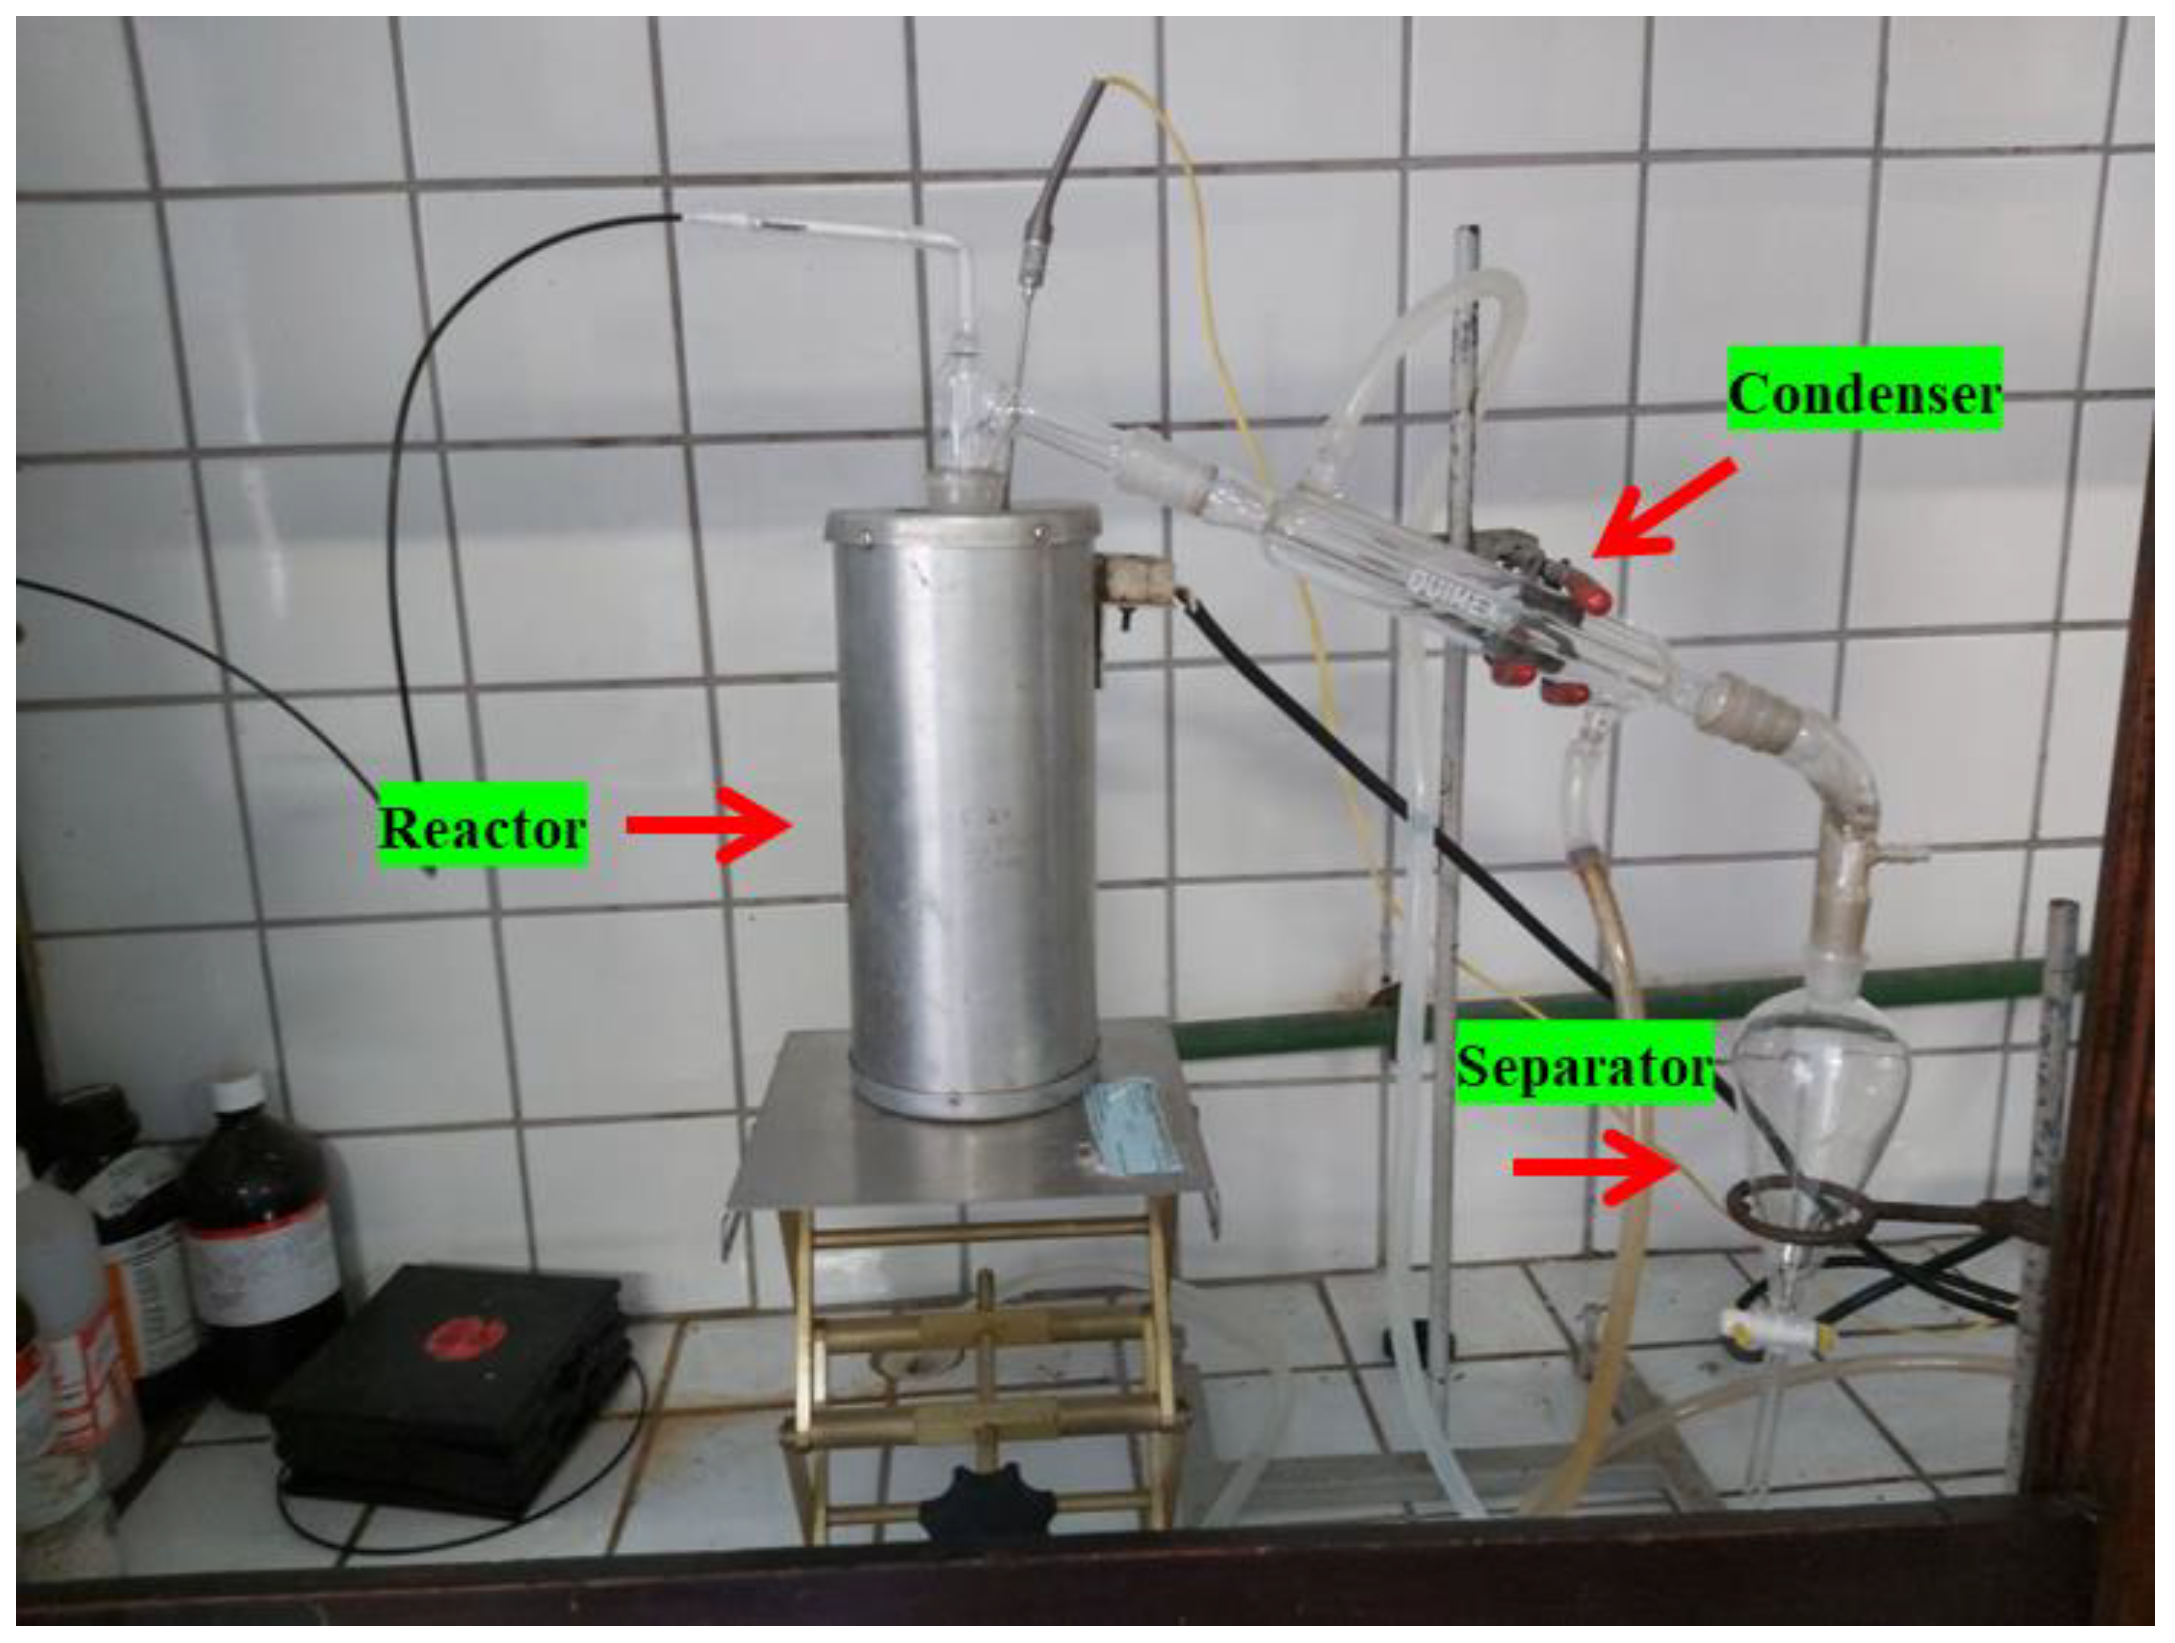
Figure 4.
Experimental apparatus (glass reactor in laboratory scale).
Figure 4.
Experimental apparatus (glass reactor in laboratory scale).
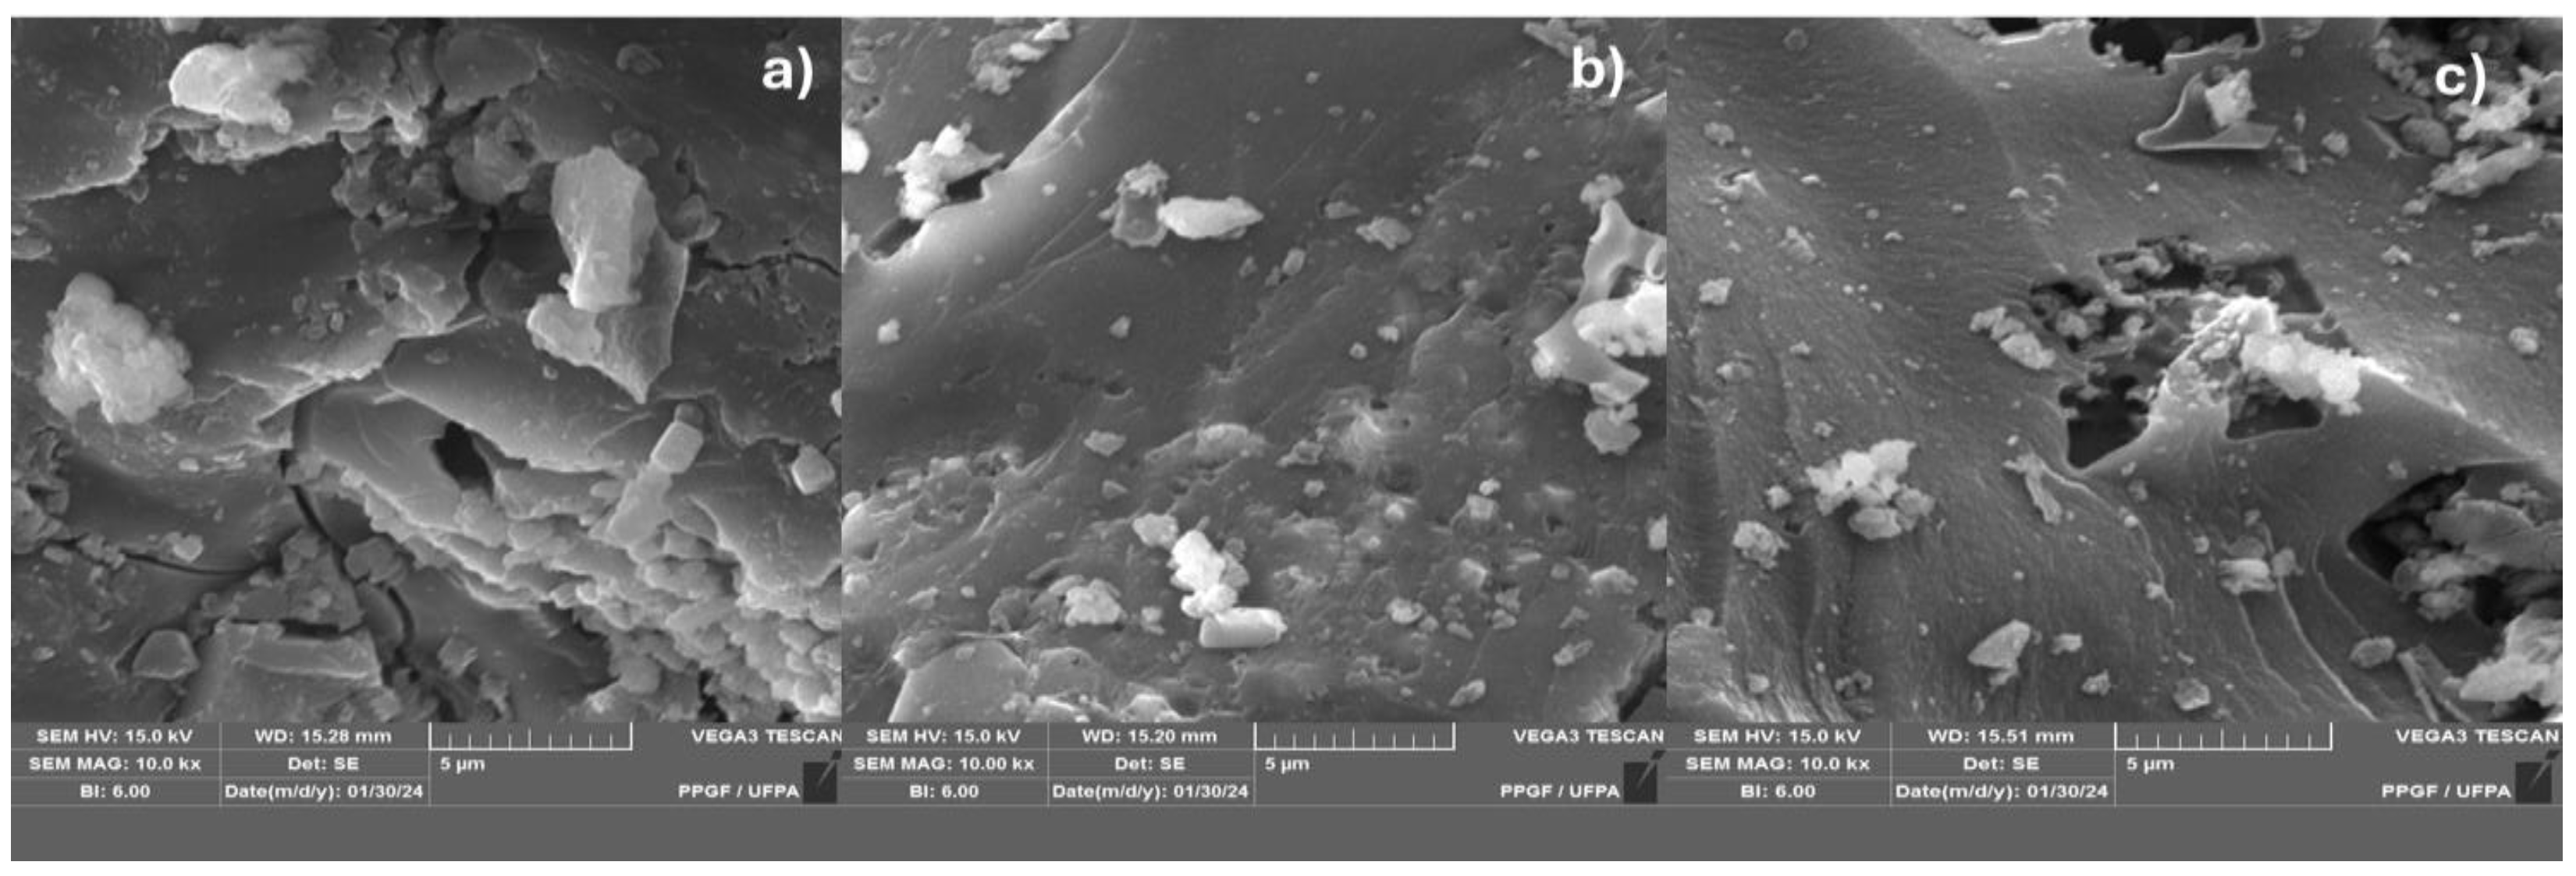
Figure 5.
SEM of biochar obtained by thermal pyrolysis of the fraction (organic matter + paper + plastic) of MSW at 400°C (a), 450°C (b) and 475°C (c), 1.0 atmosphere [MAG : 10.00 kx].
Figure 5.
SEM of biochar obtained by thermal pyrolysis of the fraction (organic matter + paper + plastic) of MSW at 400°C (a), 450°C (b) and 475°C (c), 1.0 atmosphere [MAG : 10.00 kx].
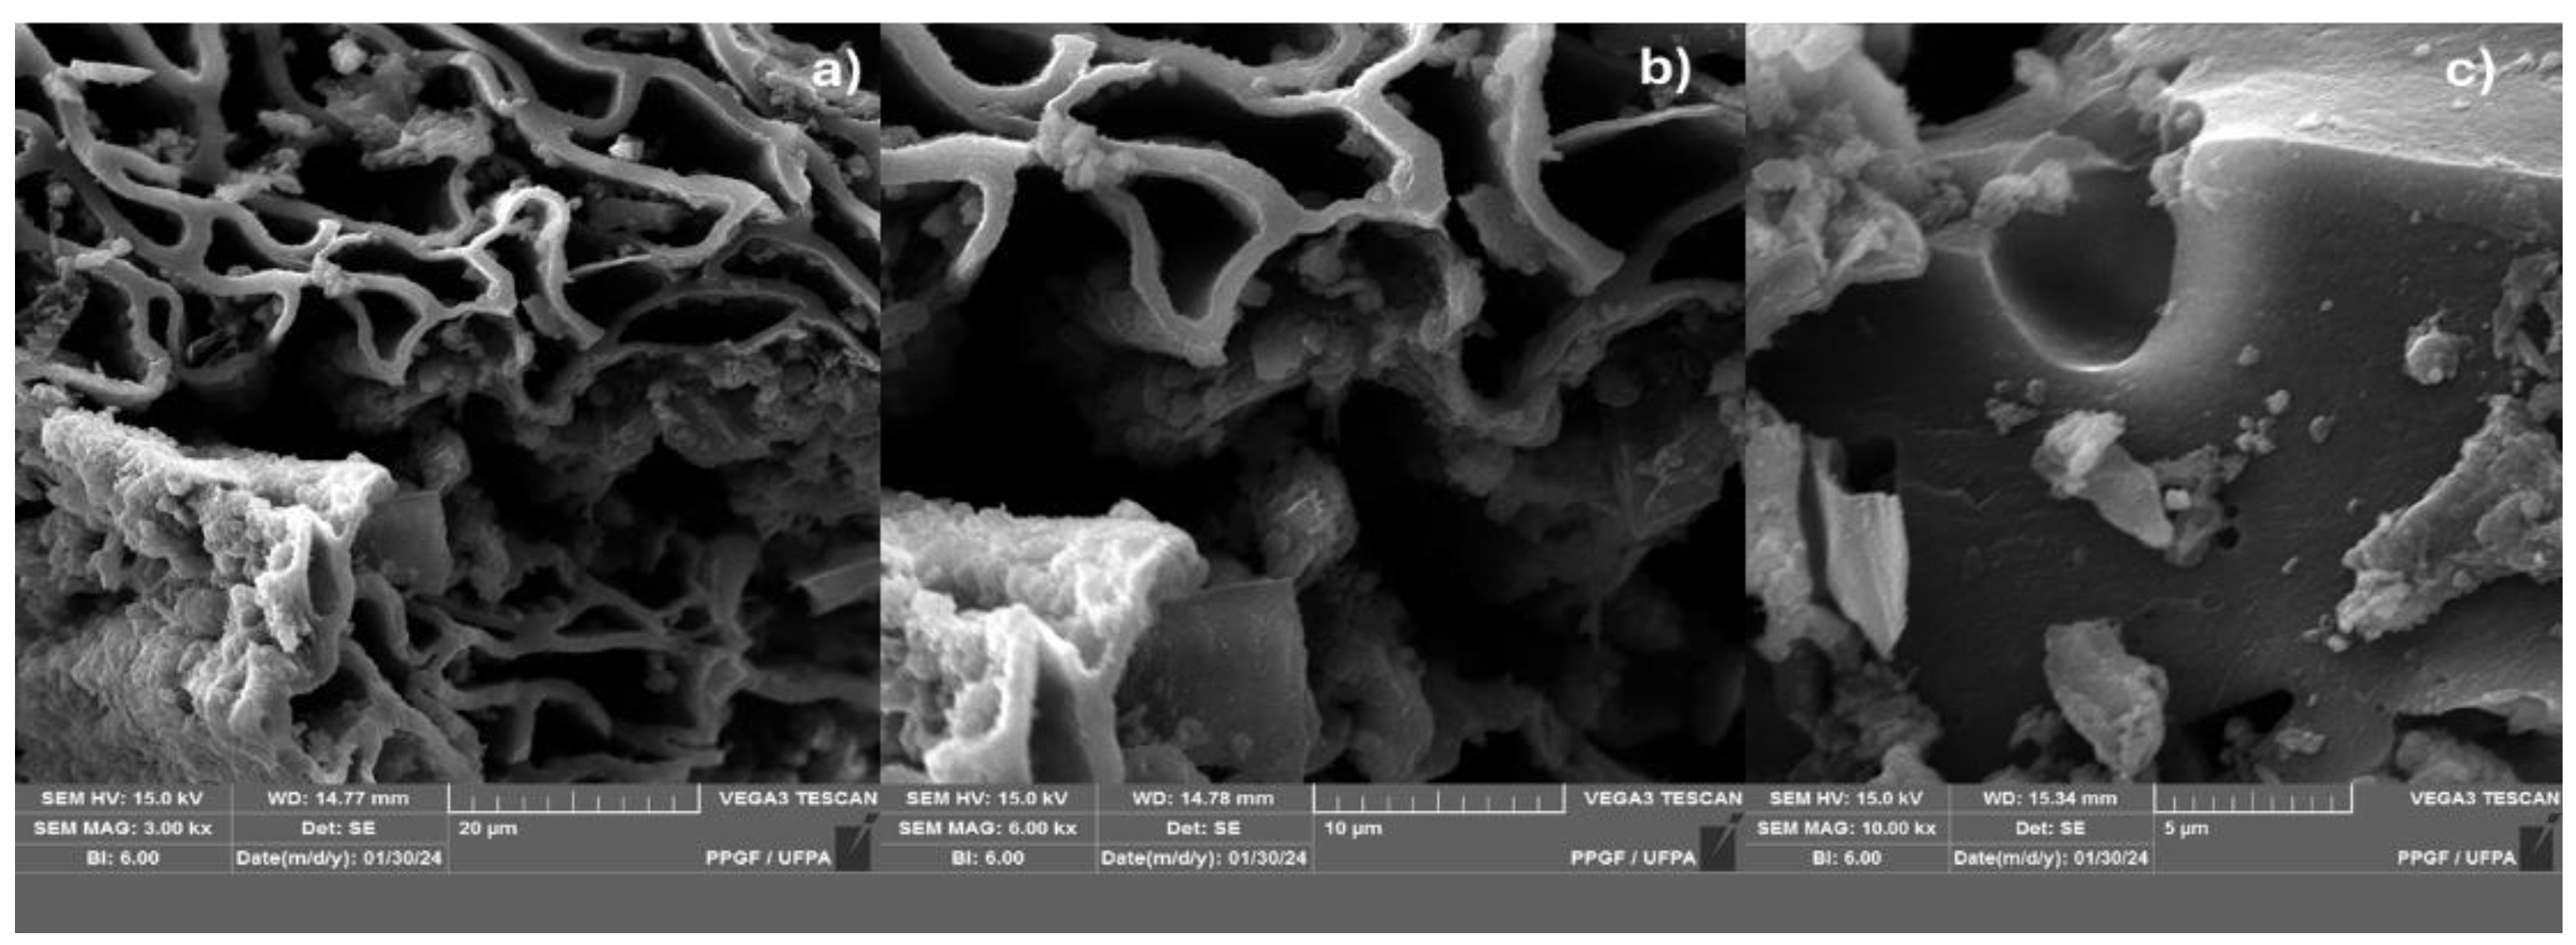
Figure 6.
SEM from biochar obtained by catalytic pyrolysis of the fraction (organic matter + paper + plastic) of MSW at 450°C 5.0% (wt.) FCC 1.0 atmosphere; with [MAG: 3.00 kx x (a); 6.0 kx (b); 10 kx (c)].
Figure 6.
SEM from biochar obtained by catalytic pyrolysis of the fraction (organic matter + paper + plastic) of MSW at 450°C 5.0% (wt.) FCC 1.0 atmosphere; with [MAG: 3.00 kx x (a); 6.0 kx (b); 10 kx (c)].
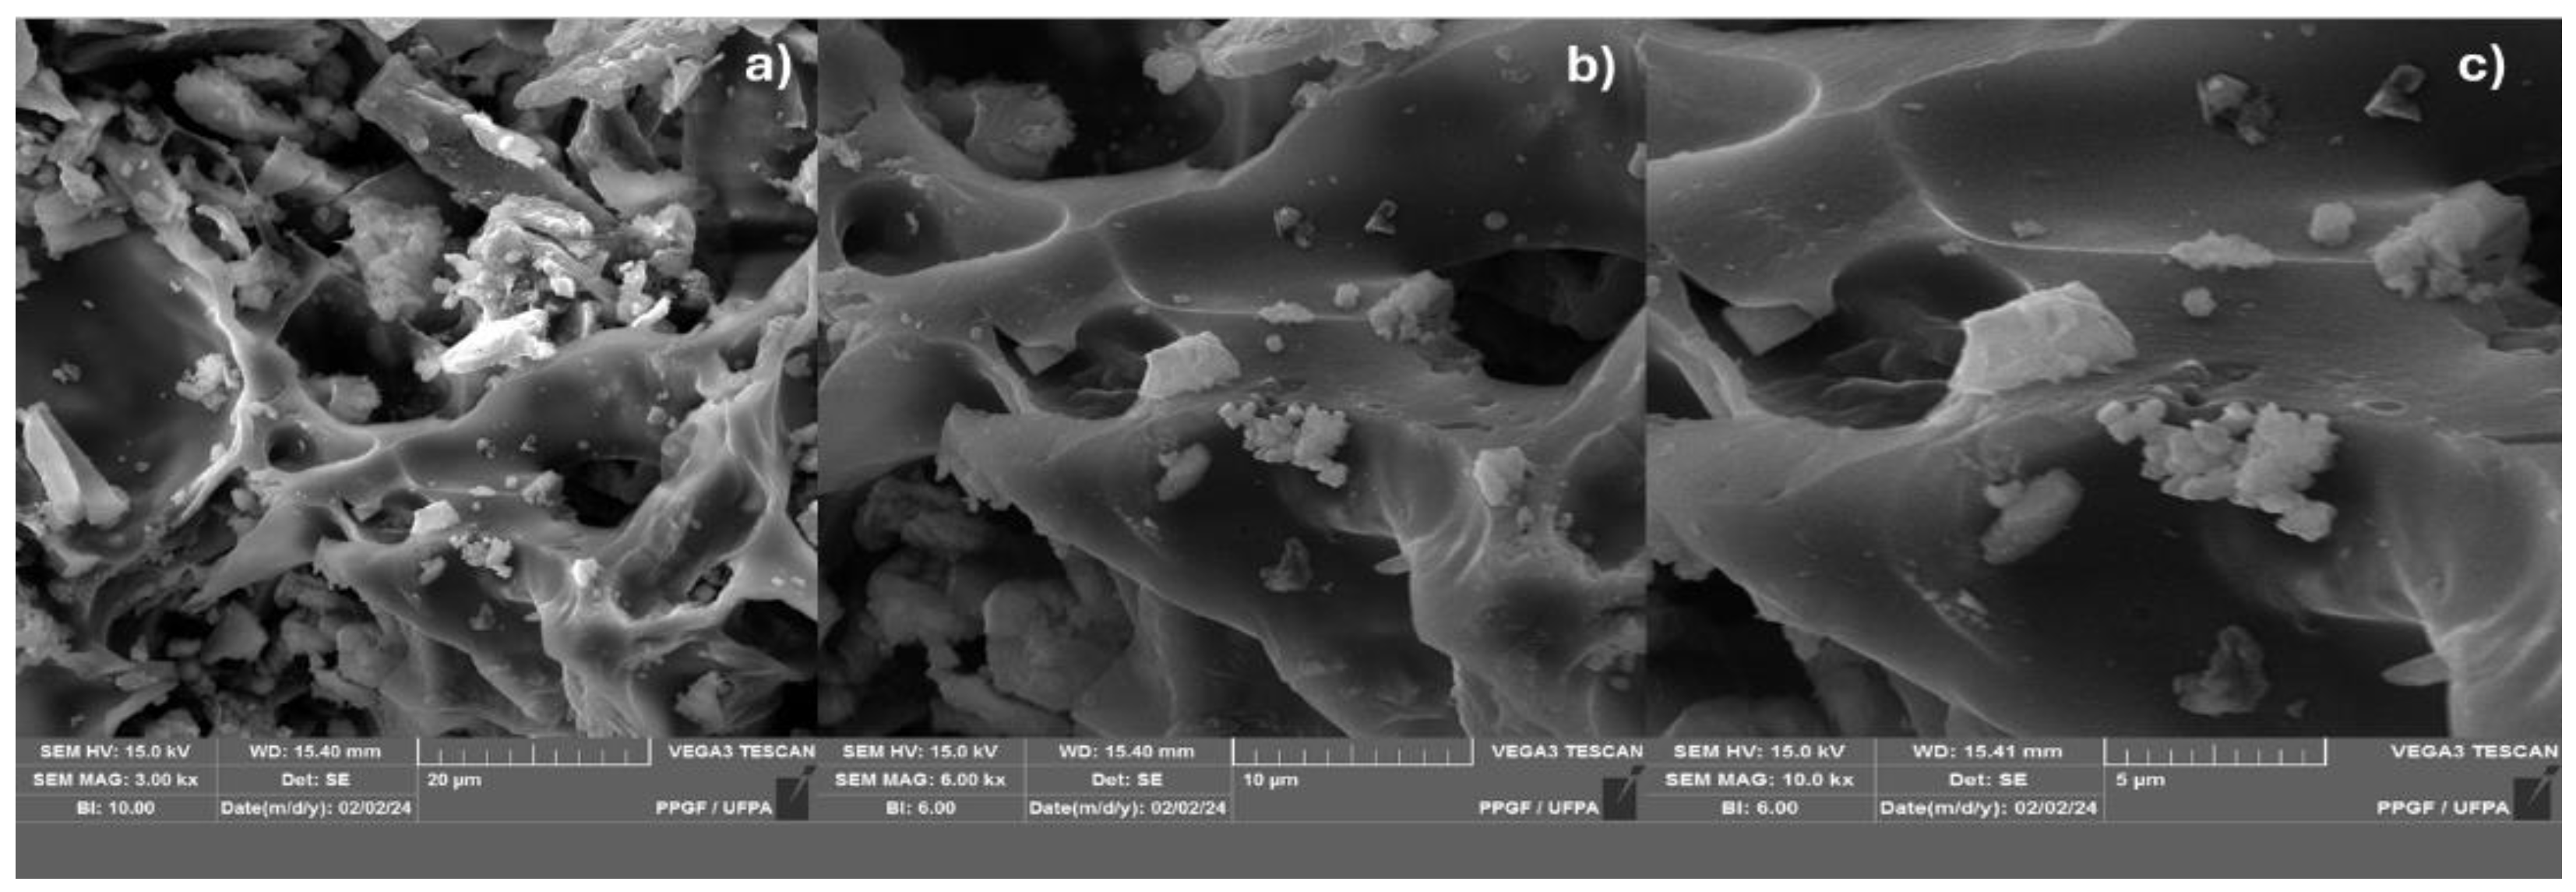
Figure 7.
SEM of biochar obtained by thermal pyrolysis of the fraction (organic matter + paper + plastic) of MSW at 450°C 10.0% (wt.) FCC 1.0 atmosphere; with [MAG: 3.00 kx x (a); 6.0 kx (b); 10 kx (c)].
Figure 7.
SEM of biochar obtained by thermal pyrolysis of the fraction (organic matter + paper + plastic) of MSW at 450°C 10.0% (wt.) FCC 1.0 atmosphere; with [MAG: 3.00 kx x (a); 6.0 kx (b); 10 kx (c)].
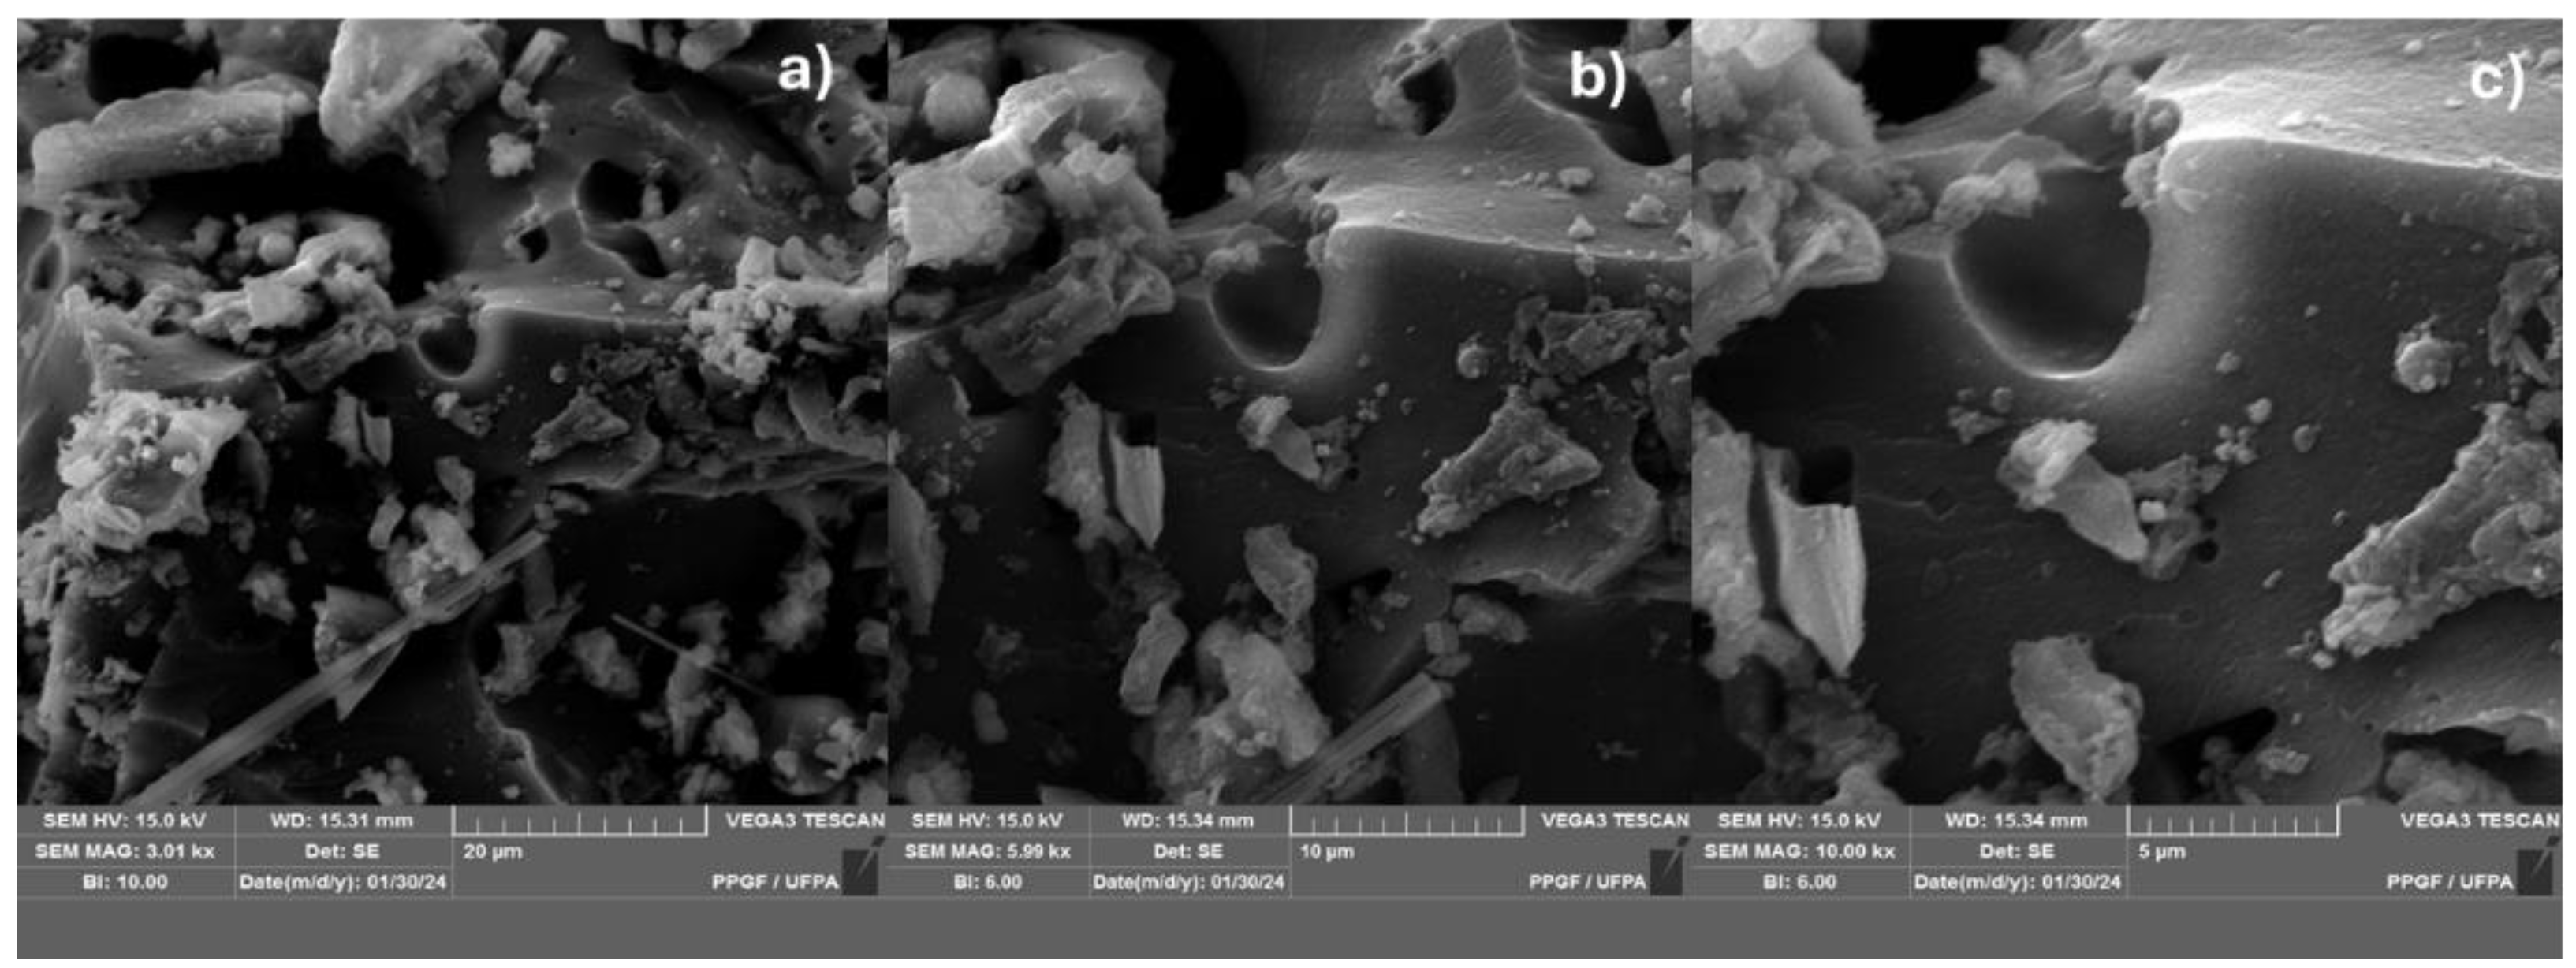
Figure 8.
MEV from biochar obtained by thermal pyrolysis of the fraction (organic matter + paper + plastic) of MSW at 450°C 15.0% (wt.) FCC 1.0 atmosphere; with [MAG: 3.00 kx x (a); 6.0 kx (b); 10 kx (c)].
Figure 8.
MEV from biochar obtained by thermal pyrolysis of the fraction (organic matter + paper + plastic) of MSW at 450°C 15.0% (wt.) FCC 1.0 atmosphere; with [MAG: 3.00 kx x (a); 6.0 kx (b); 10 kx (c)].
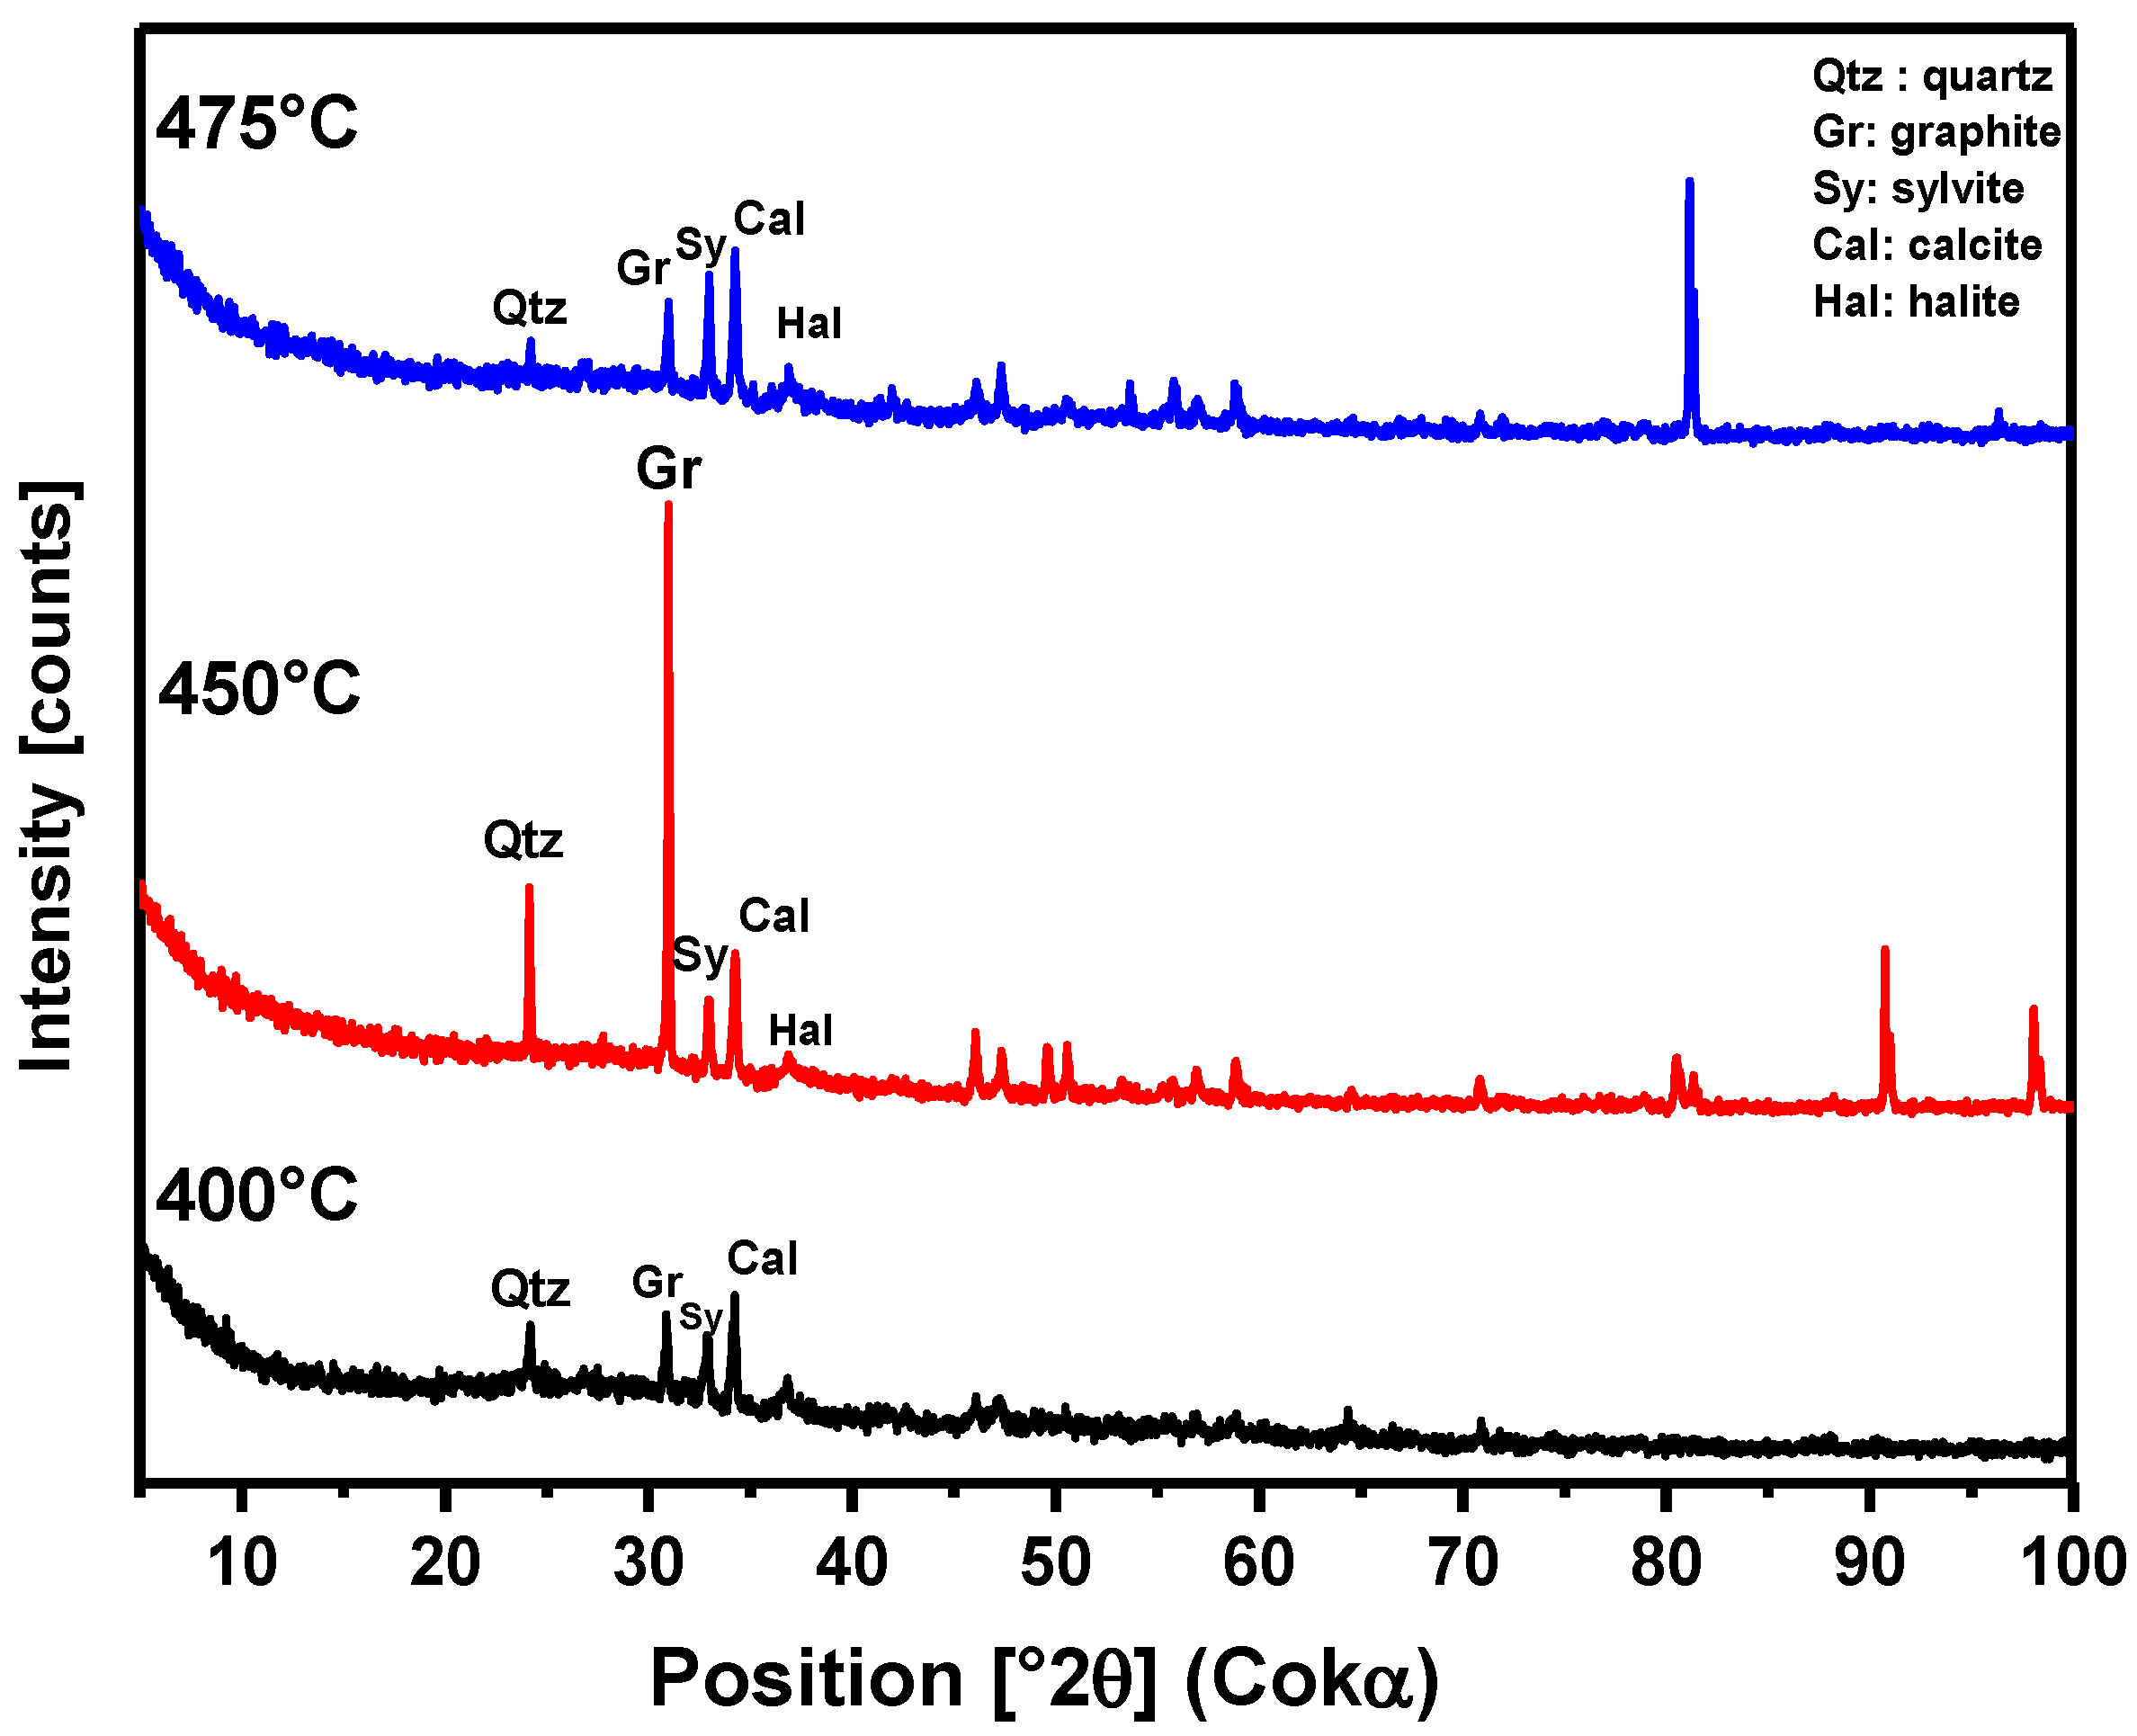
Figure 9.
XRD of solid phase products from the pyrolysis of the MSW fraction (organic matter + paper + plastic) at 400°C, 450°C, and 475°C and 1.0 atmosphere, using a 125 mL borosilicate glass reactor, on a laboratory scale.
Figure 9.
XRD of solid phase products from the pyrolysis of the MSW fraction (organic matter + paper + plastic) at 400°C, 450°C, and 475°C and 1.0 atmosphere, using a 125 mL borosilicate glass reactor, on a laboratory scale.
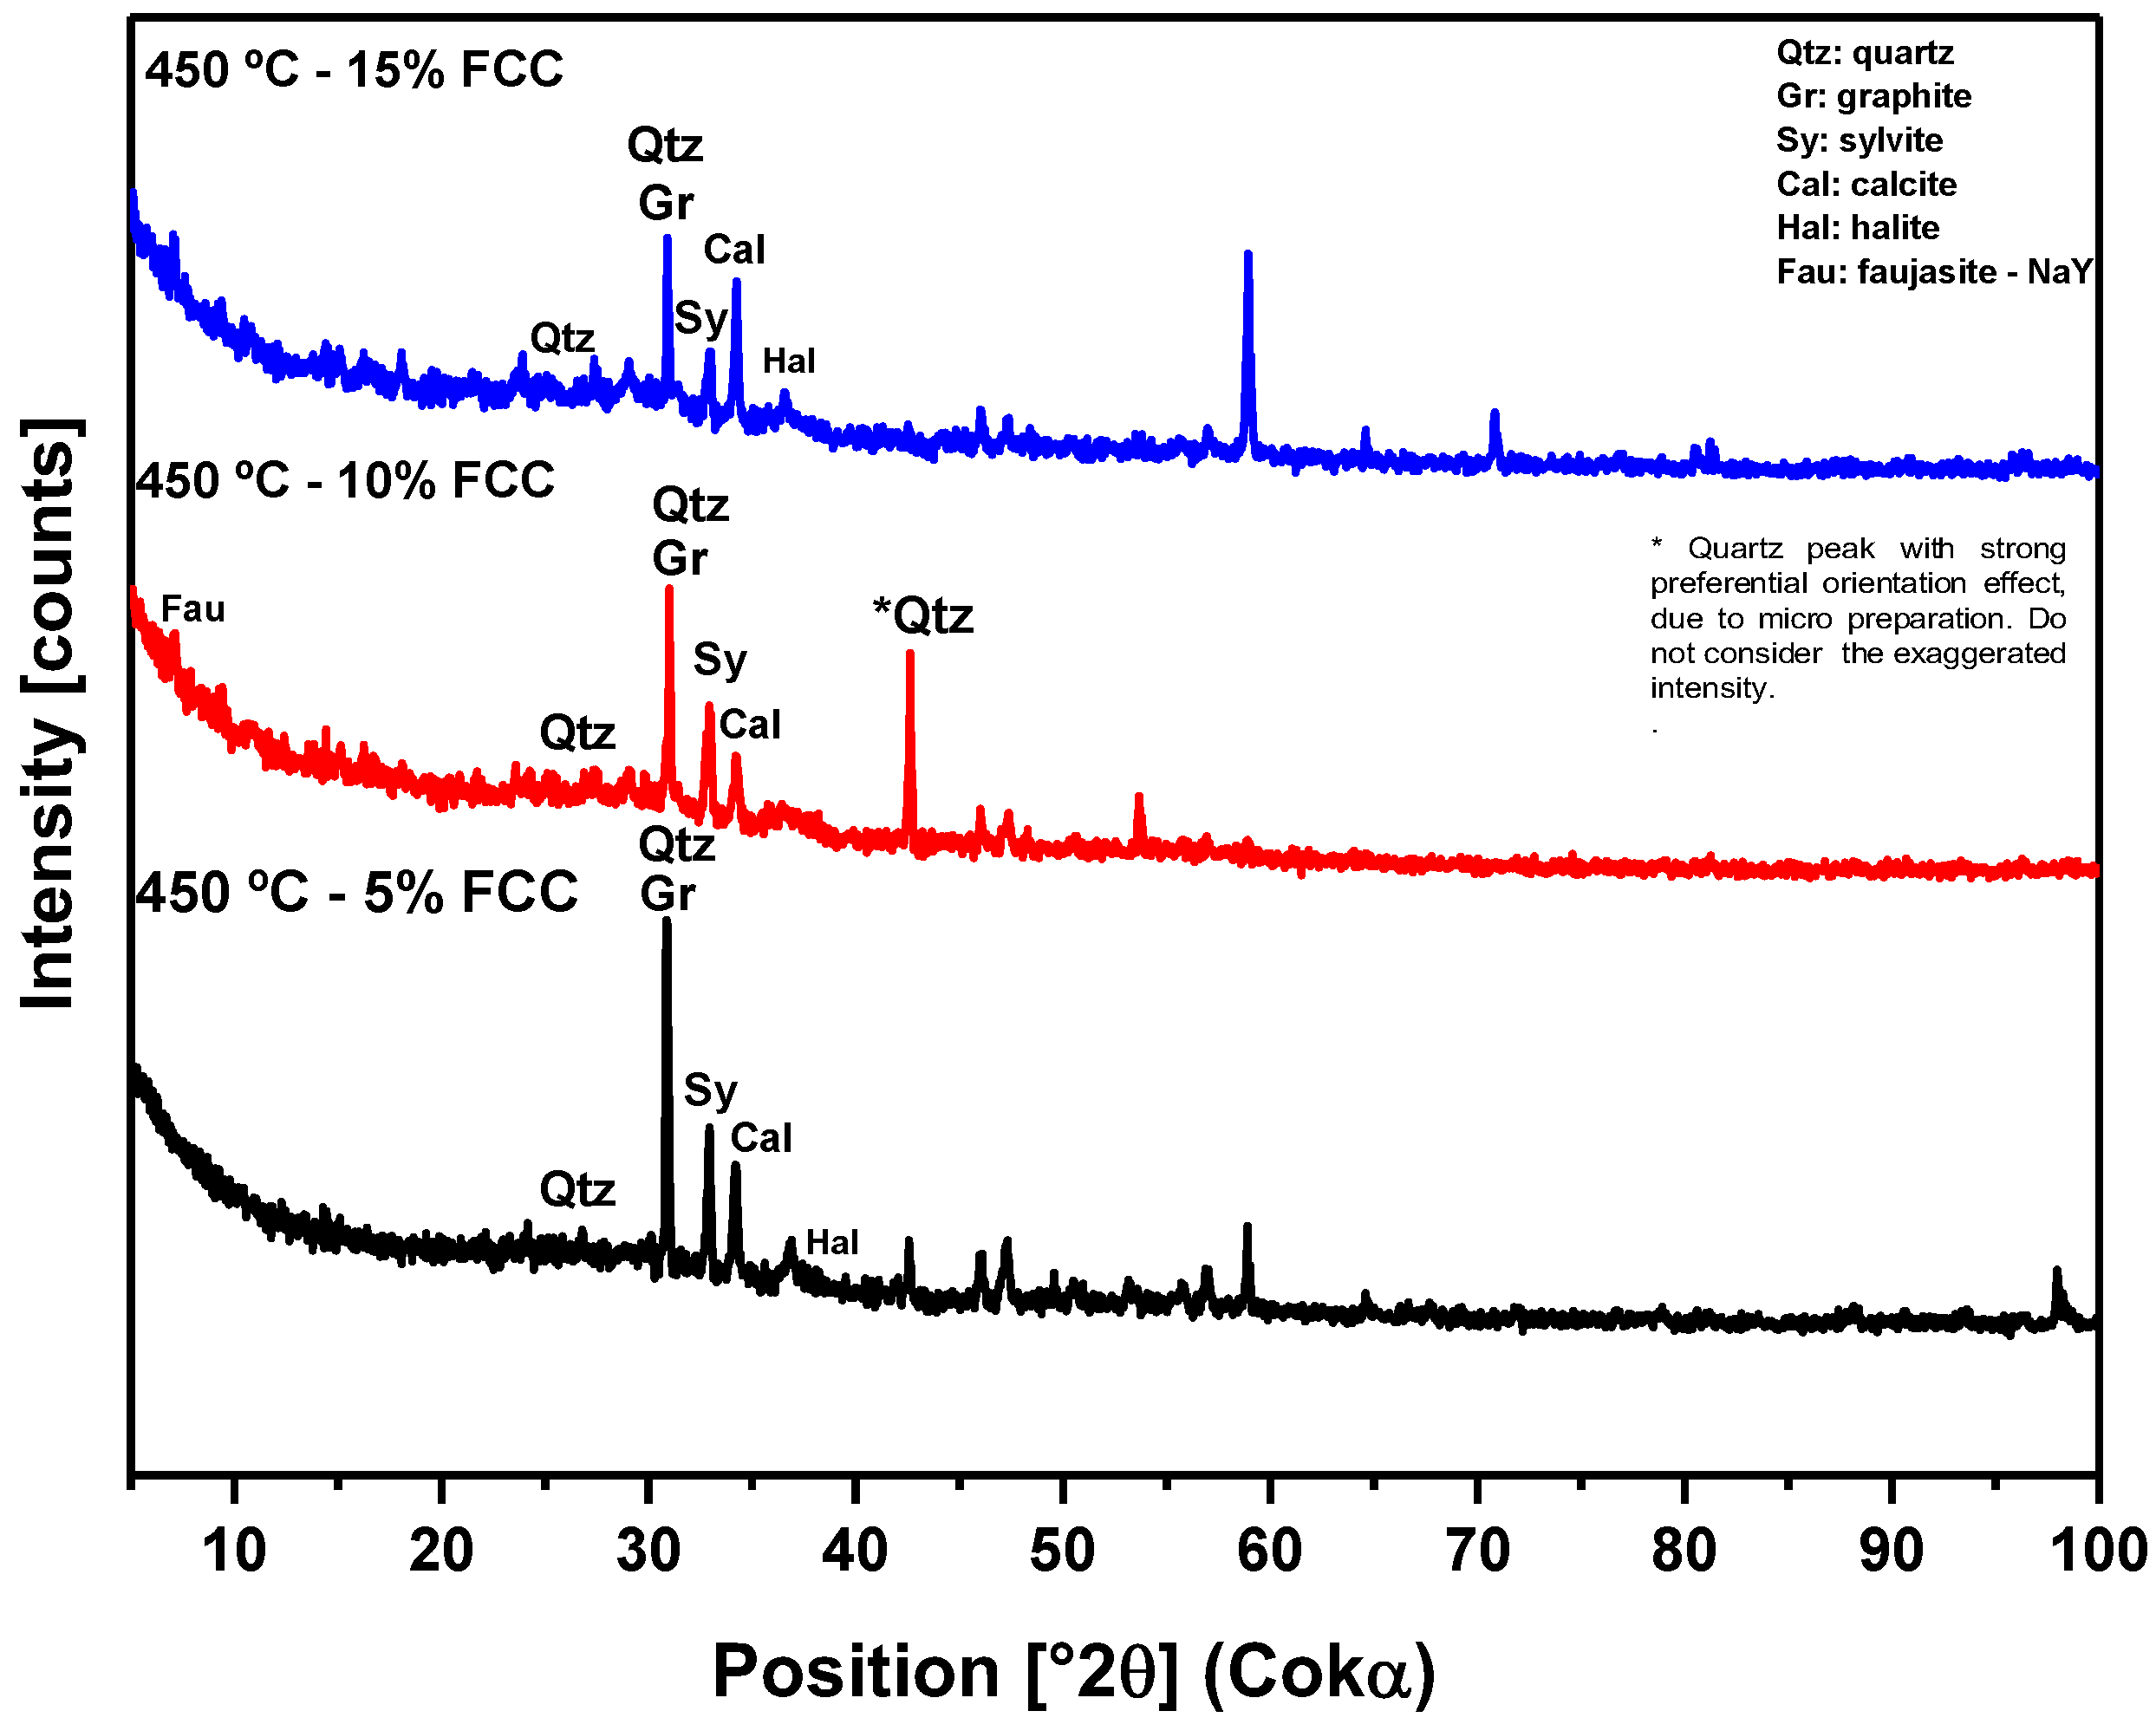
Figure 10.
XRD of solid phase products from the pyrolysis of the MSW fraction (organic matter + paper + plastic) at 450°C and 1.0 atmosphere, with 5%, 10%, and 15% (by mass) of FCC, using a 125 mL borosilicate glass reactor, on a laboratory scale.
Figure 10.
XRD of solid phase products from the pyrolysis of the MSW fraction (organic matter + paper + plastic) at 450°C and 1.0 atmosphere, with 5%, 10%, and 15% (by mass) of FCC, using a 125 mL borosilicate glass reactor, on a laboratory scale.
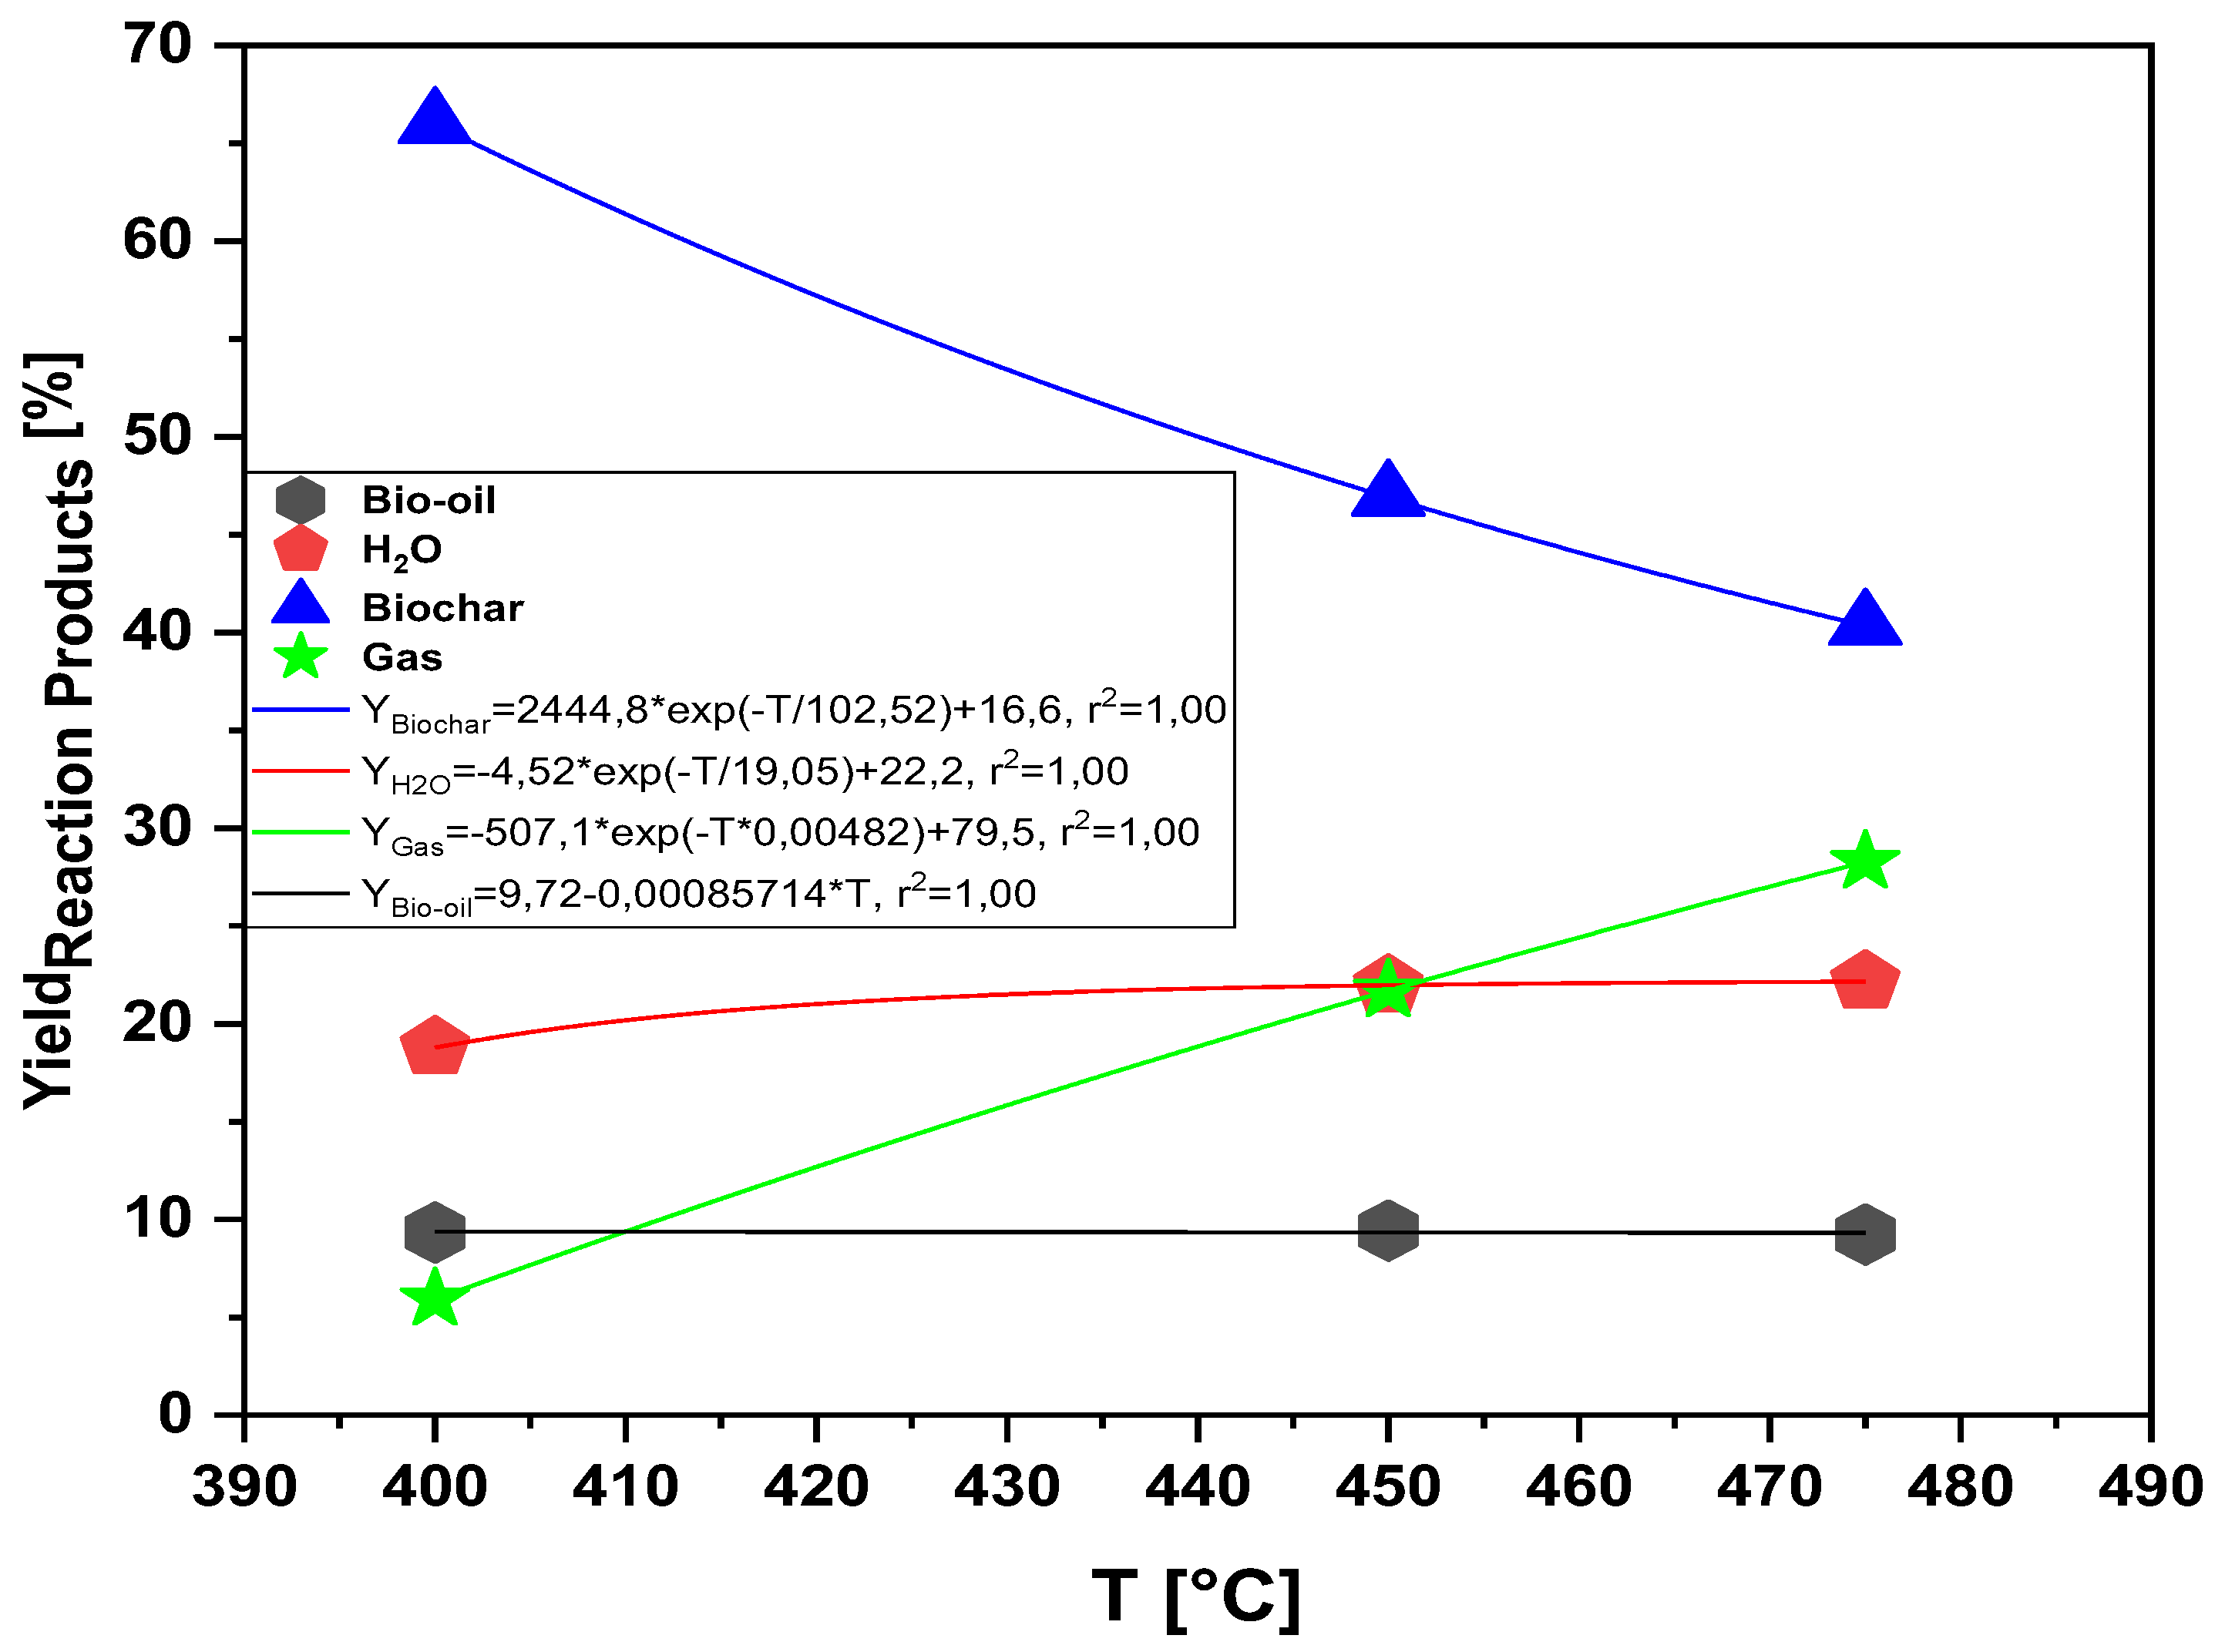
Figure 11.
Effect of pyrolysis temperature on the yields of reaction products (bio-oil, aqueous phase, bio-coal and gas) by pyrolysis of the MSW fraction (organic matter + paper + plastic) at 400, 450 and 475 °C, 1 ,0 atmosphere, on a laboratory scale.
Figure 11.
Effect of pyrolysis temperature on the yields of reaction products (bio-oil, aqueous phase, bio-coal and gas) by pyrolysis of the MSW fraction (organic matter + paper + plastic) at 400, 450 and 475 °C, 1 ,0 atmosphere, on a laboratory scale.
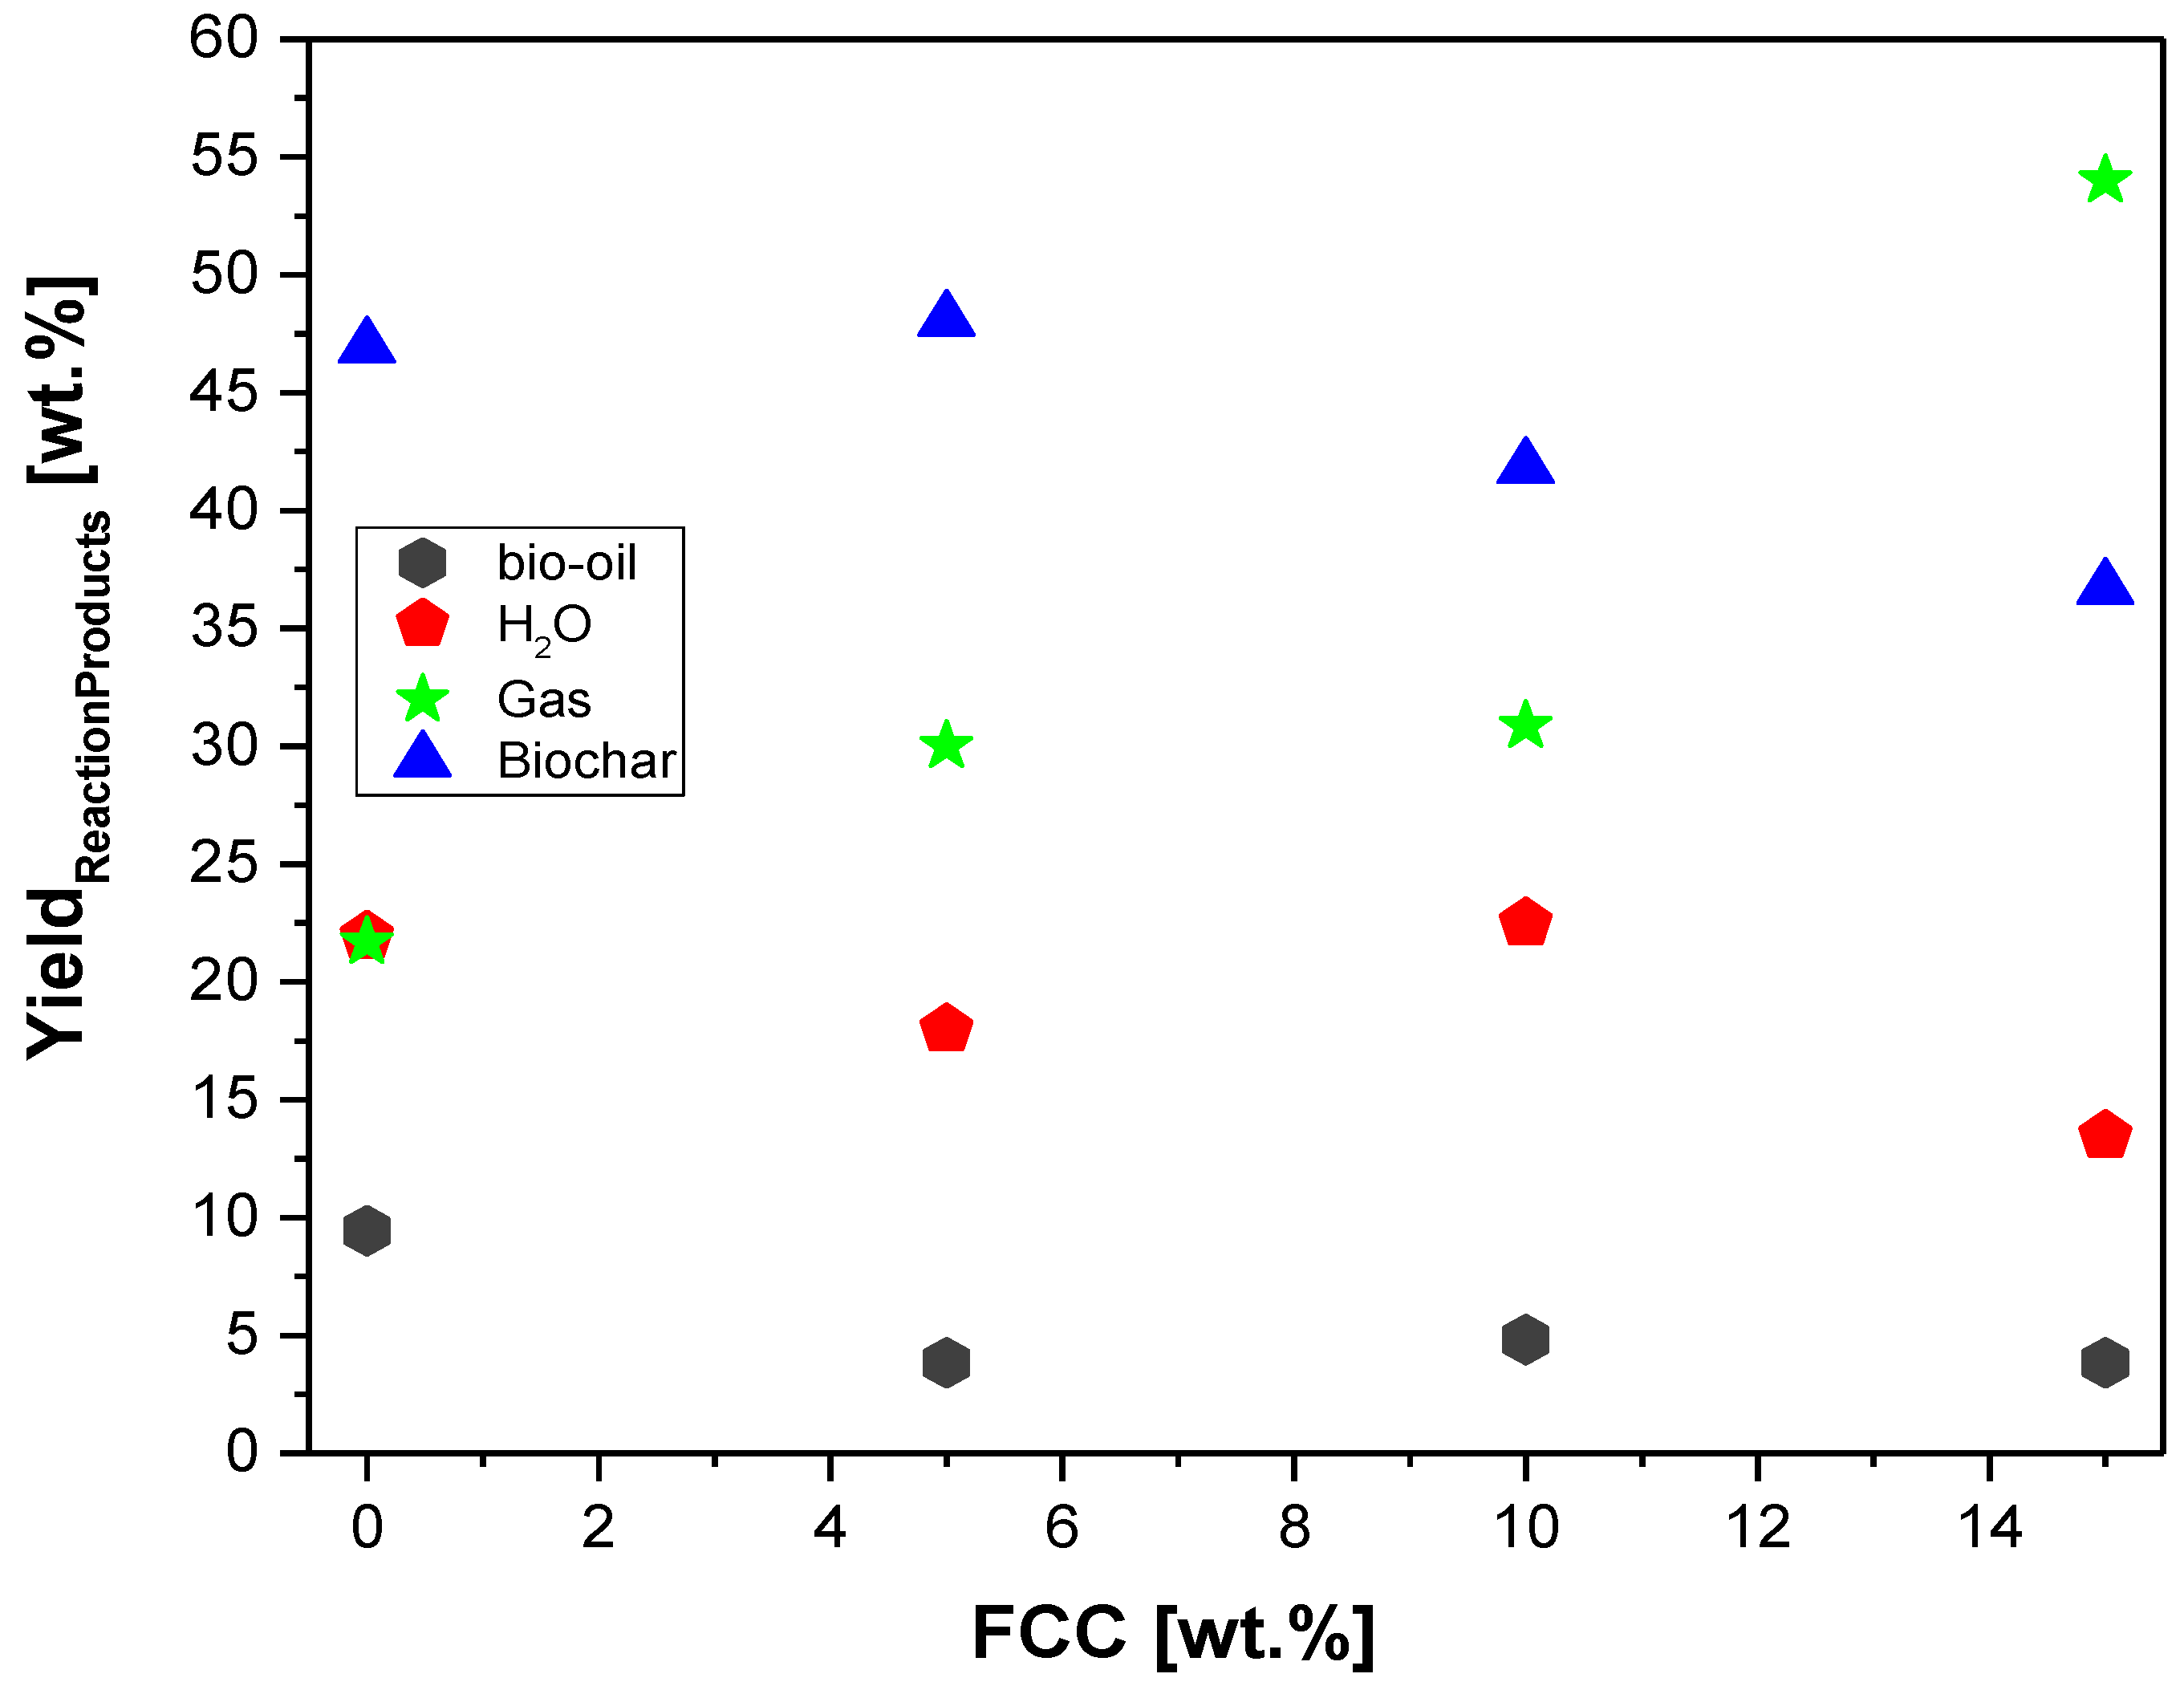
Figure 12.
Effect of FCC-to-MHSW ratio on the yield of bio-oil, biochar, aqueous, and gas phases by thermal catalytic cracking of MSW fraction (organic matter + paper +plastic) at 450 °C, 1.0 atm, 5.0, 10.0, and 15.0% (wt.) FCC, in laboratory scale.
Figure 12.
Effect of FCC-to-MHSW ratio on the yield of bio-oil, biochar, aqueous, and gas phases by thermal catalytic cracking of MSW fraction (organic matter + paper +plastic) at 450 °C, 1.0 atm, 5.0, 10.0, and 15.0% (wt.) FCC, in laboratory scale.
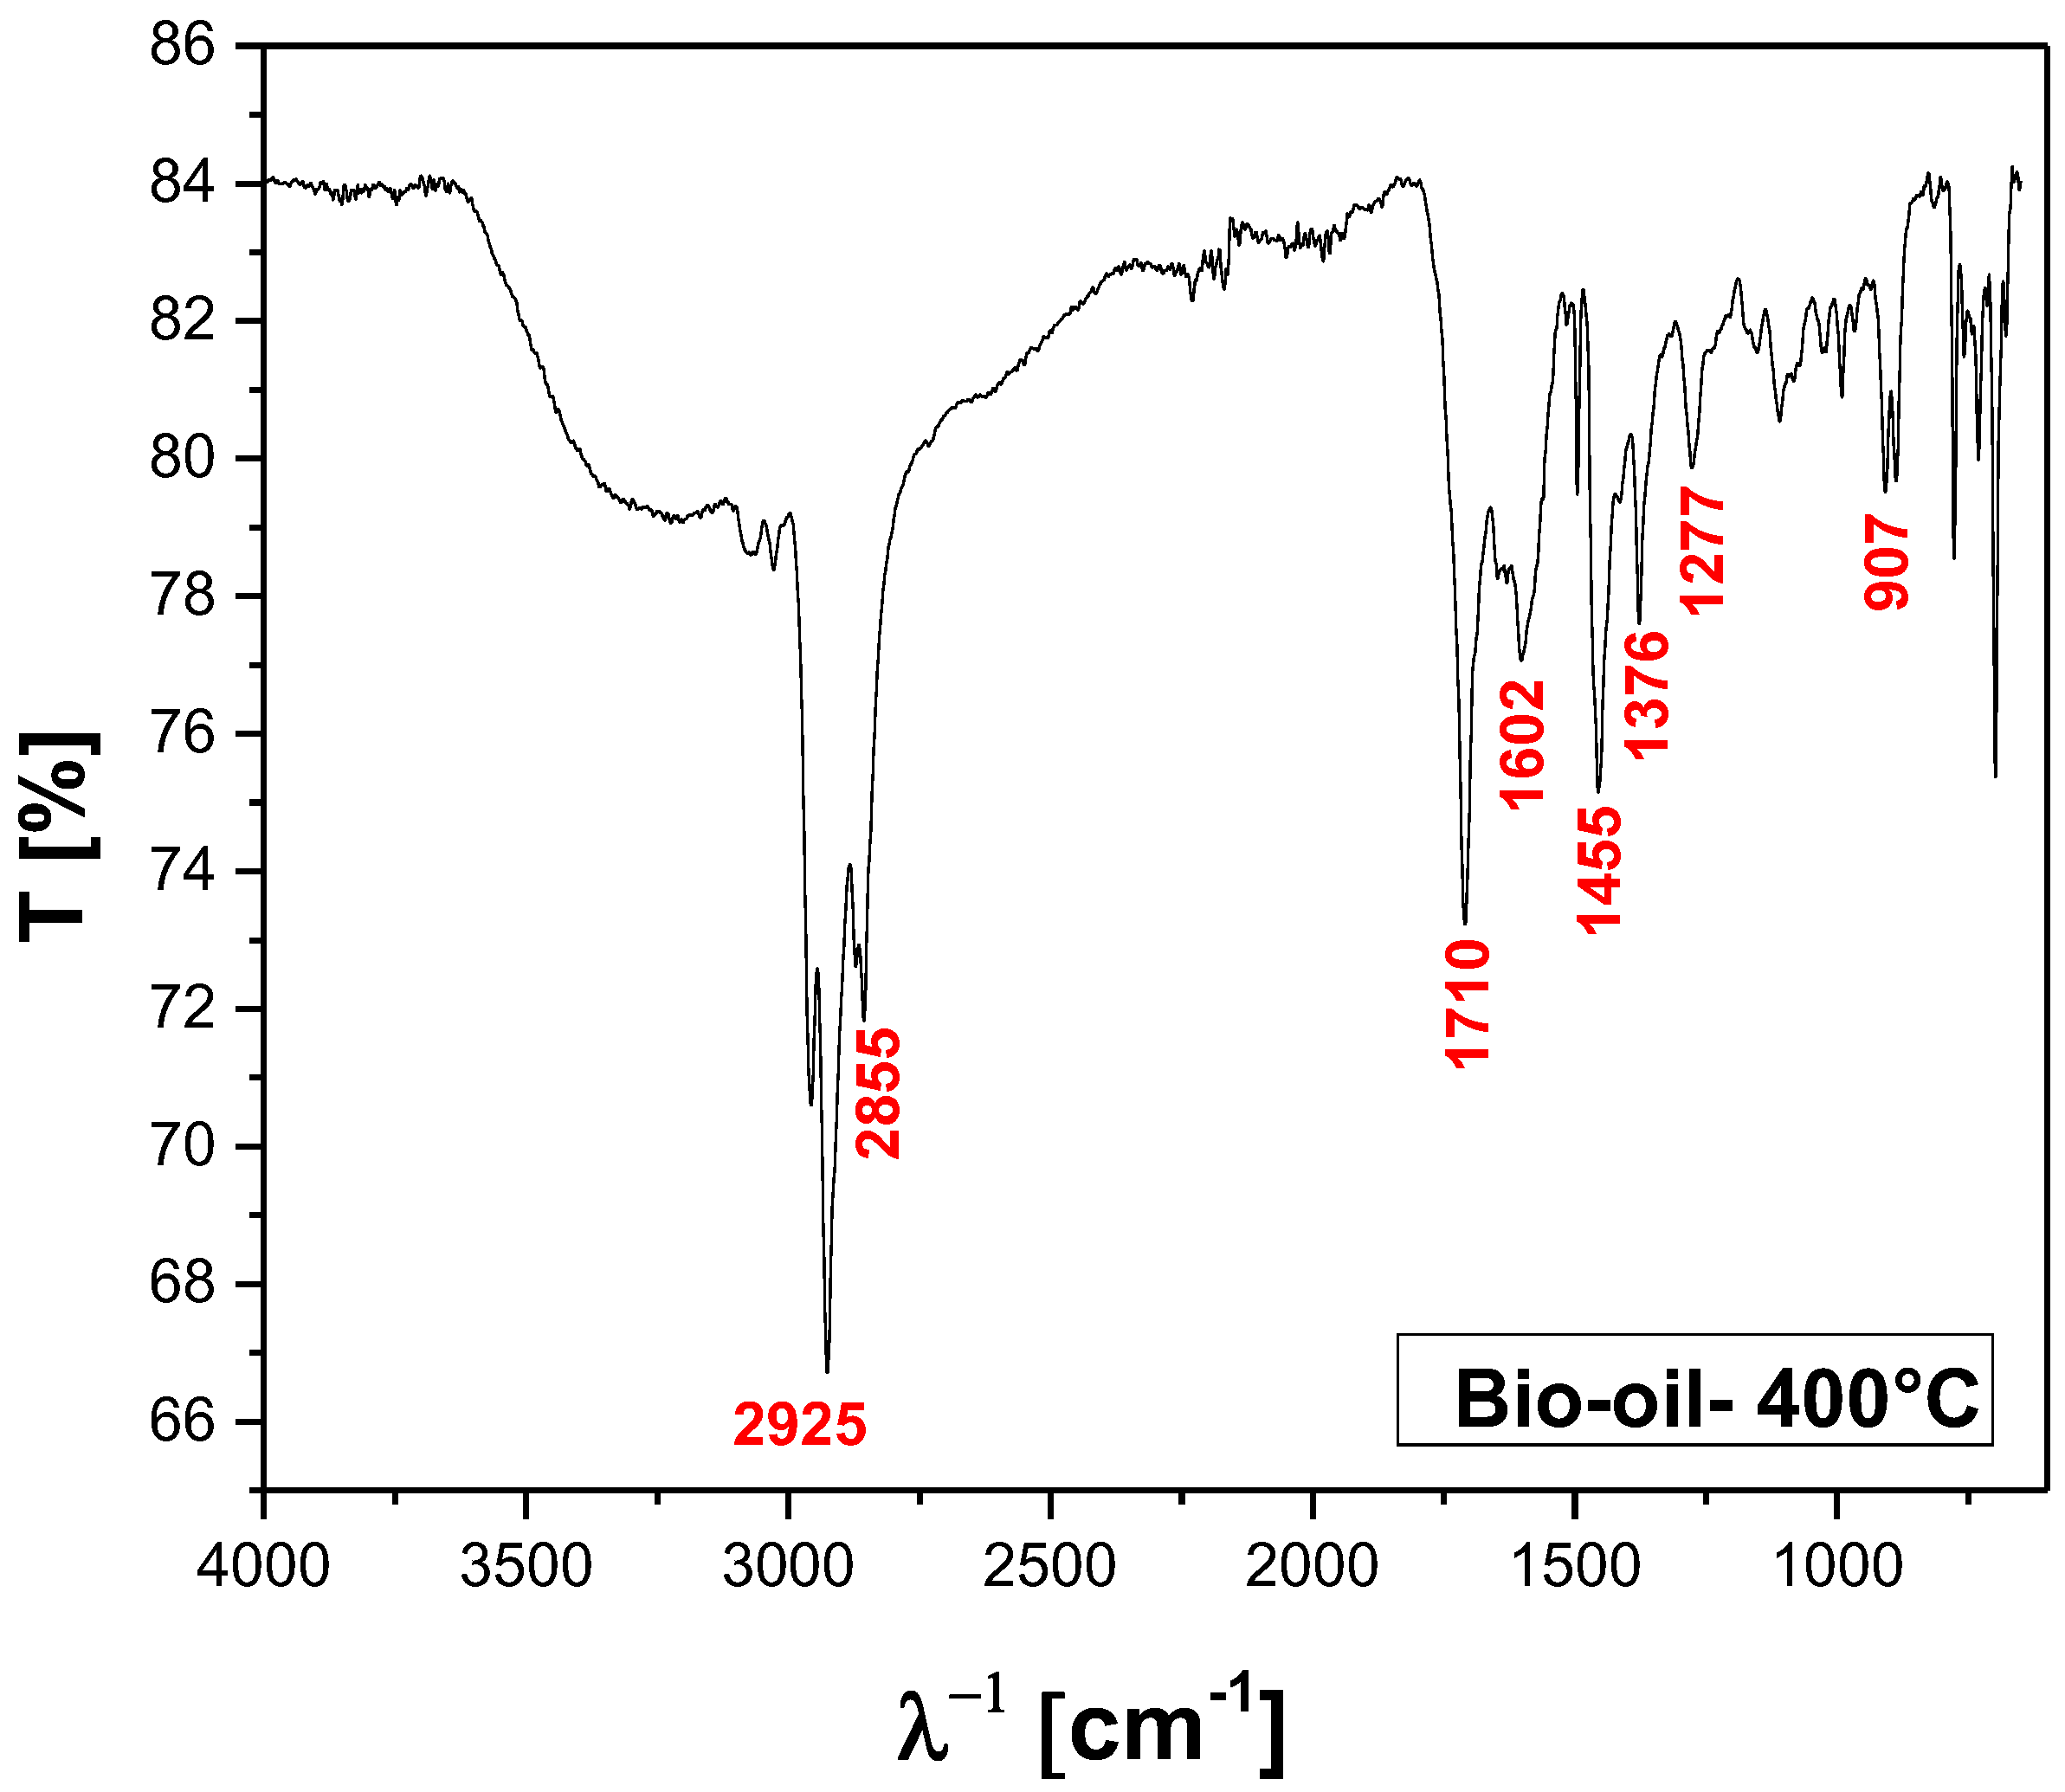
Figure 13.
FT-IR of bio-oil obtained by pyrolysis of MSW fraction (organic matter + paper+plastic) at 400°C, 1.0 atmosphere, in laboratory scale.
Figure 13.
FT-IR of bio-oil obtained by pyrolysis of MSW fraction (organic matter + paper+plastic) at 400°C, 1.0 atmosphere, in laboratory scale.
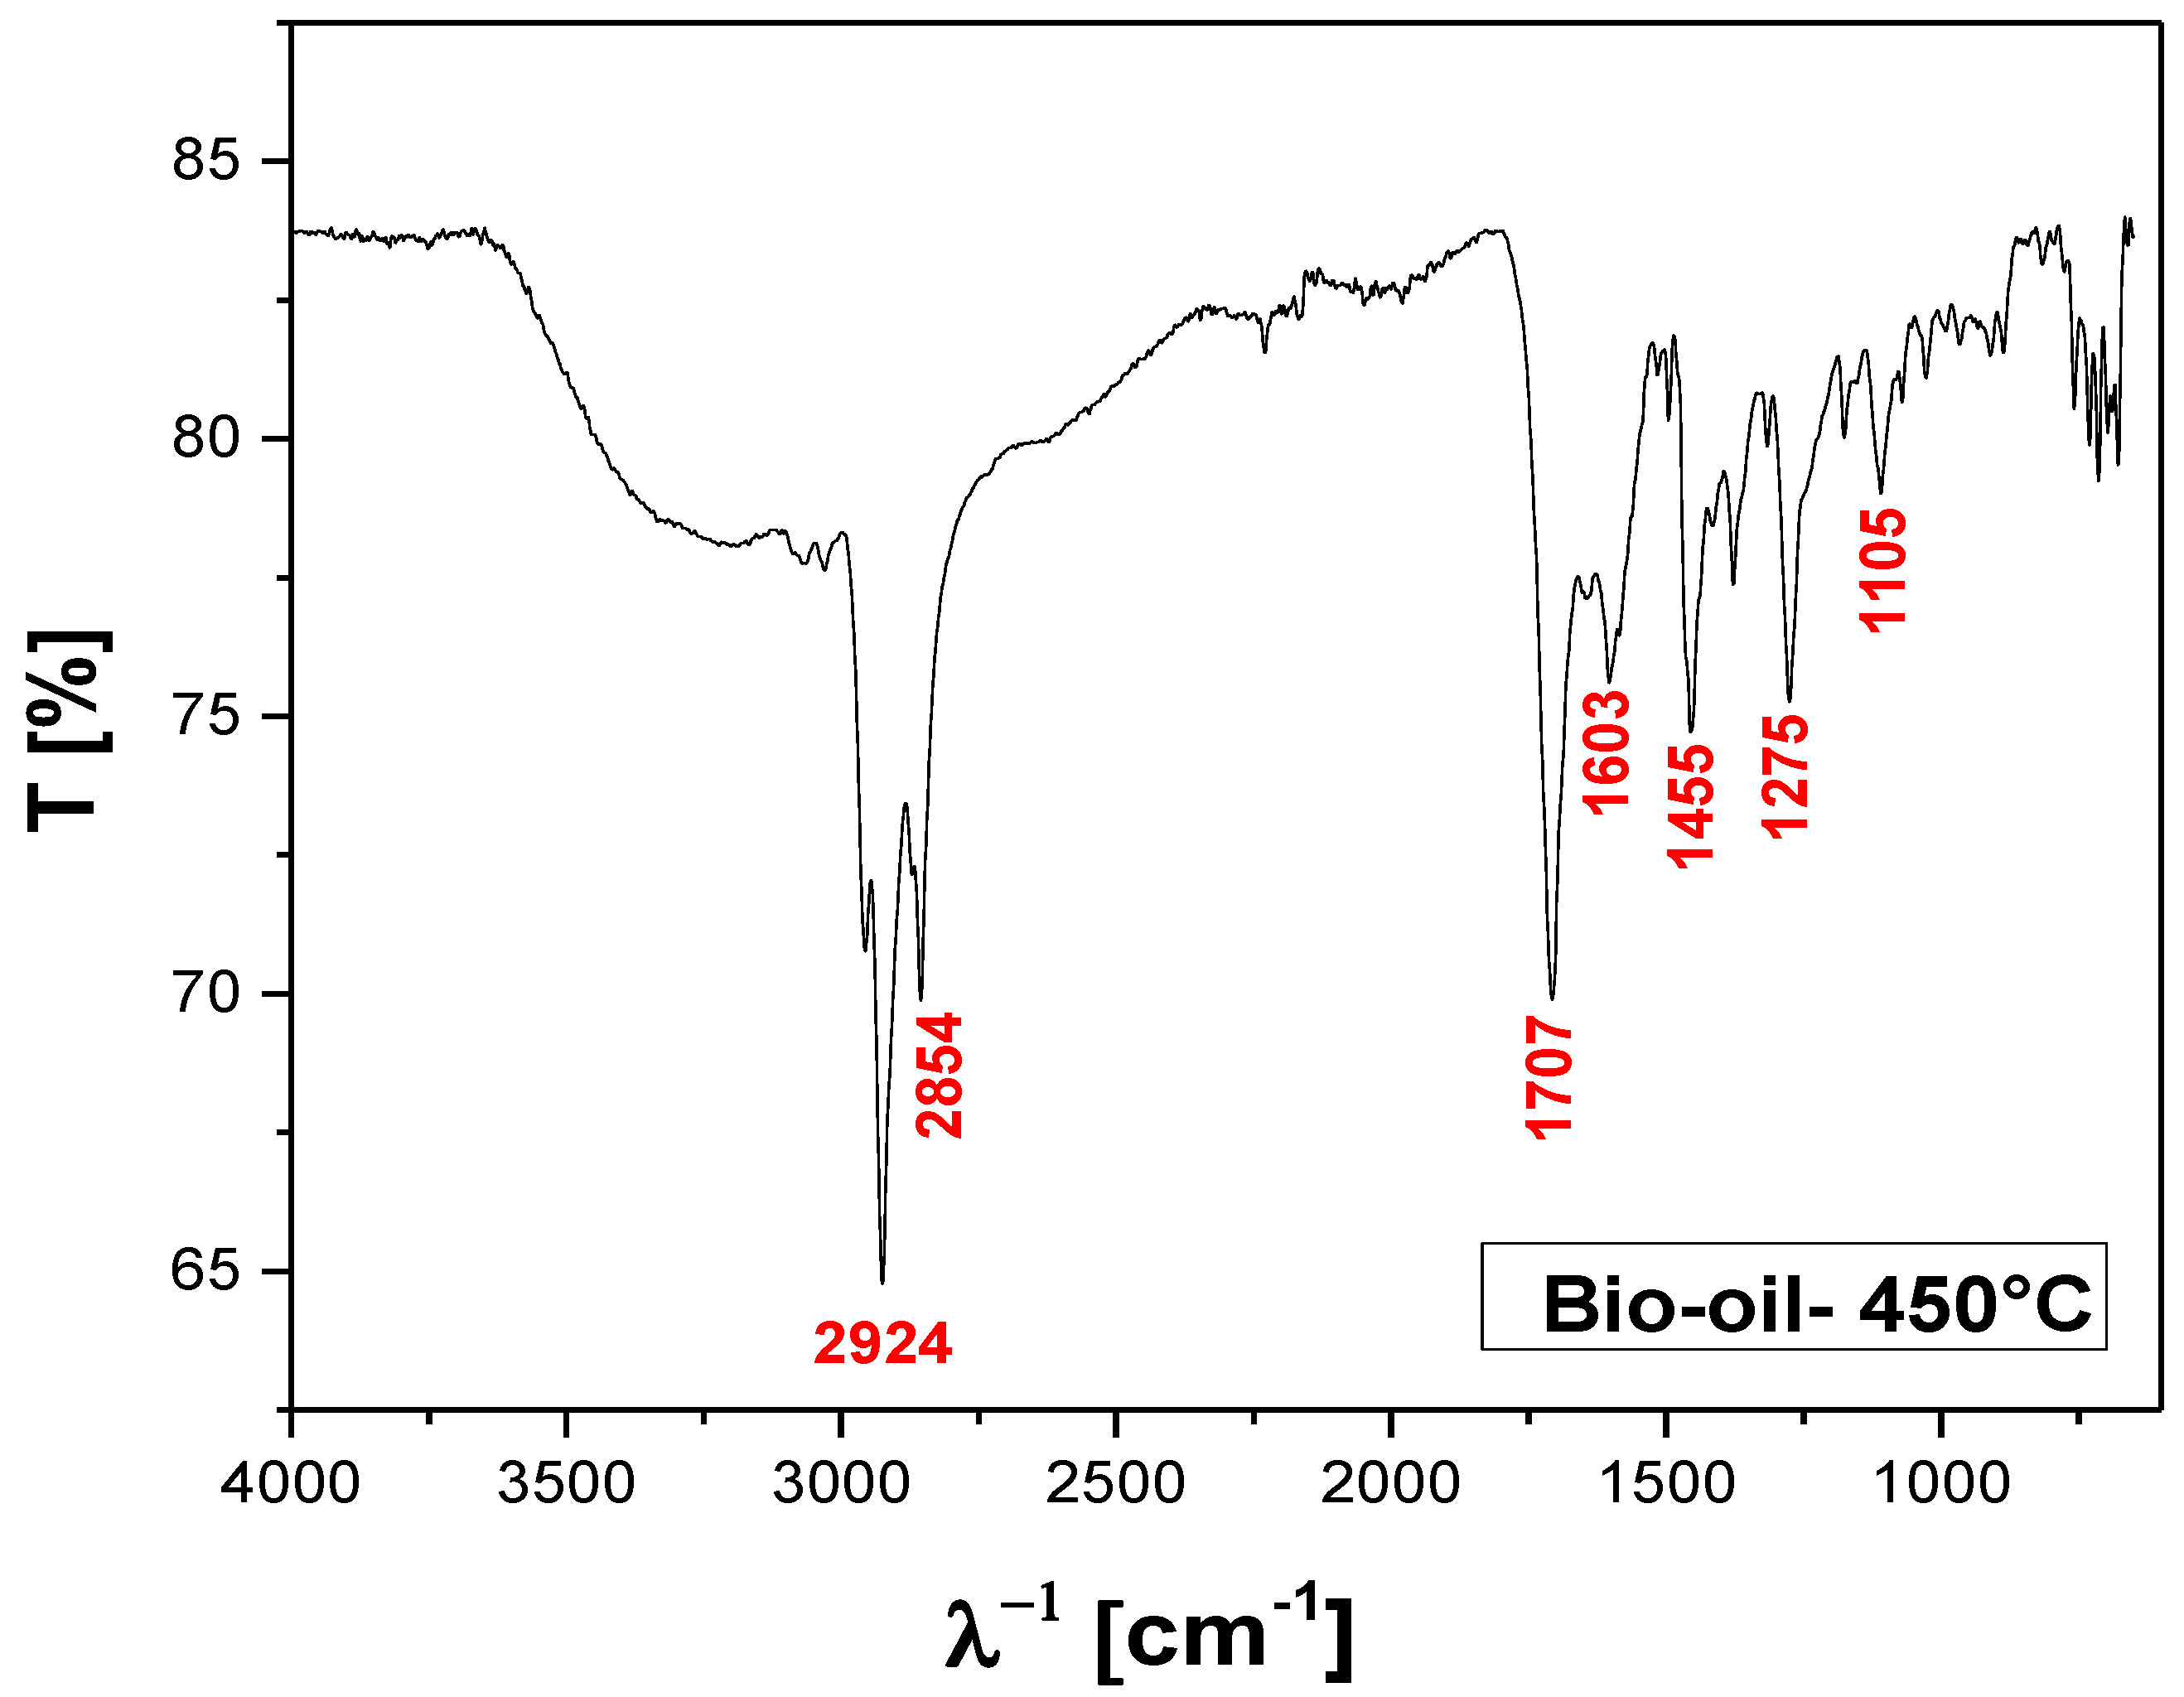
Figure 14.
FT-IR of bio-oil obtained by pyrolysis of MSW fraction (organic matter + paper+plastic) at 450 °C, 1.0 atmosphere, in laboratory scale.
Figure 14.
FT-IR of bio-oil obtained by pyrolysis of MSW fraction (organic matter + paper+plastic) at 450 °C, 1.0 atmosphere, in laboratory scale.
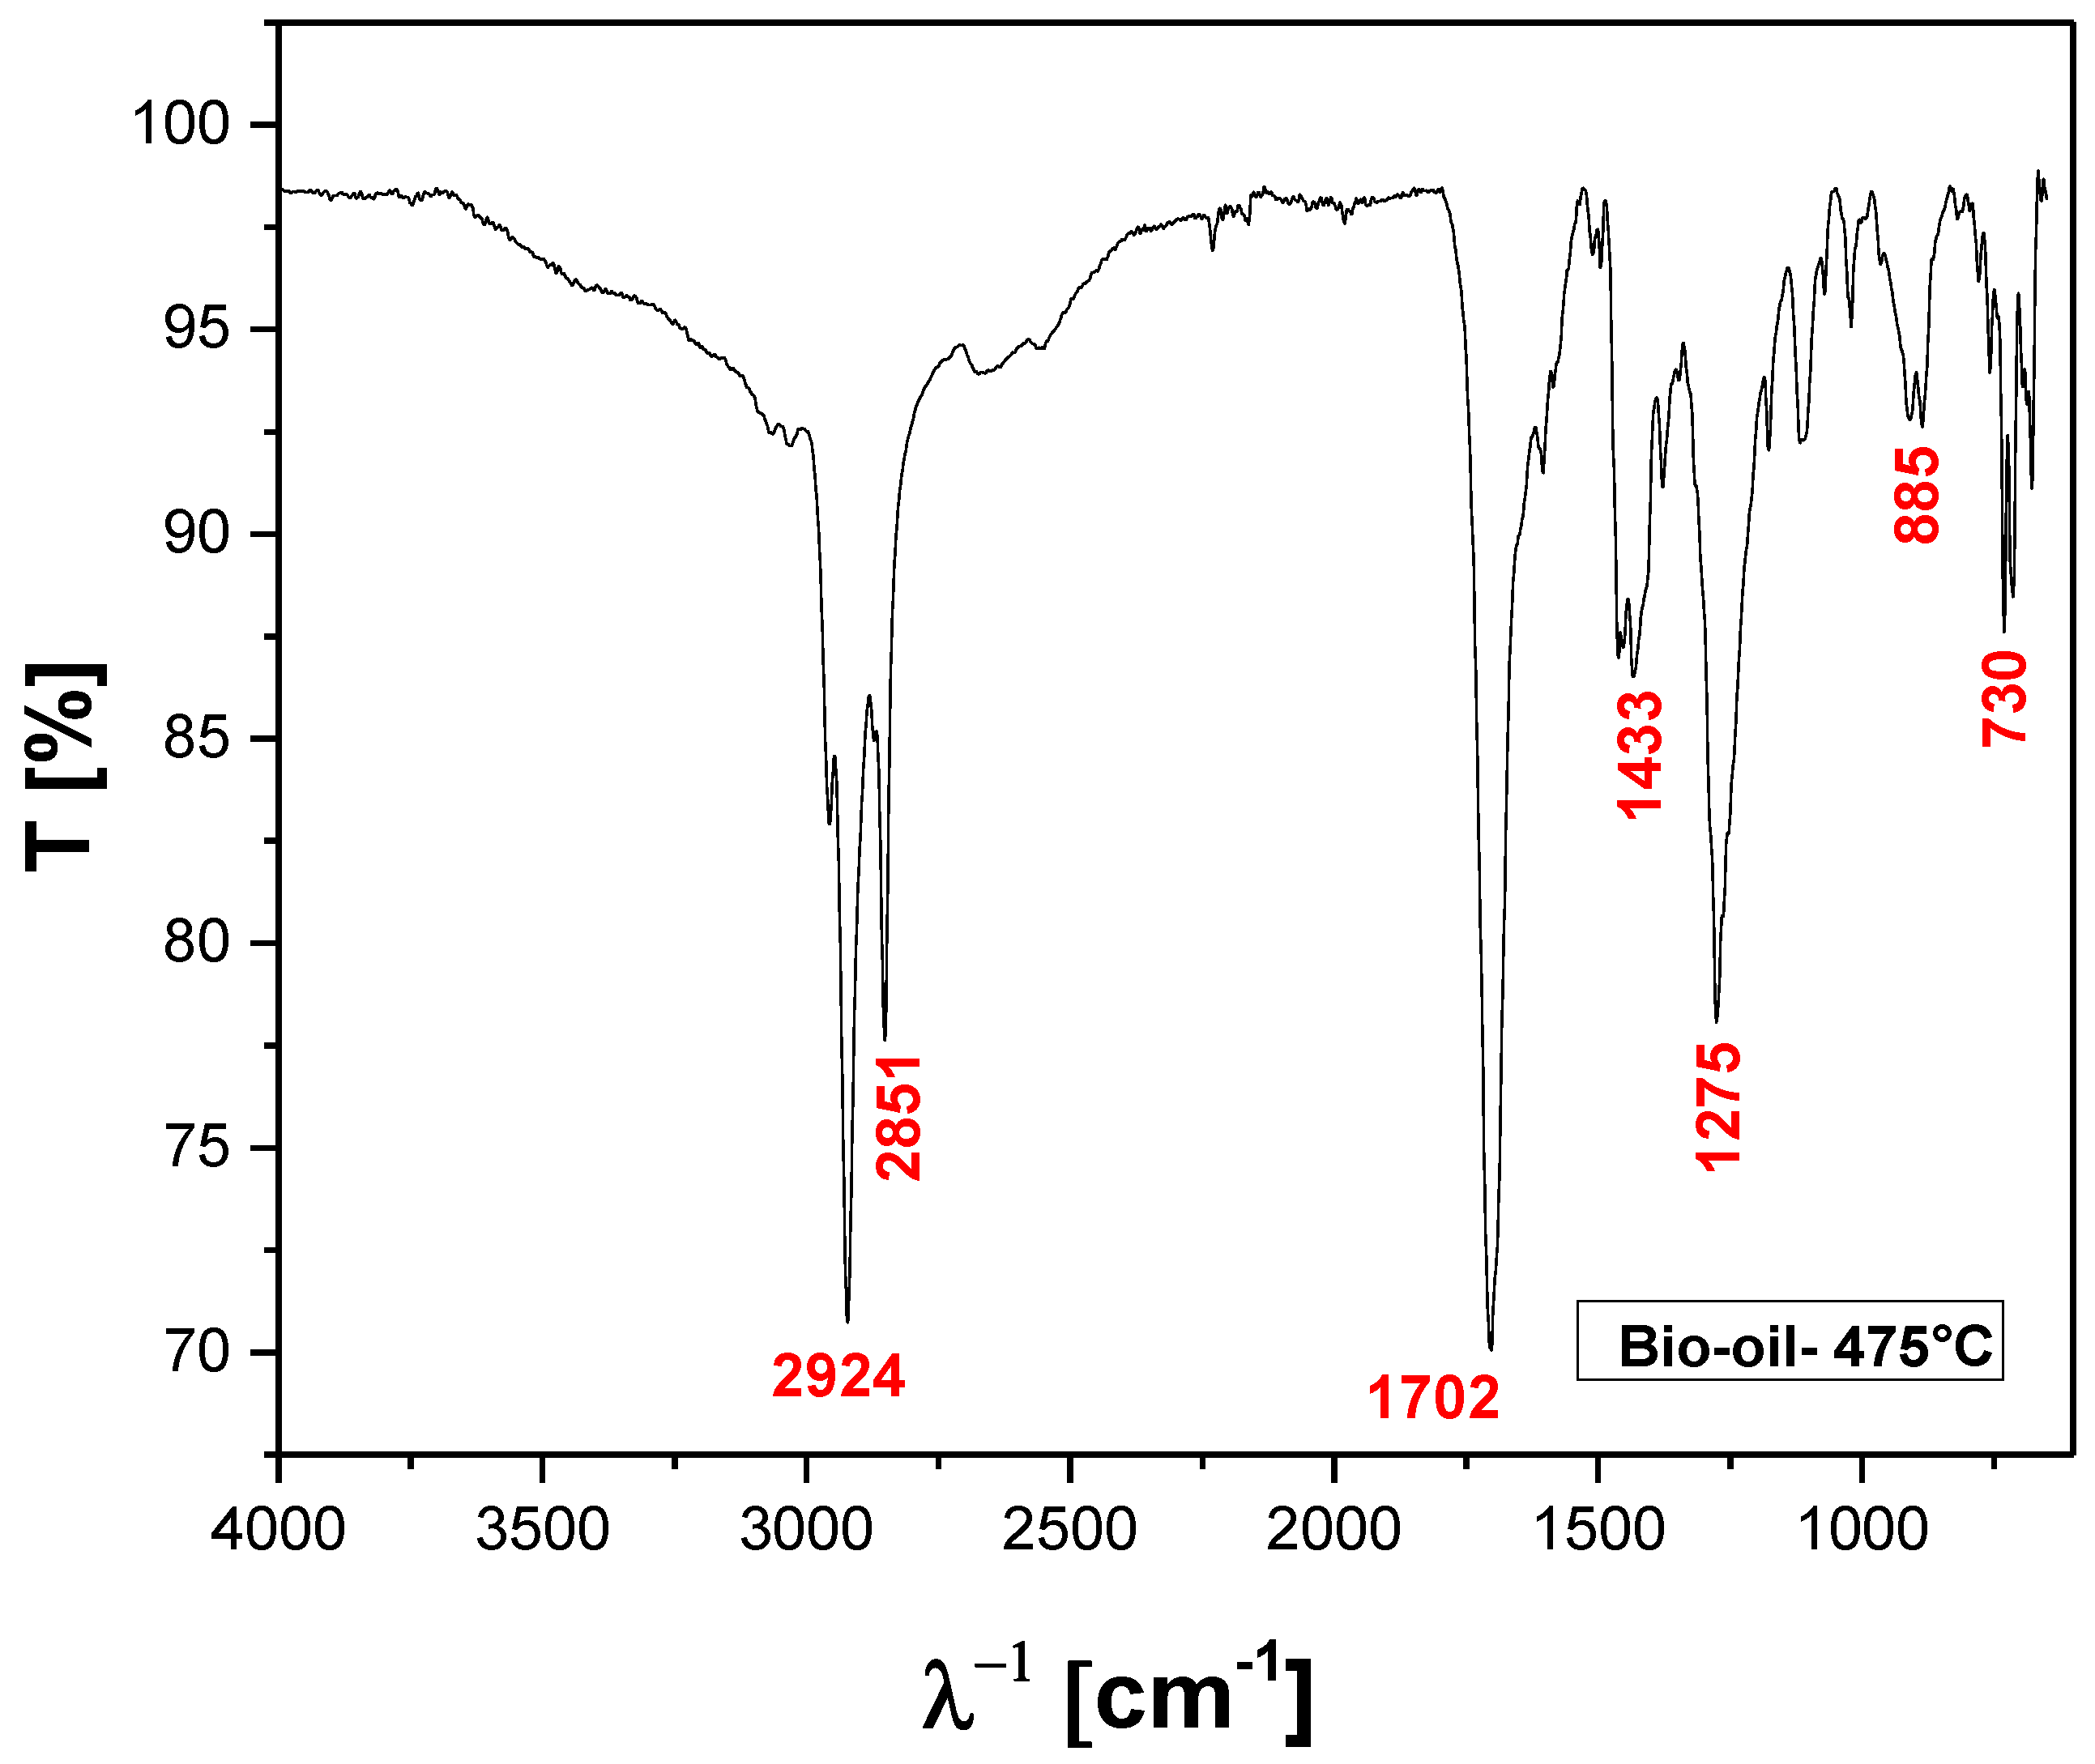
Figure 15.
FT-IR of bio-oil obtained by pyrolysis of MSW fraction (organic matter + paper+plastic) at 475 °C, 1.0 atmosphere, in laboratory scale.
Figure 15.
FT-IR of bio-oil obtained by pyrolysis of MSW fraction (organic matter + paper+plastic) at 475 °C, 1.0 atmosphere, in laboratory scale.
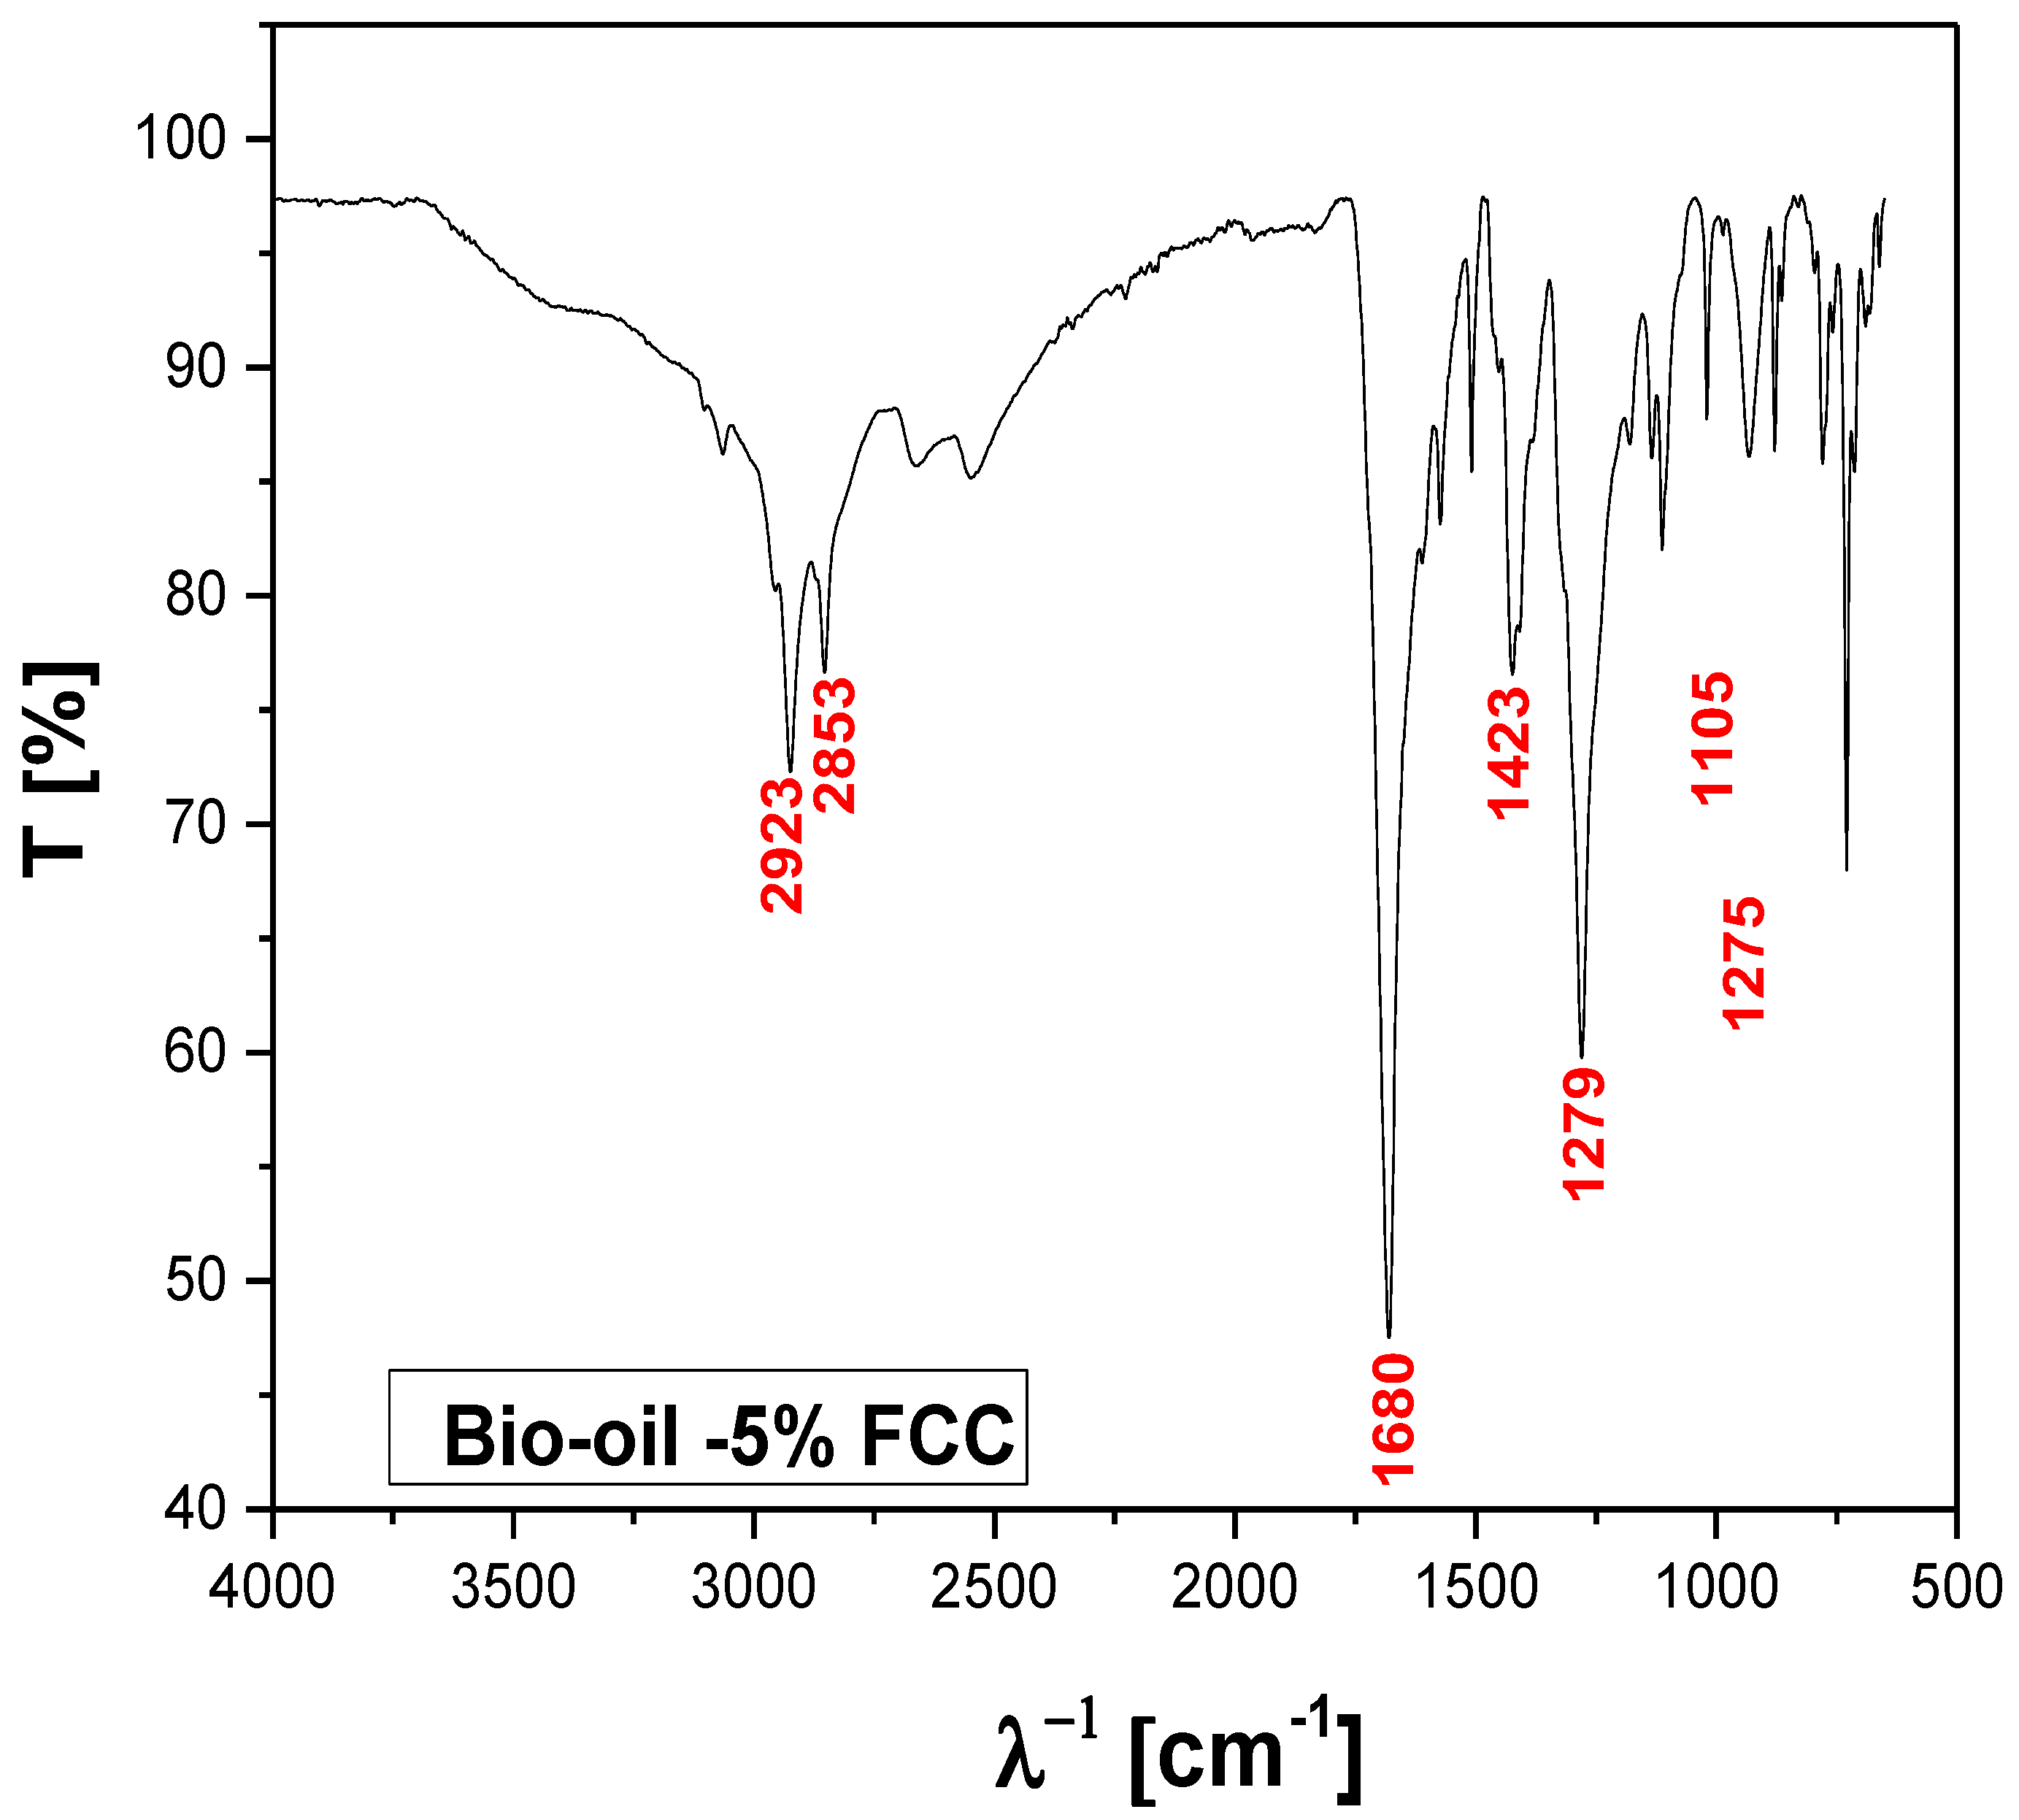
Figure 16.
FT-IR of bio-oil obtained by catalytic cracking of MHSW fraction (organic matter + paper+plastic) at 450°C, 1.0 atm, 5.0 % (wt.) FCC, in laboratory scale.
Figure 16.
FT-IR of bio-oil obtained by catalytic cracking of MHSW fraction (organic matter + paper+plastic) at 450°C, 1.0 atm, 5.0 % (wt.) FCC, in laboratory scale.
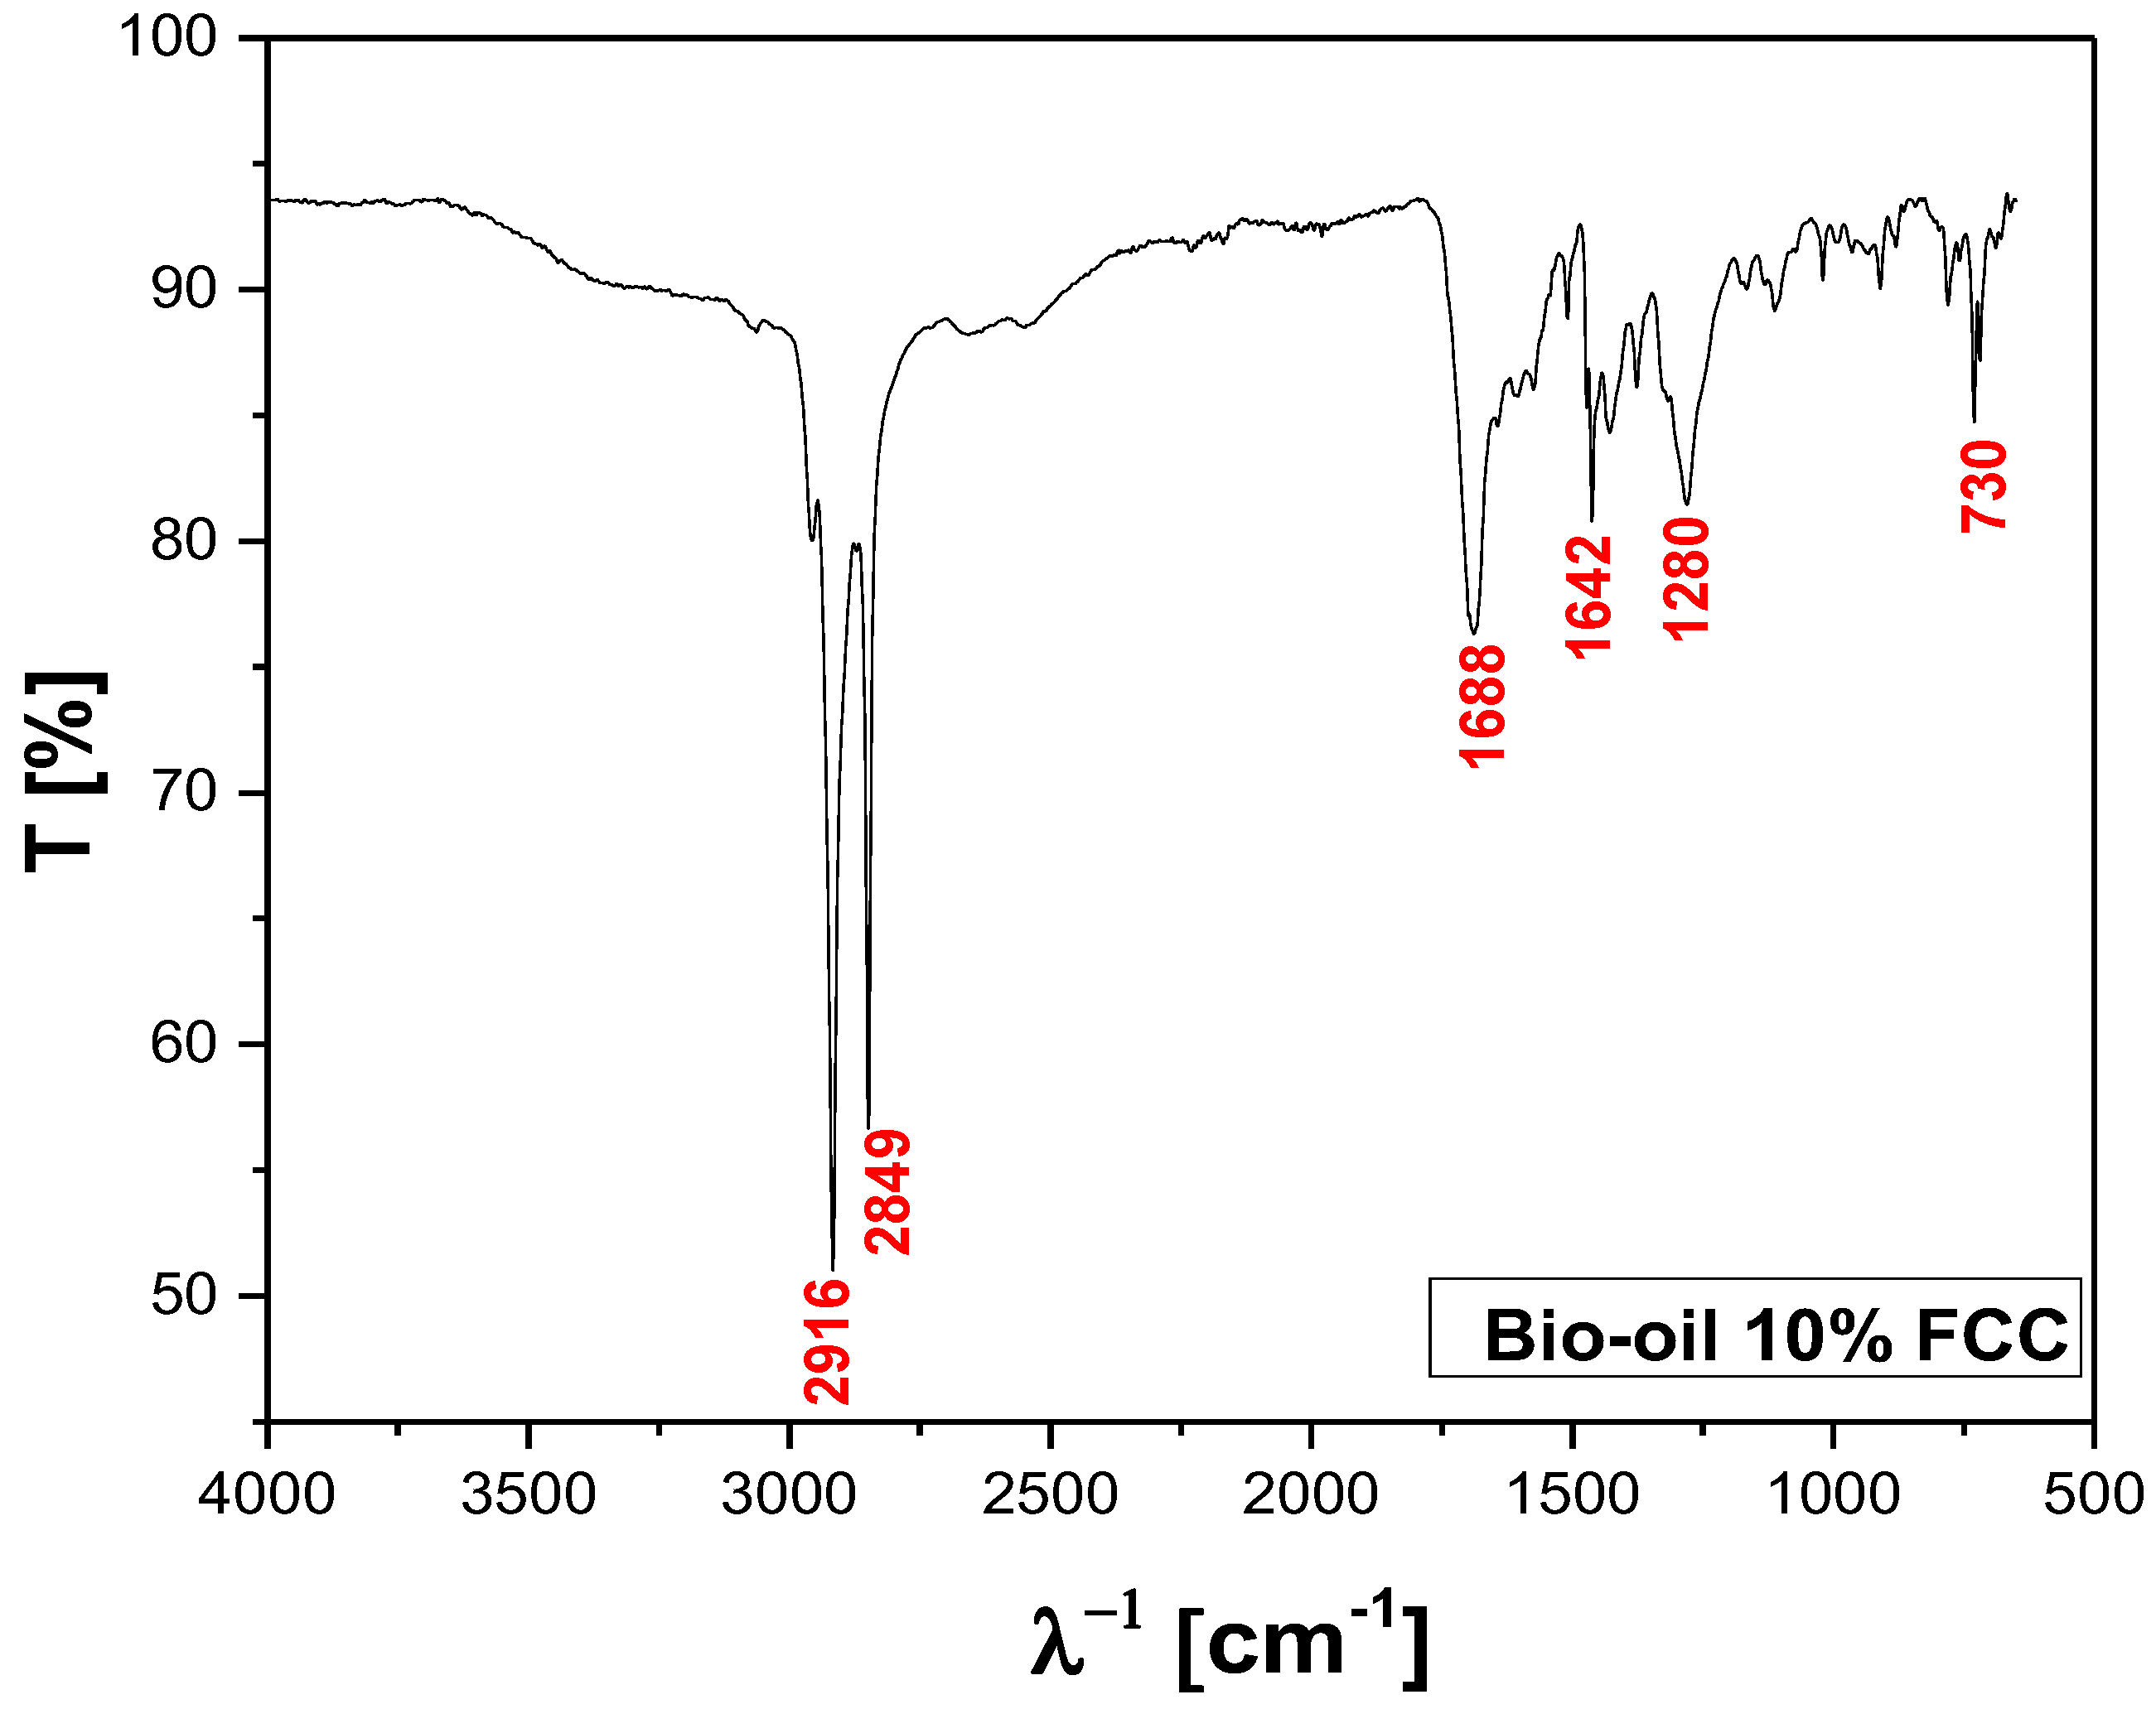
Figure 17.
FT-IR of bio-oil obtained by catalytic cracking of MHSW fraction (organic matter + paper+plastic) at 450°C, 1.0 atm, 10.0% (wt.) FCC, in laboratory scale.
Figure 17.
FT-IR of bio-oil obtained by catalytic cracking of MHSW fraction (organic matter + paper+plastic) at 450°C, 1.0 atm, 10.0% (wt.) FCC, in laboratory scale.
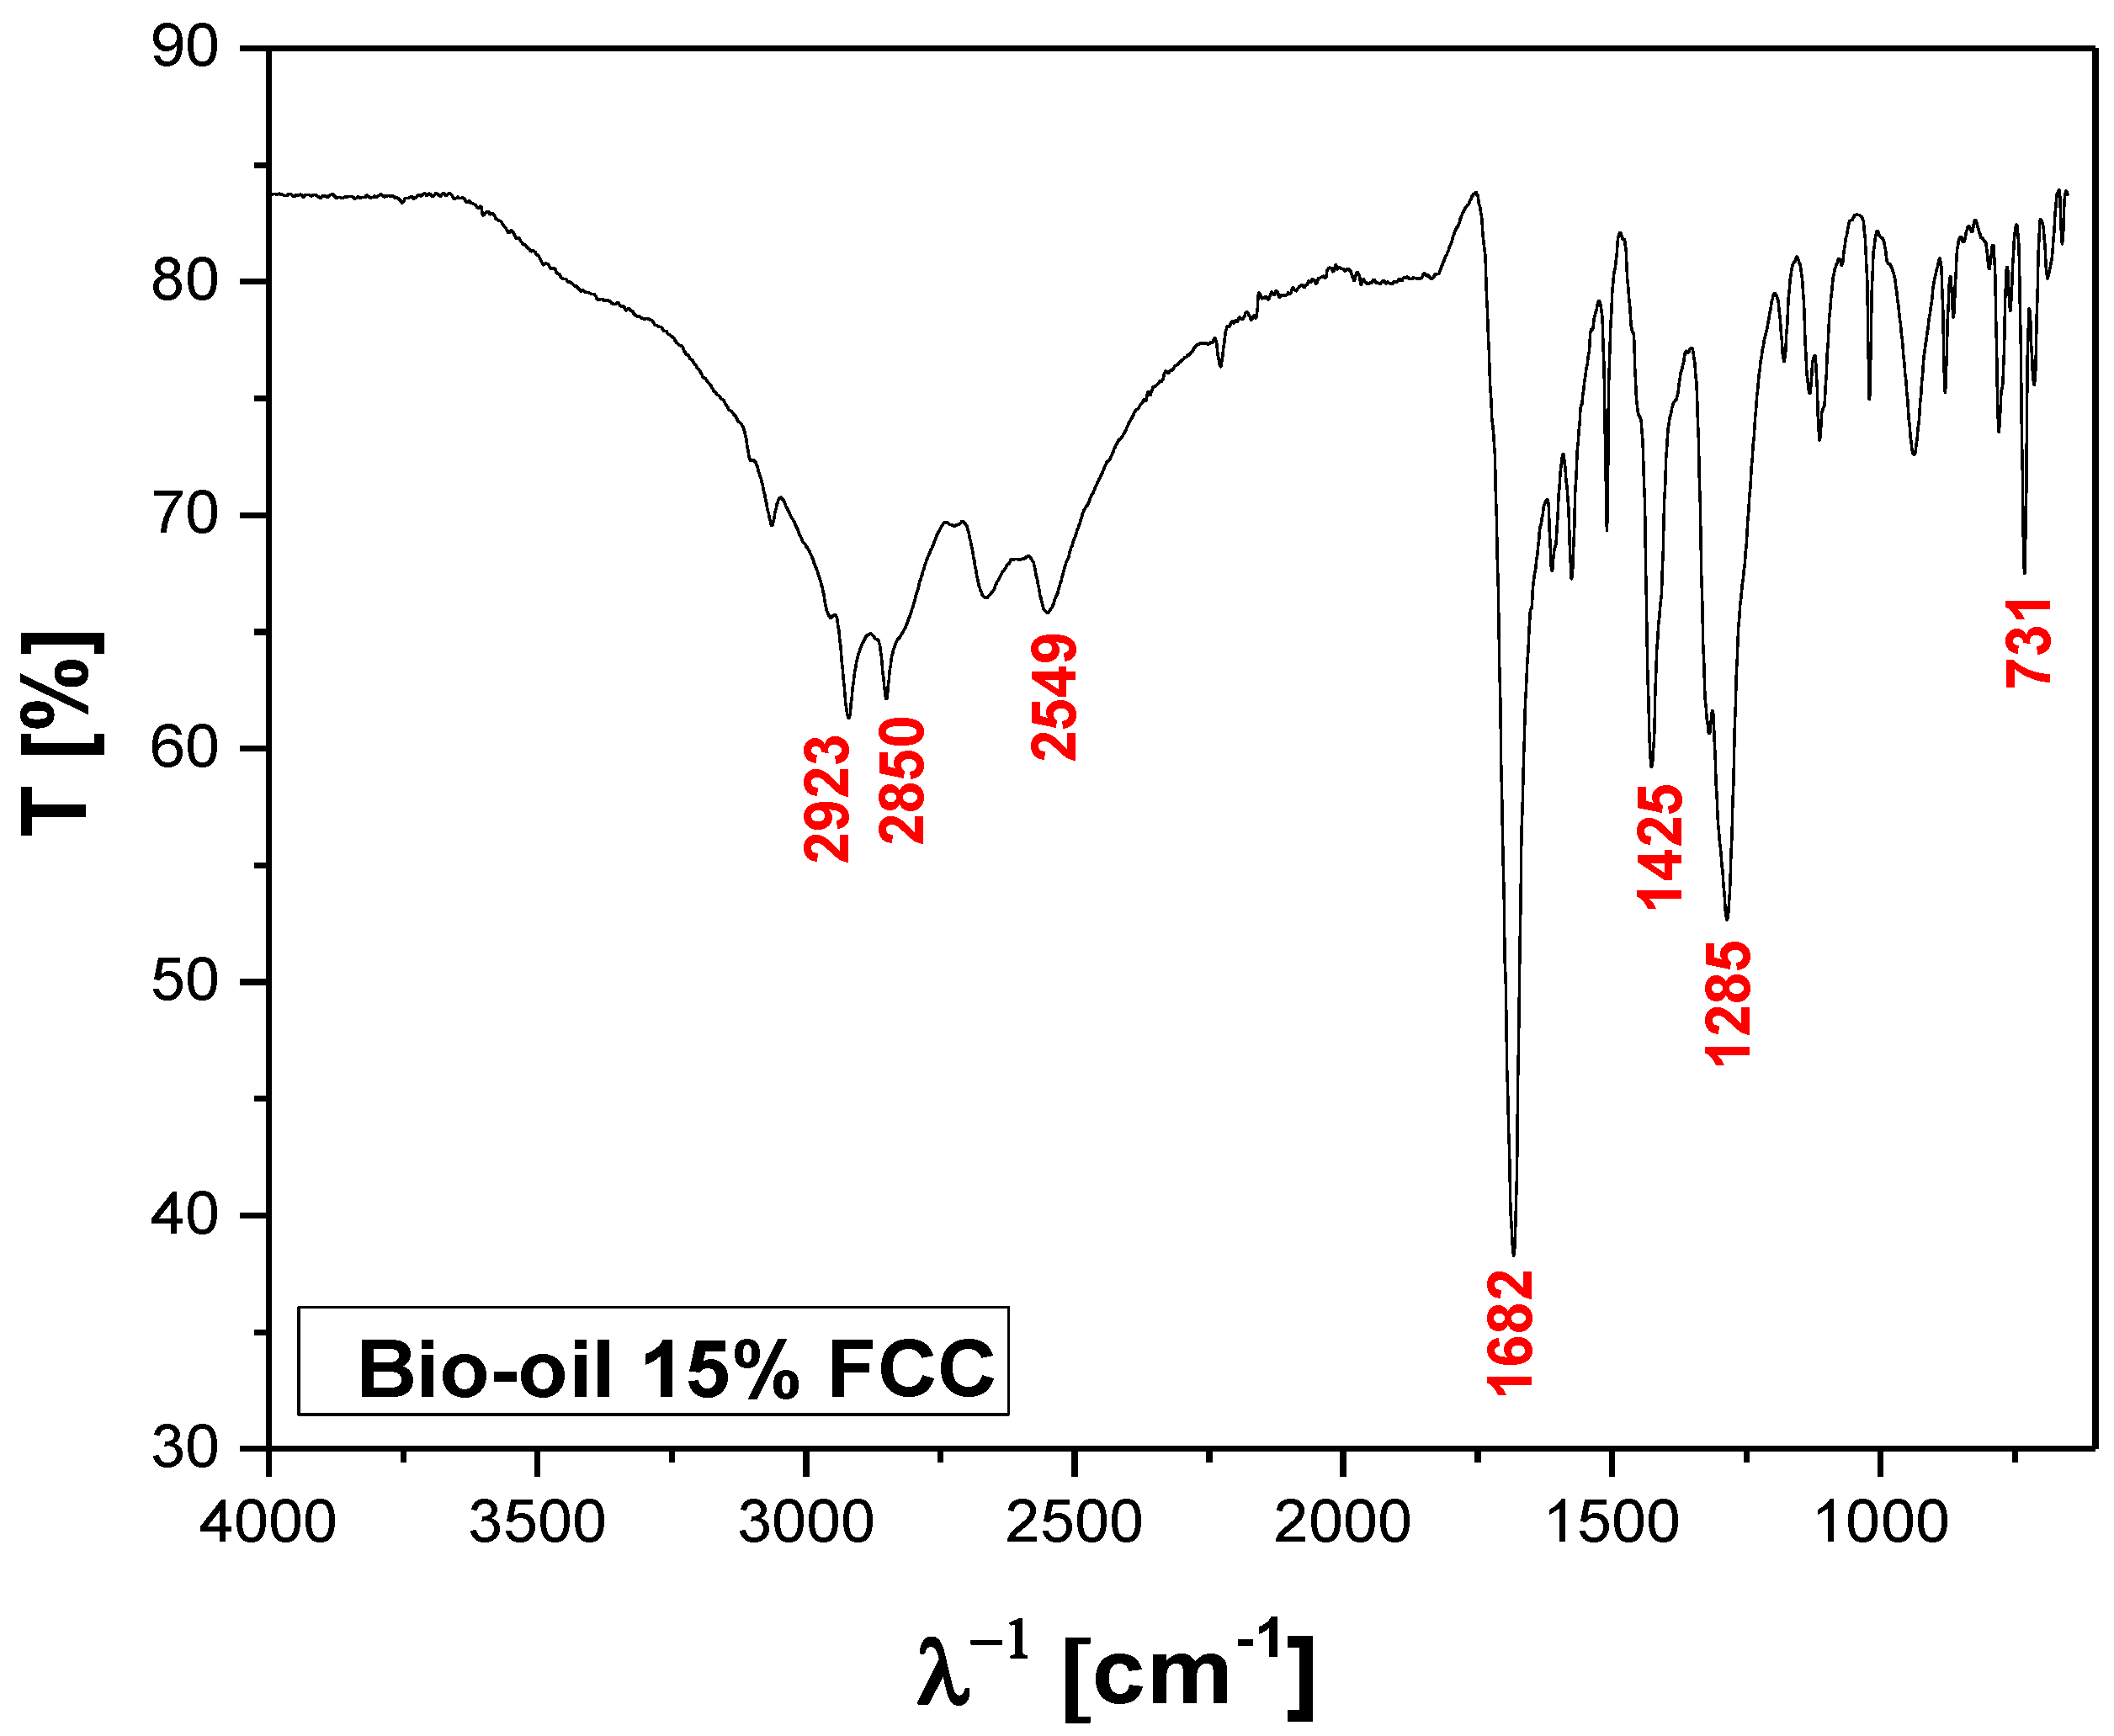
Figure 18.
FT-IR of bio-oil obtained by catalytic cracking of MHSW fraction (organic matter + paper+plastic) at 450°C, 1.0 atm, 15.0% (wt.) FCC, in laboratory scale.
Figure 18.
FT-IR of bio-oil obtained by catalytic cracking of MHSW fraction (organic matter + paper+plastic) at 450°C, 1.0 atm, 15.0% (wt.) FCC, in laboratory scale.
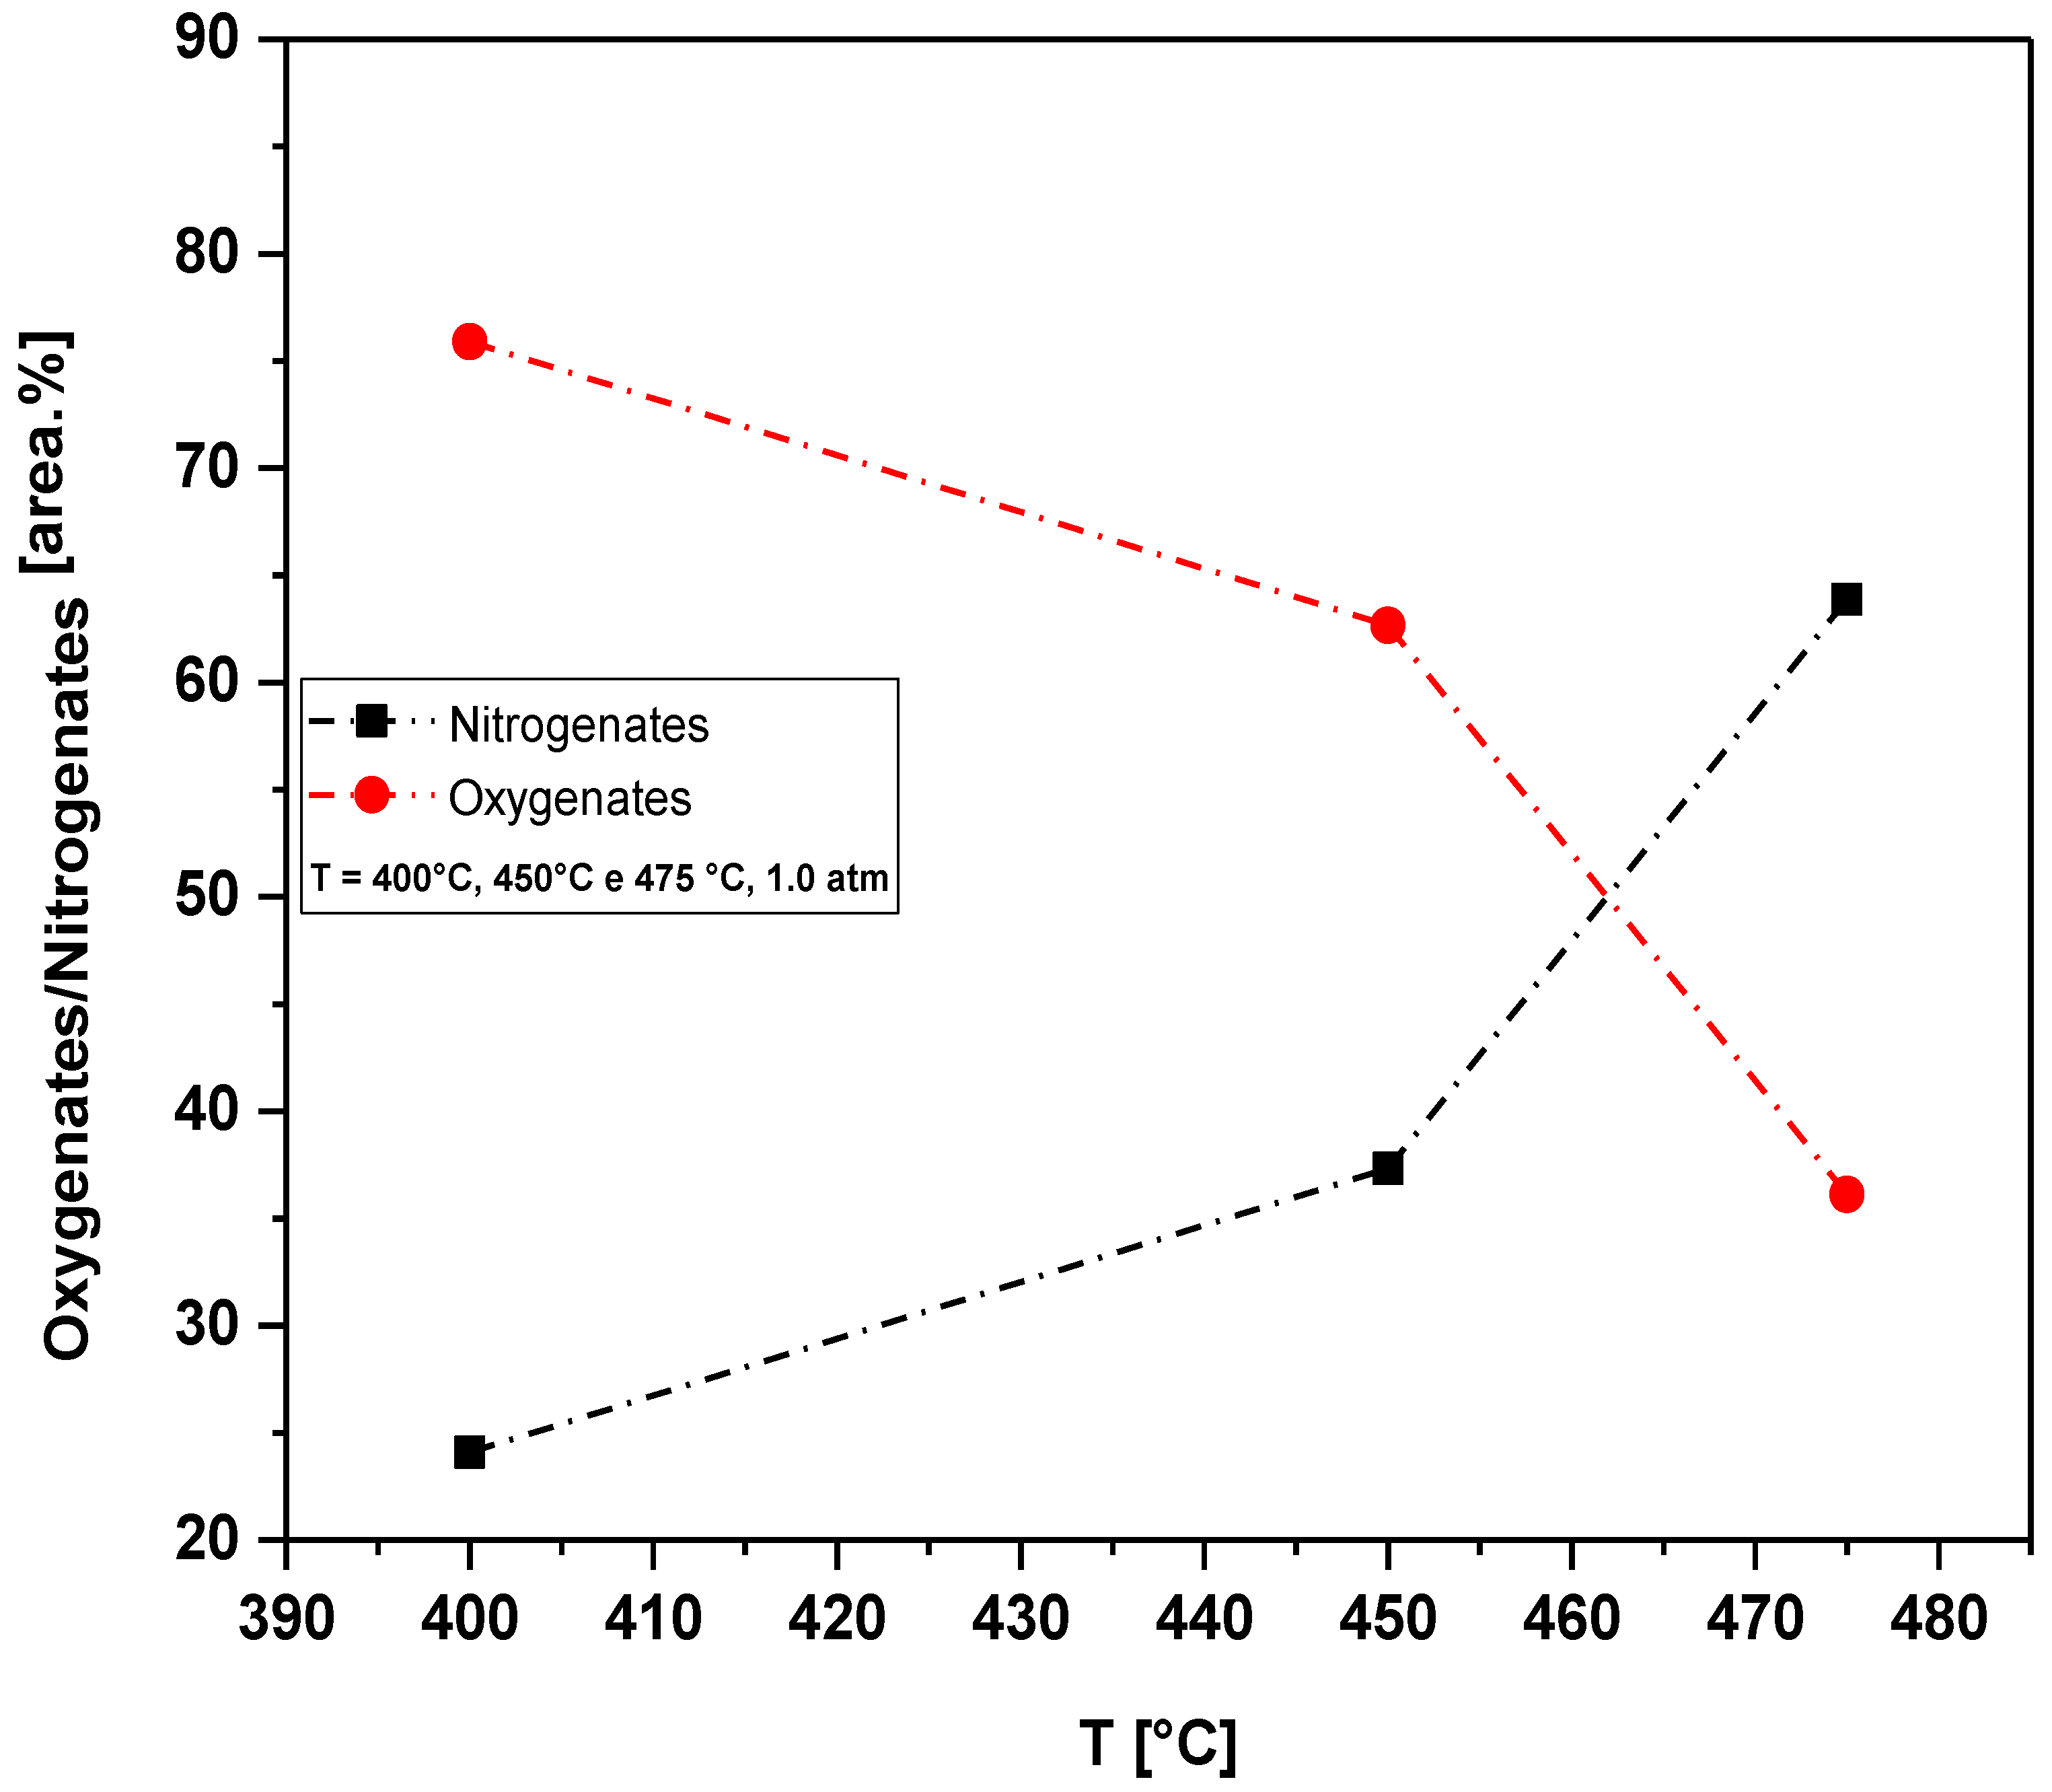
Figure 19.
Effect of temperature on the chemical composition, expressed in oxygenates and nitrogenates, of bio-oils obtained by pyrolysis of the MSW fraction (organic matter + paper + plastic) at 400, 450 and 475 °C, 1.0 atm, on a laboratory scale.
Figure 19.
Effect of temperature on the chemical composition, expressed in oxygenates and nitrogenates, of bio-oils obtained by pyrolysis of the MSW fraction (organic matter + paper + plastic) at 400, 450 and 475 °C, 1.0 atm, on a laboratory scale.
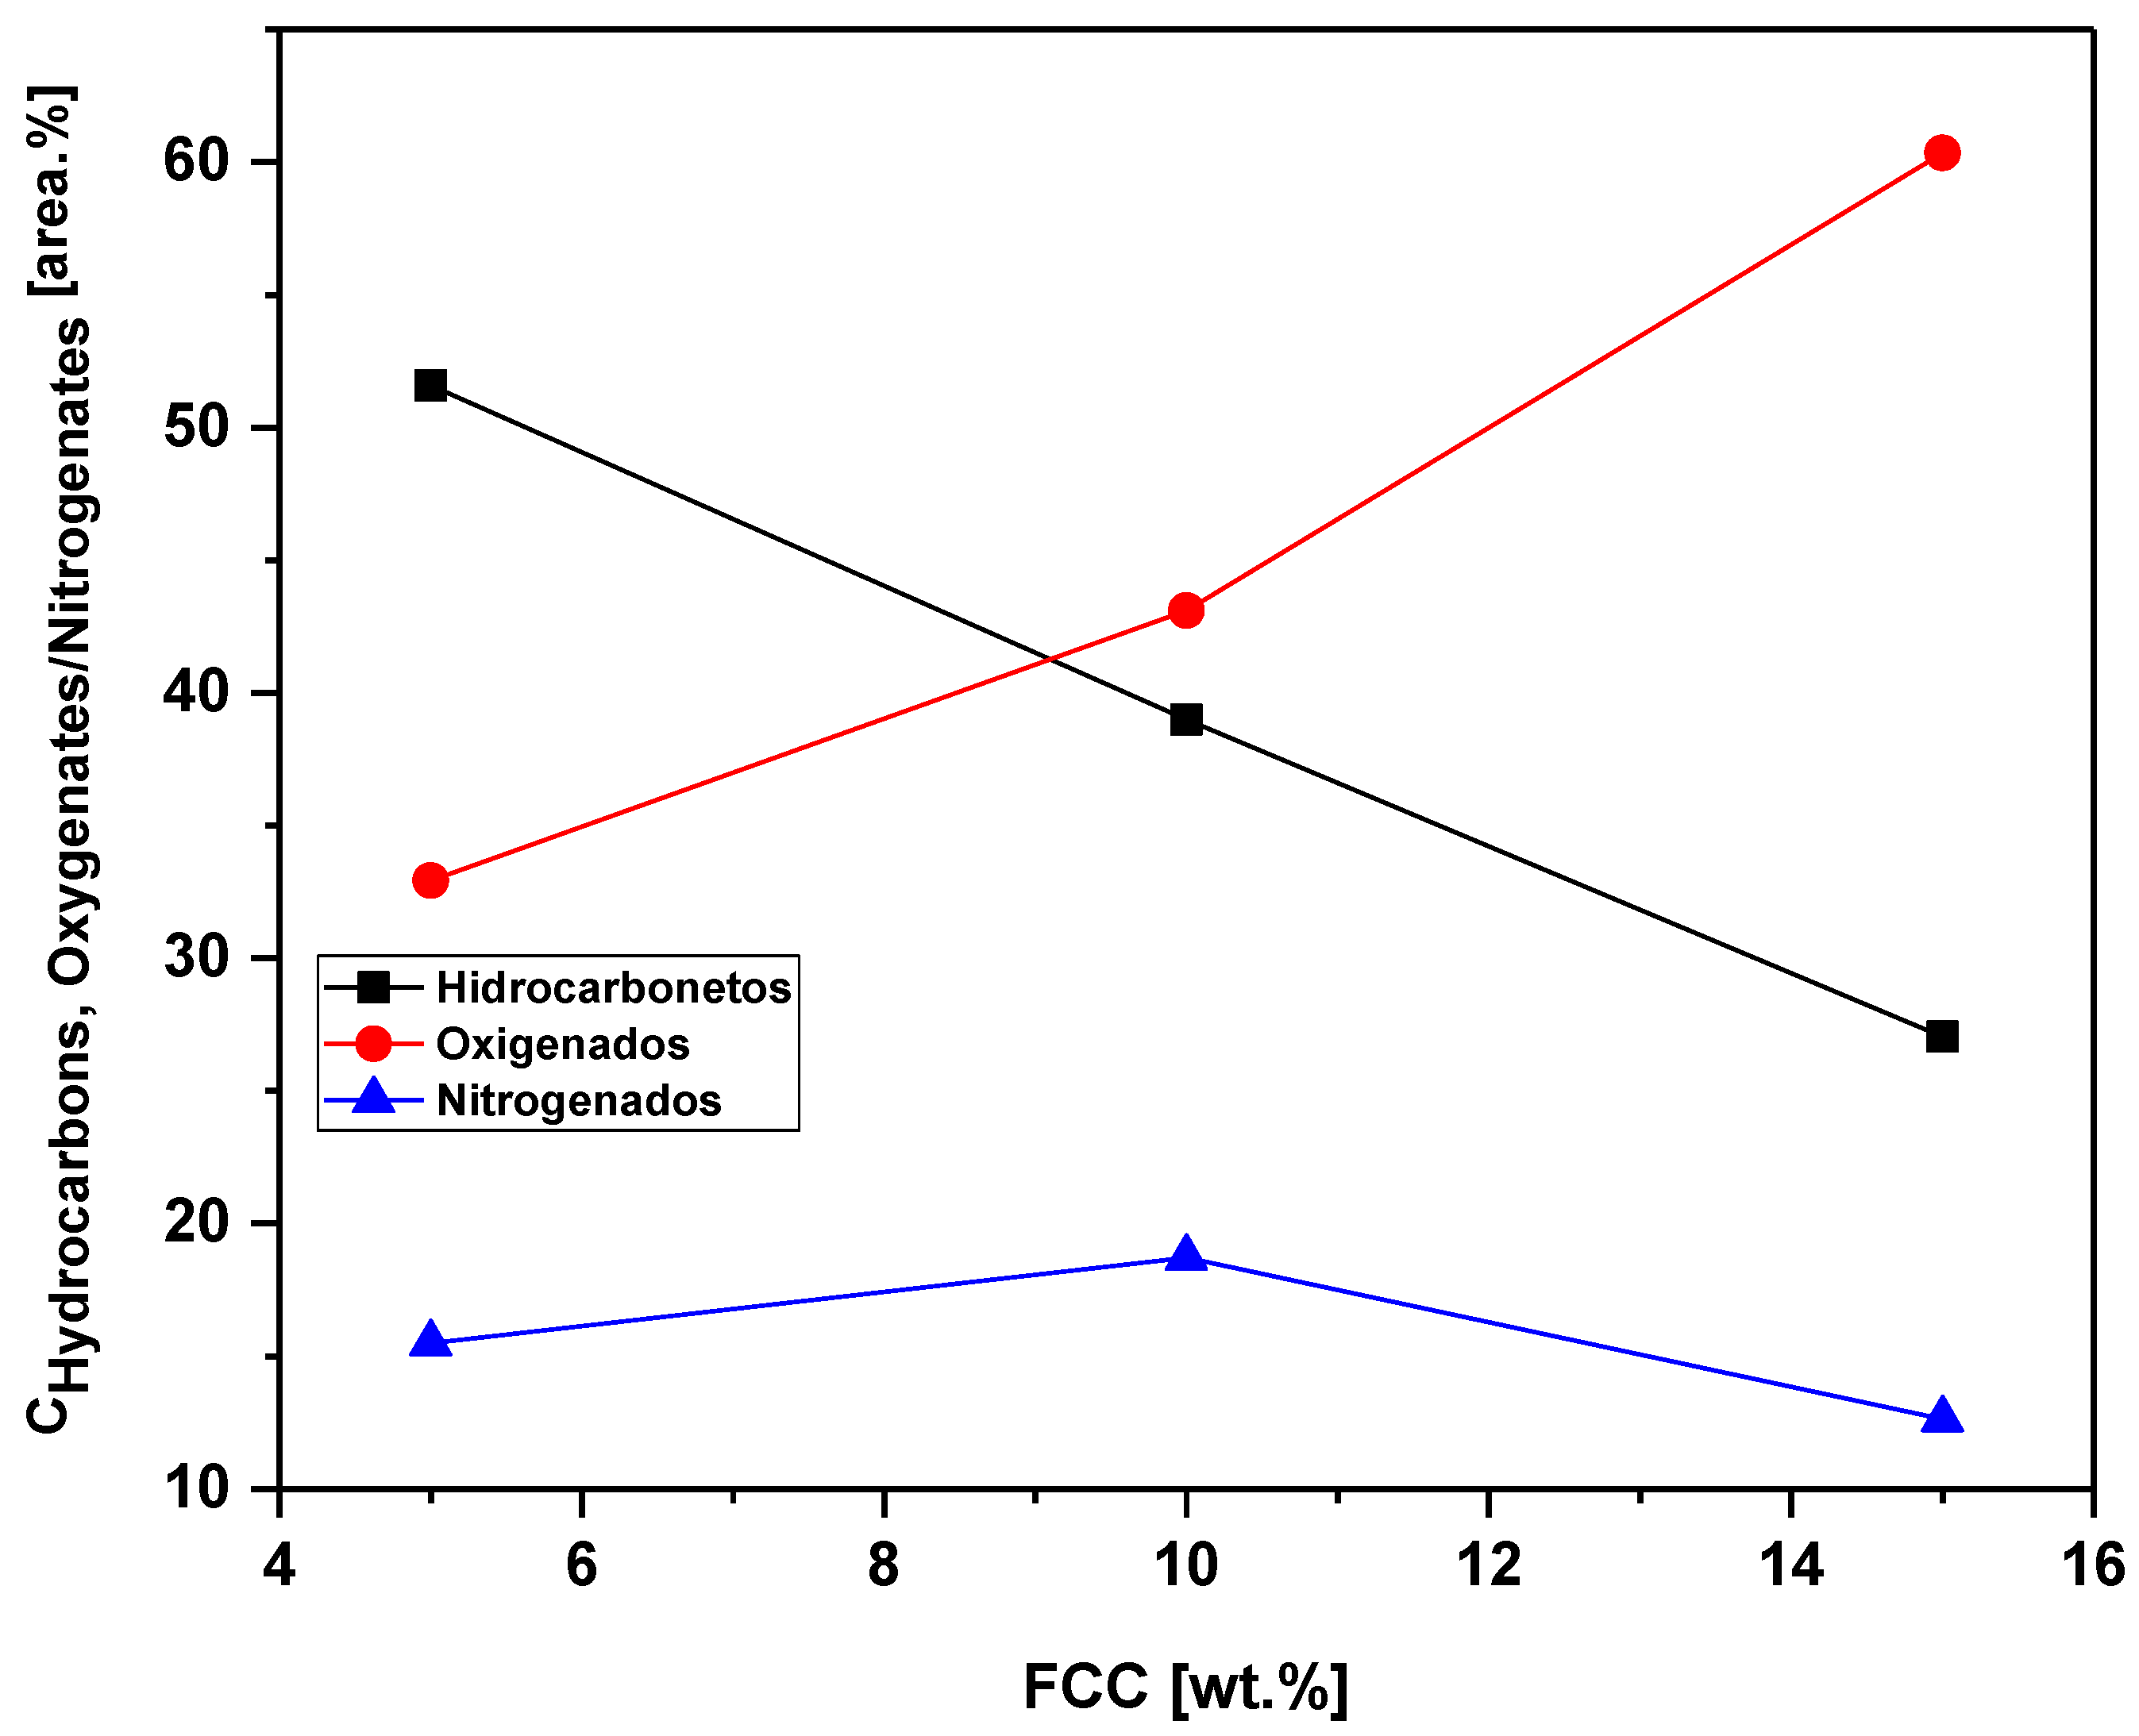
Figure 20.
Effect of the FCC/RSU ratio on the content of oxygenates, hydrocarbons and nitrogen in bio-oil obtained by catalytic pyrolysis of the MSW fraction (organic matter + paper + plastic) at 450 °C, 1.0 atm, 5.0, 10.0 and 15.0% (by mass) of FCC, on a laboratory scale.
Figure 20.
Effect of the FCC/RSU ratio on the content of oxygenates, hydrocarbons and nitrogen in bio-oil obtained by catalytic pyrolysis of the MSW fraction (organic matter + paper + plastic) at 450 °C, 1.0 atm, 5.0, 10.0 and 15.0% (by mass) of FCC, on a laboratory scale.
Table 1.
Socio-economic classification in the municipality of Belém-Pará-Brazil based on minimum salary [
10].
Table 1.
Socio-economic classification in the municipality of Belém-Pará-Brazil based on minimum salary [
10].
| Socio-economic Classification |
| Classes |
Family Income (Minimum/Basic Salary) |
| A |
over 20 salaries |
| B |
from 10 to 20 salaries |
| C |
from 10 to 20 salaries |
| D |
from 10 to 20 salaries |
| E |
up to 02 salaries |
Table 2.
Laboratory-scale pyrolysis experiments.
Table 2.
Laboratory-scale pyrolysis experiments.
| Experiments |
Feedstock |
FCC catalyst mass (%) |
Temperature (°C) |
Time toRetention (min.) |
| 1 |
F.O + Paper +Plastic |
0 |
400 |
1h 30 |
| 2 |
F. O+ Paper+ Plastic |
0 |
450 |
1h 30 |
| 3 |
F.O.+ Paper+ Plastic |
0 |
475 |
1h 30 |
| 4 |
F.O.+ Paper+Plastic |
5 |
450 |
1h 30 |
| 5 |
F.O.+ Paper +Plastic |
10 |
450 |
1h 30 |
| 6 |
F.O.+ Paper+ Plastic |
15 |
450 |
1h 30 |
Table 3.
Percentages by mass and atomic mass of biochars obtained by pyrolysis of the fraction (organic matter + paper+plastic) of MSW at 450 °C, 1.0 atmosphere and by catalytic pyrolysis of the fraction (organic matter + paper+plastic) of MSW at 450°C, 1.0 atmosphere, with 10.0% (by mass) FCC as catalyst, on laboratory scale.
| Catalyst |
|
ChemicalElements
|
Biochar, Pyrolysis at 450 °C |
Biochar, Catalytic cracking with 10% (wt.) FCC |
| Mass[wt.%] |
SD |
Mass[wt.%] |
SD |
| C |
63.1 |
0.1 |
70.6 |
0.1 |
| Ca |
6.8 |
0.0 |
2.1 |
0.0 |
| Cl |
1.5 |
0.0 |
3.5 |
0.0 |
| K |
2.0 |
0.0 |
2.8 |
0.0 |
| O |
22.3 |
0.1 |
17.3 |
0.1 |
| Na |
1.9 |
0.0 |
1.7 |
0.0 |
| Fe |
0.5 |
0.0 |
0.2 |
0.0 |
| Mg |
0.4 |
0.0 |
0.4 |
0.0 |
| Si |
0.5 |
0.0 |
0.9 |
0.0 |
| Al |
0.3 |
0.0 |
0.4 |
0.0 |
| P |
0.5 |
0.0 |
- |
- |
| Ti |
- |
- |
0.1 |
0.0 |
Table 4.
Process parameters, mass balances, and yields of reaction products (liquids, solids, H2O, and gas) by pyrolysis of MHSW fraction (organic matter + paper+ plastic) at 400, 450, and 475 °C, 1.0 atmosphere, in laboratory scale.
Table 4.
Process parameters, mass balances, and yields of reaction products (liquids, solids, H2O, and gas) by pyrolysis of MHSW fraction (organic matter + paper+ plastic) at 400, 450, and 475 °C, 1.0 atmosphere, in laboratory scale.
| Process parameters |
Thermal Experiments |
| 400 [ºC] |
450 [ºC] |
475 [ºC] |
| Mass of urban solid wastes (organic matter + paper + plastic) [g] |
50.01 |
50.02 |
50.02 |
| Cracking time [min] |
90 |
100 |
110 |
| Initial cracking temperature [°C] |
327 |
332 |
334 |
| Mass of solids (coke) [g] |
32.99 |
23.48 |
20.18 |
| Mass of bio-oil [g] |
4.67 |
4.72 |
4.62 |
| Mass of H2O [g] |
9.39 |
10.97 |
11.08 |
| Mass of gas [g] |
5.92 |
10.85 |
14.12 |
| Yield of bio-oil [%] |
9.34 |
9.44 |
9.24 |
| Yield of H2O [%] |
18.78 |
21.93 |
22.15 |
| Yield of solids [%] |
65.97 |
46.94 |
40.34 |
| Yield of gas [%] |
5.92 |
21.69 |
28.27 |
Table 5.
Process parameters, mass balances, and yields of reaction products (liquids, solids, H2O, and gas) by pyrolysis and catalytic cracking of urban solid wastes (organic matter + paper + plastic) at 450 °C, 1.0 atm, 5.0, 10.0, and 15.0% (wt.) of FCC, in laboratory scale.
Table 5.
Process parameters, mass balances, and yields of reaction products (liquids, solids, H2O, and gas) by pyrolysis and catalytic cracking of urban solid wastes (organic matter + paper + plastic) at 450 °C, 1.0 atm, 5.0, 10.0, and 15.0% (wt.) of FCC, in laboratory scale.
| Process parameters |
450 [°C] |
| 0.0(wt.) |
5.0 (wt.) |
10.0(wt.) |
15.0(wt.) |
| Mass of urban solid wastes (organic matter + paper + plastic) [g] |
50.02 |
31.52 |
33.02 |
34.51 |
| Mass of FCC [g] |
0.0 |
1.51 |
3.01 |
4.51 |
| Cracking time [min] |
100 |
90 |
90 |
90 |
| Initial cracking temperature [°C] |
332 |
278 |
267 |
265 |
| Mechanical system stirring speed [rpm] |
0 |
0 |
0 |
0 |
| Mass of solids (coke) [g] |
23.48 |
14.43 |
12.55 |
11.01 |
| Mass of bio-oil [g] |
4.72 |
1.15 |
1.45 |
1.15 |
| Mass of H2O [g] |
10.97 |
5.40 |
6.75 |
4.04 |
| Mass of gas [g] |
10.85 |
9.01 |
9.26 |
13.80 |
| Yield of bio-oil [%] |
9.44 |
3.83 |
4.83 |
3.83 |
| Yield of H2O [%] |
21.93 |
17.99 |
22.49 |
13.47 |
| Yield of solids [%] |
46.94 |
48.08 |
41.82 |
36.70 |
| Yield of gas [%] |
21.69 |
30.01 |
30.86 |
54.00 |
Table 6.
Effect of temperature on the acid index of bio-oils and aqueous phase by pyrolysis of MHSW fraction (organic matter + paper+plastic) at 400, 450, and 475 °C, 1.0 atm, in laboratory scale.
Table 6.
Effect of temperature on the acid index of bio-oils and aqueous phase by pyrolysis of MHSW fraction (organic matter + paper+plastic) at 400, 450, and 475 °C, 1.0 atm, in laboratory scale.
| Physicochemical Property |
Temperature |
| Acid Index |
400 °C |
450 °C |
475 °C |
| I.ABio-Oil [mg KOH/g] |
61.86 |
73.71 |
96.08 |
| I.AAqueous Phase [mg KOH/g] |
74.83 |
56.96 |
45.25 |
Table 7.
Effect of FCC content on the acid index of bio-oils and aqueous phase by catalytic cracking of MHSW fraction (organic matter + paper+plastic) at 450 °C, 1.0 atm, 5.0, 10.0, and 15.0% (wt.) FCC, in laboratory scale.
Table 7.
Effect of FCC content on the acid index of bio-oils and aqueous phase by catalytic cracking of MHSW fraction (organic matter + paper+plastic) at 450 °C, 1.0 atm, 5.0, 10.0, and 15.0% (wt.) FCC, in laboratory scale.
| Physicochemical Property |
450 °C |
| FCC |
| Acid Index |
5.0% (wt.) |
10.0% (wt.) |
15.0% (wt.) |
| I.ABio-Oil [mg KOH/g] |
75.60 |
86.90 |
81.25 |
| I.AAqueous Phase [mg KOH/g] |
55.83 |
64.31 |
72.40 |
Table 13.
Effect of temperature on the chemical composition, expressed in oxygenates/nitrogens, of bio-oils obtained by pyrolysis of the MSW fraction (organic matter + paper+plastic) at 400, 450 and 475 °C, 1.0 atm, on a laboratory scale.
Table 13.
Effect of temperature on the chemical composition, expressed in oxygenates/nitrogens, of bio-oils obtained by pyrolysis of the MSW fraction (organic matter + paper+plastic) at 400, 450 and 475 °C, 1.0 atm, on a laboratory scale.
| Temperature [°C] |
Concentration [%area.] |
| Oxygenates |
Nitrogenates |
| 400 |
75.89 |
24.11 |
| 450 |
62.67 |
37.33 |
| 475 |
36.12 |
63.88 |
