Submitted:
30 March 2024
Posted:
01 April 2024
You are already at the latest version
Abstract
Keywords:
1. Introduction
2. Methods
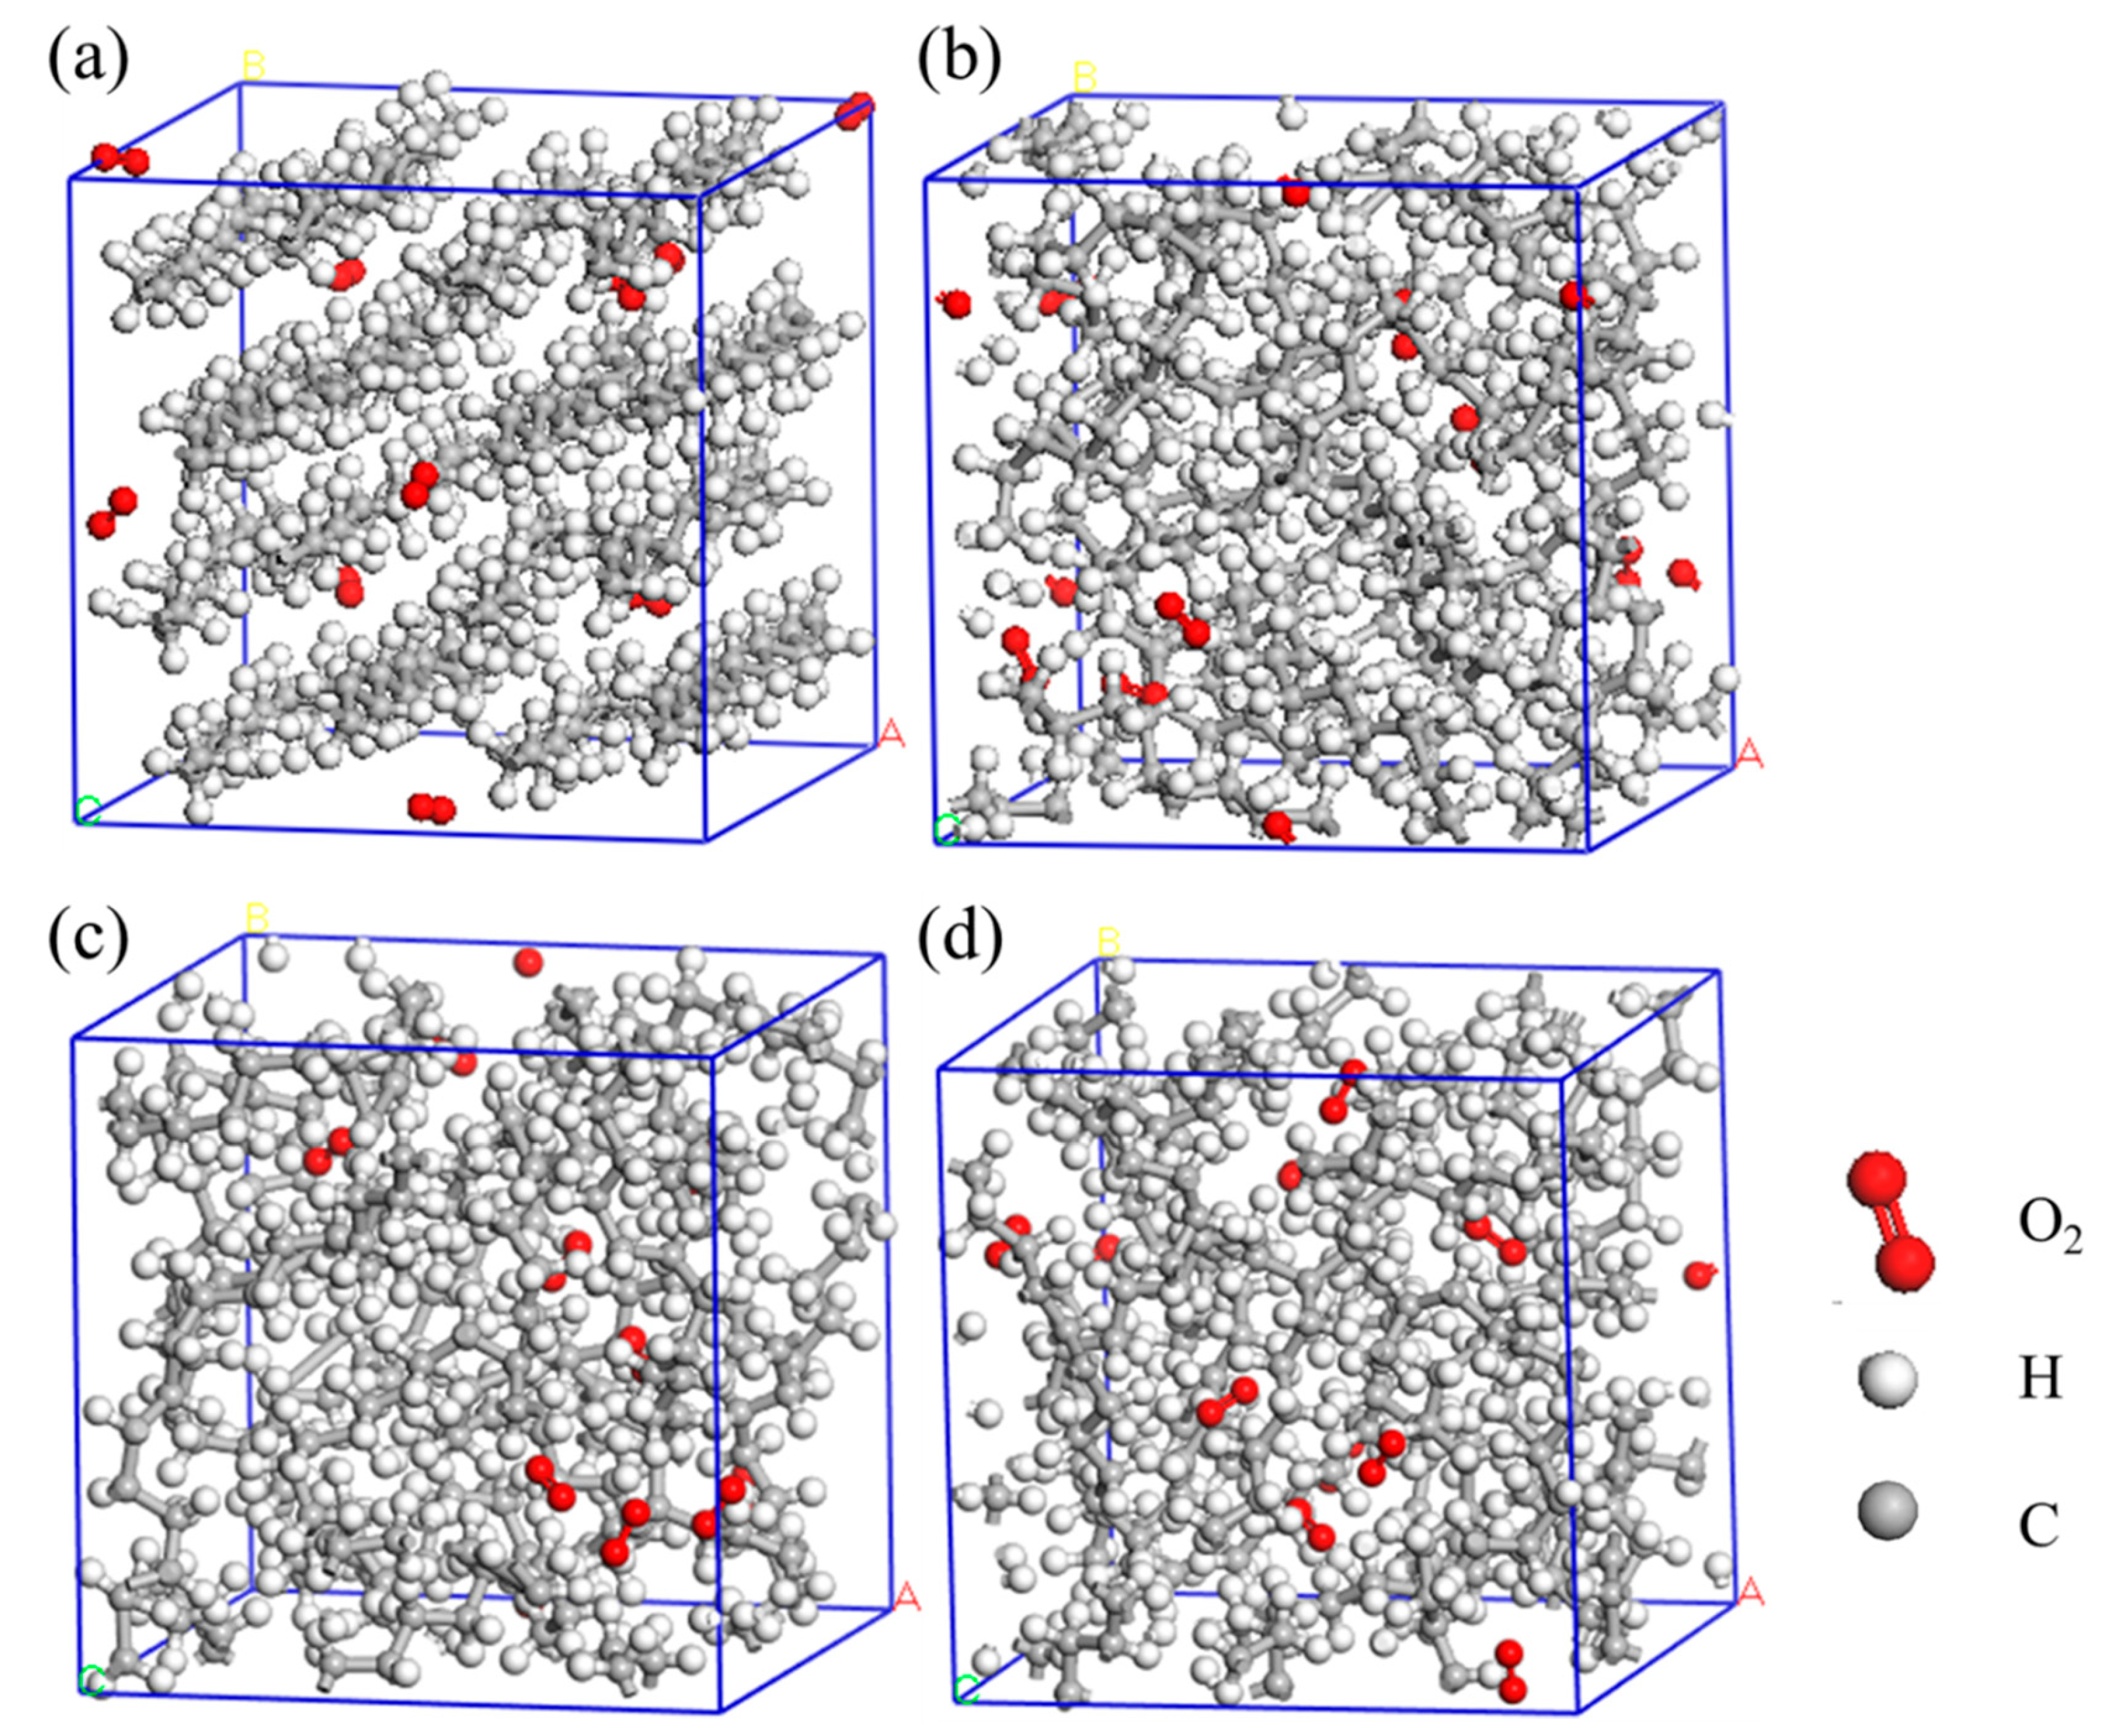
3. Result and Discussion
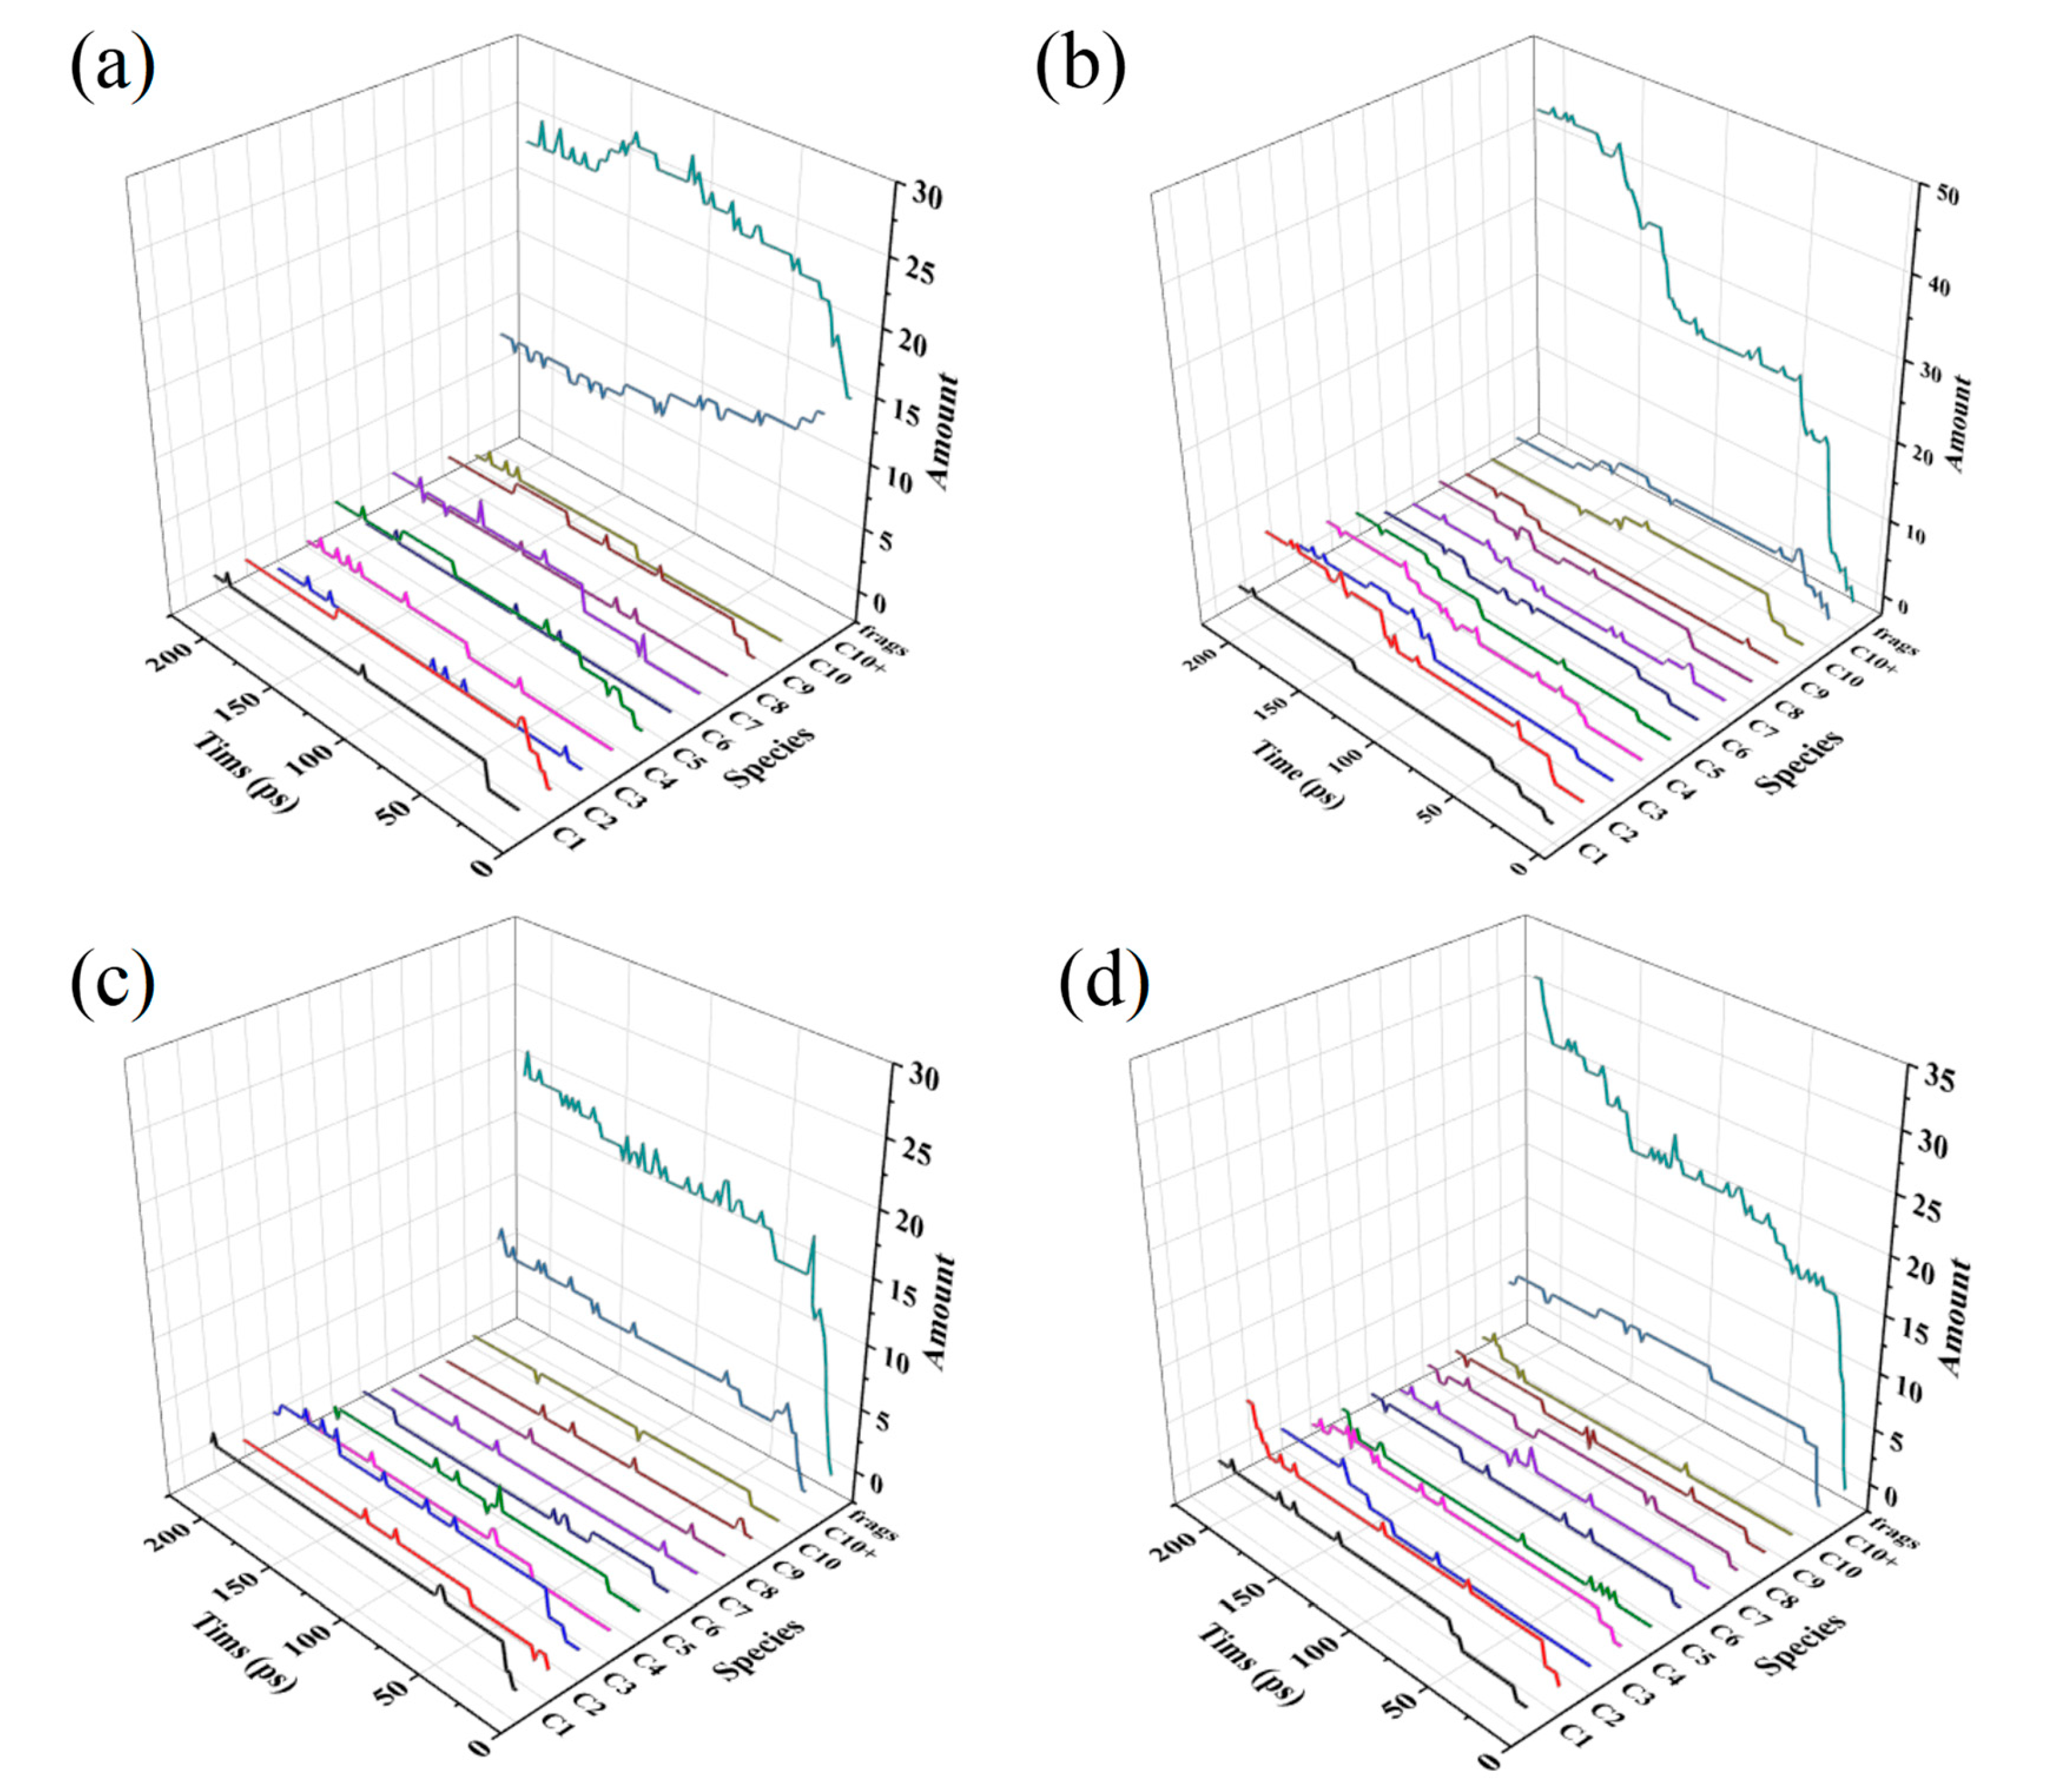
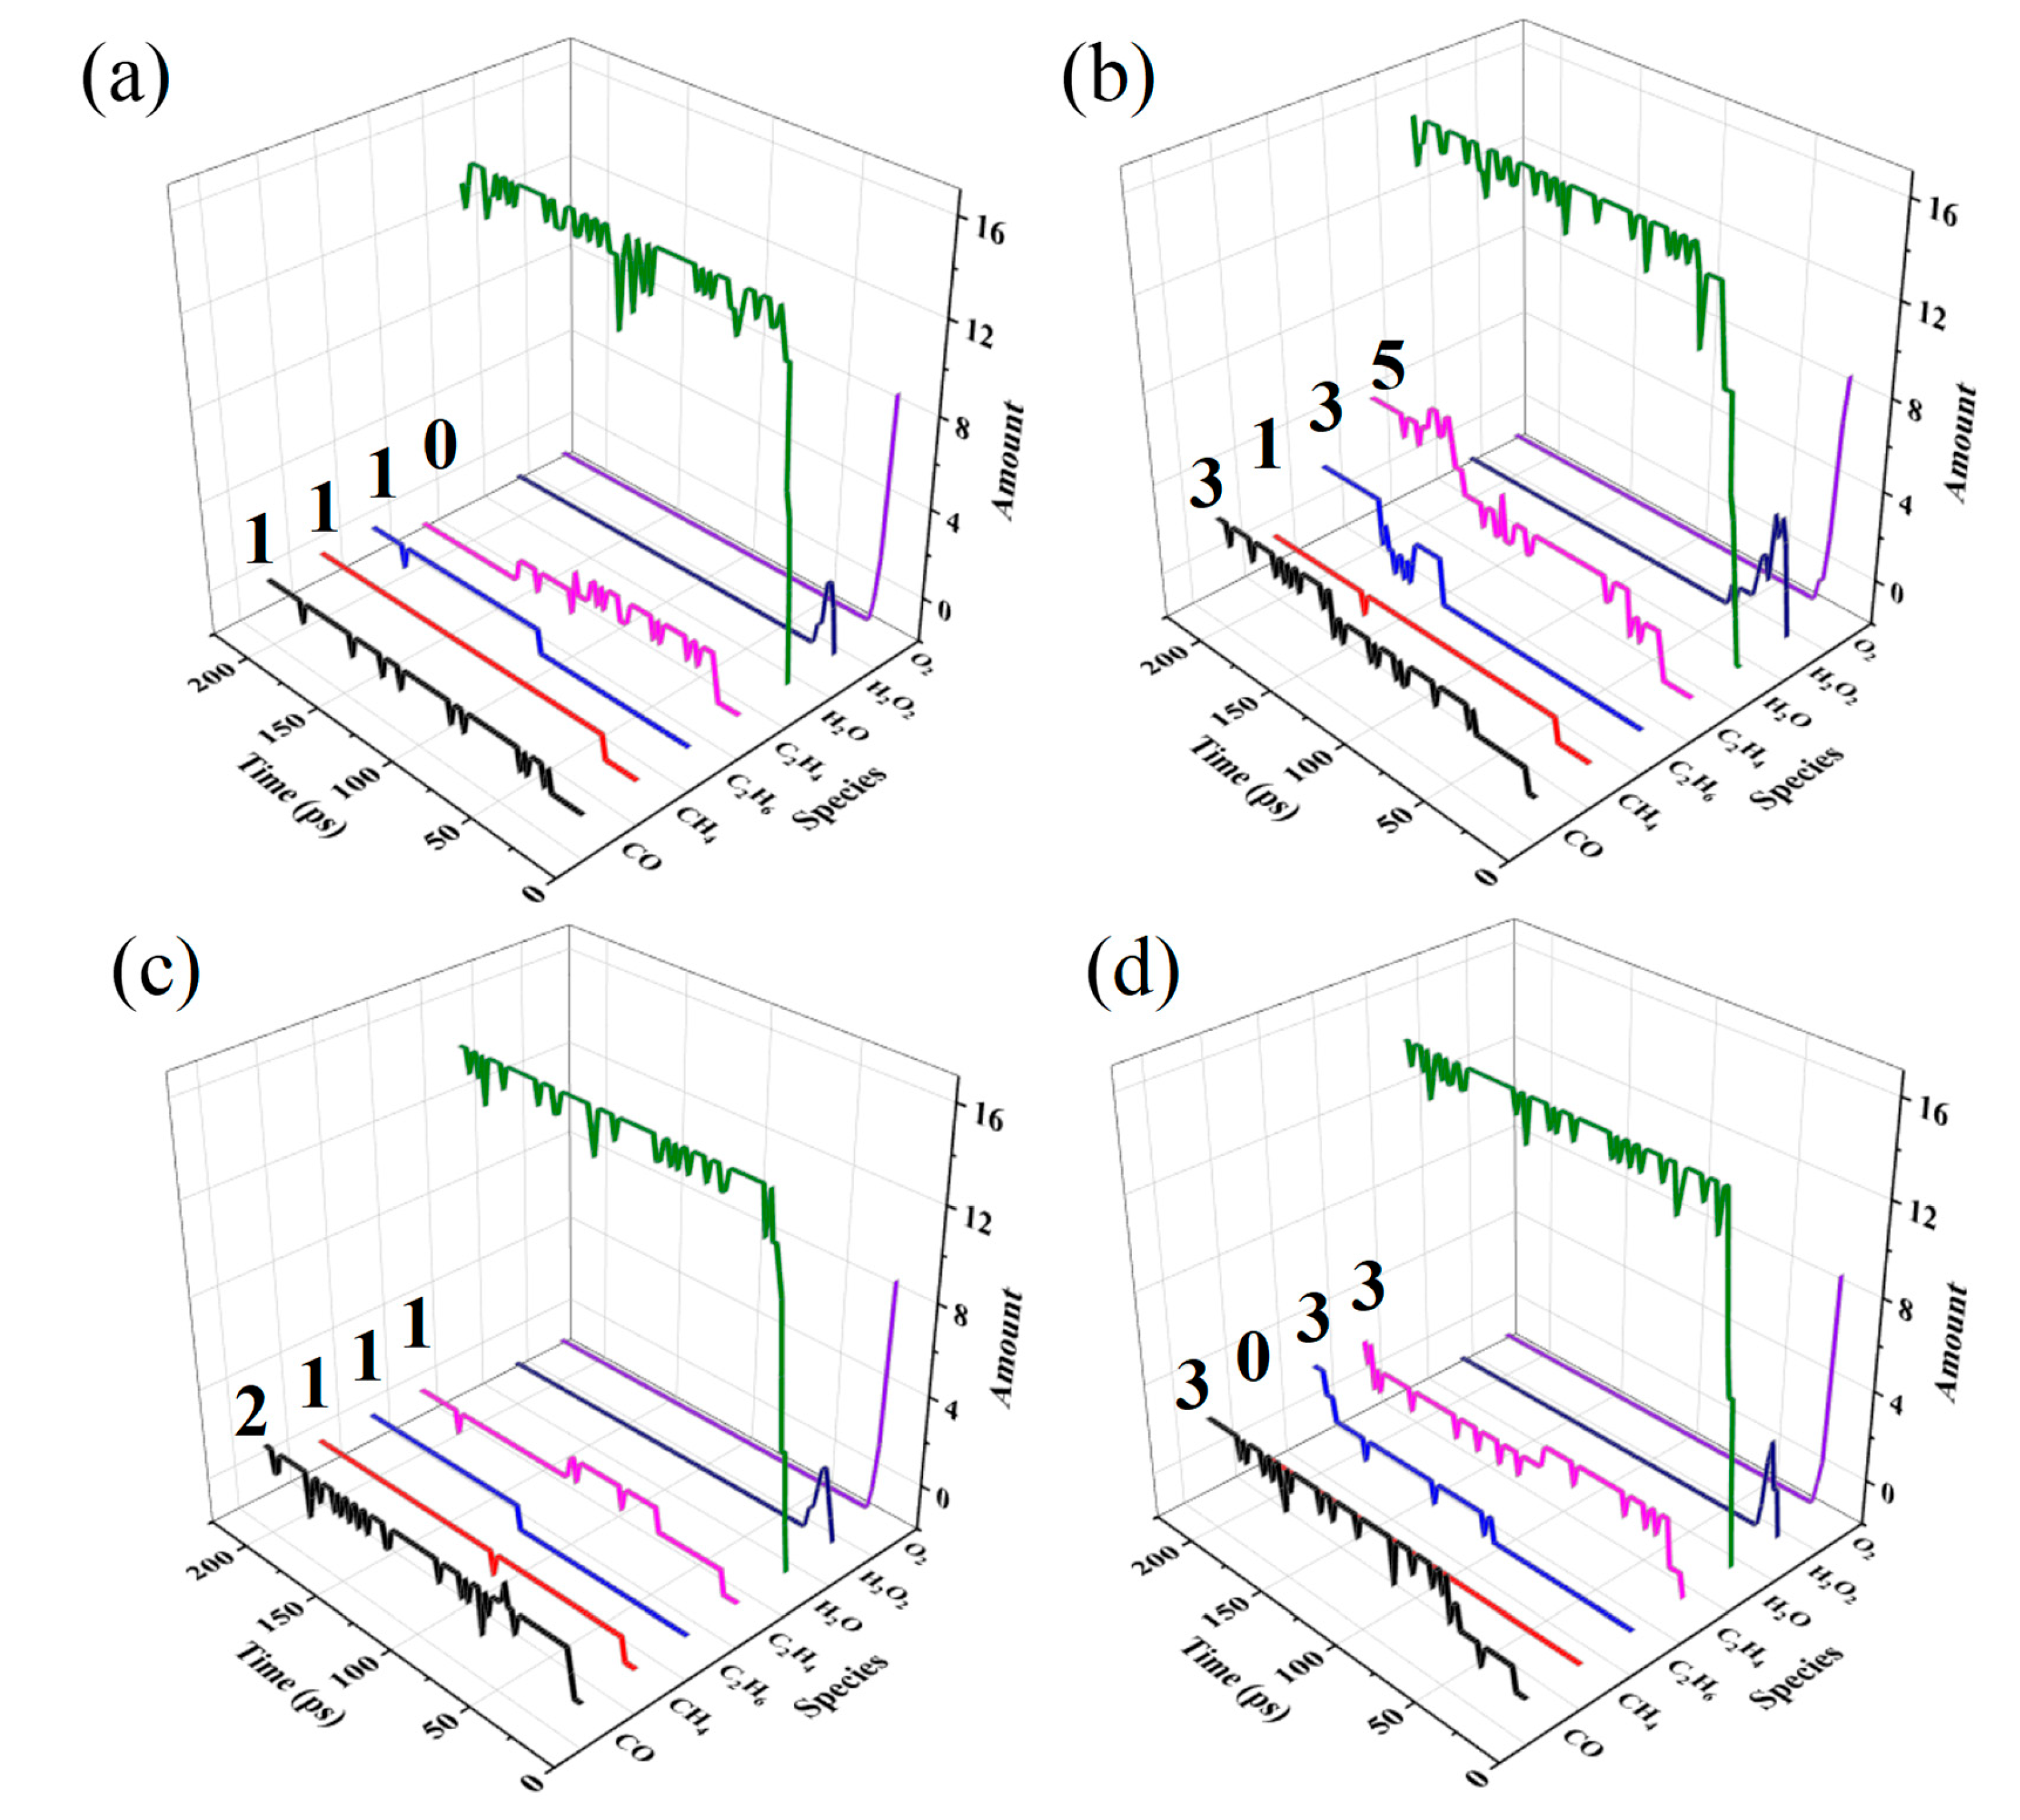
3.1. Distribution of Oxidation Products of Different PEs
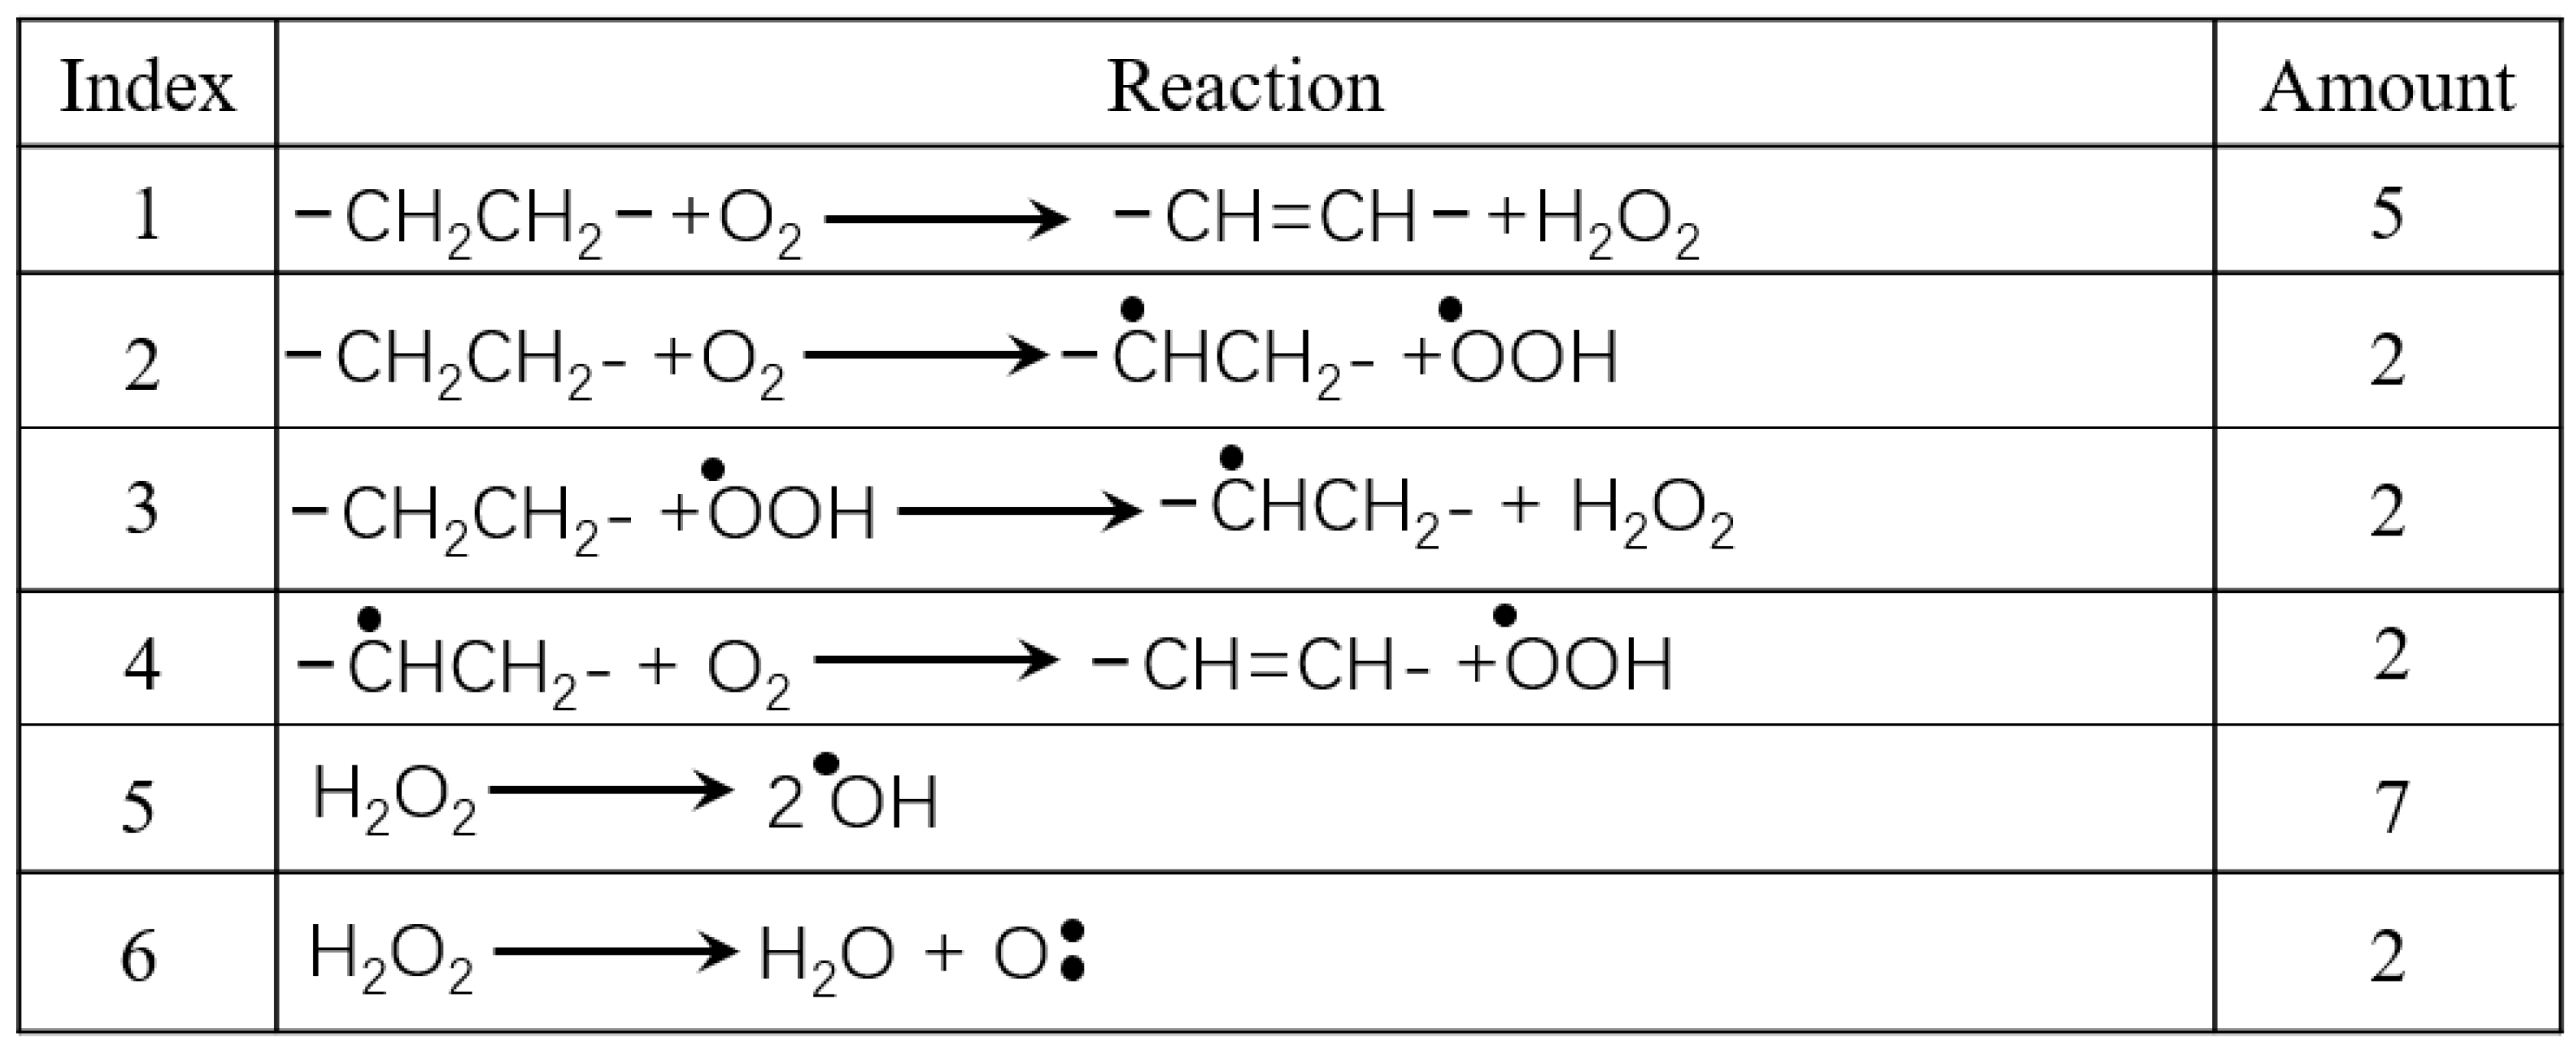
3.2. Reaction Mechanism of Thermal Oxidation of PE
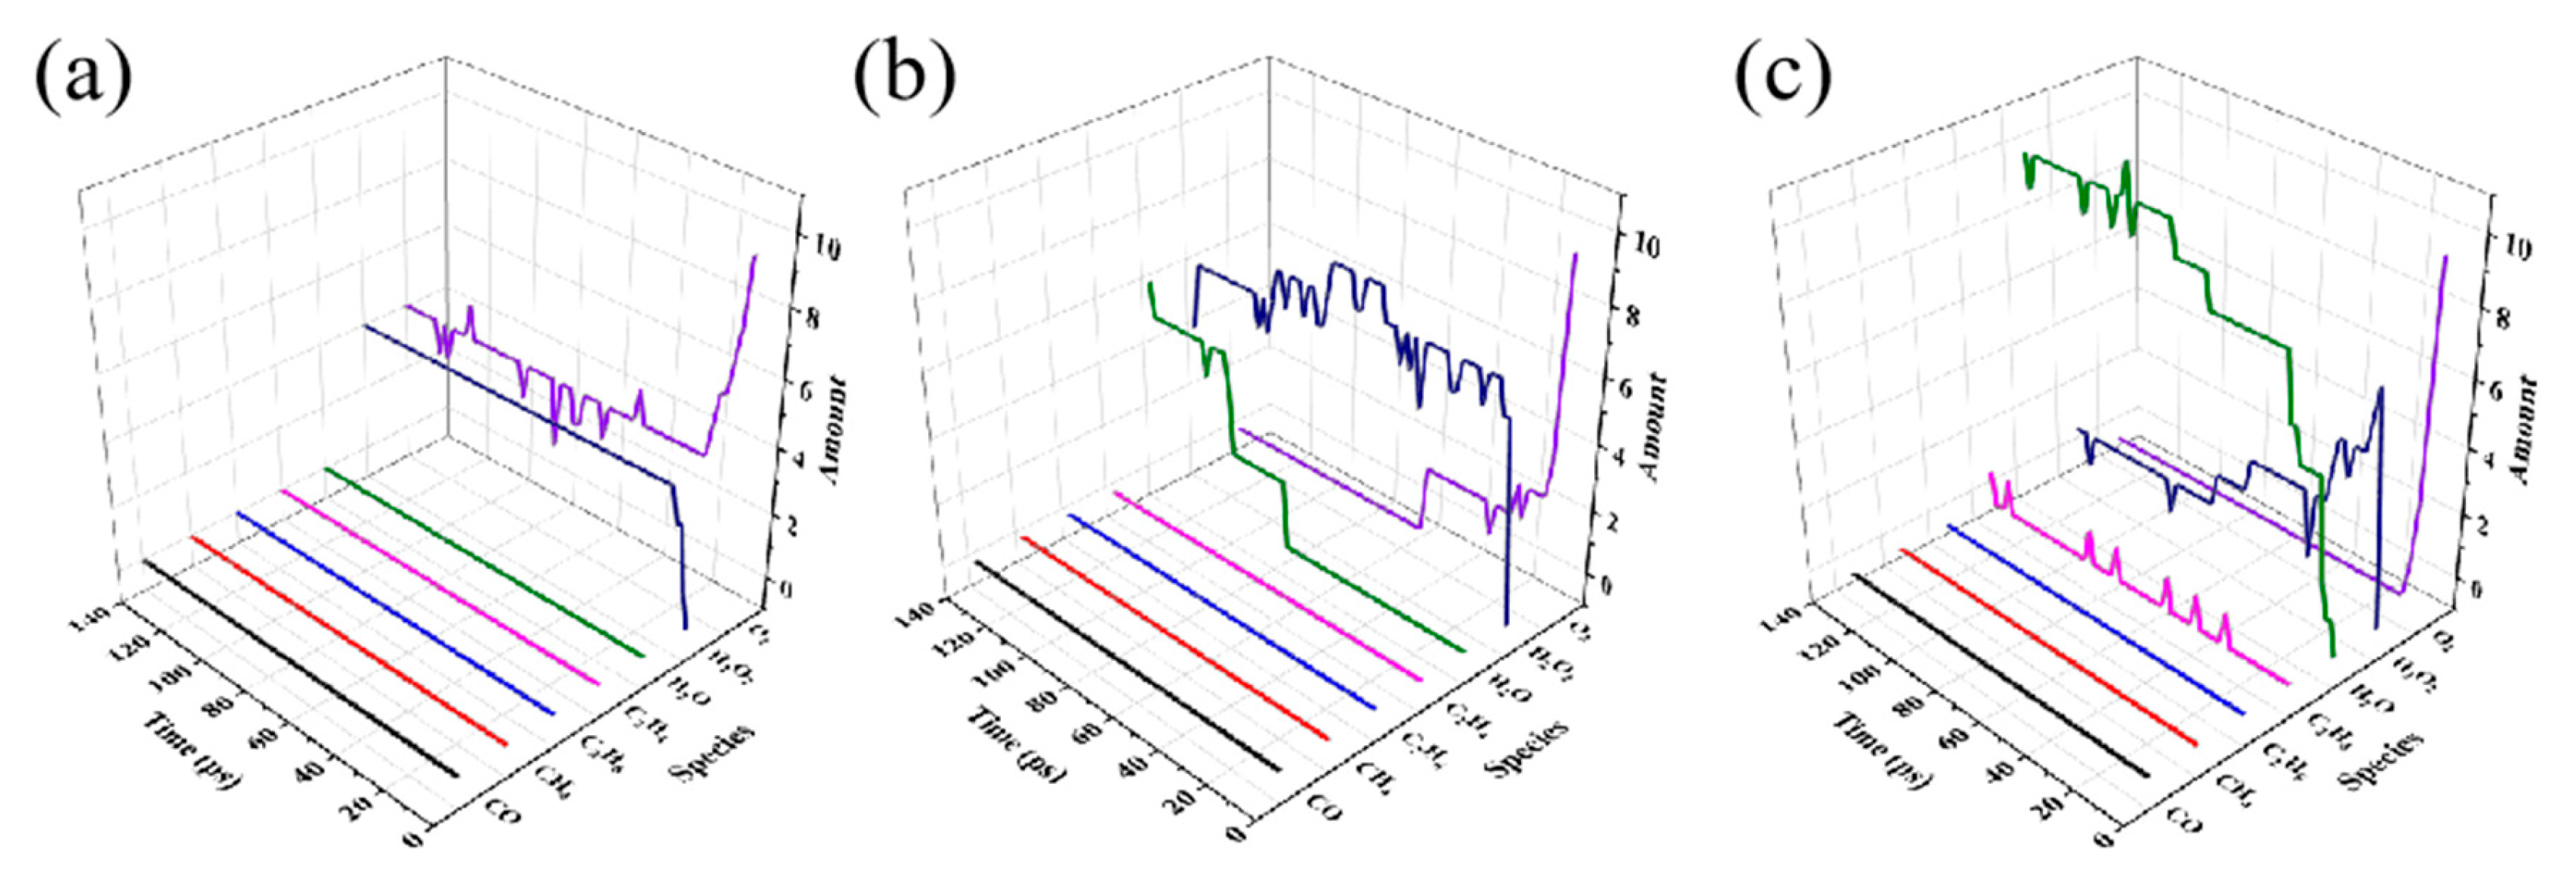
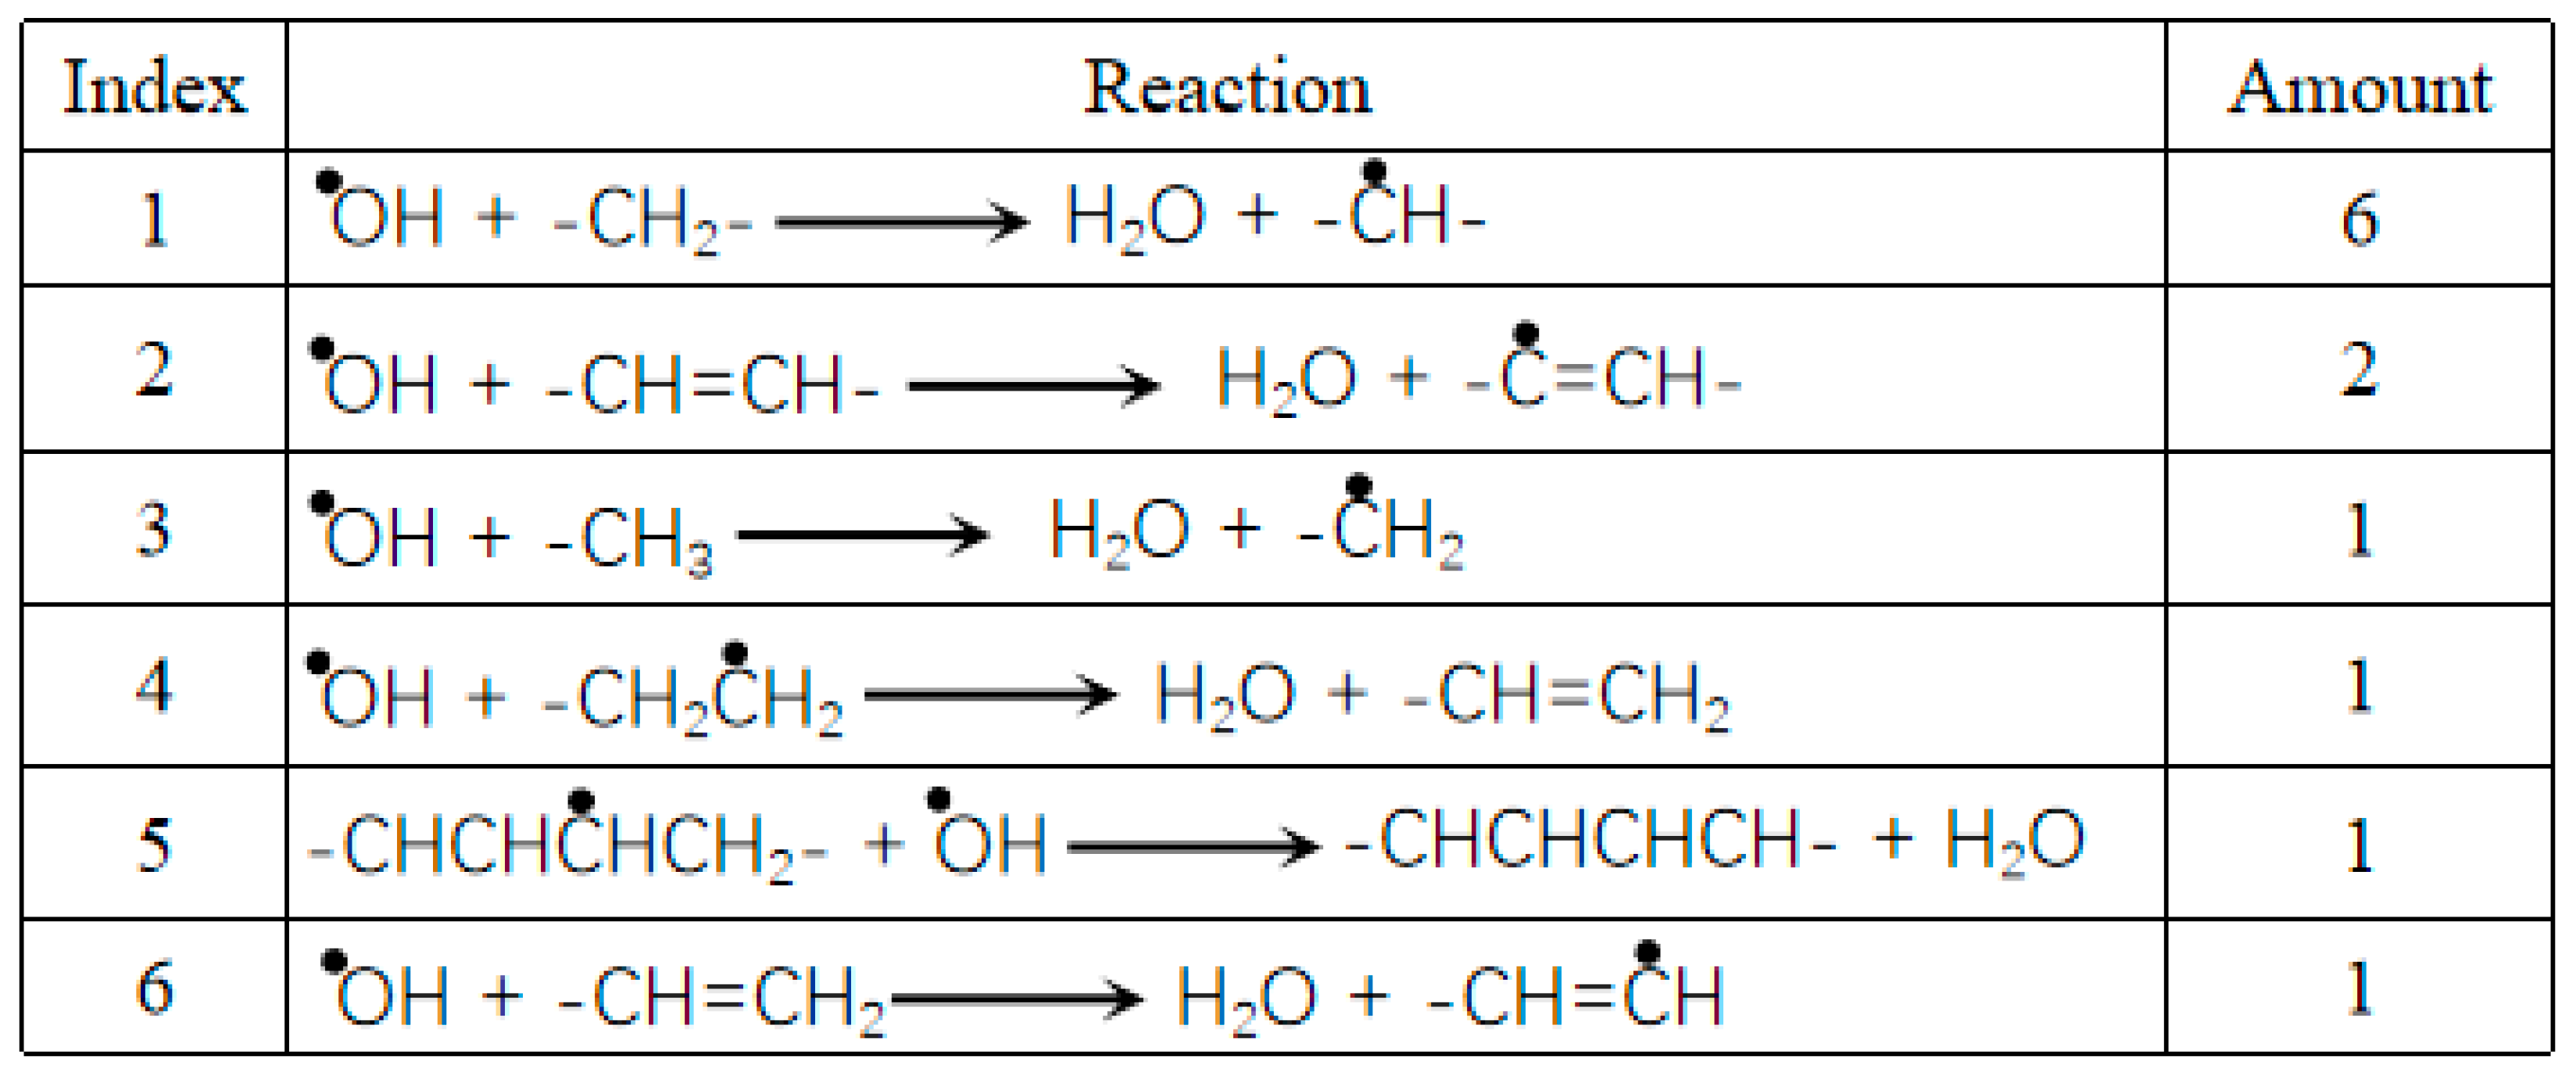
3.3. Effects of Branched Chains on PE Oxidation
4. Conclusions
Supplementary Materials
Author Contributions
Funding
Data Availability
Conflicts of Interest
References
- Al-Salem, S. M.; Chandrasekaran, S. R.; Dutta, A.; Sharma, B. K. , Study of the fuel properties of extracted oils obtained from low and linear low density polyethylene pyrolysis. Fuel 2021, 304, 121396. [Google Scholar] [CrossRef]
- Geyer, R., Chapter 2 - Production, use, and fate of synthetic polymers. In Plastic Waste and Recycling, Letcher, T. M., Ed. Academic Press: 2020; pp 13-32.
- Suresh, B.; Maruthamuthu, S.; Khare, A.; Palanisamy, N.; Muralidharan, V. S.; Ragunathan, R.; Kannan, M.; Pandiyaraj, K. N. , Influence of thermal oxidation on surface and thermo-mechanical properties of polyethylene. Journal of Polymer Research 2011, 18(6), 2175–2184. [Google Scholar] [CrossRef]
- Yang, R.; Liu, Y.; Yu, J.; Wang, K. , Thermal oxidation products and kinetics of polyethylene composites. Polymer Degradation and Stability 2006, 91(8), 1651–1657. [Google Scholar] [CrossRef]
- Jelinski, L. W.; Dumais, J. J.; Luongo, J. P.; Cholli, A. L. , Thermal oxidation and its analysis at low levels in polyethylene. Macromolecules 1984, 17(9), 1650–1655. [Google Scholar] [CrossRef]
- Cruz-Pinto, J. J. C.; Carvalho, M. E. S.; Ferreira, J. F. A. , The kinetics and mechanism of polyethylene photo-oxidation. Die Angewandte Makromolekulare Chemie 1994, 216(1), 113–133. [Google Scholar] [CrossRef]
- Chew, C. H.; Gan, L. M.; Scott, G. , Mechanism of the photo-oxidation of polyethylene. European Polymer Journal 1977, 13(5), 361–364. [Google Scholar] [CrossRef]
- Suresh, B.; Maruthamuthu, S.; Kannan, M.; Chandramohan, A. , Mechanical and surface properties of low-density polyethylene film modified by photo-oxidation. Polymer Journal 2011, 43(4), 398–406. [Google Scholar] [CrossRef]
- Bracco, P.; Costa, L.; Luda, M. P.; Billingham, N. , A review of experimental studies of the role of free-radicals in polyethylene oxidation. Polymer Degradation and Stability 2018, 155, 67–83. [Google Scholar] [CrossRef]
- O’Neill, P.; Birkinshaw, C.; Leahy, J. J.; Barklie, R. , The role of long lived free radicals in the ageing of irradiated ultra high molecular weight polyethylene. Polymer Degradation and Stability 1999, 63(1), 31–39. [Google Scholar] [CrossRef]
- Chen, T. B. Y.; Yuen, A. C. Y.; Lin, B.; Liu, L.; Lo, A. L. P.; Chan, Q. N.; Zhang, J.; Cheung, S. C. P.; Yeoh, G. H. , Characterisation of pyrolysis kinetics and detailed gas species formations of engineering polymers via reactive molecular dynamics (ReaxFF). Journal of Analytical and Applied Pyrolysis 2021, 153, 104931. [Google Scholar] [CrossRef]
- Liu, X.; Li, X.; Liu, J.; Wang, Z.; Kong, B.; Gong, X.; Yang, X.; Lin, W.; Guo, L. , Study of high density polyethylene (HDPE) pyrolysis with reactive molecular dynamics. Polymer Degradation and Stability 2014, 104, 62–70. [Google Scholar] [CrossRef]
- Oluwoye, I.; Altarawneh, M.; Gore, J.; Dlugogorski, B. Z. , Oxidation of crystalline polyethylene. Combustion and Flame 2015, 162(10), 3681–3690. [Google Scholar] [CrossRef]
- Hawkins, W. L.; Chan, M. G.; Link, G. L. Factors influencing the thermal oxidation of polyethylene. Polymer Engineering & Science 1971, 11(5), 377–380. [Google Scholar]
- Iring, M.; Földes, E.; Barabás, K.; Kelen, T.; Tüdős, F.; Ódor, L. , Thermal oxidation of Linear Low Density Polyethylene. Polymer Degradation and Stability 1986, 14(4), 319–332. [Google Scholar] [CrossRef]
- Gugumus, F. , Re-examination of the thermal oxidation reactions of polymers3. Various reactions in polyethylene and polypropylene. Polymer Degradation and Stability 2002, 77(1), 147–155. [Google Scholar] [CrossRef]
- Bravo, A.; Hotchkiss, J. H. , Identification of volatile compounds resulting from the thermal oxidation of polyethylene. Journal of Applied Polymer Science 1993, 47(10), 1741–1748. [Google Scholar] [CrossRef]
- Liao, L.; Meng, C.; Huang, C. , Thermal decomposition behaviour of polyethylene in oxygen-free and low oxygen content circumstances by reactive molecular dynamic simulation. Molecular Simulation 2018, 44(12), 954–964. [Google Scholar] [CrossRef]
- Chen, L.; Tran, H. D.; Ramprasad, R. , Atomistic mechanisms for chemical defects formation in polyethylene. The Journal of Chemical Physics 2018, 149(23), 234902. [Google Scholar] [CrossRef] [PubMed]
- Zhu, M. X.; Li, J. C.; Song, H. G.; Chen, J. M.; Zhang, H. Y. , Determination of trap energy in polyethylene with different aging status by molecular dynamics and density function theory. IEEE Transactions on Dielectrics and Electrical Insulation 2019, 26(6), 1823–1830. [Google Scholar] [CrossRef]
- Kong, J.; Zhou, K.; Ren, X.; Chen, Y.; Li, Y.; Meng, P. , Insight into gaseous product distribution of cross-linked polyethylene pyrolysis using ReaxFF MD simulation and TG-MS. Journal of Analytical and Applied Pyrolysis 2023, 169, 105847. [Google Scholar] [CrossRef]
- Woo Park, J.; Cheon Oh, S.; Pyeong Lee, H.; Taik Kim, H.; Ok Yoo, K. , A kinetic analysis of thermal degradation of polymers using a dynamic method. Polymer Degradation and Stability 2000, 67(3), 535–540. [Google Scholar] [CrossRef]
- Tsuge, K.; Enjoji, H.; Terada, H.; Ozawa, Y.; Wada, Y. , Mechanical Dispersion and Molecular Motion in Crystals of Polyethylene and Other Polymers. Japanese Journal of Applied Physics 1962, 1(5), 270. [Google Scholar] [CrossRef]
- Hori, Y.; Fukunaga, Z.; Shimada, S.; Kashiwabara, H. E.s.r. studies on oxidation processes in irradiated polyethylene: 2. Diffusion of oxygen into crystalline regions. Polymer 1979, 20(2), 181–186. [Google Scholar] [CrossRef]
- Yao, Z.; Seong, H. J.; Jang, Y.-S. , Environmental toxicity and decomposition of polyethylene. Ecotoxicology and Environmental Safety 2022, 242, 113933. [Google Scholar] [CrossRef]
- Elstner, M.; Porezag, D.; Jungnickel, G.; Elsner, J.; Haugk, M.; Frauenheim, T.; Suhai, S.; Seifert, G. , Self-consistent-charge density-functional tight-binding method for simulations of complex materials properties. Physical Review B 1998, 58(11), 7260–7268. [Google Scholar] [CrossRef]
- Prasetyo, N.; Hofer, T. S. , Adsorption and dissociation of water molecules at the α-Al2O3(0001) surface: A 2-dimensional hybrid self-consistent charge density functional based tight-binding/molecular mechanics molecular dynamics (2D SCC-DFTB/MM MD) simulation study. Computational Materials Science 2019, 164, 195–204. [Google Scholar] [CrossRef]
- Ploysongsri, N.; Vchirawongkwin, V.; Ruangpornvisuti, V. , Hydrogen boride nanotubes and their C, N, O decoration and doping derivatives as materials for hydrogen-containing gases storage and sensing: A SCC–DFTB study. Vacuum 2021, 187, 110140. [Google Scholar] [CrossRef]
- Wang, C.; Zhang, J.; Liu, R.; Guo, W. , Thermal decomposition mechanisms and stability of NTO crystal involving molecular vacancy and surface effects: DFTB-MD and DFT studies. Journal of Materials Science 2023, 58(8), 3641–3656. [Google Scholar] [CrossRef]
- Fan, W.-J.; Kang, Z.; Zhu, W.-Q.; Ding, Y.-N.; Xu, H.-Y.; Tan, D.-Z.; Chen, Y.-G. , Conjugated microporous polymers as novel adsorbent materials for VOCs capture: A computational study. Computational Materials Science 2019, 170, 109207. [Google Scholar] [CrossRef]
- Zhang, F.; Cao, Y.; Liu, X.; Xu, H.; Lu, D.; Yang, R., How Small Molecules Affect the Thermo-Oxidative Aging Mechanism of Polypropylene: A Reactive Molecular Dynamics Study. In Polymers, 2021; Vol. 13.
- Lu, X.; Wang, X.; Li, Q.; Huang, X.; Han, S.; Wang, G. , A ReaxFF-based molecular dynamics study of the pyrolysis mechanism of polyimide. Polymer Degradation and Stability 2015, 114, 72–80. [Google Scholar] [CrossRef]
- Bhoi, S.; Banerjee, T.; Mohanty, K. , Insights on the combustion and pyrolysis behavior of three different ranks of coals using reactive molecular dynamics simulation. RSC Advances 2016, 6(4), 2559–2570. [Google Scholar] [CrossRef]
- Zhao, T.; Li, T.; Xin, Z.; Zou, L.; Zhang, L., A ReaxFF-Based Molecular Dynamics Simulation of the Pyrolysis Mechanism for Polycarbonate. Energy & Fuels 2018, 32, (2), 2156-2162.
- Wang, Q.-D.; Wang, J.-B.; Li, J.-Q.; Tan, N.-X.; Li, X.-Y. , Reactive molecular dynamics simulation and chemical kinetic modeling of pyrolysis and combustion of n-dodecane. Combustion and Flame 2011, 158(2), 217–226. [Google Scholar] [CrossRef]
- Fang, Y.-H.; Liu, Z.-P. , Mechanism and Tafel Lines of Electro-Oxidation of Water to Oxygen on RuO2(110). Journal of the American Chemical Society 2010, 132(51), 18214–18222. [Google Scholar] [CrossRef] [PubMed]
- Wang, Y.; Easteal, A. J.; Chen, X. D. , Ethylene and oxygen permeability through polyethylene packaging films. Packaging Technology and Science 1998, 11(4), 169–178. [Google Scholar] [CrossRef]
- Singh, A. , Irradiation of polyethylene: Some aspects of crosslinking and oxidative degradation. Radiation Physics and Chemistry 1999, 56(4), 375–380. [Google Scholar] [CrossRef]
- He, X.-c.; Chen, D.-z. , ReaxFF MD study on the early stage co-pyrolysis of mixed PE/PP/PS plastic waste. Journal of Fuel Chemistry and Technology 2022, 50(3), 346–356. [Google Scholar] [CrossRef]
- Qu, Y.; Bian, X.; Zhou, Z.; Gao, H. , Existence of hydroperoxy and hydrogen peroxide radical complex (HO2·H2O2). Chemical Physics Letters 2002, 366(3), 260–266. [Google Scholar] [CrossRef]
- Meng, X.; Jin, G.; Yang, R. , A quantum chemical and molecular dynamics simulation study on photo-oxidative aging of polyethylene: Mechanism and differences between crystalline and amorphous phases. Polymer Degradation and Stability 2023, 217, 110536. [Google Scholar] [CrossRef]



 |
 |
Disclaimer/Publisher’s Note: The statements, opinions and data contained in all publications are solely those of the individual author(s) and contributor(s) and not of MDPI and/or the editor(s). MDPI and/or the editor(s) disclaim responsibility for any injury to people or property resulting from any ideas, methods, instructions or products referred to in the content. |
© 2024 by the authors. Licensee MDPI, Basel, Switzerland. This article is an open access article distributed under the terms and conditions of the Creative Commons Attribution (CC BY) license (http://creativecommons.org/licenses/by/4.0/).


