1. Introduction
The assessment of the dynamic load absorption capacity of ground support has been the subject of intensive research during the last two decades. In particular, laboratory and in situ drop tests have been developed to investigate the energy absorption capacity of support elements [
4,
19,
30,
34]. Despite comments about the representativeness of dynamic tests of dynamic events in situ [
8,
9,
19,
20,
44], the use of laboratory test results has become a useful design tool. Furthermore, laboratory tests can analyze and compare the performance of different types of support elements and provide information about behavior under dynamic load. However, for practical reasons, most dynamic tests imply a high investment in terms of economic resources, personnel, and preparation time. Therefore, numerical modeling may serve as a more robust support element design tool and provide useful preliminary information or feedback before more costly laboratory tests are undertaken.
Various numerical models have been developed to capture the mechanical processes that dominate the deformation or failure of support systems/elements. However, when tested under different loading conditions, it has been difficult to determine the exact response mechanism of all the element components, even more so when they are tested in the laboratory. This is mainly due to a) the presence of several different materials (bolt, grout or resin, confining medium) with radically different stiffness and mechanical behavior, b) the three-dimensional appearance of the system that is difficult to simulate, i.e., bolt type and geometry, c) loading conditions and d) the way in which the test equipment applies the load.
Some of the most popular commercially available codes, such as FLAC2D, FLAC3D, UDEC and 3DEC can be used to simulate the mechanical response of different components of a support system. With these software tools, it is possible to model the response of two distinct reinforcing elements: the cable and the rockbolt; the main difference between the two approaches is that flexural strength is not included in the cable element simulation but in some cases is used for simulating reinforcing elements such as fully grouted rockbolts. The numerical methods that are used to solve the response of reinforcement elements and in most cases the response of the rockmass to loading and unloading include the finite element method (FEM), border element method (BEM), finite difference method (FDM), and discrete element method (DEM).
Several studies have been conducted on the behavior of bolts in different loading scenarios. Jalalifar and Aziz [
15] did an exhaustive review of the existing finite element (FE) models that simulate bolt, grout, rock and two interfaces under axial and lateral loading, verifying the models results and analyzing the stress and strains developed in the bolt and surrounding materials. Simulations of laboratory tests of support systems/elements were made by Ferrero [
10] using a three-dimensional (3D) FE model to represent a shear test of rock discontinuities reinforced by steel segments. He also performed a back analysis of the elements to define the evolution of the stress, assuming perfectly plastic elastic behavior for both rock and steel. Graselli [
12] subsequently used a 3D FE code to simulate rebar and Swellex rockbolt shear testing. He assumed an elastic material model to simulate the bolts and a perfectly plastic model for an interface that represents the joint that separates the two blocks. This simulation provided some insight into bolt failure mechanisms under shear loading conditions. Aziz and Jalalifar [
2] also proposed a 3D FE code to simulate the laboratory tests performed on rock joints traversed by bolts subjected to shear load. They investigated the yield stress and the variation in the deformation of the bolt at the intersection of joint/rockbolt. The steel was simulated using a bilinear hardening model.
Finite differences (FD) code was used by Chen and Li [
5] to simulate laboratory tests performed on rebar and D-Bolts by varying the anchor displacement angles. They used a trilinear material model to capture the hardenable behavior of steel. They also used different models to represent the grout-rock and grout-bolt interfaces to explicitly simulate the different adhesion mechanisms. In the case of the rebar bolt, the adhesion between the steel and the rock was defined by the high shear strength at the bolt-grout interface. In the simulation of the D-Bolt, the bolt cohesion was defined by the shear resistance, assumed as equal in two anchor positions and between them, equal to zero. Using this model, it was possible to realistically simulate the response of the D-Bolt and rebar in terms of load and displacement under conditions of pure shear load, pure traction, and combined load.
Zhang et al. [
46] proposed a DEM model in 3D that investigated the micro and macro behavior at the grout bolt interface, considering the effects of the bolt profile and particle size. Results were validated with measurements carried out in the laboratory. This model, however, only considered shear static loading but not the type of grout used.
Marambio et al. [
26], Ma et al. [
22], Nemcik et al. [
28] and Vallejos et al. [
42] have all reported the use of the rockbolt structural element for the simulation of completely grouted bolts subjected to tension. However, Nemcik et al. [
28] ignored the forces perpendicular to the rockbolt element and subsequently its flexural strength since they were only dealing with tensile load. In their analysis, the rockbolt behaved similarly to the cable element. Ma et al. [
22] used the rockbolt element to simulate laboratory pull tests to determine the interaction between the bolt and the rock mass in a road tunnel; however, this was done in FLAC2D. Vallejos et al. [
42] used a numerical model based on FDM to simulate laboratory dynamic tests on reinforcing elements. In their model the behavior of the threadbar bolt was represented when tested under direct impact load similar to that of the CanMet Mining and Mineral Sciences Laboratories (CanMet-MMSL) test. Although the results obtained were consistent in terms of load-deformation compared with laboratory results, the bolt was modeled as a rockbolt structural element, and in addition, the response of the grout and the interfaces that made up the test were not explicitly modeled.
A review of the technical literature suggests that simulations more often use discretized cable structural elements rather than rockbolt elements probably because modelling with cable type elements is much easier than with rockbolt reinforcements. This is mainly due to the complexity of the rockbolt element itself in terms of input parameters and the calibration process. For example, various authors [
11,
16,
19,
24,
40,
43] have implemented the cable element for the simulation of pull tests or excavation support, even where cables were not used as the actual reinforcement. Ruest and Martin [
39] used the cable element in FLAC2D for the laboratory pull test simulation of instrumented cables and grouts inside steel tubes. The loads calculated along the cable element were compared with the loads measured for several tests where the grout properties were varied. The results showed very good agreement with those of laboratory tests.
In effect, there are a variety of models that have been used to evaluate the support systems used in mine design. However, as mentioned, because of the complexity of individual elements involved in rockbolts, mine designers often choose to simulate cable elements rather than rockbolts even when the actual design will incorporate rockbolts. In an effort to improve on the existing models, some of which have been developed in 2D, have used cable structural elements to represent rockbolts and/or have not identified the effect of all the elements including grout and confinement medium properties on the model results, a new numerical model of dynamic testing is proposed here. This model that functions as a simulation tool was designed to distinguish the individual elements of which a bolt is composed and propose constitutive equations that describe the response of each of these elements and their interactions. Then, these numerous equations can be solved together using a computational application. The results of this procedure include the distribution of stress on the elements that make up the model and the displacement pattern of the fortification system within a structure. Ultimately, the aim of the model is to more accurately assess the dynamic load absorption capacity of rockbolt ground support as a fortification design element.
2. Numerical Modeling of the Dynamic Response of the Threadbar
2.1. Problem Assessment
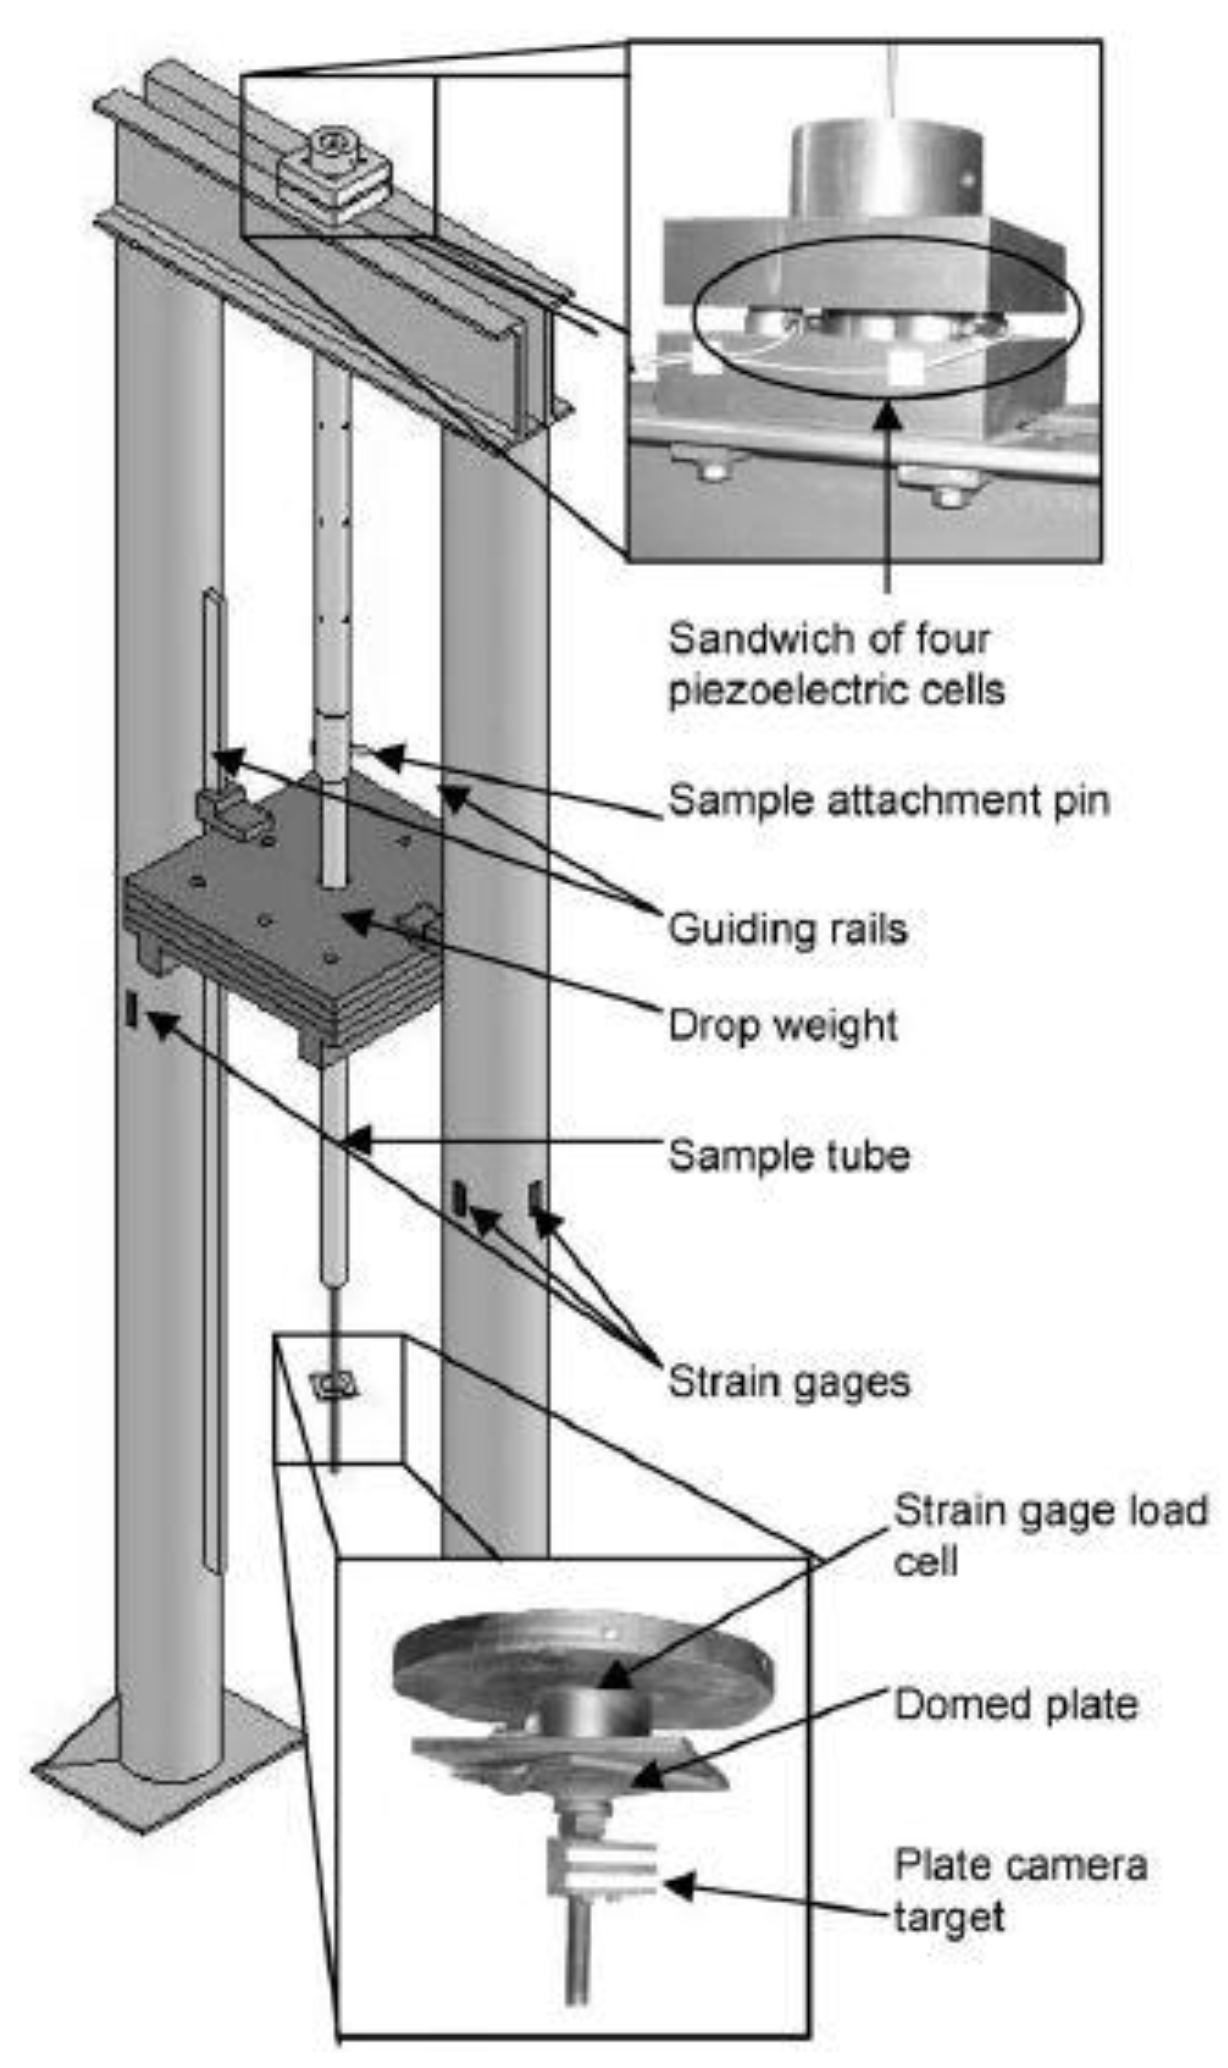
There are currently two active facilities that test rock bolts under dynamic load: the WASM and CanMet-MMSL. The New Concept Mining team has also developed the new Dynamic Impact Tester (DIT) to study the behavior of reinforcement and support elements under dynamic loads [
6]; however, the results are recent and were not available at the time the model described here was calibrated. Therefore, the operation of the DIT equipment was not studied. In recent years, the University of Chile and MIRARCO developed a new facility, which uses the direct impact method similar to that of CanMet-MMSL. The test configuration and the test procedure of the direct impact load test of CanMet-MMSL are presented in
Figure 1 and
Figure 2.
The numerical model described in the following sections represents the operating mechanism of the Chilean facility in hopes that it could serve as a complement for the tests to be carried out in the near future. This mechanism was selected considering that some authors have questioned the effect of the other modes of dynamic loading on rock reinforcement elements [
8,
9,
18,
42]. The threadbar was selected (known also as rebar or gewibar) as the reinforcement element to be modeled due to its wide use and range of success in Chilean underground mining along with the necessity to improve this element given its possible globalization.
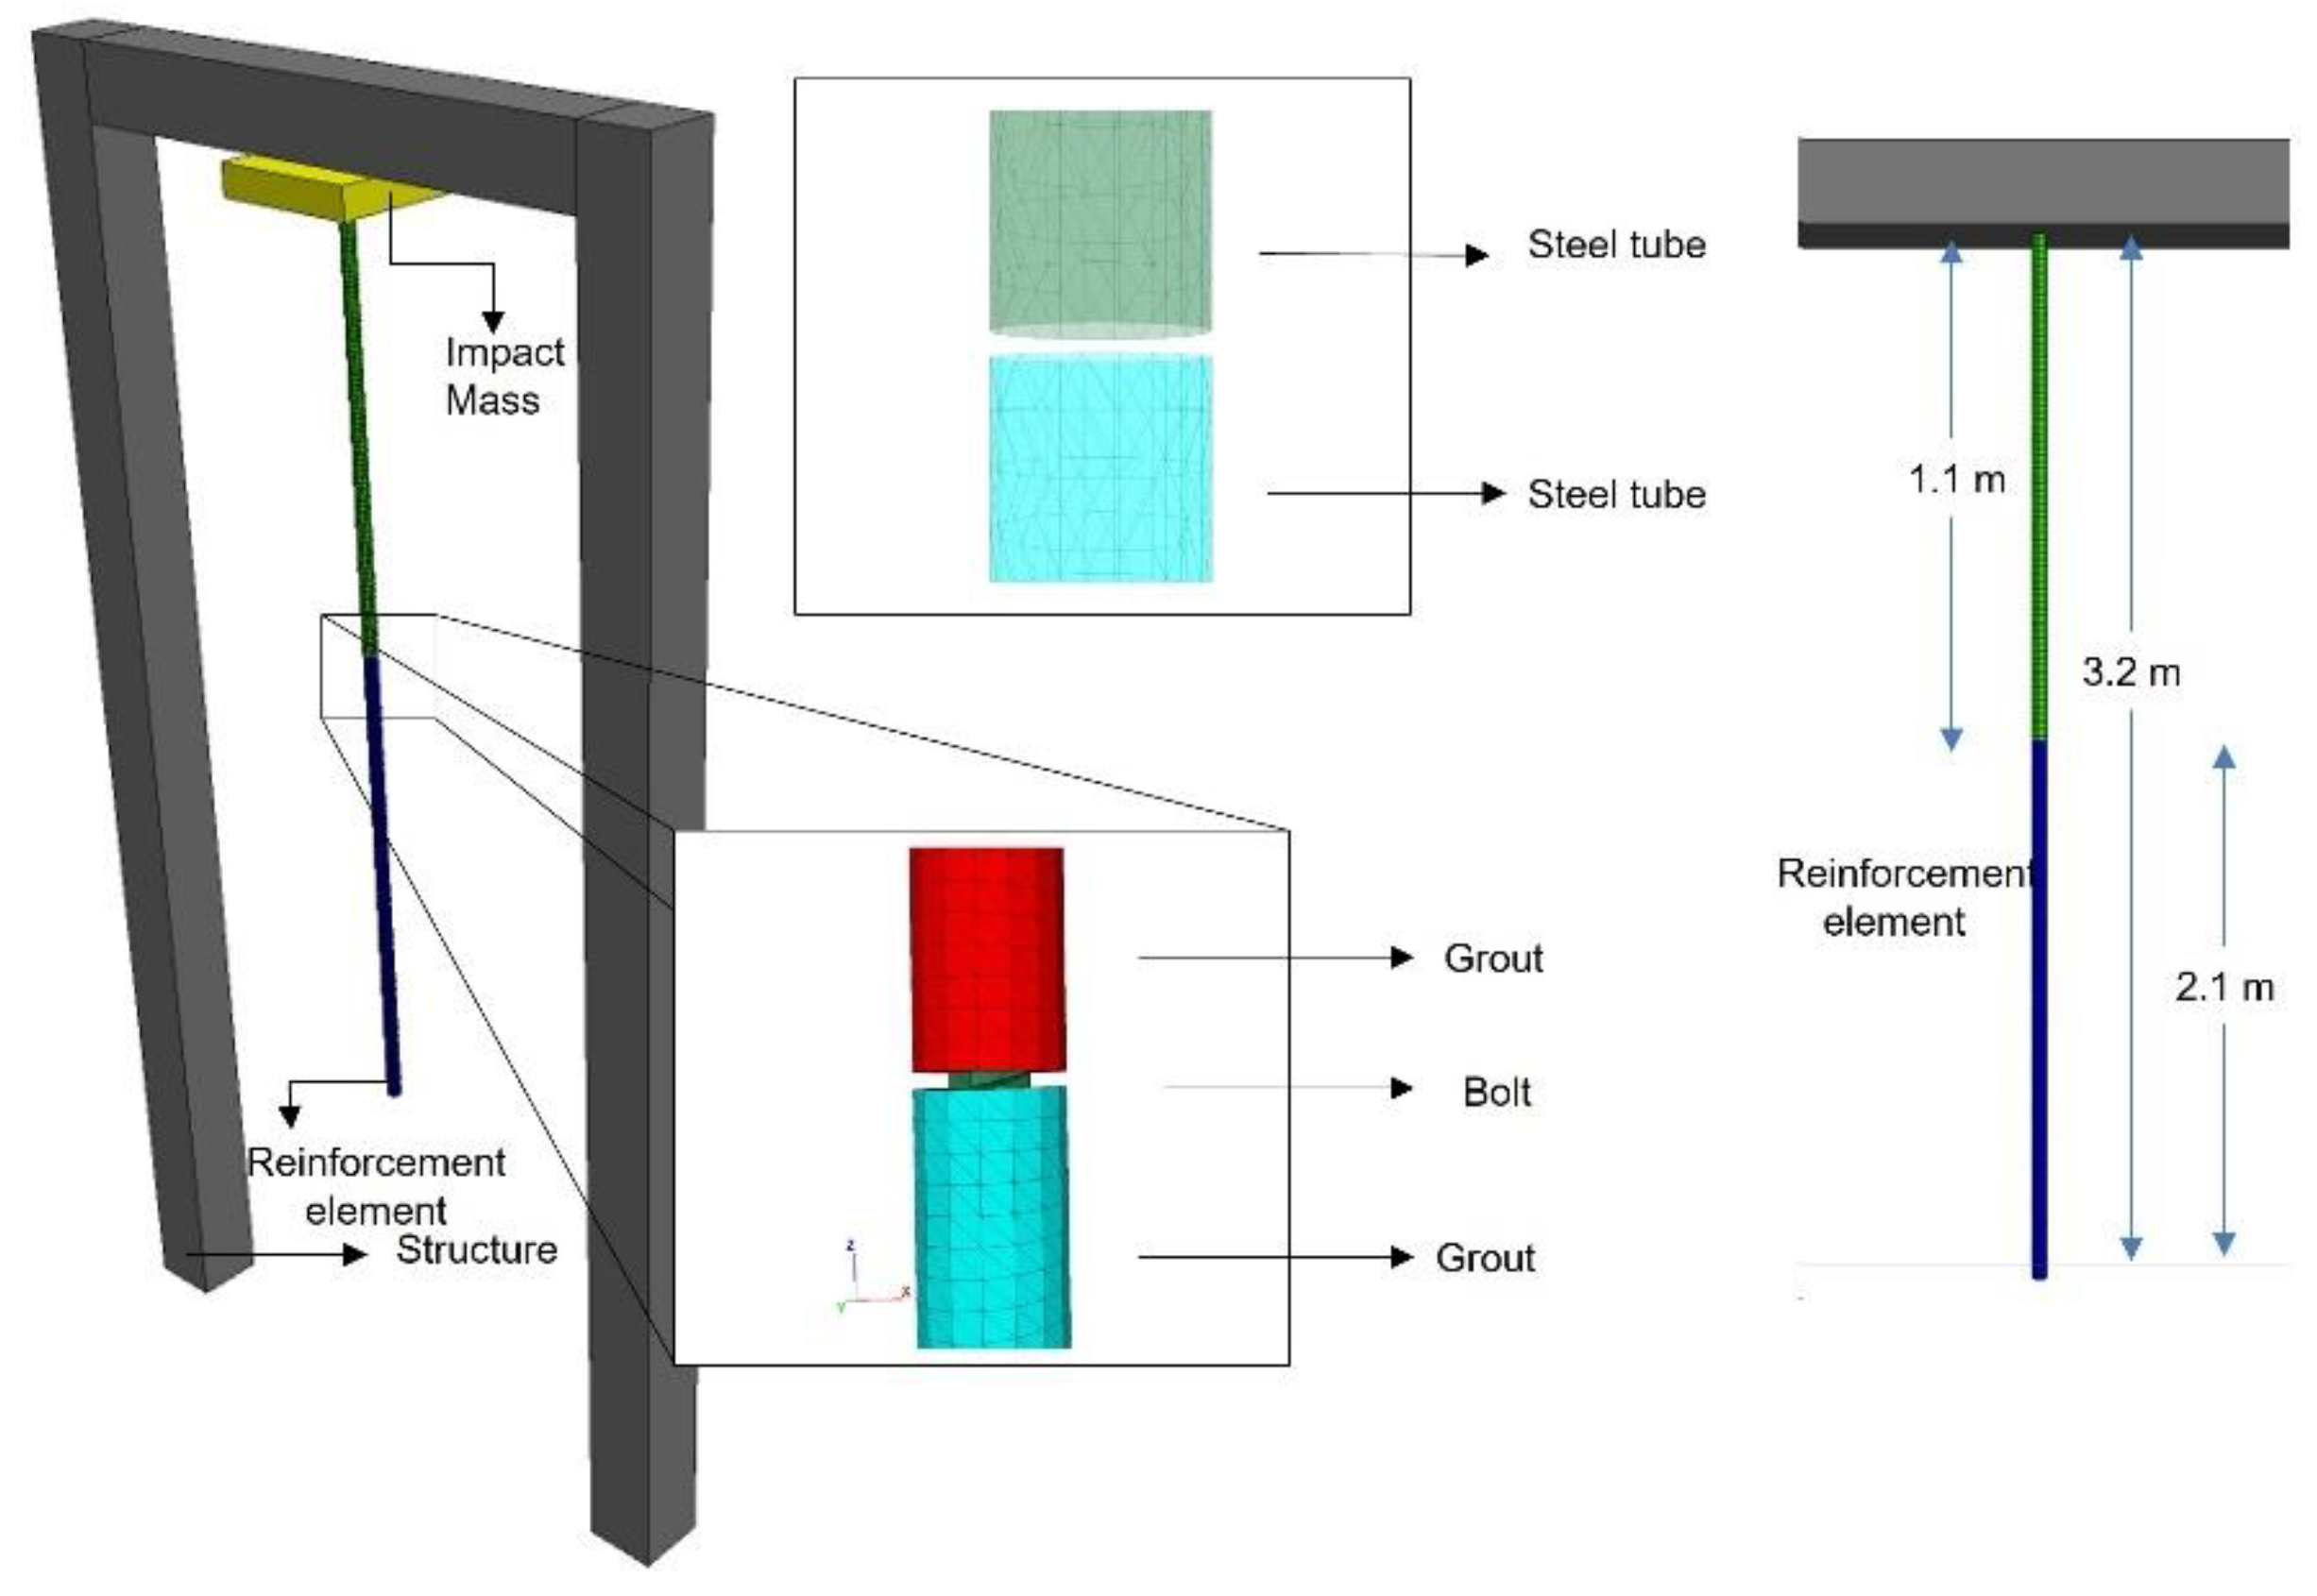
The numerical model is composed of four main elements: the test facility structure, rock bolt, grout and confinement medium (steel tube). Three different geometries of FLAC3D meshes were created for the first three components. Various sizes of mesh for the geometries implemented in the numerical model were tested and the best fit in terms of representativeness and solution time are the ones selected for the analysis presented in the paper.
The steel tube is represented by a DKT-CST hybrid structural element (Shell element). The dimensions implemented in the model are the same as those reported in the available information for threadbar tests [
33,
34]. The model configuration is shown in
Figure 3.
2.2. Properties and Mechanical Response of Model Components
Below are the equations and properties that allow modeling the dynamic response of the elements that make up the tested system. In the case of steel and grout, empirical equations were implemented because in the cases where the elements physical characteristics are different from those presented in the calibration model it can be easily established and replaced in the numerical model.
2.2.1. Rockbolt
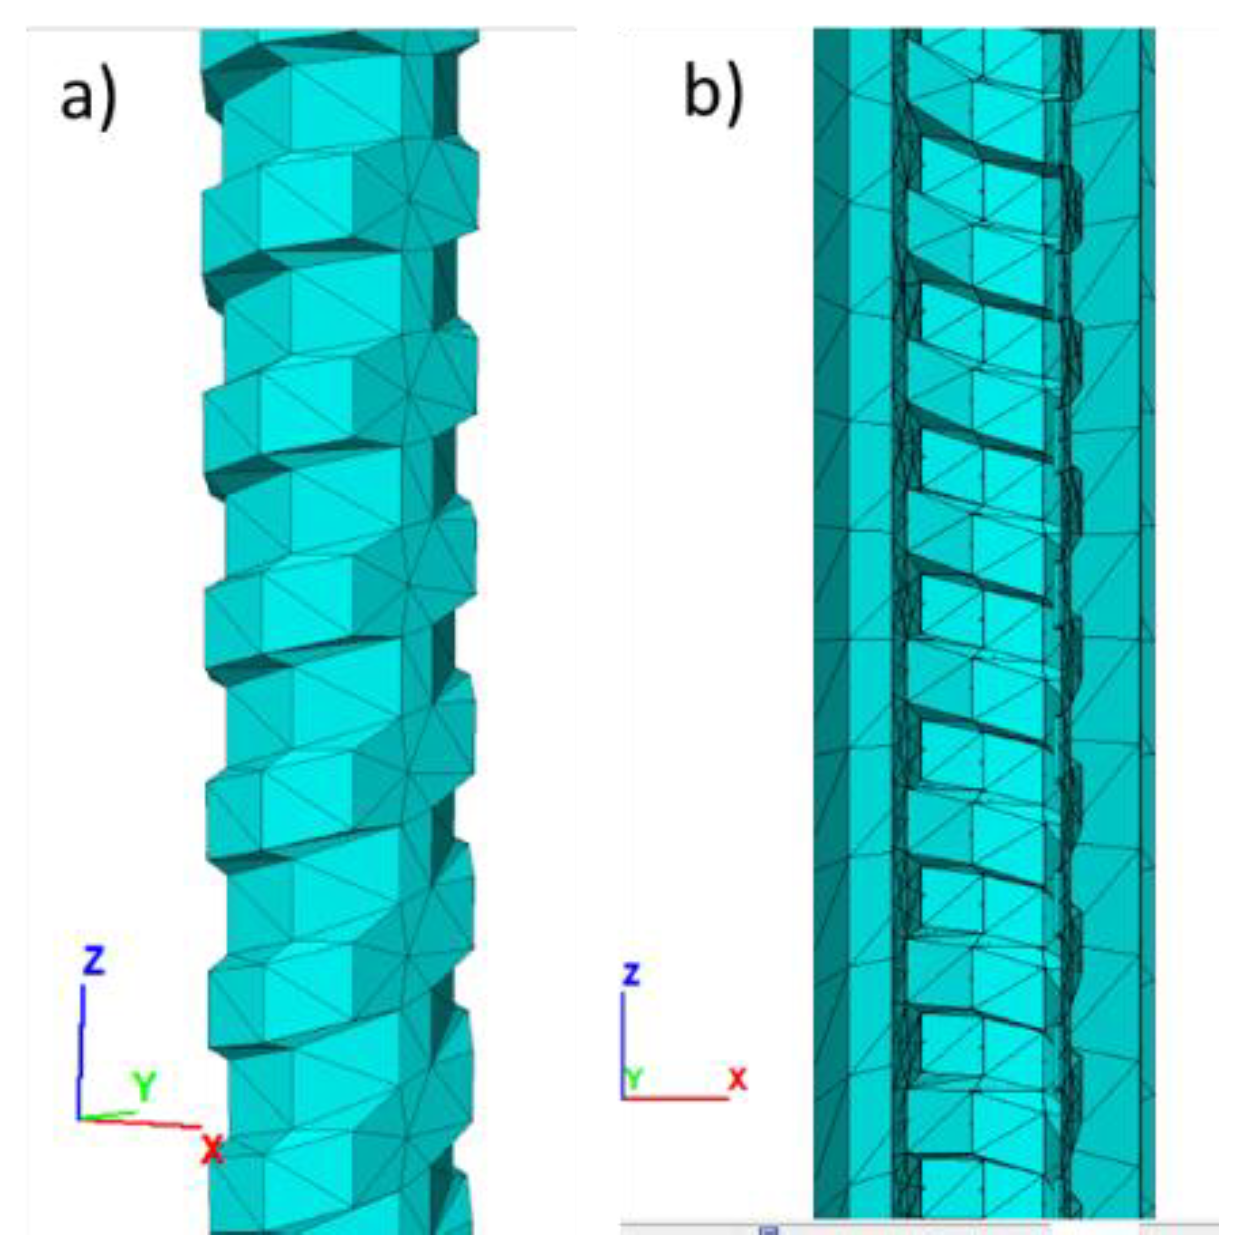
The rockbolt (
Figure 4) is represented in the model by an explicit element with the real geometry of the threadbar (22 mm nominal diameter), which responds to tension through an elastic- perfectly plastic constitutive model. The response element is controlled by bolt stiffness
and the static yield limit
of the steel.
The bolt properties under static loading are well known, and manufacturers show the properties of the steel used in their specific rock reinforcement element in their catalogues.
Table 1 presents the mechanical properties corresponding to the threadbar
However, steel is known to change its yield limit and ultimate strength under dynamic loading conditions. According to Malvar and Crawford [
26], these magnitudes can be estimated by the elastic properties of steel scaling through a dynamic increase factor (DIF), and various authors have implemented this formulation to obtain the dynamic strength properties of steel bars under different problem configurations with satisfactory results [
21,
26,
41,
42].
DIF depends on strain rate
in s
-1 (1/second) and a coefficient (α). The coefficient α is a function of σ
y (in MPa) and can be used to calculate the dynamic yield limit and dynamic ultimate strength of steel. See Equation 1
Where and are coefficients for yield limit and the ultimate strength of steel respectively.
The use of the DIF is recommended for steel bars with yield strengths varying from 290 to 710 MPa and strain rates between and 225 . Since threadbar meets the conditions mentioned above and dynamic tests have shown strain rates around 12, this formulation can be applicable to the simulation proposed in this paper.
2.2.2. Grout
A group of explicit elements that envelop the threadbar, forming a ring with a defined thickness, represent the grout in which the rockbolt is inserted in the laboratory-scale dynamic tests. Cement grout, due to its heterogeneity, presents a complex mechanical response, which requires detailed analysis and implementation in the model to obtain a precise simulation.
Cement grout exhibits the phenomenon of strain softening under compressive loads. This behavior can be modeled by using a strain-hardening/softening constitutive model. The constitutive model is controlled by variations prescribed to the properties of the Mohr-Coulomb model (cohesion, friction, dilation angle) as a function of plastic strain in the numerical model.
Non-linear strength degradation of grout is highly stress dependent, as documented by conventional triaxial test results from Hyett et al. [
13] and Xie and Shao [
46]. These results are used as primary source of the grout properties.
The confining pressure and the water:cement (w:c) ratio of the grout strongly influence the shape of the strength degradation curves as well as the value of residual strength. Strength degradation decreases with increasing confinement pressure, to the point that under high enough confinement pressure, the grout becomes nearly ductile, and no degradation occurs.
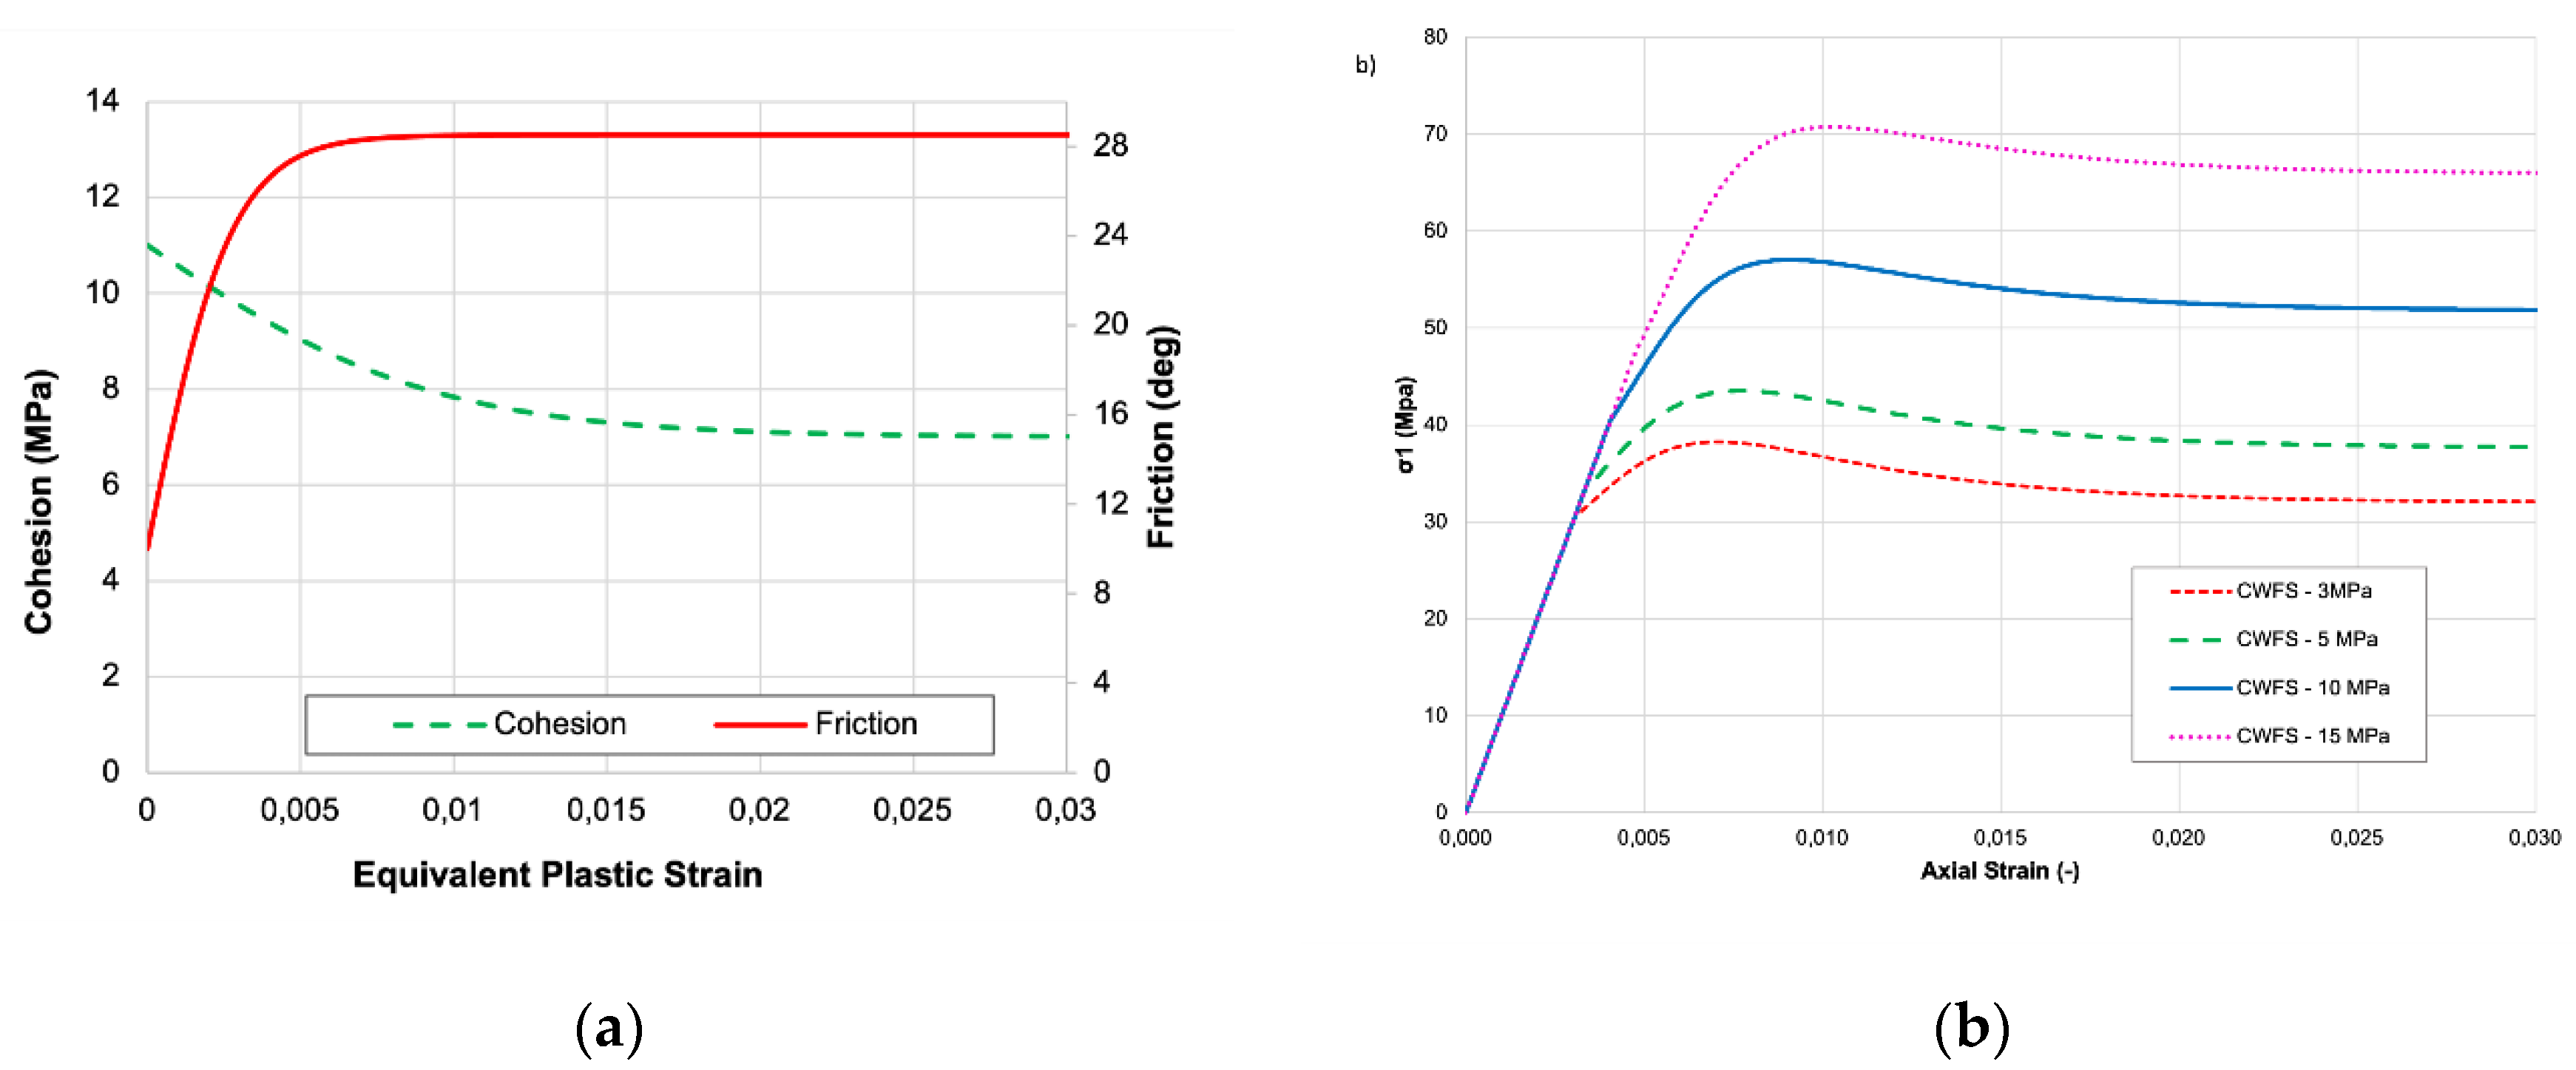
The Cohesion Weakening Friction Strengthening (CWFS) model proposed by Renani and Martin [
38] allows the variation of the degradation behavior to be defined in relation to the confining pressure. Equation 2 and Equation 3 were used to describe cohesion degradation
and friction mobilization (φ) of grout as smooth functions of plastic strain:
where
and
are initial and degraded values of cohesion,
and
are initial and mobilized values of friction angle, and
and
are plastic strains at cohesion and friction angle within 5% of their ultimate values, respectively.
Based on the information from literature [
13,
46], the estimated parameters of the CWFS model for 0.4 and 0.44 w:c ratio of the cement grout are given in
Table 2, where E and 𝜈 are the Young´s modulus and Poisson’s ratio of the cement grout, respectively.
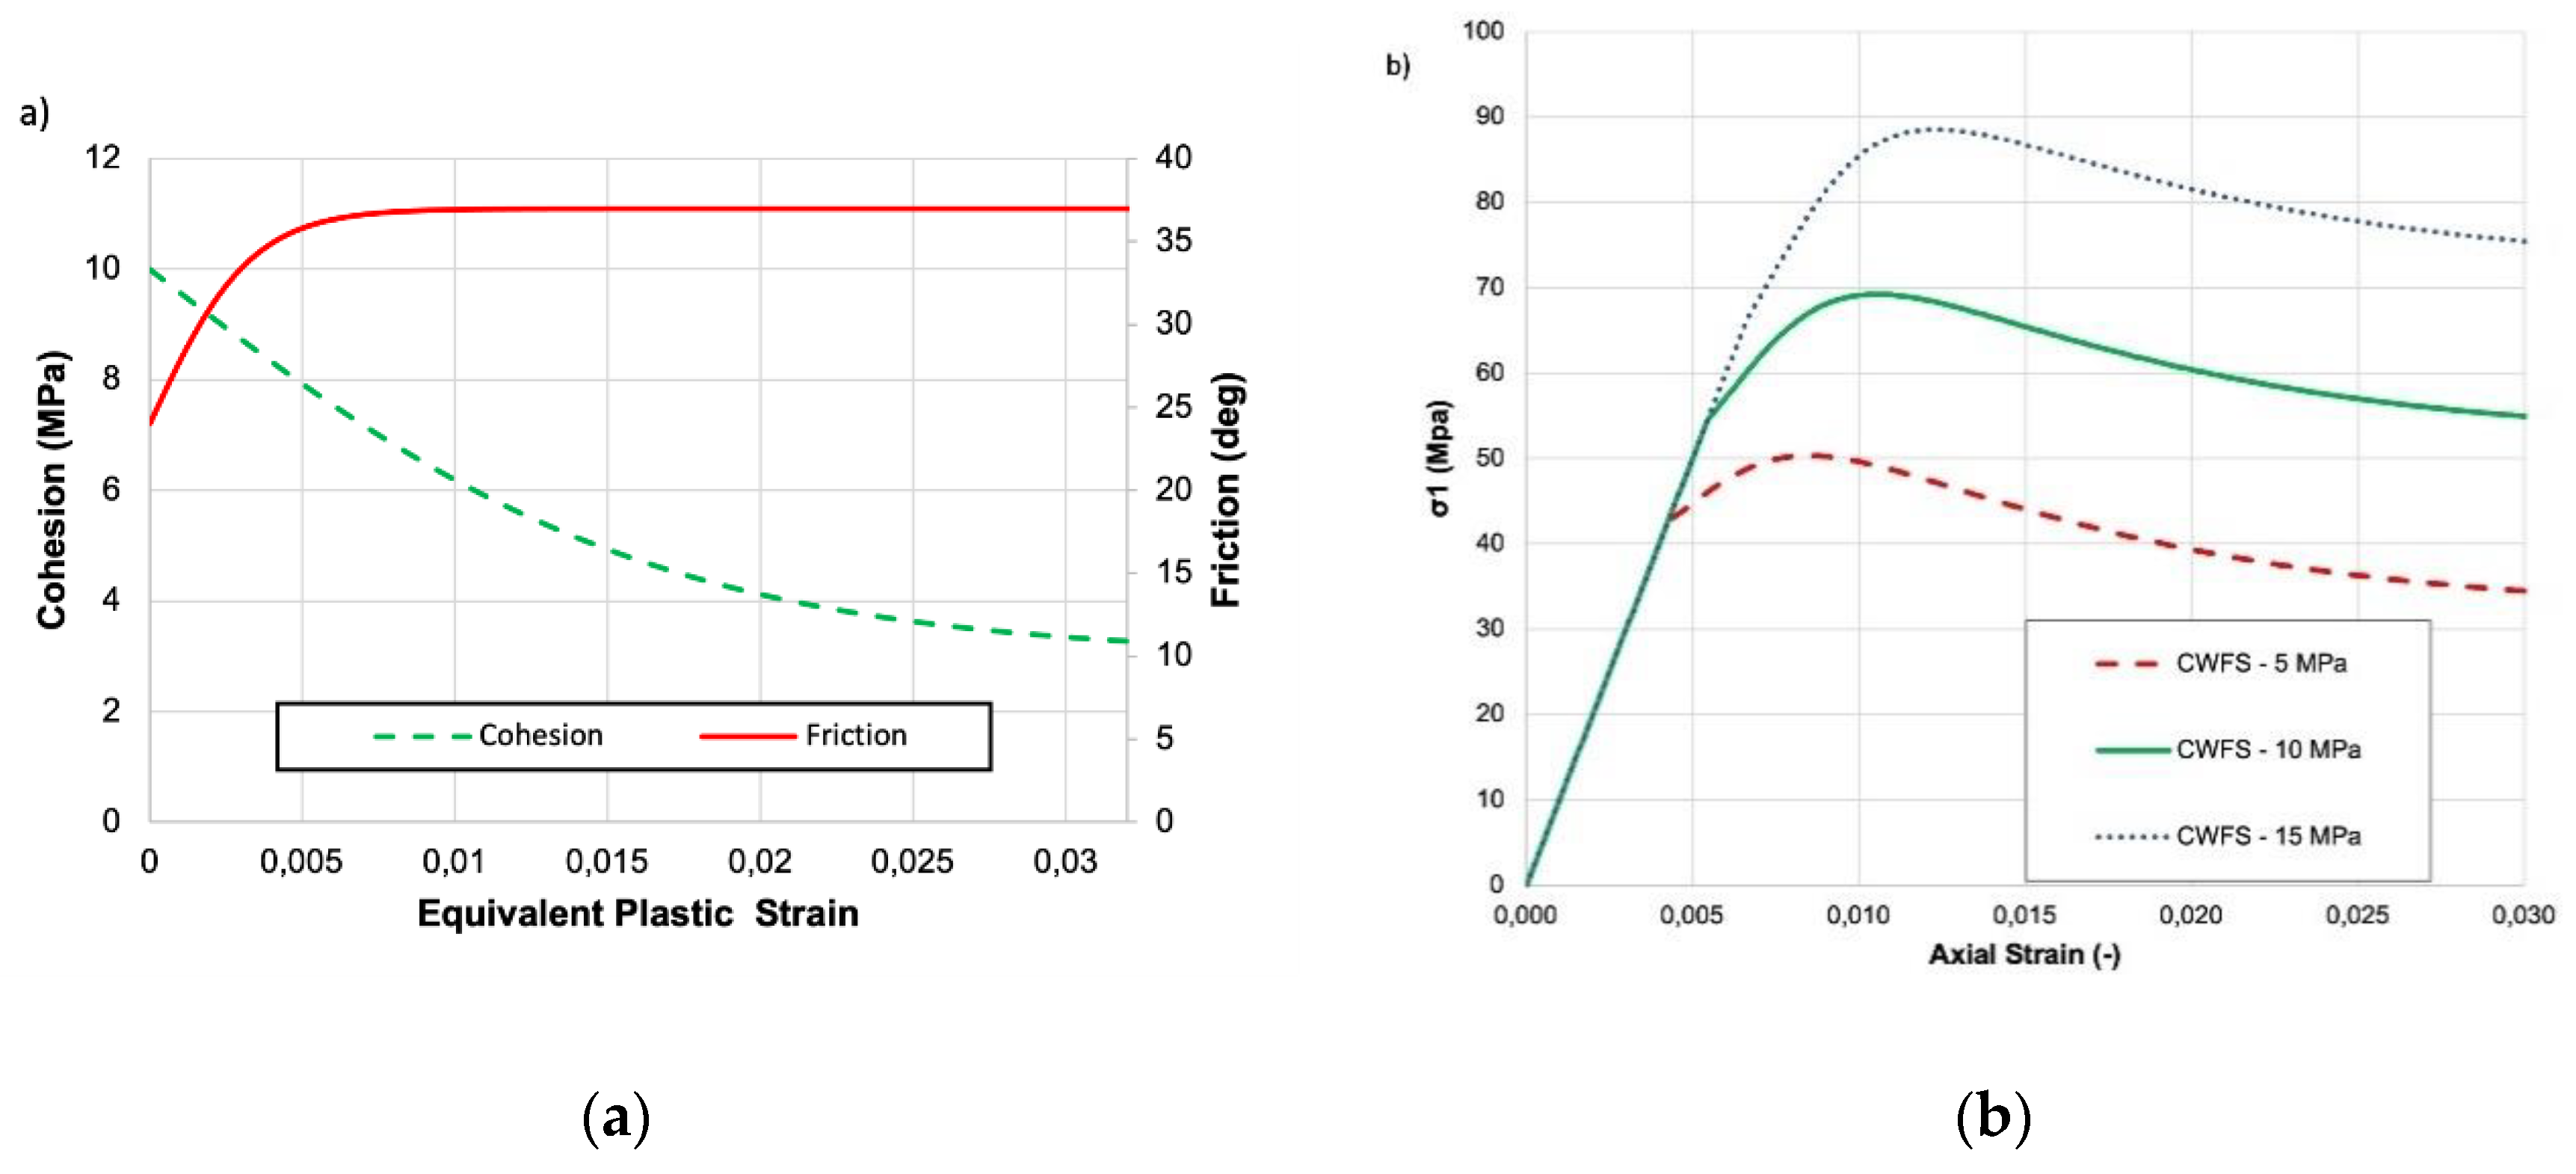
The variation of cohesion and friction for each strain and the corresponding stress-strain curves under conventional triaxial compression resulting from the application of the CWFS model are shown in
Figure 5a,b and
Figure 6a,b. The conventional triaxial test data were analyzed to deduce cohesion and friction of the grout for implementation in the strain-softening/hardening constitutive model in FLAC3D.
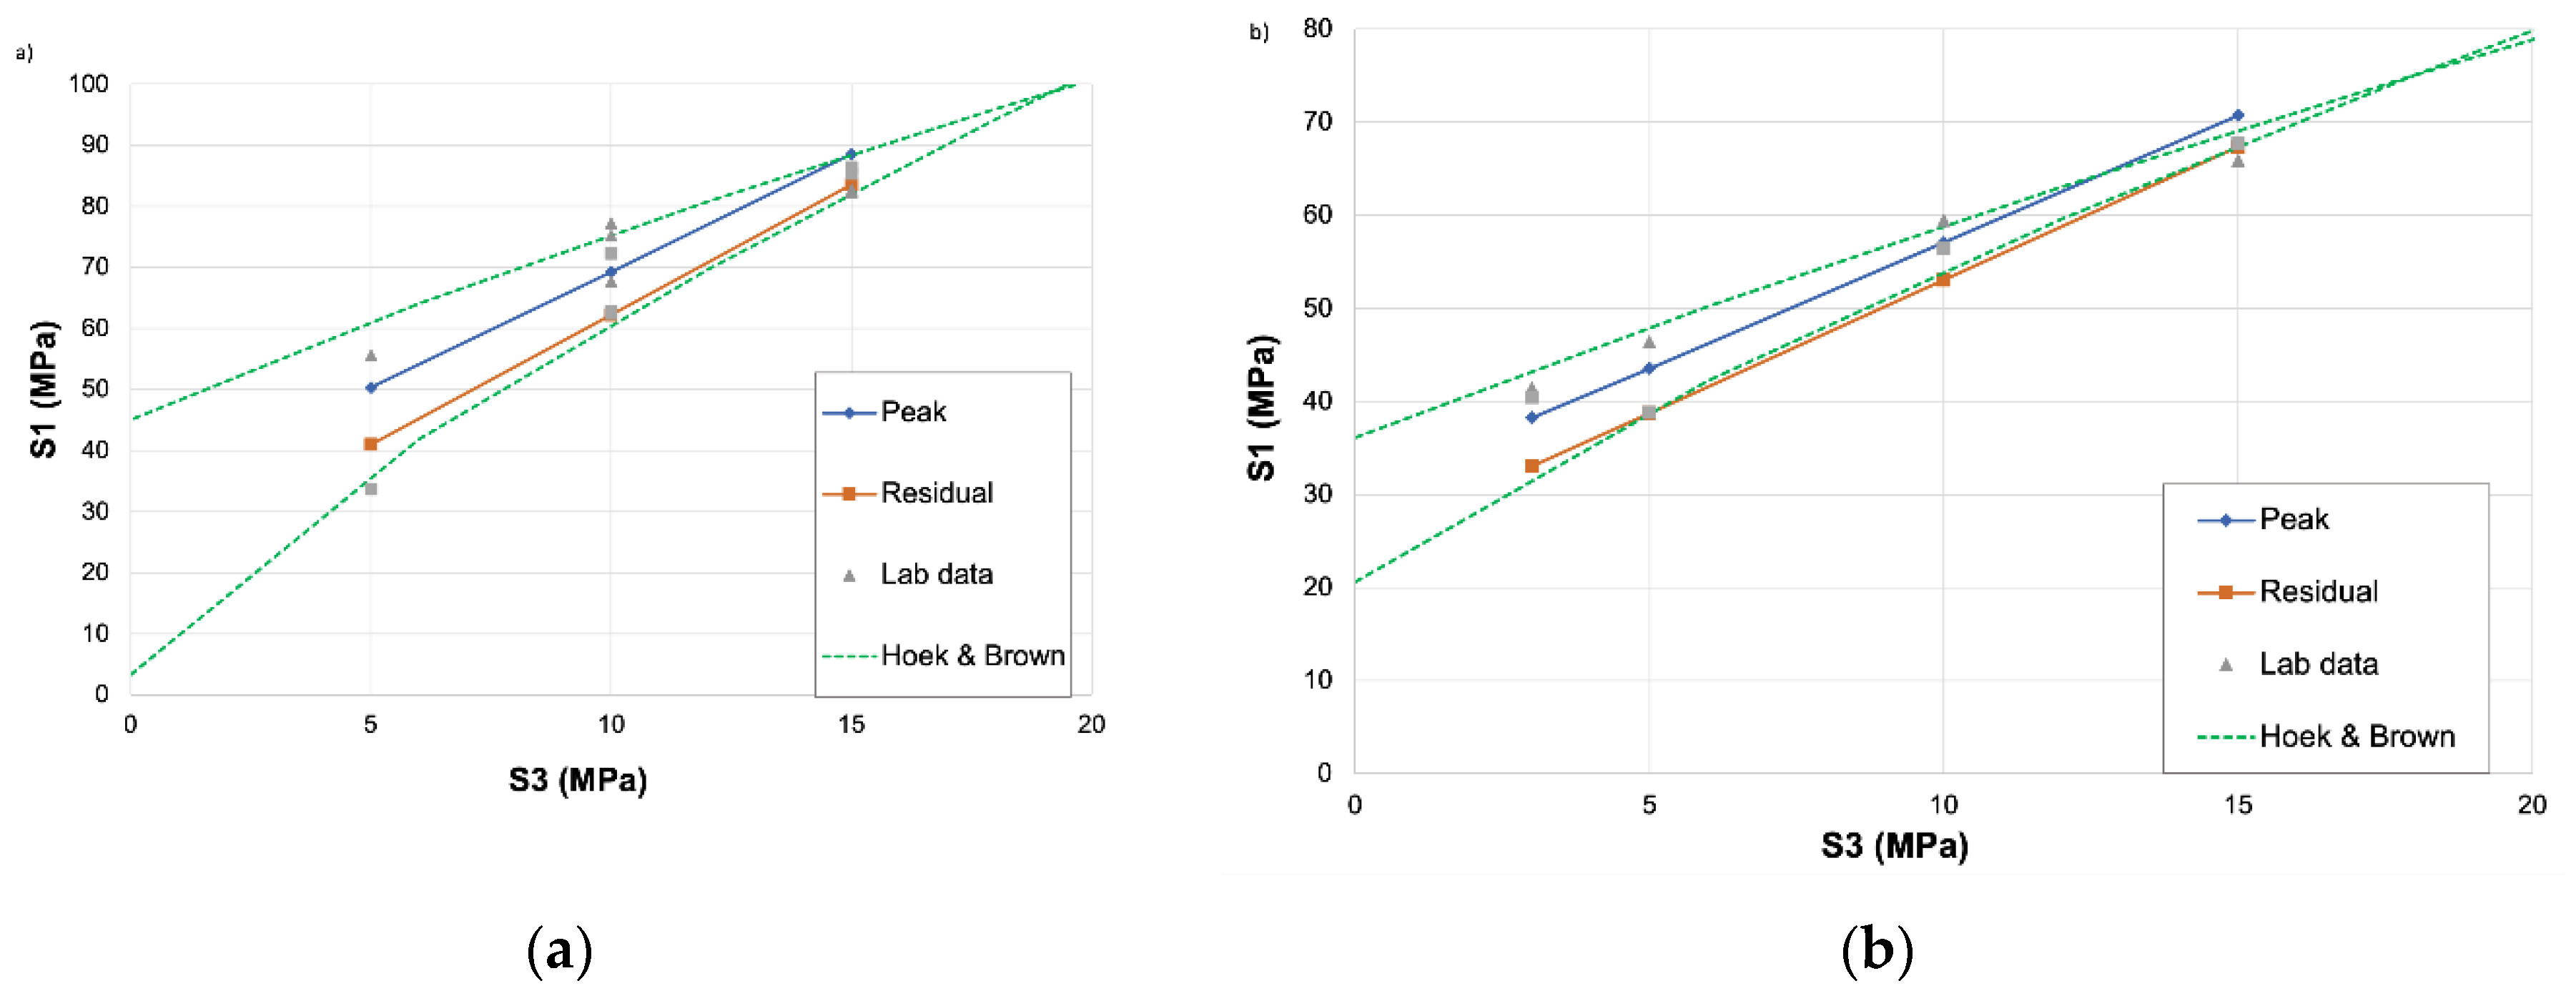
Peak and residual Hoek–Brown (H–B) failure criteria were fitted to the peak and residual strength values obtained as a result of CWFS implementation. These fits, together with the original test data and data from CWFS model, are presented in
Figure 7. A comparison shows good agreement in terms of maximum and residual strength of grout at different confining stresses. In addition to cohesion and friction, the dilation angle (ψ) for 0.44 w:c ratio grout was evaluated, considering that radial and axial stress-strain curves are available only for such grout samples [
46].
The model to calculate the dilation angle is divided into two parts: one referring to the peak dilation
angle and the second to dilation angle decay with plasticity
Equation 4 and Equation 5 show the formulation of the dilation model [
1]:
where
are peak dilation angle and peak friction angle;
are dilation angle decay with plasticity and dilation angle decay peak;
are shear plastic strain and plasticity parameter constants, respectively; and
are uniaxial compressive strength, confinement pressure, major and minor principal plastic strain, respectively.
Using the above-mentioned approach and fit coefficients presented in
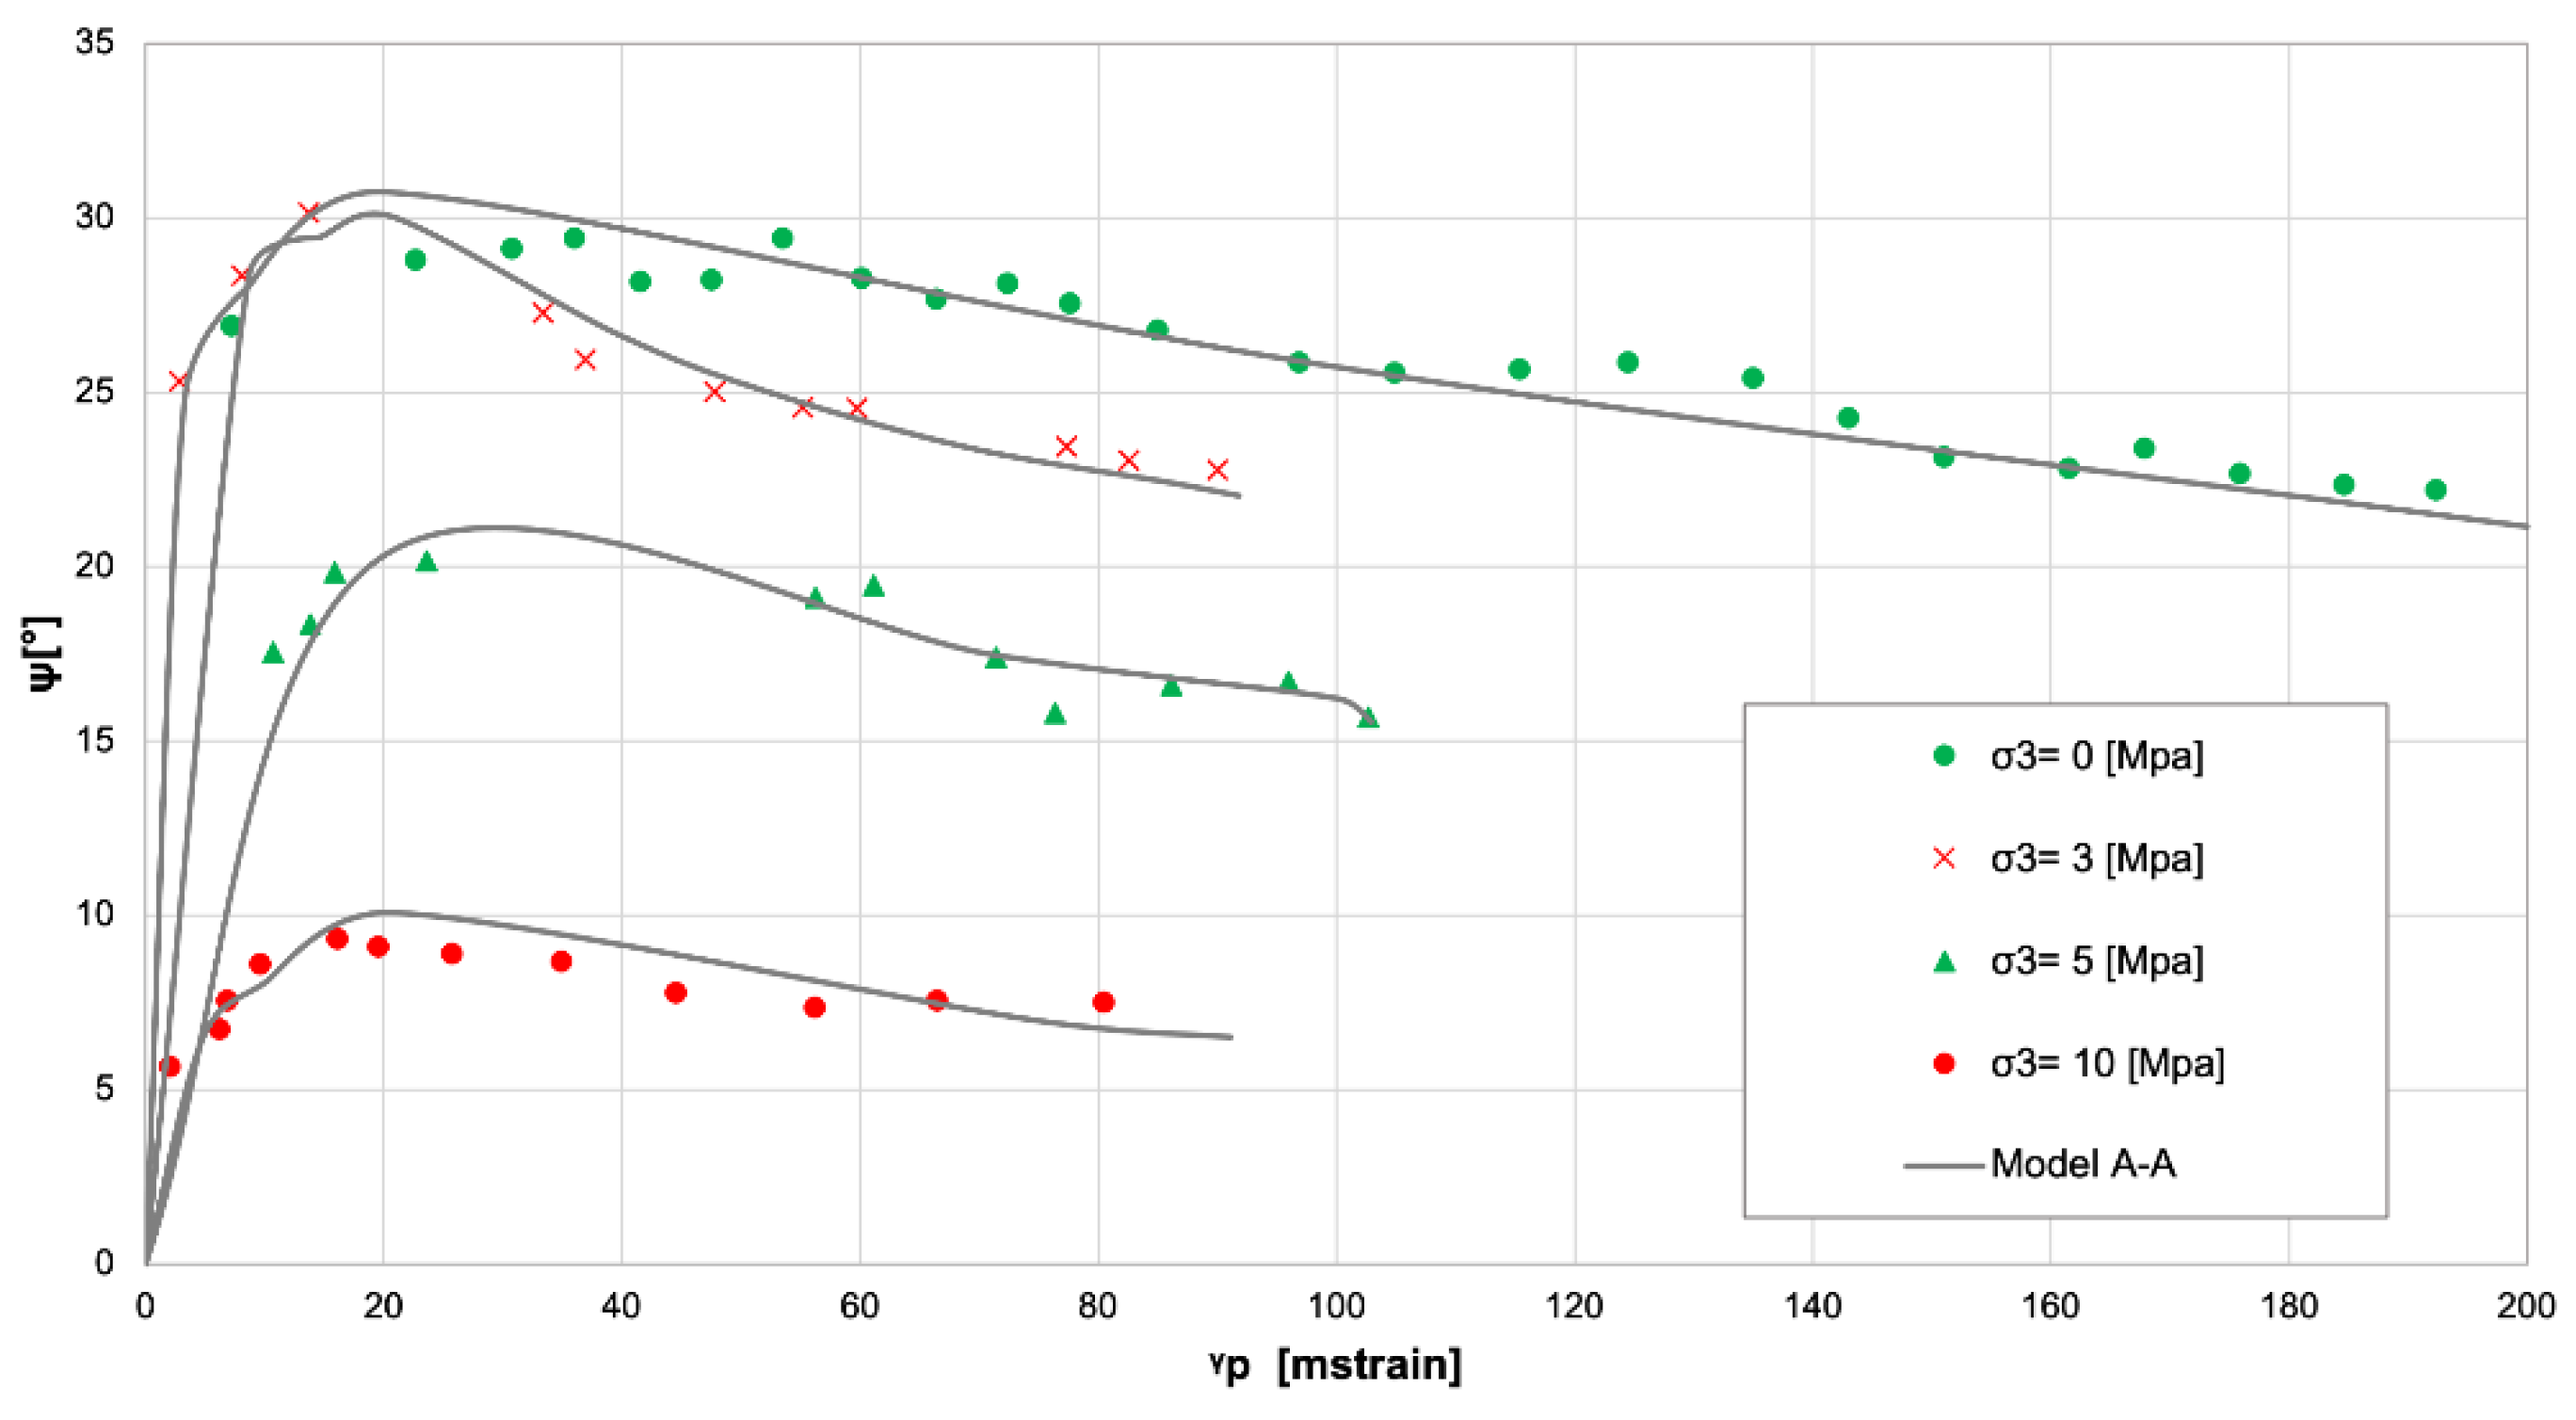
Table 3 dilatancy angle for cement grout with 0.4 w:c ratio was estimated for confinement pressures of 0, 3, 5 and 10 MPa. Also, point clouds for the dilation angle of grout, calculated from conventional triaxial tests, were made.
Figure 8 also shows curves of
as a function of the plastic parameter 𝛾𝑝 and confinement pressure. This figure reveals the expected behavior: dilation angle dependencies as pointed out by Alejano and Alonso [
1], such that the dilation angle depends, first, on confining pressure (i.e., as confining pressure grows, the dilation angle diminishes) and second, on plastic shear strain (i.e., as plastic shear strain develops, the dilation angle decays).
2.2.2.1. Validation of Grout Mechanical Properties
The validation of the values to use as mechanical properties of grout (e.g. cohesion, friction and dilation) in the strain-softening/hardening constitutive model was carried out through 3D numerical simulations of conventional triaxial compression tests of a Mohr-Coulomb strain-softening material using FLAC3D. The model has a height of 100 mm and a diameter of 50 mm. The mesh contains 96,000 elements and 100,521 grid-points. A constant grid-point velocity of 5 m/step was applied at the top and bottom of the sample, the time step in the simulations is automatically controlled in FLAC3D for numerical stability.
Material softening, upon shear or tensile failure, was implemented in FLAC3D by tables relating friction angle, cohesion and dilatancy angle to plastic shear strain. The elastic parameters Young’s modulus (E) and Poisson’s ratio (v) used initially were the same values obtained from conventional triaxial tests and are presented in
Table 2.
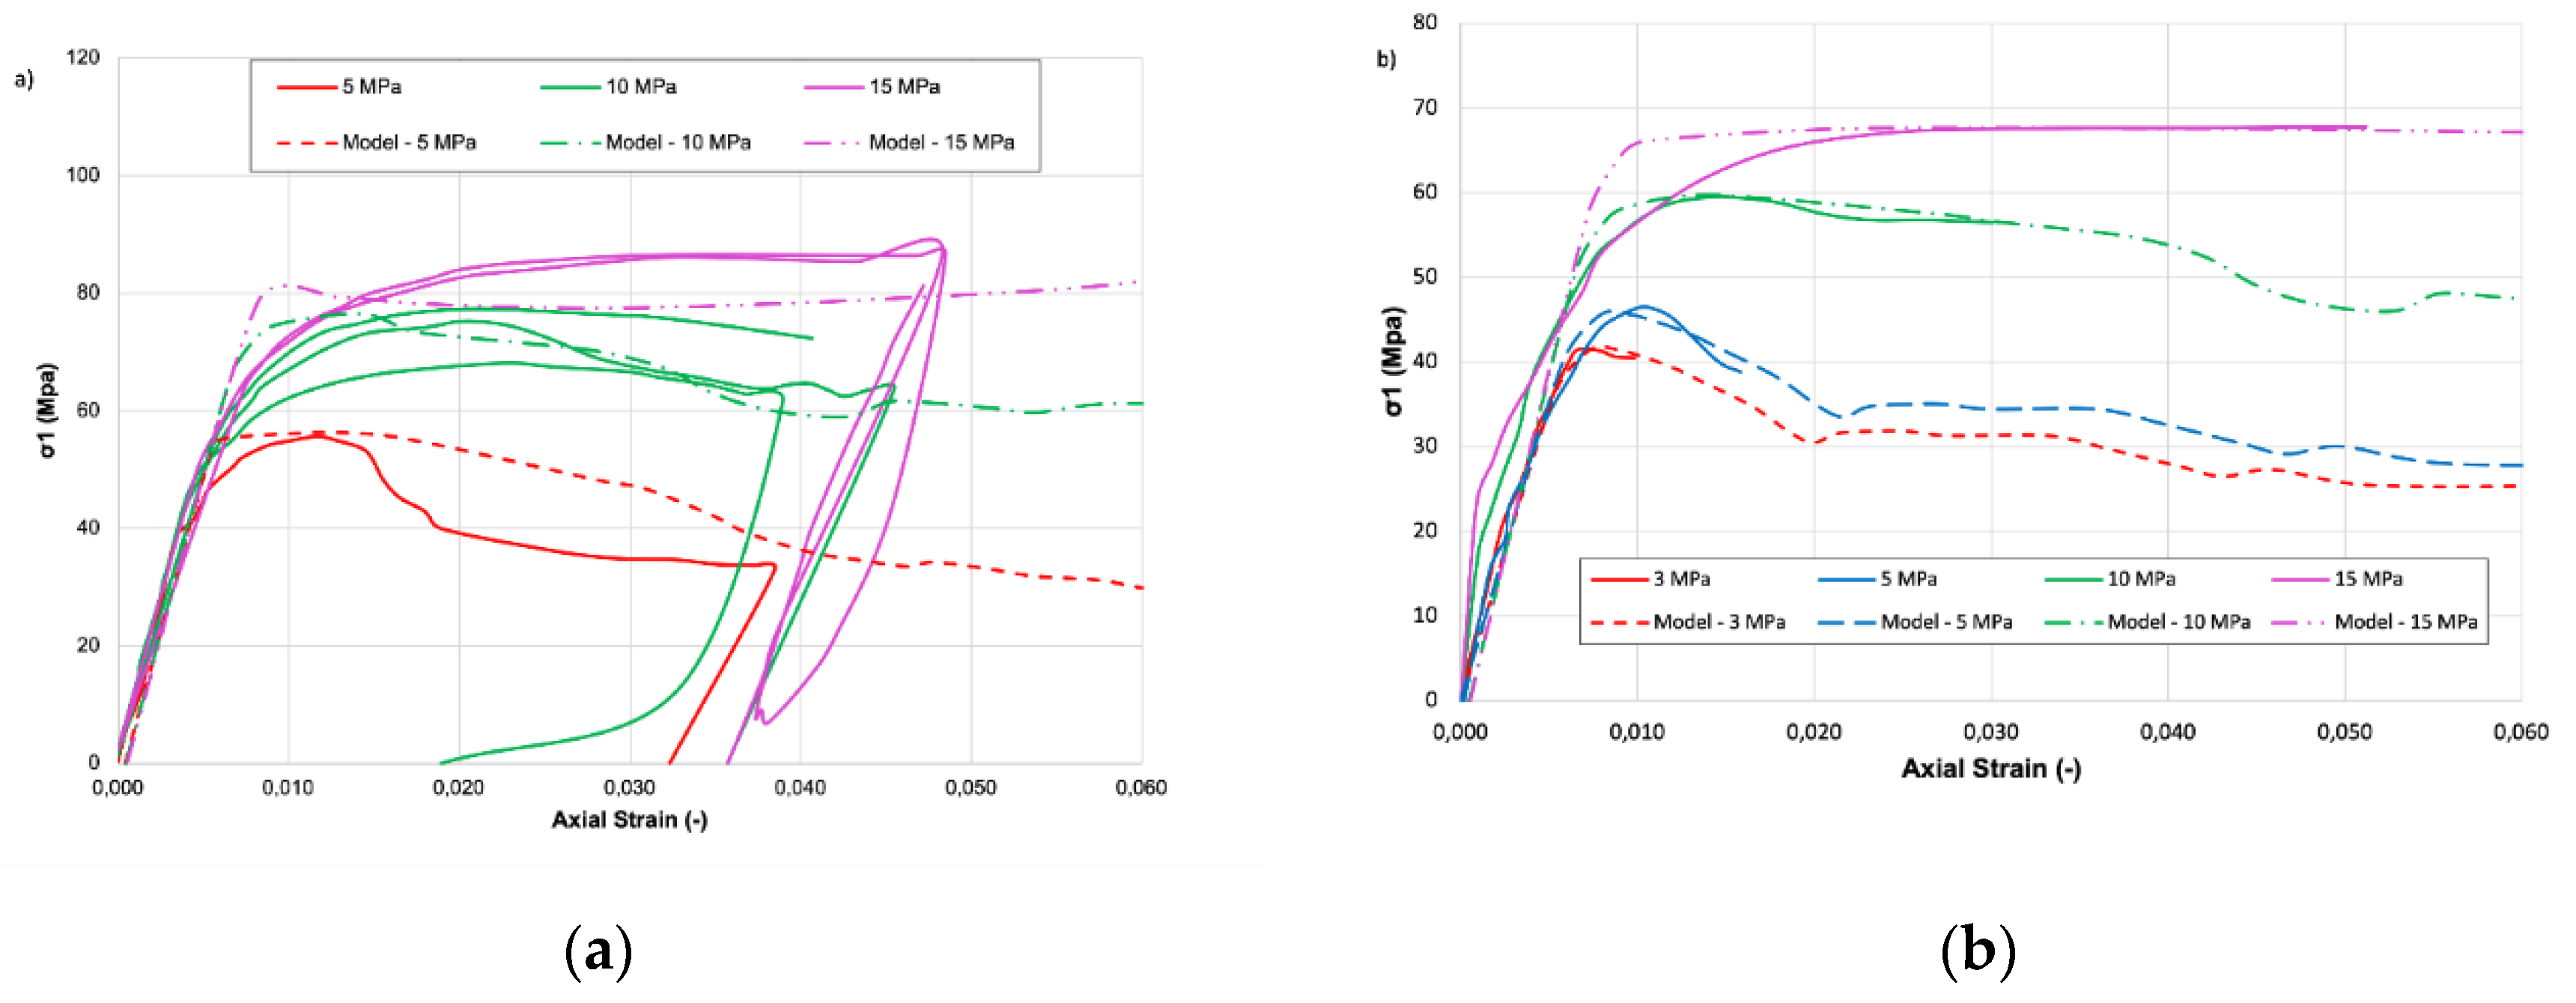
During the simulation of the conventional triaxial loading process, the elements deformed and revealed degradation and dilation. Considering the strength heterogeneity, the elements undergoing degradation and dilation will coalesce and the formation of macroscopic fractures is expected. The simulated stress-axial strain curves under confining pressure of 3, 5, 10, and 15 MPa for 0.4 and 0.44 w:c rate grouts together with analogous results from the actual tests are shown in
Figure 9. The results reveal good agreement in terms of
,
yield point and softening behavior. The implementation presented here is the same for the simulations of grout in the dynamic testing model.
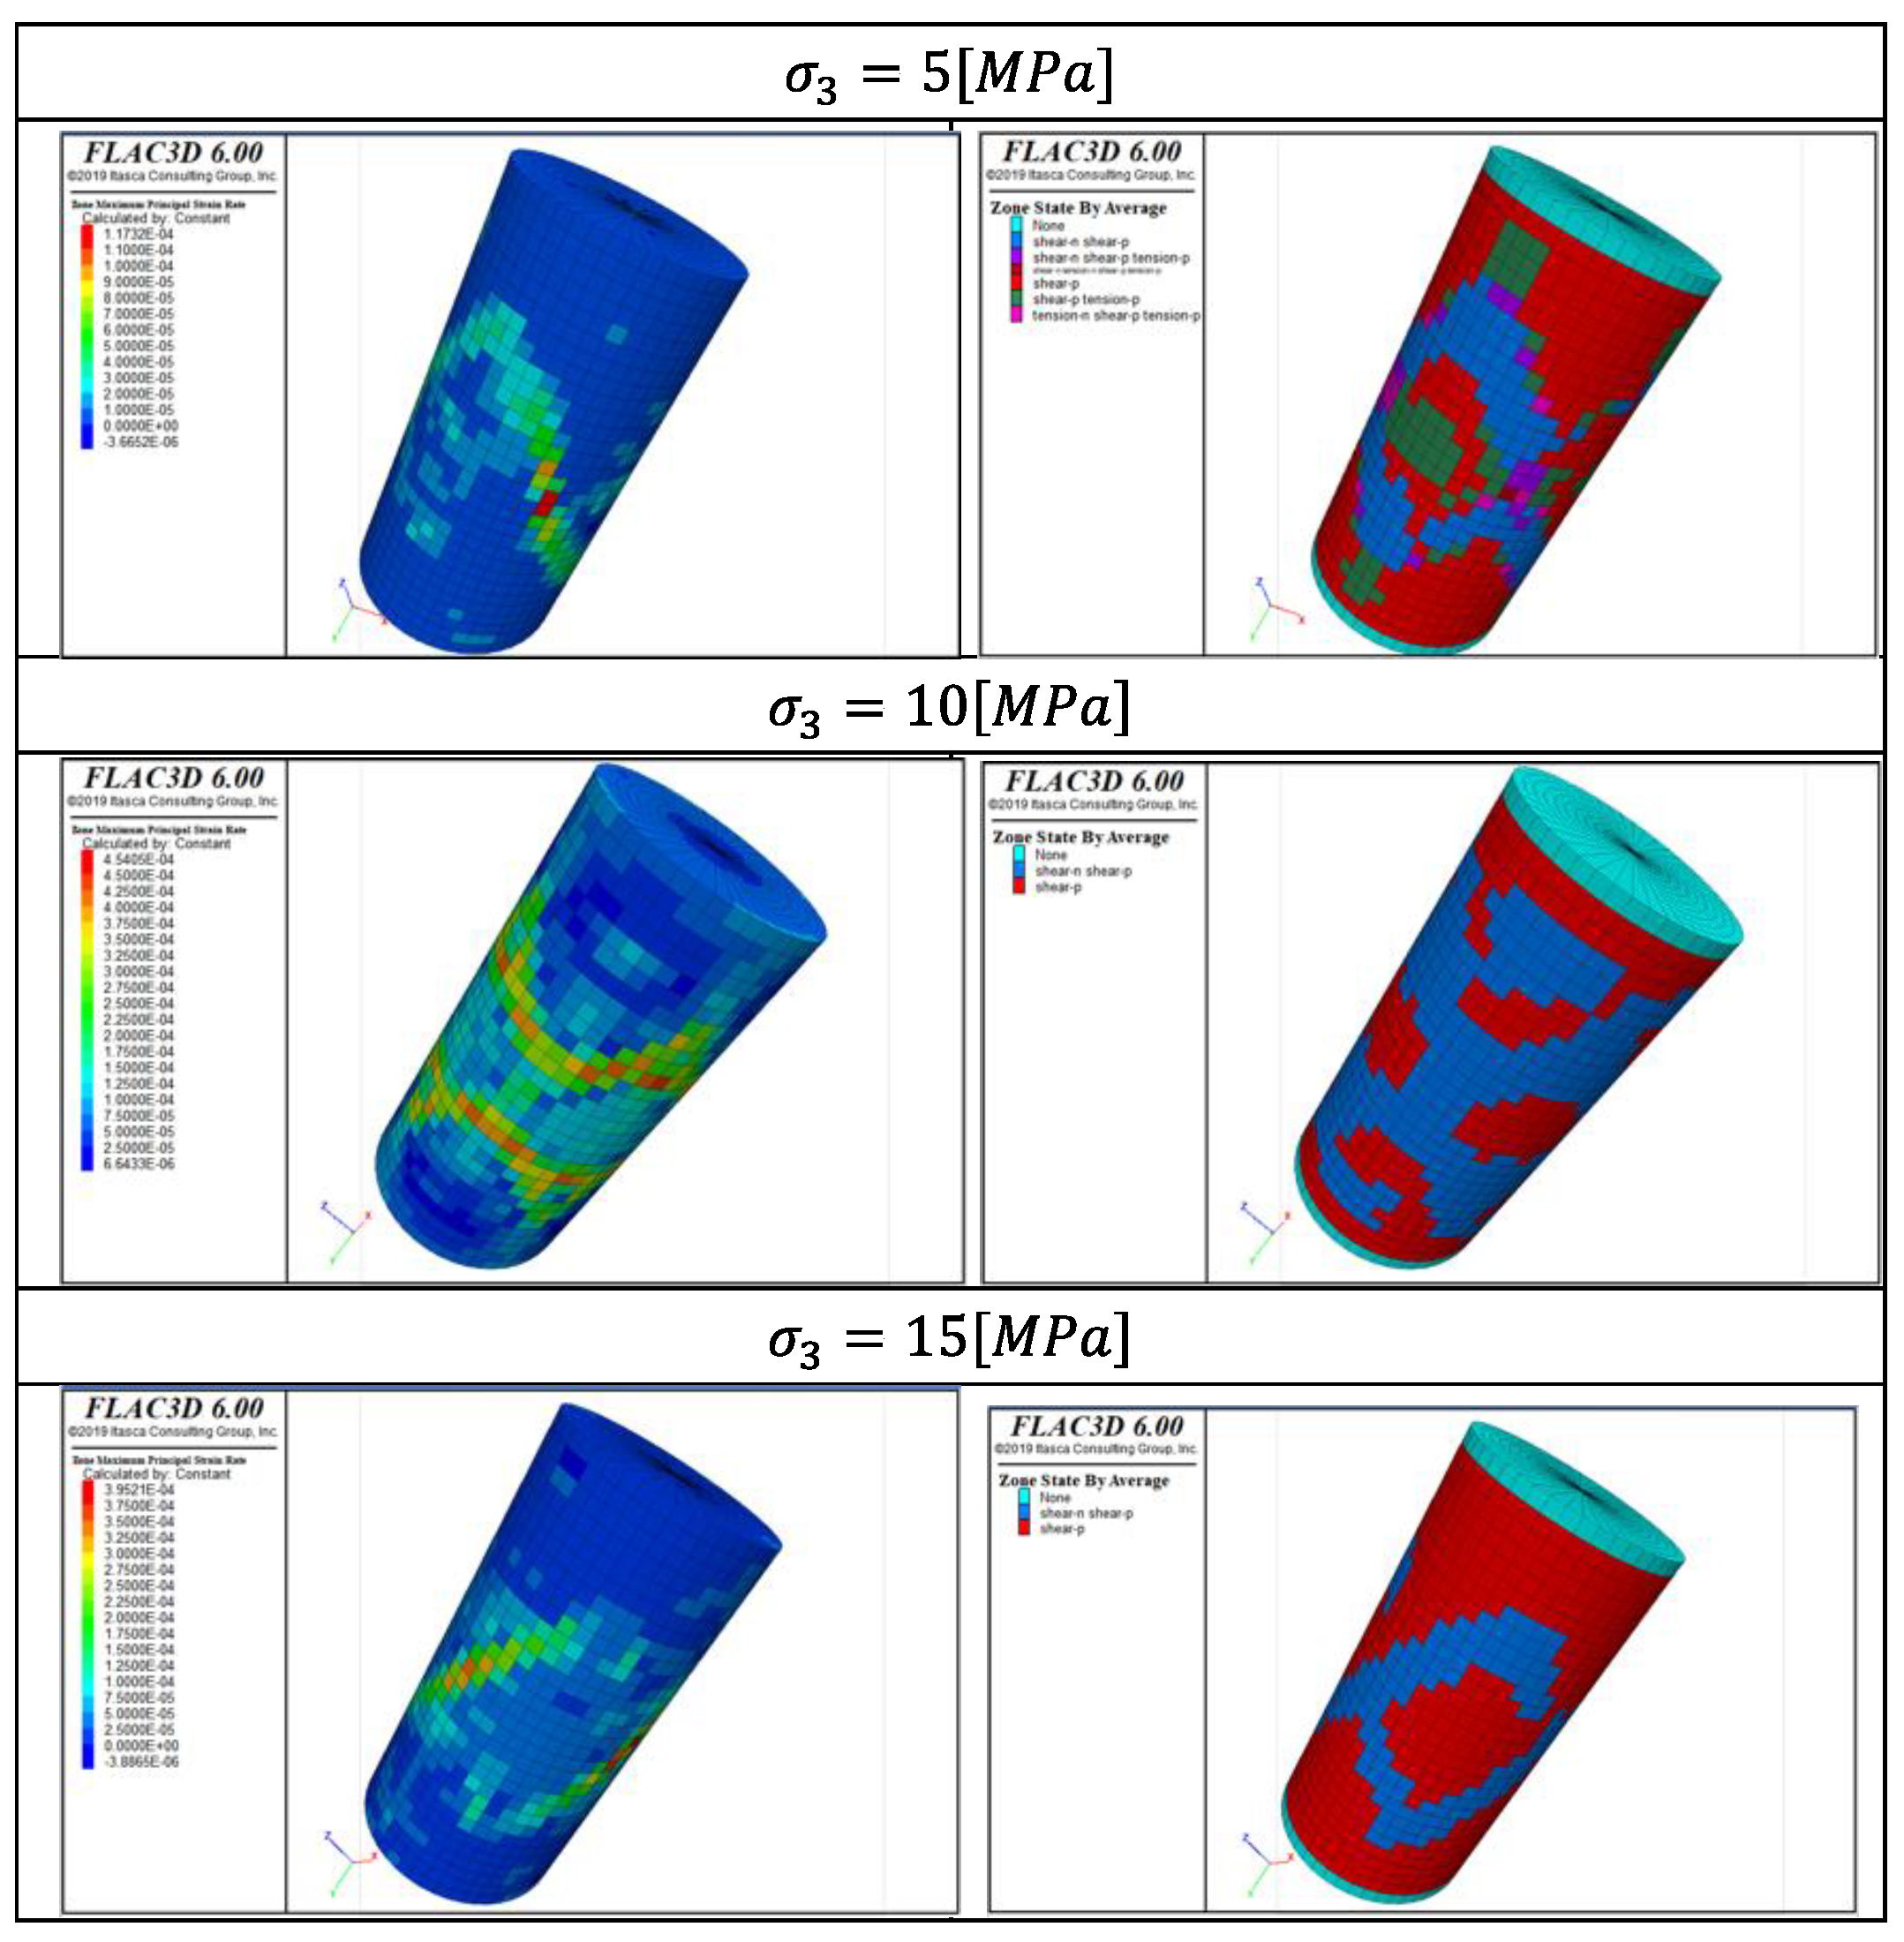
The contour of shear strain rate and failure state development on the grout sample in the simulations can be observed in
Figure 10. As expected, sample failure is produced by the formation of localized shear bands. The orientation of shear bands depends on the value of confining pressure. Then there is a clear transition from brittle to ductile behavior when the confining pressure increases.
2.2.3. Steel Tube
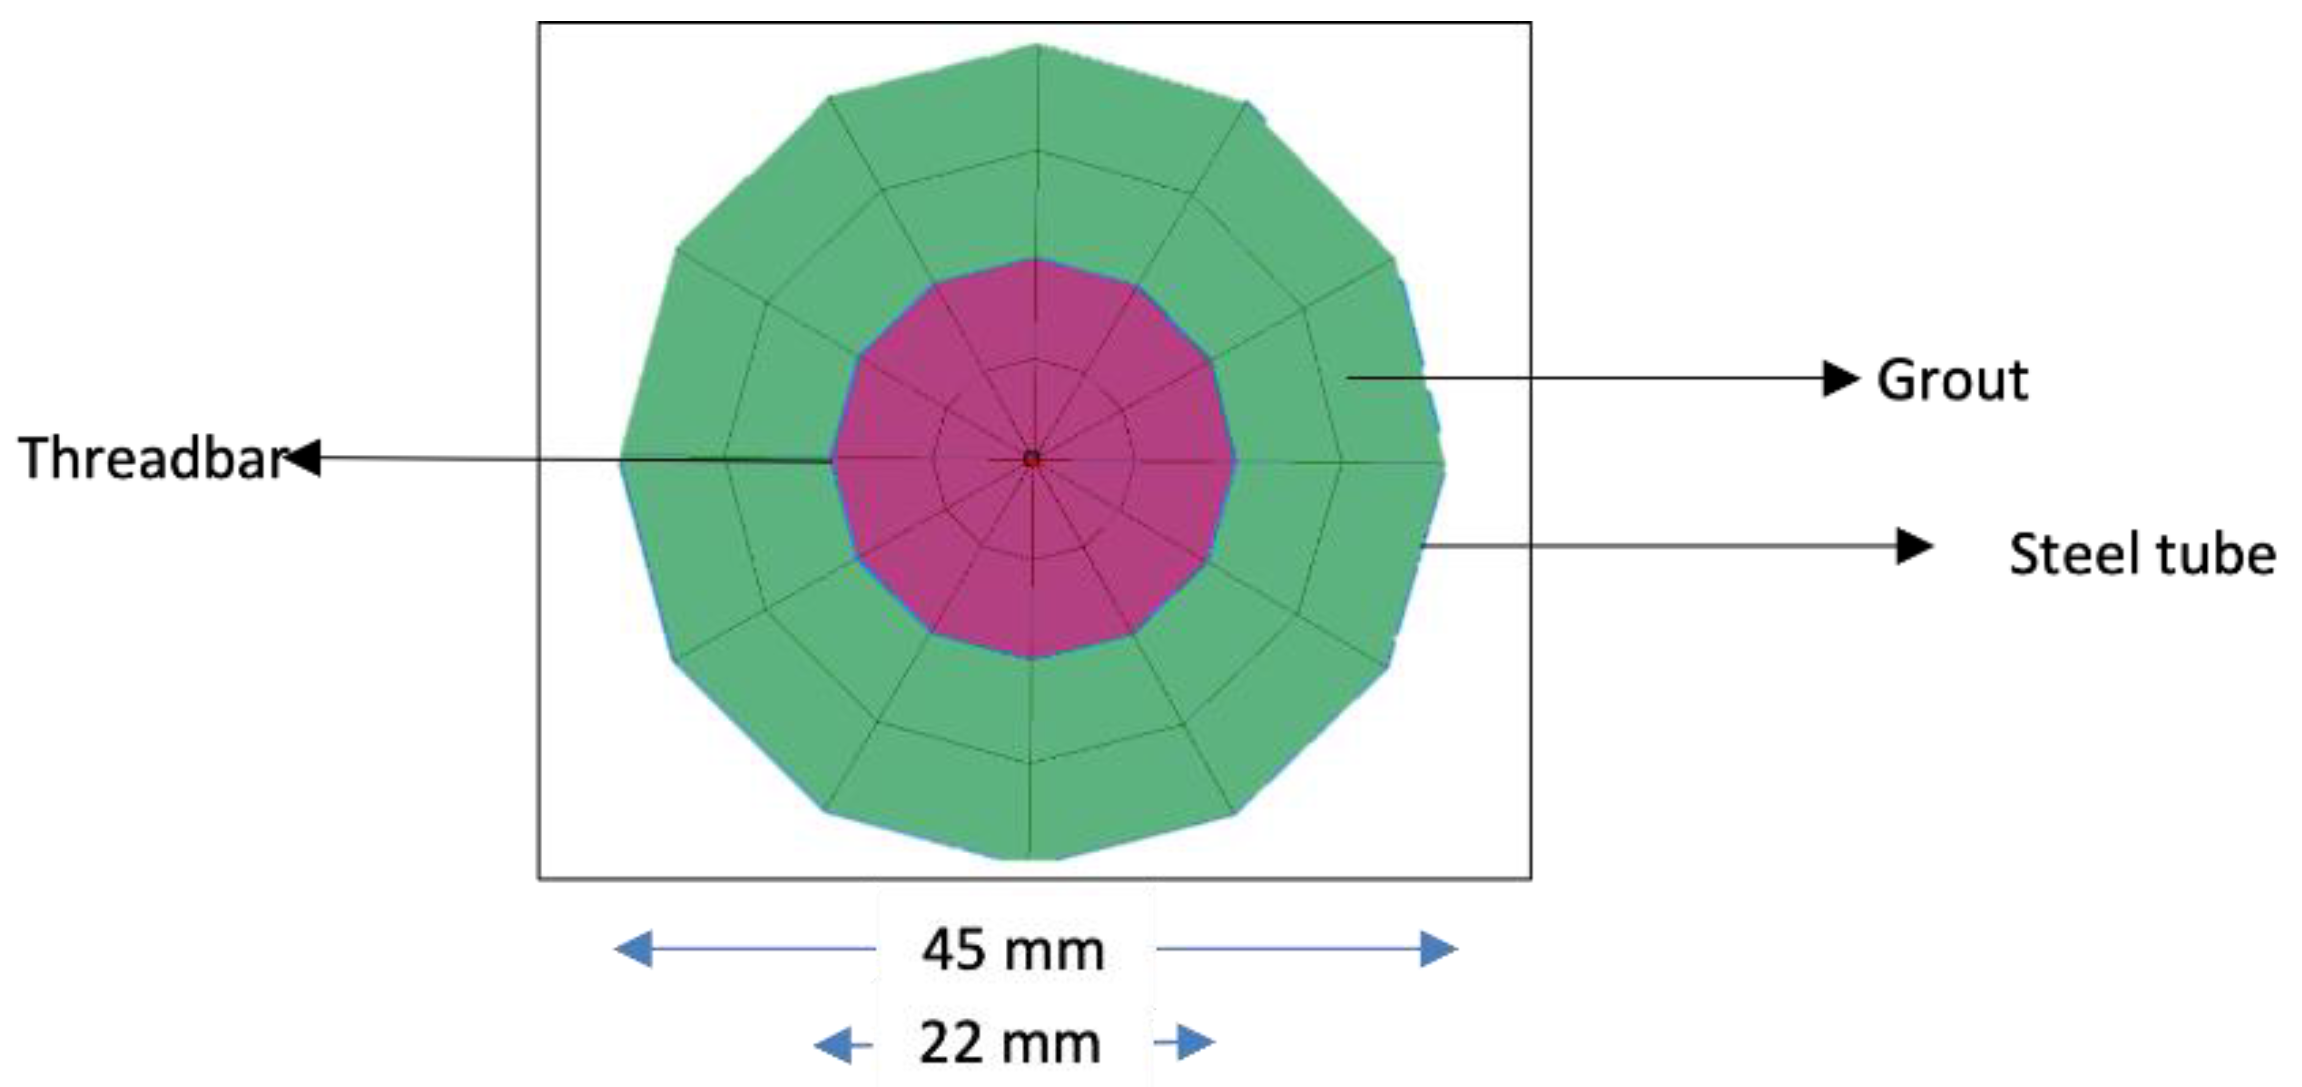
A shell structural element that envelops the grout represents the steel split pipe in which the grouted rockbolt was inserted in the laboratory-scale dynamic testing, as shown in
Figure 11. The steel tube applies confinement to the element tested and simulates the ground surrounding an excavation. That configuration represents what in situ during a seismic event would be solid ground (steel pipe) and fractured plane (split), [
32]. In the numerical model, the shell responds to the tension through an elastic constitutive model controlled by the Young`s Modulus (E) and Poisson ratio (v) of steel. This model is valid for homogeneous, isotropic and continuous materials that exhibit linear stress-strain behavior
The link between the shell (steel tube) and the grid (grout) was treated as rigid so that stresses develop within the shell as the grid deforms. The steel tube remains elastic and rigidly connected to the grout throughout the simulation. 2.2.4 Interface between rockbolt and grout.
Although the model only consists of four main parts, it was necessary to use interface elements to allow relative movements between the rockbolt and the grout. These interface elements were used around the superior and inferior part of the rock bolt; the split tube length was not surrounded by the interface.
Interface properties play an important role in a rockbolt-grout model, it can fail in tension or shear governing whether a slip (debonding) or an opening of a gap between the rockbolt and the grout (decoupling) may occur, both of which are possibilities in the analysis, but this behavior was not allowed in the laboratory tests.
FLAC3D interface elements have properties of friction, cohesion, dilation, normal
and shear
stiffness, and tensile strength. Itasca Consulting Group [
14] recommends that the use of normal and shear stiffnesses be ten times that of the stiffest neighboring element, which in this case was the steel. The apparent stiffness (expressed in units of stress-per-unit length) of an element (or zone) in the normal direction
is defined by Equation 6:
where K is the bulk modulus of the steel, G is the shear modulus of the steel, and
is the smallest dimension of an adjoining element in the normal direction.
2.3. Simulation of Dynamic Tests
2.3.1. Equations to Motion
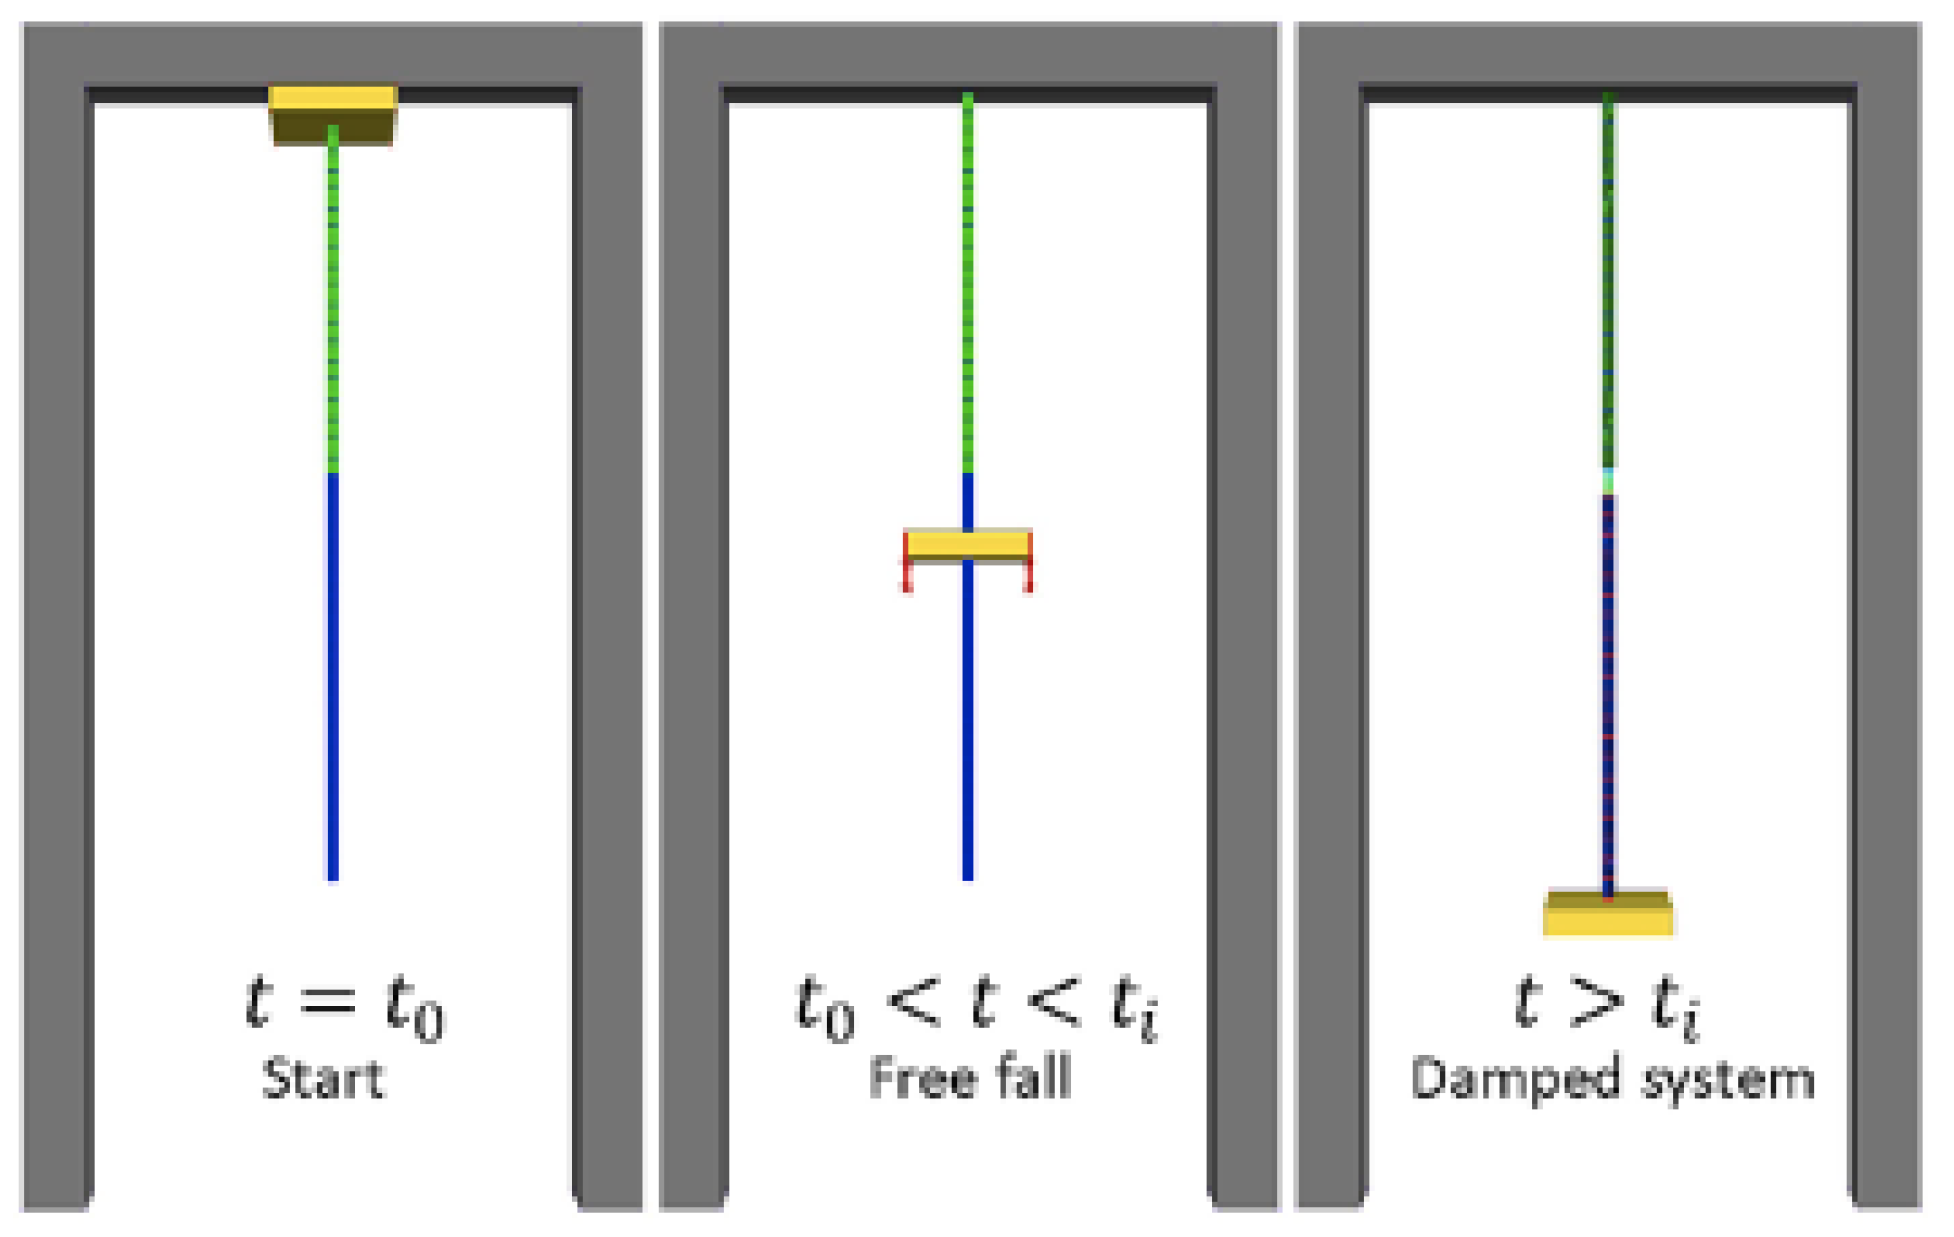
To solve the numerical model, the dynamic system is divided into three stages as proposed and illustrated by Vallejos et al., [
43] and Marambio et al. [
27] in
Figure 12. The first and second stages include the free fall of the mass used in the dynamic test until it impacts the plate (damping cushion in the current test) at a particular time of impact. The third stage is what was modelled here and occurs after the moment of impact when the mass begins to move along with the rockbolt, stretching it or sliding it until possible failure. Our model does not explicitly include the external hardware (nut and plate), so the mass impacts the lower part of the steel tube.
The whole system can be represented by two differential equations, in which the first describes the motion of the rockbolt and the second the motion of the grout, as presented in Equation 7 and Equation 8, respectively. St-Pierre [
42] has shown a similar scheme in the development of his model for the cone bolt reinforcement element. Equation 7 and Equation 8 are as follows:
where
are the loading mass used in the dynamic test and grout mass, respectively;
is the gravity constant;
are the stiffness of rockbolt and grout, respectively;
are the viscous damping of rockbolt and grout;
are the displacement of rockbolt and grout;
are the velocity of rockbolt and grout;
are the acceleration of rockbolt and grout;
is the friction force representing the contact between rockbolt and grout. The motion equations are solved by an iterative numerical method – explicit in time combined with the unbalanced force criteria from FLAC3D.
The mass of the rockbolt (
) in Equation 7 and grout weight (
) in Equation 8 are negligible in comparison with the loading mass of the dynamic test (
m), where the loading mass is about 200 times higher than the mass of the rockbolt, and therefore not taken into account in motion equations. The stiffness of the rockbolt and the grout shown in Equation 7 and Equation 8 are approximated by their equivalent stiffness for systems connected in series [
36].
Furthermore, the viscous damping of the rockbolt and the grout are proportional to their respective masses, stiffness and a damping component
, commonly known as classical Rayleigh damping [
37]. Equation 9 and Equation 10 show the damping components of the rockbolt and grout.
where
is the n normal vibration mode for rockbolt, assumed as a bar anchored at one end;
is the n critical structural material damping, between 2%_and 5%;
is the n normal mode for grout, and
is the n critical geological material damping, between 2% and 10%.
The damping components mentioned above depend on the normal mode of vibration for rock bolt as in Equation 11 [
7], grout as in Equation 12 [
30], and strain rate:
where
is the length of rockbolt;
the density of rockbolt,
the Young`s modulus of rockbolt,
the moment of inertia of rockbolt,
the empirical coefficient for each mode,
grout stiffness, and
the grout mass.
2.3.2. Model Operation
The model simulates the movement and the impact of the loading mass, considering the behavior of the rockbolt and grout, and follows the steps described below:
The dynamic test is represented by a mass that generates the impact. The input necessary to represent it is the loading mass in Kg. For initial modeling, the loading mass is 2000 Kg.
Force at each node is calculated from stress, applied load, and body forces (stress and strain are constant within an element).
The equations of motion are used to derive new nodal velocities, displacements and forces in each zone representing the rockbolt. In this sense, new strain rates are derived from nodal velocities to apply the dynamic increase factor proposed by Malvar & Crawford [
25] in a constitutive model elastic-perfectly plastic. This is repeated at every time step of the calculation until the system reaches equilibrium.
The strain rate of each element is determined from the velocity of each node.
However, in the split-tube configuration a monitoring point for the strain rate is located at the discontinuity of the encapsulating tube.
The confinement imposed by the encapsulating tube is represented by a structural element type DKT- CSTH shell whose constitutive behaviour is considered to be elastic. For initial modeling, the thickness of the split tube is 5 mm.
2.4. Modeling Results
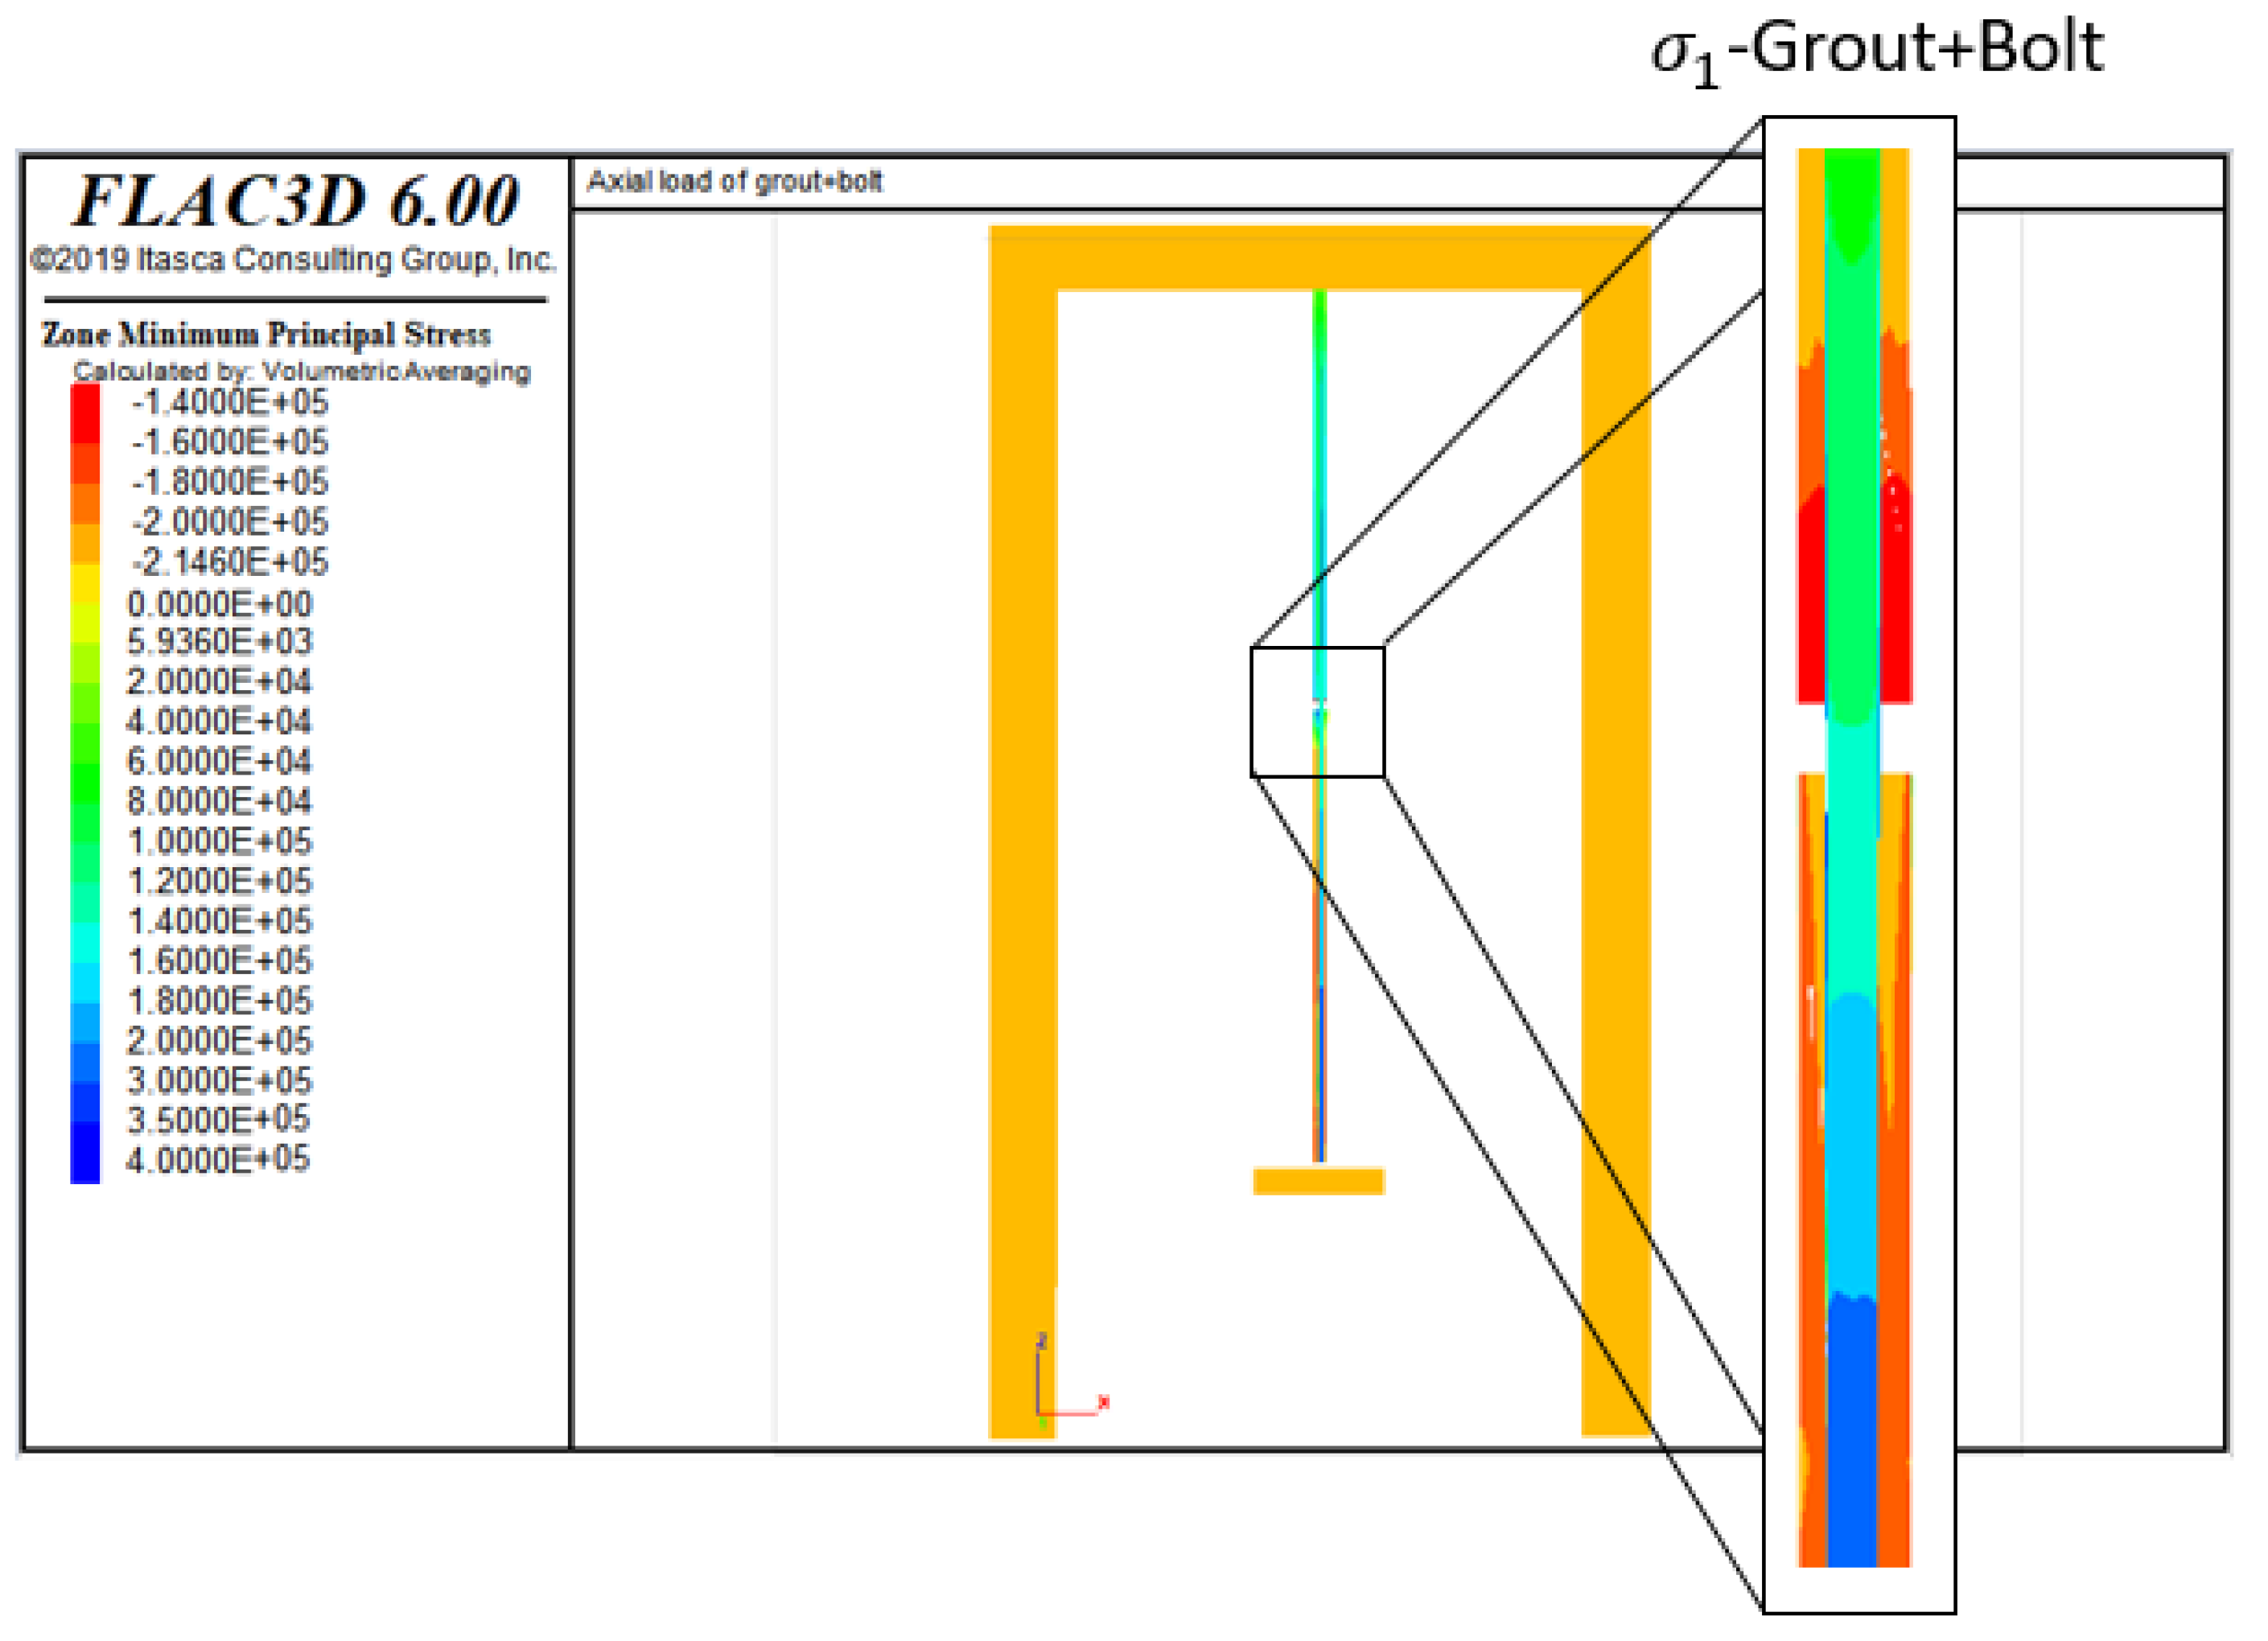
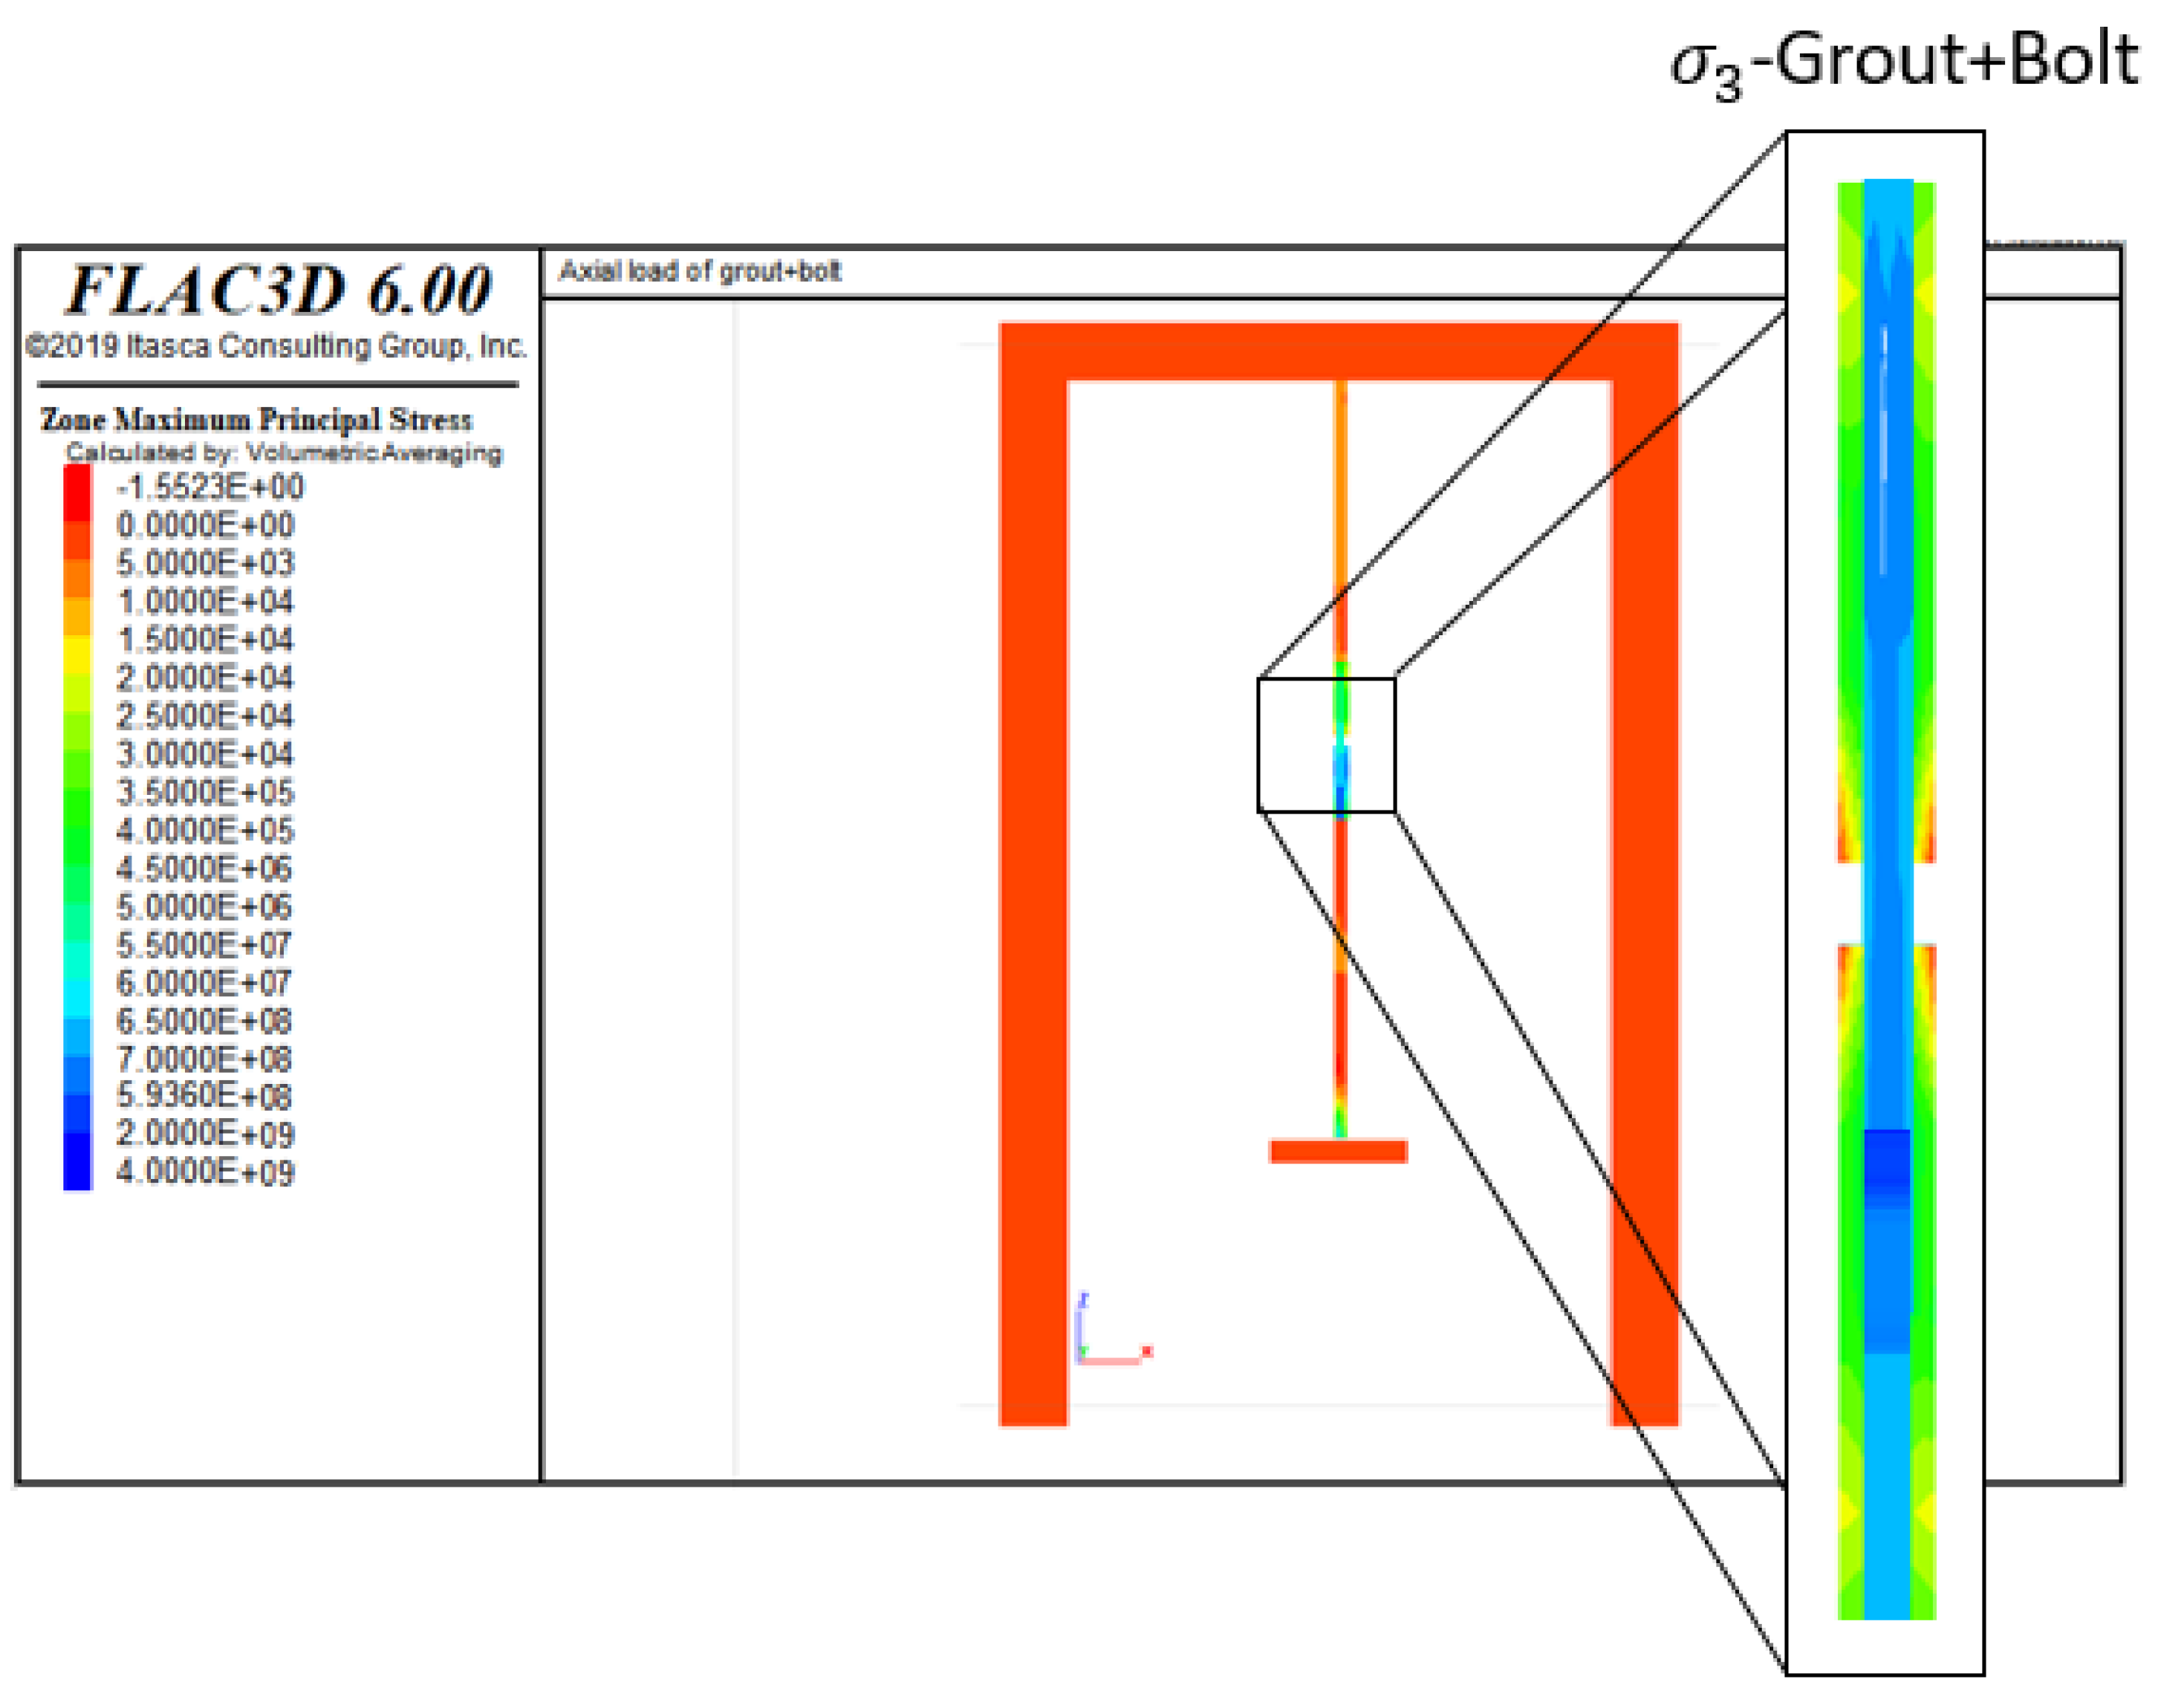
The maximum and minimum principal stresses in the zone around the simulated discontinuity (split tube) for rockbolt and grout are shown in
Figure 13 and
Figure 14, respectively (note that in FLAC3D by definition, tension and extension are positive). In the case of rockbolt, the strength increases as the length analyzed moves away from the split tube zone, indicating that the bolt is more prone to failure in the confinement-free zone.
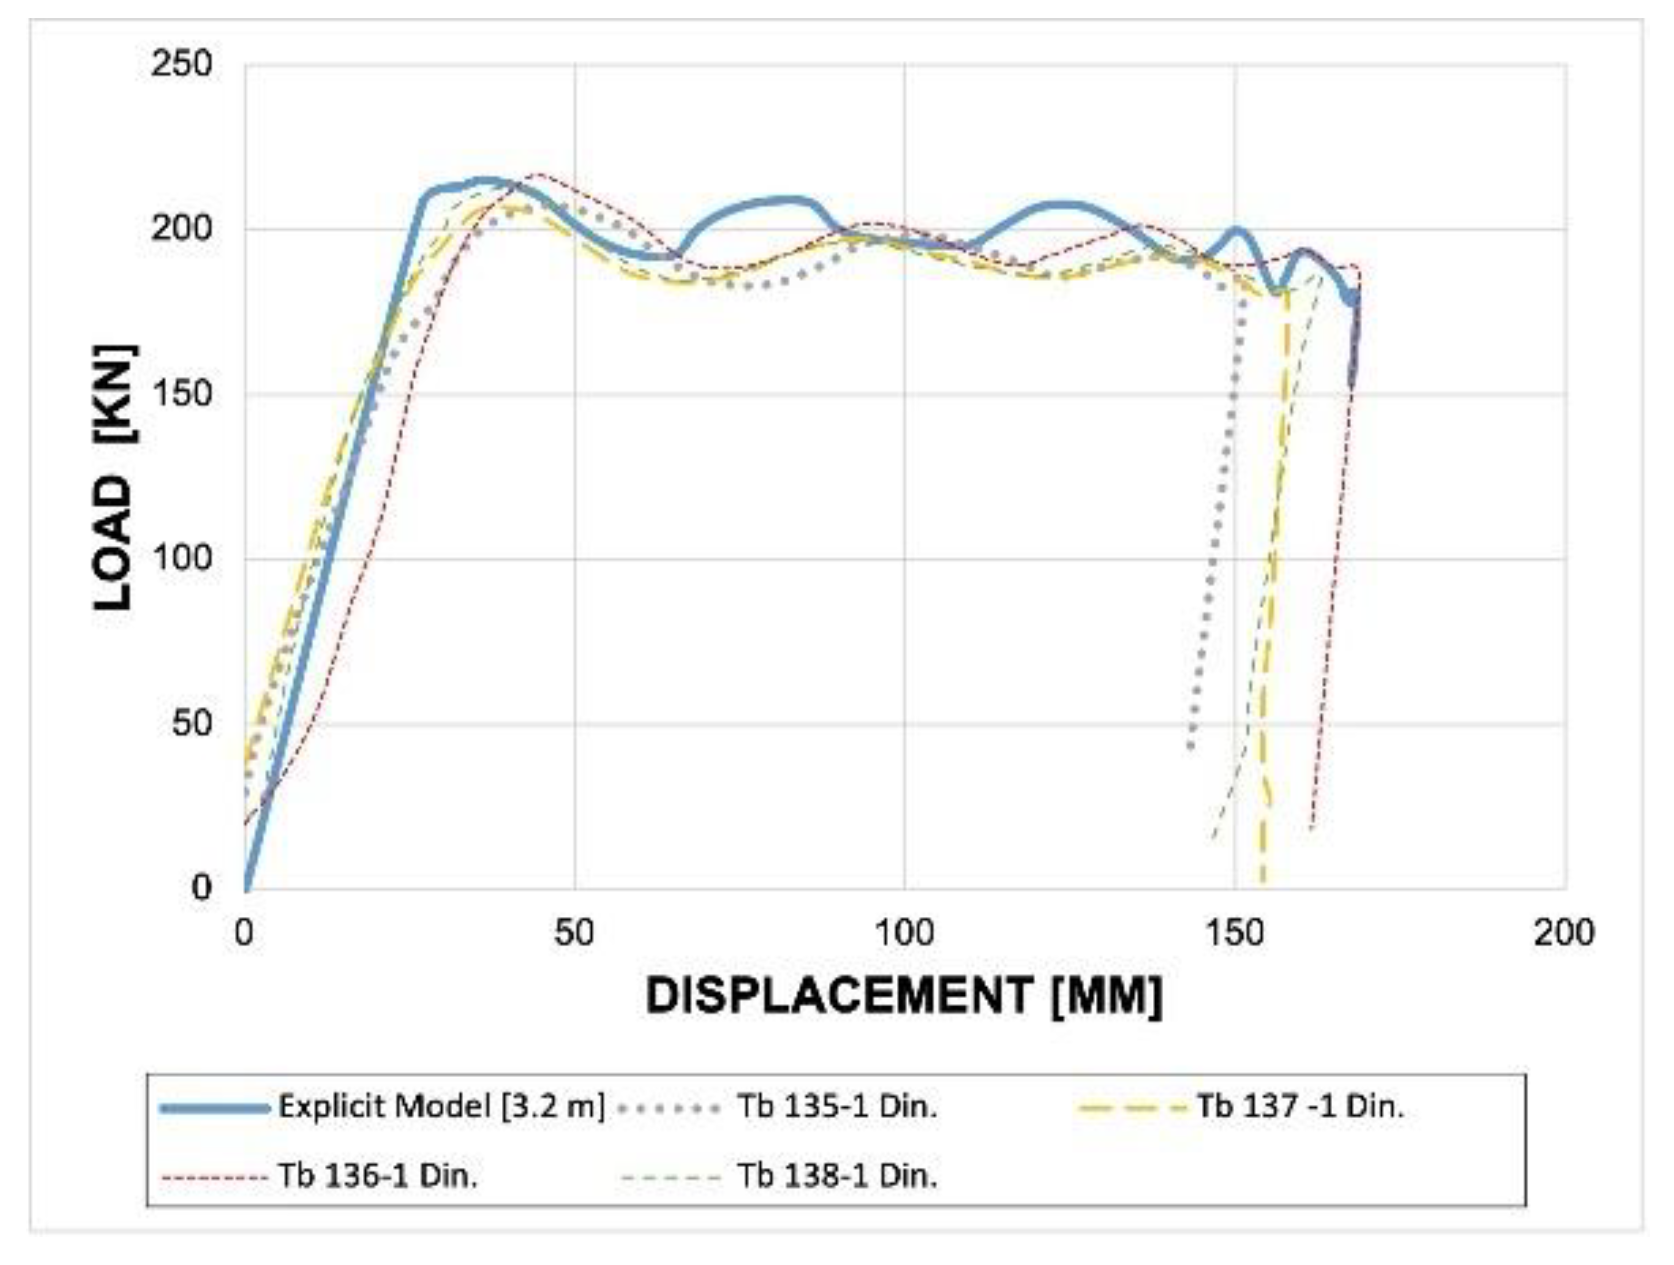
.A monitoring zone was located along the split tube zone to measure the variation of load and displacement of the threadbar in the simulation from the mass impact (initial loading) and until the simulation returned to equilibrium. The comparison between the simulation and laboratory-scale dynamic test results for the threadbar can be seen in
Figure 15 [
33]. In this graph, the similarity between the numerical model and the laboratory testing results in terms of yield load and ultimate plastic displacement (D) of the bolt can be seen.
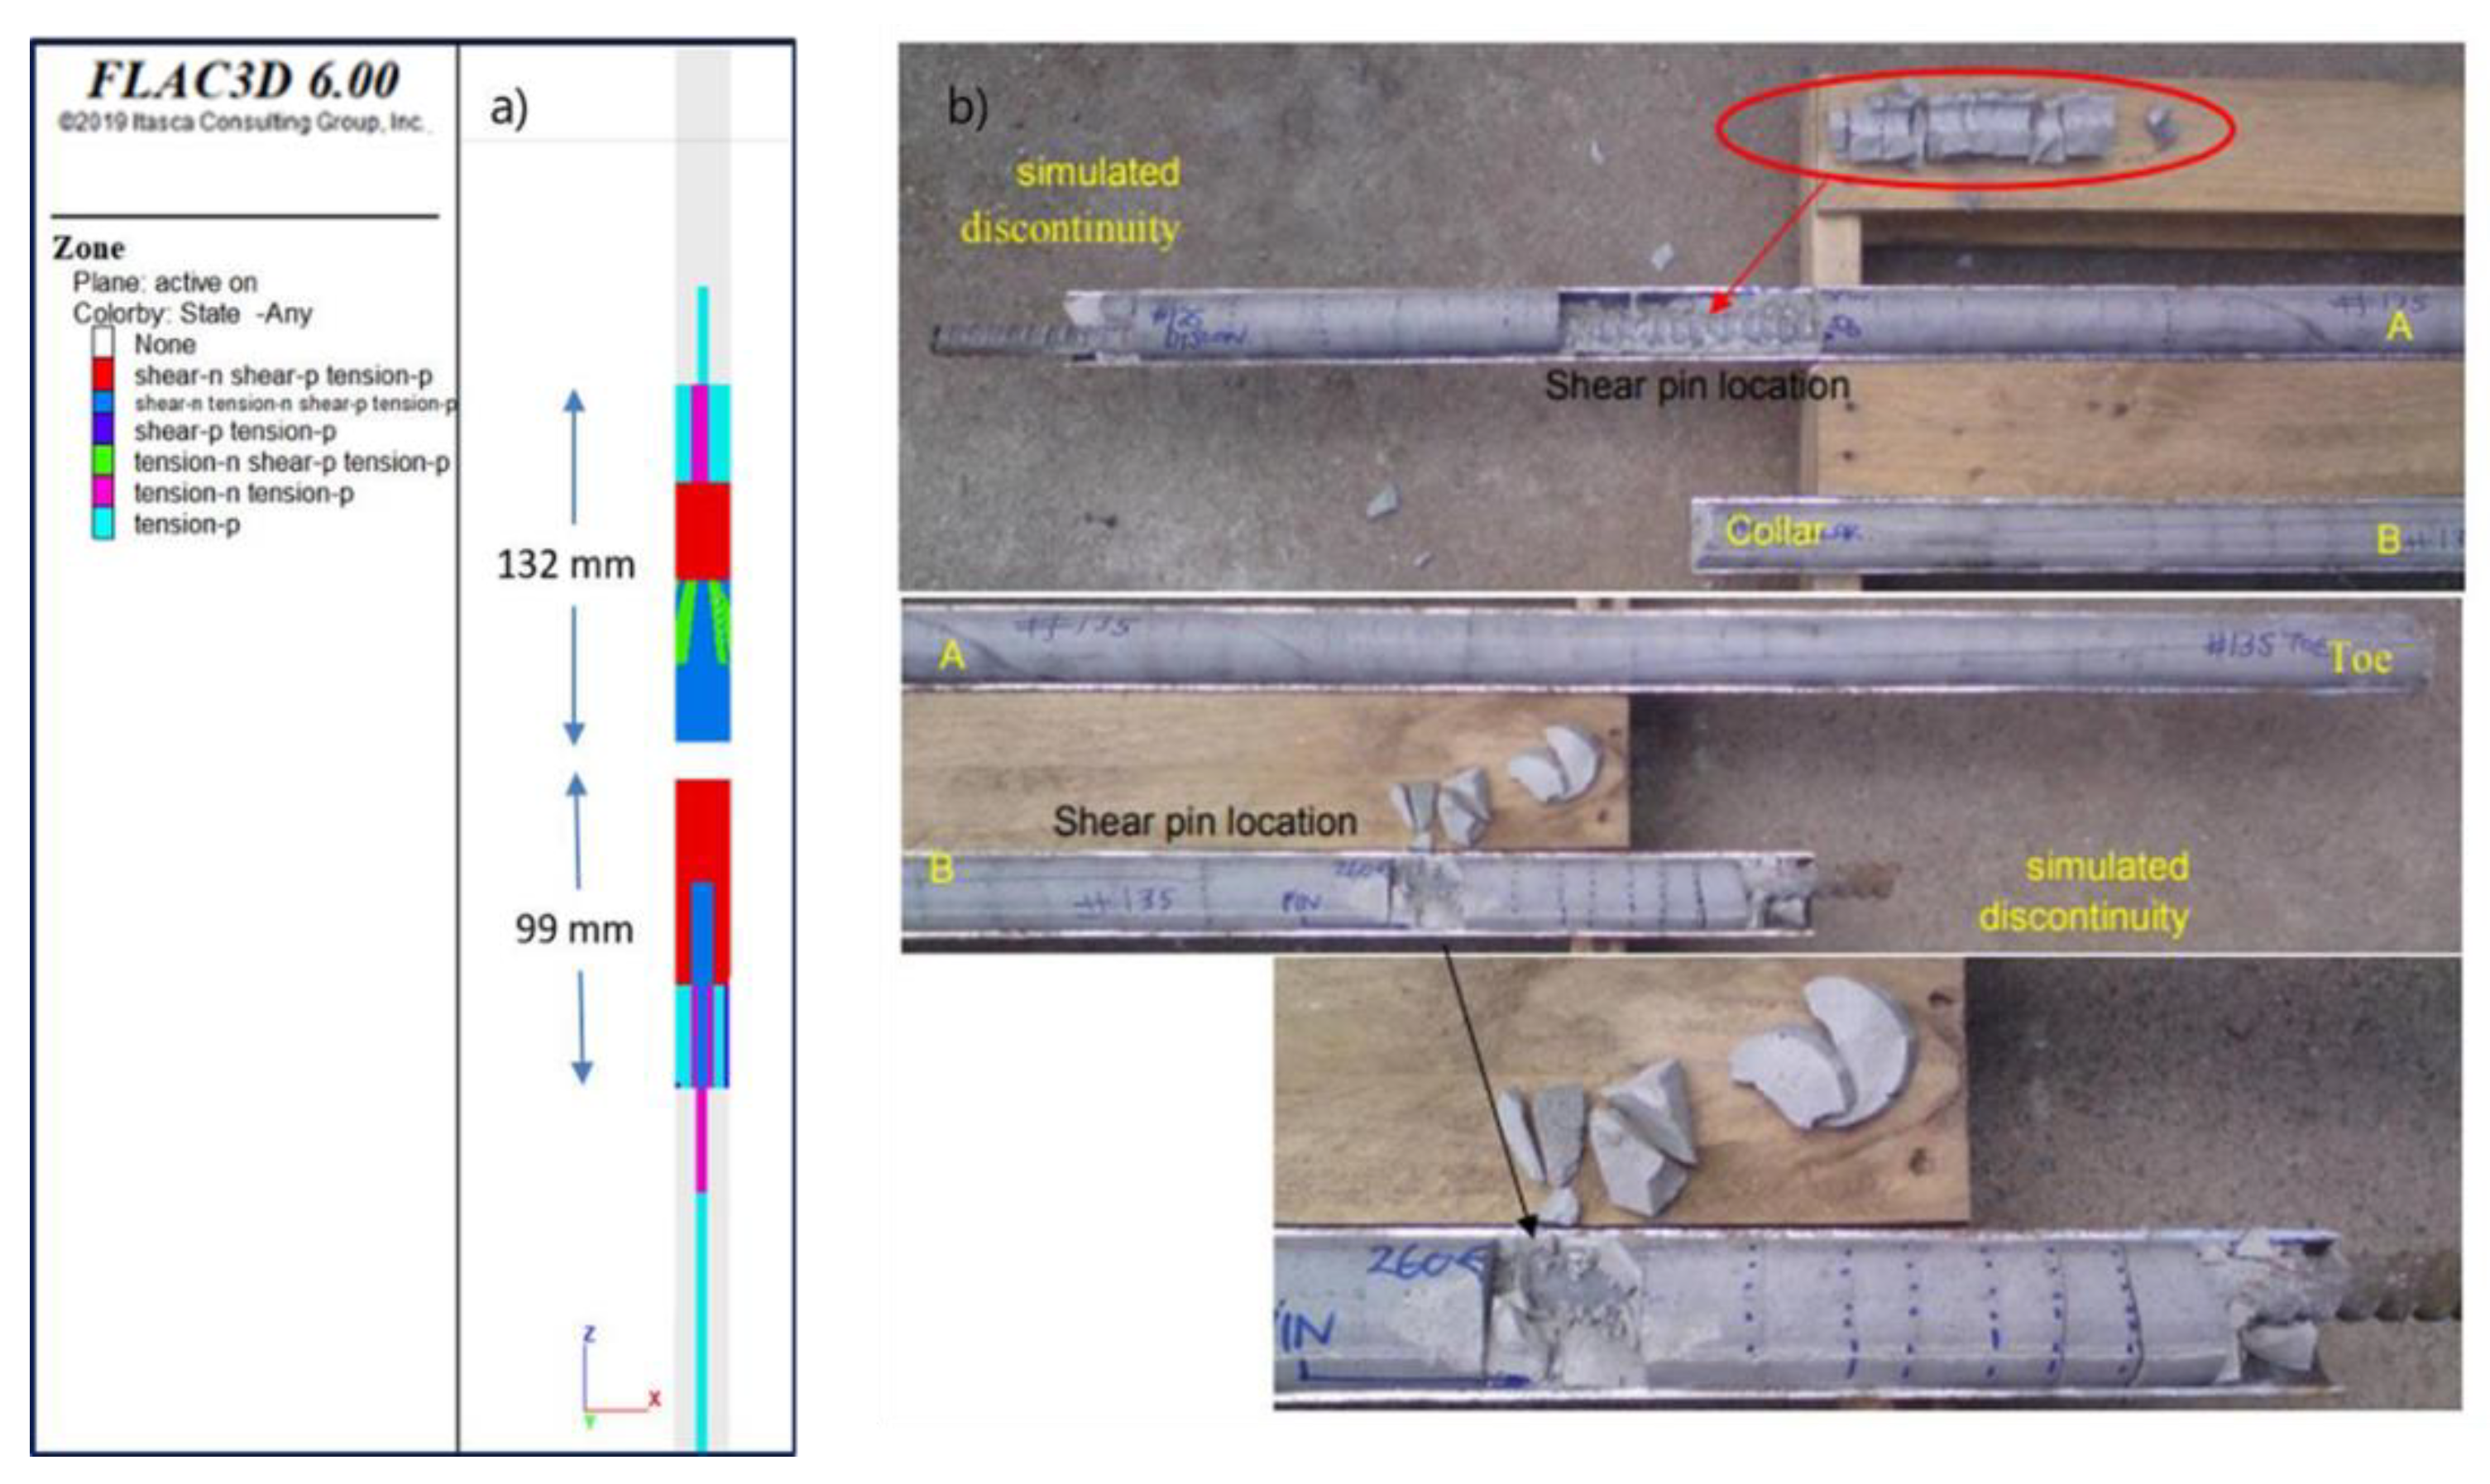
In
Figure 16, grout behavior from simulations is presented in comparison to images of a sample after dynamic testing. In laboratory testing, the simulated standard boreholes included shear pins installed through the pipe wall penetrating approximately 5 mm into the grout to minimize or stop grout sliding [
32]. Therefore, in the simulation neither slipping nor gap opening are allowed in the tube-grout interface. As can be observed in
Figure 16b, shear pins were installed as pairs above and below the simulated discontinuity and due to this, the grout around these areas failed.
All available mechanical parameters of grout and steel were considered in the simulations. Results show the model responded as expected according to experience in dynamic conditions, showing failure all around the simulated discontinuity and near the grout bolt interface in the length where the system was less confined.
3. Influence of Varying Parameters on the Dynamic Response of Threadbar
Total bolt length was modified from 3.2 m to 3.0 and 2.3 m. These lengths were chosen based on published results [
33,
34], which allow comparison with the numerical model. The 1 m length for the upper steel tube was maintained in the three scenarios. In
Figure 17 a comparison of the stresses obtained with the new lengths is presented.
Figure 18 shows the bolt response in terms of load vs. displacement for both the model and for laboratory tests. The model results and the laboratory test results show good agreement with a difference of load and displacement measured between curves that does not exceed 5% in any point of the trajectory. Following the validation experiments with bolt length, further validation measures were carried out varying other parameters: Rockbolt diameter, impact mass and steel tube thickness. Model results in terms of load and displacement are presented in
Figure 19.
To model variation in the diameter of the rockbolt, total lengths of 3.2 m and a 2,000 Kg impact mass weight were fixed as inputs. It was observed that both yield strength and stiffness increase with increased diameter. In addition, when displacement and, therefore, deformation were analyzed, a strong inverse relation regarding the diameter was seen.
The effect of mass impact variation was noticeable only in terms of total displacement of the rock bolt such that the larger the mass, the greater the displacement. Steel tube thickness was also seen to have a strong influence on rock stiffness but less influence on rockbolt deformation. For the last analyses, 3.2 m rockbolt length and 22 mm diameter were fixed.
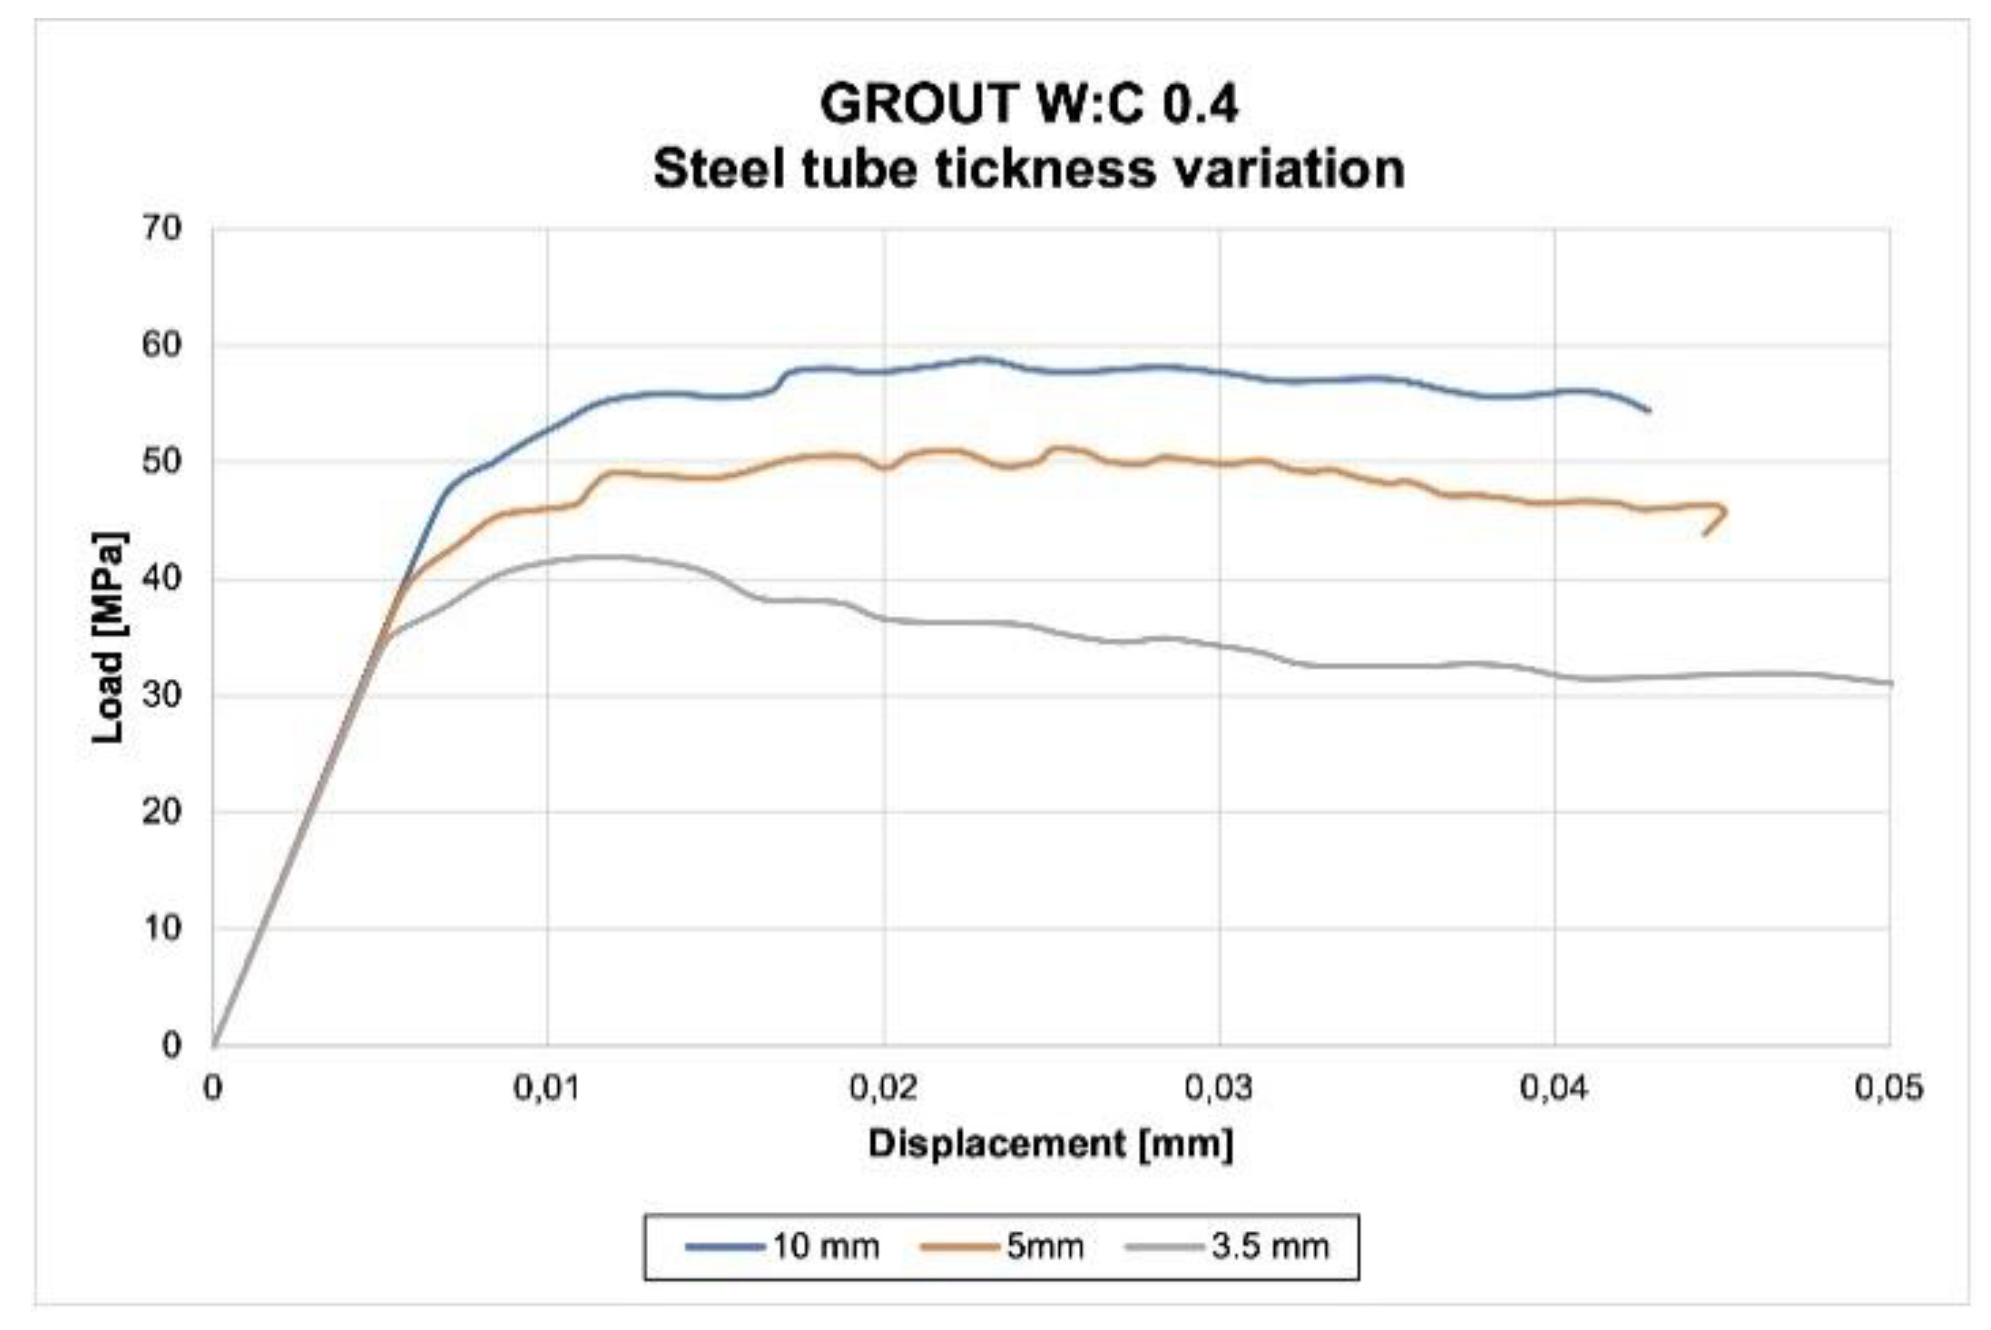
After evaluating the above parametric analysis, it was found that grout response was strongly influenced by the variation of the steel tube thickness, as confinement is directly related with the inside and outside diameters of the pipe [
13]. Modeling results are presented in
Figure 20, where grout yield load is increased as thickness increases while displacement has the contrary response, being greater at less confinement. Total bolt length and impact mass were not found to have an important effect on the mechanical response of grout.
As there are no measurements about the strength and deformation in the grout in dynamic laboratory tests, the model results obtained were compared with the Mohr-Coulomb failure envelope [
17] and the modified failure envelope presented by Shen et al. [
40] in terms of
and
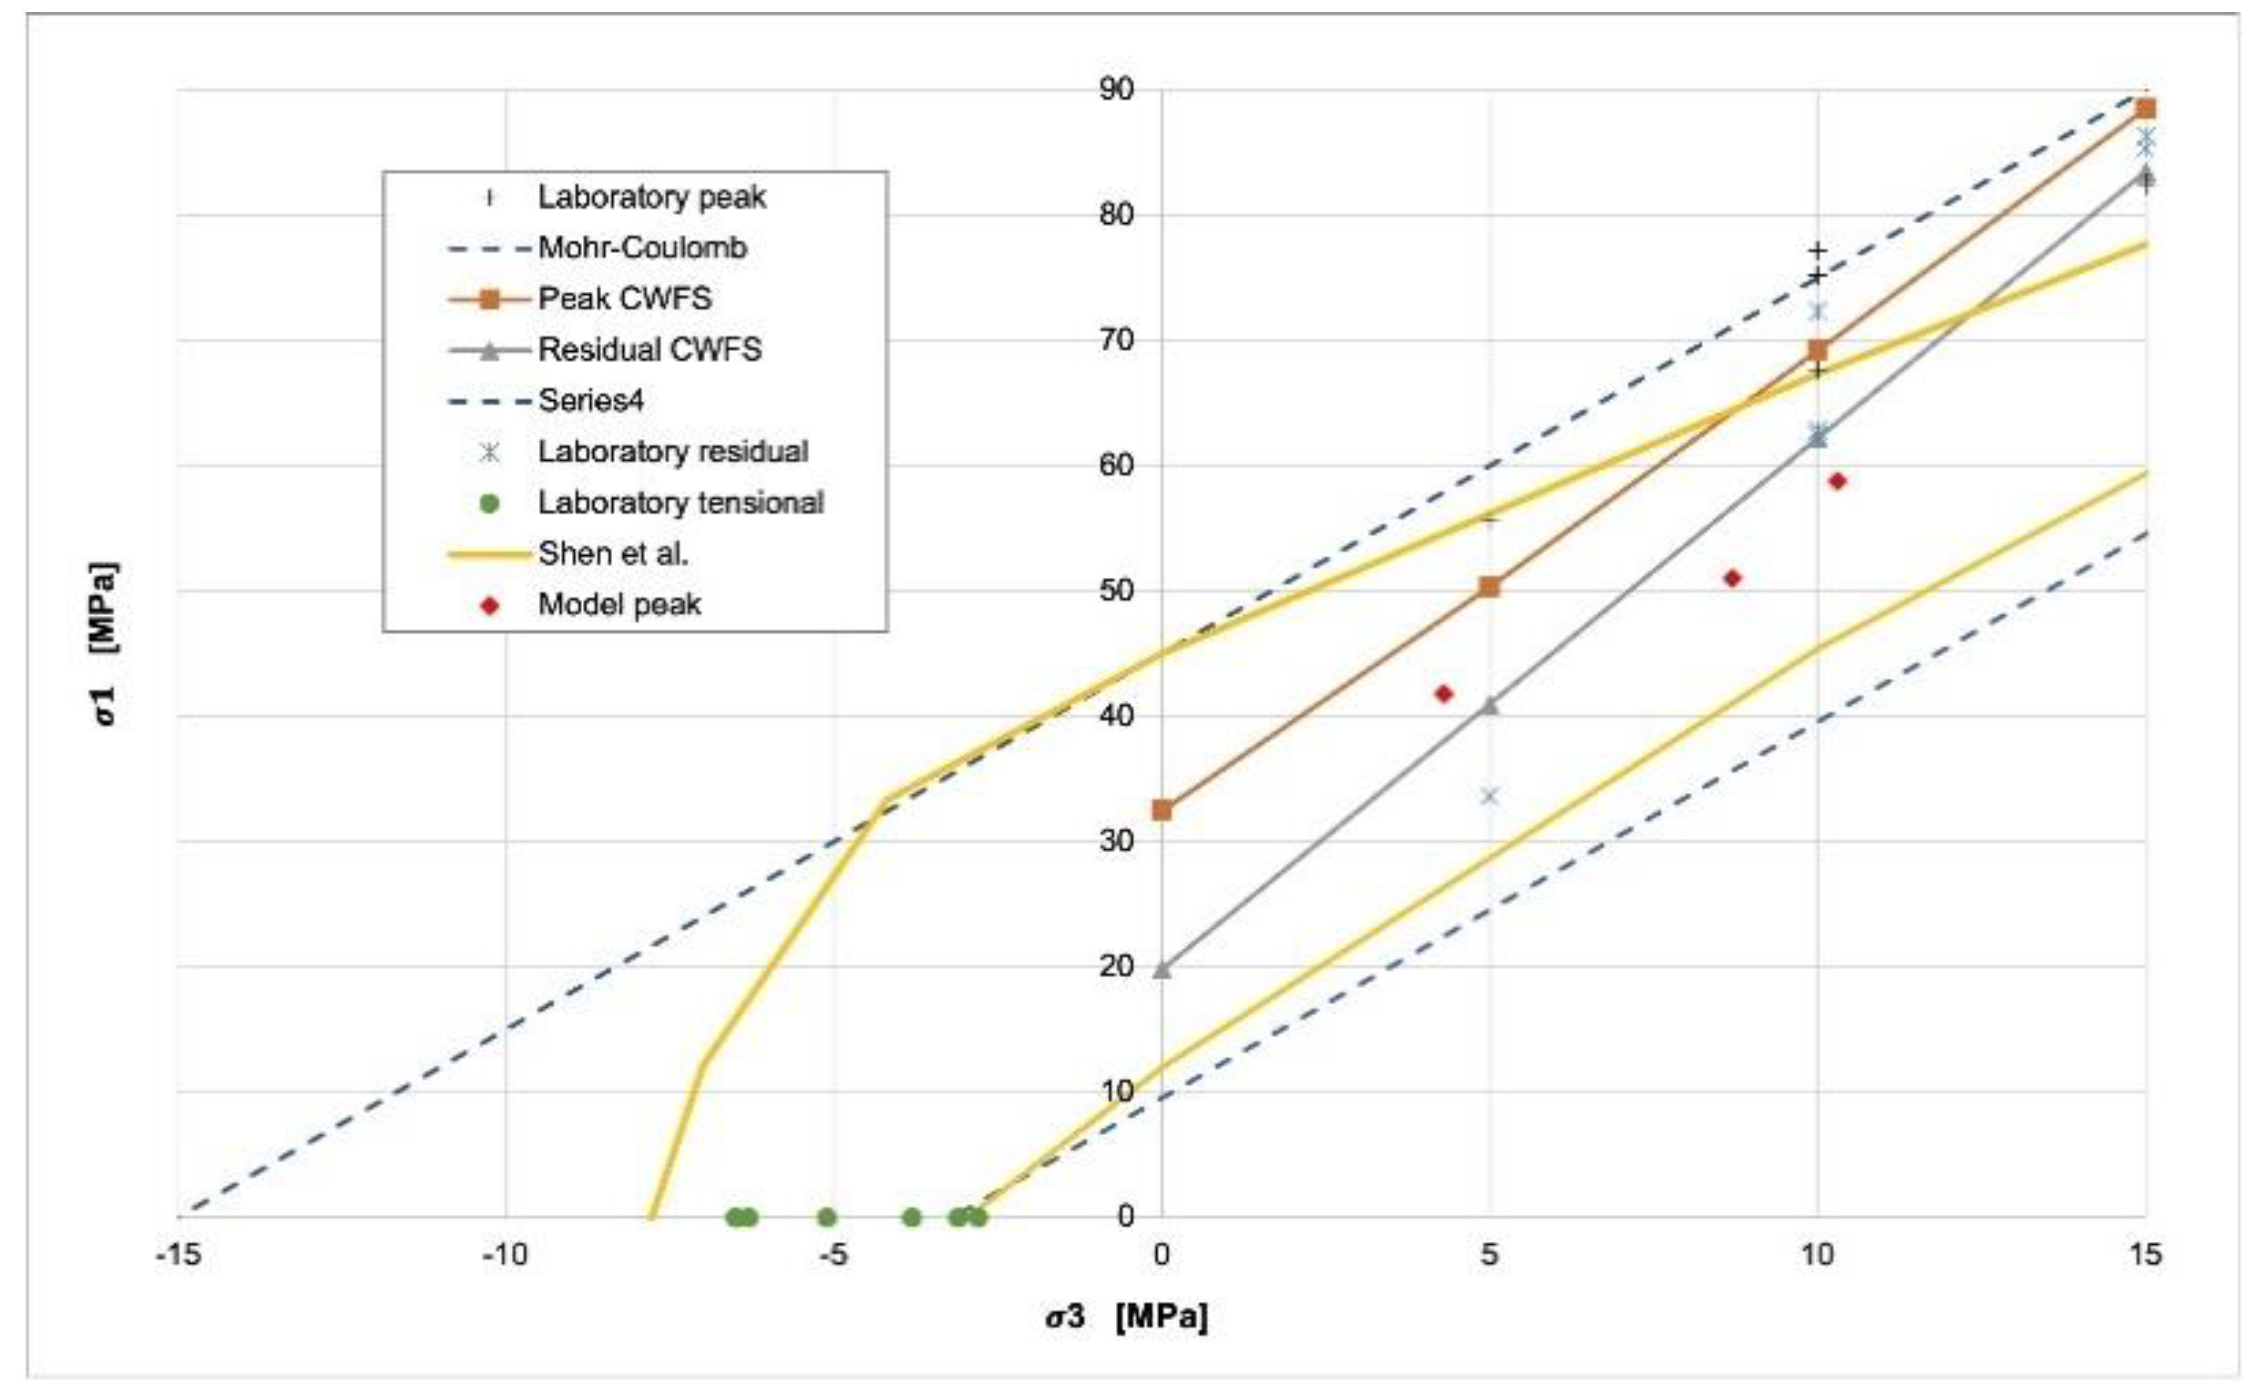
, since the latter criteria consider the variation in terms of the friction and cohesion that the grout presents. In addition to the above,
Figure 21 shows results from laboratory triaxial and tensile tests [
13] and results from CWFS model [
38]. Results were also located in the
Vs.
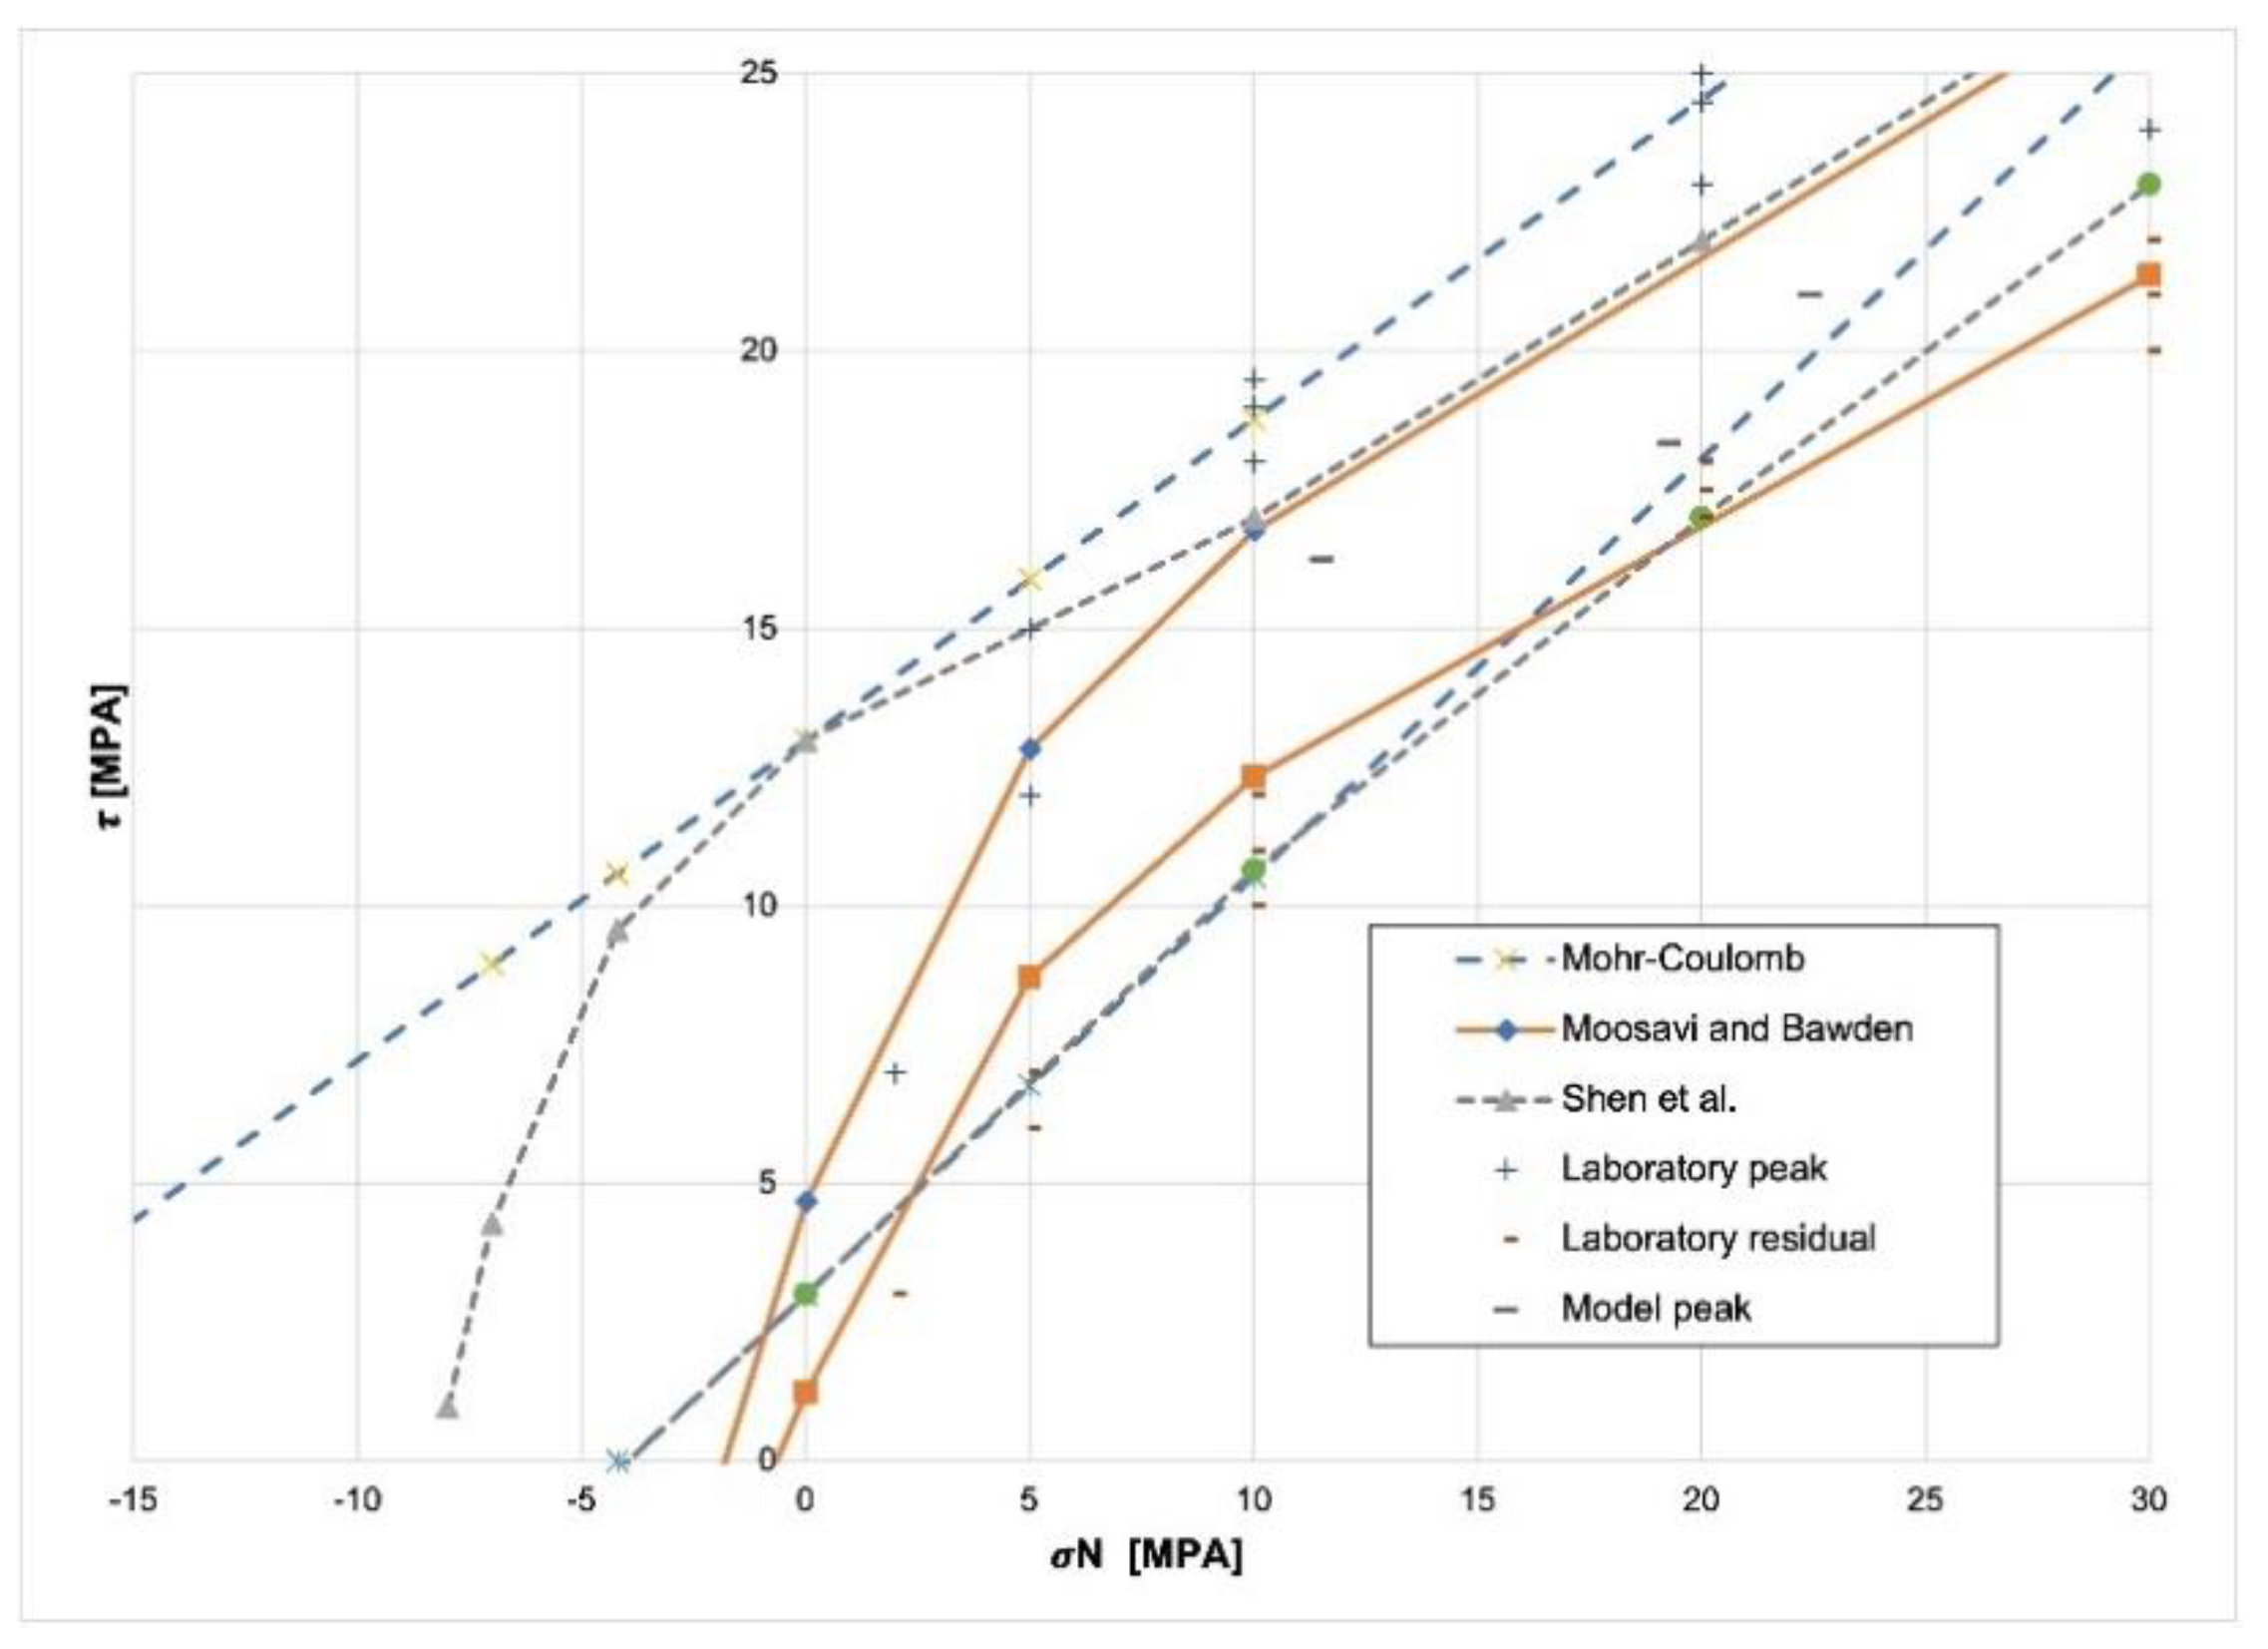
plane. For this analysis, results from direct shear tests and the failure envelope proposed by Moosavi and Bawden [
28] were also compared as shown in
Figure 22. The figure shows strength values that agree with the expected behavior of grout under axial loads.
4. Energy Absorption Capacity
The energy absorption capacity of the reinforcement element is one of the main requirements to be considered when designing a support system [
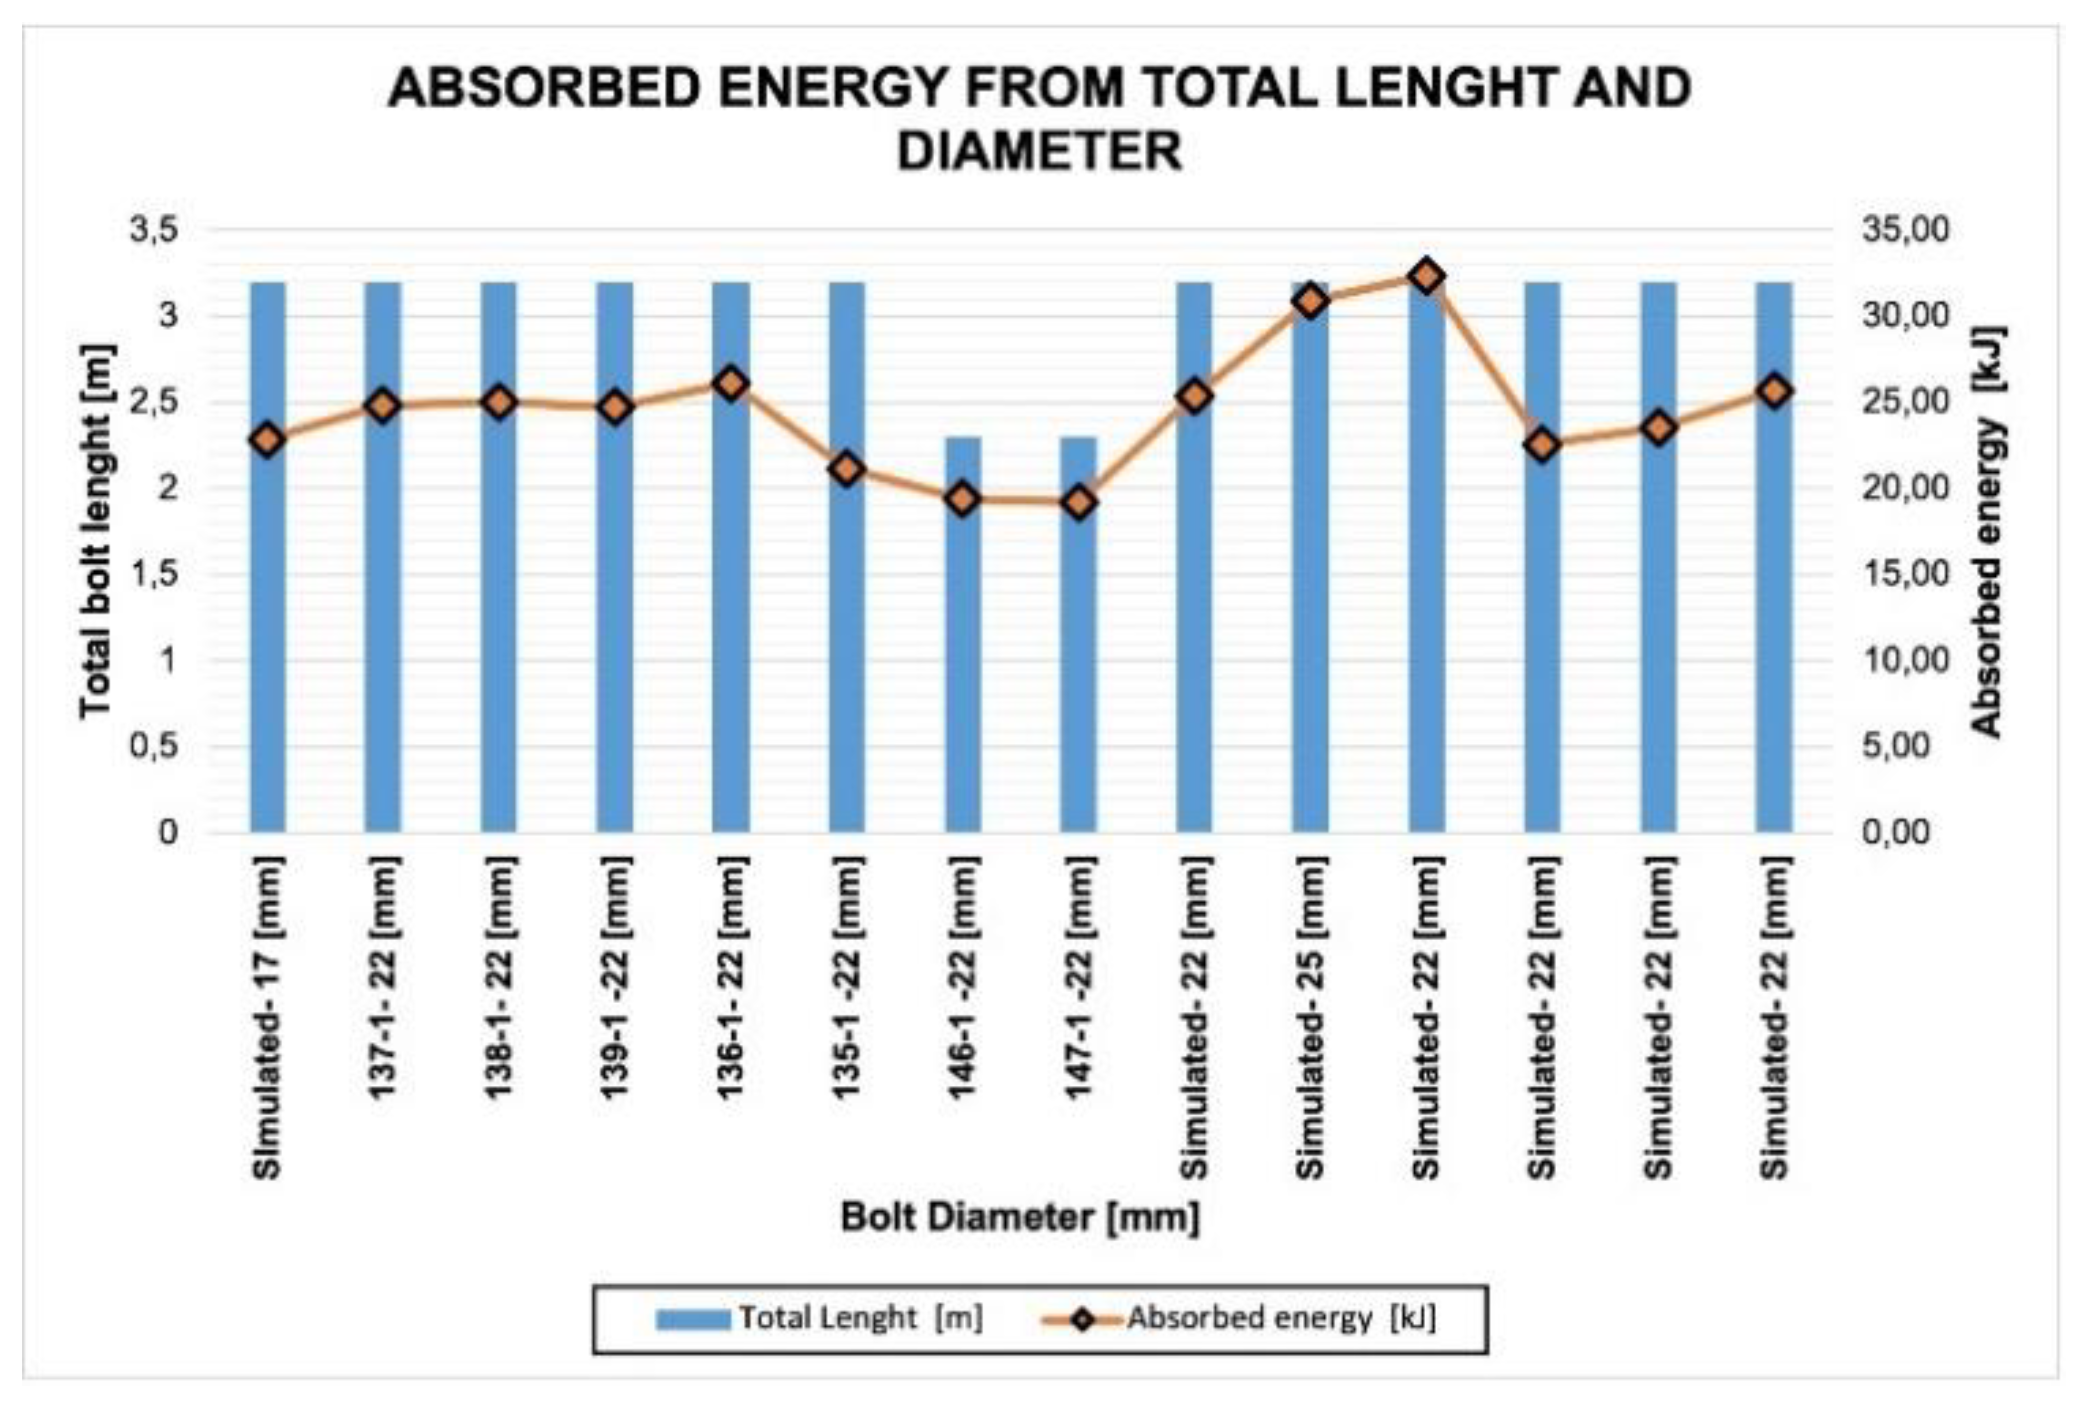
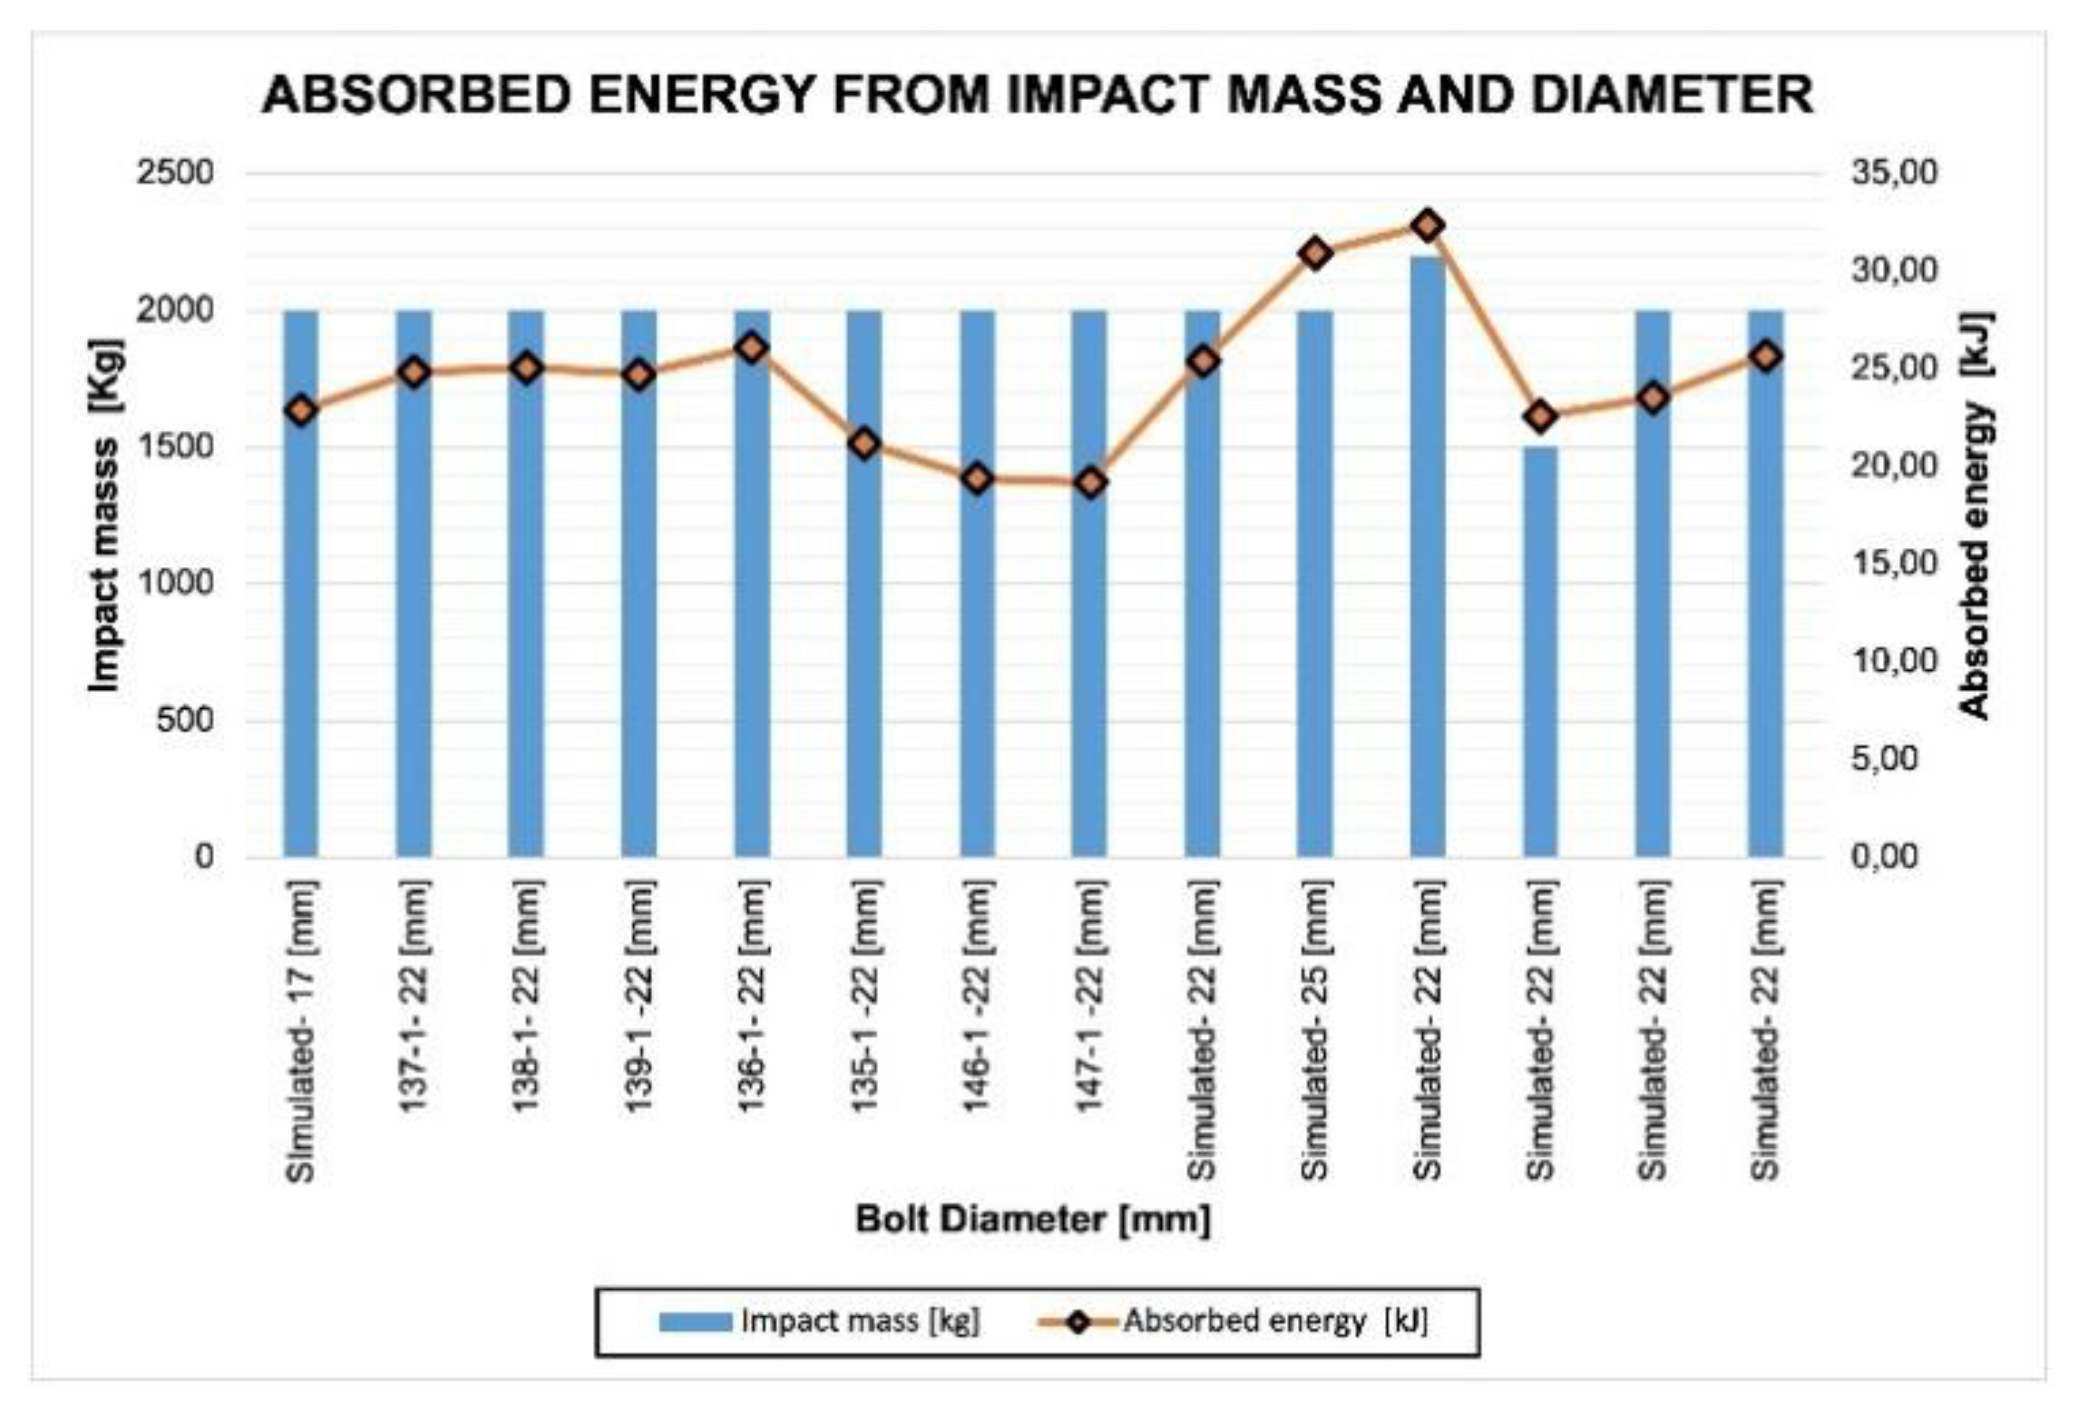
4]. For this reason,
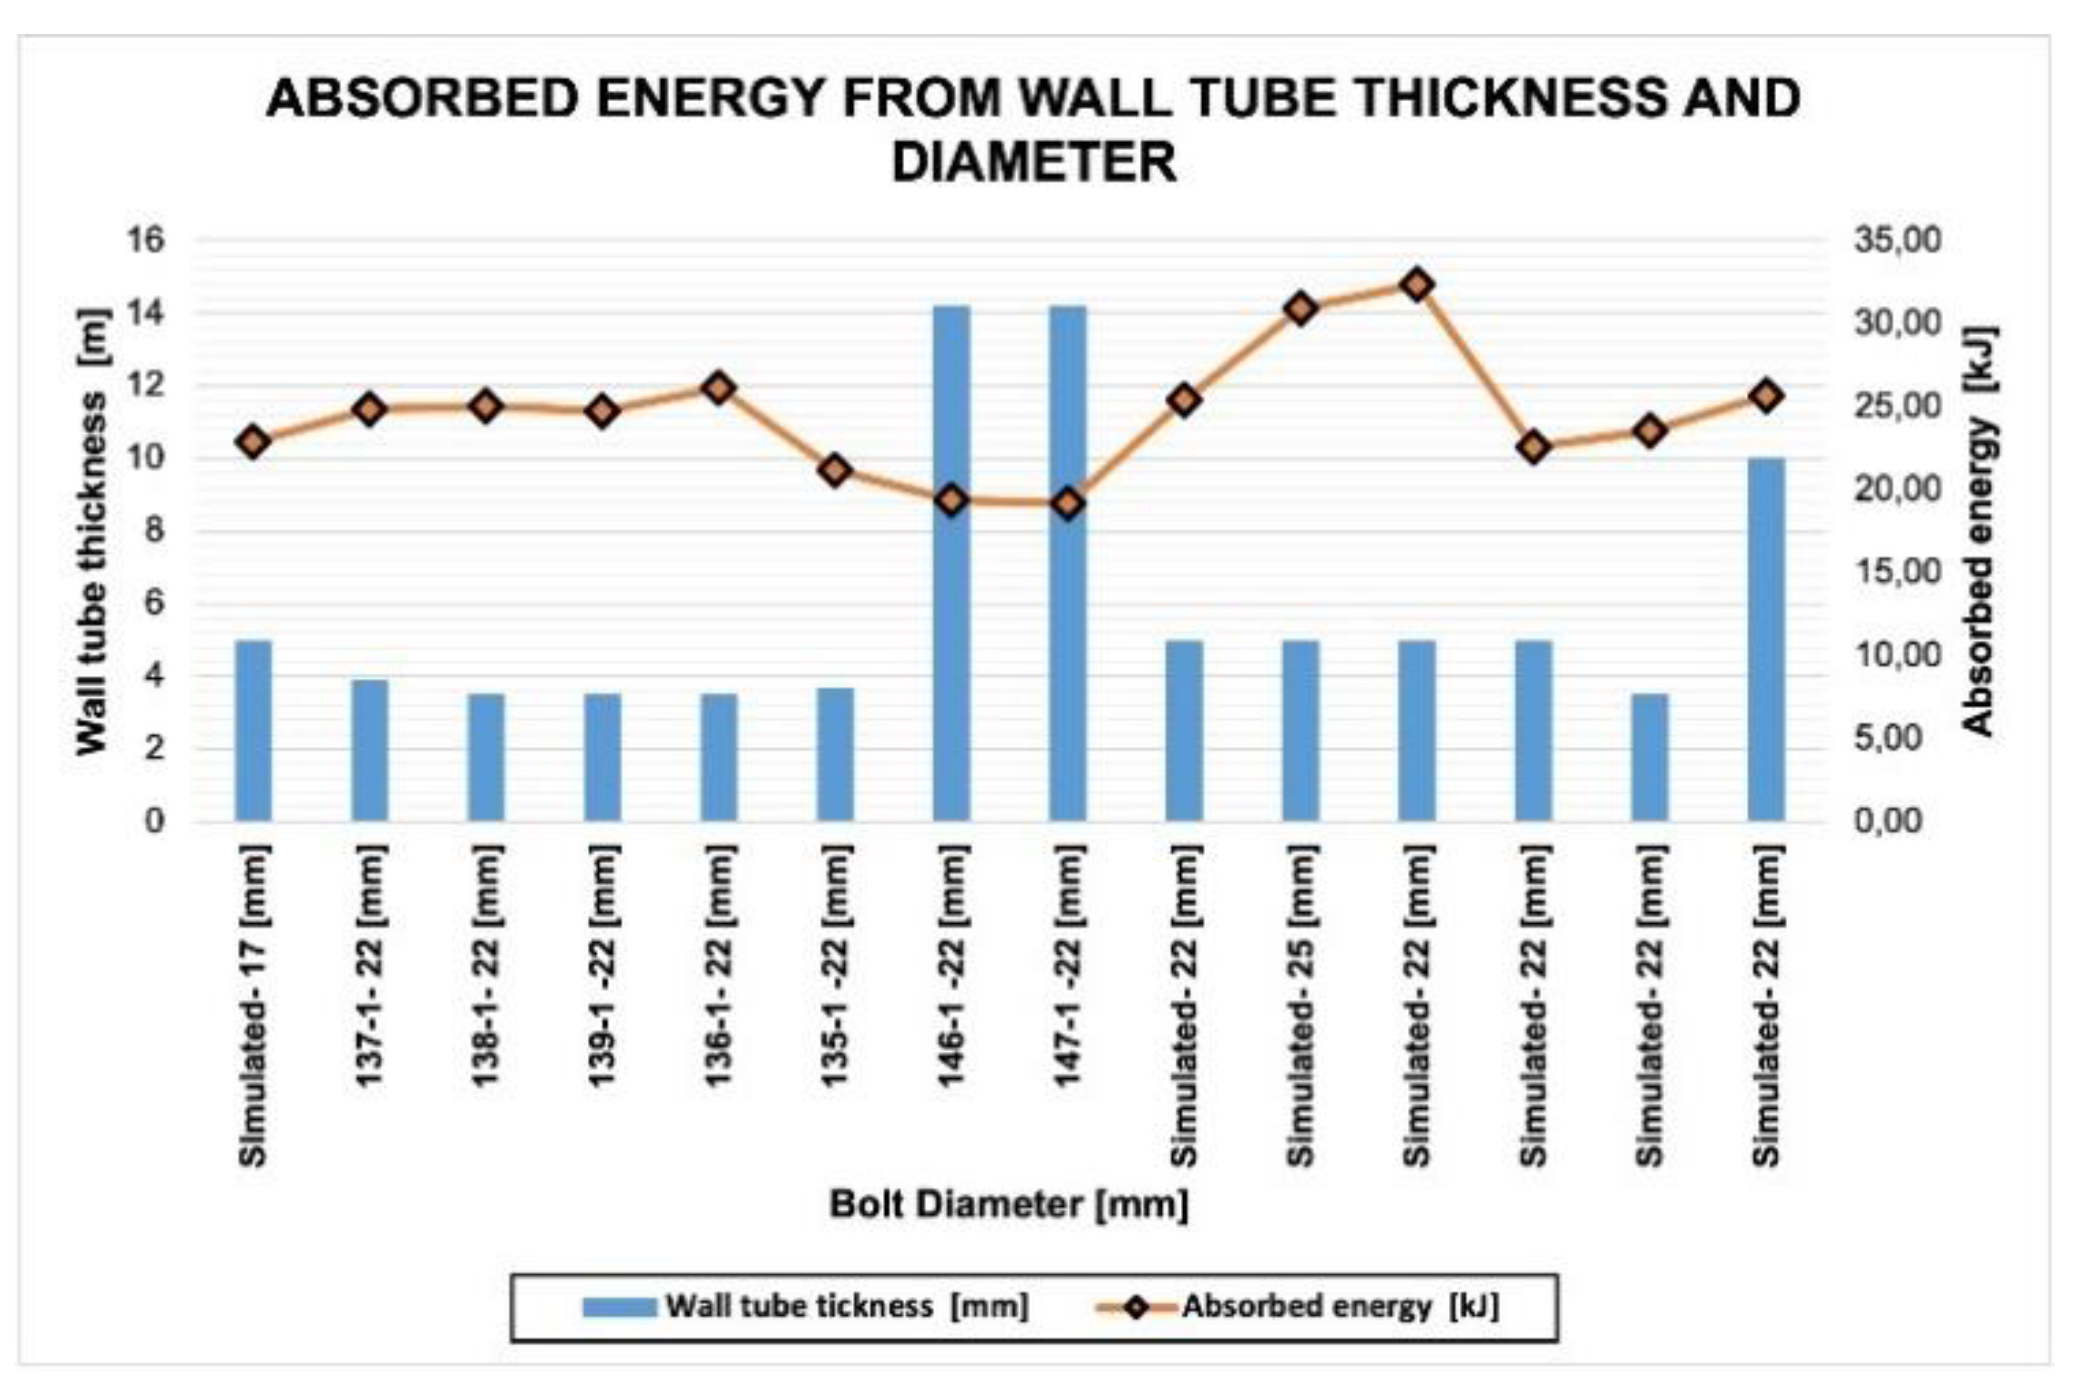
Figure 23,
Figure 24 and
Figure 25 present the energy absorbed by the bolt from simulations varying input parameters compared with energy absorbed in laboratory tests. From this information, it can be seen that impact mass and rockbolt total length are the parameters that most influence the energy absorption capacity of the bolt.
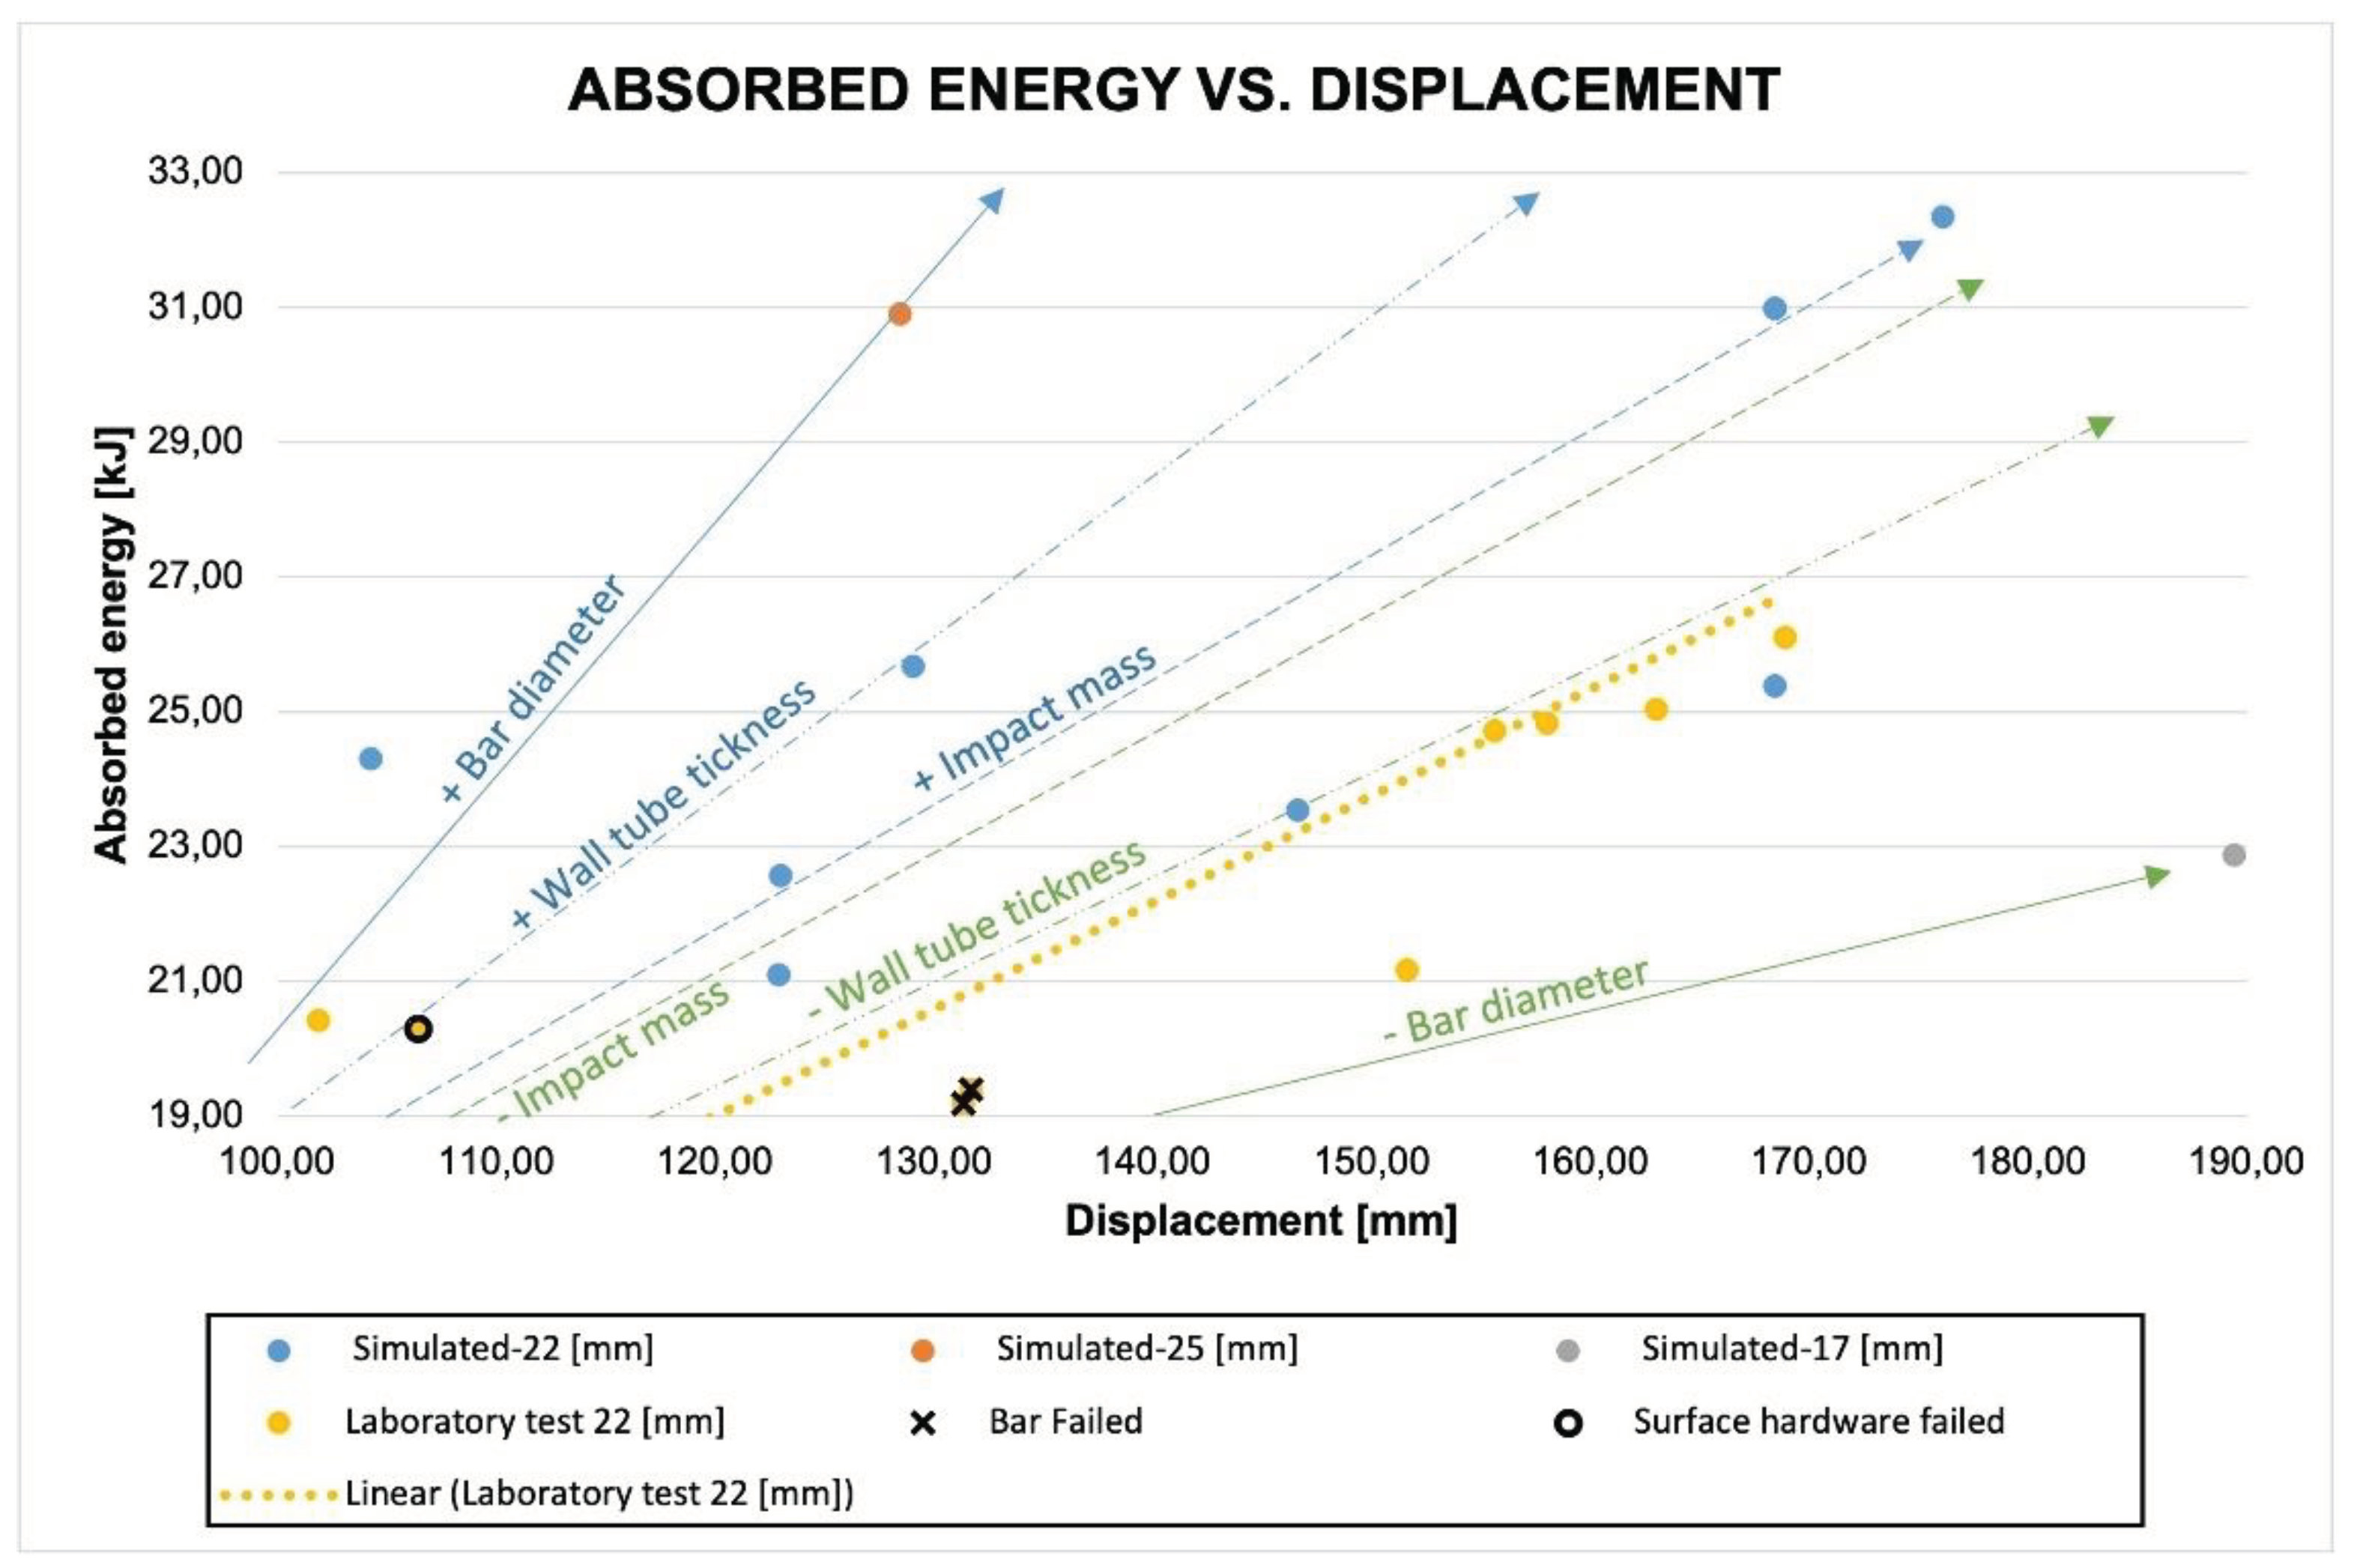
Figure 26 is a compilation of results from drop tests and simulations, in which the total energy absorbed is plotted as a function of the displacement. The figure includes data grouped under 3 datasets, represented by different colors. Each dataset represents a variation in the diameter of the bolt and whether it was tested in the laboratory or simulated.
Considering that a wide variety of parameters were tested or simulated, the datasets compiled show some very clear “quasi-linear” trends. The yellow line indicates the behavior tendency for threadbars with 22 mm diameter, 3.2 m length, 2,000 Kg impact mass and 5 mm steel tube thickness in both tests and simulations. The other trend lines indicate how the threadbar responds to the parametric variation implemented in the numerical model. The blue lines show what is observed when the parameters’ values are increased and the green lines when decreased.
A large cloud of data plots is in the area defined between 24 and 32 kJ of total energy absorption and between 150 and 175 mm displacement. This trend of increasing energy with displacement is to be expected as the energy is a result of the load capacity and displacement. In this specific zone of the graph, the data were obtained from the highest mass impact implemented. As shown in
Figure 26, the simulations showed increased bolt displacement as the impact mass increased as would be expected for dynamic loading.
The first half of the graph — energy between 20 and 31 kJ and displacement between 25 and 150 mm — is dominated by results obtained from the implementation of greater bar diameter or greater wall tube thickness. Results showed that total displacement is inversely proportional to these two parameters while load is directly proportional. From this analysis, it can be established that diameter has the greatest influence on bolt energy absorption capacity and stiffness.
5. Conclusions
A model that simulates the behavior of threadbar subjected to dynamic laboratory tests was presented. The model’s configuration was based on the CanMet-MMSL direct impact load test facility and was implemented in FLAC3D software. The same threadbar, grout and steel tube elements tested in the CanMet-MMSL laboratory facility were modelled. Using this model, the role of grout in the overall reinforcement system strength was determined. To achieve this, grout properties of cohesion, friction, and the dilation angle for 0.4 and 0.44 c:w ratio as a function of plastic strain were established. With these requirements, the behavior of grout in simulations of its response to triaxial load but also in models where the grout is a fundamental part of a fortification system was found to approximate well with what has been reported as actual grout behavior. Importantly, these results contradict what has been indicated by some authors who have claimed that the constitutive models available in FLAC3D do not represent the real behavior of the grout under dynamic or static testing of reinforcement elements [
3].
As further evidence of the adequacy of this model, when analyzing the independent response of grout in the simulation of a direct impact test, it was observed that it failed partially along the rockbolt at the expected zones, mainly around the split tube due to the mechanical parameters assigned and to low confinement in that region of the tested element. This shows that the constitutive model and parameters chosen are appropriate to describe the grout response including the post failure stage. Also given that the real threadbar geometry (rib pass and form) was implemented in the numerical model, the interaction between the grout and the bolt showed appropriate responses, including grout failure in circumscribed areas at the grout bolt interface. This is due to the loss of cohesion and mechanical interlock of the ribs, which would be the expected outcome in the real situations as modelled here.
When comparing the results of the bolt in dynamic testing with the model results, good agreement was reached when initial stiffness, yield load, ultimate load and maximum displacement were analyzed. It should be noted that the dumping at the final load/deformation stage was exaggerated in the model, although to a lesser extent compared to similar models, but had no relevant influence on the energy absorption capacity of rockbolt.
From the parametric analysis can be concluded that the impact mass has a strong influence in the increase of the displacement of the bolt, while the larger the diameter of the bar, the expected displacement is less and the absorbed energy increases. On the other hand, when the thickness of the confining tube decreases, the displacement of the bar increases and the energy absorbed is lower.
Because laboratory testing is expensive and time consuming, the success of this model represents an interesting advance in terms of preliminary exploration before more in-depth laboratory dynamic testing is undertaken. The application of modelling with careful attention to the simulation parameters can save time and money, and further exploration of this type of modelling is an attractive area for future research. Furthermore, given the increasing depths expected in future mining projects, models and simulations such as those described here should be useful when designing threadbar with increasing capacities for energy absorption.
Acknowledgments
This study was sponsored by the basal CONICYT/PIA Project AFB220002 of Advanced Mining Technology Center (AMTC).
Conflicts of Interest
The authors confirm that there are no known conflicts of interest associated with this publication and there has been no significant financial support for this work that could have influenced its outcome.
References
- Alejano, L.R.; Alonso, E. Considerations of the dilatancy angle in rocks and rock masses. International Journal of Rock Mechanics and Mining Sciences 2005, 42, 481–507. [Google Scholar] [CrossRef]
- Aziz, N.I.; Jalalifar, H. Experimental and numerical study of double shearing of bolt under confinement. In Proceedings of the 26th International Conference on Ground Control in Mining. Morgantown. WV. USA. 2007 pp. 242–249. [Google Scholar]
- Bin, L.; Taiyue, Q.; Wang, Z.; Longwei, Y. Back analysis of grouted rock bolt pullout strength parameters from field tests. Tunnelling and underground space technology 2012, 28, 345–349. [Google Scholar] [CrossRef]
- Cai, M.; Kaiser, P. Capacity of rock support components. In: Rockburst Support Reference Book. Rockburst Phenomenon and Support Characteristics 2018, pp. 123–157.
- Chen, Y.; Li, C.C. Experimental and three-dimensional numerical studies of the anchorage performance of rock bolts. In Proceedings of the 13th ISRM International Congress of Rock Mechanics. 2015. OnePetro. [Google Scholar]
- Crompton, B.; Berghorst, A.; Knox, G.; Mining, N.C. A new dynamic test facility for support tendons. Australian Centre for Geomechanics Newsletter. 2018. 47.
- Den Hartog J. P. Mechanical Vibrations. New York: Dover Publications. 1985. Retrieved October 4 2023. 2023.
- Doucet, C.; Gradnik, R. Recent development with the Roofex bolt. In Proceedings of the 5th International Seminar on Deep and High Stress Mining. Australian Centre for Geomechanics. Santiago; 2010; pp. 353–366. [Google Scholar]
- Doucet, C.; Voyzelle, B. Technical Data Sheets Revised September 2012. Ottawa, Canada.
- Ferrero, A.M. The shear strength of reinforced rock joints. International Journal of Rock Mechanics and Mining Sciences & Geomechanics. 1995, 32, 595–605. [Google Scholar]
- Gao, F.; Stead, D.; Kang, H. Numerical simulation of squeezing failure in a coal mine roadway due to mining-induced stresses. Rock Mechanics and Rock Engineering 2015, 1635–1645. [Google Scholar] [CrossRef]
- Graselli, G. 3D behaviour of bolted rock joints: experimental and numerical study. International Journal of Rock Mechanics and Mining Sciences 2005, 42, 13–24. [Google Scholar] [CrossRef]
- Hyett, A.J.; Bawden, W.F.; Reichert, R.D. The effect of rock mass confinement on the bond strength of fully grouted cable bolts. International journal of rock mechanics and mining sciences & geomechanics 1992, 29, 503–524. [Google Scholar]
- Itasca Consulting Group. User’s Manual of FLAC3D. 2012. (Structural Elements).
- Jalalifar, H. & Aziz, N. Numerical Simulation of Fully Grouted Rock Bolts. 2012. [CrossRef]
- Jiang, Y.; Li, B.; Yamashita, Y. Simulation of cracking near a large underground cavern in a discontinuous rock mass using the expanded distinct element method. International Journal of Rock Mechanics and Mining Sciences 2009, 46, 97–106. [Google Scholar] [CrossRef]
- Labuz, J. & Zang, A. Mohr-coulomb failure criterion. The ISRM Suggested Methods for Rock Characterization, Testing and Monitoring: 2007- 2014, 2015, 227–231. [Google Scholar]
- Li, B.; Qi, T.; Wang, Z.Z.; Yang, L. Back analysis of grouted rock bolt pullout strength parameters from field tests. Tunnelling and Underground Space Technology 2012, 345–349. [Google Scholar]
- Li, C.C.; Doucet, C. Performance of D-bolts under dynamic loading. Rock Mechanics and Rock Engineering 2012, 45, 193–204. [Google Scholar] [CrossRef]
- Li, C.; Hadjigeorgiou, J.; Mikula, P.; Knox, G.; Darlington, B.; Royer, R.; Pytlik, A.; Hosp, M. Performance of identical rockbolts tested on four dynamic testing rigs employing the direct impact method. Journal of Rock Mechanics and Geotechnical Engineering 2021, 13. [Google Scholar] [CrossRef]
- Charlie, Li.; Hadjigeorgiou, J.; Mikula, P.; Knox, G.; Darlington, B.; Royer, R.; Pytlik, A.; Hosp, M. Performance of identical rockbolts tested on four dynamic testing rigs employing the direct impact method. Journal of Rock Mechanics and Geotechnical Engineering 2021, 13, 745–754. [CrossRef]
- Li, L.; Hagan, P.C.; Saydam, S.; Hebblewhite, B.; Zhang, C. A laboratory study of shear behaviour of rockbolts under dynamic loading based on the drop test using a double shear system. Rock Mechanics and Rock Engineering 2019, 52, 3413–3429. [Google Scholar] [CrossRef]
- Ma, S.; Nemcik, J.; Aziz, N. Simulation of fully grouted rockbolts in underground roadways using FLAC2D. Canadian Geotechnical Journal 2014, 51, 911–920. [Google Scholar] [CrossRef]
- Ma, S.; Nemcik, J.; Aziz, N.; Zhang, Z. Numerical Modeling of Fully Grouted Rockbolts Reaching Free-End Slip. International Journal of Geomechanics 2015, 16, 04015020–10. [Google Scholar] [CrossRef]
- Malmgren, L.; Nordlund, E. Interaction of shotcrete with rock and rock bolts—A numerical study. International Journal of Rock Mechanics and Mining Sciences 2008, 45, 538–553. [Google Scholar] [CrossRef]
- Malvar, L.J.; Crawford, J.E. Dynamic increase factors for steel reinforcing bars, in: Proceedings of the 28th Department of Defense Explosives Safety Board Seminar, Department of Defense Explosives Safety Board, 1998, Orlando, Florida.
- Marambio, E.; Vallejos, J.A.; Burgos, L.; Gonzalez, C.; Castro, L.; Saure, J.P.; Urzua, J. Numerical modelling of dynamic testing for rock reinforcement used in underground excavations. In Proceedings of the Fourth International Symposium on Block and Sublevel Caving. Australian Centre for Geomechanics; 2018; pp. 767–780. [Google Scholar]
- Moosavi, M., Bawden, W.F. Shear strength of Portland cement grout. Cement and Concrete Composites 25, 2003, pp. 729–735.
- Nemcik, J.; Ma, S.; Aziz, N.; Ren, T.; Geng, X. Numerical modelling of failure propagation in fully grouted rock bolts subjected to tensile load. International Journal of Rock Mechanics and Mining Sciences, 2014, 71, 293–300. [Google Scholar] [CrossRef]
- Nilsson, C. Modelling of dynamically loaded shotcrete, 2009.
- Ortlepp, W., Swart, A. Extended use of the Savuka dynamic test facility to improve material and analytical technology in deep-level stope support, 2012, SIMRAC GAP Report 818.
- Villaescusa, E.; Thompson, A.G.; Player, J. Dynamic Testing of Rock Reinforcement Systems. Proceedings of the 6th International Symposium on Ground Support in Mining and Civil Engineering Construction, 2008, Cape Town.
- Player, J., Cordova, M. WASM Dynamic results-Reinforcement. Internal report CODELCO, 2009.
- Player, J.; Thompson, AG.; Villaescusa, E. Dynamic testing of threadbar used for rock reinforcement, 2009.
- Plouffe, M.; Anderson T.; Judge, K. ROCK BOLTS TESTING UNDER DYNAMIC CONDITIONS AT CANMET-MMSL, 2008.
- Rao, S.S. Mechanical Vibrations, 5th ed.; Upper Saddle River: Prentice Hall, 2011. [Google Scholar]
- Rayleigh, J. The Theory of Sound. 2Nd rev. and enl. ed. New York: Dover, 1945.
- Renani, R.; Hossein.; Martin, C.D. Modeling the progressive failure of hard rock pillars. Tunnelling and Underground Space Technology 2018, 74, 71–81. [CrossRef]
- Ruest, M.; Martin, L. FLAC simulation of split-pipe tests on an instrumented cable bolt. In Proceedings of the 104th Annual General Meeting of the Canadian Institute of Mining, Metallurgy and Petroleum. Canadian Institute of Mining, Metallurgy and Petroleum, Montreal. 2002. [Google Scholar]
- Shen, B.; Shi, J.; Barton, N. An approximate nonlinear modified Mohr-Coulomb shear strength criterion with critical state for intact rocks. Journal of Rock Mechanics and Geotechnical Engineering, 1016. [Google Scholar]
- Shreedharan, S.; Kulatilake, P.H. Discontinuum–equivalent continuum analysis of the stability of tunnels in a deep coal mine using the distinct element method. Rock Mechanics and Rock Engineering 2016, 49, 1903–1922. [Google Scholar] [CrossRef]
- St-Pierre, Luc & Hassani, Ferri & Radziszewski, Peter & Ouellet, J. Development of a dynamic model for a cone bolt. International Journal of Rock Mechanics and Mining Sciences 2009, 46, 107–114. [Google Scholar] [CrossRef]
- Vallejos, J.; Marambio, E.; Burgos, L.; Gonzalez, C. Numerical modelling of the dynamic response of threadbar under laboratory-scale conditions. Tunnelling and Underground Space Technology 2020, 100, 103263–10. [Google Scholar] [CrossRef]
- Vardakos, S.; Gutierrez, M.; Barton, N. Back-analysis of Shimizu Tunnel No. 3 by distinct element modeling. Tunnelling and Underground Space Technology 2007, 22, 401–413. [Google Scholar] [CrossRef]
- Wu, R.; Oldsen, J.; Lamothe, M. The Yield-Lok bolt for bursting and squeezing ground support. In Proceedings of the 5th Int. Seminar on Deep and High Stress Mining. Australian Centre for Geomechanics, Santiago, Chile; 2012; pp. 301–308. [Google Scholar]
- Xie, S.; Shao, J.; Burlion, F. Experimental study of mechanical behaviour of cement paste under compressive stress and chemical degradation. Cement and Concrete Research 2008, 38, 1416–1423. [Google Scholar] [CrossRef]
- Tahmasebinia, F.; Zhang, C.; Canbulat, I.; Vardar, O.; Saydam, S. Numerical and analytical simulation of the structural behaviour of fully grouted cable bolts under impulsive loading. International Journal of Mining Science and Technology 2018, 28, 807–811. [Google Scholar] [CrossRef]
Figure 1.
CanMet-MMSL direct impact load test configuration. Modified by St-Pierre, [
41].
Figure 1.
CanMet-MMSL direct impact load test configuration. Modified by St-Pierre, [
41].
Figure 2.
CanMet-MMSL direct impact load test procedure.
Figure 2.
CanMet-MMSL direct impact load test procedure.
Figure 3.
Complete geometry of the proposed numerical model.
Figure 3.
Complete geometry of the proposed numerical model.
Figure 4.
Geometry of the a) threadbar and b) grout implemented in the numerical model.
Figure 4.
Geometry of the a) threadbar and b) grout implemented in the numerical model.
Figure 5.
CWFS model for 0.4 w:c rate grout a) cohesion loss and friction mobilization in terms of the equivalent plastic strain, and b) stress-strain curves under conventional triaxial compression.
Figure 5.
CWFS model for 0.4 w:c rate grout a) cohesion loss and friction mobilization in terms of the equivalent plastic strain, and b) stress-strain curves under conventional triaxial compression.
Figure 6.
CWFS model for 0.44 w:c a) cohesion loss and friction mobilization in terms of the equivalent plastic strain, and b) stress-strain curves under conventional triaxial compression.
Figure 6.
CWFS model for 0.44 w:c a) cohesion loss and friction mobilization in terms of the equivalent plastic strain, and b) stress-strain curves under conventional triaxial compression.
Figure 7.
Peak and residual strength test results fitted to Hoek–Brown failure criteria, laboratory data and CWFS model. (a) 0.4 w:c (b) 0.44 w:c.
Figure 7.
Peak and residual strength test results fitted to Hoek–Brown failure criteria, laboratory data and CWFS model. (a) 0.4 w:c (b) 0.44 w:c.
Figure 8.
Dilatant behavior for cement grout of 0.44 w:c ratio in terms of plastic shear strain. Dilatancy from conventional triaxial test compared with the model proposed by Alejano and Alonso [
1].
Figure 8.
Dilatant behavior for cement grout of 0.44 w:c ratio in terms of plastic shear strain. Dilatancy from conventional triaxial test compared with the model proposed by Alejano and Alonso [
1].
Figure 9.
Complete set of stress - strain curves for different confining pressures compared with lab results for a) 0.4 w:c and b) 0.44 w:c.
Figure 9.
Complete set of stress - strain curves for different confining pressures compared with lab results for a) 0.4 w:c and b) 0.44 w:c.
Figure 10.
Contours of shear-strain rate and failure state on the grout sample for conventional triaxial test for 0.4 W:C grout simulations.
Figure 10.
Contours of shear-strain rate and failure state on the grout sample for conventional triaxial test for 0.4 W:C grout simulations.
Figure 11.
Cross section of the simulation of the threadbar inserted in grout and steel tube.
Figure 11.
Cross section of the simulation of the threadbar inserted in grout and steel tube.
Figure 12.
Solve scheme in FLAC3D Software; from left to right three temporal stages of the numerical model [
43].
Figure 12.
Solve scheme in FLAC3D Software; from left to right three temporal stages of the numerical model [
43].
Figure 13.
Principal maximum stress at split tube zone for rockbolt and grout.
Figure 13.
Principal maximum stress at split tube zone for rockbolt and grout.
Figure 14.
Minimum principal stress at split tube zone for rockbolt and grout.
Figure 14.
Minimum principal stress at split tube zone for rockbolt and grout.
Figure 15.
Load vs. Displacement curves from dynamic testing and numerical modeling of threadbar.
Figure 15.
Load vs. Displacement curves from dynamic testing and numerical modeling of threadbar.
Figure 16.
a) FLAC3D Grout zone state b) Grout state after dynamic testing, taken from Player & Cordova [
33].
Figure 16.
a) FLAC3D Grout zone state b) Grout state after dynamic testing, taken from Player & Cordova [
33].
Figure 17.
Stresses for 2.3 and 3.0 m length rockbolt model.
Figure 17.
Stresses for 2.3 and 3.0 m length rockbolt model.
Figure 18.
Load vs displacement curves for various rockbolt lengths. Numerical model and test results.
Figure 18.
Load vs displacement curves for various rockbolt lengths. Numerical model and test results.
Figure 19.
Load vs. Displacement curves for parametric analysis.
Figure 19.
Load vs. Displacement curves for parametric analysis.
Figure 20.
Load vs. Displacement curves for various steel tube thickness.
Figure 20.
Load vs. Displacement curves for various steel tube thickness.
Figure 21.
Grout vs for various confining loads.
Figure 21.
Grout vs for various confining loads.
Figure 22.
Grout vs. for various confining loads.
Figure 22.
Grout vs. for various confining loads.
Figure 23.
Energy absorbed in terms of total length and diameter.
Figure 23.
Energy absorbed in terms of total length and diameter.
Figure 24.
Energy absorbed in terms of impact mass and diameter.
Figure 24.
Energy absorbed in terms of impact mass and diameter.
Figure 25.
Energy absorbed in terms of steel tube thickness and diameter.
Figure 25.
Energy absorbed in terms of steel tube thickness and diameter.
Figure 26.
Trends from Absorbed Energy vs Displacement. The symbol (+) indicates an increase in the magnitude of the mentioned parameter and (-) indicates a decrease in the magnitude of the mentioned parameter.
Figure 26.
Trends from Absorbed Energy vs Displacement. The symbol (+) indicates an increase in the magnitude of the mentioned parameter and (-) indicates a decrease in the magnitude of the mentioned parameter.
Table 1.
Threadbar static mechanical properties.
Table 1.
Threadbar static mechanical properties.
| Property |
Value |
| Bar diameter |
22 mm |
| Yield limit |
167.258 KN |
| Tensile strength |
440 MPa |
|
Young’s Modulus [E]
|
210 GPa |
|
Poisson`s ratio [v]
|
0.27 |
| Density |
7,850 Kg/m3 |
| Elongation |
10 % |
Table 2.
Estimated parameters of the CWFS model for 0.4 and 0.44 w:c rate grouts. *Values taken from Hyett et al. (1992).
Table 2.
Estimated parameters of the CWFS model for 0.4 and 0.44 w:c rate grouts. *Values taken from Hyett et al. (1992).
| |
Grout |
| w:c |
0.44 |
0.4 |
|
[MPa]
|
36.12 |
45.92 |
|
[MPa]
|
30.19 |
12.98 |
| E [GPa] |
10 |
10 |
|
0.25 |
0.25 |
|
0.017 |
0.03 |
|
0.005 |
0.006 |
|
[°]
|
21.4 |
24 |
|
[°]
|
28.5 |
37 |
|
[MPa]
|
12 |
10 |
|
[MPa]
|
7.6 |
3 |
|
Density*
|
1.98 |
1.97 |
| Tensile Strength [MPa]* |
3.9 |
3.8 |
Table 3.
Approach and fit coefficients for calculation of dilation angle variation.
Table 3.
Approach and fit coefficients for calculation of dilation angle variation.
| Coefficient |
Value |
|
=0 20 |
|
=3 21 |
|
=5 28 |
|
=10 30 |
| |
|
|
25[mstrain] |
|
20[mstrain] |
|
Disclaimer/Publisher’s Note: The statements, opinions and data contained in all publications are solely those of the individual author(s) and contributor(s) and not of MDPI and/or the editor(s). MDPI and/or the editor(s) disclaim responsibility for any injury to people or property resulting from any ideas, methods, instructions or products referred to in the content. |
© 2024 by the authors. Licensee MDPI, Basel, Switzerland. This article is an open access article distributed under the terms and conditions of the Creative Commons Attribution (CC BY) license (http://creativecommons.org/licenses/by/4.0/).
