1. Introduction
Rail safety inspection has gained significant attention across multiple industries due to past incidents, driving the development and exploration of advanced detection methods and maintenance practices. Ratcheting, occurring within a spacing of 0.8 to 20 mm [
1,
2,
3,
4], may lead to the formation of closely spaced cracks. This process is often initiated by the continuous passage of train wheels over rail tracks, potentially resulting in critical safety hazards.
Eddy current (EC) testing is a widely used non-destructive testing (NDT) technique, distinguished by its capability of identifying surface and subsurface defects within rail without direct contact. This technique can be adapted for delivering instantaneous, real-time feedback and necessitates negligible surface preparation, streamlining the inspection process [1, 5]. However, EC testing has limitations which affect the performance of rail inspection, including reduction of signal and spatial resolution at high lift-off [6, 7]. In response to the inherent limitations, many innovative solutions have been studied.
Li et al. developed an EC system with an increased coil gap to compensate for signal attenuation, allowing for accurate measurement of crack depth and inclination at the working frequency of 17 kHz [
8]. However, large coil gap can lead to reduction of spatial resolution. Xu et al. proposed a differential EC system that can be applied to evaluate surface opening defects up to 8 mm depth with a maximum 15% relative error at a frequency of 60 kHz [
9]. However, the spatial resolution is not quantified as the samples have 100 mm crack spacing.
Kwon et al. proposed a 16-channel eddy current flaw detection system, which works at 300 kHz and lift-off of 1 mm, with high reliability of 1 mm margin of error [
10]. However, maintaining a very low lift-off distance during rail inspection can increase the risk of probe damage or rail surface wear. Blitz et al. used a differential-coil probes for detecting surface cracks in steel with high lift-off, up to 12 mm, while there exist limitations in accurately resolving closely spaced defects, as evidenced by 100 mm crack spacings [
11].
To enhance spatial resolution of signal, Sukhanov et al. presents a visualization technique for small heterogeneities in flat metallic objects using an eddy current sensor. It employs differential and flat spiral coils. The technique improves image resolution via post-processing. Spatial linear filtration and regularization are key to enhancing signal-to-noise ratios. Experimentally, for metallic objects at a 15 mm range, the method led to an increase in reconstructed signal resolution by up to 2.6 times relative to the raw measured data [
12]. The sensor employed is limited to a single channel, necessitating the use of a scanner to comprehensively survey the desired area, which constrains the overall efficiency of the investigation.
Minimizing lift-off effects helps preserve spatial resolution. Meng et al. presented a simplified algorithm. It uses a multifrequency sensor to reduce lift-off impact in eddy current testing. This method tests nonmagnetic coatings on ferromagnetic substrates. It achieves up to 3% accuracy in thickness measurements for lift-offs up to 10 mm [
13]. A significant limitation of using multi-frequency sensors for rail defect detection is their challenge in differentiating signals from various defect types, due to the distinct interactions of each frequency with the substrate. This issue requires complex signal processing for accurate defect identification, increasing computational demands [14, 15]. Additionally, the sensor’s performance at different frequencies can be affected by external factors, including temperature and humidity, complicating the defect detection process.
In this study, a novel multi-channel EC sensor array is produced to examine the cracks on rails. The EC system operates at 200 kHz with a 4-6 mm probe lift-off. The system can obtain data from any combination of the coils pairs, and therefore with flexibility of multiple coil spacings. From measurements, the defects are reconstructed by solving an inverse problem with direct and iterative image reconstruction algorithms. Its capability to accurately identify and map cracks of various depths and intervals is demonstrated. This design effectively balances spatial resolution and lift-off distance, potentially making it suited for future railway inspection applications and can resolve cracks spaced as close as 5 mm.
2. Method
2.1. Measurement Setup for Rail Testing
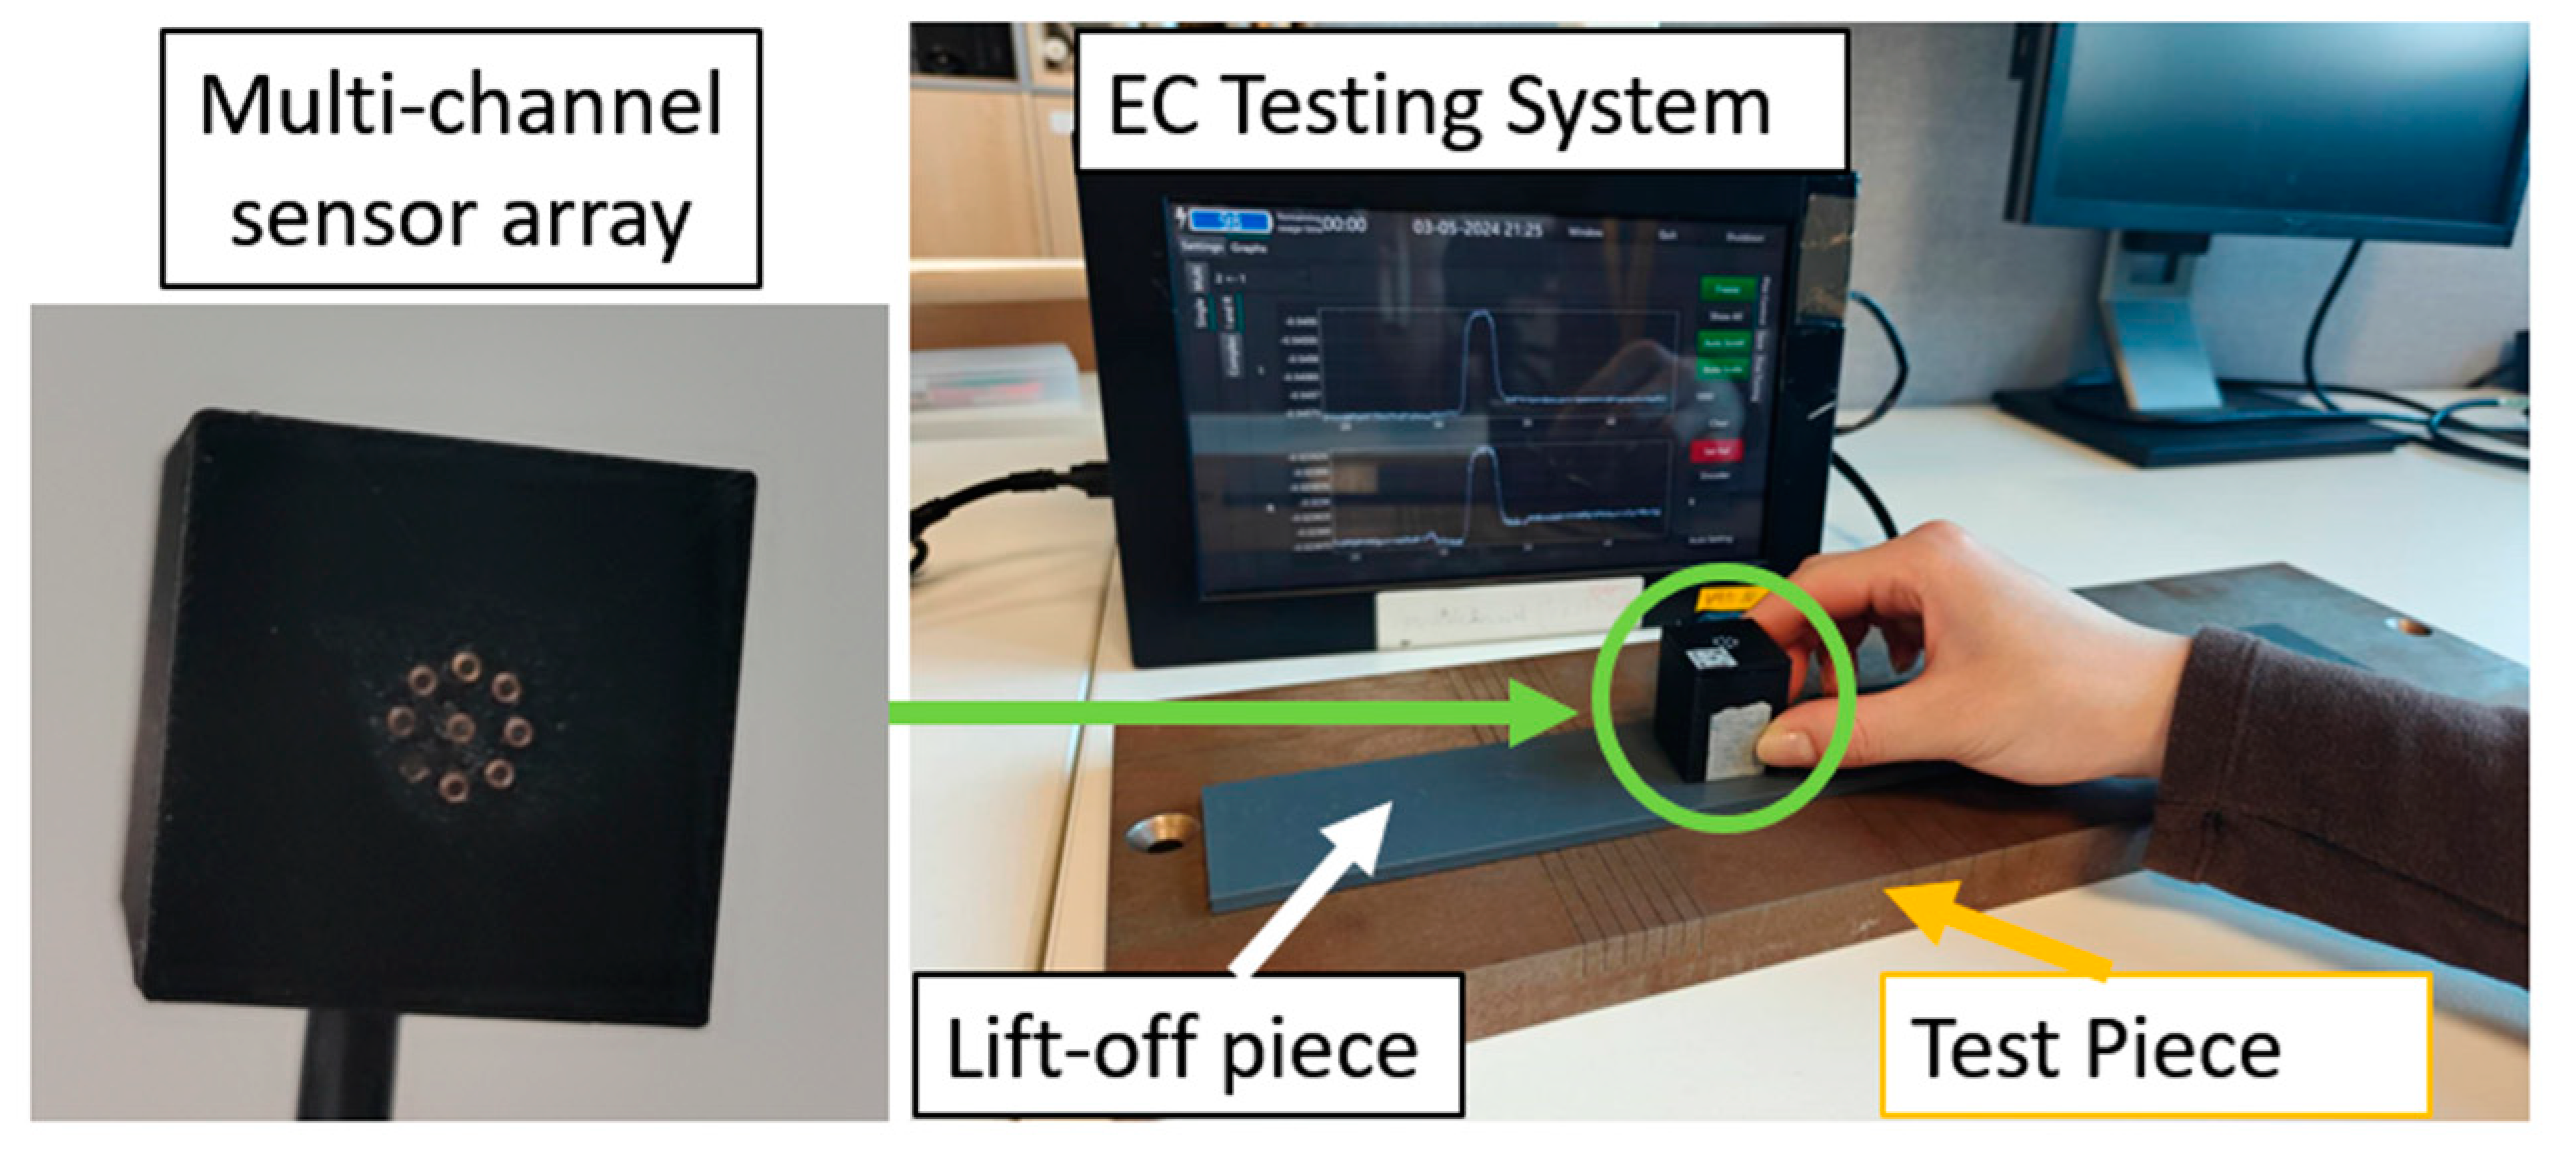
Images of rail crack testing are shown in
Figure 1. The customised multi-channel EC system, previously reported [
16] is employed to acquire the EC probe signals from the coil array. The probe is moved above the testing sample across the cracks illustrated in
Figure 2.
The cracks on rail could have various orientations, depth and space between them. As illustrated in
Figure 2, the observed cracks on the rails can be categorized into three distinct groups. The first group exhibits a spacing of 5 mm and a depth of 9 mm. In the second group, there are five cracks with a spacing of 10 mm and a depth of 9 mm. Furthermore, the third group comprises three cracks, each characterized by varying depths (6mm, 9mm, and 12 mm). Then the To test the cracks with depth and spacing in the range of
mm and
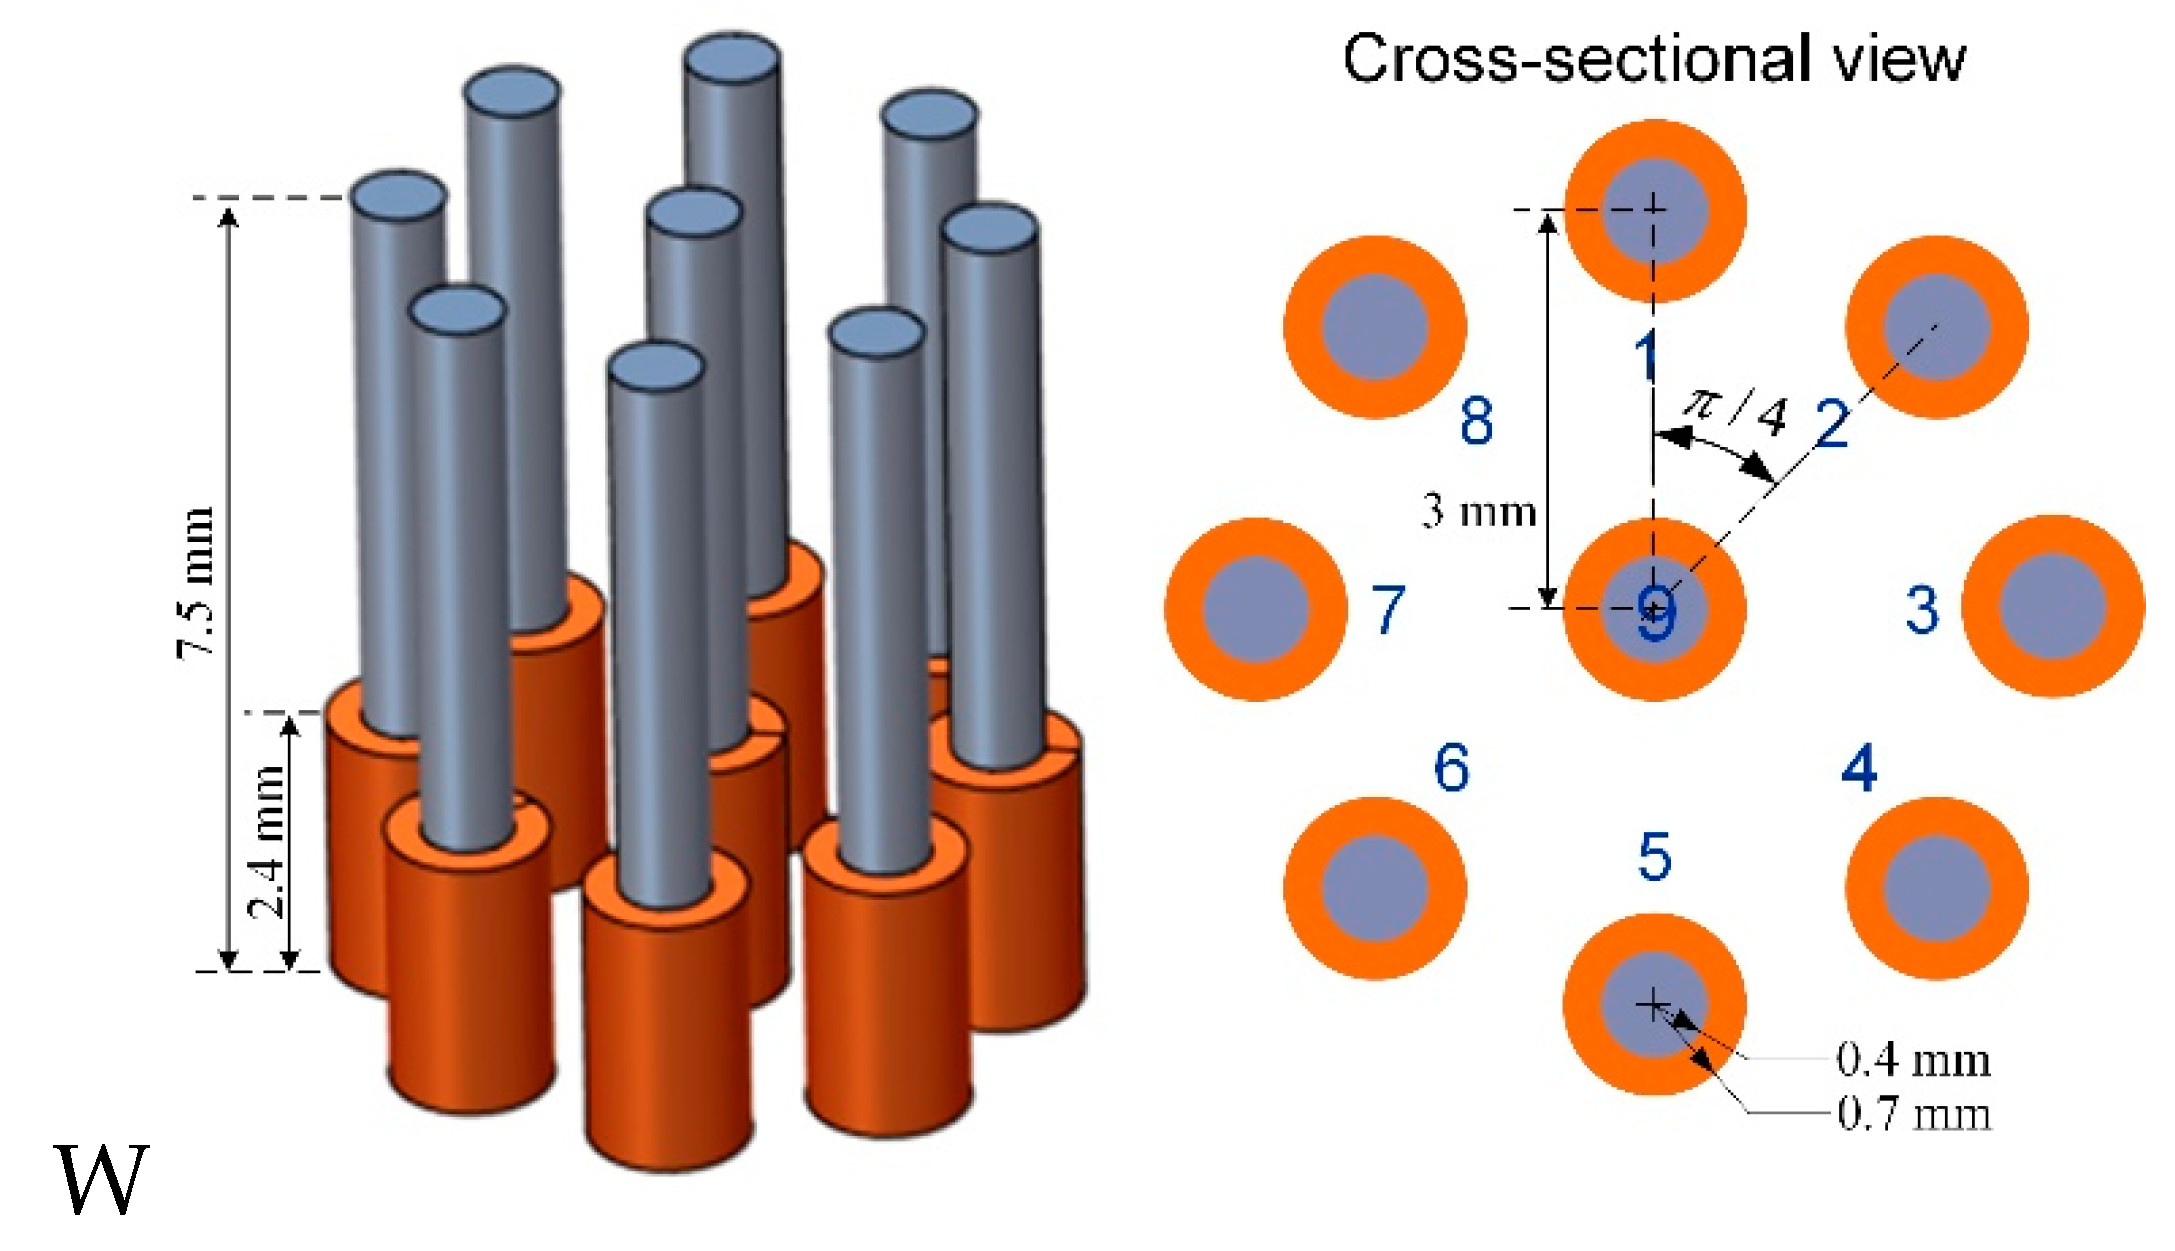
mm, respectively, the ferrite-core coil array shown in
Figure 3 was designed, which is symmetric and sensitive to cracks in various orientations. For testing of a typical rail steel in electrical conductivity of 4 MS/m and magnetic relative permeability of 40, the excitation frequency of 200 kHz, relating to the EC skin-depth of 0.09 mm, is selected for rail surface crack detection.
2.2. Forward problem of Rail Testing
In EC testing scenario, the governing diffusion equation of magnetic vector potential is,
(1.1)
where is the angular frequency, is the current density of source field, and are magnetic permeability and electrical conductivity of measurement space, respectively.
The electromagnetic field can be obtained by solving the diffusion equation, e.g., through FEM and BEM, with the known source field excited by the coil array. For an array consisting of 9 coils, there exist 36 independent measurements between coil pairs. The coil pairs are in different spacing and orientations. The sensitivity of conductivity variation
on plate due to defects, for a certain Tx-Rx coil, has been previously defined [
17], i.e.,
(1.2)
where indicates the voltage variation on the Rx coil, is the region of plate, and are source field excited by the Tx and Rx coils, respectively. For simplicity, the sensitivity of conductivity and conductivity variation are represented by and hereinafter.
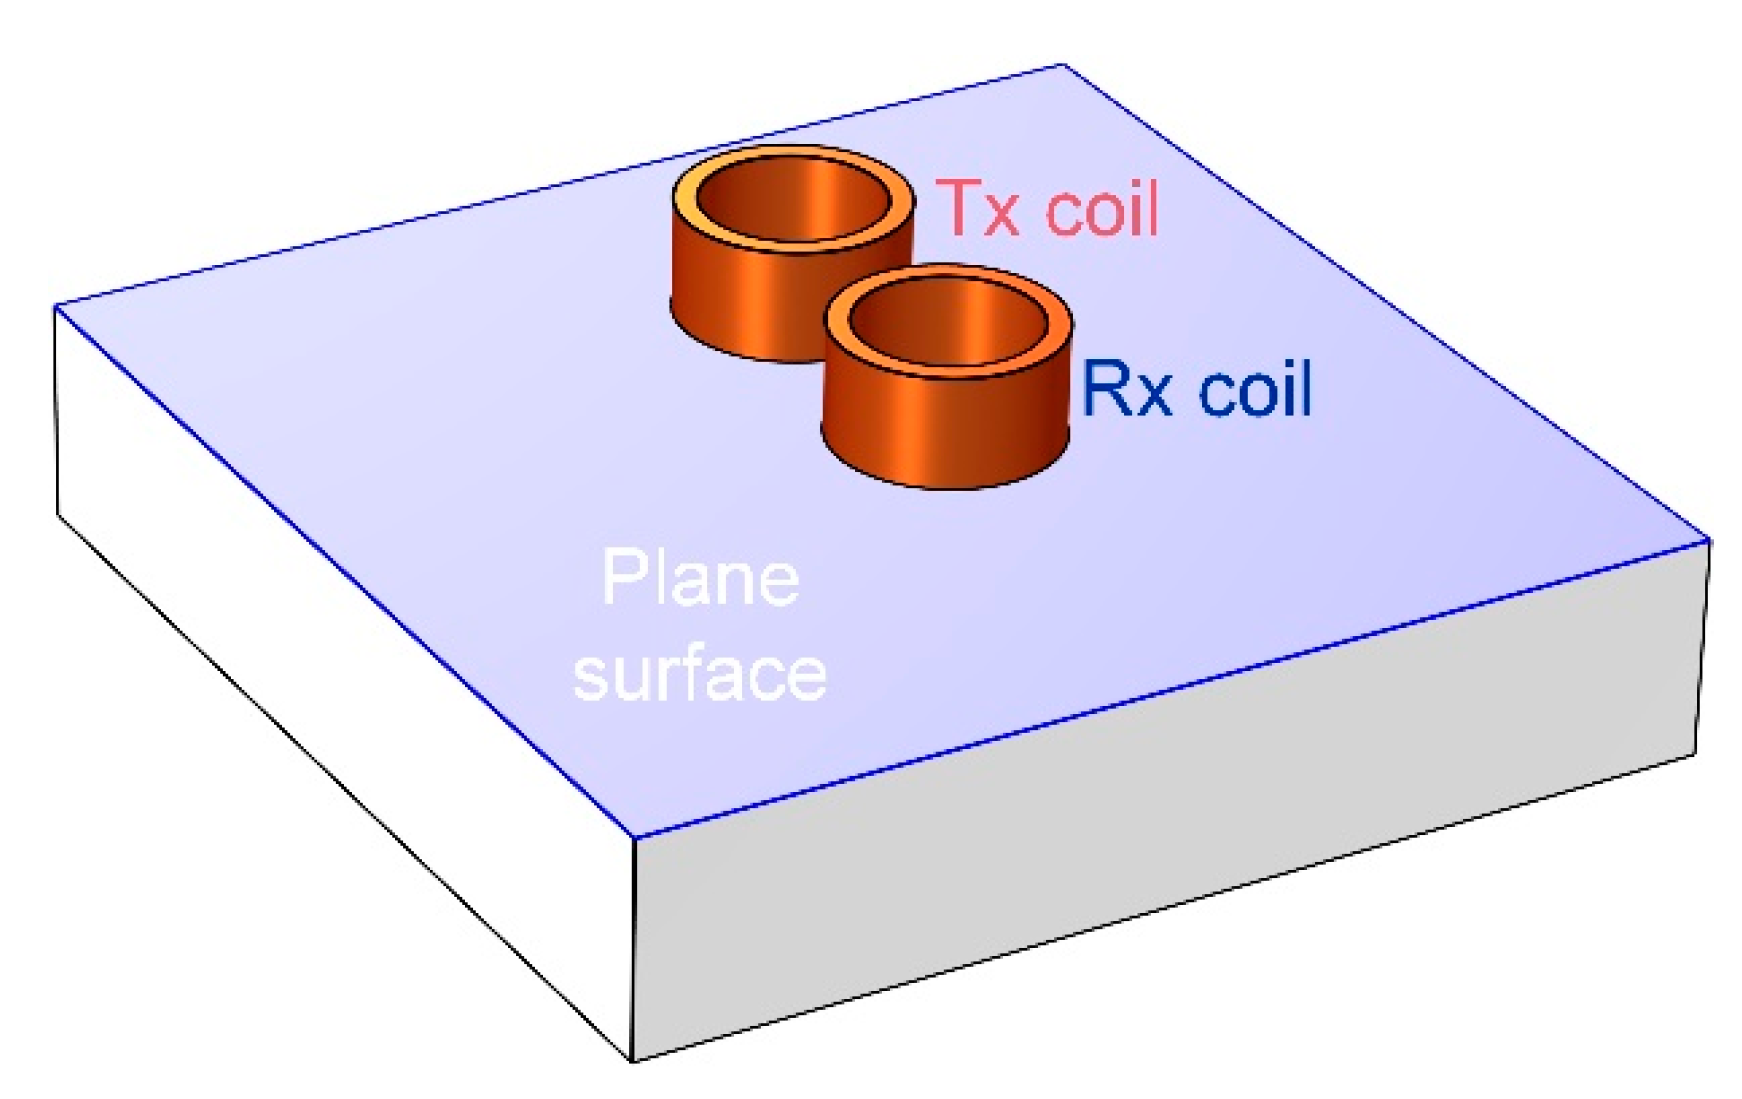
On the surface of the tested plane shown in
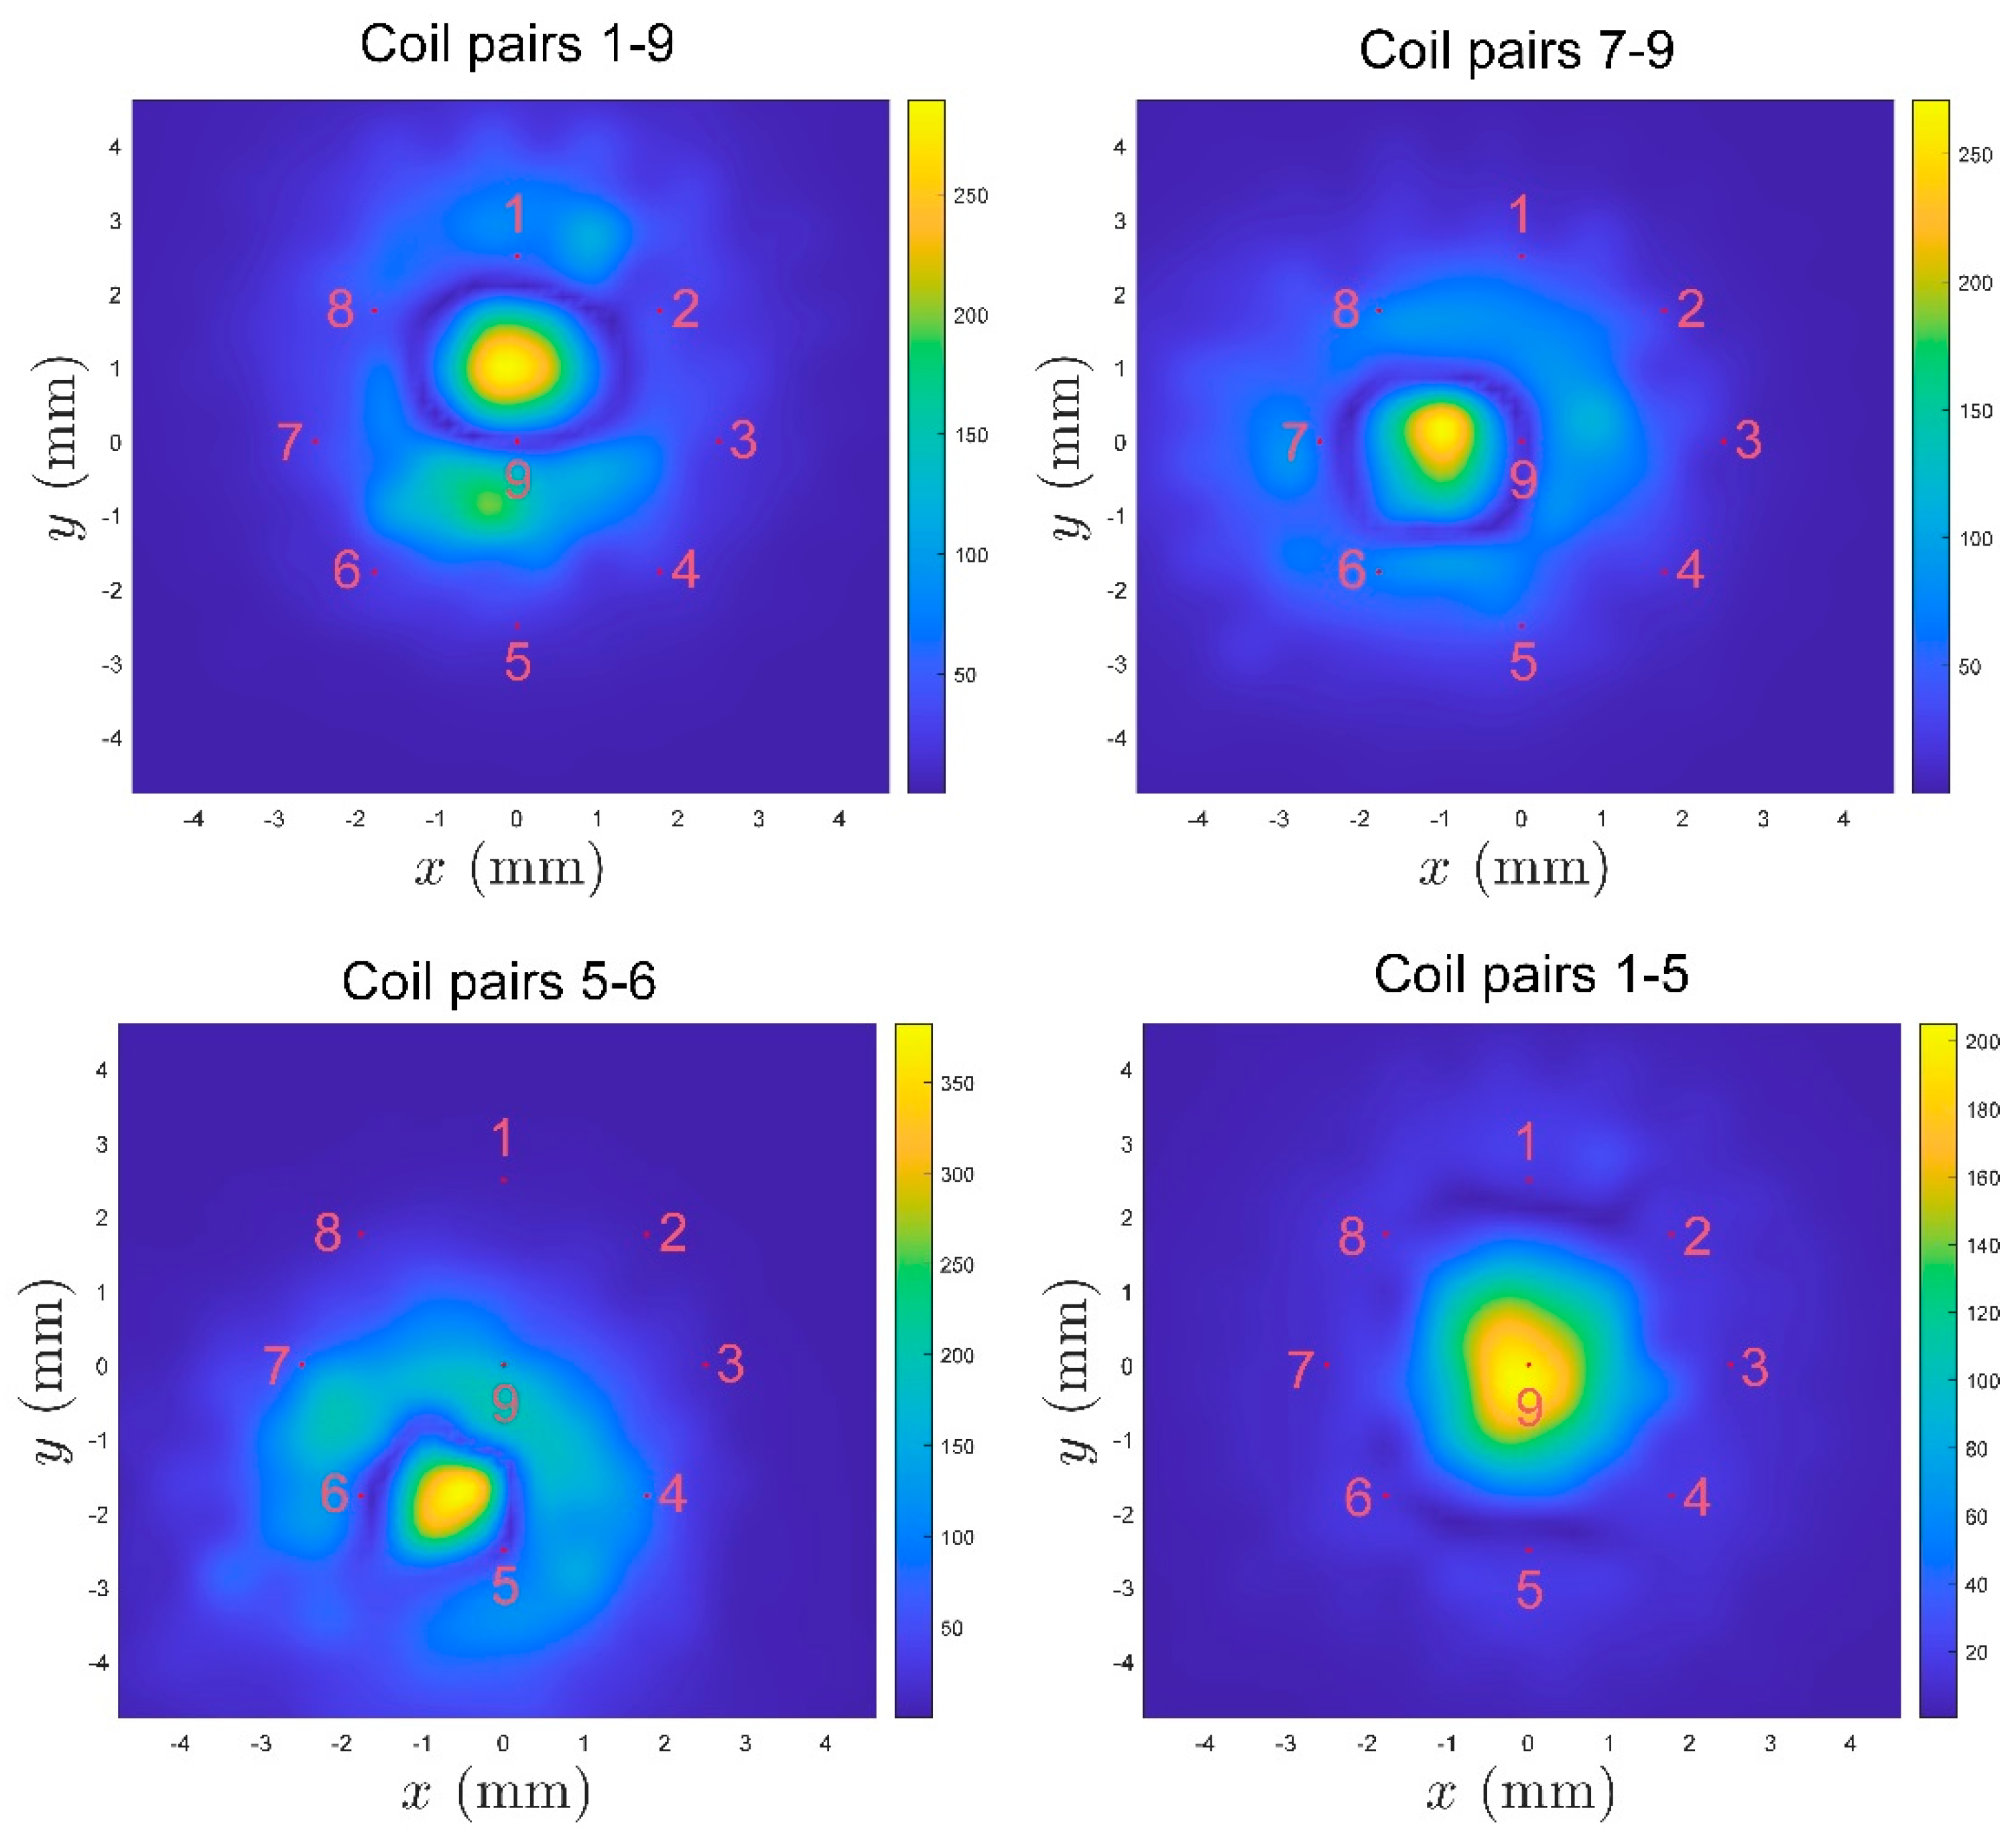
Figure 4, the sensitivity of conductivity between representative coil pairs is shown in
Figure 5. There exists the high value region of sensitivity between the Tx and Rx coils. The sensitivity maps show that the measurements of different coil pairs contain complimentary area on plane. By combining these measurements, the details of cracks could be reconstructed.
2.3. Inverse problem of Crack Reconstruction
The direct and iterative approaches based on the sensitivity can be employed to reconstruct the conductivity variation and reflect the distribution of defects on rail. Several representative direct methods, i.e., linear back projection (LBP), truncated singular value decomposition (TSVD), Tikhonov regularisation, and iterative algorithms, simultaneous iterative reconstruction technique (SIRT), Newton-Raphson (NR) and conjugate gradient (CG), are investigated for reconstruction of the relative change of conductivity.
The direct methods can be expressed by [
19]
(1.3)
where the sensitivity matrix , and are number of independent measurements between coils and pixels on plate to be reconstructed, the singular value decomposition of the sensitivity matrix is , is the diagonal matrix of singular values, , are filtering parameters to reduce the influence of small singular values, is identity matrix and is regularization parameter.
of which the basic form is shown in Table.
The iterative approaches optimize the variation of conductivity in an iterative manner,
(1.4)
where is the iterative step.
The updating directions of the implemented iterative methods are shown in
Table 2.1. Details of the reconstruction algorithms can be found in the studies [18, 19].
To obtain the 1-D scanning results of defect distribution, the arithmetic mean of 2-D reconstruction results is aligned into a vector with element corresponding to each testing point of the probe, , represents the number of testing points.
3. Results and Discussions
All potential transmitter and receiver coil pairings (shown in appendix A) were thoroughly evaluated, with data collected throughout the experiment. This is dedicated to ensuring a more comprehensive evaluation of results with inverse algorithms.
3.1. Received Data
Theoretically, if adjacent cracks on a rail are closely spaced, the response signals from these cracks can merge together, resulting in a single signal that displays as a continuous high value range due to low spatial resolution.
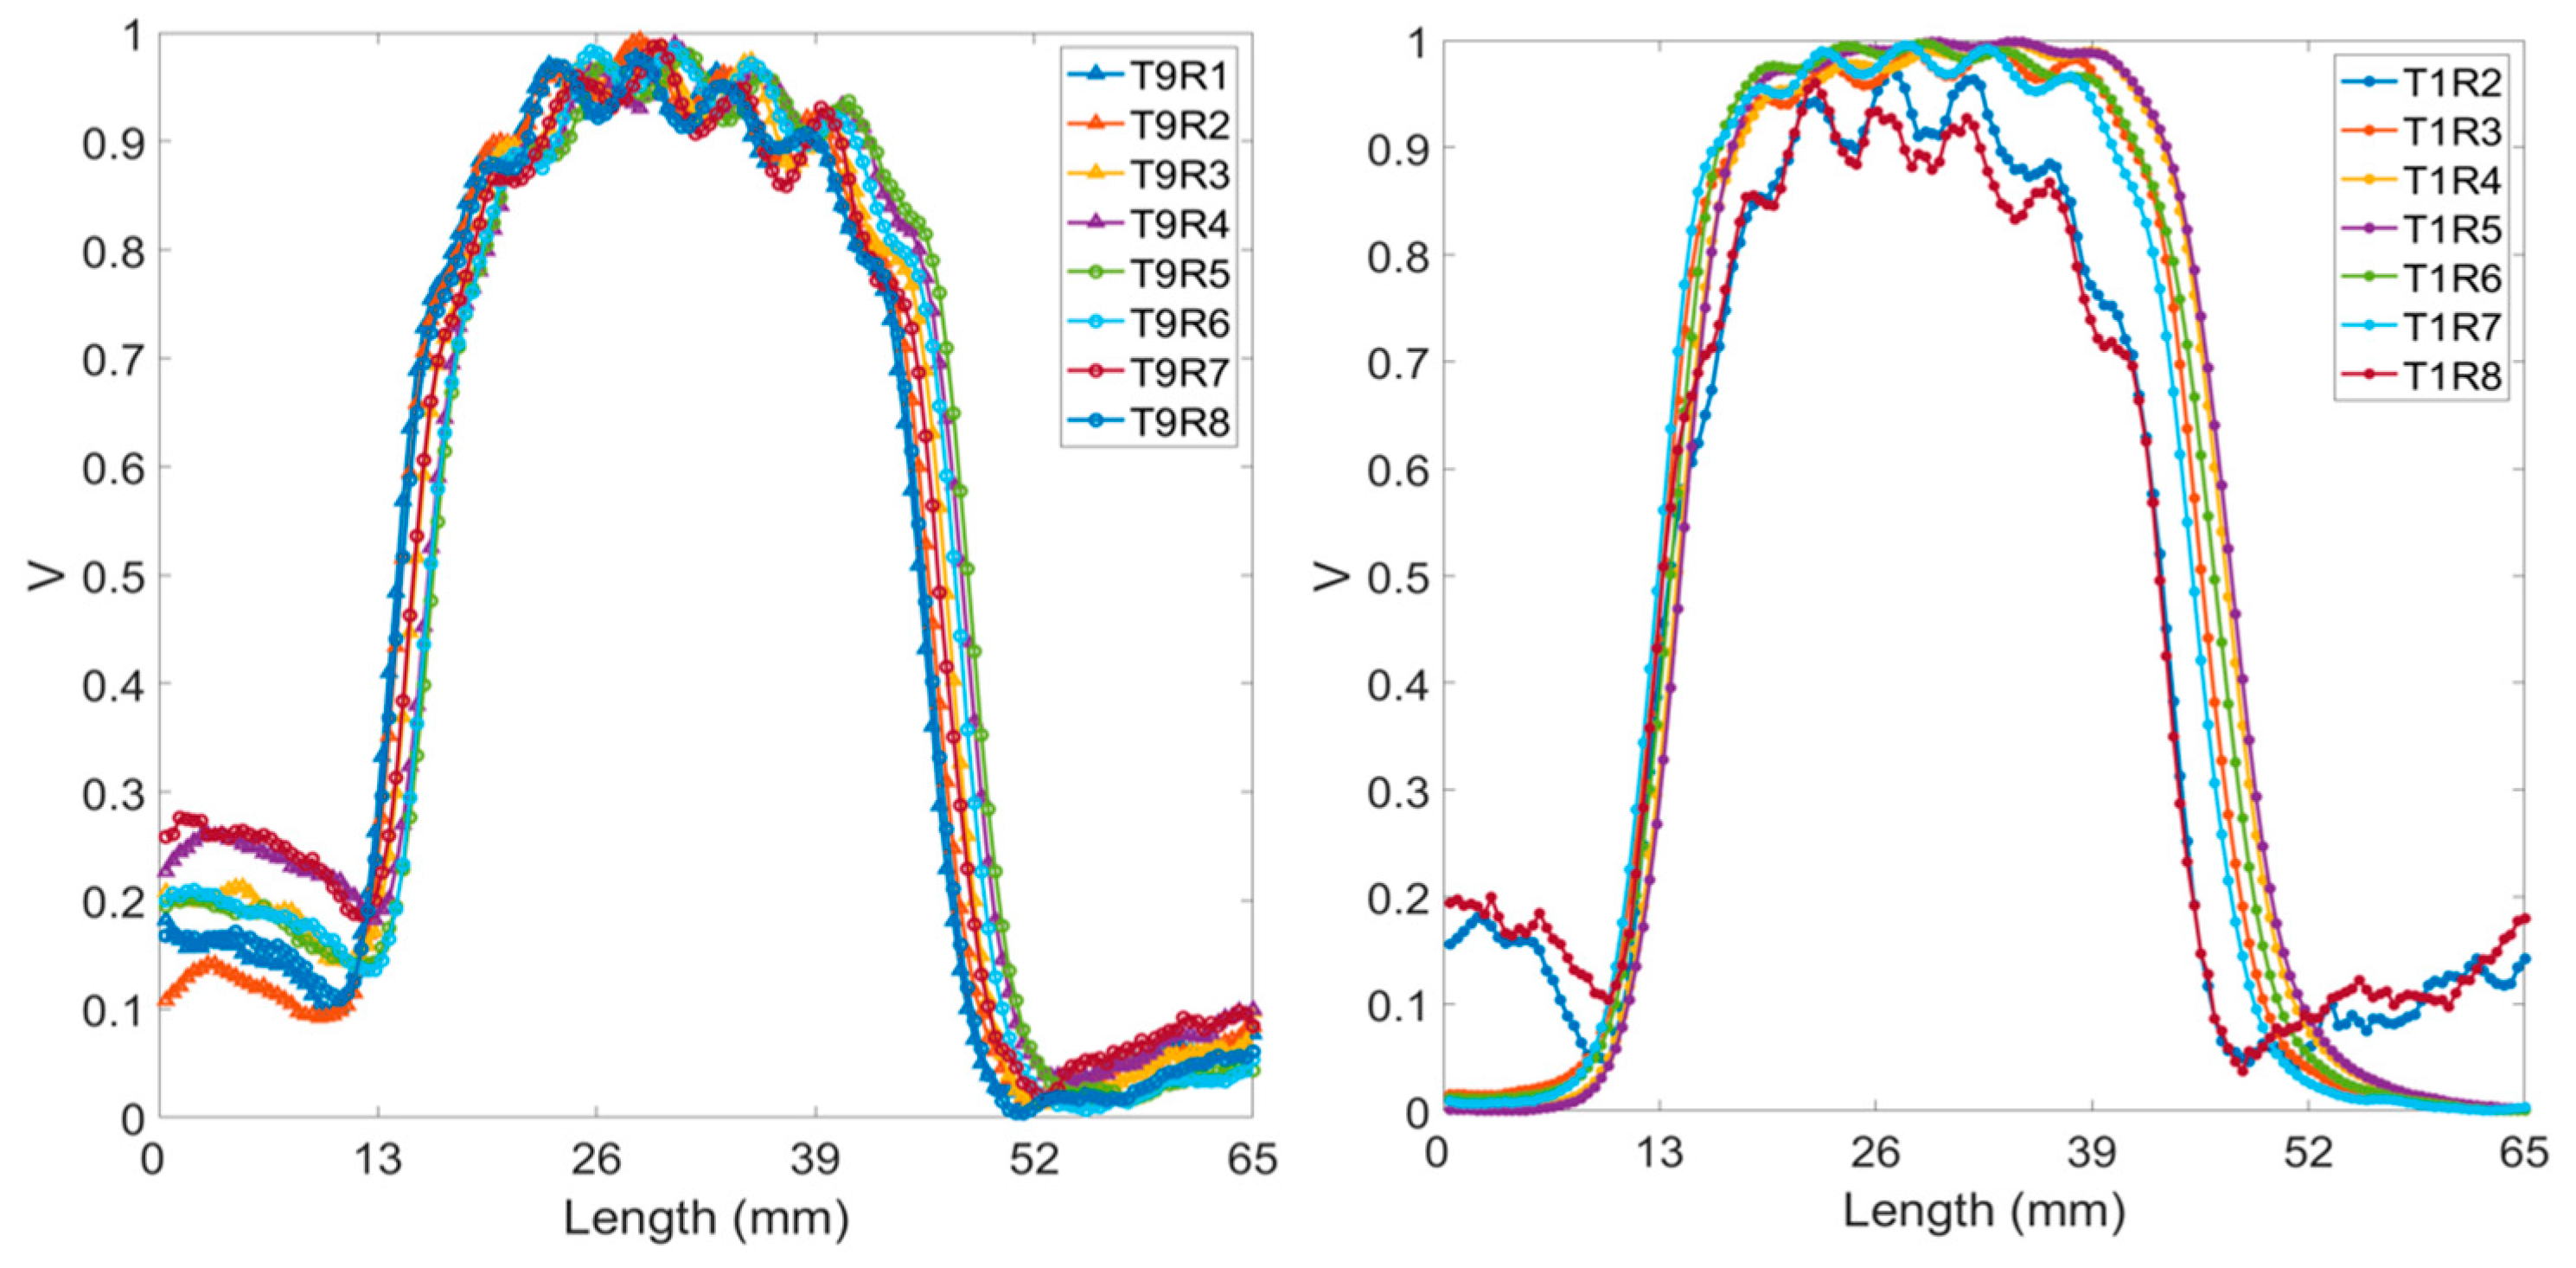
Figure 6 presents the normalised voltage signals obtained by scanning across 7 cracks spaced 5 mm apart, with a 5 mm lift-off, at a frequency of 200 kHz. The 7 peaks of response signal are represented as the small peaks on the bump. This figure presents data from 15 of the possible 36 transmitter (T)—receiver (R) coil combinations contained in the multichannel EC array. Each plot within the figure shows the response signal for seven cracks, appearing as distinct peaks atop the main bump. The combinations from T9-R1 to T9-R8 have a consistent coil spacing of 3 mm. The pairings T1-R2 and T1-R8 feature the narrowest coil spacing at 2.296 mm, while T1-R5 has the widest spacing at 6 mm, as referenced in
Figure 3. At a 5 mm lift-off distance, all coil spacings can detect a group of cracks. However, identifying the exact number of cracks requires further analysis through algorithms, due to the less distinct peaks on the bump.
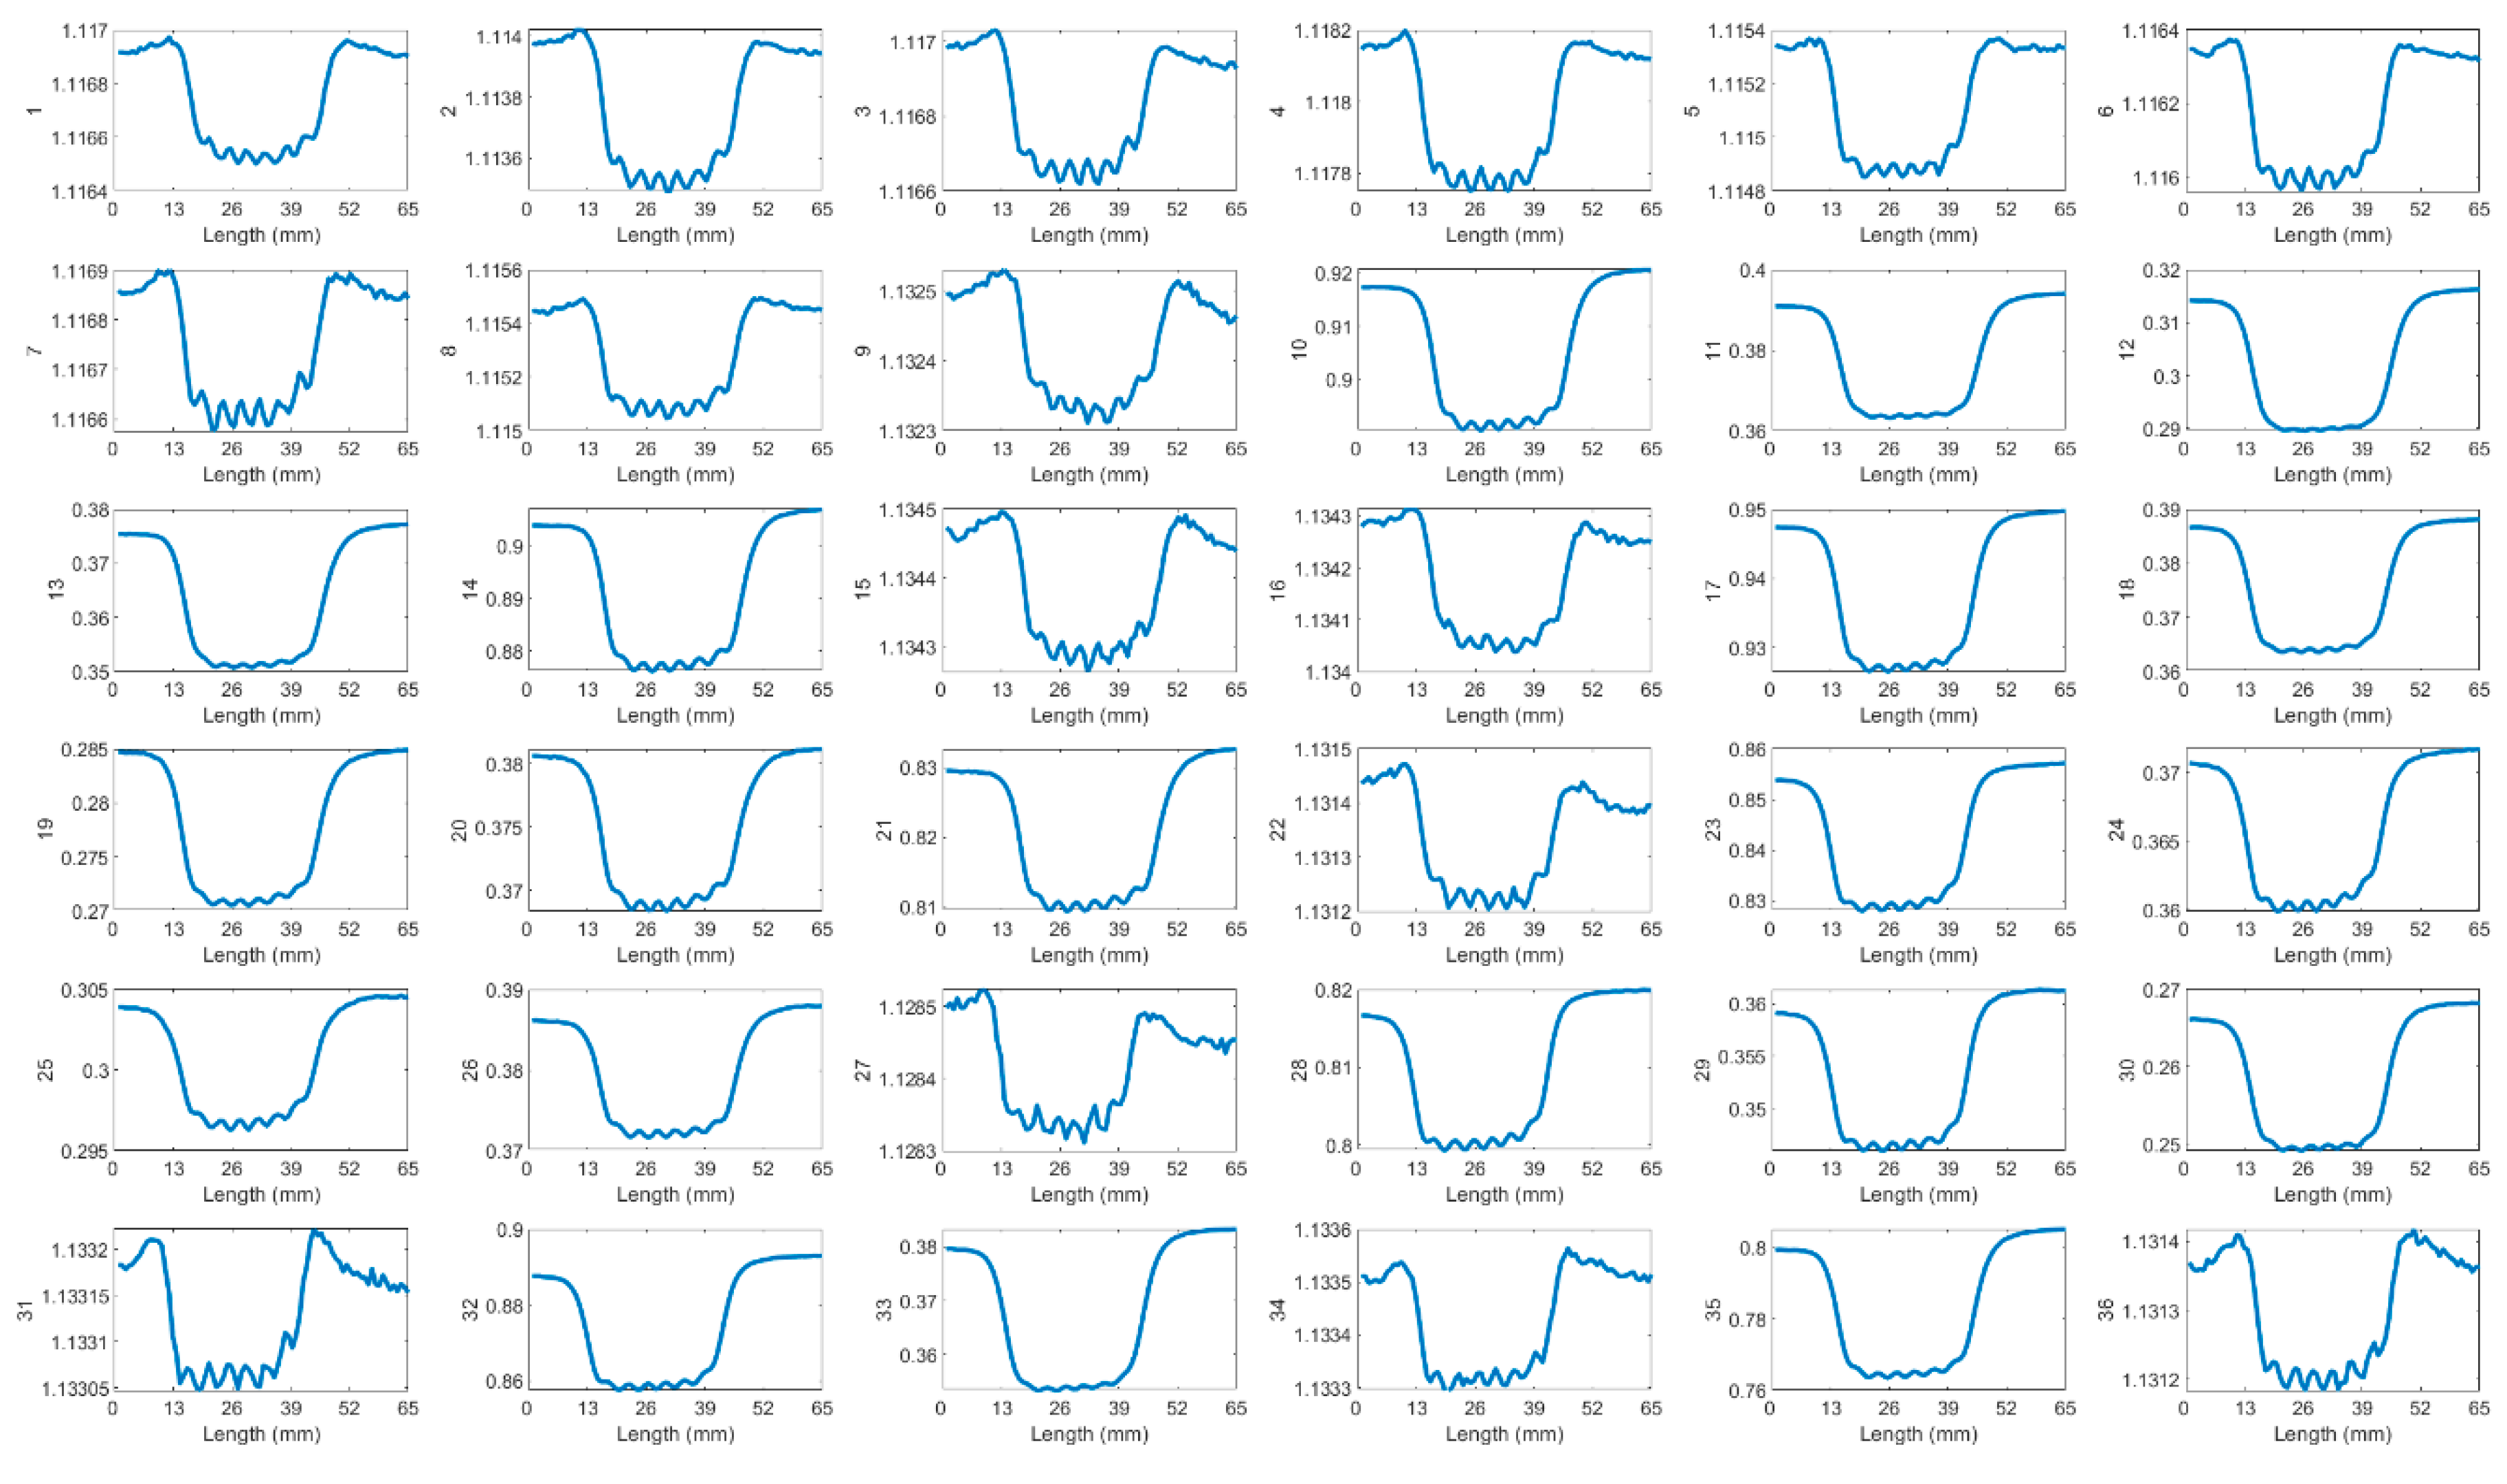
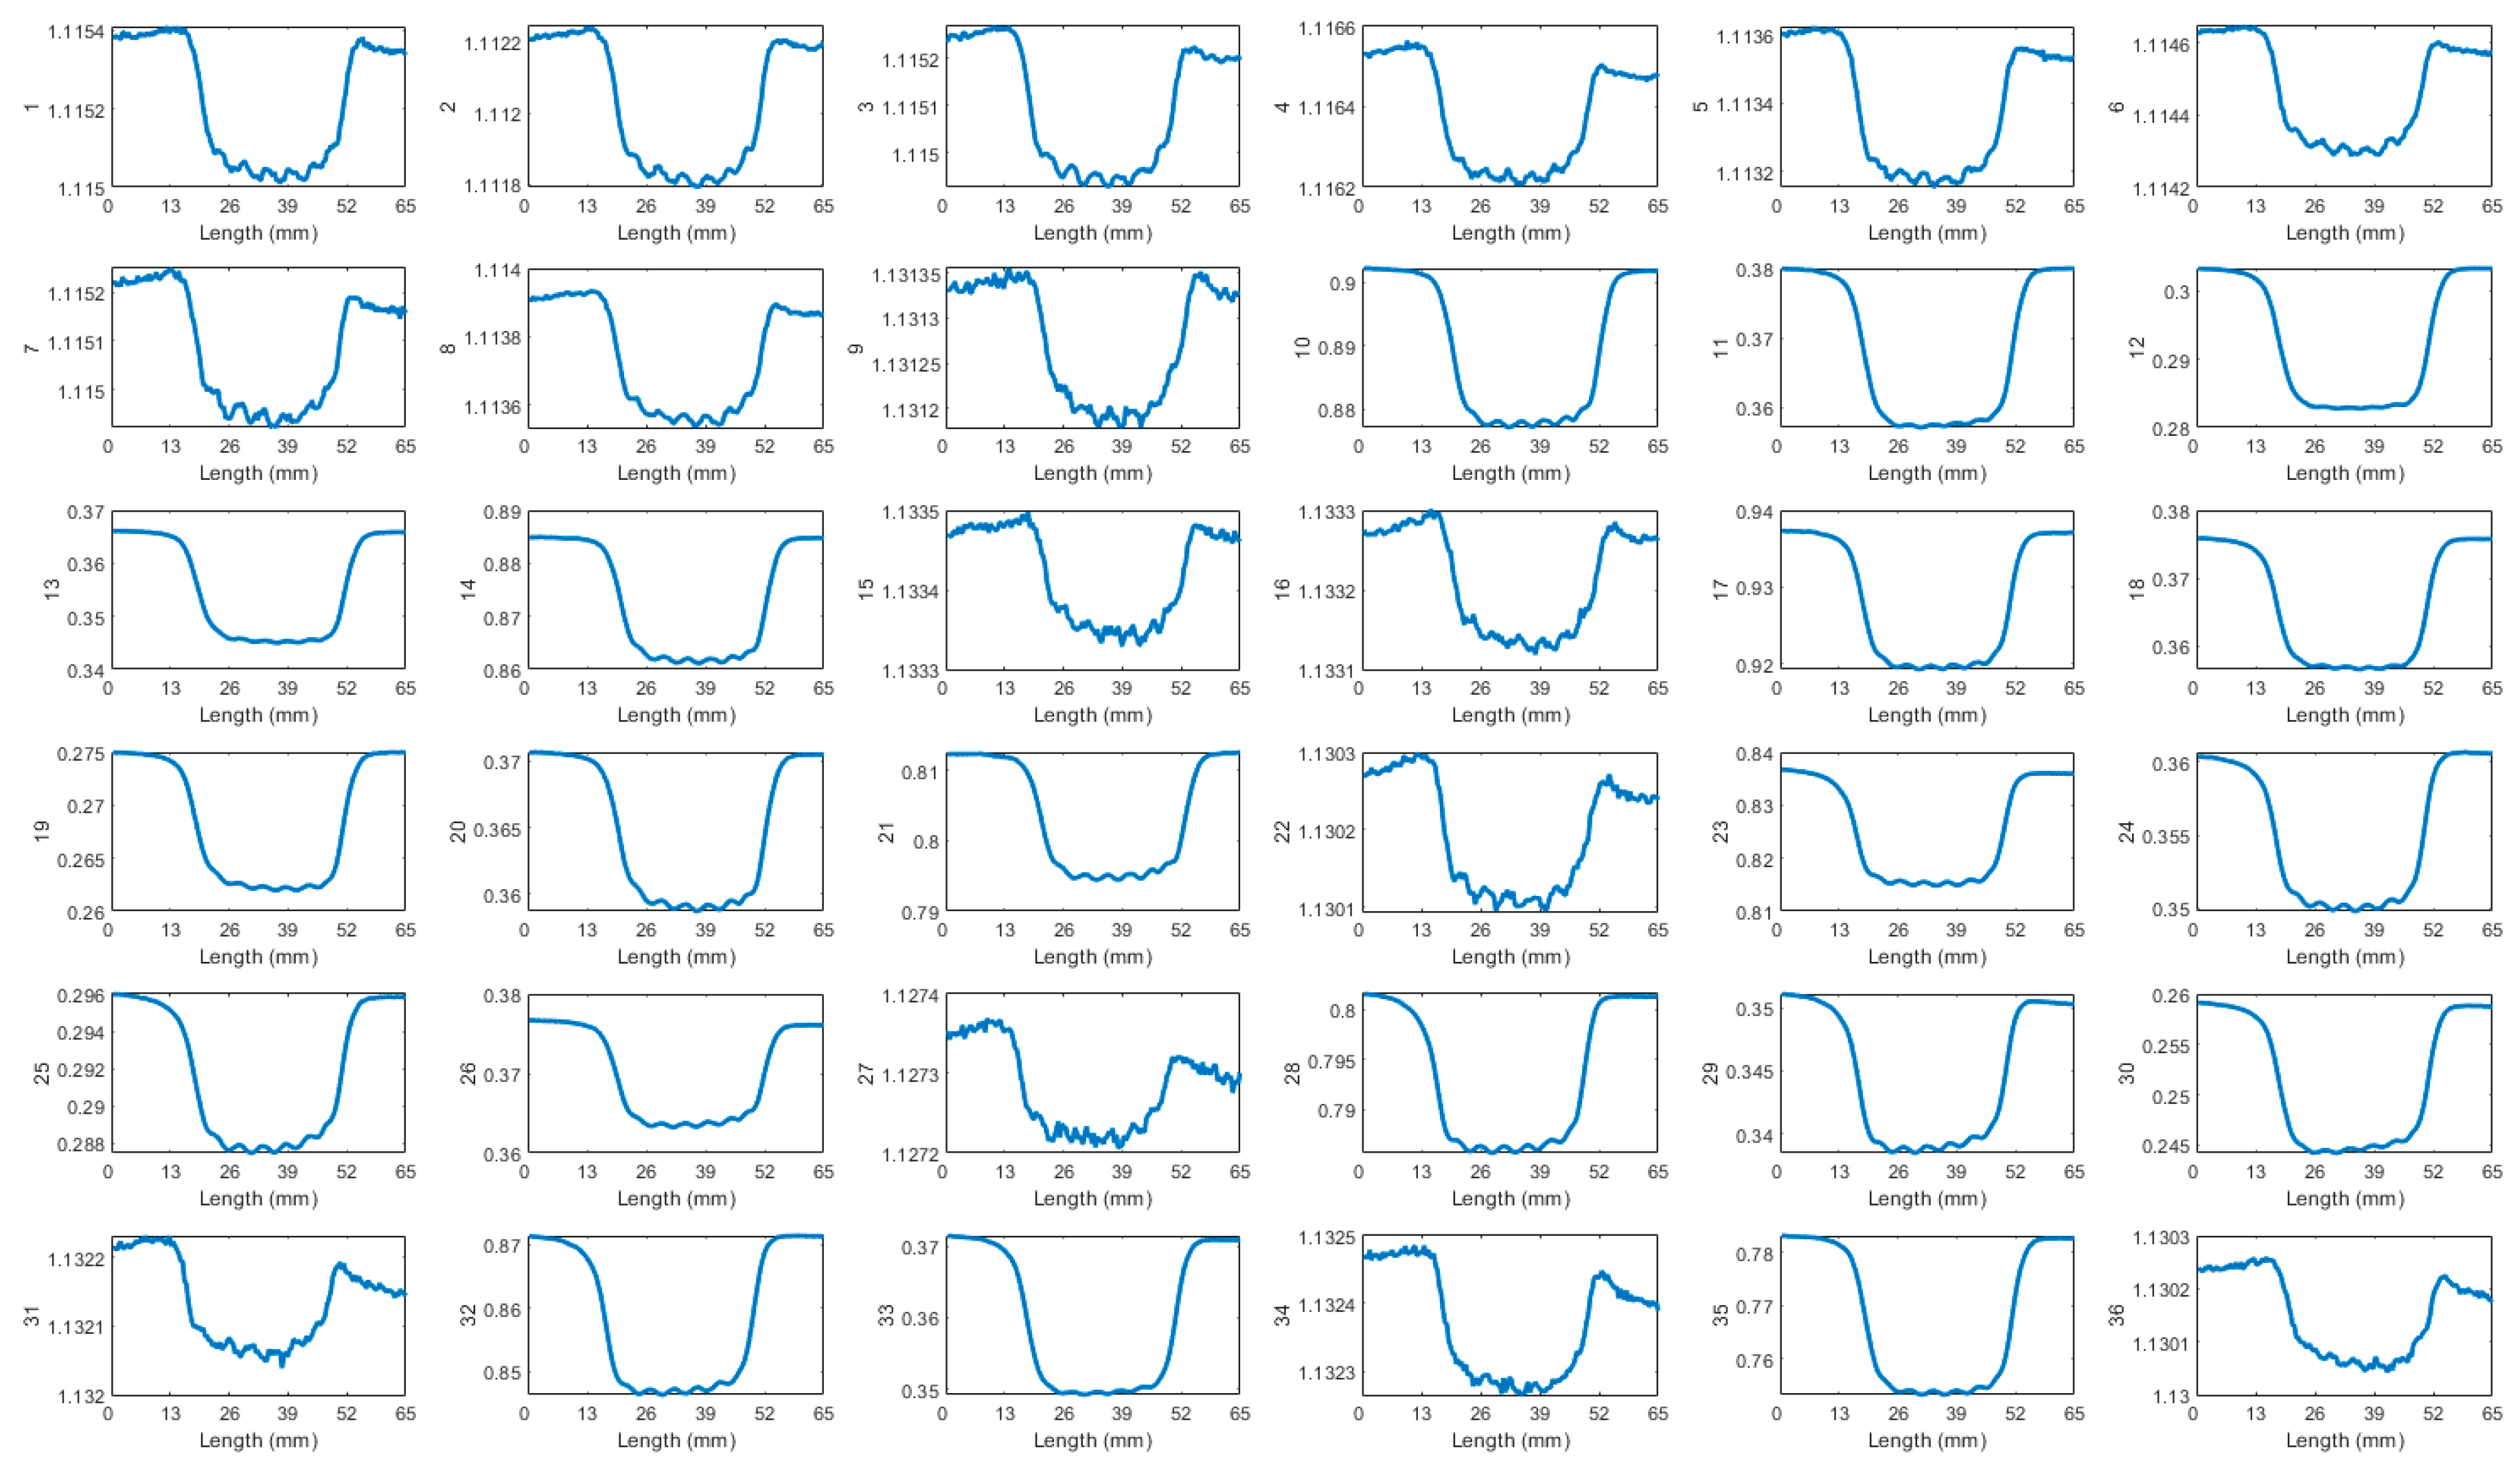
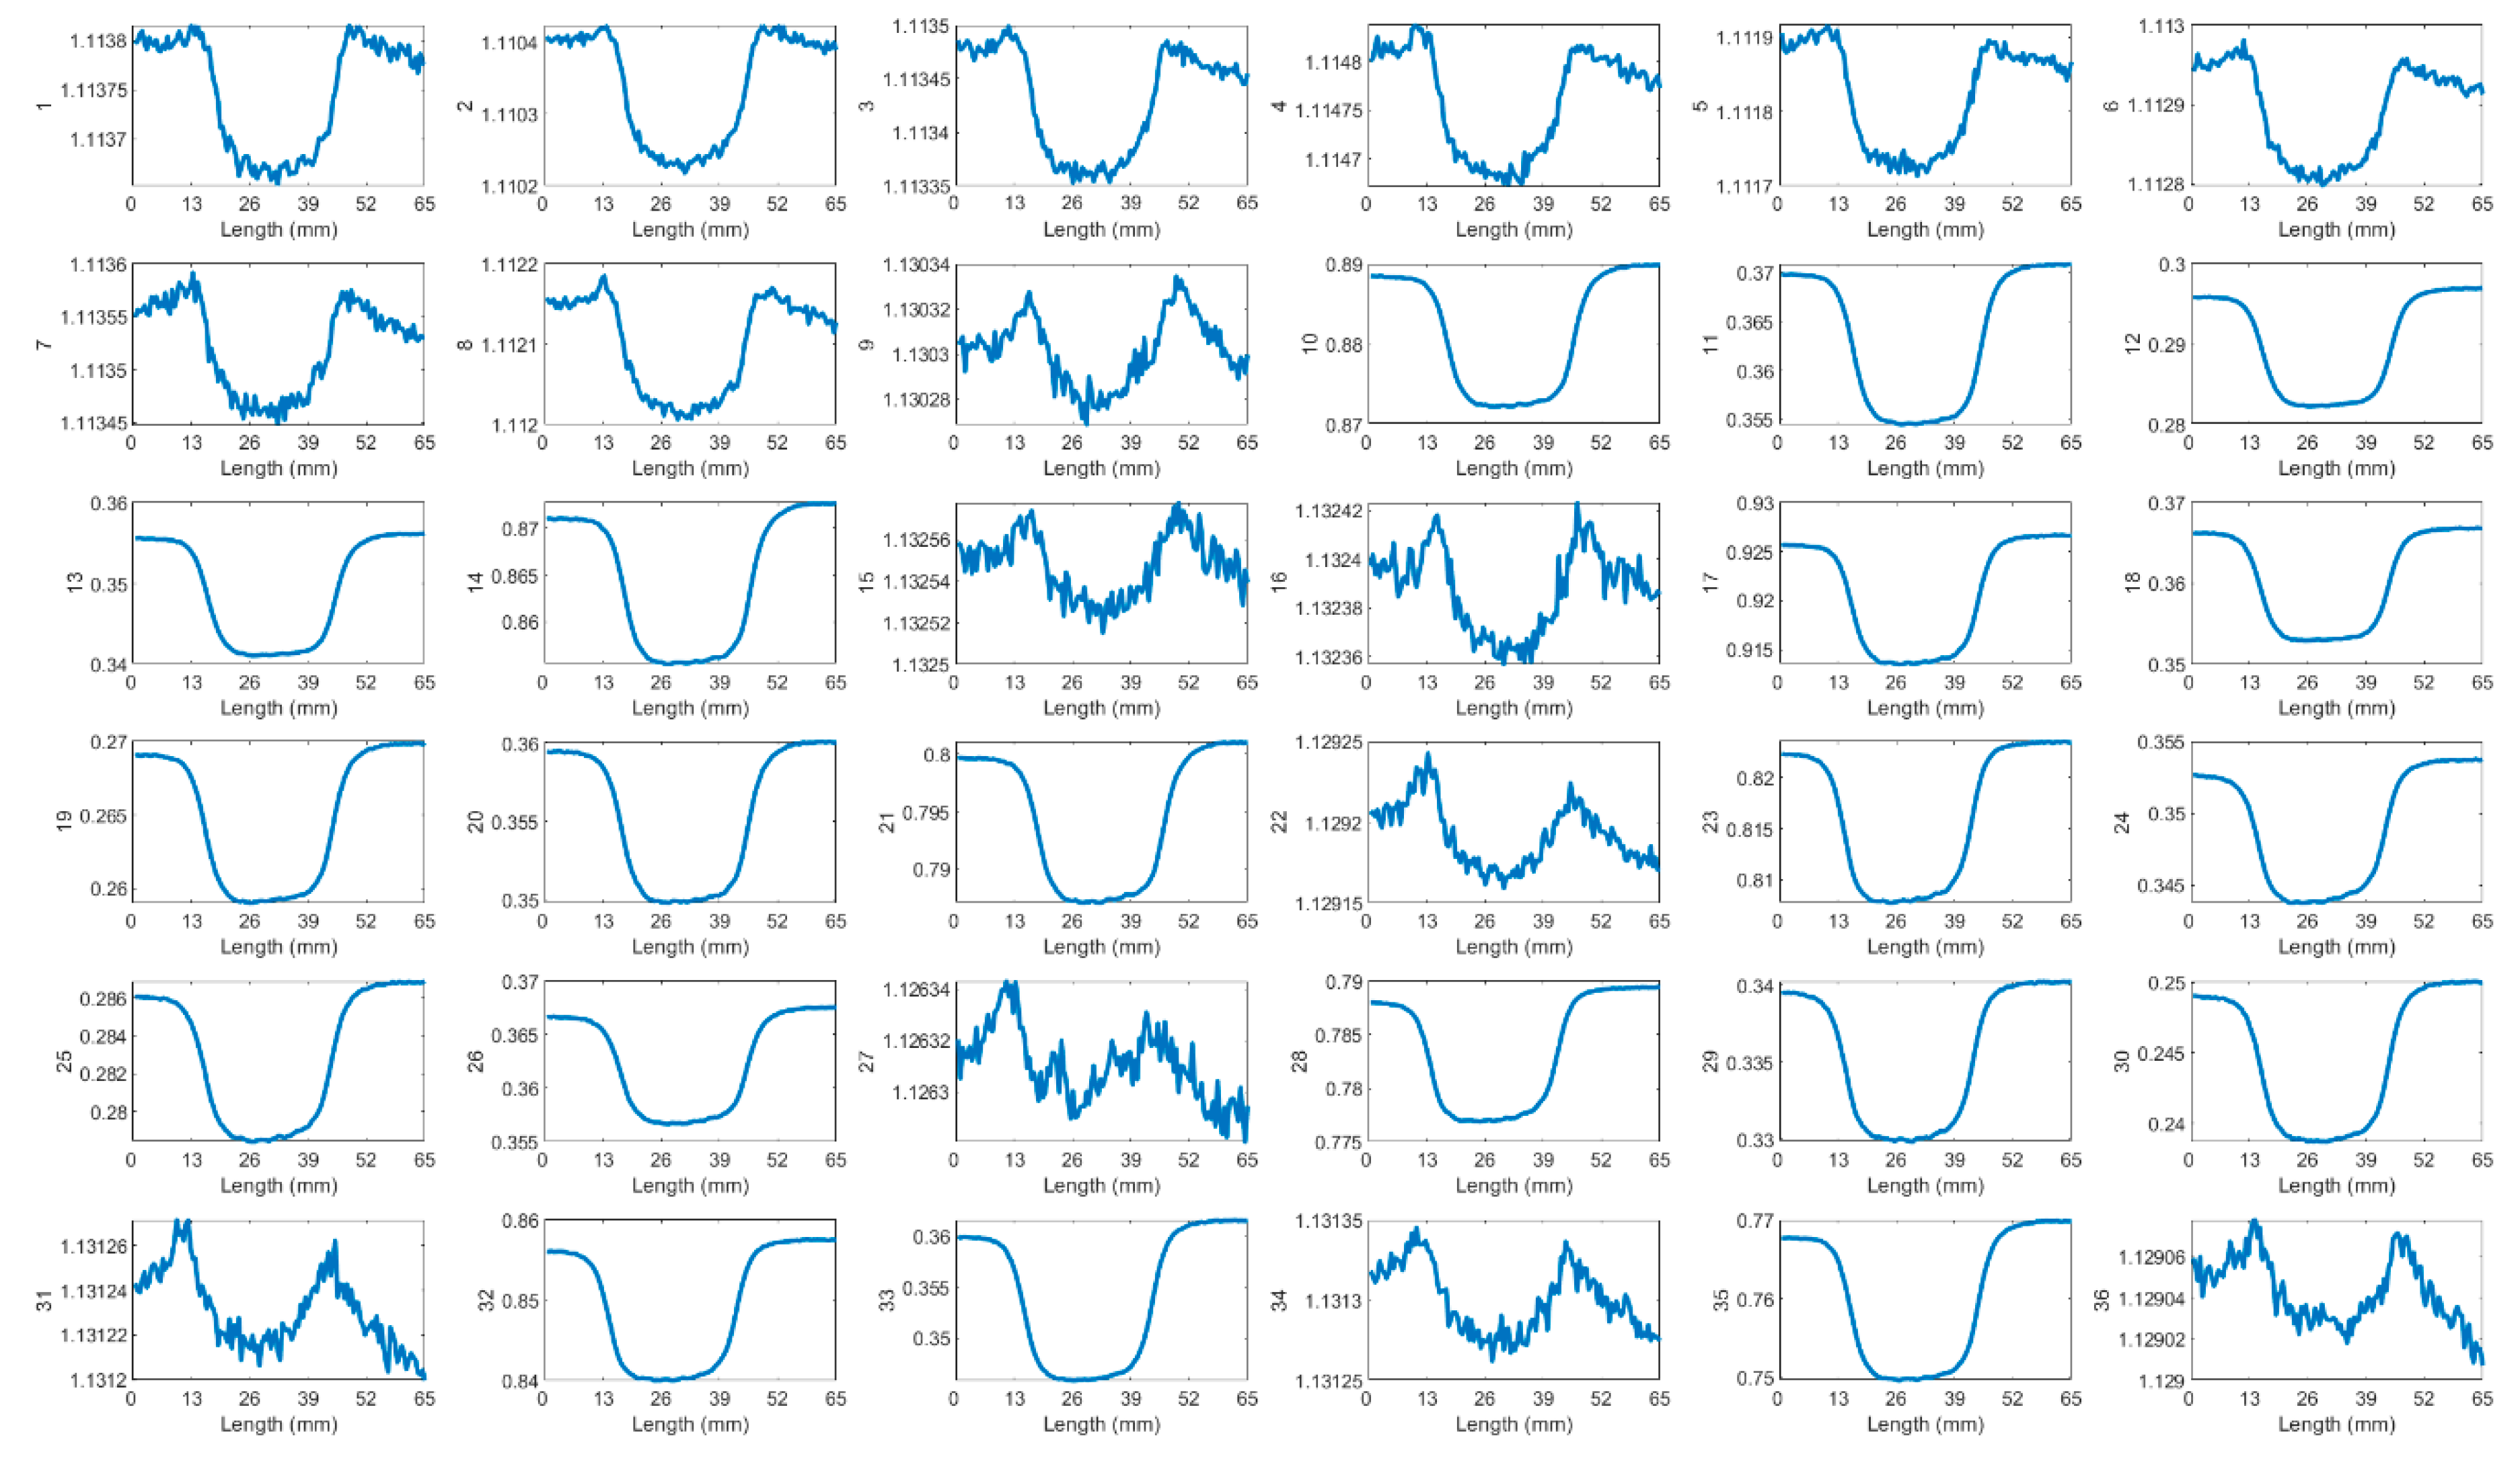
Reducing the probe’s lift-off improves its spatial resolution. This study examines the balance between spatial resolution and lift-off effects by scanning a sample featuring cracks spaced 5 mm apart, with lift-offs varying between 4 mm and 6 mm. The raw data for all transmitter-receiver (T-R) pairings at 4 mm, 5 mm, and 6 mm lift-offs are illustrated in Figure 11 to 13 in Appendix. At a 4 mm lift-off, the peaks corresponding to individual cracks are more obvious to be observed visually. Signal amplitude is greater than at lift-offs of 5 mm and 6 mm. At a 6 mm lift-off, the signal for T-R pairings with smaller spacings becomes noisy, obscuring the peaks on the bump and reducing the amount of inspectable information.
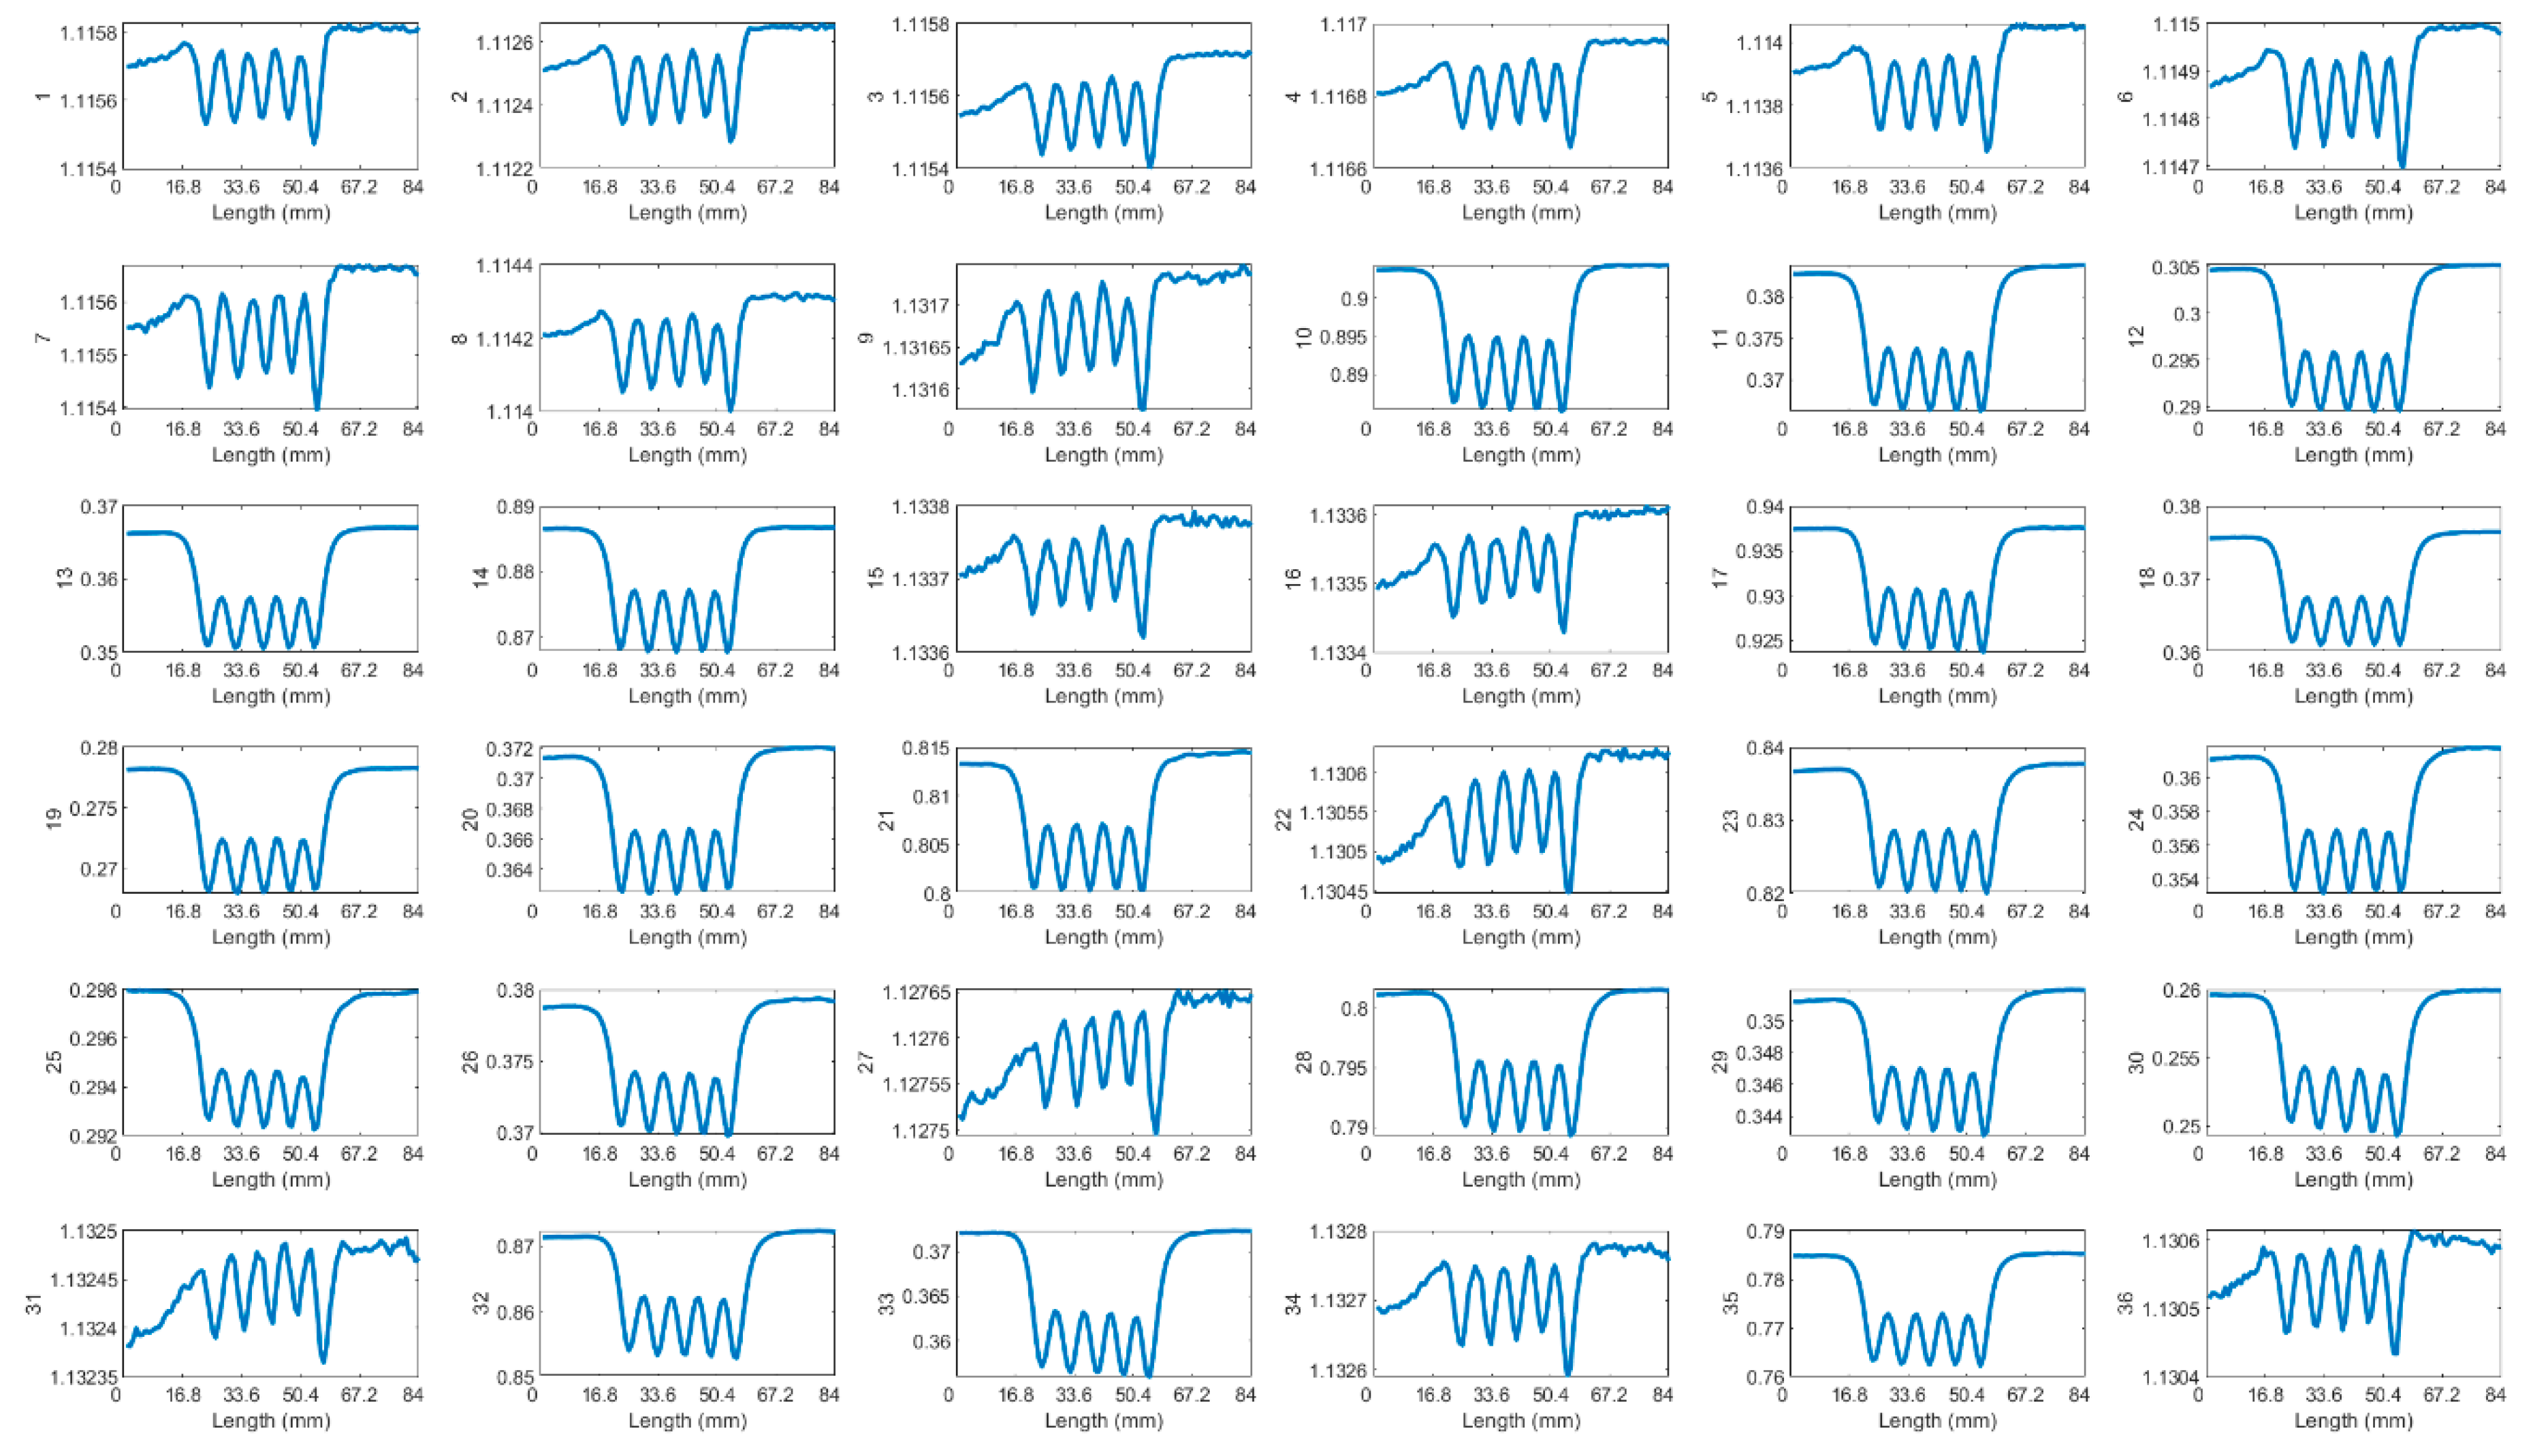
The data obtained from scanning five adjacent cracks, each separated by a 10 mm spacing, and three cracks with varying depths (6 mm, 9 mm, and 12 mm), with a 5 mm lift-off, are presented in Figure 14, 15 in the appendix. These results are encouraging for direct crack detection, as the cracks can be distinctly identified through five distinct peaks in the raw data. Furthermore, the capability to discern cracks of different depths is demonstrated by the amplitude variation of the response signal, where a shallower crack corresponds to a lower signal amplitude. This correlation between crack depth and signal amplitude underlines the effectiveness of the detection method in distinguishing cracks of varying severities directly from the raw data.
Although a smaller lift-off provides superior spatial resolution and signal strength, it poses a higher risk of damage to the delicate sensor probe, potentially increasing maintenance costs. Conversely, a larger lift-off introduces noise into the signal and captures less information. Consequently, a 5 mm lift-off is selected to balance spatial resolution and signal strength, mitigating the risk of probe damage and maintaining data quality.
3.2. Evaluation of Results Using Inverse Problems
3.2.1. 7 Cracks with 5 mm Spacing
The processed data utilizing all the algorithms can be observed in
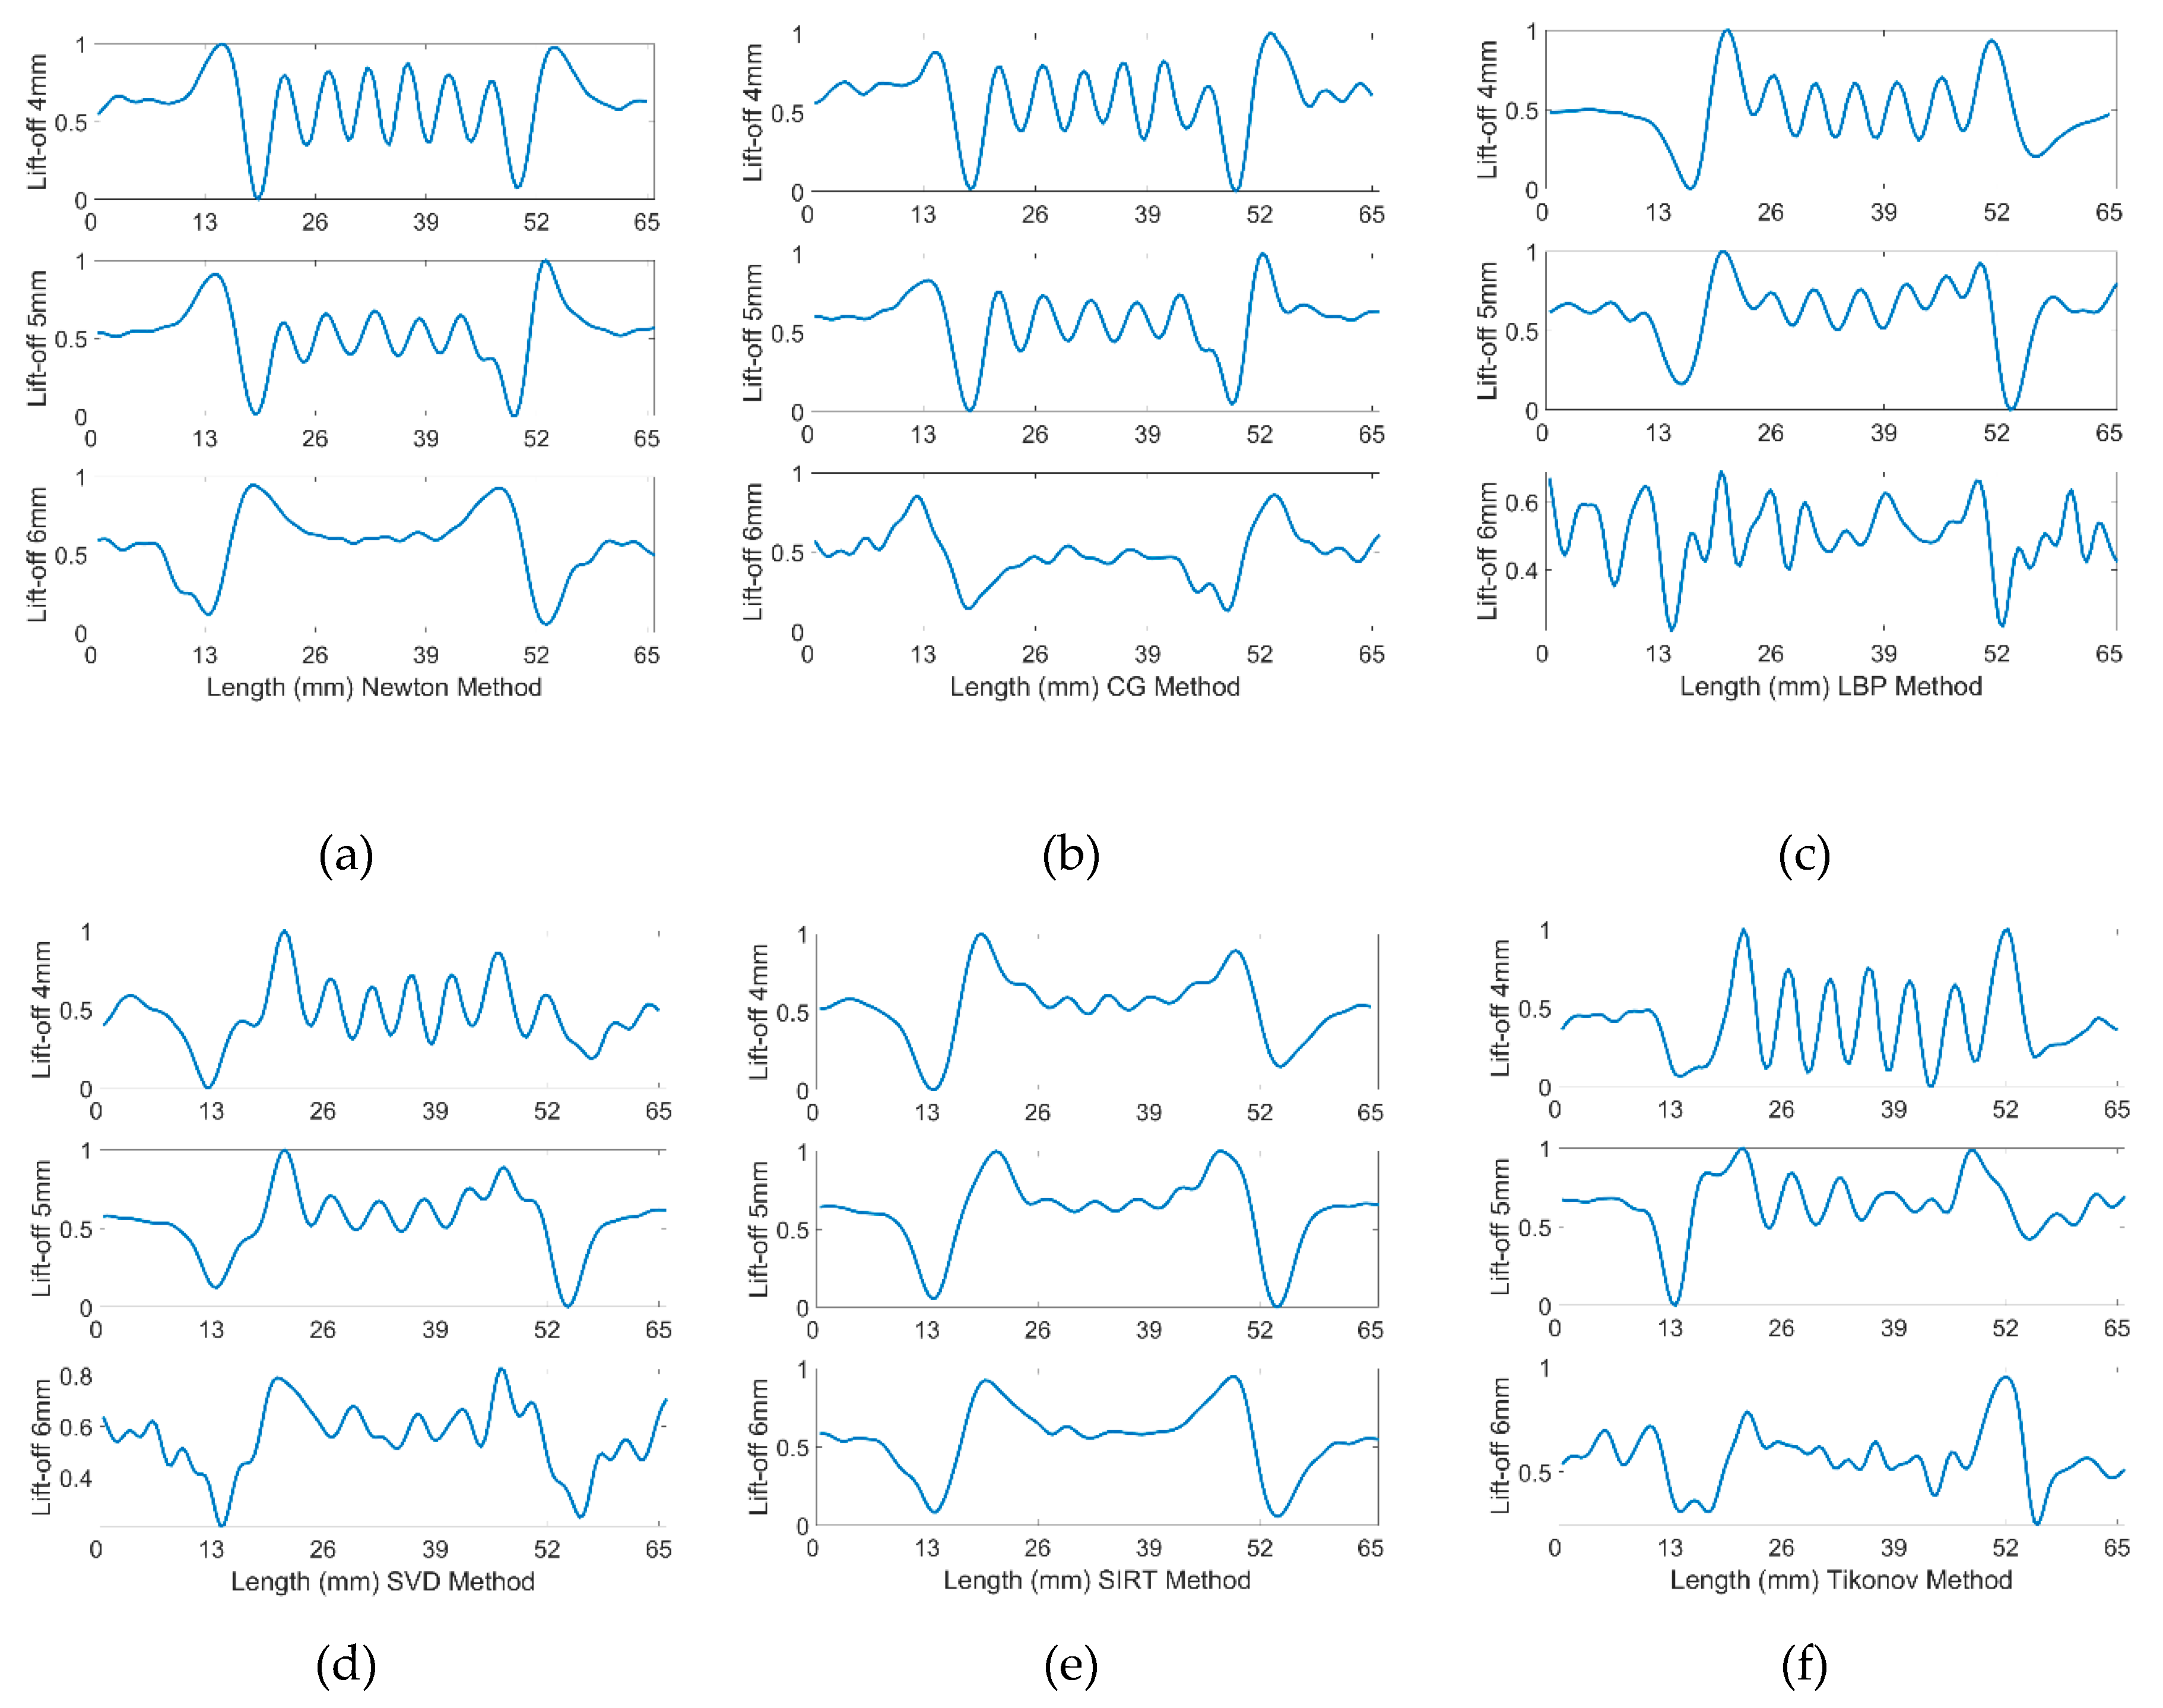
Figure 7. All 36 pairings of received signals are employed when applying inverse method algorithms. It can be noted that the signals for seven cracks, each spaced 5 mm apart, are distinguished from a significant bump into seven peaks when the lift-off is set to 4 mm with inverse algorithms applied. At a 5 mm lift-off, the Newton-Raphson, CG, and LBP methods continue to exhibit good results. However, when the lift-off increases to 6 mm, the crack signals are obscured by noise, rendering the plots devoid of useful information. Therefore, the preferred algorithmic methods are Newton-Raphson, CG, and LBP, with the processed signals at a lift-off of 4 mm, 5 mm and 6 mm.
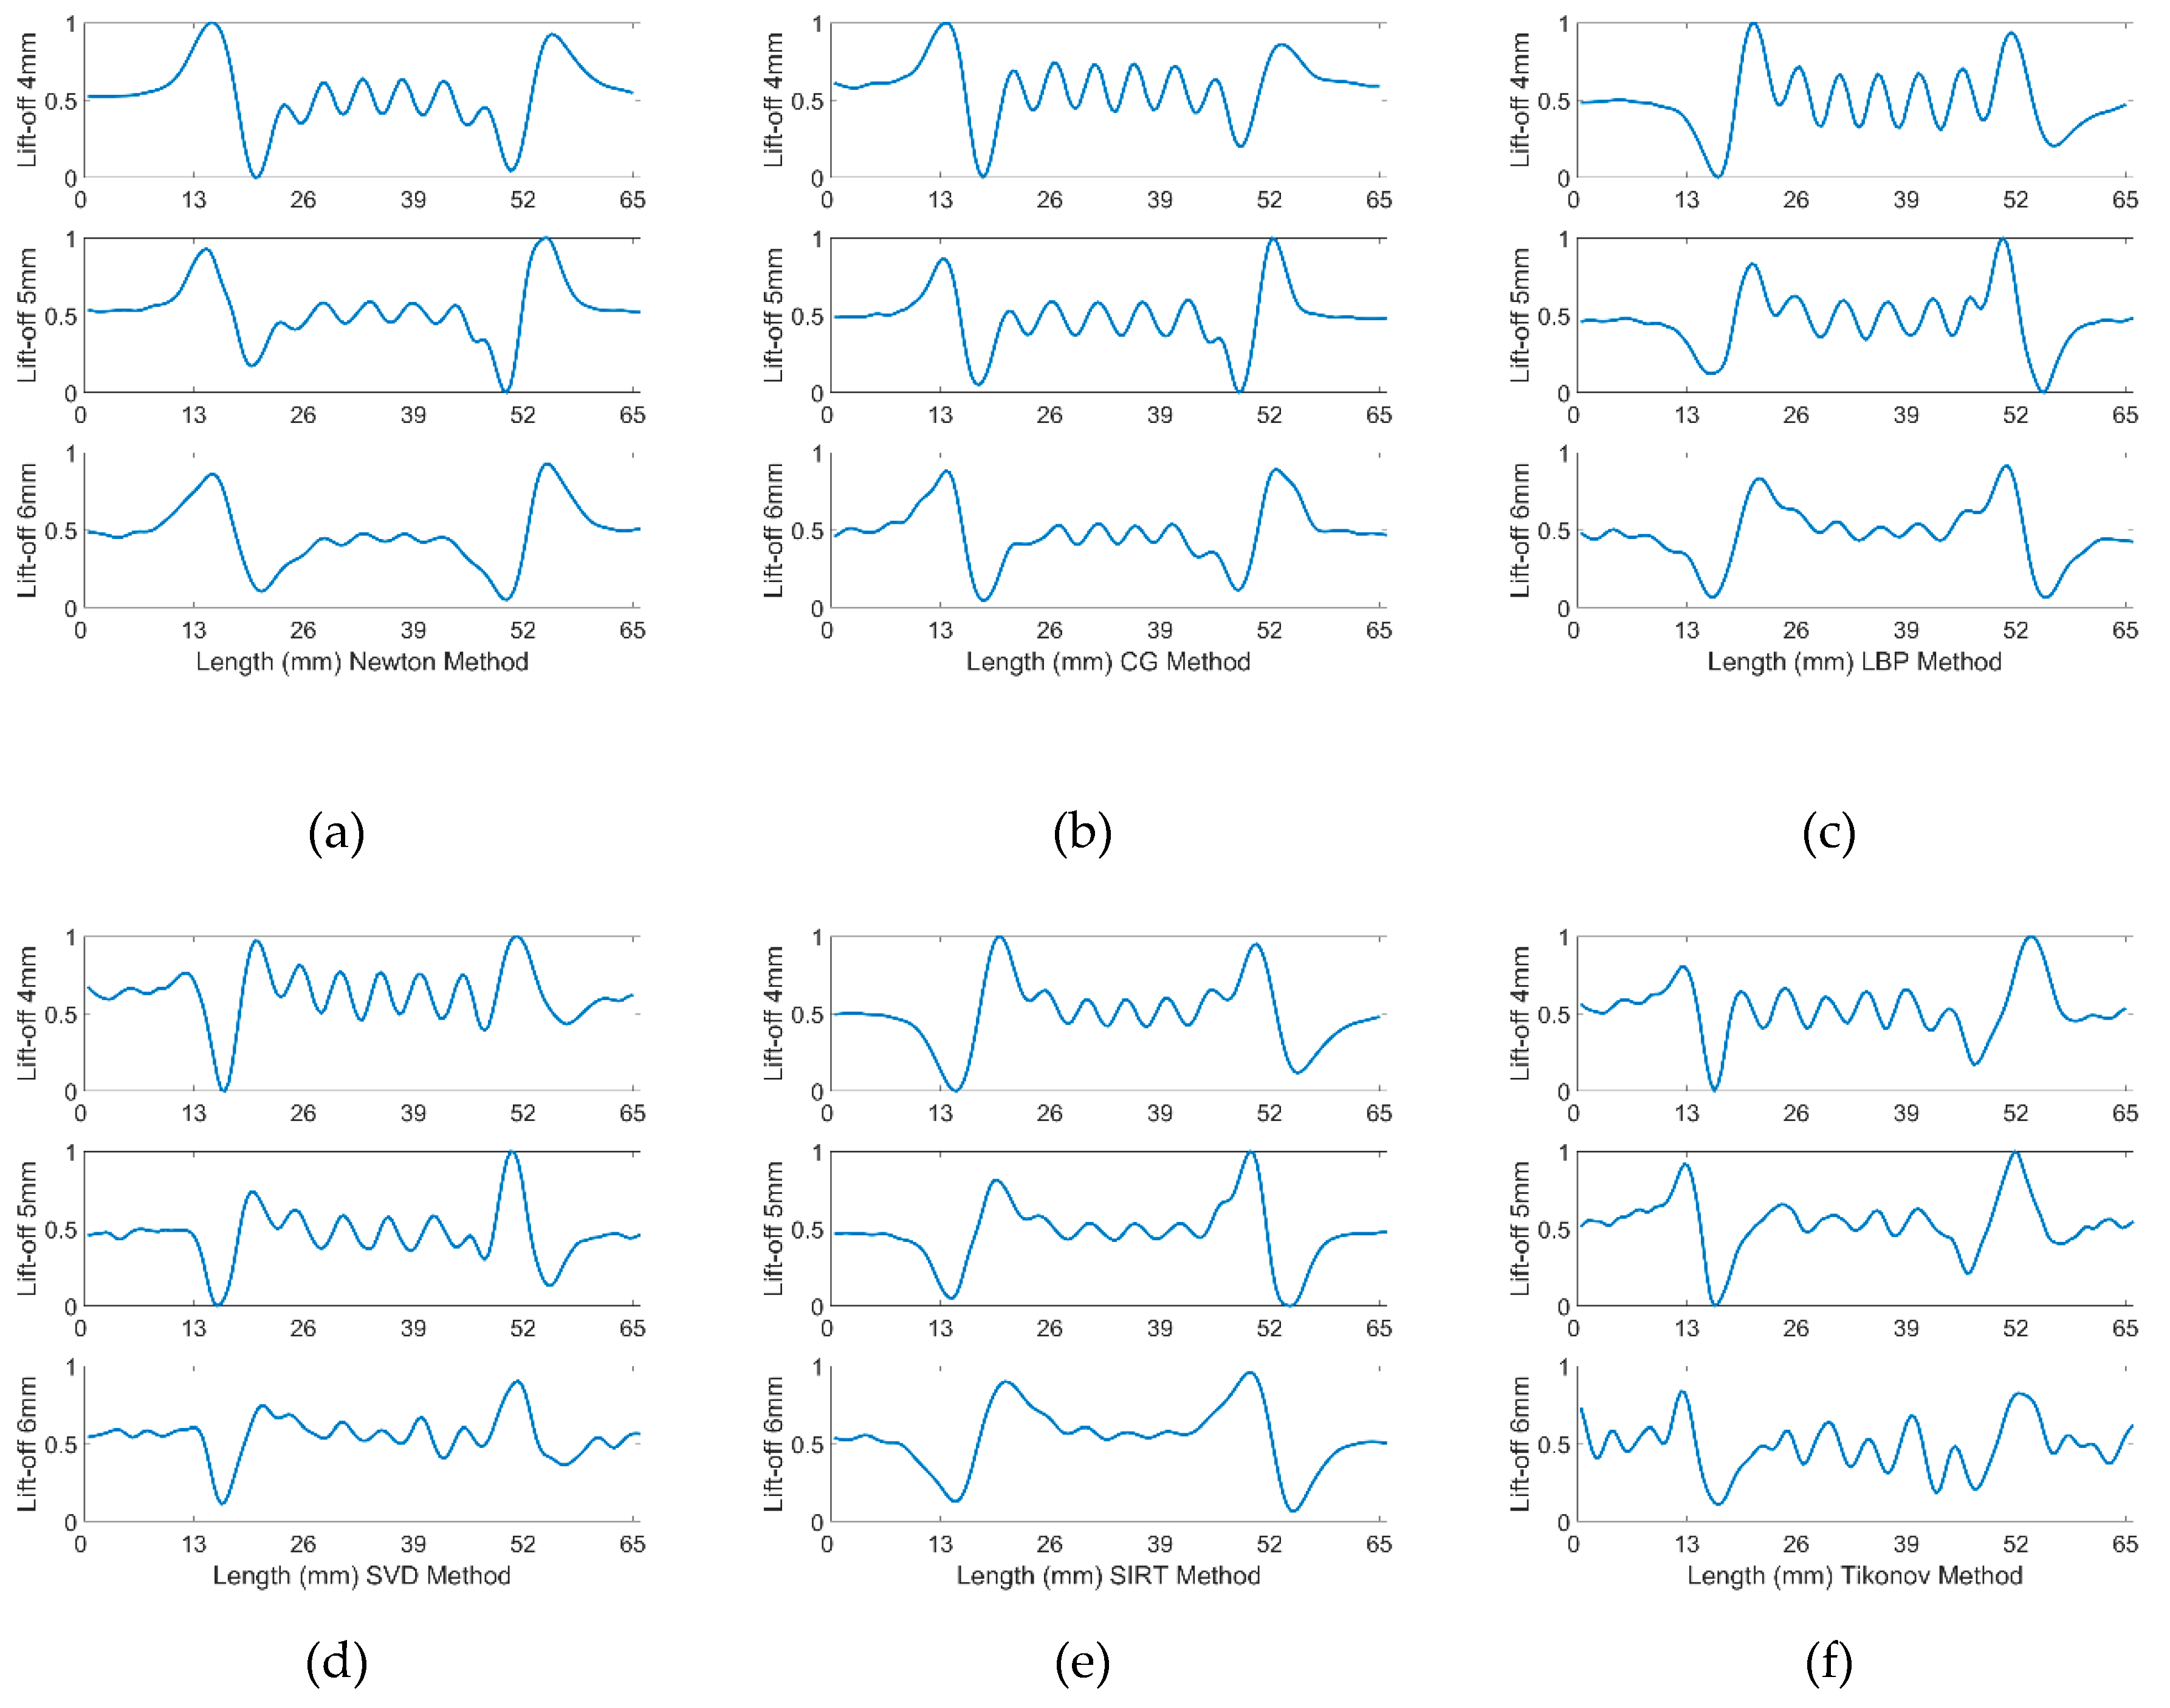
Distinguishing the response signals corresponding to specific cracks from the peak of the bump becomes challenging when the lift-off is set to 6 mm. This difficulty is evident in Figure 13 in Appendix, where the received signals from coil pairs with shorter spacings are processed. The underlying issue is that the reduced distance between coils results in a diminished penetration depth, adversely affecting signal clarity and the ability to identify cracks accurately. Accordingly, pairings 10 to 14, characterized by their wider spacings, were selected for analysis across all algorithms. The outcomes of this evaluation are depicted in
Figure 8 presented above. The analysis indicates a reduction in noise interference, allowing for the detection of cracks from the plots. Yet, determining the exact number of cracks remains challenging. Additionally, there is a noticeable decrease in the amplitude of the crack signal peaks at 4 mm and 5 mm lift-off, likely attributable to the diminished quantity of input signals available for data processing.
3.2.2. 5 Cracks with 10 mm Spacing
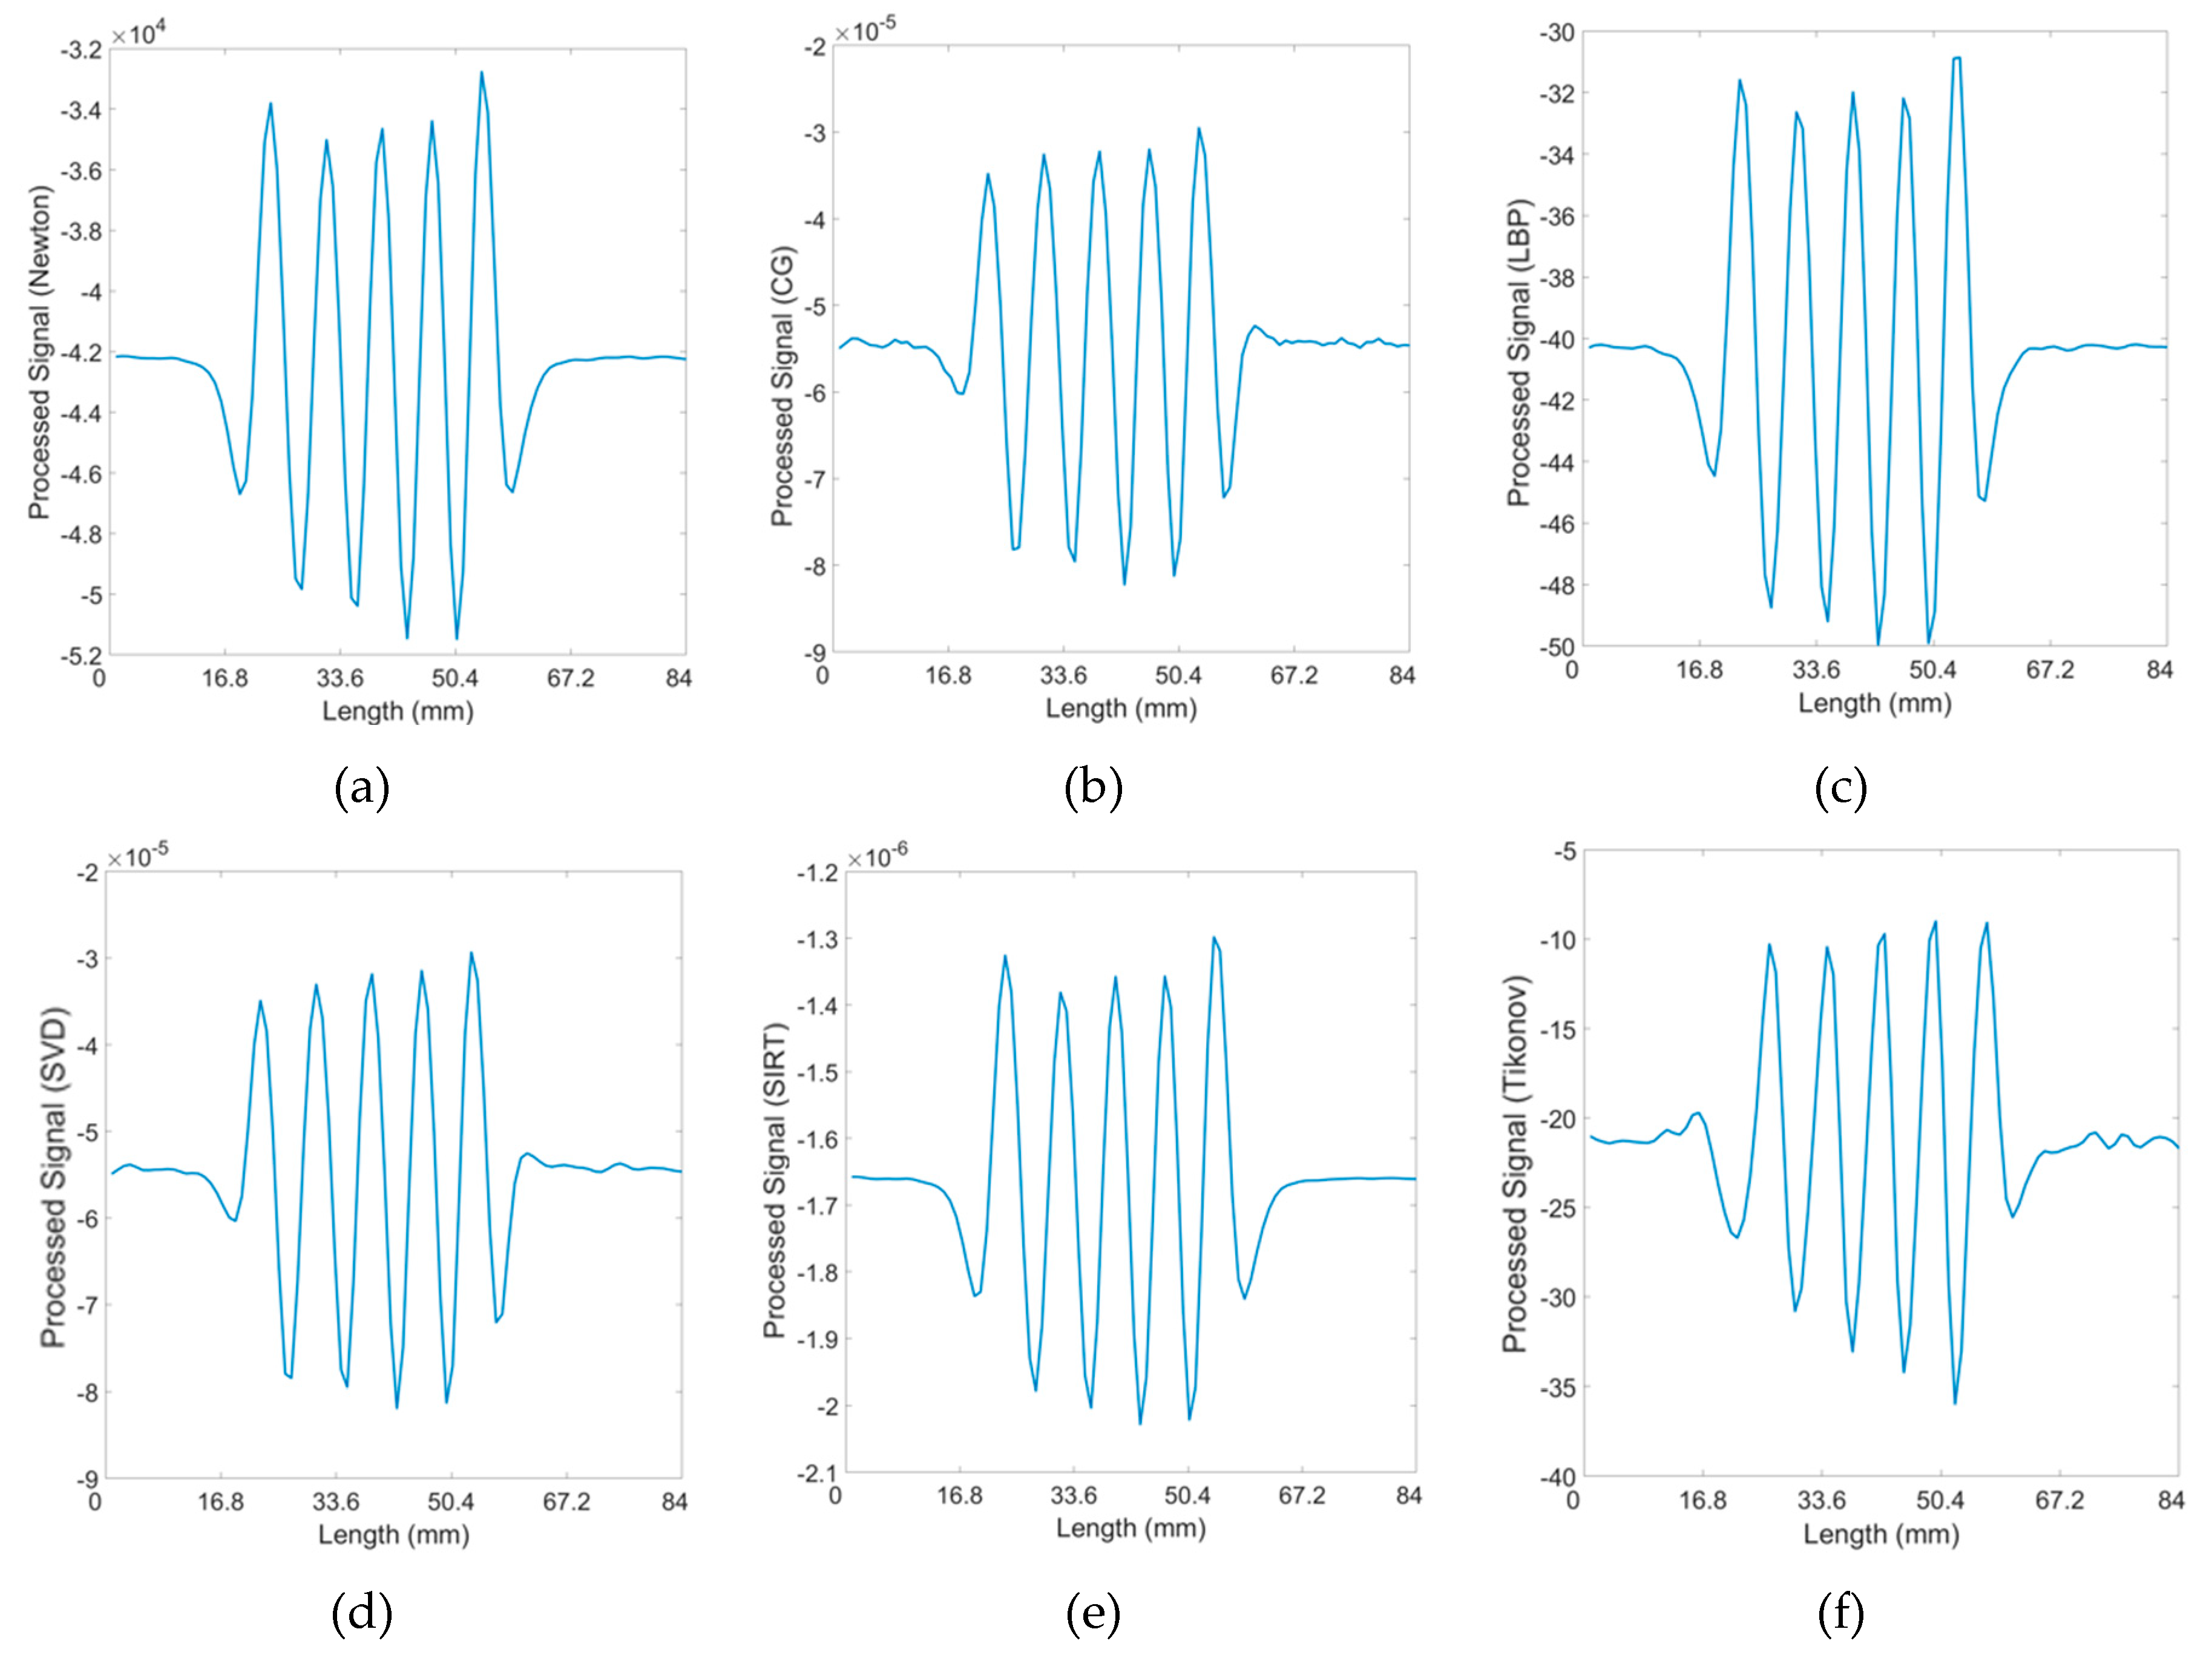
Given that the response signal can clearly identify cracks with a 10 mm spacing, it is crucial to assess whether the processing algorithms might alter the raw data.
Figure 9 illustrates this point effectively, showing that all five cracks can be distinguished by their respective peaks in the processed data. This indicates the algorithms preserve the integrity of the raw signal, allowing for accurate identification of cracks, a vital aspect for the reliability of the detection method.
3.2.3. Three Cracks with 6 mm, 9 mm and 12 mm depths
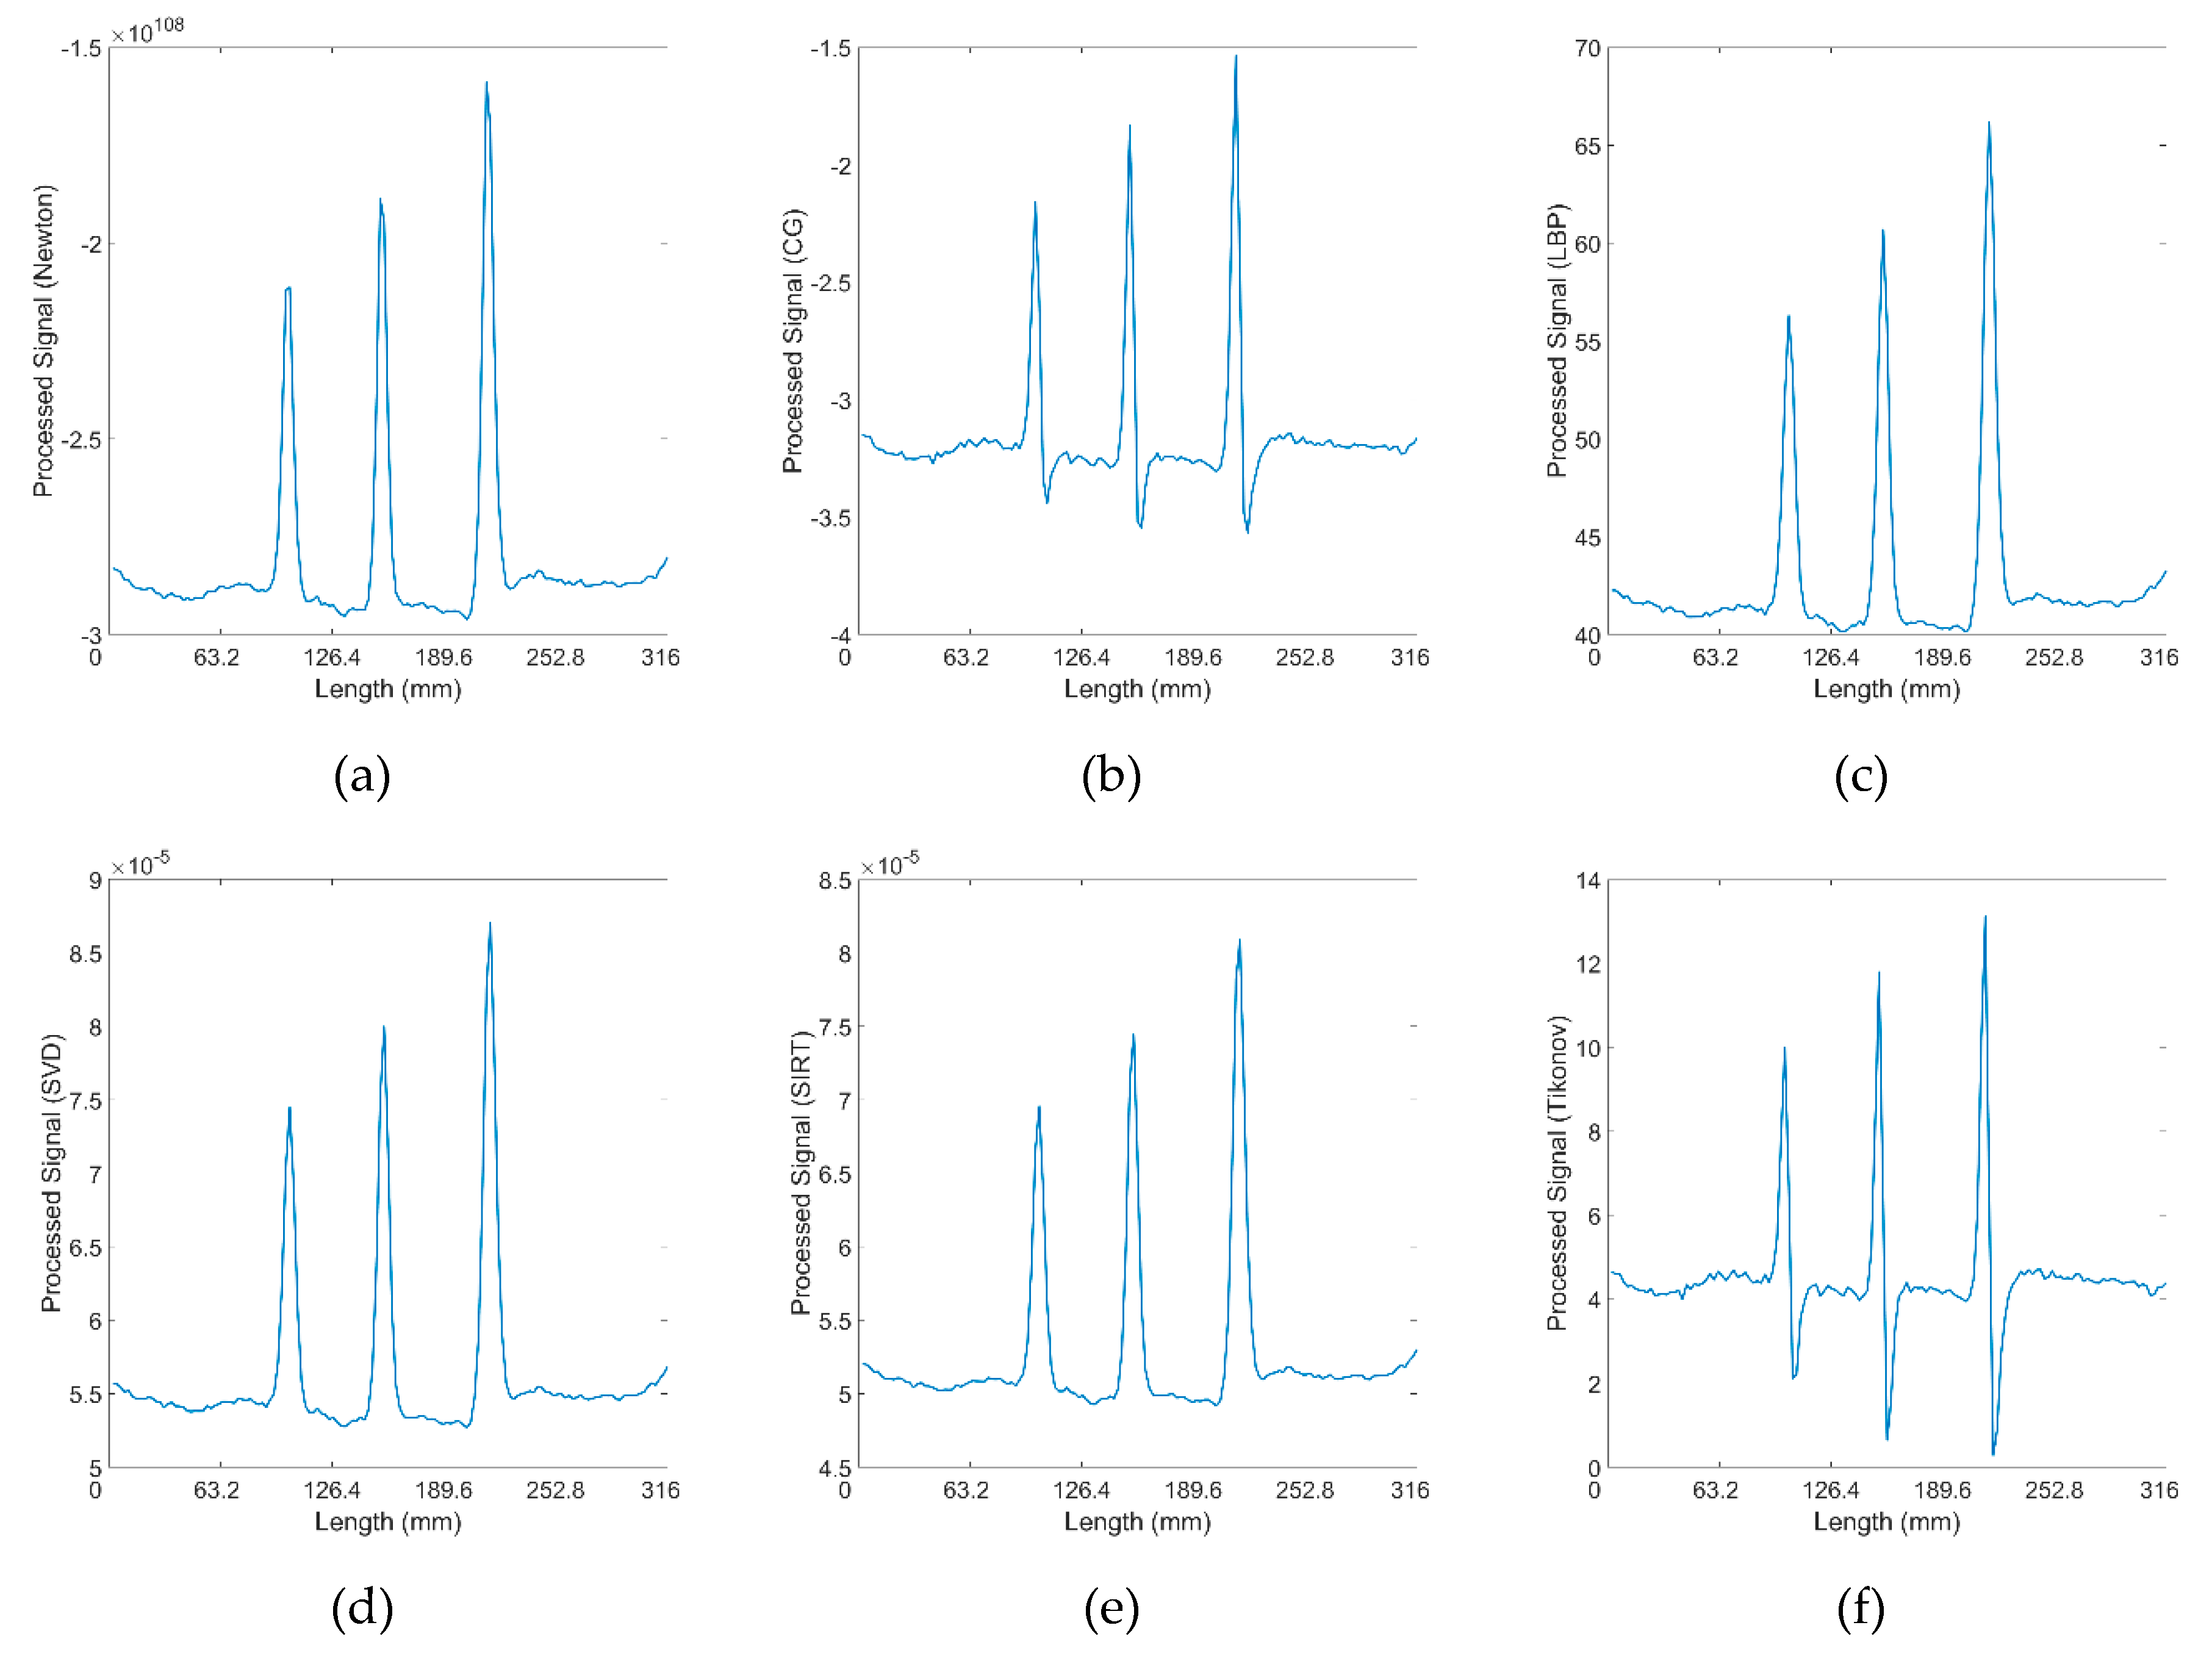
The algorithms were also applied to signals received from three cracks of varying depths, aiming to determine if data processing impacts the signal’s sensitivity to crack depth.
Figure 10 demonstrate that the peak amplitude of the signal for each crack correlates nearly directly with the crack’s depth. This correlation suggests that the algorithms effectively enable the assessment of cracks of different depths on railway tracks, providing a reliable means to gauge the severity of such defects based on signal amplitude analysis.
4. Conclusions
In conclusion, this research introduces an innovative approach to railway track crack detection, incorporating a nine-coil sensor array, a multi-channel instrument, and sophisticated inverse algorithms, specifically Newton-Raphson, CG, and LBP algorithms. Operating at a frequency of 200 kHz and with a lift-off of 5 mm, this system achieves an optimal balance between lift-off and spatial resolution. It significantly enhances the detection of closely spaced cracks (as narrow as 5 mm apart) through refined data processing techniques, facilitating more accurate crack identification. The carefully chosen probe lift-off not only minimizes the risk of damage to the sensitive sensor probe but also ensures data quality. This approach does not compromise the system’s ability to detail intricate information about the defects. The processed data demonstrates the system’s success in distinguishing between cracks of various depths and intervals, highlighting the algorithms’ capacity to extract useful information from the raw signal. These findings show promise to realize non-contact railway defect detection capabilities.
Future research will expand upon this work by exploring the integration of this system into railway test vehicles, assessing its performance in practical rail conditions, and further refining the sensing system and algorithms for increased performance.
Appendix A
This appendix presents a comprehensive compilation of the raw data collected by the introduced sensing system, which serves as the basis for subsequent data processing.
Table A1.
9-coil sensor array with 36 coil pair combinations.
Table A1.
9-coil sensor array with 36 coil pair combinations.
| Coil combinations |
|---|
| Order |
Transmitter |
Receiver |
Order |
Transmitter |
Receiver |
Order |
Transmitter |
Receiver |
| 1 |
Coil 9 |
Coil 1 |
13 |
Coil 1 |
Coil 6 |
25 |
Coil 3 |
Coil 7 |
| 2 |
Coil 9 |
Coil 2 |
14 |
Coil 1 |
Coil 7 |
26 |
Coil 3 |
Coil 8 |
| 3 |
Coil 9 |
Coil 3 |
15 |
Coil 1 |
Coil 8 |
27 |
Coil 4 |
Coil 5 |
| 4 |
Coil 9 |
Coil 4 |
16 |
Coil 2 |
Coil 3 |
28 |
Coil 4 |
Coil 6 |
| 5 |
Coil 9 |
Coil 5 |
17 |
Coil 2 |
Coil 4 |
29 |
Coil 4 |
Coil 7 |
| 6 |
Coil 9 |
Coil 6 |
18 |
Coil 2 |
Coil 5 |
30 |
Coil 4 |
Coil 8 |
| 7 |
Coil 9 |
Coil 7 |
19 |
Coil 2 |
Coil 6 |
31 |
Coil 5 |
Coil 6 |
| 8 |
Coil 9 |
Coil 8 |
20 |
Coil 2 |
Coil 7 |
32 |
Coil 5 |
Coil 7 |
| 9 |
Coil 1 |
Coil 2 |
21 |
Coil 2 |
Coil 8 |
33 |
Coil 5 |
Coil 8 |
| 10 |
Coil 1 |
Coil 3 |
22 |
Coil 3 |
Coil 4 |
34 |
Coil 6 |
Coil 7 |
| 11 |
Coil 1 |
Coil 4 |
23 |
Coil 3 |
Coil 5 |
35 |
Coil 6 |
Coil 8 |
| 12 |
Coil 1 |
Coil 5 |
24 |
Coil 3 |
Coil 6 |
36 |
Coil 7 |
Coil 8 |
Figure A1.
Received signals of 36 T-R pairings for 7 cracks at 5 mm spacing, at 4 mm lift-off and 200 kHz.
Figure A1.
Received signals of 36 T-R pairings for 7 cracks at 5 mm spacing, at 4 mm lift-off and 200 kHz.
Figure A2.
Received signals of 36 T-R pairings for 5 cracks at 5 mm spacing, at 5 mm lift-off and 200kHz.
Figure A2.
Received signals of 36 T-R pairings for 5 cracks at 5 mm spacing, at 5 mm lift-off and 200kHz.
Figure A3.
Received signals of 36 T-R pairings for 7 cracks at 5 mm spacing, at 6 mm lift-off and 200 kHz.
Figure A3.
Received signals of 36 T-R pairings for 7 cracks at 5 mm spacing, at 6 mm lift-off and 200 kHz.
Figure A4.
Received signals of 36 T-R pairings for 5 cracks at 10 mm spacing, at 5 mm lift-off and 200kHz.
Figure A4.
Received signals of 36 T-R pairings for 5 cracks at 10 mm spacing, at 5 mm lift-off and 200kHz.
Figure A5.
Received signals of 36 T-R pairings for 3 cracks with depths of 6, 9, 12 mm, at 5 mm lift-off and 200 kHz.
Figure A5.
Received signals of 36 T-R pairings for 3 cracks with depths of 6, 9, 12 mm, at 5 mm lift-off and 200 kHz.
References
- Saunders, S.; Crocker, R. A. Pedestrian and Vehicle-Mounted System for Detecting RCF in Rail using Eddy Currents. 19th World Conference on Non-Destructive Testing; 2016.
- Haidemenopoulos, G.N.; Sarafoglou, P.I.; Christopoulos, P.; Zervaki, A.D. Rolling contact fatigue cracking in rails subjected to in-service loading. Fatigue & Fracture of Engineering Materials & Structures 2016, 39, 1161–1172. [Google Scholar]
- Shen, J.; Zhou, L.; Warnett, J.; Williams, M.; Rowshandel, H.; Nicholson, G.; Davis, C. The influence of rcf crack propagation angle and crack shape on the ACFM signal. In 19th World Conf. Non Destr Test; 2016; pp. 1–9.
- Tillberg, J.; Larsson, F.; Runesson, K. A study of multiple crack interaction at rolling contact fatigue loading of rails. Proceedings of the Institution of Mechanical Engineers, Part F: Journal of Rail and Rapid Transit 2009, 2016223, 319–330. [Google Scholar] [CrossRef]
- Rajamäki, J.; Vippola, M.; Nurmikolu, A.; Viitala, T. Limitations of eddy current inspection in railway rail evaluation. Proceedings of the Institution of Mechanical Engineers, Part F: Journal of Rail and Rapid Transit 2018, 232, 121–129. [Google Scholar] [CrossRef]
- Mandache, C.; Brothers, M.; Lefebvre, V. ; Time domain lift-off compensation method for eddy current testing. NDT Net 2005, 10, 1–7. [Google Scholar]
- Van Drunen, G.; Cecco, V.S. ; Recognizing limitations in eddy-current testing. NDT international 1984, 17, 9–17. [Google Scholar] [CrossRef]
- Li, X.; Tian, G.; Li, K.; Zhang, Q.; Lu, X. ; Investigation of rolling contact fatigue cracks using the transmitter-receiver eddy current testing under moving conditions. Nondestructive Testing and Evaluation 2023, 1–20. [Google Scholar] [CrossRef]
- Xu, P.; Zhu, C.L.; Zeng, H.M.; Wang, P. ; Rail crack detection and evaluation at high speed based on differential ECT system. Measurement 2020, 166, 108152. [Google Scholar] [CrossRef]
- Kwon, S.G.; Lee, T.G.; Park, S.J.; Park, J.W.; Seo, J.M. ; Natural Rail Surface Defect Inspection and Analysis Using 16-Channel Eddy Current System. Applied Sciences 2021, 11, 8107. [Google Scholar] [CrossRef]
- Blitz, J.; Willsttäter, V.J.; Oaten, S.R.; Hajian, N.T. ; Eddy-current surface-crack sizing in steel with high lift-off. NDT international 1987, 20, 105–110. [Google Scholar] [CrossRef]
- Sukhanov, D.; Zavyalova, K.; Kadurina, A. ; Method for enhancement of spatial resolution of eddy current imaging. Measurement Science and Technology 2019, 30, 065402. [Google Scholar] [CrossRef]
- Meng, X.; Lu, M.; Yin, W.; Bennecer, A.; Kirk, K.J. ; Evaluation of coating thickness using lift-off insensitivity of eddy current sensor. Sensors 2021, 21, 419. [Google Scholar] [CrossRef] [PubMed]
- Xu, P.; Zeng, H.; Qian, T.; Liu, L. ; Research on defect detection of high-speed rail based on multi-frequency excitation composite electromagnetic method. Measurement 2022, 187, 110351. [Google Scholar] [CrossRef]
- Xu, P.; Qian, T. ; High-speed rail defect detection using multi-frequency exciting 3D ACFM. Measurement 2024, 227, 114160. [Google Scholar] [CrossRef]
- Shao, Y.; Meng, T.; Yu, K.; Xia, Z.; Huang, R.; Tao, Y.;…; Yin, W.; Automatic detection and imaging of rivet hole defects for aircraft structures with optimized sensor array using eddy current method and image analysis. IEEE Sensors Journal 2022, 23, 4597–4606.
- Yin, W.; Peyton, A.J. ; Sensitivity formulation including velocity effects for electromagnetic induction systems. IEEE Transactions on Magnetics 2009, 46, 1172–1176. [Google Scholar] [CrossRef]
- Cui, Z.; Wang, Q.; Xue, Q.; Fan, W.; Zhang, L.; Cao, Z.;…; Yang, W.; A review on image reconstruction algorithms for electrical capacitance/resistance tomography. Sensor Review 2016, 36, 429–445. [CrossRef]
- Yang, W.Q.; Peng, L. ; Image reconstruction algorithms for electrical capacitance tomography. Measurement science and technology 2002, 14, R1. [Google Scholar] [CrossRef]
|
Disclaimer/Publisher’s Note: The statements, opinions and data contained in all publications are solely those of the individual author(s) and contributor(s) and not of MDPI and/or the editor(s). MDPI and/or the editor(s) disclaim responsibility for any injury to people or property resulting from any ideas, methods, instructions or products referred to in the content. |
© 2024 by the authors. Licensee MDPI, Basel, Switzerland. This article is an open access article distributed under the terms and conditions of the Creative Commons Attribution (CC BY) license (http://creativecommons.org/licenses/by/4.0/).
