Submitted:
02 April 2024
Posted:
02 April 2024
You are already at the latest version
Abstract
Keywords:
1. Introduction
2. Models and Simulation Methods
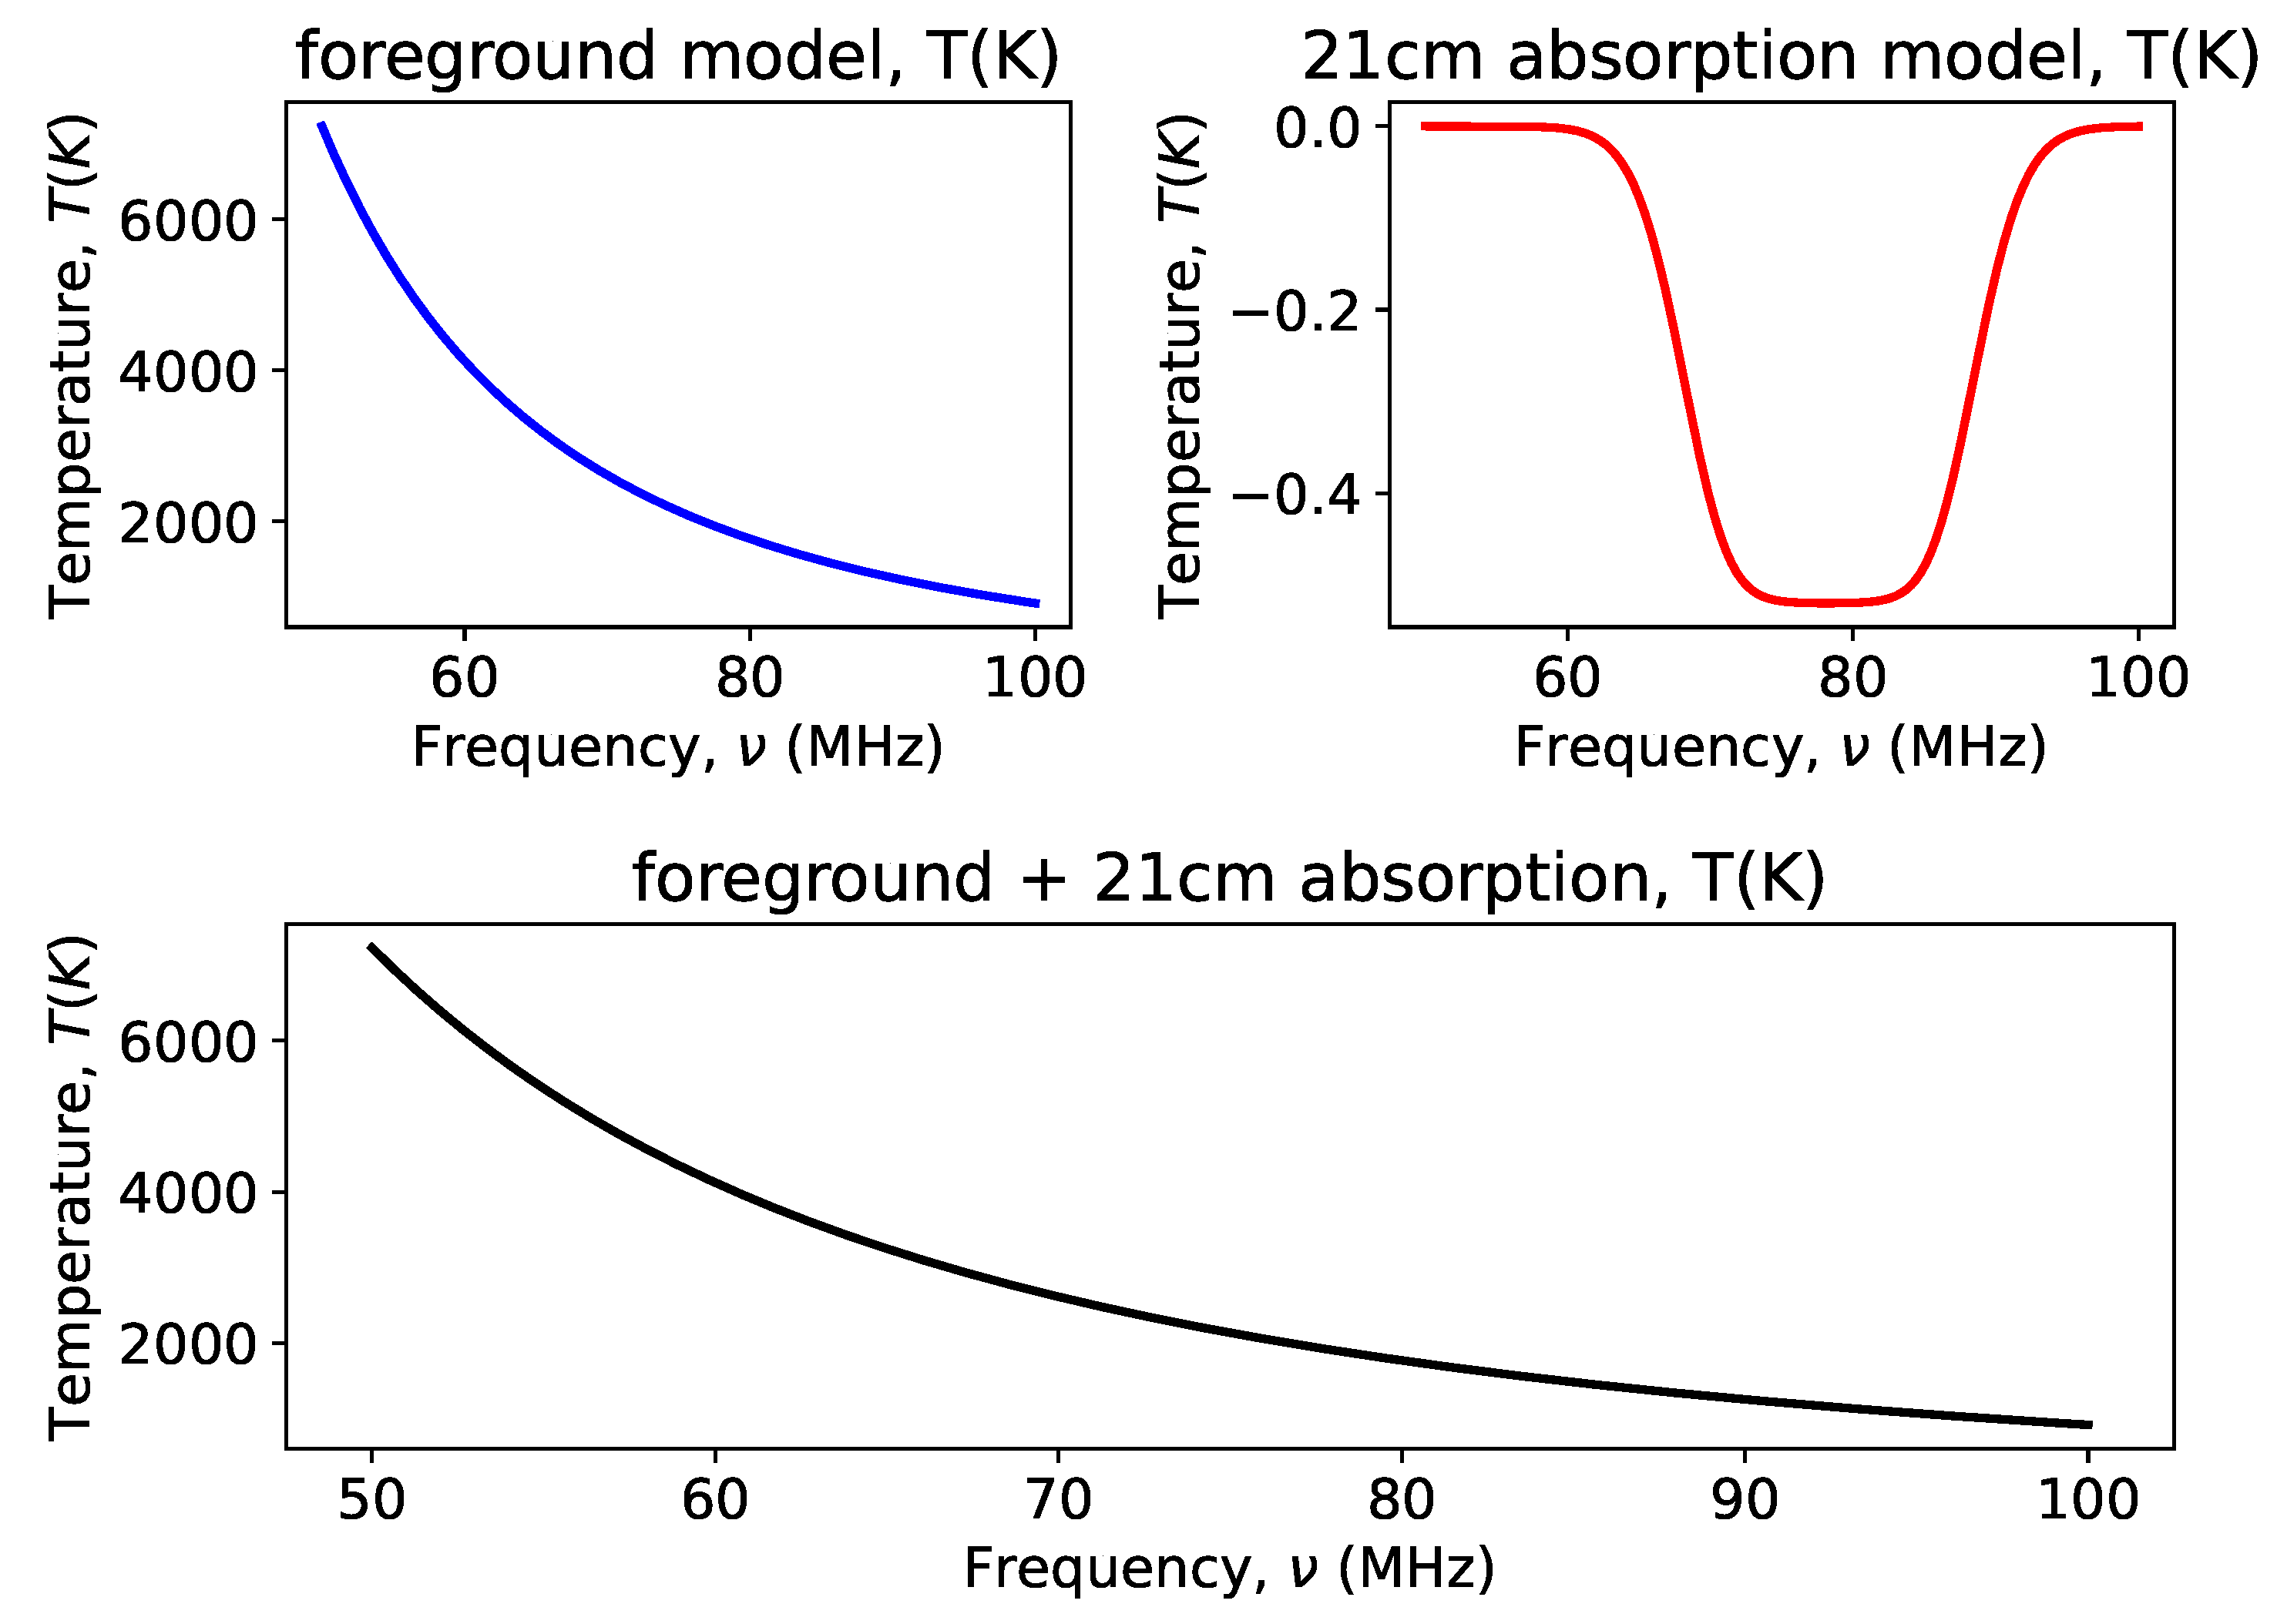
2.1. Foreground and 21 cm Spectrum Model
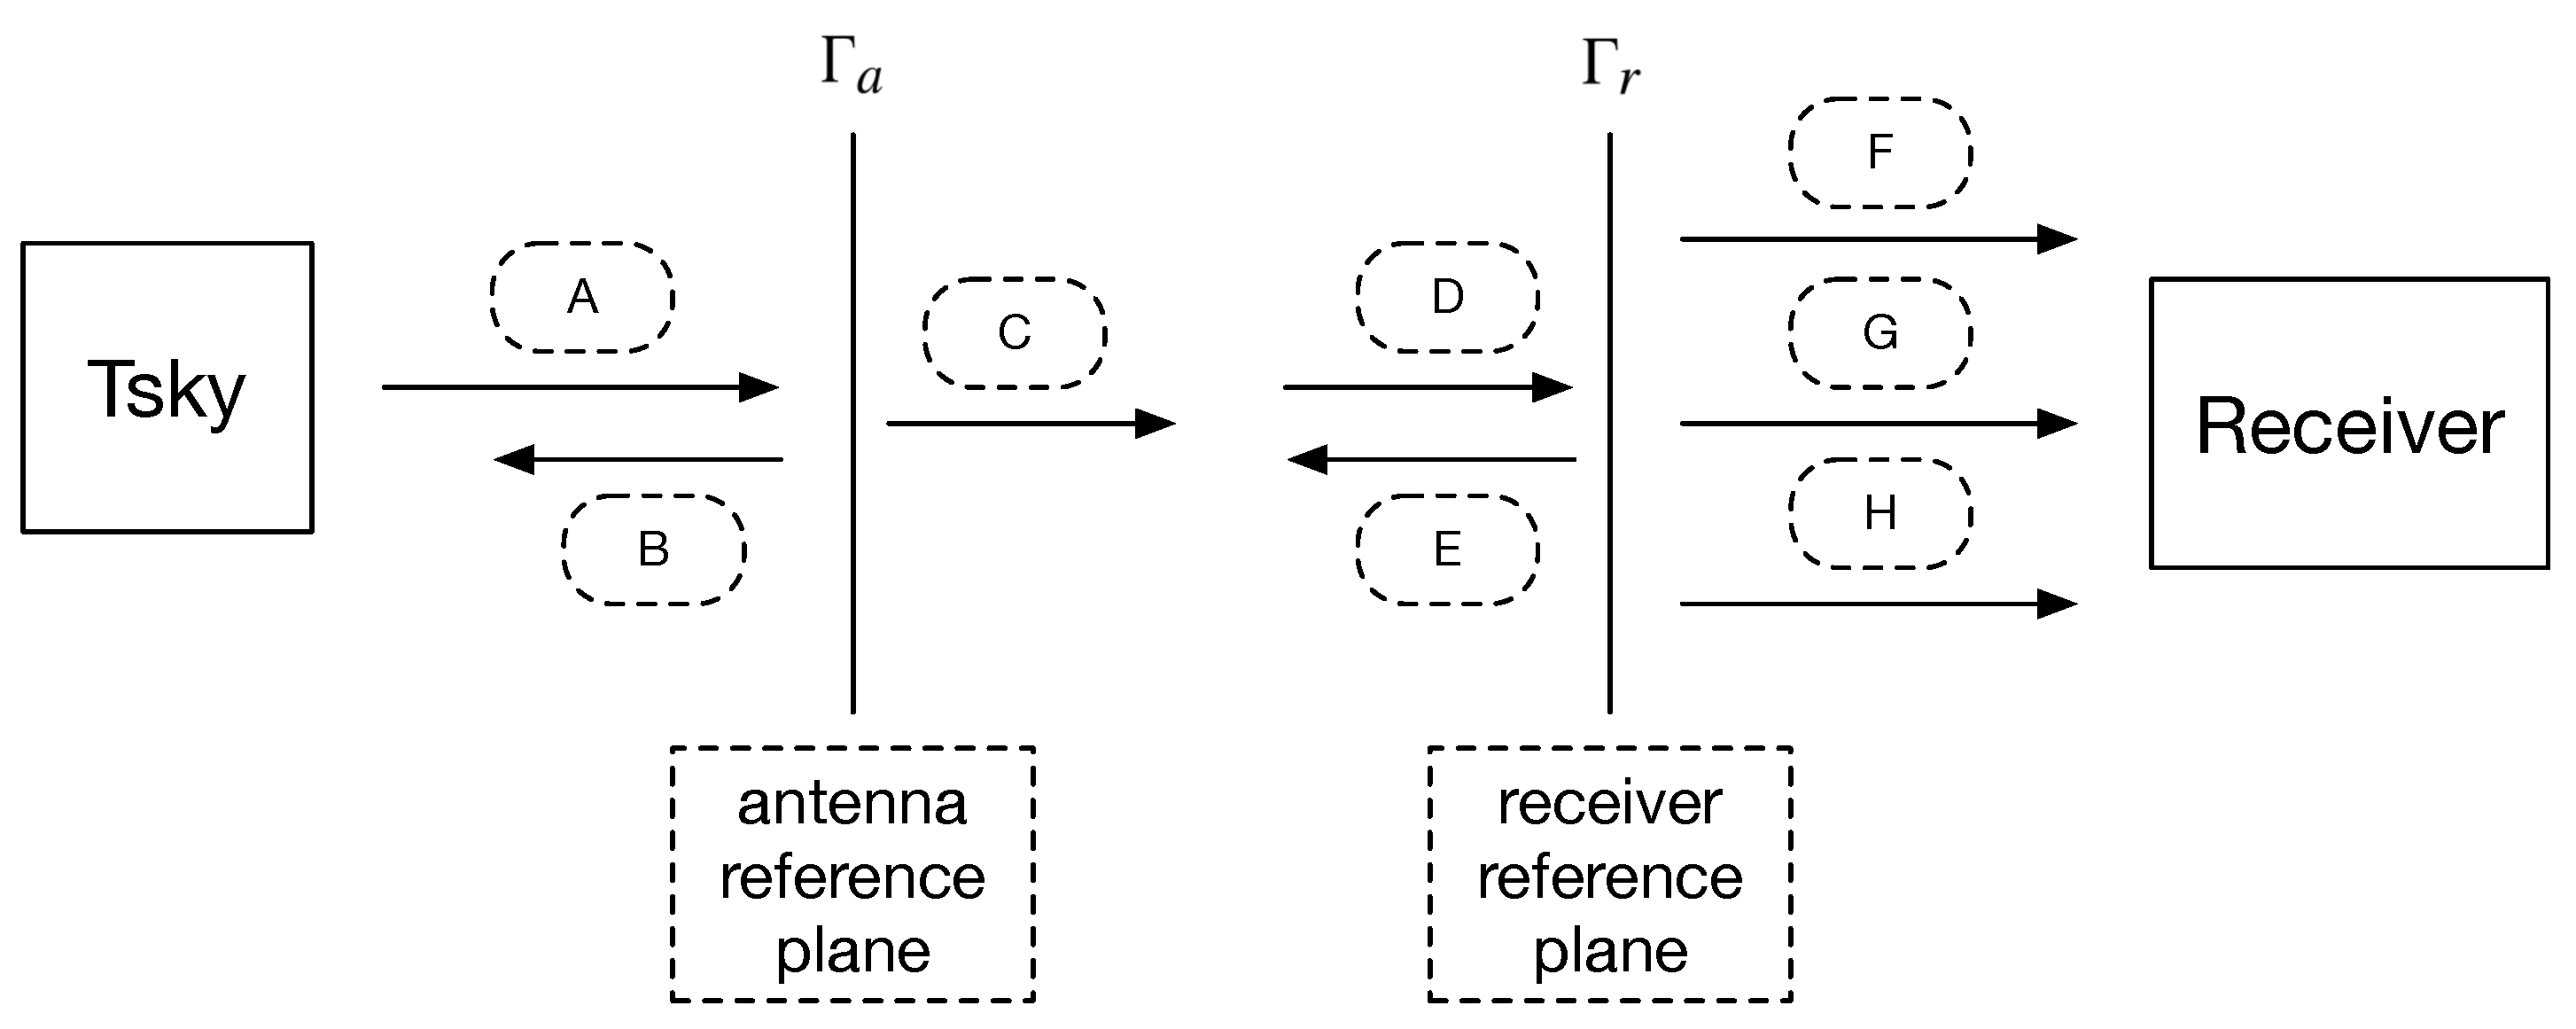
2.2. The Noise Wave Formulation
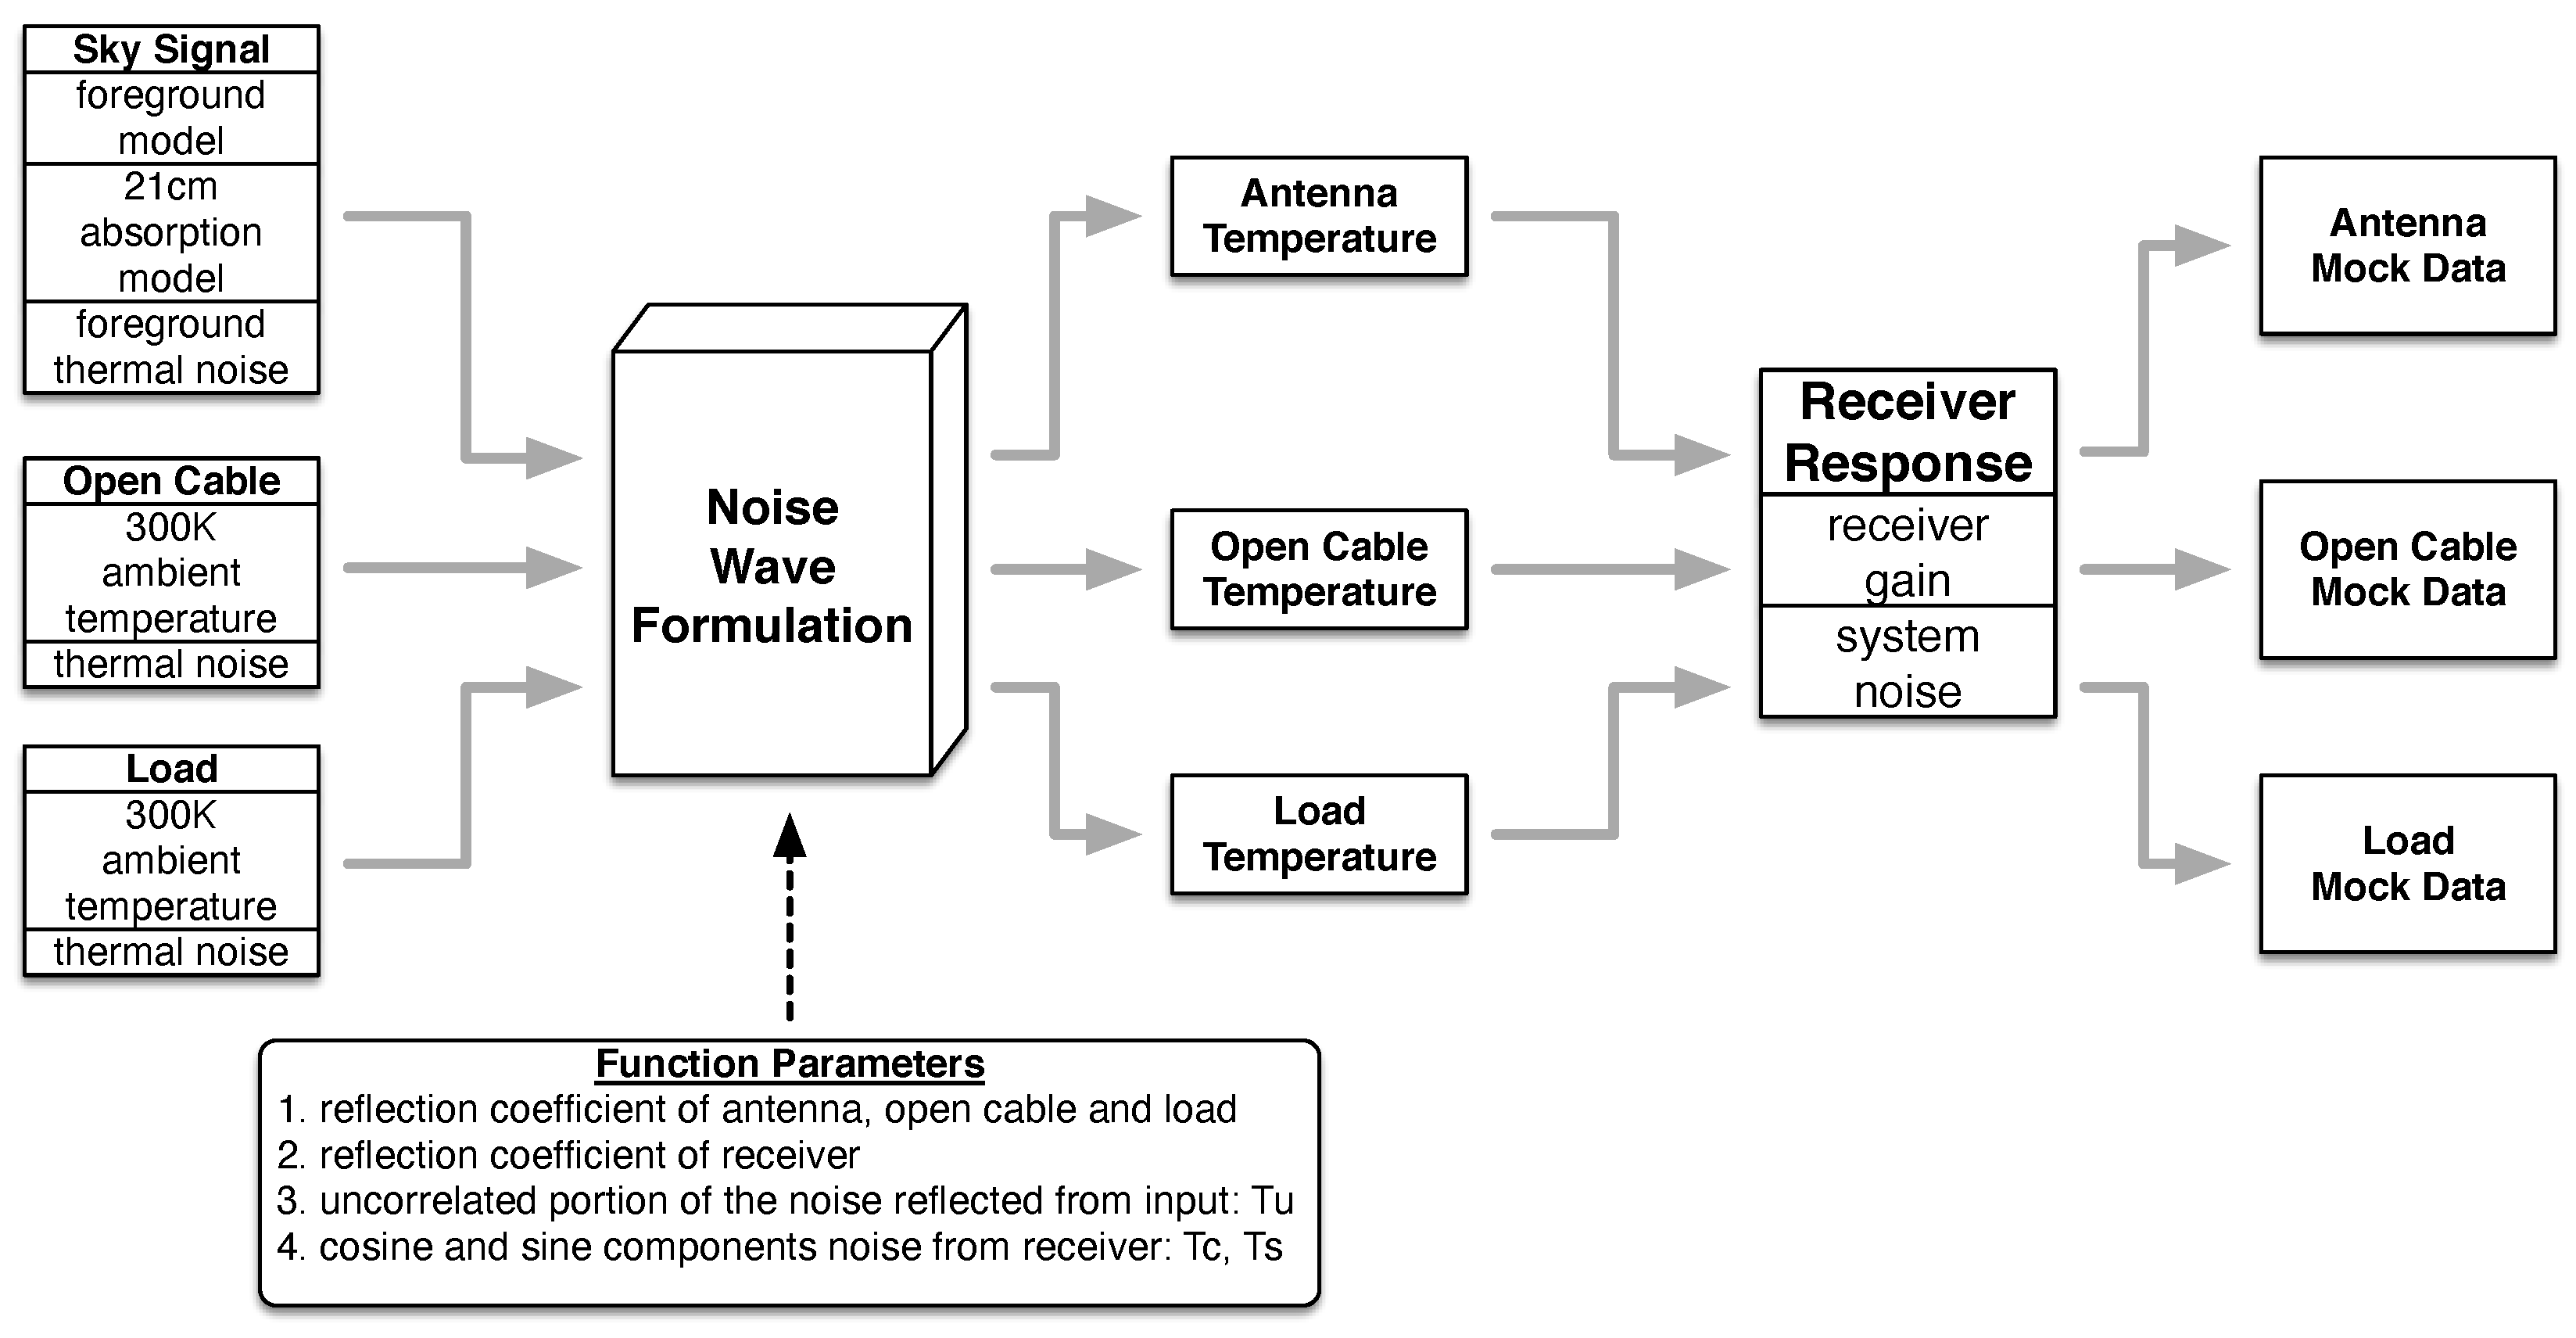
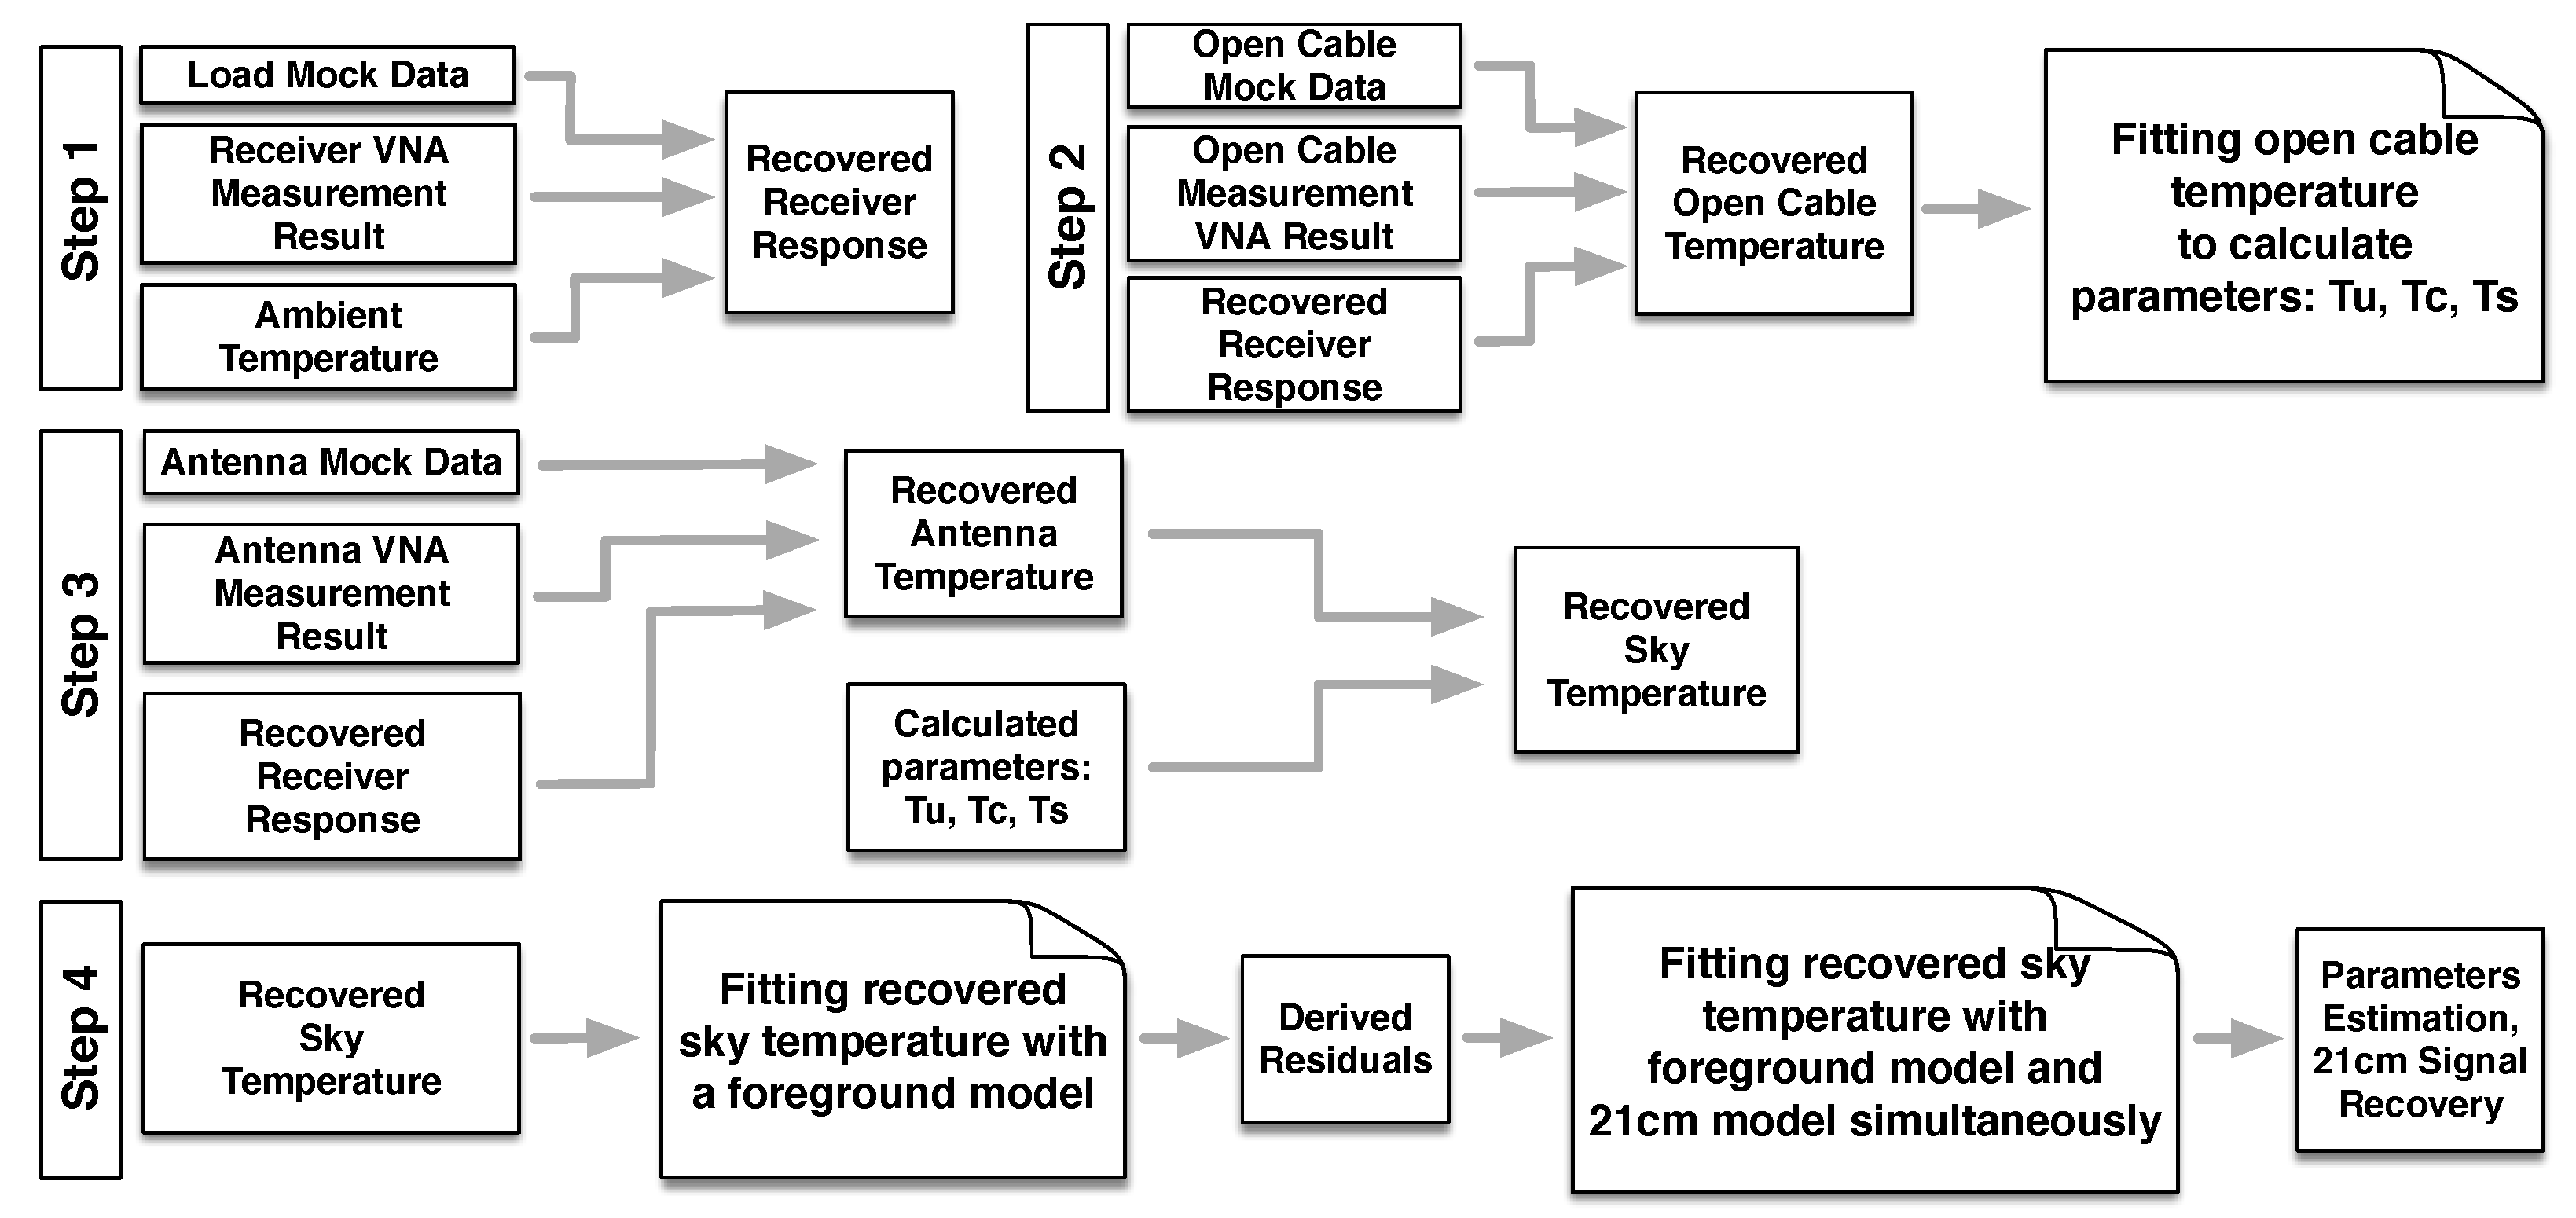
2.3. The Global Spectrum Measurement System
2.4. Hardware Models
2.5. Vna Measurement Error Model
3. Error Propagation
3.1. Receiver Error Simulation
3.2. Vna Error Simulation
3.3. Effect of an Attenuator
3.4. Discussions
4. Conclusions
Acknowledgements
Appendix A. Derivation of Calibration Formula Based on Noise Wave Concept
Appendix B. Vector Network Analyzer Measurement Uncertainty

References
- Madau, P.; Meiksin, A.; Rees, M.J. 21 centimeter tomography of the intergalactic medium at high redshift. The Astrophysical Journal 1997, 475, 429. [Google Scholar] [CrossRef]
- Chen, X.; Miralda-Escudé, J. The Spin-Kinetic Temperature Coupling and the Heating Rate due to Lyα Scattering before Reionization: Predictions for 21 Centimeter Emission and Absorption. apj 2004, 602, 1–11. [Google Scholar] [CrossRef]
- Chen, X.; Miralda-Escudé, J. The 21 cm Signature of the First Stars. apj 2008, 684, 18–33. [Google Scholar] [CrossRef]
- Furlanetto, S.R.; Oh, S.P.; Briggs, F.H. Cosmology at low frequencies: The 21 cm transition and the high-redshift Universe. Physics reports 2006, 433, 181–301. [Google Scholar] [CrossRef]
- Barkana, R. The rise of the first stars: Supersonic streaming, radiative feedback, and 21-cm cosmology. Physics Reports 2016, 645, 1–59. [Google Scholar] [CrossRef]
- Bowman, J.D.; Rogers, A.E.; Hewitt, J.N. Toward empirical constraints on the global redshifted 21 cm brightness temperature during the epoch of reionization. The Astrophysical Journal 2008, 676, 1. [Google Scholar] [CrossRef]
- Bowman, J.D.; Rogers, A.E.E. A lower limit of Δz>0.06 for the duration of the reionization epoch. Nature 2010, 468, 796–798. [Google Scholar] [CrossRef]
- Sokolowski, M.; Tremblay, S.E.; Wayth, R.B.; Tingay, S.J.; Clarke, N.; Roberts, P.; Waterson, M.; Ekers, R.D.; Hall, P.; Lewis, M.; others, *!!! REPLACE !!!*. BIGHORNS-broadband instrument for global HydrOgen ReioNisation signal. Publications of the Astronomical Society of Australia 2015, 32. [Google Scholar] [CrossRef]
- Patra, N.; Subrahmanyan, R.; Raghunathan, A.; Shankar, N.U. SARAS: a precision system for measurement of the cosmic radio background and signatures from the epoch of reionization. Experimental Astronomy 2013, 36, 319–370. [Google Scholar] [CrossRef]
- Singh, S.; Subrahmanyan, R.; Shankar, N.U.; Rao, M.S.; Girish, B.S.; Raghunathan, A.; Somashekar, R.; Srivani, K.S. SARAS 2: a spectral radiometer for probing cosmic dawn and the epoch of reionization through detection of the global 21-cm signal. Experimental Astronomy 2018, 45, 269–314. [Google Scholar] [CrossRef]
- T. , J.N.; Subrahmanyan, R.; Somashekar, R.; Shankar, N.U.; Singh, S.; Raghunathan, A.; Girish, B.S.; Srivani, K.S.; Rao, M.S. SARAS 3 CD/EoR radiometer: design and performance of the receiver. Experimental Astronomy 2021, 51, 193. [Google Scholar] [CrossRef]
- Philip, L.; Abdurashidova, Z.; Chiang, H.; Ghazi, N.; Gumba, A.; Heilgendorff, H.; Jáuregui-García, J.; Malepe, K.; Nunhokee, C.; Peterson, J.; others. Probing radio intensity at high-Z from marion: 2017 instrument. Journal of Astronomical Instrumentation 2019, 8, 1950004. [Google Scholar] [CrossRef]
- de Lera Acedo, E. REACH: Radio Experiment for the Analysis of Cosmic Hydrogen. 2019 International Conference on Electromagnetics in Advanced Applications (ICEAA). IEEE, 2019, pp. 0626–0629.
- Cumner, J.; Acedo, E.D.L.; de Villiers, D.I.L.; Anstey, D.; Kolitsidas, C.I.; Gurdon, B.; Fagnoni, N.; Alexander, P.; Bernardi, G.; Bevins, H.T.J.; Carey, S.; Cavillot, J.; Chiello, R.; Craeye, C.; Croukamp, W.; Ely, J.A.; Fialkov, A.; Gessey-Jones, T.; Gueuning, Q.; Handley, W.; Hills, R.; Josaitis, A.T.; Kulkarni, G.; Magro, A.; Maiolino, R.; Meerburg, P.D.; Mittal, S.; Pritchard, J.R.; Puchwein, E.; Razavi-Ghods, N.; Roque, I.L.V.; Saxena, A.; Scheutwinkel, K.H.; Shen, E.; Sims, P.H.; Smirnov, O.; Spinelli, M.; Zarb-Adami, K. Radio antenna design for sky-averaged 21 cm cosmology experiments: the REACH case, 2021. arXiv:astro-ph.IM/2109.10098.
- Price, D.; Greenhill, L.; Fialkov, A.; Bernardi, G.; Garsden, H.; Barsdell, B.; Kocz, J.; Anderson, M.; Bourke, S.; Craig, J.; others. Design and characterization of the Large-aperture Experiment to Detect the Dark Age (LEDA) radiometer systems. Monthly Notices of the Royal Astronomical Society 2018, 478, 4193–4213. [Google Scholar] [CrossRef]
- Voytek, T.C.; Natarajan, A.; Jáuregui García, J.M.; Peterson, J.B.; López-Cruz, O. PROBING THE DARK AGES AT z∼20: THE SCI-HI 21 cm ALL-SKY SPECTRUM EXPERIMENT. The Astrophysical Journal 2014, 782, L9. [Google Scholar] [CrossRef]
- Nhan, B.D.; Bordenave, D.D.; Bradley, R.F.; Burns, J.O.; Tauscher, K.; Rapetti, D.; Klima, P.J. Assessment of the Projection-induced Polarimetry Technique for Constraining the Foreground Spectrum in Global 21 cm Cosmology. The Astrophysical Journal 2019, 883, 126. [Google Scholar] [CrossRef]
- Bustos, R.; Monsalve, R. Mapper of the IGM Spin Temperature. http://www.physics.mcgill.ca/mist/, 2021.
- Bowman, J.D.; Rogers, A.E.; Monsalve, R.A.; Mozdzen, T.J.; Mahesh, N. An absorption profile centred at 78 megahertz in the sky-averaged spectrum. Nature 2018, 555, 67–70. [Google Scholar] [CrossRef]
- Singh, S.; T., J.N.; Subrahmanyan, R.; Shankar, N.U.; Girish, B.S.; Raghunathan, A.; Somashekar, R.; Srivani, K.S.; Rao, M.S. On the detection of a cosmic dawn signal in the radio background. 2021; arXiv:astro-ph.CO/2112.06778].
- Burns, J.; Bale, S.; Bradley, R.; Ahmed, Z.; Allen, S.; Bowman, J.; Furlanetto, S.; MacDowall, R.; Mirocha, J.; Nhan, B.; others. Global 21-cm Cosmology from the Farside of the Moon. arXiv 2021, arXiv:2103.05085. [Google Scholar]
- Burns, J.O.; Bradley, R.; Tauscher, K.; Furlanetto, S.; Mirocha, J.; Monsalve, R.; Rapetti, D.; Purcell, W.; Newell, D.; Draper, D.; others. A space-based observational strategy for characterizing the first stars and galaxies using the redshifted 21 cm global spectrum. The Astrophysical Journal 2017, 844, 33. [Google Scholar] [CrossRef]
- Chen, X.; Yan, J.; Deng, L.; Wu, F.; Wu, L.; Xu, Y.; Zhou, L. Discovering the Sky at the Longest wavelengths with a lunar orbit array. Phil. Trans. Roy. Soc. Lond. A 2020, arXiv:astro-ph.IM/2007.15794379, 20190566. [Google Scholar] [CrossRef]
- Meys, R.P. A Wave Approach to the Noise Properties of Linear Microwave Devices. IEEE Transactions on Microwave Theory and Techniques 1978, 26, 34–37. [Google Scholar] [CrossRef]
- Rogers, A.E.; Bowman, J.D. Absolute calibration of a wideband antenna and spectrometer for accurate sky noise temperature measurements. Radio Science 2012, 47, 1–9. [Google Scholar] [CrossRef]
- Monsalve, R.A.; Rogers, A.E.E.; Bowman, J.D.; Mozdzen, T.J. CALIBRATION OF THE EDGES HIGH-BAND RECEIVER TO OBSERVE THE GLOBAL 21 cm SIGNATURE FROM THE EPOCH OF REIONIZATION. The Astrophysical Journal 2017, 835, 49. [Google Scholar] [CrossRef]
- Monsalve, R.A.; Rogers, A.E.; Bowman, J.D.; Mozdzen, T.J. Results from EDGES High-band. I. Constraints on phenomenological models for the global 21 cm signal. The Astrophysical Journal 2017, 847, 64. [Google Scholar] [CrossRef]
- Roque, I.L.V.; Handley, W.J.; Razavi-Ghods, N. Bayesian noise wave calibration for 21-cm global experiments. mnras 2021, arXiv:astro-ph.IM/2011.14052]505, 2638–2646. [Google Scholar] [CrossRef]
- de Oliveira-Costa, A.; Tegmark, M.; Gaensler, B.; Jonas, J.; Landecker, T.; Reich, P. A model of diffuse Galactic radio emission from 10 MHz to 100 GHz. Monthly Notices of the Royal Astronomical Society 2008, 388, 247–260. [Google Scholar] [CrossRef]
- Cohen, A.; Fialkov, A.; Barkana, R.; Lotem, M. Charting the Parameter Space of the Global 21-cm Signal. Monthly Notices of the Royal Astronomical Society 2017, 472, 1915–1931. [Google Scholar] [CrossRef]
- Dassault Systèmes, I. CST, 2020.
- WanTcom, I. wantcominc, 2017.
- Keysight Technologies, I. Downloadable Vector Network Analyzer Uncertainty Calculator, 2020.
- Seager, S.; Sasselov, D.D.; Scott, D. A New Calculation of the Recombination Epoch. apjl 1999, 523, L1–L5. [Google Scholar] [CrossRef]
- Seager, S.; Sasselov, D.D.; Scott, D. How Exactly Did the Universe Become Neutral? apjs 2000, 128, 407–430. [Google Scholar] [CrossRef]
- Wong, W.Y.; Moss, A.; Scott, D. How well do we understand cosmological recombination? mnras 2008, arXiv:astro-ph/0711.1357386, 1023–1028. [Google Scholar] [CrossRef]
- Scott, D.; Moss, A. Matter temperature during cosmological recombination. mnras 2009, arXiv:astro-ph.CO/0902.3438397, 445–446. [Google Scholar] [CrossRef]
- Monsalve, R.A.; Rogers, A.E.; Mozdzen, T.J.; Bowman, J.D. One-port direct/reverse method for characterizing VNA calibration standards. IEEE Transactions on Microwave Theory and Techniques 2016, 64, 2631–2639. [Google Scholar] [CrossRef]
- Wong, K.; Hoffmann, J. Improving VNA measurement accuracy by including connector effects in the models of calibration standards. 82nd ARFTG Microwave Measurement Conference. IEEE, 2013, pp. 1–7.
- Markus Zeier, Djamel Allal, R.J. Guidelines on the Evaluation of Vector Network Analysers (VNA). EURAMET Calibration Guide No. 12 Version 3.0 (03/2018), 2018.
- Packard, H. Applying error correction to network analyzer measurements. Hewlett-Packard, Hewlett-Packard Appl. Note 1997, pp. 1287–3.
- Buber, T.; Narang, P.; Esposito, G.; Padmanabhan, S.; Zeier, M. Characterizing Uncertainty in S-Parameter Measurements. MICROWAVE JOURNAL 2019, 62, 88. [Google Scholar]
- Rytting, D.K. Network analyzer accuracy overview. 58th ARFTG Conference Digest. IEEE, 2001, Vol. 40, pp. 1–13.
- Ballo, D. Applying error correction to network analyzer measurements. Microwave Journal 1998, 41, 64–75. [Google Scholar]
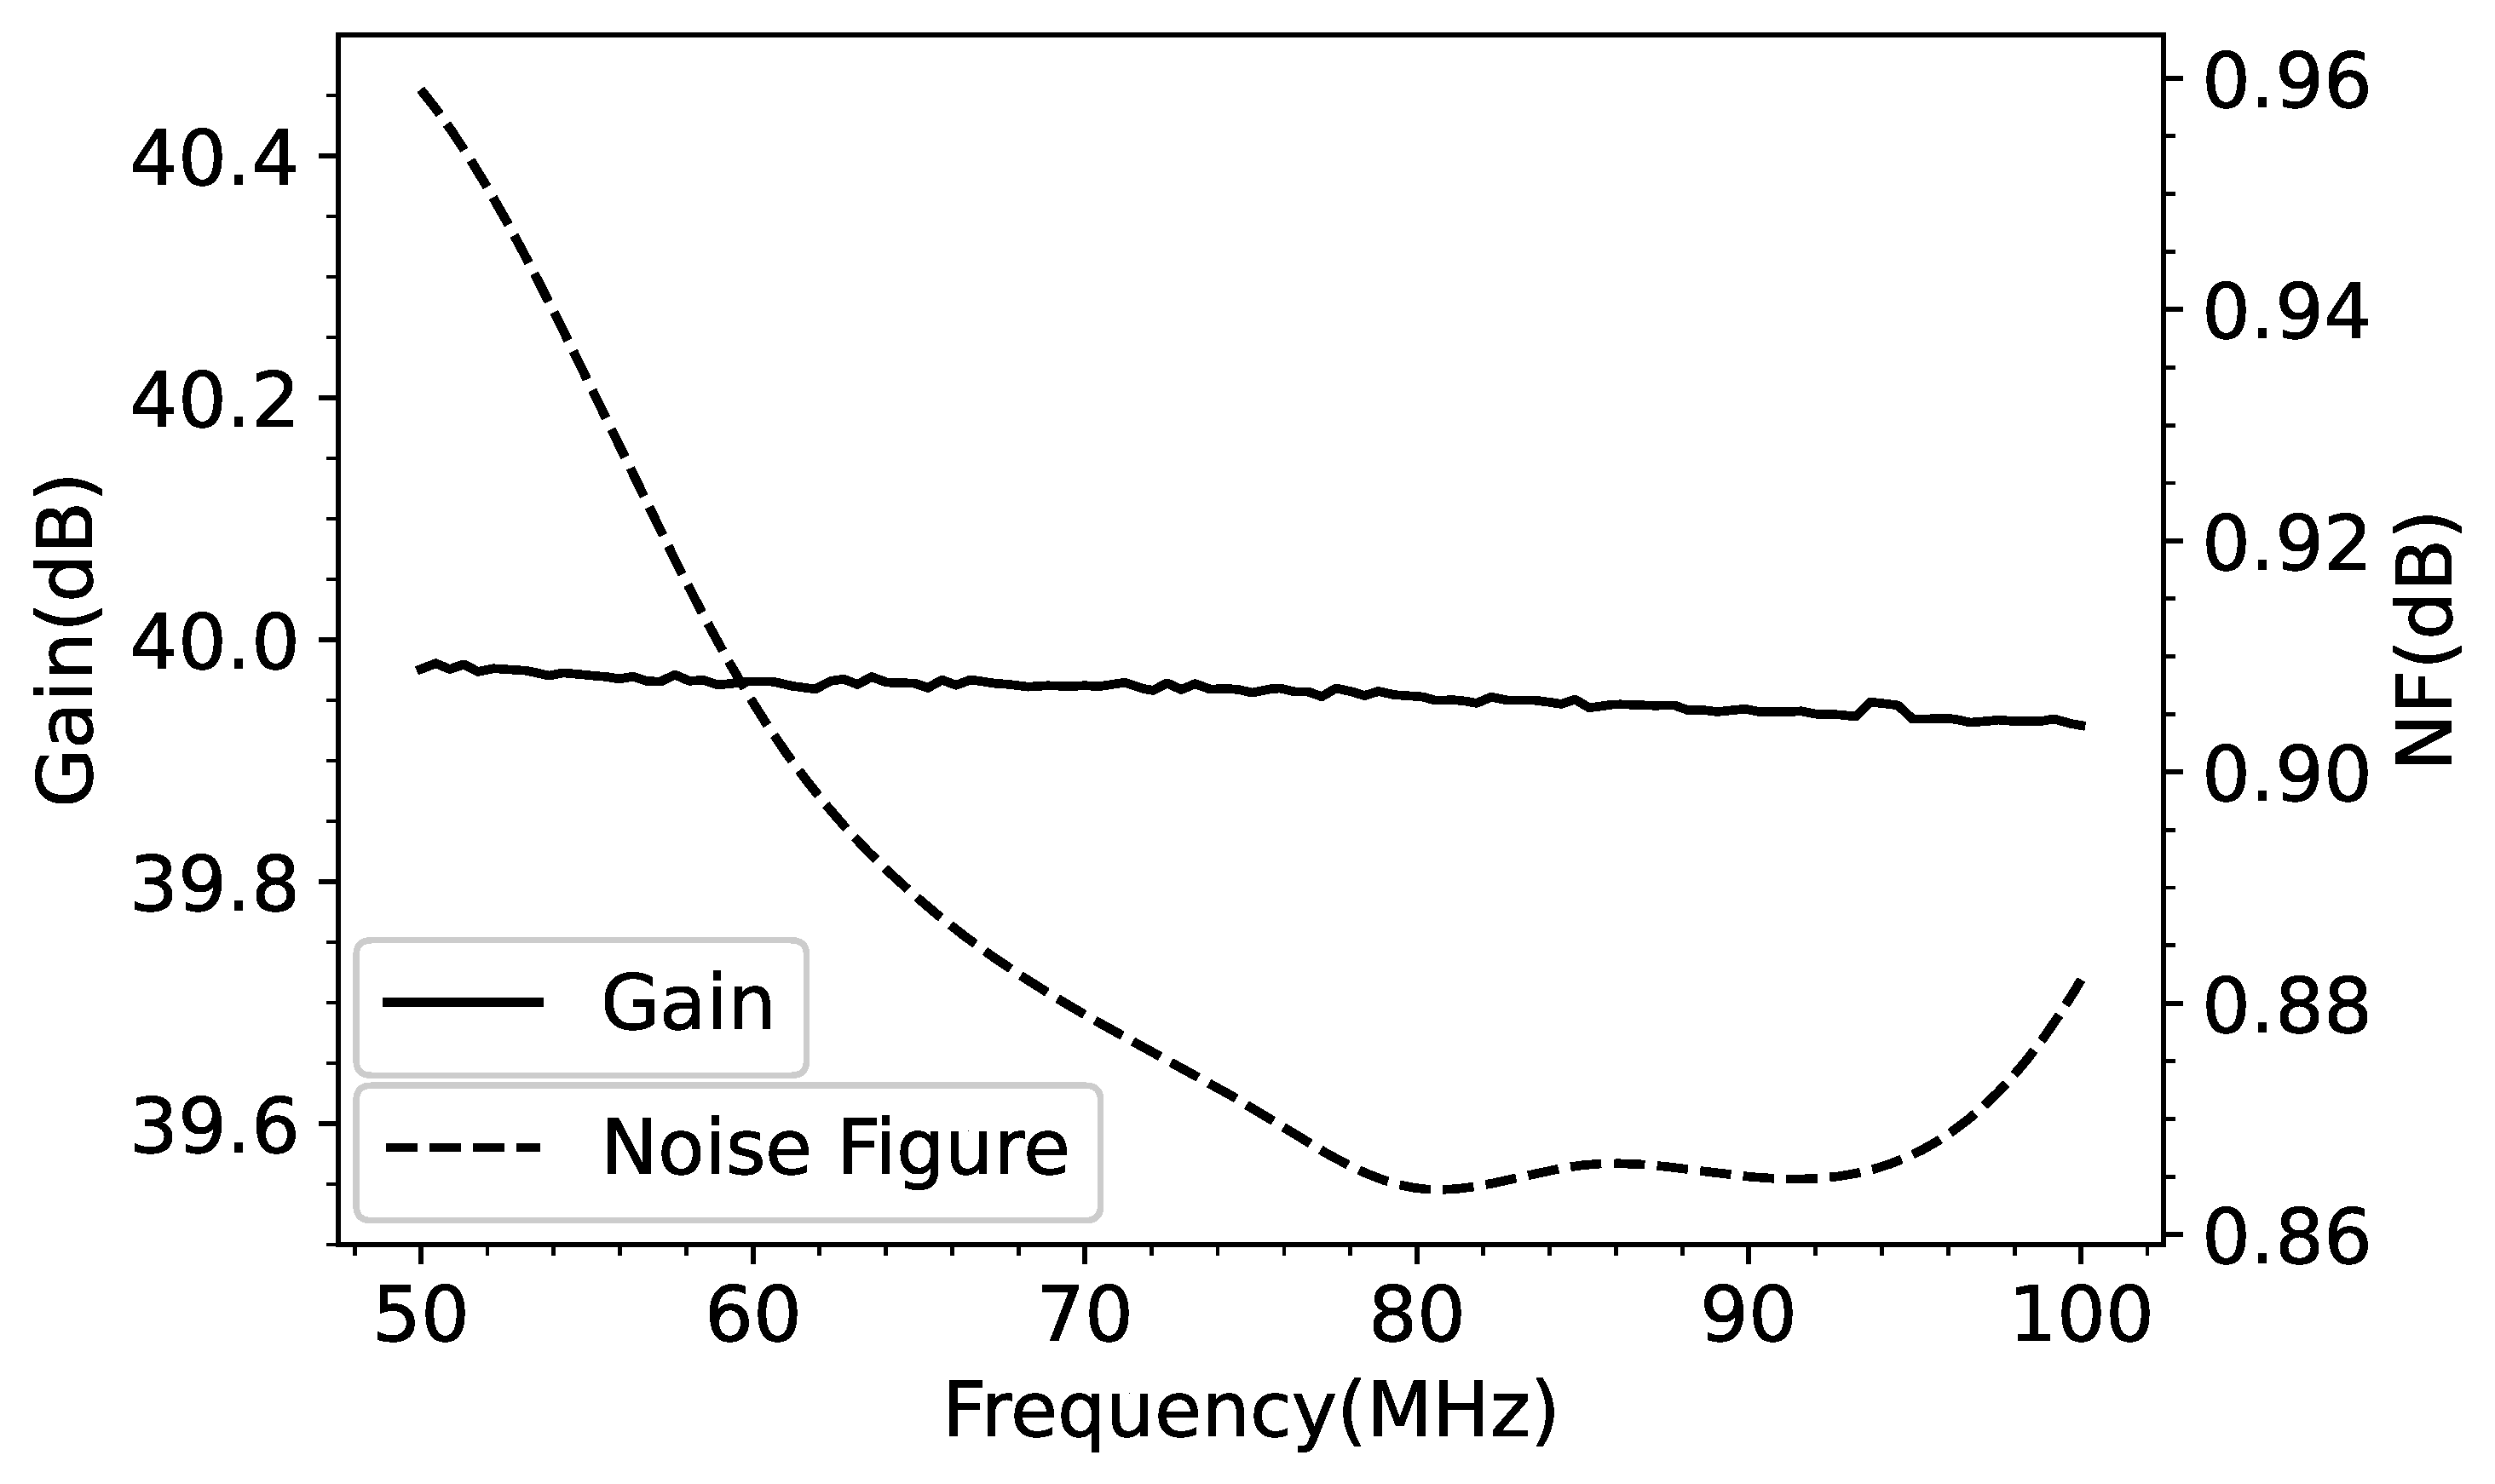
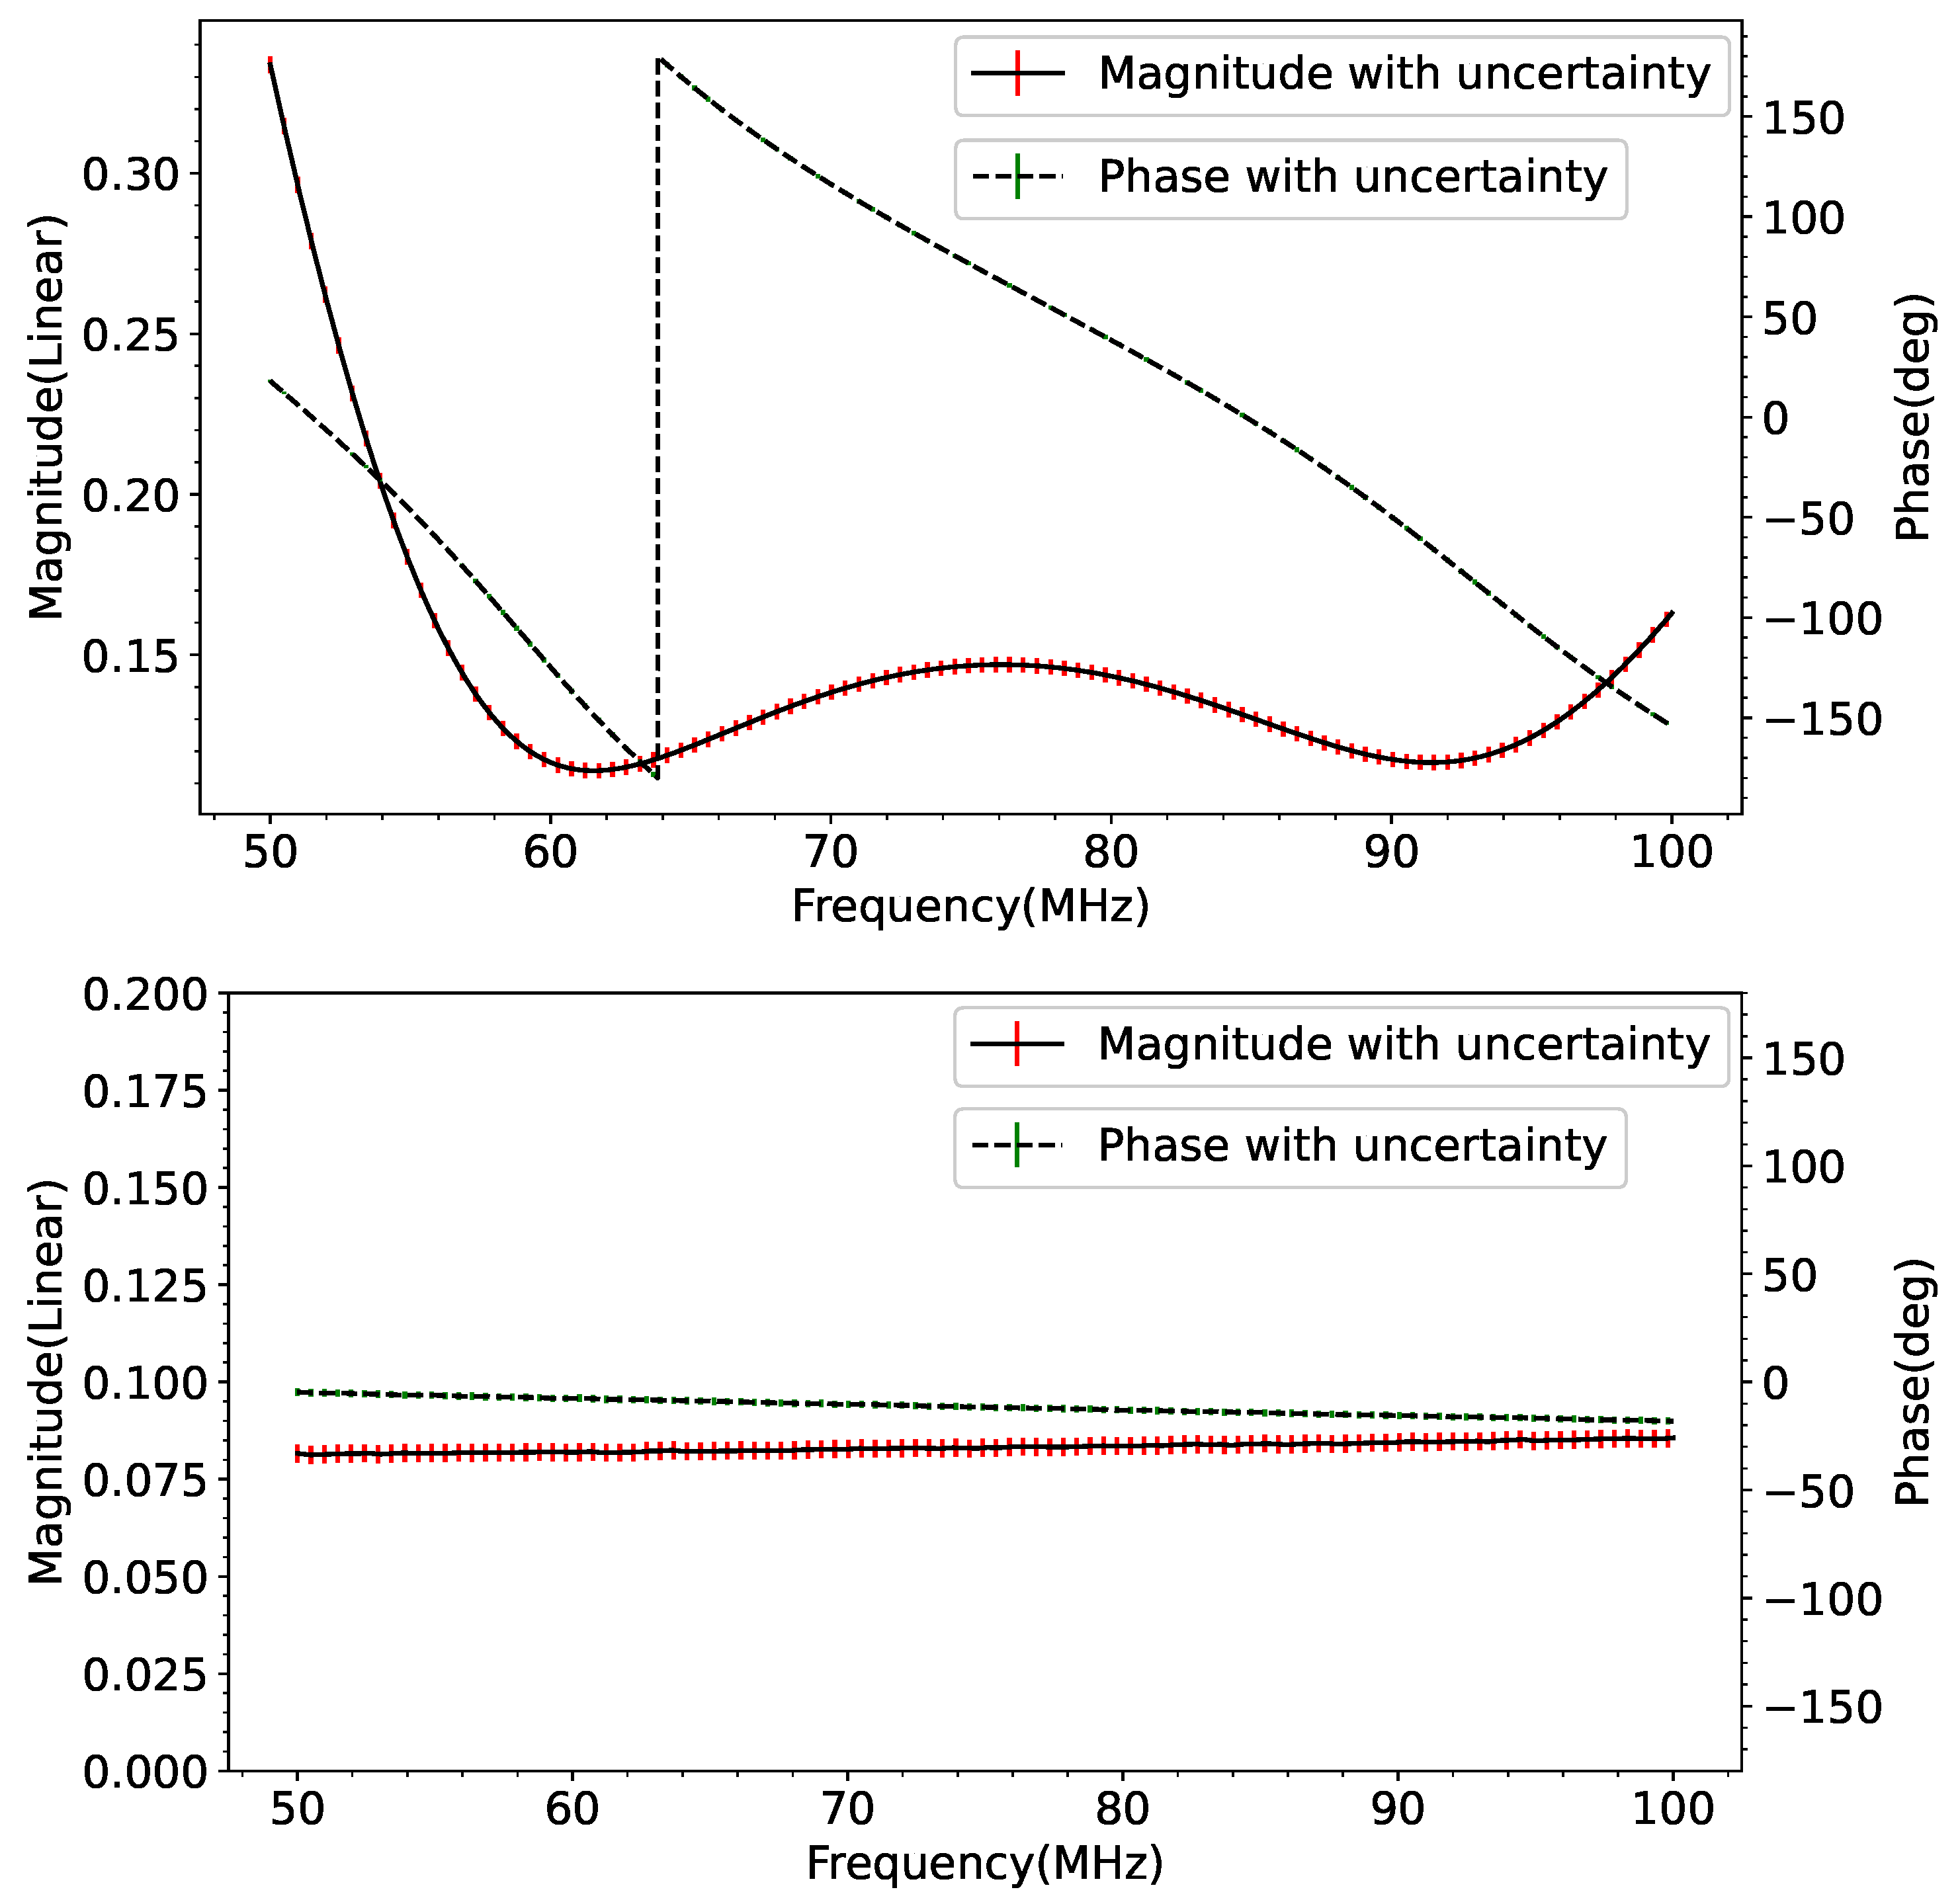
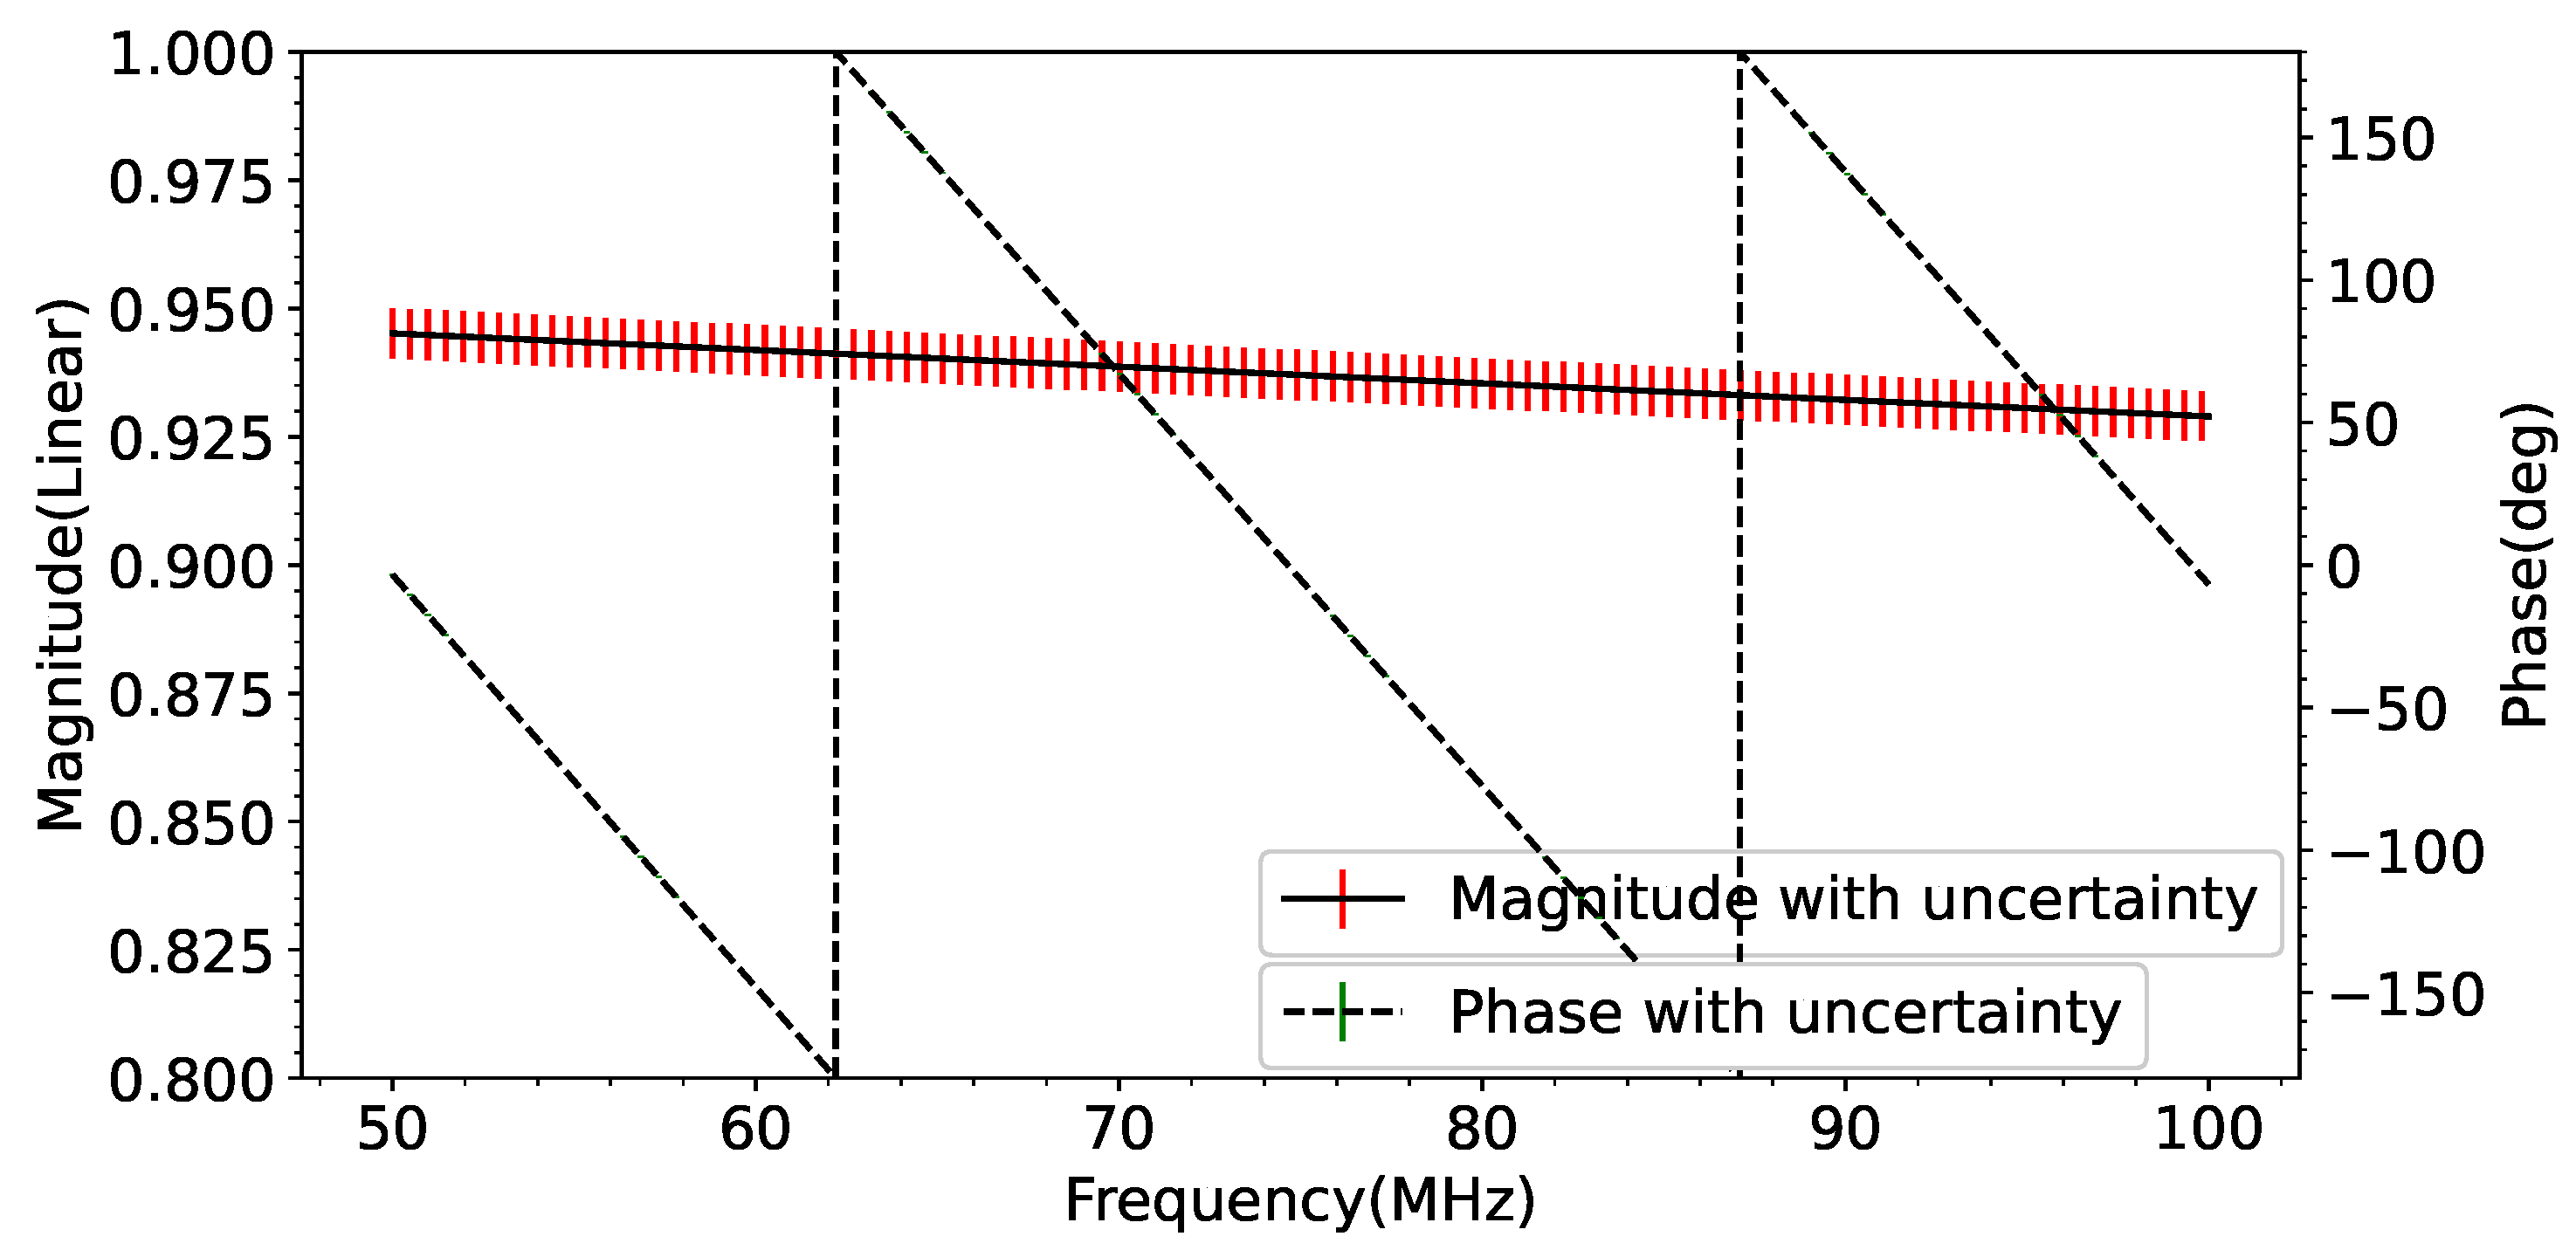
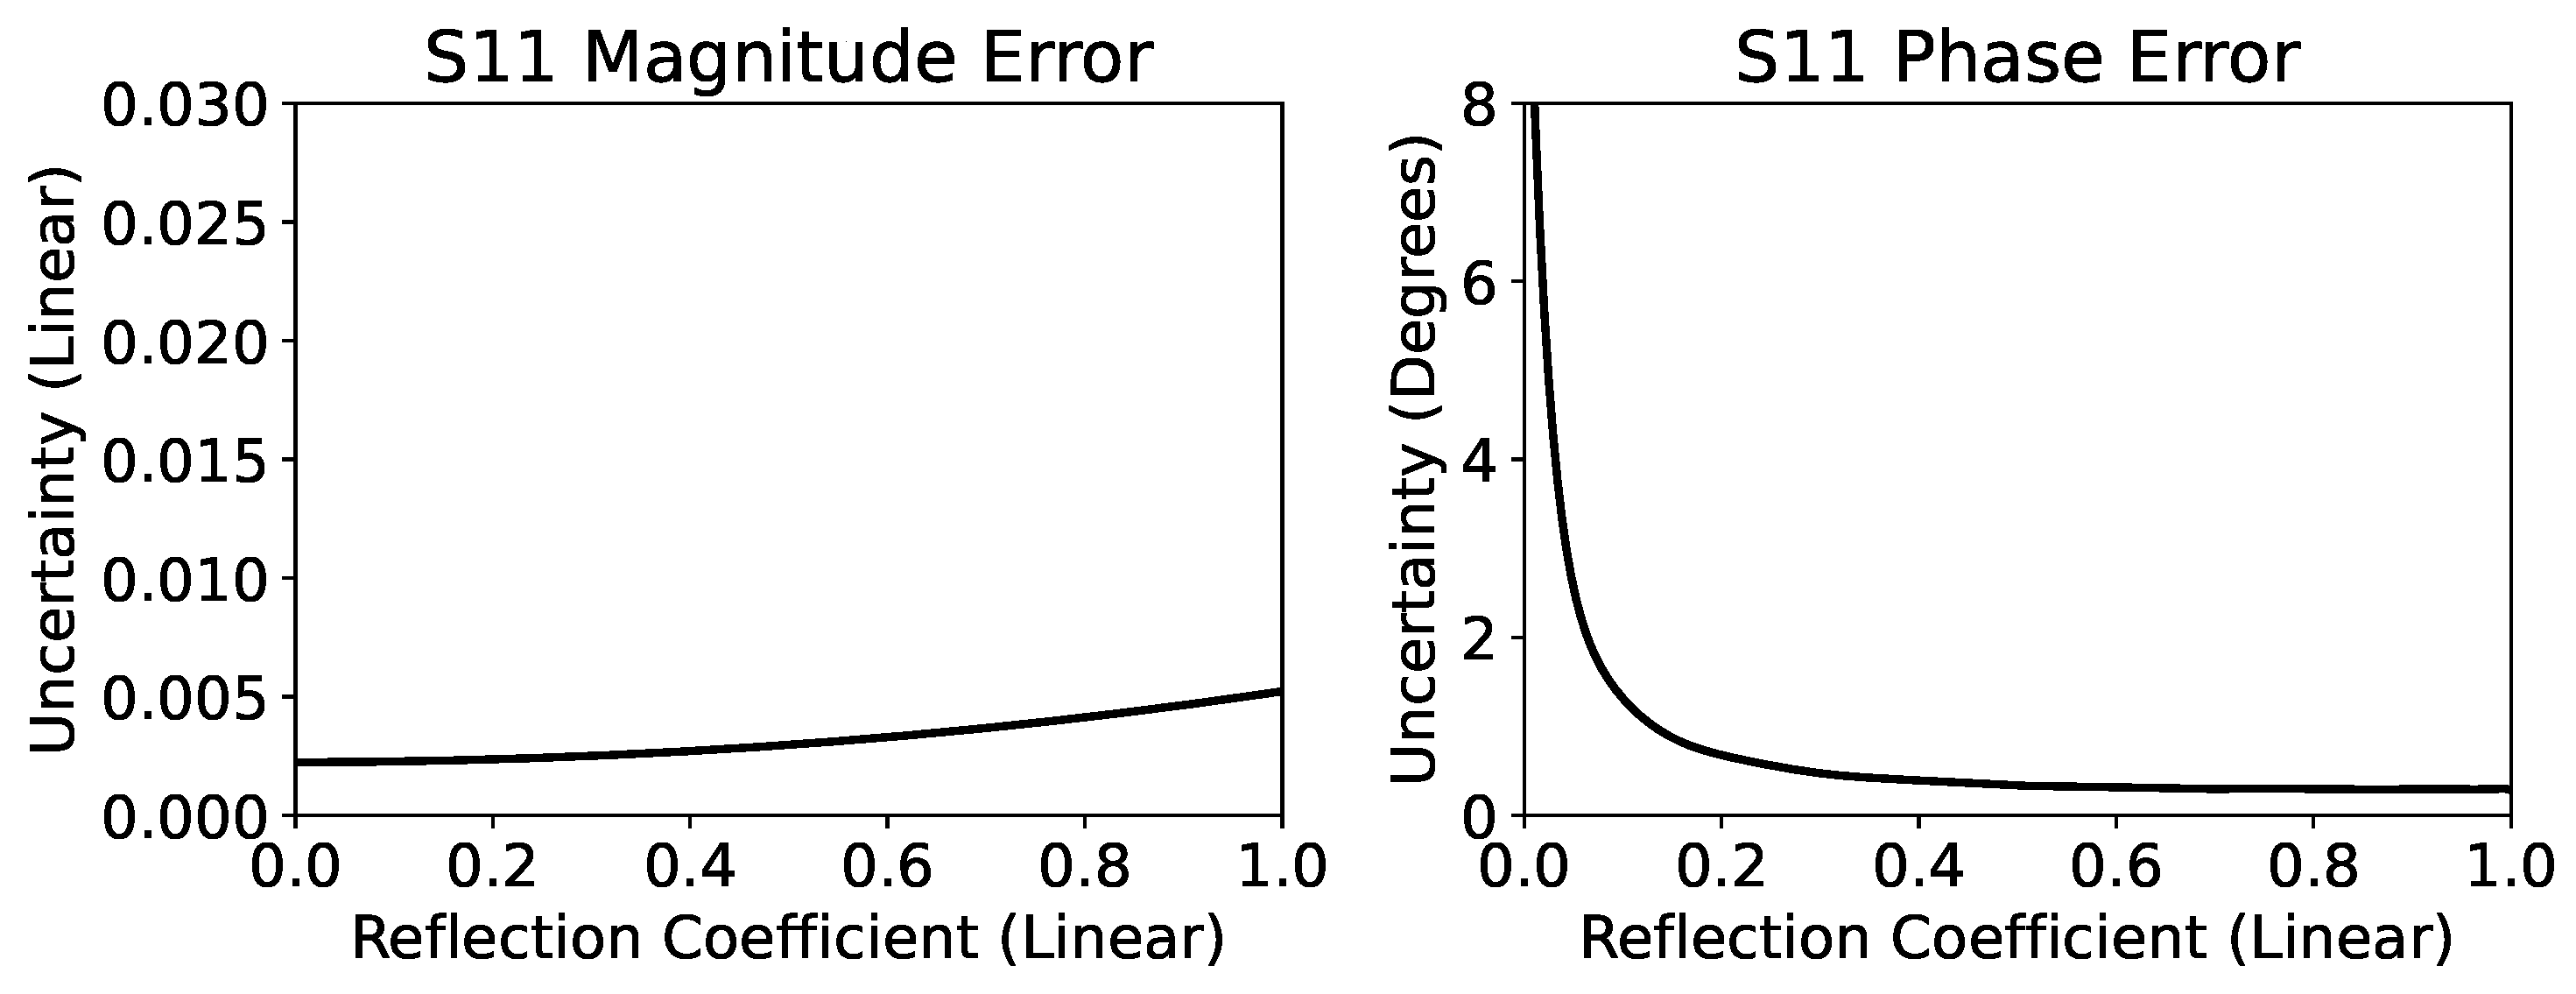
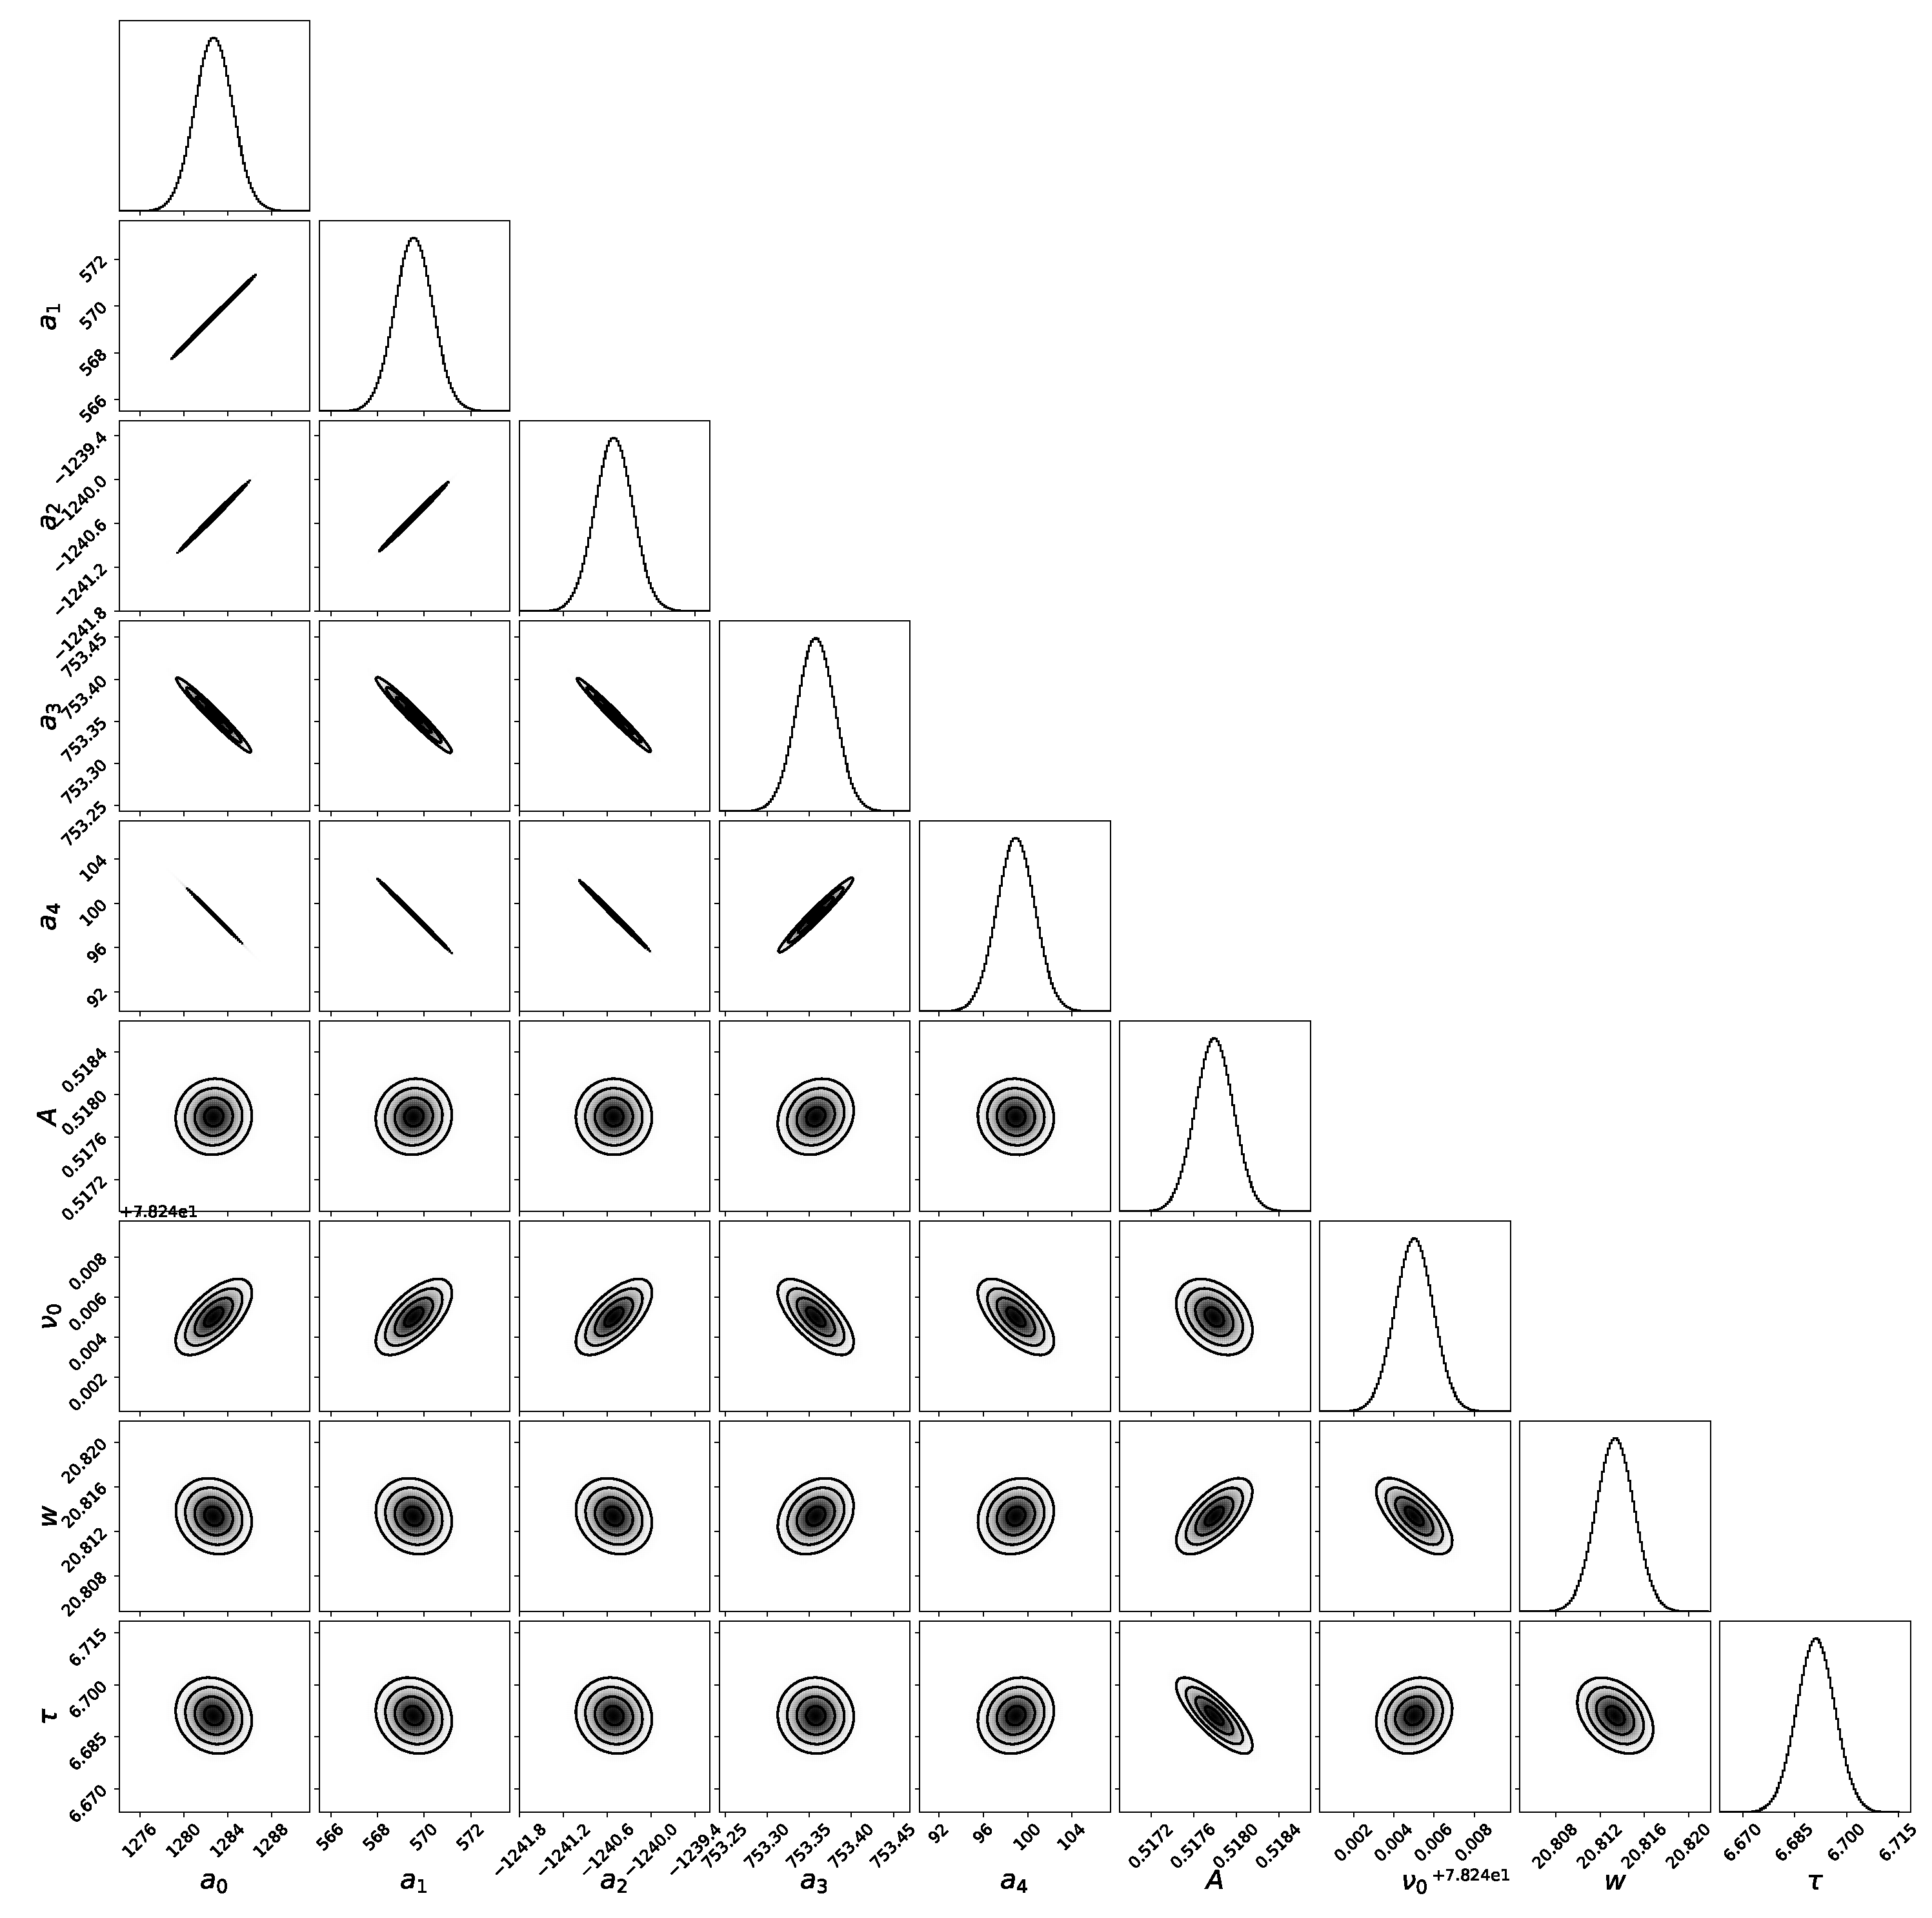

| 1284 | 570 | -1240 | 753 | 98 |
| A | w | |||
| 0.52 | 78.3 | 20.7 | 6.5 |
| Directivity | Source Match | Load Match | |
| Mag | Mag | Mag | |
| 48 dB | 40 dB | 47 dB | |
| Reflection Tracking | Dynamic Accuracy | ||
| Mag | Phase | Mag | Phase |
| dB | 0.009 dB | ||
Disclaimer/Publisher’s Note: The statements, opinions and data contained in all publications are solely those of the individual author(s) and contributor(s) and not of MDPI and/or the editor(s). MDPI and/or the editor(s) disclaim responsibility for any injury to people or property resulting from any ideas, methods, instructions or products referred to in the content. |
© 2024 by the authors. Licensee MDPI, Basel, Switzerland. This article is an open access article distributed under the terms and conditions of the Creative Commons Attribution (CC BY) license (http://creativecommons.org/licenses/by/4.0/).


