
Submitted:
02 April 2024
Posted:
03 April 2024
You are already at the latest version
Abstract
The Vu Gia - Thu Bon River Basin (VG-TB) is confronting numerous challenges related to water security (WS), particularly in the face of the impacts of climate change. These challenges manifest in salinity intrusion, altered rainfall patterns, and reduced water supply in downstream areas. To assess the current state of water security in the basin, the study employed statistical analysis methods, Process Analysis Method (PAM), SMART, and Analytic Hierarchy Process (AHP) to develop a comprehensive Assessment Framework for Water Security (AFWS) in the VG-TB. The AFWS encompasses five key dimensions, 17 indicators, and 28 variables, aligning with the UN-Water definition of water security and addressing the Sustainable Development Goal 6 (SDG6) criteria for global water sustainability. It also adheres to the Asian Development Bank's (ADB) approach to water security assessment as outlined in the Asian Water Development Outlook (AWDO) reports. This allows for the computation of a comprehensive Water Security Index (WSI) for specific regions, serving as a foundation for decision-making and policy formulation aimed at enhancing water security in the context of climate change and facilitating sustainable basin development in the future.
Keywords:
Water security framework
; Climate change
; Vu Gia - Thu Bon River basin
1. Introduction
Water is considered an essential natural resource; however, freshwater systems are currently under direct threat from human activities (UN-Water, 2009; Vörösmarty et al., 2005) and face an increasing risk due to climate change (Karl et al., 2009; Vörösmarty et al., 2010; Wagener et al., 2010). Ensuring water security is a multifaceted challenge that could jeopardize the lives and livelihoods of billions if left unaddressed (Jensen and Wu, 2018; Jiménez Cisneros et al., 2014; Srinivasan et al., 2013; Steffen et al., 2015). Due to economic pressures, poverty, and urbanization trends (Falkenmark, 2013), the growing concentration of people in densely populated coastal cities is expected to worsen water scarcity and increase vulnerability to water-related disasters (Mekonnen and Hoekstra, 2016). This issue has been highlighted in a study by Vorosmarty et al. (2000), where population growth emerges as a significantly more influential factor than climate change in driving water scarcity.
The term “Water Security” is gaining prominence as a way to encompass the numerous complexities linked to modern water resource management (Cook and Bakker, 2012). Water security is a defined concept that entails the maintenance of an acceptable level of risks related to water for both human populations and ecosystems, all while ensuring a sufficient supply of water that meets the required standards to support livelihoods, national security, human well-being, and ecosystem functions (Bakker, 2012; Grey and Sadoff, 2007; Zeitoun, 2011). Besides that, especially when awareness of the importance of water security is recognized by the world and included in specific action programs such as Goal 7 of the 8 of Millennium Development Goals – MDGs, which preceded the Sustainable Development Goals (SDGs) before 2015 (United Nations, 2000), and since then, Sustainable Development Goal 6 (SDG6), which aims at ensuring the availability and sustainable management of water and sanitation for all (Gregucci et al., 2023; United Nations, 2015).
The measurement of water security is not a novel concept. However, most of the early research on water security was primarily conceptual, emphasizing defining the boundaries of water security (Babel et al., 2020). One particularly impactful paper in this context is by Grey and Sadoff (2007), who conceptualized water security by highlighting its relevance to human well-being and ecosystem health, emphasizing safeguarding against risks (Babel et al., 2020).
Currently, a highly favored and extensively employed approach for evaluating water security revolves around utilizing an assessment framework incorporating a set of criteria representing different characteristics of water security (Aboelnga et al., 2019; Allan et al., 2018). Several studies have followed this approach at various scales such as urban (Assefa et al., 2018; Dong et al., 2018; Jensen and Wu, 2018), basin (Babel and Shinde, 2018; Dang et al., 2021), national (Marttunen et al., 2019; Su et al., 2019), regional (ADB, 2020, 2016), and global scale (Fischer et al., 2015; Gain et al., 2016). The choice of assessment framework and criteria varies depending on the size and attributes of the system under investigation. In most cases, these assessment frameworks prioritize addressing the pivotal aspects that exert the greatest influence on water security. Each of these frameworks has its advantages and limitations. These efforts are progressively moving towards more accurate assessments, aiding policymakers and decision-makers in formulating timely and appropriate water security policies.
In their assessment of the state of water security, researchers need to address the escalating complexity of the challenges stemming from economic downturns, disasters, and risks related to water resources. These challenges are exacerbated by adverse effects arising from human development activities and global climate change. Recent studies on water security have adopted a broader perspective, encompassing risks, disasters, the repercussions of ongoing climate change, and projections for the future across various dimensions and scales (Babel and Shinde, 2018; Babel et al., 2020; Xiao-jun et al., 2014). For example, the four-dimensional framework in rural Alaska (Penn et al., 2017); the multi-criteria assessment framework for the city of Bangkok-Thailand (Babel et al., 2020) and Yulin City in China (Xiao-jun et al., 2014); water security and zone adaptive management for arid and semi-arid regions of the Americas (Scott et al., 2013) and water security at the basin scale (Babel and Shinde, 2018). Current research often employs methods such as DPSIR (Driving Force - Pressure - State - Impact - Response) (Babel and Shinde, 2018; Babel et al., 2020), system dynamics modeling (SDM) (Su et al., 2019), and Process Analysis Methods (PAM) (Jensen and Wu, 2018; Tho et al., 2018). Among these methods, PAM is regarded as advantageous and more suitable compared to the other two approaches (Jensen and Wu, 2018; Tahir and Darton, 2010) when applied to construct a water security assessment framework.
In Vietnam, there is a limited number of studies on water security using assessment frameworks, and those conducted have not adequately addressed the impacts of climate change. Most research in this area has predominantly utilized the AWDO approach as its foundation (Dang et al., 2017, 2016) and UN-water (Hieu et al., 2021; Tien et al., 2022). At the basin scale, assessments have been performed for the Red River (Dang et al., 2021), Ma River (Mui and Thanh, 2018), and Mekong River (Tien et al., 2022) basins. Regarding the provincial and city scales, only Hanoi City (Dang et al., 2016), Quang Ngai Province, and Tra Vinh City (Viet et al., 2018) have been considered. However, there is no comprehensive and direct research on assessing the level of water security in the VG-TB river basin. Except for some studies indirectly addressing various aspects and individual factors related to ensuring the water security of the basin. For example, research on balance (Lan et al., 2019) and water resource allocation (Don, 2021; Thang, 2019), environmental flow (Dung, 2018), the impact of rainfall and floods (Huy, 2018; Vo and Gourbesville, 2018), drought (Vu et al., 2017), changes in vegetation cover (Tho et al., 2018), and especially the effects of hydropower system operation on household water supply downstream (Hung, 2017).
In Vietnam, there is a limited number of studies on water security using assessment frameworks, and those conducted have not adequately addressed the impacts of climate change. Most research in this area has predominantly utilized the AWDO approach as its foundation (Dang et al., 2017, 2016) and UN-water (Hieu et al., 2021; Tien et al., 2022). At the basin scale, assessments have been performed for the Red River (Dang et al., 2021), Ma River (Mui and Thanh, 2018), and Mekong River (Tien et al., 2022) basins. Regarding the provincial and city scales, only Hanoi City (Dang et al., 2016), Quang Ngai Province, and Tra Vinh City (Viet et al., 2018) have been considered. However, there is no comprehensive and direct research on assessing the level of water security in the VG-TB river basin. Except for some studies indirectly addressing various aspects and individual factors related to ensuring the water security of the basin. For example, research on balance (Lan et al., 2019) and water resource allocation (Don, 2021; Thang, 2019), environmental flow (Dung, 2018), the impact of rainfall and floods (Huy, 2018; Vo and Gourbesville, 2018), drought (Vu et al., 2017), changes in vegetation cover (Tho et al., 2018), and especially the effects of hydropower system operation on household water supply downstream (Hung, 2017).
The paper uses the PAM method to present a framework for assessing water security at the river basin scale. This framework provides a scientific foundation for policymakers to enhance water security and formulate sustainable development strategies. It is built upon specific indicators from previous studies and the development of indicators tailored to the characteristics of the VG-TB river basin under climate change and basin development conditions.
2. Materials and Methods
2.1. Study Area
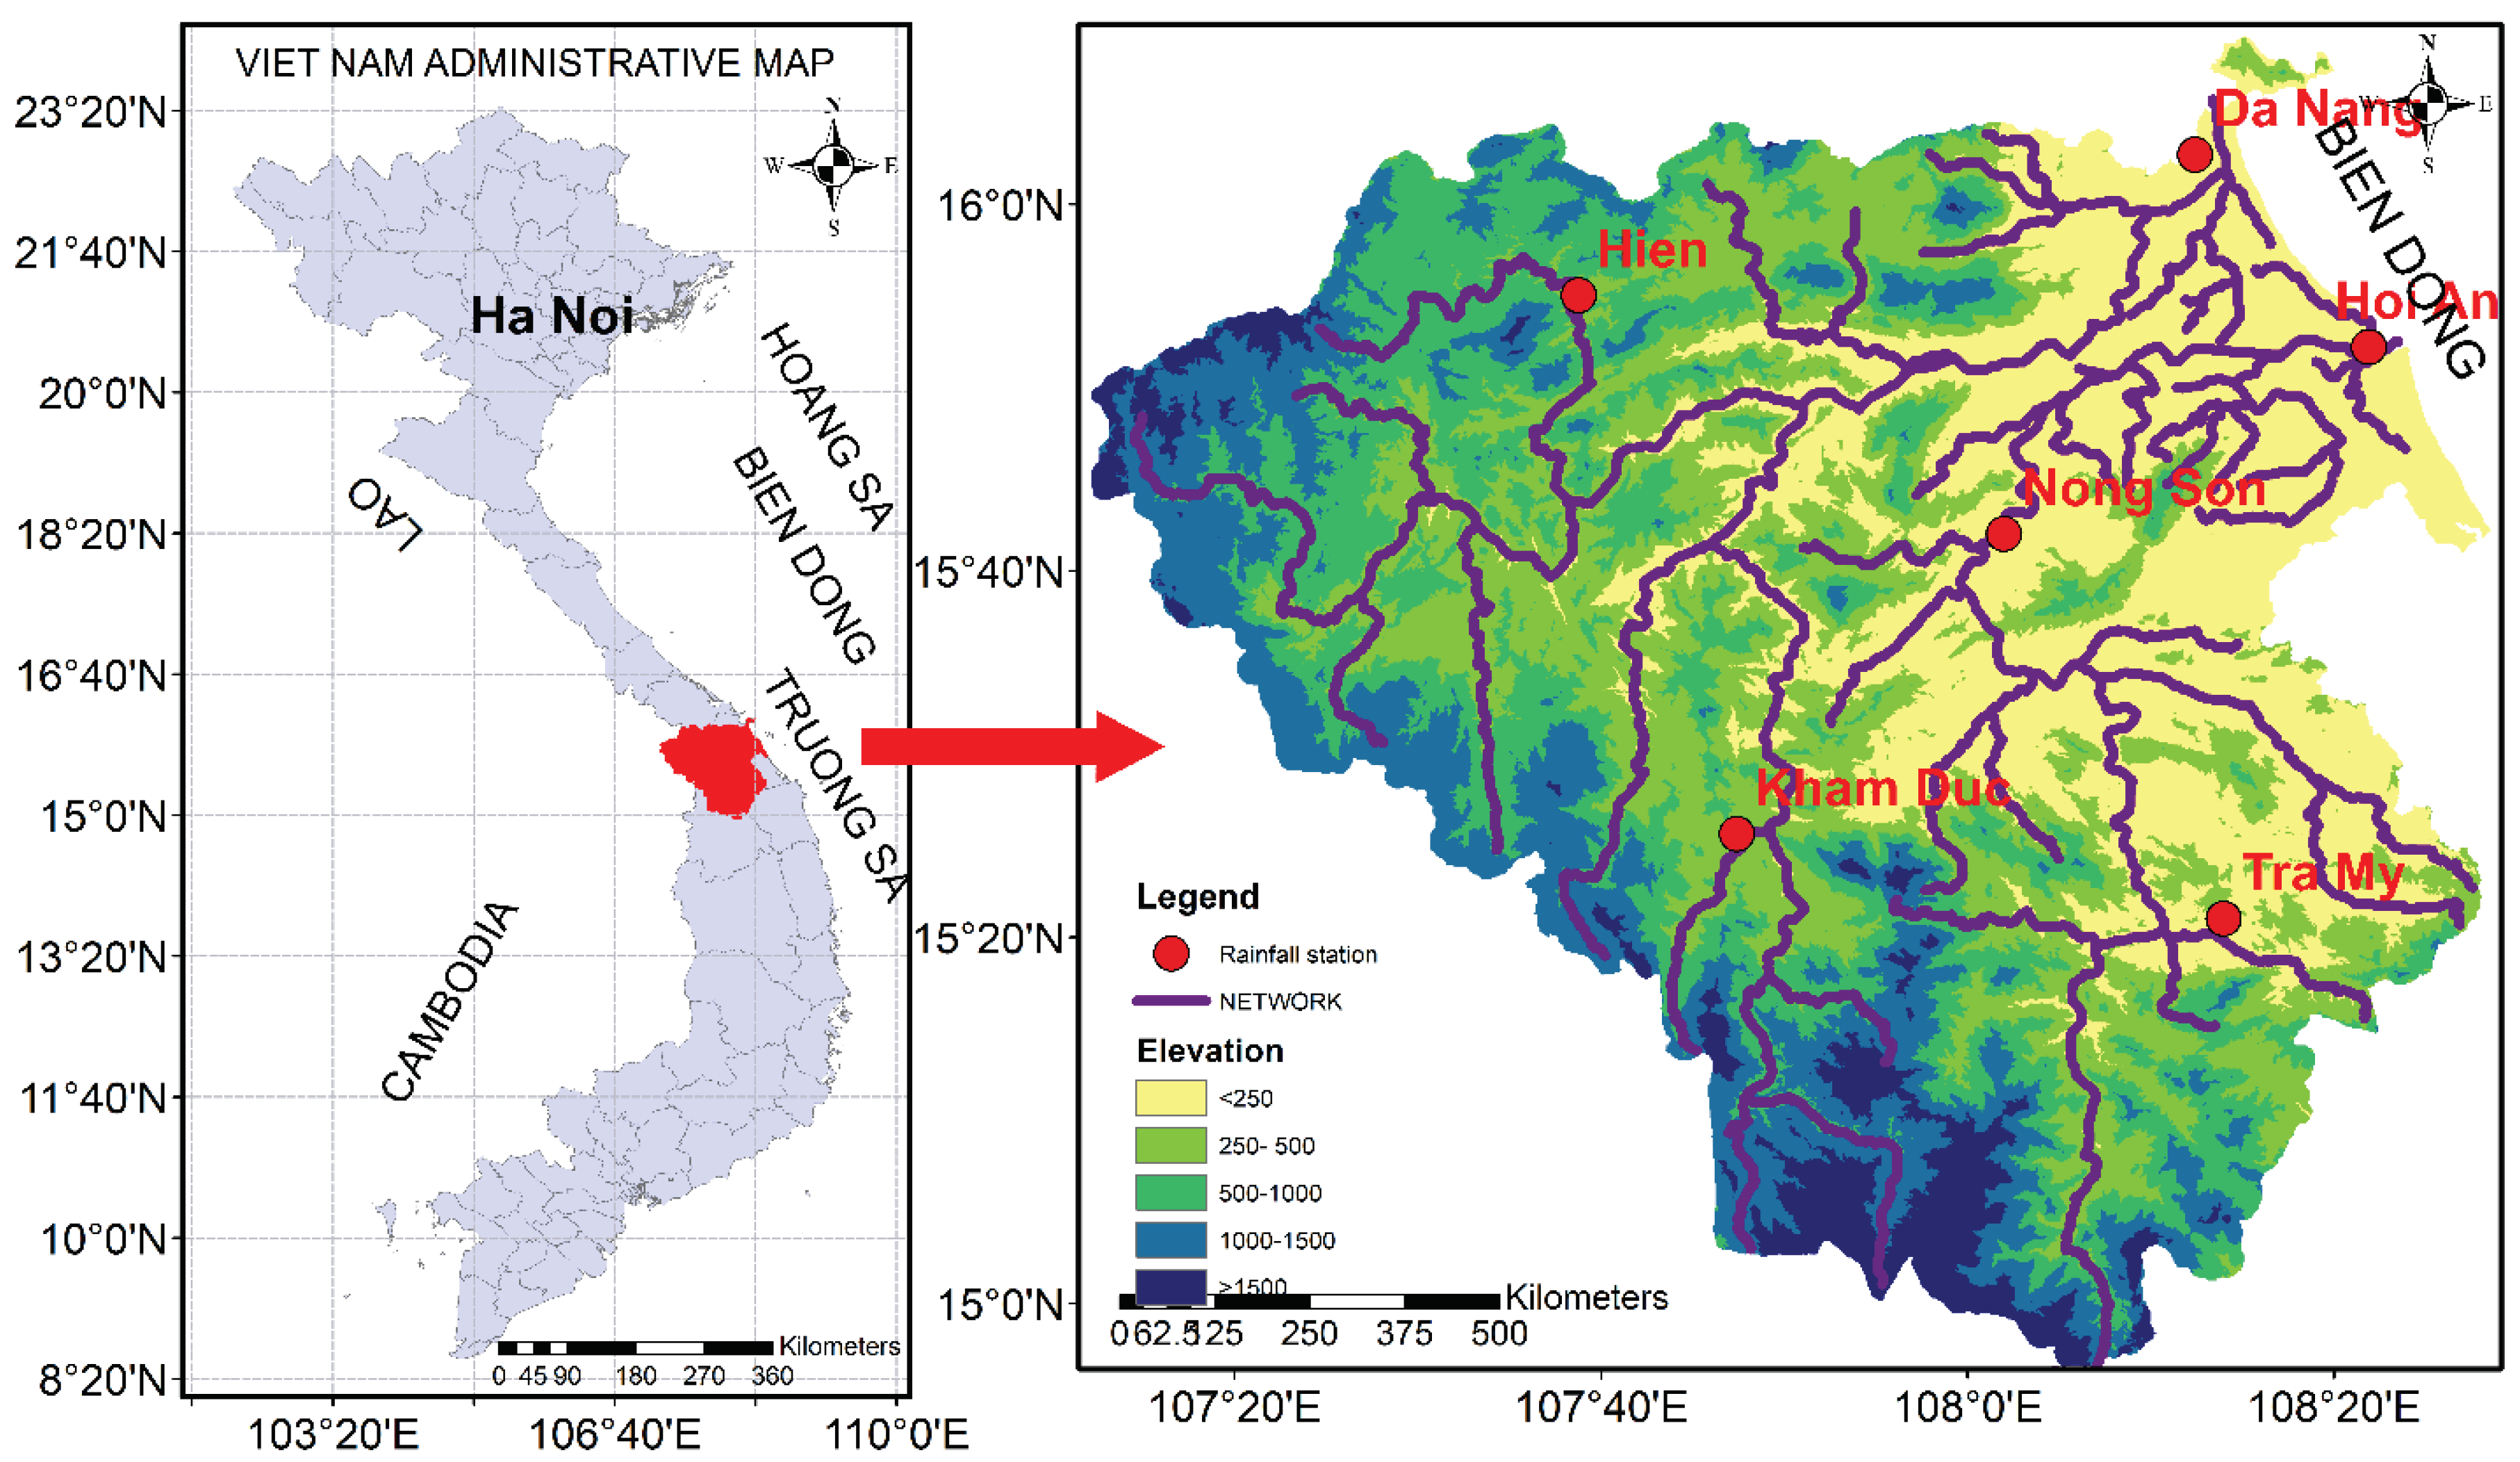
This study focuses on the VG-TB river basin area (Vo et al., 2016). This region is home to Central Vietnam’s most extensive river system, characterized by two primary rivers, Vu Gia and Thu Bon, originating in the Ngoc Linh Mountain and flowing towards the Cua Dai estuary (Phuong et al., 2020). Covering an extensive area of approximately 10,350 km2, the VG-TB basin encompasses parts of Kon Tum, Quang Ngai, Quang Nam, and Da Nang City (An and Hoa, 2013; Loi et al., 2019; Phuong et al., 2020). It is situated within a tropical monsoon climate zone where weather phenomena, including intense rainfall events and storms, occur complexly (Vo and Gourbesville, 2016). This region experiences substantial rainfall, averaging 2000 mm to 4000 mm annually, influenced by the basin’s topography and shifting seasons (Nguyen et al., 2021; Vo et al., 2016). The rainy season contributes significantly to the annual precipitation from September to December, accounting for 65-80% of the total. Conversely, during the dry season from January to August, rainfall sharply decreases, constituting only about 20-35% of the annual rainfall (Nguyen et al., 2021; Vo et al., 2016; Vo and Gourbesville, 2016).
Figure 1.
Study area: the VG-TB River basin.
2.2. Framework Design
2.2.1. Principles for Selecting the Indicators
The selection of indicators for the proposed evaluation framework must be relevant to the VG-TB river basin, ensuring the framework’s appropriateness to the region under investigation. Still, it must also ensure that the assessment is practical and maintains its scientific rigor. Therefore, whether creating new indicators or adopting existing water security indicators from previous studies, it is essential to adhere to the following principles: (1) The selected aspects, indicators, and variables must align with the UN-Water definition of water security, taking into account the fulfillment of criteria outlined in SDG6 (United Nations, 2015), and the criteria ensuring water security as per the approach of the ADB in its AWDO reports (ADB, 2020, 2016); (2) The selected indices must be clearly defined, verifiable, and not overly numerous (Jensen and Wu, 2018); (3) they can be measurable using a scientifically sound method within a cost-effective range; (4) The metrics should possess representativeness and appropriate synthesis in alignment with the evaluation objectives. (5) Can be capable of reflecting future trend changes.
Applying these principles helps establish an evaluation framework and identify the best set of metrics under current conditions. However, in practice, the study bypassed certain principles while selecting water security indicators due to computational constraints, data collection limitations, and other factors.
2.2.2. A Composite Model of Basin Sustainability
Developed by Tahir and Darton (2010) and based on analyzing relationships among various factors, PAM provides a procedure for selecting indicators to assess a system’s sustainability and resilience effectively. It enables the creation of a comprehensive set of sustainability indicators and metrics tailored to a specific river system (Wu et al., 2015; Wu and Leong, 2016). In this method, the impacts on the system are identified along with their underlying causes, referred to as the impacting agents (Jensen and Wu, 2018). Internal impacting agents pertain to activities within the watershed, such as water management, economic development, and societal factors, while external impact generators beyond the watershed’s boundaries, such as meteorological conditions, hydrology, natural disasters, and climate change, serve as external driving forces. Both impacting agents contribute to water security within the watershed through critical dimensions. These impacts give rise to specific consequences for relevant entities, known as recipients of these impacts (including humans, the environment, and development activities within the watershed). These consequences are delineated through various aspects of indicators and are quantified using specific variables derived from statistical data and calculations. This process is depicted in Figure 3. In contrast to the SDM model, PAM does not quantify causal relationships between causes, effects, and consequences. Instead, the selection of indicators through this method reflects a holistic understanding of a complex system by examining the literature and involving stakeholders while concurrently measuring specific factors (Jensen and Wu, 2018). With clear objectives, the advantage of the PAM approach is that it provides straightforward yet meaningful results. PAM focuses on internal and external driving forces while identifying their impacts on the system through its analytical framework.
Figure 2.
PAM’s flow chart.
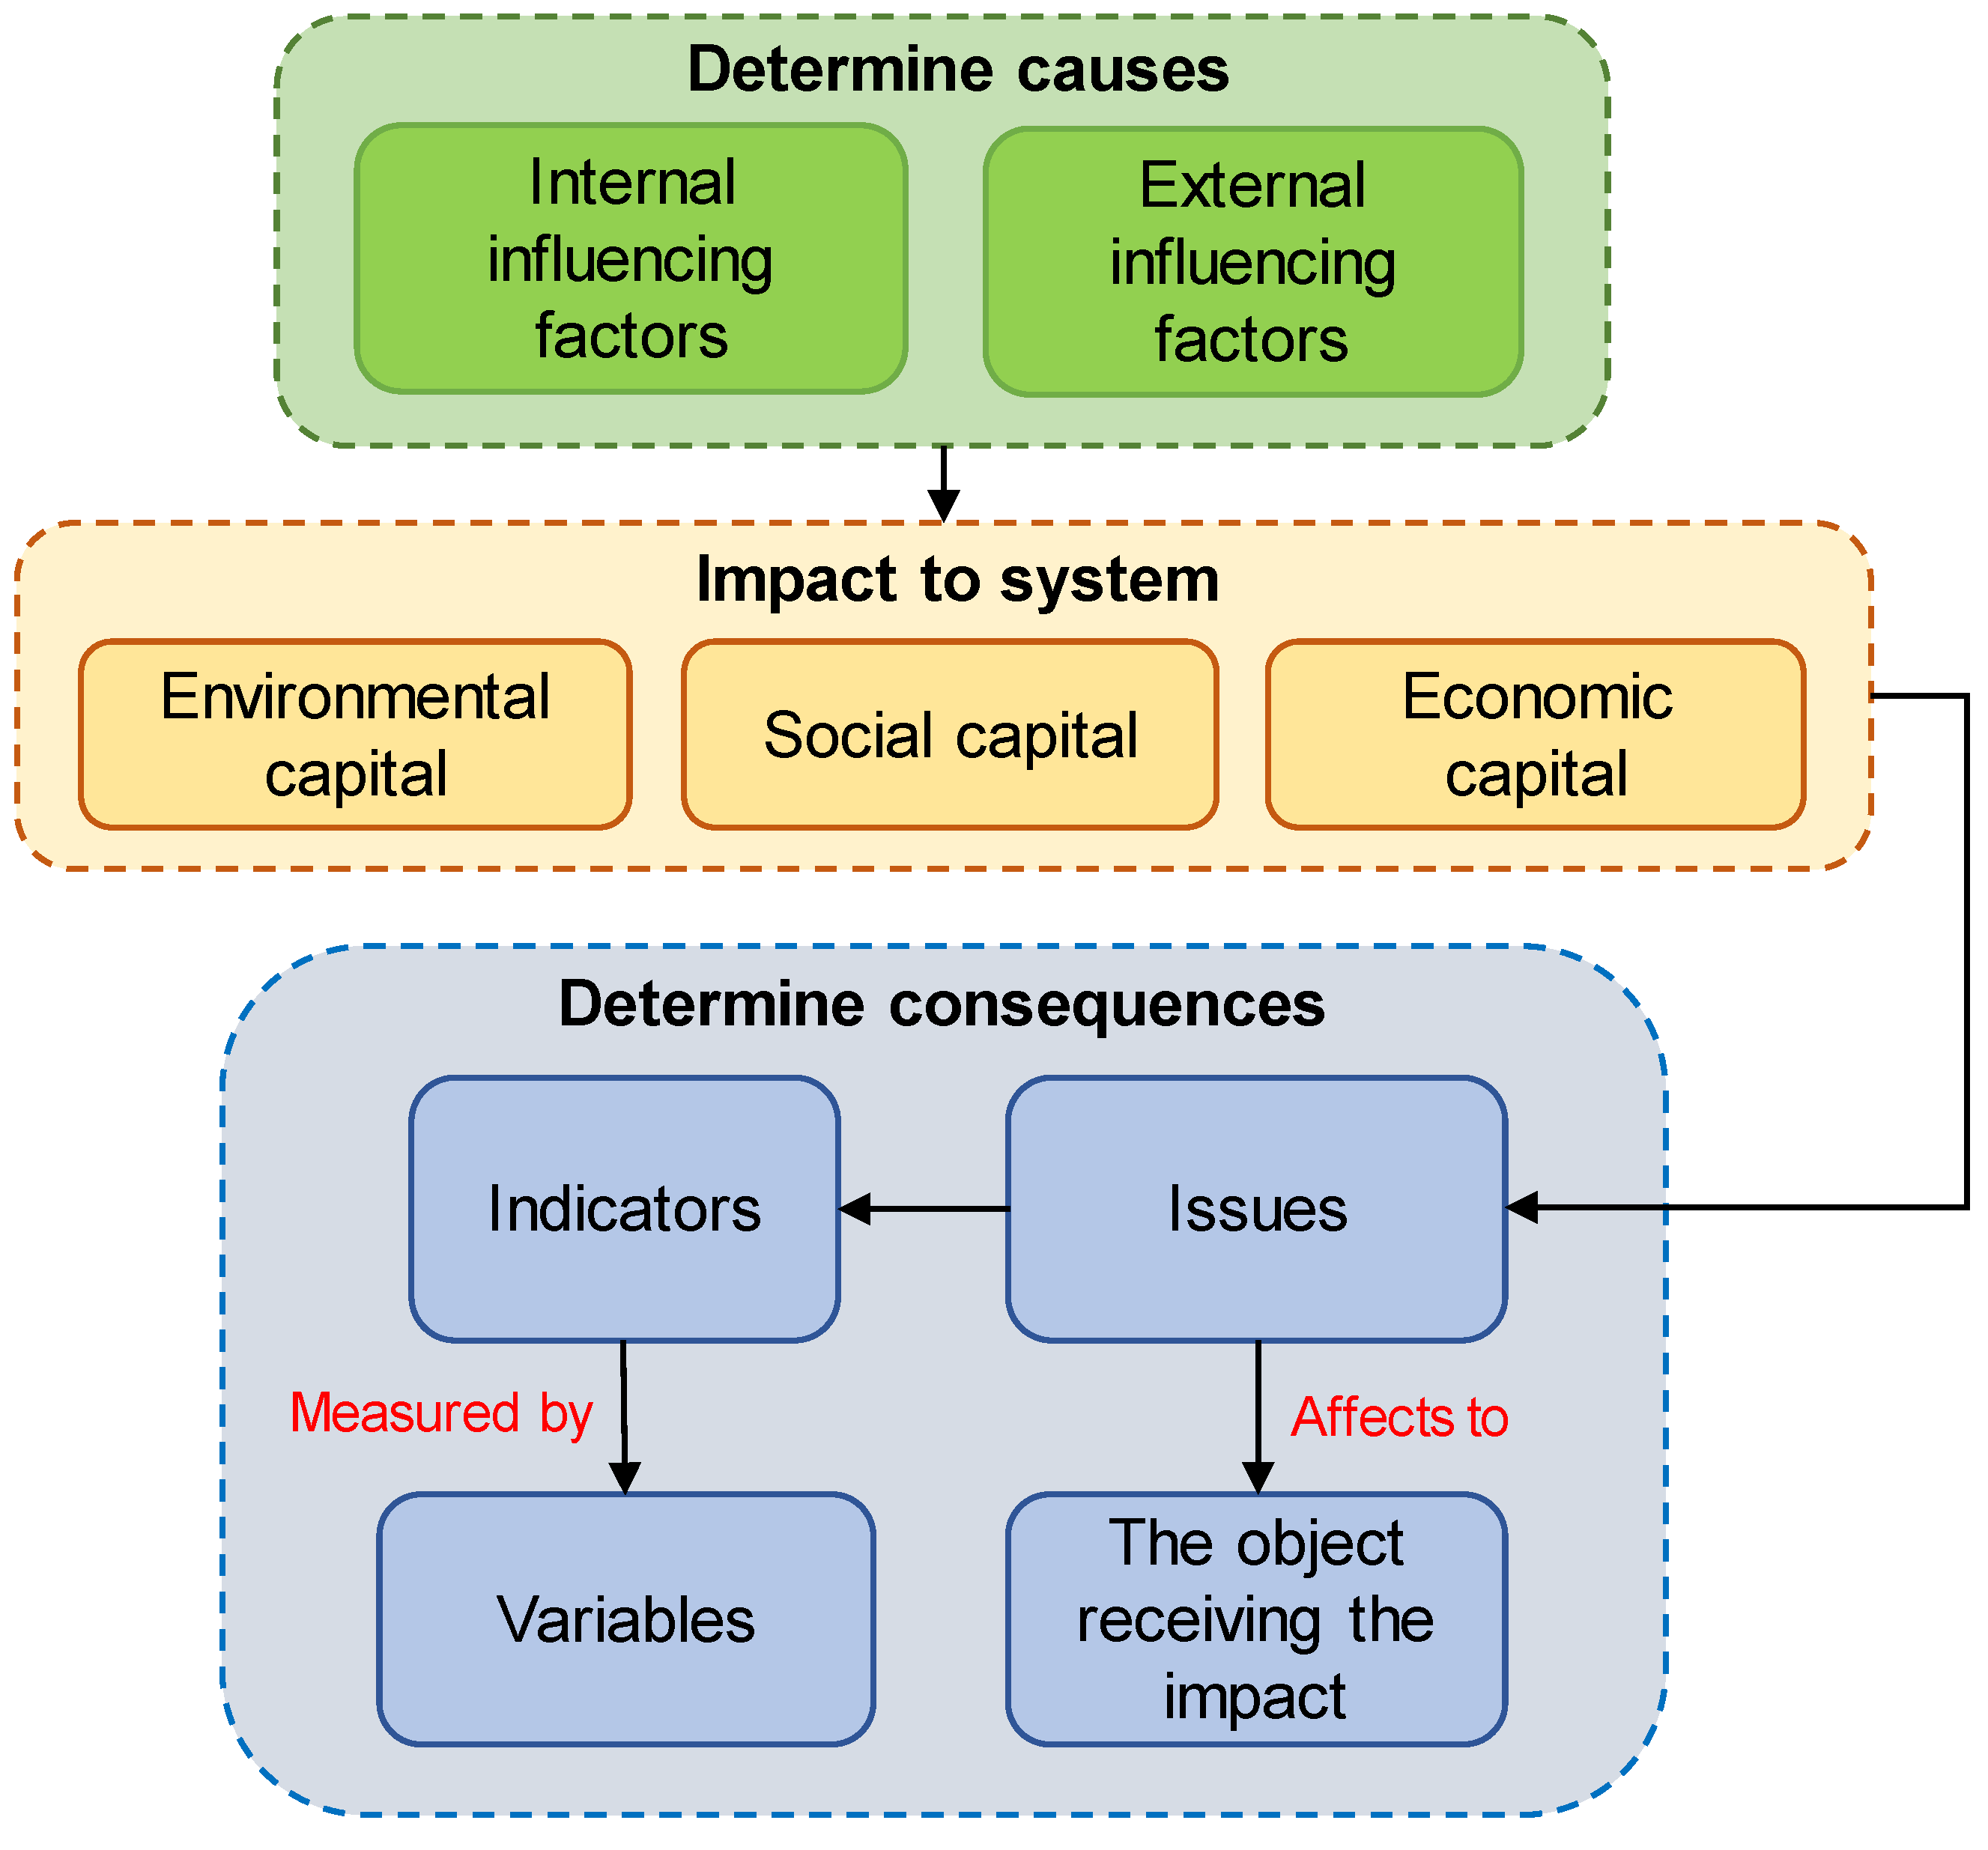
Figure 3.
SMART’s flow chart.
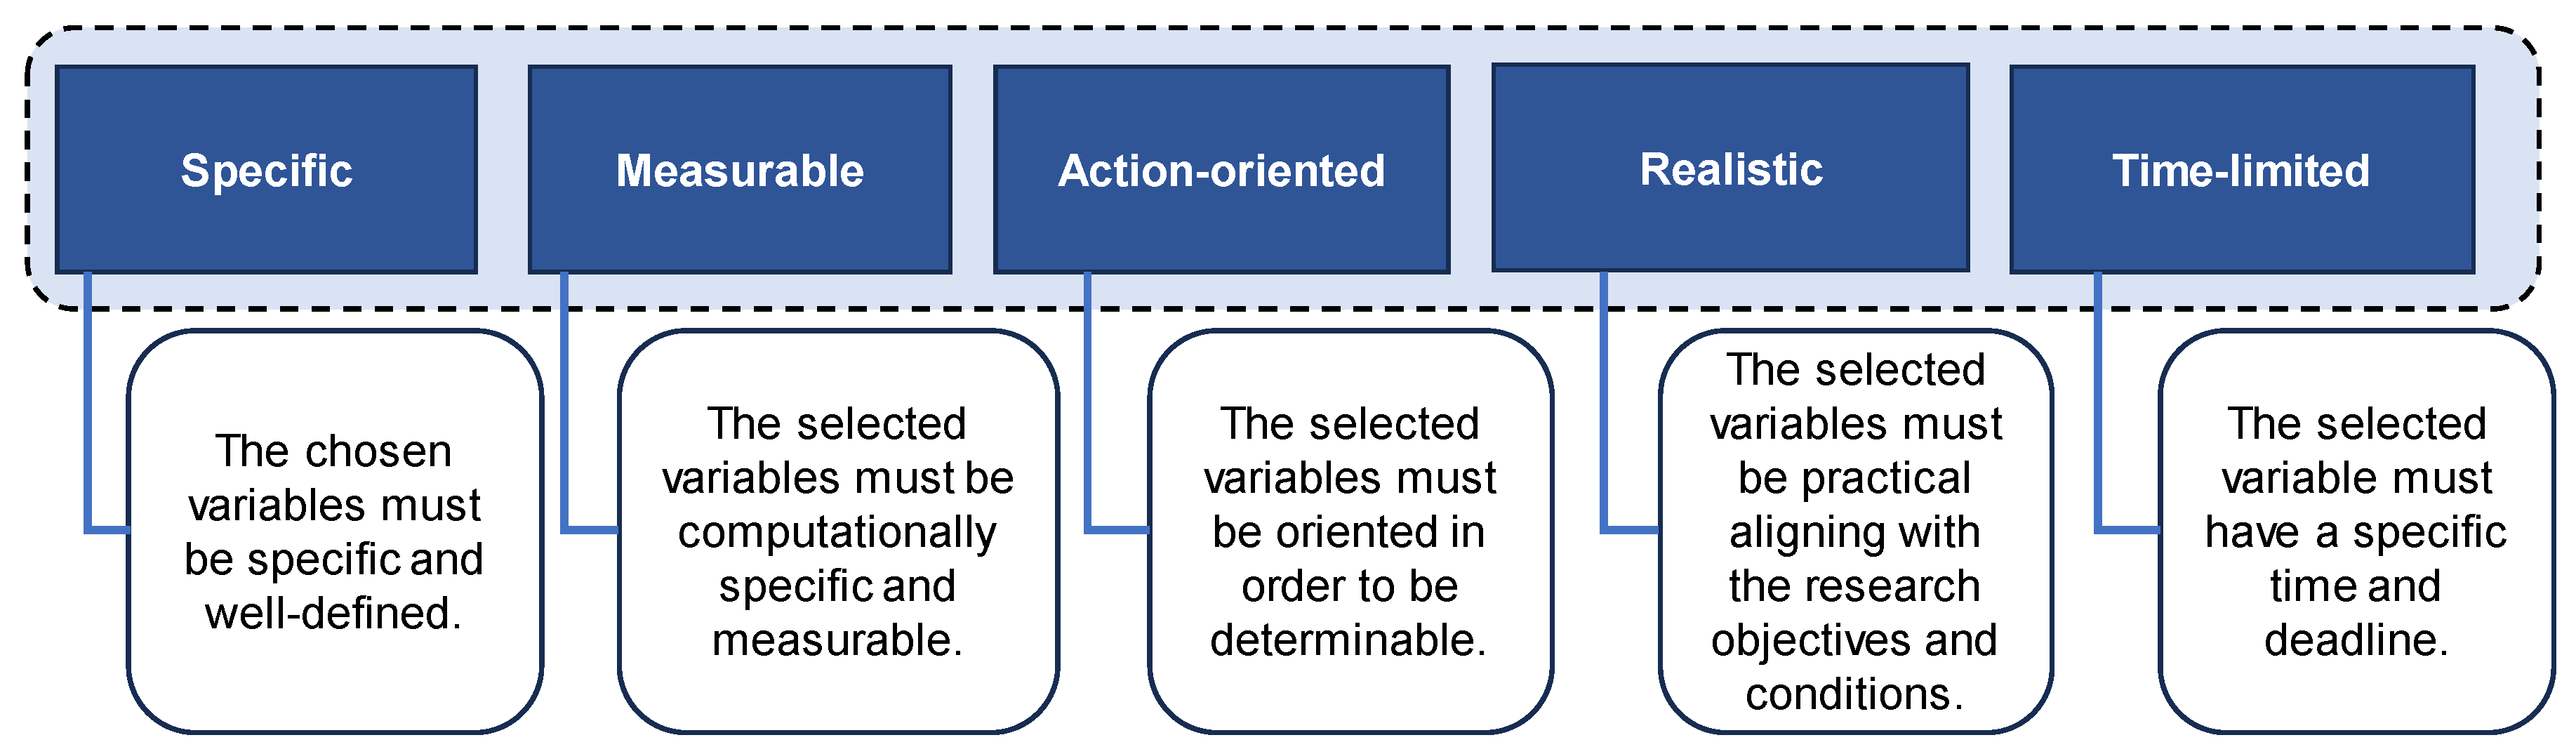
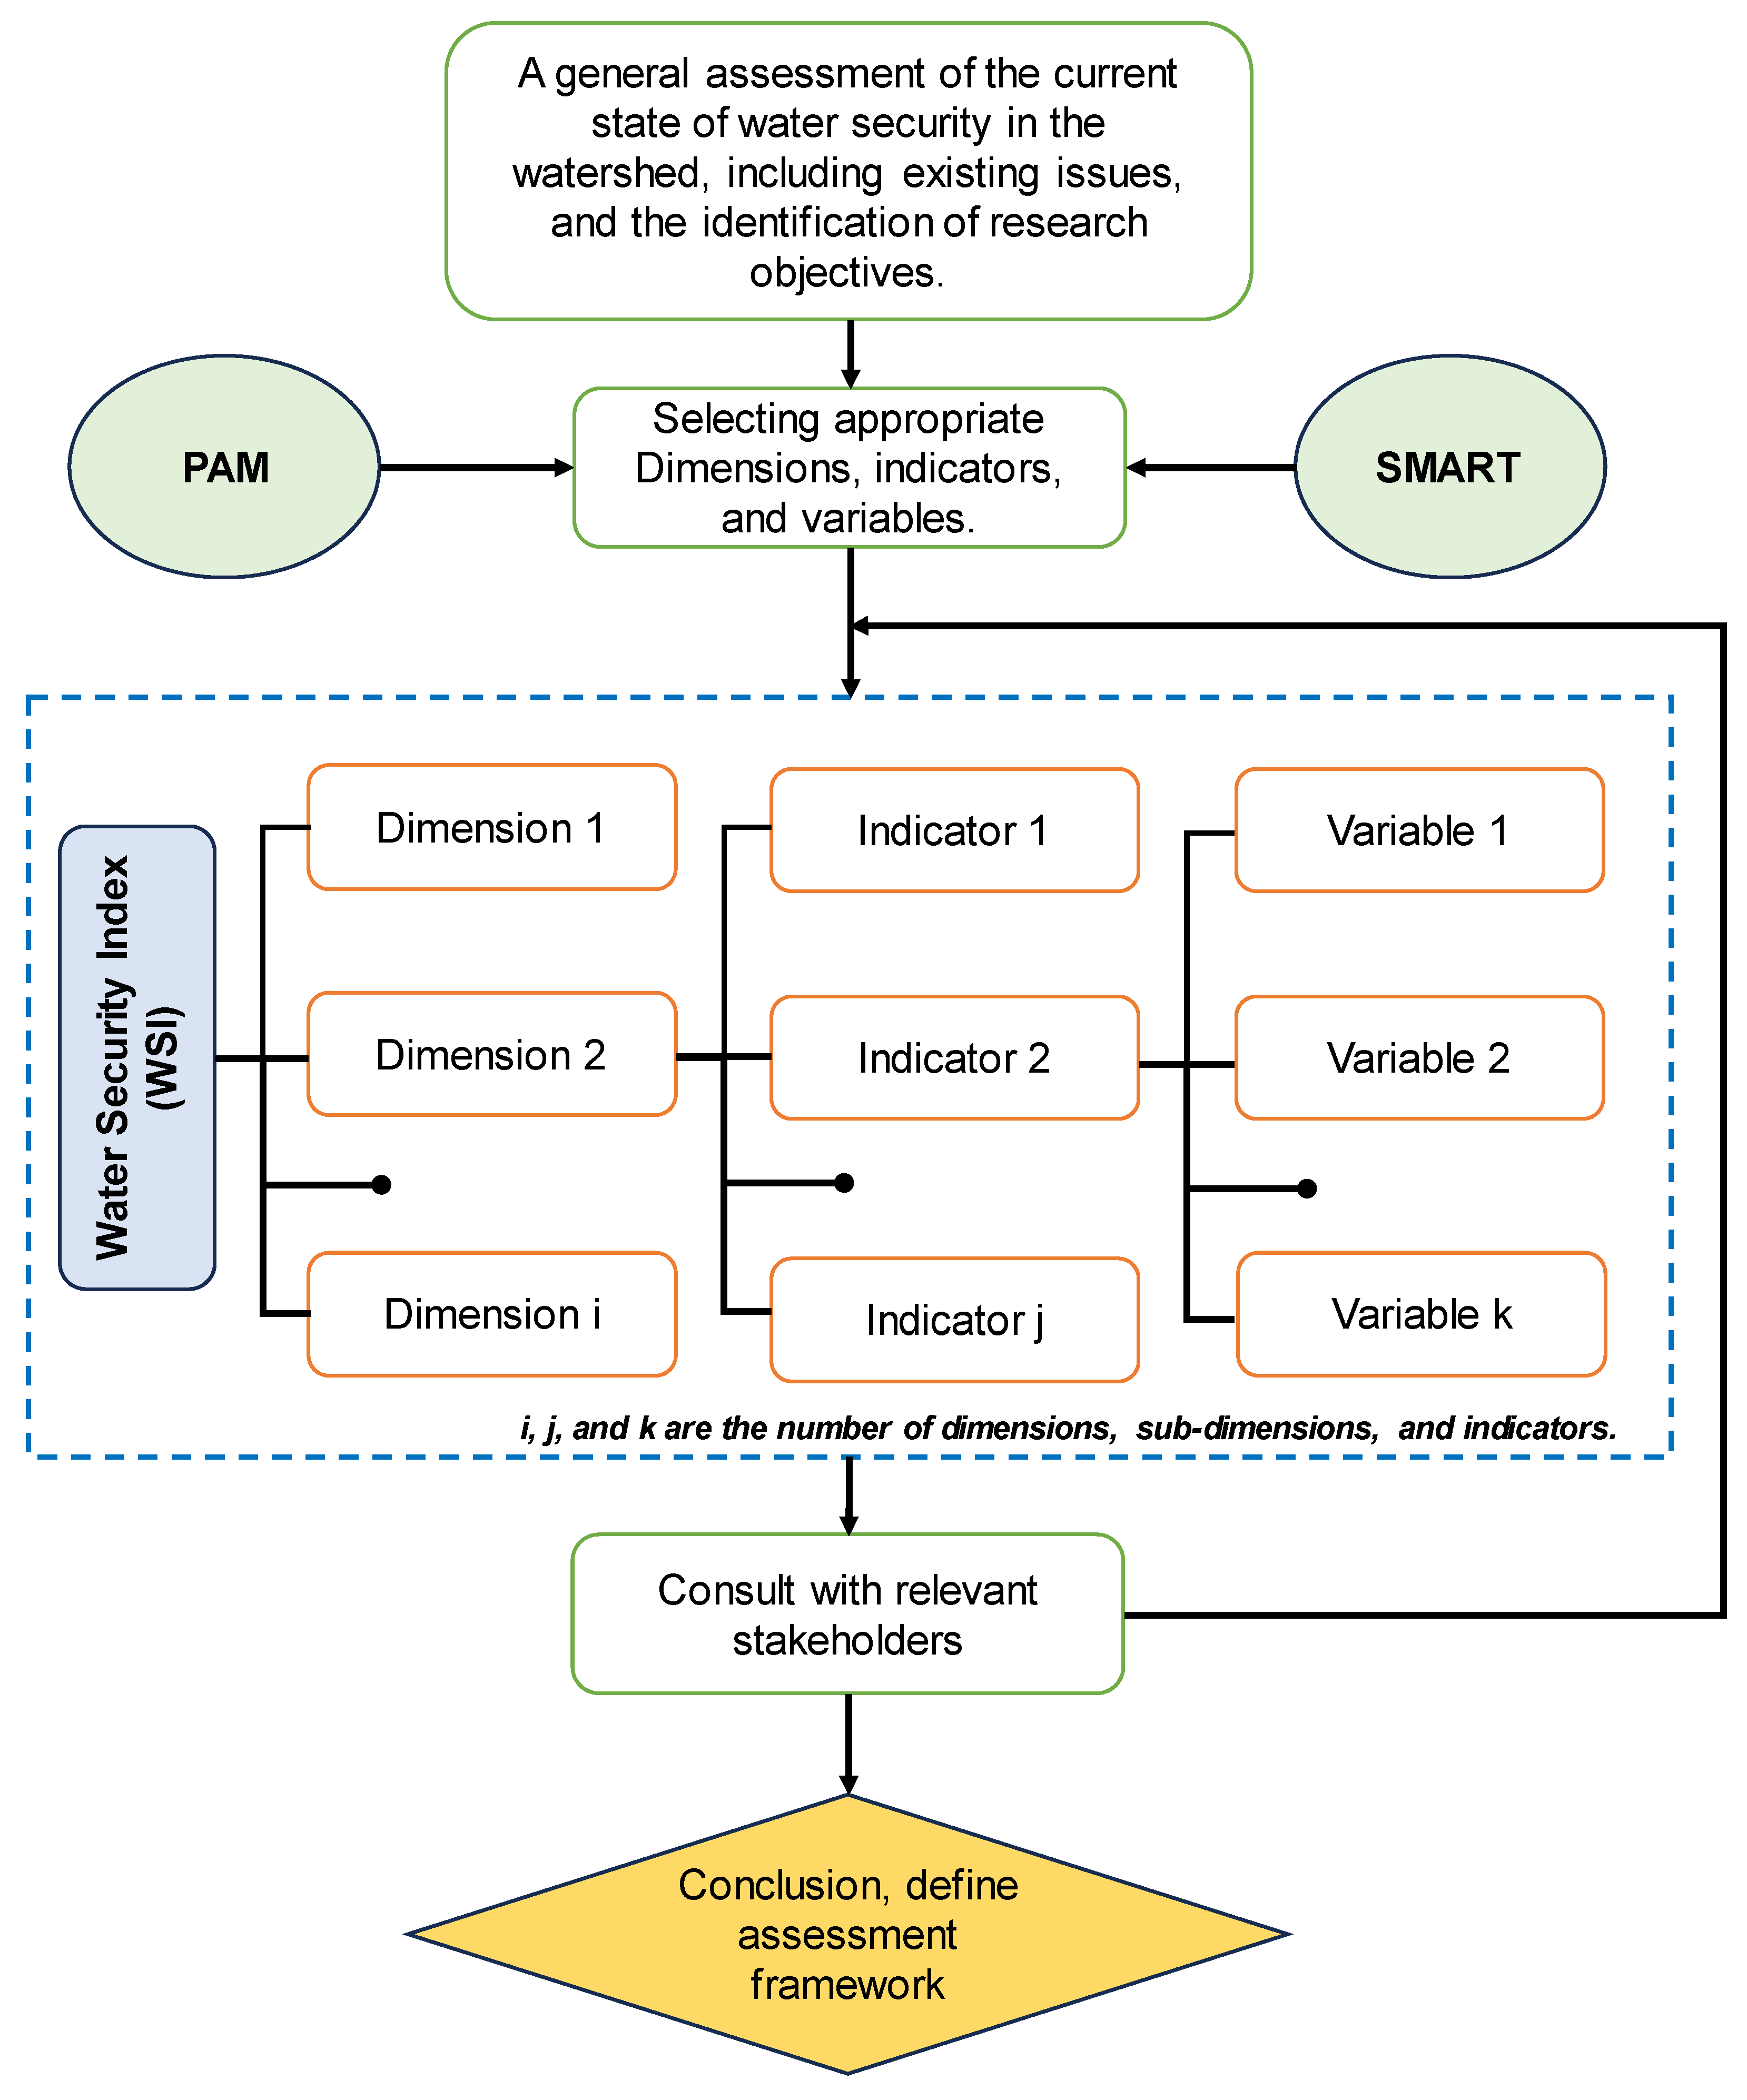
Based on the analyses above, this study employs the PAM to construct a comprehensive framework for assessing water security in the VG-TB river basin. Subsequently, the SMART analysis method is used to select the key variables for this assessment framework. SMART aids in identifying the most feasible and effective factors for achieving the set evaluation objectives, ensuring that they are Specific, Measurable, Action-oriented, Realistic, and Time-limited. The process of establishing SMART criteria is illustrated in Figure 3.
The steps for developing the assessment framework using the PAM method are as follows:
- Step 1: Evaluate the overall water security situation in the VG-TB river basin, identify the issues that need to be addressed, and conduct an analysis and assessment of current water resources (quality, quantity), the capacity to meet water demands, water utilization activities within the basin, water-related risks, and the impact of basin development activities, as well as water management practices within the context of climate change.
- Step 2: Define the notion of water security (or define water security) to enable the selection of appropriate indicators. There are various definitions and approaches to water security worldwide. This study opts for the comprehensive description of water security provided by UN-Water, as it aligns with the practical conditions in Vietnam, specifically in the VG-TB river basin. While selecting indicators based on this definition, the research also considers the criteria of the SDG6 and the ADB approach to water security as presented in the AWDO reports.
- Step 3: Determine the boundaries of the assessment framework in terms of space and time. The study uses Water Security Index (WSI) indicators within the administrative boundaries of local areas (districts) in the basin, enabling a comparison of water security levels and facilitating solutions to improve water security for each locality. The period for assessing meteorological and hydrological variables is determined based on historical data. Socio-economic data are collected for the most recent three-year period at the time of assessment. As for assessing the impact of climate change on water security in the basin, a mid-century period (2050) is chosen, along with corresponding scenarios.
- Step 4: Establish the Water Security assessment framework. Based on the objectives of water security, spatial and temporal considerations, preliminary dimensions, indicators, and variables are selected. These aspects must align with the specific conditions and characteristics of the VG-TB river basin. The chosen dimensions, indicators, and variables should effectively represent the impact of various factors on the well-being of the basin’s residents. Water security in the basin is achieved when the population has access to water that meets the required standards in quantity and quality, sanitation facilities, convenient access to water sources, affordability, and safety during water-related disasters, all within acceptable levels. After the preliminary selection of evaluation variables, the SMART analysis method is used to determine the key variables for the assessment framework (see Figure 3).
- Step 5: Consult with relevant stakeholders regarding the suitability of the variables and the assessment framework. Finally, the assessment framework, including dimensions, indicators, and variables determined using the specified methods and data, is evaluated for suitability through expert consultation and engagement with relevant parties. The methodology for building the assessment framework is depicted in Figure 2.
Figure 4.
Diagram for developing the water security framework.
2.2.3. Method for Determining Weights Analysis Hierarchy Process (AHP)
To construct a highly reliable assessment framework that accurately reflects the level of water security in the basin, this study opted for the AHP methodology developed by Saaty (1980) as the chosen method for analyzing the hierarchical system. Saaty (1987) introduced the AHP as a measurement theory to establish ratio scales through discrete and continuous paired comparisons, aid decision-makers in prioritizing tasks, and optimize decision-making (Nhamo et al., 2020). The AHP comparison matrix is created by systematically evaluating pairs of indicators using Saaty’s scale, which ranges from 1 to 9 (Saaty, 1977) (Table 1). Assigning weights to these indicators plays a vital role in evaluating water security. The AHP method employs expert assessments, incorporating both quantitative and qualitative analyses, to determine the relative importance of each indicator (Saaty, 2008).

Table 1.
Scale of relationships between elements of the AHP method (Saaty, 1980).
| Intensity importance | Definition | Explanation |
|---|---|---|
| 1 | Equal importance | The two factors contribute equally |
| 2 | Equally important to moderately important | |
| 3 | Moderate importance | Experience and judgment give moderate priority to one factor |
| 4 | Moderately important to important | |
| 5 | Importance | Experience and judgment have a strong preference for one factor |
| 6 | Important to very important | |
| 7 | Very important | A very important factor |
| 8 | Very important to extremely important | |
| 9 | Extremely important | Highest priority |
Figure 4.
Diagram for determining the weights of factors according to the AHP method (Dang et al., 2011).
Figure 4.
Diagram for determining the weights of factors according to the AHP method (Dang et al., 2011).
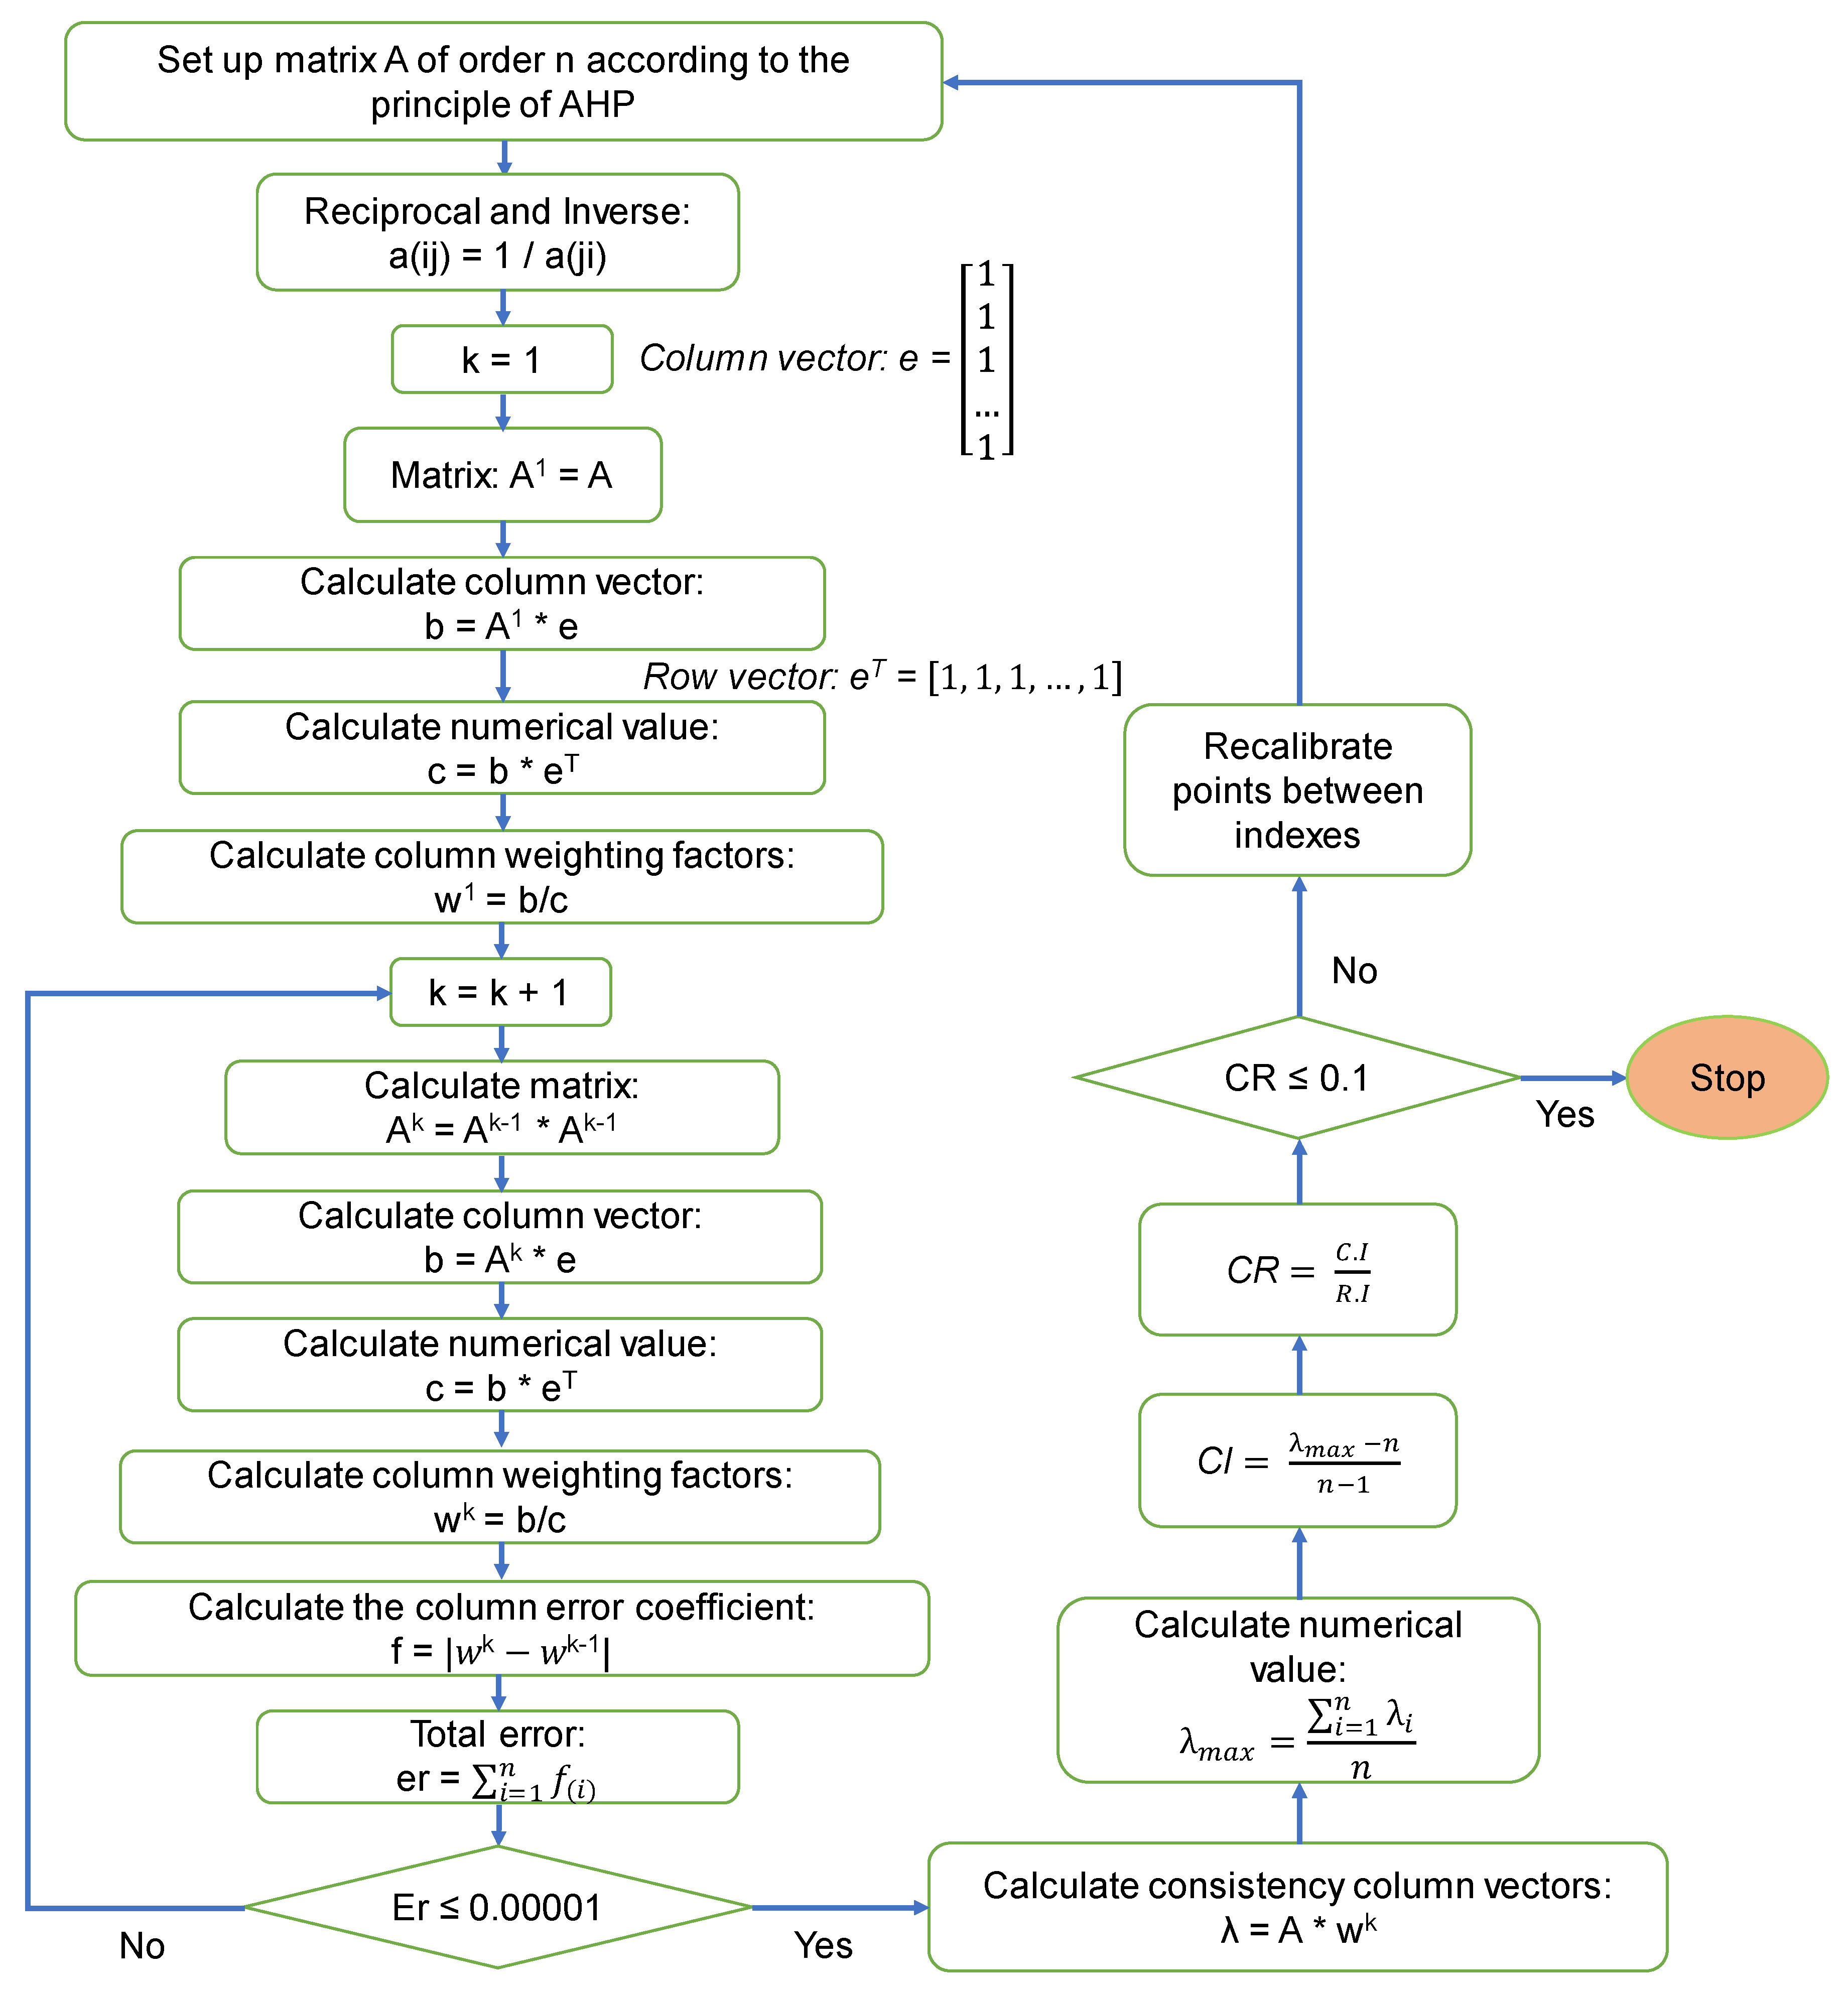
2.2.4. Determining the Consistency of the Pairwise Comparison Matrix
Saaty emphasized that the calculated indices should consistently fall within an acceptable range of less than 0.1 or 10% (Nhamo et al., 2020). CR indicates the probability that the matrix judgments were generated randomly and remain consistent (Alonso and Lamata, 2006). This means that only about 10% or less of the responses are random and inconsistent, while most responses are highly confident and certain. Conversely, if CR ≥ 10%, it indicates a situation where responses are hesitant and inconsistent in assessing pairwise comparisons within matrix A. In such cases, it is necessary to revisit the evaluations with experts to reach a consensus (Saaty, 1977).
To ensure the reliability of a pairwise comparison matrix, it is essential to assess it using consistency indicators (CI) and a validation ratio (CR). These assessments are determined through the following calculations:
where CI is the consistency index; RI is a function of the degree of the pair comparison matrix (n) proposed by (Saaty, 1980), as shown in Table.
The CI coefficient is calculated through λmax and degree of matrices (n):
where λmax is the largest eigenvalue of the pairwise comparison matrix. It is important to note that λmax ≥ n, and if λmax is closer to n, it indicates a higher level of consistency in expert evaluations. The value of λmax is the average of the elements in the consistent column vector λi.
where λi is a consistent column vector with n elements, i = 1 ~ n, each element λi is determined by the following formula:
where [ai,j] are the elements of the experts’ pairwise comparison matrix; w is the weight column vector; wi or wj are both the value of the i or j element of the weight column vector w.
Table 2.
The relationship between the degree of the matrix (n) and RI used in the AHP method.
| n | 1 | 2 | 3 | 4 | 5 | 6 | 7 | 8 | 9 | 10 | 11 | 12 | 13 | 14 | 15 |
| RI | 0.0 | 0.0 | 0.58 | 0.90 | 1.12 | 1.24 | 1.32 | 1.41 | 1.45 | 1.49 | 1.51 | 1.48 | 1.56 | 1.57 | 1.59 |
3. Results and Discussions
3.1. Identification and Selection of the Water Security Assessment Indicators
Through a comprehensive analysis of water security on a global and local scale in Vietnam, several fundamental factors have been identified for consideration when constructing an assessment framework for the VG-TB River basin. These factors include the natural characteristics and socio-economic development activities in Quang Nam province and Da Nang City and the increasing pressure on water supply due to population growth, tourism, water pollution sources, and existing challenges in managing and utilizing water resources. The study initially proposed an evaluation framework utilizing five key dimensions, 17 fundamental indicators, and 34 specific variables.
Based on an analysis of the available data sources and input from expert consultations and relevant stakeholders, the study excluded six variables that did not meet the SMART criteria: (1) Residue of pesticides and fertilizers in agricultural production. (2) Incidence of diseases related to digestive and dermatological health due to the use of unsanitary water sources. (3) Economic water scarcity (the extent of river extraction). (4) Compliance of hydroelectric plants with reservoir operation processes. (5) Water loss due to “virtual water” in agricultural production. (6) Local government’s attention to water security in their decision-making and governance.
Finally, the official set of indices consists of five dimensions, 17 indicators, and 28 variables. These serve as the foundation for calculating the Water Security Index (WSI), which quantifies the level of water security in each locality and the overall water security status in the VG-TB river basin. The components, significance, and methods for determining the variables in the assessment framework are detailed.
3.1.1. Water Resource Potential Dimension (WSI1)
Water is a fundamental factor closely related to water security. The higher the volume of water in the basin, the greater the level of water security. This aspect is linked to the total water supply to the basin. The study examines the key potential sources, including rainfall, surface water, and groundwater. Based on data collected from meteorological and hydrological stations, as well as groundwater measurements, the potential water resources are determined using variables such as annual flow module, low flow module, coefficient of variation for low flow (Cv-dry), average annual rainfall, groundwater exploitation capacity, and reservoir capacity. For WSI1, water resources are evaluated spatially and in terms of time. The potential for new water resources only reflects the balance (surplus/deficit) and does not consider the ability to extract and efficiently use water resources (loss and wastage) (Table 3).
3.1.2. The Water Quality Dimension (WSI2)
The water quality aspect has the most pronounced impact on the water security level of the basin. This aspect is determined through indicators that include emissions from agricultural and aquacultural activities, surface water quality, groundwater quality, and the extent of water quality improvement within the basin. This group of indicators is represented by variables such as agricultural land area, total livestock and poultry population, aquaculture area, the number of lodging establishments, the number of times water quality standards are exceeded, access to clean water sources, and the ability to ensure environmental sanitation conditions (Table 4).
3.1.3. Disaster Dimension (WSI3)
The impact of water-related disasters is a significant factor in ensuring water security; this aspect considers the community’s resilience to the effects of natural disasters. For the VG-TB river basin, typical natural disasters significantly affecting economic and social life include floods, droughts, and saltwater intrusion. The more significant the impact of natural disasters, the lower the level of water security. This aspect is assessed through indicators of flood level, SPI drought index, and river water salinity due to saltwater intrusion. Compared to other elements that humans heavily influence, the impacts of natural disasters on the basin are issues that we cannot fully actively control (Table 5).
3.1.4. Dimension Water Supply Capability (WSI4)
This is a highly crucial aspect that determines the level of water security. This dimension reflects water scarcity within the basin or the degree of water shortage due to insufficient or untapped water resources to meet the water demand at various times. Current assessments indicate that the water potential in the VG-TB basin is substantial due to total annual precipitation. However, the degree of water shortage is primarily due to the temporal distribution of rainfall (which is concentrated during the rainy season) and the system’s inability to harness all the water generated in the basin during the rainy season. This dimension is determined by calculating the balance between the water inflow and demand of various water-consuming sectors within the basin (Table 6).
3.1.5. Basin Development Dimension (WSI5)
The aspect considers the impact of development activities on the basin. This aspect is challenging to determine because the variables include many dimensions and are difficult to quantify. The study evaluates the impact of development activities on the basin based on economic, social, environmental, policy, and institutional criteria. Hydropower exploitation, forest area conversion, and urbanization are activities that significantly impact the basin’s water security. The transfer of water from the Vu Gia River to the Thu Bon River due to the operation of hydroelectric plants is also a notable issue in this basin. The water transfer has caused a water shortage downstream of the Vu Gia River, leading to continuous saltwater intrusion in the dry season in recent years since the hydroelectric system was put into operation. Salinity has dramatically affected the supply of water for agriculture and domestic use in the downstream areas of Quang Nam province and Da Nang City (Table 7).
3.2. Determining the Weights of Factors According to the AHP Method
After selecting the water security assessment framework for the VG-TB basin, including aspects, indices, and variables as synthesized in Section 3.1, the AHP method is employed to establish comparison matrices. The consistency of expert ratings is evaluated through the CR, and calculations are performed to determine the weights of the components of specific variables, indicators, and aspects, as shown in Table 8. This table presents the weight values for different dimensions, indicators, and variables. It can be said that the results of the AHP method depend on the weights assigned to the criteria. In which the Water Resource Potential Dimension (WSI1), “Water Storage Capacity (WSI1-4)” exerts the most substantial influence, carrying an AHP weight of 0.60. Notably, “Reservoir Capacity (WSI1-4-1)” stands out with the highest AHP weight of 1.00, underscoring its pivotal role in shaping water resource potential.
Transitioning to the Water Quality (WS2) dimension, significant contributions arise from “Waste Sources (WS2-1)” with an AHP weight of 0.70. Among these sources, the noticeable impact of “Tourism Service Activities (WS2-1-5)” is evident, boasting a considerable AHP weight of 0.48 and emphasizing its role in influencing water quality.
Within the Natural Disaster dimension (WS3), paramount importance is assigned to the sub-dimension “Flood (WSI3-1),” carrying a substantial AHP weight of 0.78. Specifically, the assessment of “Flood Depth (WSI3-1-1)” takes precedence with the highest AHP weight of 1.00, underscoring its crucial role in evaluating the consequences of floods.
Turning to the Ability to Meet Water Needs (WSI4), the primary contributor is identified as “Level of Water Demand Met (WSI4-1),” boasting a noteworthy AHP weight of 1.00. Noteworthy is “Water Shortage (Water Scarcity) (WSI4-1-1),” commanding the highest AHP weight of 1.00 and signifying its indispensable role in determining the basin’s capacity to fulfill water needs.
3.3. Discussions
After quantitative calculations based on 28 variables derived from statistical data and mathematical models, the assessment framework provides the WSI for each variable, indicator, and dimension. Subsequently, this allows the determination of the WSI for individual regions and the aggregated WSI for the entire basin. When considering climate change, the variables most relevant are temperature increase, sea-level rise, and changes in rainfall patterns are examined within the potential water resources aspect (WSI1), natural disasters (WSI3), and water supply capability (WSI4). Indices related to basin development are reflected in the Development of the Basin aspect (WSI5), with a few variables in the remaining dimensions. The water security assessment framework for the VG-TB River basin, after quantitatively calculating the WSI for both the entire basin and individual regions (districts/counties), serves as a scientific basis to provide an overarching view of the current status and changes in water security within the basin, considering the impacts of climate change and future basin development activities. In addition to the achieved results, the study has excluded six variables considered highly ideal for assessing water security within the basin due to limitations in available data and calculations. Furthermore, some variables had to be indirectly calculated through other indicators, which might not represent the assessment objectives best. Besides that, although the values of the VG-TB River basin water index, as outlined in Table 8, provide an overall picture of water security, inputs from complex water resource models can be utilized to calculate specific indicator parameters, especially when applying probability and uncertainty associated with mathematical expressions (Biswas and Rahman, 2023). These are challenges that need to be addressed in further research endeavors.
4. Conclusions
This article utilized the PAM to construct an Assessment Framework for Water Security for the VG-TB River basin. The framework encompasses five dimensions, 17 indicators, and 28 variables, aligning with the UN-Water definition of water security and addressing the SDG6 criteria for global water sustainability. Additionally, it adheres to the ADB approach to assessing water security, as outlined in the AWDO reports. The Assessment Framework offers a comprehensive overview of the factors influencing the water security status within the basin. In addition to the inherited indices, the research proposes aspects, indicators, and indices that reflect significant influences on the basin’s water security level. These influences include tourism exploitation, water transfers within the basin due to hydroelectric activities, urbanization, and overall developmental activities. These impacts are represented through the Development of the Basin (WSI5), Waste Emissions (WSI2-1), Water Transfers within the Basin (WSI5-1), Urbanization (WSI5-3), Basin Management (WSI5-4), variables related to Tourism Service Activities (WSI2-1-5), Rural Infrastructure Development (WSI5-4-2), the ratio of specialized personnel in state management agencies (WSI5-4-3), and others. Furthermore, several variables are calculated using new methods that are suitable for the available data conditions in the basin, such as Reservoir Capacity (WSI1-4-1), Livestock Farming Activities (WSI2-1-2), Poultry Farming Activities (WSI2-1-3), the number of annual exceedances of water quality standards (WSI2-2-1), the Standardized Precipitation Index for 12 months (WSI3-2-1), and Literacy Rate (WSI5-2-1).
Author Contributions
supervision, conceptualization, writing – orginal draft, and review: N.M.D.; data collection, curation and analysis, software, computation, results analysis: L.N.V.; writing – original draft, formal analysis, visualization, writing – review & editing: A.H.T.; writing – original draft, formal analysis, visualization, writing – review & editing: A.S.G.; writing, review, and editing: P.N.T.; conceptualization, writing – original draft, formal analysis, visualization, writing – review & editing: T.A.D. All authors have read and agreed to the published version of the manuscript.
Funding
This research received no external funding.
Institutional Review Board Statement
Not applicable.
Informed Consent Statement
Informed consent was obtained from all subjects involved in the study.
Acknowledgments
The authors acknowledge experts participated discussions and workshops during this research is conducted, and the anonymous reviewers.
Conflicts of Interest
The authors declare no conflict of interest.
References
- Aboelnga, H.T.; Ribbe, L.; Frechen, F.-B.; Saghir, J. Urban water security: Definition and assessment framework. Resources 2019, 8, 178. [Google Scholar] [CrossRef]
- ADB. Asian Water Development Outlook (AWDO) - Strengthening Water Security in Asia and The Pacific. Asian Development Bank, Mandaluyong City, Philippines, 2020.
- ADB. Asian water development outlook 2016: Strengthening water security in Asia and the Pacific. Asian Development Bank, Mandaluyong City, Philippines, 2016.
- Allan, J.V.; Kenway, S.J.; Head, B.W. Urban water security-what does it mean? Urban Water Journal 2018, 15, 899–910. [Google Scholar] [CrossRef]
- Alonso, J.A.; Lamata, M.T. Consistency in the analytic hierarchy process: A new approach. International journal of uncertainty, fuzziness and knowledge-based systems 2016, 14, 445–459. [Google Scholar] [CrossRef]
- An, N.; Hoa, N. Research on flood forecasting in Vu Gia—Thu Bon river basin. J. Water Resour. Environ. Eng 2013, 43, 118–124. [Google Scholar]
- Assefa, Y.T.; Babel, M.S.; Sušnik, J.; Shinde, V.R. Development of a generic domestic water security index, and its application in Addis Ababa, Ethiopia. Water 2018, 11, 37. [Google Scholar] [CrossRef]
- Babel, M.; Shinde, V.R. A framework for water security assessment at basin scale. APN Science Bulletin 2018, 8, 27–32. [Google Scholar] [CrossRef]
- Babel, M.S.; Shinde, V.R.; Sharma, D.; Dang, N.M. Measuring water security: A vital step for climate change adaptation. Environmental Research 2020, 185, 109400. [Google Scholar] [CrossRef] [PubMed]
- Bakker, K. Water security: Research challenges and opportunities. Science 2012, 337, 914–915. [Google Scholar] [CrossRef]
- Biswas, R.R.; Rahman, A. Development and application of regional urban water security indicators. Utilities Policy 2023, 84, 101637. [Google Scholar] [CrossRef]
- Cook, C.; Bakker, K. Water security: Debating an emerging paradigm. Global environmental change 2012, 22, 94–102. [Google Scholar] [CrossRef]
- Dang, N.M.; Babel, M.S.; Luong, H.T. Evaluation of food risk parameters in the day river flood diversion area, Red River delta, Vietnam. Natural hazards 2011, 56, 169–194. [Google Scholar] [CrossRef]
- Dang, N.M.; Tu, V.T.; Babel, M.; Shinde, V.; Sharma, D. Water Security Assessment for the Red River Basin, Vietnam. In Towards Water Secure Societies: Coping with Water Scarcity and Quality Challenges; Ribbe, L., Haarstrick, A., Babel, M., Dehnavi, S., Biesalski H., K., Eds.; Springer: Gewerbestrasse 11, 6330 Cham, Switzerland, 2021; pp. 11–28. [Google Scholar]
- Dang, N.M.; Tu, V.T.; Babel, M.S.; Shinde, V.; Sharma, D. Water security assessment for the Red River Basin, Vietnam. In Proceedings of the Water Security and Climate Change, Cologne, Germany, 18 – 21 Sep 2017. [Google Scholar]
- Dang, N.M.; Tu, V.T.; Hai, N.D. Water Security Assessment Framework for Hanoi city: The data collection and analysis. In Proceedings of the Water Security and Climate Change: Challenges and Opportunities in Asia, Bangkok, Thailand, 29 Nov – 1 Dec 2016. [Google Scholar]
- Don, T.V. Research on reasonable allocation of surface water resources for the Vu Gia-Thu Bon River basin. Ph.D. Thesis, Institute of Meteorology, Hydrology and Climate Change, Hanoi, Vietnam, 2021. (In Vietnamese). [Google Scholar]
- Dong, G.; Shen, J.; Jia, Y.; Sun, F. Comprehensive evaluation of water resource security: Case study from Luoyang City, China. Water 2018, 10, 1106. [Google Scholar] [CrossRef]
- Dung, N.T.K. Research and develop a method to determine minimum flow - Apply to Vu Gia-Thu Bon River syste. PhD Thesis, Viet nam Academy for Water Resources, Hanoi, , Vietnam, 2018. (In Vietnamese). [Google Scholar]
- Falkenmark, M. Adapting to climate change: Towards societal water security in dry-climate countries. International Journal of Water Resources Development 2013, 29, 123–136. [Google Scholar] [CrossRef]
- Fischer, G.; Hizsnyik, E.; Tramberend, S.; Wiberg, D. Towards indicators for water security-A global hydro-economic classification of water challenges, 2015.
- Gain, A.K.; Giupponi, C.; Wada, Y. Measuring global water security towards sustainable development goals. Environmental Research Letters 2016, 11, 124015. [Google Scholar] [CrossRef]
- Gregucci, D.; Nazir, F.; Calabretta, M.M.; Michelini, E. Illuminating Progress: The Contribution of Bioluminescence to Sustainable Development Goal 6—Clean Water and Sanitation—Of the United Nations 2030 Agenda. Sensors 2023, 23, 7244. [Google Scholar] [CrossRef]
- Grey, D.; Sadoff, C.W. Sink or swim? Water security for growth and development. Water policy 2007, 9, 545–571. [Google Scholar] [CrossRef]
- Hieu, B.D.; Thi, T.D.; Huong, H.T.L.; Thinh, D.Q.; Dai, N.V.; Lieu, N.T.; Tuan, N.A. Assessing water security in Quang Ngai province in the context of climate change. Vietnam Journal of Hydro- Meteorology 2021, 729, 79–90. (In Vietnamese) [Google Scholar]
- Hung, L. Research on the impact of operating upstream hydroelectric projects on water supply of Cau Do water plant in the context of climate change, sea level rise and socio-economic development of Da Nang city - Propose suitable solutions. Science and Technology Tasks of Danang City People’s Committee, Da Nang, 2017. (In Vietnamese).
- Huy, D.Q. Research on extreme rain and floods in the Vu Gia - Thu Bon River basin. PhD Thesis, Viet nam Academy for Water Resources, Hanoi, Vietnam, 2018. (In Vietnamese). [Google Scholar]
- Jensen, O.; Wu, H. Urban water security indicators: Development and pilot. Environmental Science & Policy 2018, 83, 33–45. [Google Scholar]
- Jiménez Cisneros, B.E.; Oki, T.; Arnell, N.W.; Benito, G.; Cogley, J.G.; Doll, P.; Jiang, T.; Mwakalila, S.S. Freshwater resources. 2014.
- Karl, T.R.; Melillo, J.M.; Peterson, T.C. Global climate change impacts in the United States: A state of knowledge report from the US Global Change Research Program. Cambridge University Press, 2019.
- Lan, V.T.T.; Son, H.T.; Tung, N.B.; Thuy, D.B.; Yen, N.T.H. Water balance in the Vu Gia-Thu Bon River basin using the Mike Hydro Basin model. Vietnam Journal of Hydro- Meteorology 2019, 208, 1–12. (In Vietnamese) [Google Scholar]
- Loi, N.K.; Liem, N.D.; Tu, L.H.; Hong, N.T.; Truong, C.D.; Tram, V.N.Q.; Nhat, T.T.; Anh, T.N.; Jeong, J. Automated procedure of real-time flood forecasting in Vu Gia–Thu Bon river basin, Vietnam by integrating SWAT and HEC-RAS models. Journal of Water and Climate Change 2019, 10, 535–545. [Google Scholar] [CrossRef]
- Marttunen, M.; Mustajoki, J.; Sojamo, S.; Ahopelto, L.; Keskinen, M. A framework for assessing water security and the water–energy–food nexus—The case of Finland. Sustainability 2019, 11, 2900. [Google Scholar] [CrossRef]
- Mekonnen, M.M. , Hoekstra, A.Y. Four billion people facing severe water scarcity. Science advances 2016, 2, e1500323. [Google Scholar] [CrossRef] [PubMed]
- Mui, N.T.; Thanh, L.D. Research on water resource security for sustainable development in the Ma river basin. Journal of Water Resources & Environmental Engineering 2018, 60, 100–107. (In Vietnamese) [Google Scholar]
- Nguyen, L.D.; Nguyen, H.T.; Dang, P.D.; Duong, T.Q.; Nguyen, L.K. Design of an automatic hydro-meteorological observation network for a real-time flood warning system: A case study of Vu Gia-Thu Bon River basin, Vietnam. Journal of Hydroinformatics 2021, 23, 324–339. [Google Scholar] [CrossRef]
- Nhamo, L.; Mabhaudhi, T.; Mpandeli, S.; Dickens, C.; Nhemachena, C.; Senzanje, A.; Naidoo, D.; Liphadzi, S.; Modi, A.T. An integrative analytical model for the water-energy-food nexus: South Africa case study. Environmental Science & Policy 2020, 109, 15–24. [Google Scholar]
- Penn, H.J.; Loring, P.A.; Schnabel, W.E. Diagnosing water security in the rural North with an environmental security framework. Journal of environmental management 2017, 199, 91–98. [Google Scholar] [CrossRef] [PubMed]
- Phuong, D.N.D.; Duong, T.Q.; Liem, N.D.; Tram, V.N.Q.; Cuong, D.K.; Loi, N.K. Projections of future climate change in the VG-TB River Basin, Vietnam by using statistical downscaling model (SDSM). Water 2020, 12, 755. [Google Scholar] [CrossRef]
- Saaty, R.W. The analytic hierarchy process—What it is and how it is used. Mathematical modelling 1987, 9, 161–176. [Google Scholar] [CrossRef]
- Saaty, T.L. Decision making with the analytic hierarchy process. IJSSCI Published Online 18/3/2008, pp. 83–98. [CrossRef]
- Saaty, T.L. The Analytic Hierarchy Process. Agricultural Economics Review 1980, 70, 34. [Google Scholar]
- Saaty, T.L. A scaling method for priorities in hierarchical structures. Journal of Mathematical Psychology 1977, 15, 234–281. [Google Scholar] [CrossRef]
- Scott, C.A.; Meza, F.J.; Varady, R.G.; Tiessen, H.; McEvoy, J.; Garfin, G.M.; Wilder, M.; Farfán, L.M.; Pablos, N.P.; Montaña, E. Water security and adaptive management in the arid Americas. Annals of the Association of American Geographers 2013, 103, 280–289. [Google Scholar] [CrossRef]
- Srinivasan, V.; Seto, K.C.; Emerson, R.; Gorelick, S.M. The impact of urbanization on water vulnerability: A coupled human–environment system approach for Chennai, India. Global Environmental Change 2013, 23, 229–239. [Google Scholar] [CrossRef]
- Steffen, W.; Richardson, K.; Rockström, J.; Cornell, S.E.; Fetzer, I.; Bennett, E.M.; Biggs, R.; Carpenter, S.R.; De Vries, W.; De Wit, C.A. Planetary boundaries: Guiding human development on a changing planet. Science 2015, 347, 1259855. [Google Scholar] [CrossRef] [PubMed]
- Su, Y.; Gao, W.; Guan, D. Integrated assessment and scenarios simulation of water security system in Japan. Science of the Total Environment 2019, 671, 1269–1281. [Google Scholar] [CrossRef]
- Tahir, A.C.; Darton, R. The process analysis method of selecting indicators to quantify the sustainability performance of a business operation. Journal of cleaner production 2010, 18, 1598–1607. [Google Scholar] [CrossRef]
- Thang, T.V. Research on water resource allocation and reasonable operation of the reservoir system in the Vu Gia-Thu Bon River basin during the dry season. PhD Thesis, Viet nam Academy for Water Resources, Vietnam, 2019. (In Vietnamese). [Google Scholar]
- Tho, D.B.; Binh, N.Q.; Duong, V.N.; Hieu, L.C. Assessing the impact of land cover change on the flow regime in the Vu Gia-Thu Bon River basin. Vietnam, 2018.
- Tien, T.H.; Dat, N.D.; Tuong, P.; Thien, V.M.; Phuong, N.H.; Quan, N.T. Research on calculating the water security index for the Mekong Delta region of Vietnam. Vietnam Journal of Hydro- Meteorology 2022, 744, 39–54. (In Vietnamese) [Google Scholar]
- United Nations. Transforming our World: The 2030 agenda for sustainable development. UN general assembly resolution (No. A/RES/70/1), New York, 2015.
- United Nations. Resolution adopted by the General Assembly. Resolution adopted by the General Assembly (No. A/55/L.2). UN Department of Public Information, New York, 2000.
- UN-Water. Water in a changing world. World Water Assessment Programme, United Nations, 2009.
- Viet, C.T.; Thom, N.T.; Van, C.T. Research to establish a method to calculate and evaluate developments in water security index for Tra Vinh city, Tra Vinh province. Vietnam Journal of Earth Sciences 2018, 34, 1–9. (In Vietnamese) [Google Scholar]
- Vo, N.D.; Gourbesville, P. Flood risk assessment: A view of climate change impact at VG-TB catchment, Vietnam, in: Advances in Hydroinformatics: SimHydro 2017 - Choosing The Right Model in Applied Hydraulics. Springer, 2018, pp. 727–737.
- Vo, N.D.; Gourbesville, P. Application of deterministic distributed hydrological model for large catchment: A case study at VG-TB catchment, Vietnam. Journal of Hydroinformatics 2016, 18, 885–904. [Google Scholar] [CrossRef]
- Vo, N.D.; Gourbesville, P.; Vu, M.T.; Raghavan, S.V.; Liong, S.-Y. A deterministic hydrological approach to estimate climate change impact on river flow: Vu Gia–Thu Bon catchment, Vietnam. Journal of Hydro-environment Research 2016, 11, 59–74. [Google Scholar] [CrossRef]
- Vorosmarty, C.J.; Green, P.; Salisbury, J.; Lammers, R.B. Global water resources: Vulnerability from climate change and population growth. Science 2000, 289, 284–288. [Google Scholar] [CrossRef]
- Vörösmarty, C.J.; Léveque, C.; Revenga, C.; Bos, R.; Caudill, C.; Chilton, J.; Douglas, E.; Meybeck, M.; Prager, D.; Balvanera, P. Fresh water. Millennium ecosystem assessment 2005, 1, 165–207. [Google Scholar]
- Vörösmarty, C.J.; McIntyre, P.B.; Gessner, M.O.; Dudgeon, D.; Prusevich, A.; Green, P.; Glidden, S.; Bunn, S.E.; Sullivan, C.A.; Liermann, C.R. Global threats to human water security and river biodiversity. Nature 2010, 467, 555–561. [Google Scholar] [CrossRef] [PubMed]
- Vu, M.T.; Vo, N.D.; Gourbesville, P.; Raghavan, S.V.; Liong, S.-Y. Hydro-meteorological drought assessment under climate change impact over the Vu Gia–Thu Bon river basin, Vietnam. Hydrological Sciences Journal 2017, 62, 1654–1668. [Google Scholar] [CrossRef]
- Wagener, T.; Sivapalan, M.; Troch, P.A.; McGlynn, B.L.; Harman, C.J.; Gupta, H.V.; Kumar, P.; Rao, P.S.C.; Basu, N.B.; Wilson, J.S. The future of hydrology: An evolving science for a changing world. Water Resources Research 2010, 46. [Google Scholar] [CrossRef]
- Wu, H.; Darton, R.; Borthwick, A. Defining and measuring river basin sustainability: A case study of the Yellow River. WIT Transactions on the Built Environment 2015, 168, 383–394. [Google Scholar]
- Wu, H.; Leong, C. A composite framework of river sustainability: Integration across time, space and interests in the Yellow River and Ganges River. Water Policy 2016, 18, 138–152. [Google Scholar] [CrossRef]
- Xiao-jun, W.; Jian-yun, Z.; Shahid, S.; Xing-hui, X.; Rui-min, H.; Man-ting, S. Catastrophe theory to assess water security and adaptation strategy in the context of environmental change. Mitigation and adaptation strategies for global change 2014, 19, 463–477. [Google Scholar] [CrossRef]
- Zeitoun, M. The global web of national water security. Global Policy 2011, 2, 286–296. [Google Scholar] [CrossRef]
Table 3.
Composition and determination of the dimension of water resource potential.
| Indicators | Variables | Determine | Data source | Meaning of variables in water security assessment |
| Surface water potential (WSI1-1) |
Year flow module (WSI1-1-1) |
Calculate the daily flow from the mathematical model. Based on this data series, determine Q0 and Qdry for each year. Calculate the average M0 and Mdry for many years. | Central Regional Hydrometeorological Station, Department of Natural Resources and Environment of Quang Nam province, Da Nang City. | It demonstrates the basin’s ability to produce water. The larger M0 represents the abundance and availability of water resources and the higher the water security level. |
| Dry season flow module (WSI1-1-2) |
Demonstrates the ability to produce water in the basin during the dry season. The smaller the Mdry, the higher the level of water shortage. The larger the Mdry, the higher the level of security. | |||
| Level of low flow fluctuation (WSI1-1-3) | Establish the low flow series and the low flow Cv from the average flow in each year’s dry season. | The larger the Cv-dry, the greater the dispersion of the dry season flow data series and the higher the possibility of extreme drought events. The higher the Cv-dry, the lower the water security level. | ||
| Rainwater potential (WSI1-2) |
Average annual rainfall (WSI1-2-1) |
Rainfall distribution in localities is determined from the annual rainfall isometric map. | The larger the amount of water coming from rain distributed in localities, the higher the level of water security. | |
| Groundwater potential (WSI1-3) | Underground water reserves can be exploited (WSI1-3-1) | Determine groundwater reserves from groundwater potential reports. | Quang Nam Environmental Monitoring Center, Da Nang | The ability to replenish water sources from groundwater, the greater the groundwater potential, the higher the level of water security. |
| Water storage capacity (WSI1-4) | Total capacity of reservoirs (WSI1-4-1) |
Determine from statistics the capacity of all reservoirs from the Irrigation Departments and hydroelectric reservoir owners. | Department of Agriculture and Rural Development, Irrigation Engineering Company, Hydroelectric plants | In an area with many reservoirs (irrigation/hydropower), the ability to retain water in the basin is higher, and the benefiting area has a high level of water security. |
Table 4.
Composition and determination of Water Quality Dimension.
| Indicators | Variables | Determine | Data source | Meaning of variables in water security assessment |
|---|---|---|---|---|
| Waste sources (WSI2-1) |
Agricultural farming activities (WSI2-1-1) | The ratio of land area used for agricultural cultivation/total natural area | Department of Agriculture and Rural Development of Quang Nam and Da Nang provinces | The more farming activities, the greater the water use and loss level, and the more fertilizer and pesticide residues pollute water sources. |
| Livestock farming activities. (WSI2-1-2) |
Total livestock herd (head) of each locality | The lower the water security level, the more livestock farming activities lead to surface water and groundwater pollution. | ||
| Poultry farming activities. (WSI2-1-3) |
Total poultry herd (thousands of birds) in each locality | The lower the water security level, the more poultry farming activities lead to surface water and groundwater pollution. | ||
| Aquaculture activities (WSI2-1-4) |
The ratio of aquaculture area of each locality/total natural land area of the locality. | The larger the aquaculture area, the more drug residues, and leftover food lead to pollution and fertility. A large amount of seawater is introduced to create a brackish water environment, causing salinity. The more this activity, the lower the water security level. | ||
| Tourism service activities (WSI2-1-5) |
Total number of accommodation rooms serving tourism in each locality | Department of culture, sports and tourism of Quang Nam and Da Nang provinces | The total number of accommodation rooms represents the need to serve large numbers of tourists, causing local pressure on water supply needs and water pollution from wastewater and garbage discharge activities in localities where these activities occur. tourism. The more tourism activities, the lower the water security level. | |
| Surface and underground water quality (rivers, lakes, wells) (WSI2-2) |
Number of times exceeding the allowable threshold of water quality indicators/year (WSI2-2-1) | The number of times in the year that 12 basic indicators exceeded the allowable threshold level B1 (QCVN 08 MT: 2023/BTNMT)/the total number of monitoring times in the year. | Water quality monitoring report from environmental monitoring centers of Quang Nam and Da Nang provinces | The number of times exceeding the allowable threshold level B1 (QCVN 08-MT:2023/BTNMT) of 12 basic indicators during the year at monitoring points represents the pollution level of the local water environment. The more passes, the lower the water security. |
| Degree of water quality improvement (WSI2-3) |
Percentage of communes with common domestic wastewater systems (WSI2-3-1) |
Number of communes with shared domestic wastewater systems/total number of communes (%) | Quang Nam and Da Nang statistical yearbook | The more communes have common domestic wastewater systems, the better the wastewater is collected, minimizing water pollution, and the higher the water security level. |
| Percentage of communes with waste collection in the area (WSI2-3-2) |
Number of communes with waste collection in the area/total number of communes (%) |
Quang Nam and Da Nang statistical yearbook | The more communes that have waste collection on the ground, the better the amount of waste collected and treated, minimizing water pollution from surface waste and the higher the level of water security. | |
| Ability to supply clean water according to QCVN 02:2009/BYT (WSI2-3-3) | Percentage of households provided with clean water according to Standard 02/Total number of households (%) | Quang Nam and Da Nang statistical yearbook | According to Standard 02, the more households are provided with clean water, the better the water supply system, the more people can access clean water, and the better the water security. |
Table 5.
Components and determine natural disaster dimension.
| Indicators | Variables | Determine | Data source | Meaning of variables in water security assessment |
|---|---|---|---|---|
| Flood (WSI3-1) |
Flood depth (WSI3-1-1) | Flood map of a frequently occurring flood (P = 5% - 10%) | Irrigation Department | The level of flooding corresponding to floods that are likely to occur frequently reflects the negative impact of flooding on the basin; the deeper the level of flooding, the lower the level of water security. |
| Drought (WSI3-2) |
12-month drought index SPI12 (WSI3-2-1) |
SPI12 index was determined: R: calculated annual CHIRPS rainfall; : documented average CHIRPS rainfall; σ: standard deviation of document list. |
Global CHIRPS satellite rain data | Localities with high levels of drought significantly affect water supply, and the damage caused by drought is large. The higher this index, the lower the water security. |
| Saline intrusion (WSI3-3) |
Salinity (WSI3-3-1) |
Salinity S (‰) determined from mathematical model results | Environmental monitoring center of Quang Nam and Da Nang provinces. | The greater the salinity S (‰), the higher the level of salinity intrusion, the greater the damage, and the lower the water security level. |
Table 6.
Components and determine the ability to meet water demand dimension.
| Indicators | Variables | Determine | Data source | Meaning of variables in water security assessment |
|---|---|---|---|---|
| Level of water demand satisfaction (WSI4-1) | Degree of water shortage (water scarcity) (WSI4-1-1) |
Calculate the water balance between incoming water volume and total water demand of sectors in the basin. | Central Region Hydrometeorological Station, Department of Agriculture and Rural Development, Department of Industry and Trade of Quang Nam and Da Nang | The greater the water resource shortage, the less the ability to exploit and use water resources efficiently. Not meeting the water demand for industries leads to low water security. |
Table 7.
Components and ways to determine basin development dimension.
| Indicators | Variables | Determine | Data source | Meaning of variables in water security assessment |
|---|---|---|---|---|
| Water transfer in the basin (WSI5-1) |
Give/receive water ( WSI5-1-1) |
Total amount of water transferred (to)/ total amount of natural water arriving in that basin (%) | Calculated from the model, Dak Mi 4 hydropower plant operating parameters, | The total water outflow from the basin (considering dry season water supply only, excluding the flood season) increases due to the influence of hydropower projects; this will affect the downstream area of the basin and the water security level of the downstream region (post-construction), making the water security level lower. Conversely, the portion of the basin that receives water will have the opposite effect. |
| Socio-economic (WSI5-2) | Level of awareness and propaganda about water security in the community (WSI5-2-1) | Total number of teachers at schools (primary, middle, high school) of each locality/ 10,000 people (people/ 10,000 people) | Quang Nam and Da Nang statistical yearbook | A high ratio of high school teachers in the population represents a high proportion of educational establishments or the number of students in the locality, representing the number of people being propagated and educated about the awareness of saving and protecting water resources. A high ecological environment and water security level will be high, and vice versa. |
| Average income per capita (WSI5-2-2) |
Average income (Thousand VND/person/month) | Quang Nam and Da Nang statistical yearbook | Localities with high per capita income demonstrate their ability to withstand adverse impacts from natural disasters (floods, droughts, etc.) and improve their quality of life and living environment. They also have a good ability to pay for water supply services. The higher the average income, the better the level of water security. | |
| Health services (WSI5-2-3) | Total number of hospital beds of medical facilities in the area (beds) | Quang Nam and Da Nang statistical yearbook | The greater the number of hospital beds in medical facilities in the area, the better the living conditions and resilience to the negative impacts of natural disasters related to the water environment. | |
| Urbanization (WSI5-3) | Degree of decline in green area (WSI5-3-1) | Determine the index from remote sensing images over time to determine the level of tree area decline. | Data from remote sensing image source Sentinel 2 | The more significant the decline in the green area, the greater the reduction of the basin’s land cover and buffer surface. This affects the ability to store water and prevent erosion. High levels of urbanization and heavy forest exploitation activities pressure the water environment. The greater the degree of degradation, the lower the water security. |
| Population density (WSI5-3-2) |
Population density of localities (people/km2) | Quang Nam and Da Nang statistical yearbook | The larger the population of localities, the higher the demand for water supply and the higher the level of waste discharge (wastewater, garbage), which will negatively impact the water environment. The higher the population density, the lower the level of water security response. | |
| Basin governance (WSI5-4) | Investment capital for water supply, waste and wastewater management, and treatment activities (WSI5-4-1) | Investment capital for water supply, management, waste, and wastewater treatment activities in localities (million VND) | Quang Nam and Da Nang statistical yearbook | The larger the investment capital allocated to water supply, waste management, and wastewater treatment activities in local areas, the more it enhances water supply capacity and the ability to manage and control water environmental pollution. A higher level of investment capital correlates with higher water security. |
| Infrastructure development in rural areas (WSI5-4-2) | Percentage of communes meeting new rural standards/total number of communes in the locality (%) | Quang Nam New Rural Office, Da Nang | The more communes that meet new rural standards the better the rural infrastructure system, including good water supply and wastewater treatment systems, living environment conditions, and accessibility. Guaranteed water source, educated people, high standard of living (meets 19 new rural criteria). A locality with a high rate means a good level of water security. | |
| The proportion of field managers in state management agencies (districts) with appropriate expertise (WSI5-4-3) | Number of people with expertise in water resources field/number of district People’s Committee officials (%) | People’s Committees of districts in Quang Nam Province and Da Nang City | The more people with expertise in water resources in the local management and administration apparatus, the better the advice will be for the management and direction of local authorities to ensure water security issues, as well as the ability to propagate and raise awareness about water security in local communities. The higher this ratio, the better the water security level. |
Table 8.
AHP Weights for Water Security Dimensions in VG-TB Basin.
| Dimensions | Indicator | Variable | |||
|---|---|---|---|---|---|
| Main Dimensions | AHP Weight | Sub-Dimensions | AHP Weight | Sub-Dimensions | AHP Weight |
| Water Resource Potential Dimension (WSI1) | 0.04 | Surface water potential (WSI1-1) | 0.23 | Year flow module (WSI1-1-1) | 0.14 |
| Dry season flow module (WSI1-1-2) | 0.80 | ||||
| Fluctuating level of flow in the dry season (WSI1-1-3) | 0.06 | ||||
| Rainwater potential (WSI1-2) | 0.04 | Average annual rain (WSI1-2-1) | 1.00 | ||
| Groundwater potential (WSI1-3) | 0.13 | Ability to exploit groundwater (WSI1-3-1) | 1.00 | ||
| Water storage capacity (WS1-4) | 0.60 | Reservoir capacity (WSI1-4-1) | 1.00 | ||
| Water quality (WS2) | 0.10 | Waste sources (WS2-1) | 0.70 | Agricultural cultivation activities (WS2-1-1) | 0.05 |
| Cattle raising activities (WS2-1-2) | 0.28 | ||||
| Poultry farming activities (WS2-1-3) | 0.15 | ||||
| Aquaculture activities (WS2-1-4) | 0.04 | ||||
| Tourism service activities (WS2-1-5) | 0.48 | ||||
| Surface and groundwater quality (WSI2-2) | 0.08 | Number of times exceeding the allowable threshold of criteria/year (WS2-2-1) | 1.00 | ||
| Level of improvement in water quality (WSI2-3) | 0.21 | Percentage of communes with shared domestic wastewater systems (WSI2-3-1) | 0.15 | ||
| Percentage of communes with waste collection in the area (WSI2-3-2) | 0.07 | ||||
| Ability to supply clean water according to Regulation 02 - 2009 BYT, Vietnam (WSI2-3-3) | 0.79 | ||||
| Natural disaster (WS3) | 0.34 | Flood (WSI3-1) | 0.78 | Flood depth (WSI3-1-1) | 1.00 |
| Drought (WSI3-2) | 0.14 | Standardized Precipitation Index (SPI) (WSI3-1-2) | 1.00 | ||
| Salinity intrusion (WSI3-3) | 0.08 | Salinity (S‰) (WSI3-1-3) | 1.00 | ||
| Ability to meet water needs (WSI4) | 0.38 | Level of water demand met (WSI4-1) | 1.00 | Water Shortage (Water Scarcity) (WSI 4-1-1) | 1.00 |
| Basin development (WSI5) | 0.15 | Water transfer (WSI5-1) | 0.16 | Giving/receiving water (WSI5-1-1) | 1.00 |
| Socio-economic (WSI5-2) | 0.06 | Public intelligence (WSI5-2-1) | 0.08 | ||
| Average income per capita (WSI5-2-2) | 0.60 | ||||
| Health services (WSI5-2-3) | 0.32 | ||||
| Urbanization (WSI5-3) | 0.15 | Reduced green area (WSI5-3-1) | 0.20 | ||
| Population density (WSI5-3-2) | 0.80 | ||||
| Basin Governance (WSI5-4) | 0.63 | Investment capital for water supply, waste and wastewater management, and treatment activities (WSI5-4-1) | 0.12 | ||
| Infrastructure (WSI5-4-2) | 0.68 | ||||
| Water resource management (WSI5-4-3) | 0.20 | ||||
Disclaimer/Publisher’s Note: The statements, opinions and data contained in all publications are solely those of the individual author(s) and contributor(s) and not of MDPI and/or the editor(s). MDPI and/or the editor(s) disclaim responsibility for any injury to people or property resulting from any ideas, methods, instructions or products referred to in the content. |
© 2024 by the authors. Licensee MDPI, Basel, Switzerland. This article is an open access article distributed under the terms and conditions of the Creative Commons Attribution (CC BY) license (http://creativecommons.org/licenses/by/4.0/).
Copyright: This open access article is published under a Creative Commons CC BY 4.0 license, which permit the free download, distribution, and reuse, provided that the author and preprint are cited in any reuse.


