Submitted:
03 April 2024
Posted:
03 April 2024
You are already at the latest version
Abstract
Keywords:
1. Introduction
2. Materials and Methods
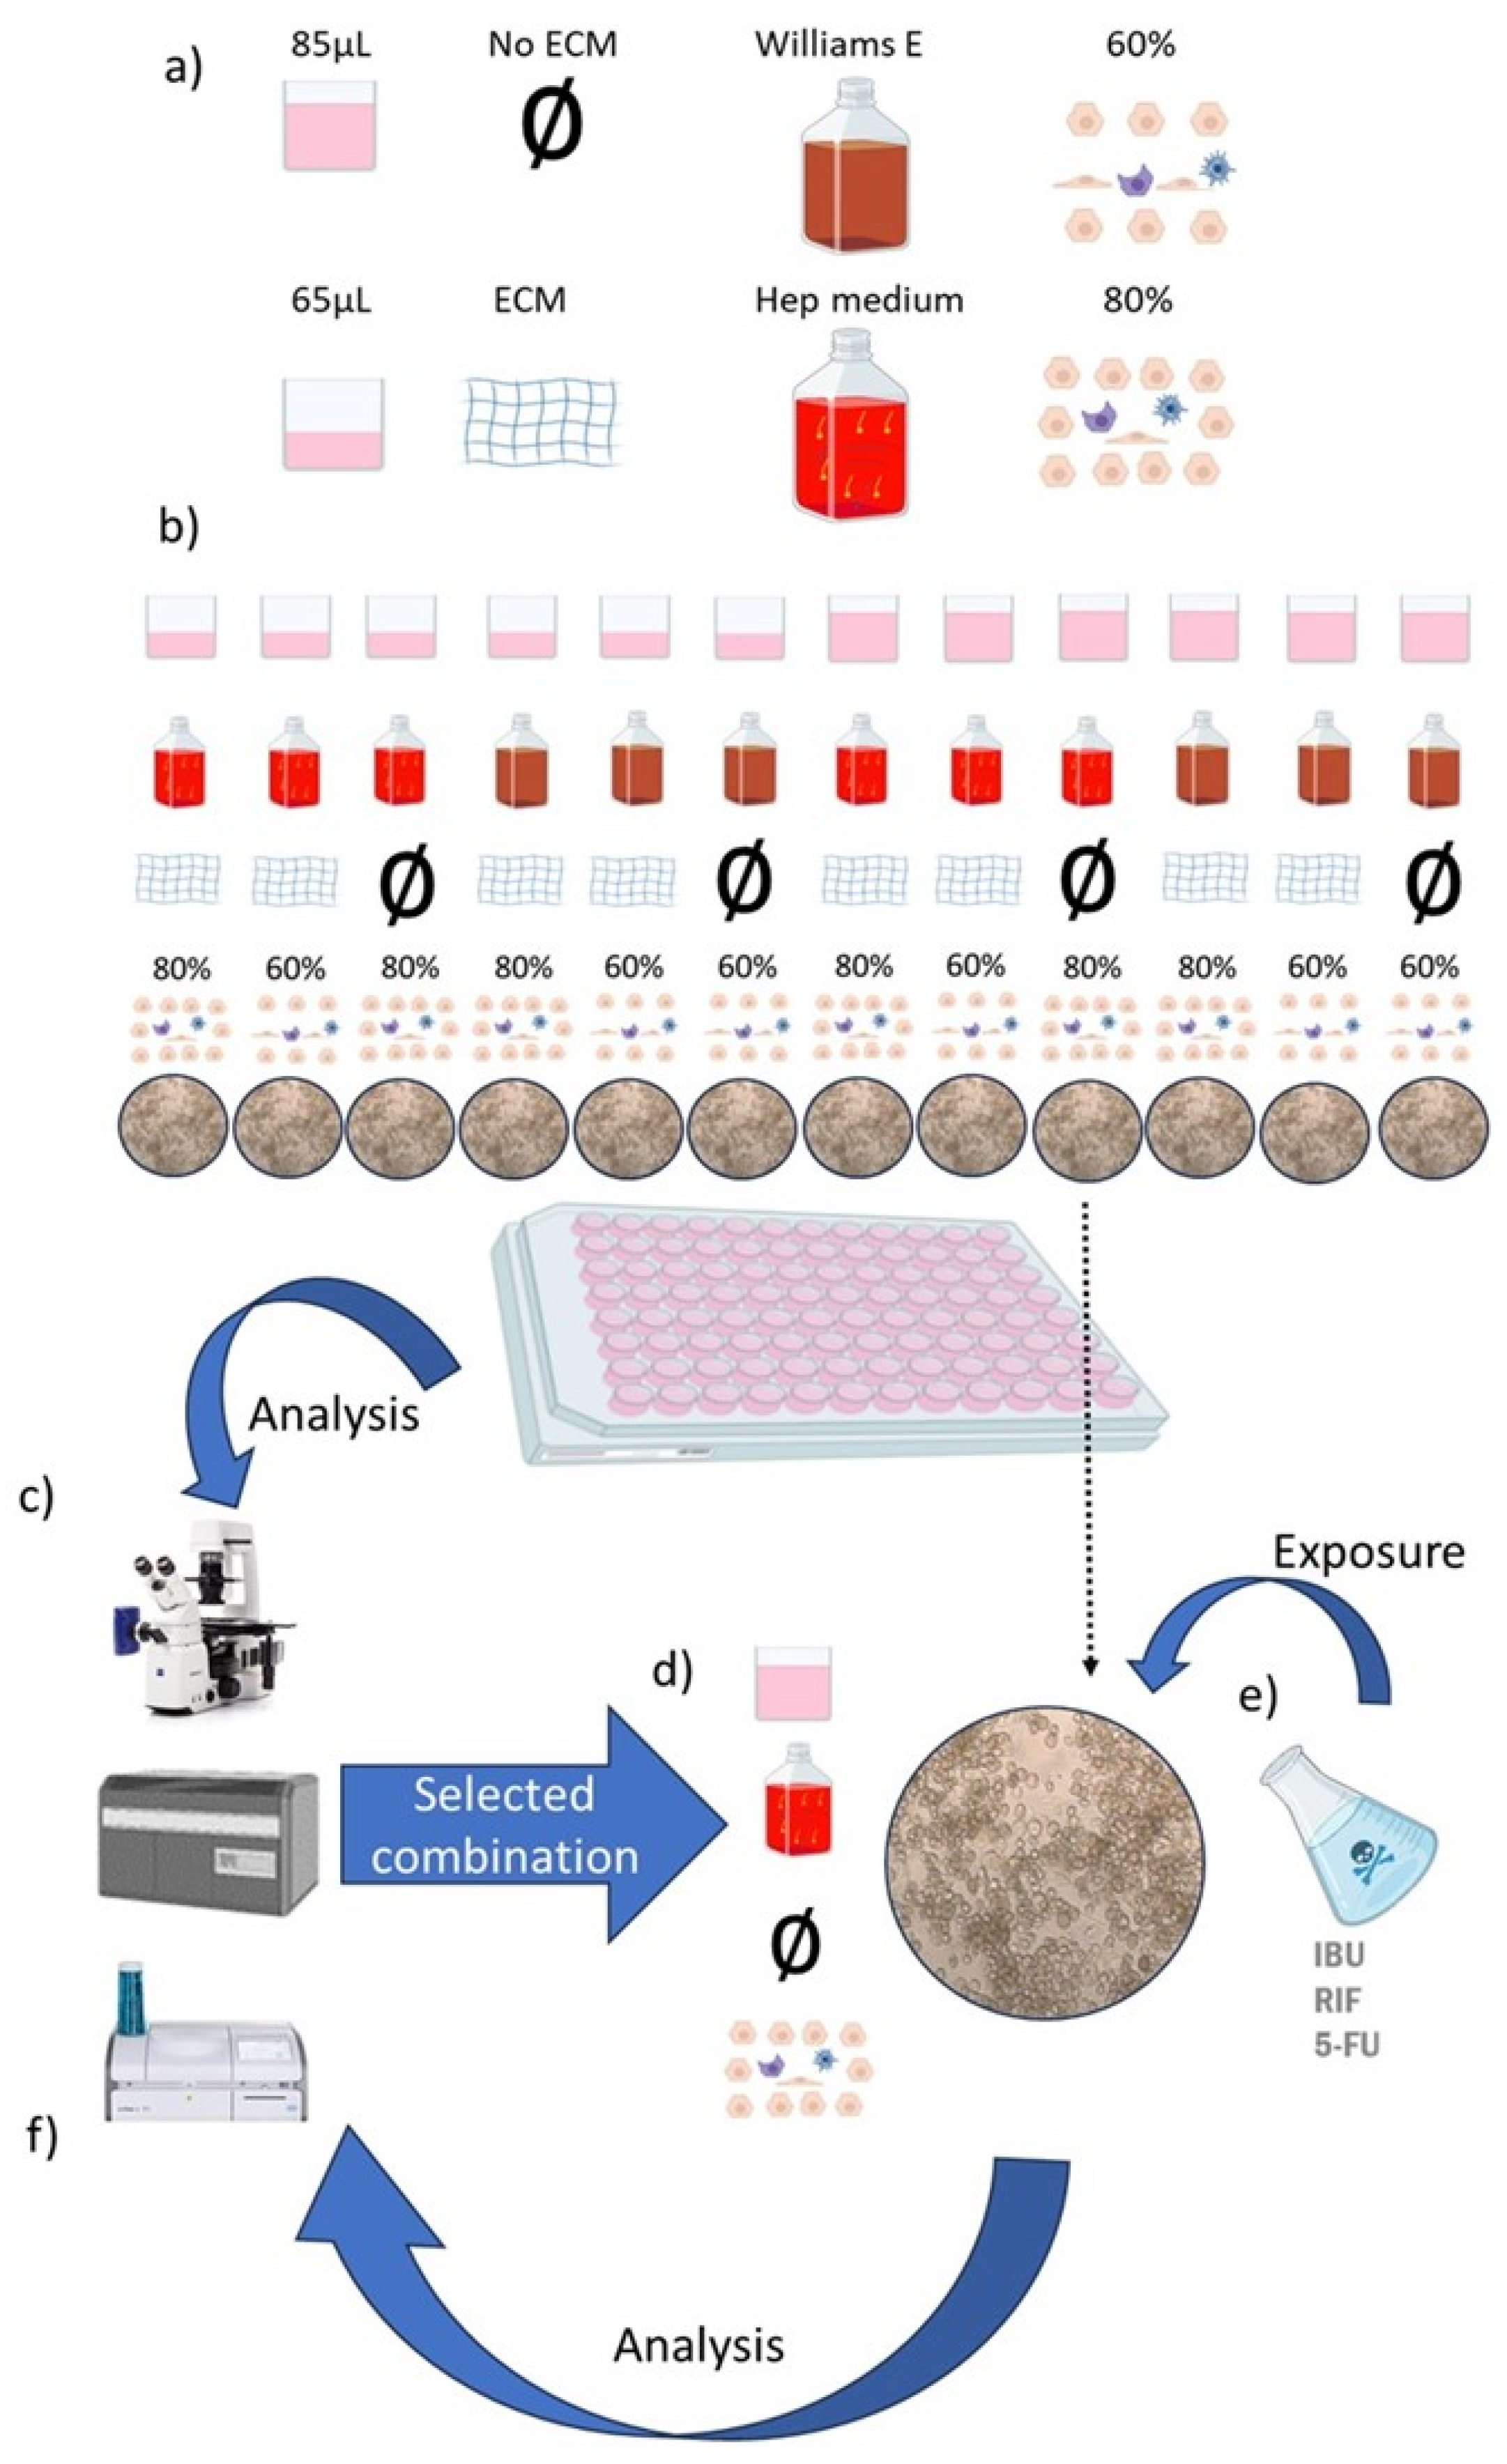
2.1. Cell Culture Medium
- i
- Williams E colorless medium (Thermo Fisher Scientific, USA) containing 10% fetal bovine serum (FBS) (Thermo Fisher Scientific, USA). L-glutamine (2 mM, Sigma), penicillin (100 U mL-1, Sigma), and streptomycin (1 mgmL-1, Fluka, Buchs, Switzerland) were also added for optimal cell growth.
- ii
- A medium based on Williams E’s colorless medium, which we will refer to from now on as Hep medium (Supplement Table S1). This medium was supplemented with additional amino acid, fatty acids, vitamins and insulin. We use Maxgel, a commercial extra cellular matrix (ECM) (Merck KGaA, Darmstadt, Germany).
2.2. Cells
2.3. Toxic Agents
2.4. Analytical Techniques
2.5. Statistical Analysis
3. Results
3.1. Cell Morphology
3.2. Cell Viability Assessment
3.3. Clinical Biochemistry
3.4. Testing the Selected Model with RIF, IBU, 5-FU
3.4.1. Morphology Assessment
3.4.2. Viability Assessment
3.4.3. Clinical Biochemistry
4. Discussion
4.1. Limitations of the Model
4.2. Highlights
- Our in vitro liver model had similar biomarker levels to those observed in vivo, confirming the representativeness of the model.
- The biological effects elicited by the selected drugs had similar trends to those observed in clinical studies.
- This new approach facilitates the translation between basic and clinical research.
- LSEC and Kupffer had a more pronounced biological effect (viability) than the other cell types when exposed to hepatotoxic drugs.
5. Conclusions
Supplementary Materials
Author Contributions
Funding
Data Availability Statement
Conflicts of Interest
References
- Dominguez, D.C.; Lopes, R.; Torres, M.L. Proteomics: clinical applications. Clinical laboratory science : journal of the American Society for Medical Technology 2007, 20, 245–8. [Google Scholar]
- Schwenk, J.M.; Omenn, G.S.; Sun, Z.; Campbell, D.S.; Baker, M.S.; Overall, C.M.; Aebersold, R.; Moritz, R.L.; Deutsch, E.W. The Human Plasma Proteome Draft of 2017: Building on the Human Plasma PeptideAtlas from Mass Spectrometry and Complementary Assays. J Proteome Res 2017, 16, 4299–4310. [Google Scholar] [CrossRef]
- Edge, R.; Ford, C. CADTH Rapid Response Reports. In Clinical Decision Support Systems for Appropriate Medical Imaging: Clinical Evidence and Cost-Effectiveness, Canadian Agency for Drugs and Technologies in Health Copyright © 2019 Canadian Agency for Drugs and Technologies in Health.: Ottawa (ON), 2019.
- Oltvai, Z.N.; Barabási, A.-L.; Jeong, H.; Tombor, B.; Albert, R. The large-scale organization of metabolic networks. Nature 2000, 407, 651–654. [Google Scholar]
- Maresova, P.; Klimova, B.; Kuca, K. ; Legislation, regulation and policies issues of orphan drugs in developed countries from 2010 to 2016. Journal of Applied Biomedicine 2018. [Google Scholar] [CrossRef]
- Lauschke, V.M.; Shafagh, R.Z.; Hendriks, D.F.G.; Ingelman-Sundberg, M. 3D Primary Hepatocyte Culture Systems for Analyses of Liver Diseases, Drug Metabolism, and Toxicity: Emerging Culture Paradigms and Applications. Biotechnol J 2019, 14, e1800347. [Google Scholar] [CrossRef]
- Ouedraogo, M.; Nguyen, A.T.; Duez, P. Methods Applied to the In Vitro Primary Toxicology Testing of Natural Products: State of the Art, Strengths, and Limits. 2014.
- Kharasch, E.D.; Whittington, D.; Hoffer, C.; Krudys, K.; Craig, K.; Vicini, P.; Sheffels, P.; Lalovic, B. Paradoxical role of cytochrome P450 3A in the bioactivation and clinical effects of levo-alpha-acetylmethadol: importance of clinical investigations to validate in vitro drug metabolism studies. Clinical pharmacokinetics 2005, 44, 731–51. [Google Scholar] [CrossRef] [PubMed]
- Wiederhold, N.P. Paradoxical echinocandin activity: a limited in vitro phenomenon? Medical mycology 2009, 47 Suppl 1, S369–75. [Google Scholar] [CrossRef]
- Yang, P.; Zhao, Y.; Zhao, L.; Yuan, J.; Chen, Y.; Varghese, Z. Paradoxical effect of rapamycin on inflammatory stress-induced insulin resistance in vitro and in vivo. Nature Publishing Group 2015, 1–13. [Google Scholar] [CrossRef]
- Lee, M.; Nam, K.T.; Kim, J.; Lim, S.E.; Yeon, S.H.; Lee, B.; Lee, J.Y.; Lim, K.M. Evaluation of ocular irritancy of coal-tar dyes used in cosmetics employing reconstructed human cornea-like epithelium and short time exposure tests. Food Chem Toxicol 2017, 108, 236–243. [Google Scholar] [CrossRef]
- OECD, Test No. 492B: Reconstructed Human Cornea-like Epithelium (RHCE) Test Method for Eye Hazard Identification. 2022.
- Polidoro, M.A.; Ferrari, E.; Marzorati, S.; Lleo, A.; Rasponi, M. Experimental liver models: From cell culture techniques to microfluidic organs-on-chip. Liver Int 2021, 41, 1744–1761. [Google Scholar] [CrossRef]
- Brooks, A.; Liang, X.; Zhang, Y.; Zhao, C.X.; Roberts, M.S.; Wang, H.; Zhang, L.; Crawford, D.H.G. Liver organoid as a 3D in vitro model for drug validation and toxicity assessment. Pharmacol Res 2021, 169, 105608. [Google Scholar] [CrossRef]
- Messelmani, T.; Morisseau, L.; Sakai, Y.; Legallais, C.; Le Goff, A.; Leclerc, E.; Jellali, R. Liver organ-on-chip models for toxicity studies and risk assessment. Lab Chip 2022, 22, 2423–2450. [Google Scholar] [CrossRef]
- Madorran, E.; Stozer, A.; Bevc, S.; Maver, U. In vitro toxicity model: Upgrades to bridge the gap between preclinical and clinical research. Bosn J Basic Med Sci 2019. [Google Scholar] [CrossRef]
- Bowling, J.L.; Katayev, A. An Evaluation of the Roche Cobas c 111. Laboratory Medicine 2010, 41, 398–402. [Google Scholar] [CrossRef]
- Yuan, H.X.; Xiong, Y.; Guan, K.L. Nutrient sensing, metabolism, and cell growth control. Mol Cell 2013, 49, 379–87. [Google Scholar] [CrossRef]
- DeBerardinis, R.J.; Lum, J.J.; Hatzivassiliou, G.; Thompson, C.B. The Biology of Cancer: Metabolic Reprogramming Fuels Cell Growth and Proliferation. Cell Metabolism 2008, 7, 11–20. [Google Scholar] [CrossRef]
- Boron, W.F.; Boulpaep, E.L. Medical Physiology. Proceedings of the Royal Society of Medicine 2012, 68, 3487. [Google Scholar]
- Boron, W.F.; Boulpaep, E.L. Medical physiology: a cellular and molecular approach; Saunders Elsevier: Philadelphia, PA, 2012. [Google Scholar]
- Mescher, A.L. Junqueira’s Basic Histology: Text and Atlas. 16th Edition ed.; McGraw Hill: New York, 2021. [Google Scholar]
- Alves-Bezerra, M.; Cohen, D.E. Triglyceride Metabolism in the Liver. Compr Physiol 2017, 8, 1–8. [Google Scholar]
- Levitt, D.G.; Levitt, M.D. Human serum albumin homeostasis: a new look at the roles of synthesis, catabolism, renal and gastrointestinal excretion, and the clinical value of serum albumin measurements. Int J Gen Med 2016, 9, 229–255. [Google Scholar] [CrossRef]
- Chinnici, C.M.; Miceli, V.; Pampalone, M.; Lo Nigro, A.; Amico, G.; Conaldi, P.G. In vitro evidences of epithelial to mesenchymal transition in low cell-density cultured human fetal hepatocytes. Biochem Biophys Res Commun 2017, 490, 472–479. [Google Scholar] [CrossRef]
- Carotti, S.; Morini, S.; Carpino, G.; Gaudio, E. Liver Histology. In Liver Diseases: A Multidisciplinary Textbook, Radu-Ionita, F.; Pyrsopoulos, N.T., Jinga, M., Tintoiu, I.C., Sun, Z., Bontas, E., Eds.; Eds. Springer International Publishing: Cham, 2020; pp. 17–28. [Google Scholar]
- Saxena, R.; Theise, N.D.; Crawford, J.M. Microanatomy of the human liver-exploring the hidden interfaces. Hepatology 1999, 30, 1339–46. [Google Scholar] [CrossRef]
- Trepat, X.; Chen, Z.; Jacobson, K. Cell migration. Compr Physiol 2012, 2, 2369–92. [Google Scholar]
- SenGupta, S.; Parent, C.A.; Bear, J.E. The principles of directed cell migration. Nature Reviews Molecular Cell Biology 2021, 22, 529–547. [Google Scholar] [CrossRef]
- Wang, Y.; Kim, M.H.; Shirahama, H.; Lee, J.H.; Ng, S.S.; Glenn, J.S.; Cho, N.J. ECM proteins in a microporous scaffold influence hepatocyte morphology, function, and gene expression. Sci Rep 2016, 6, 37427. [Google Scholar] [CrossRef]
- Tsuchida, T.; Friedman, S.L. Mechanisms of hepatic stellate cell activation. Nat Rev Gastroenterol Hepatol 2017, 14, 397–411. [Google Scholar] [CrossRef]
- Moman, R.N.; Gupta, N.; Varacallo, M. Physiology, Albumin. In StatPearls, StatPearls Publishing Copyright © 2020; StatPearls Publishing LLC.: Treasure Island (FL), 2020. [Google Scholar]
- Akrami, H.; Moradi, B.; Borzabadi Farahani, D.; Mehdizadeh, K. Ibuprofen reduces cell proliferation through inhibiting Wnt/β catenin signaling pathway in gastric cancer stem cells. Cell Biol Int 2018, 42, 949–958. [Google Scholar] [CrossRef]
- Sommer, J.; Mahli, A.; Freese, K.; Schiergens, T.S.; Kuecuekoktay, F.S.; Teufel, A.; Thasler, W.E.; Müller, M.; Bosserhoff, A.K.; Hellerbrand, C. Analysis of molecular mechanisms of 5-fluorouracil-induced steatosis and inflammation in vitro and in mice. Oncotarget 2017, 8, 13059–13072. [Google Scholar] [CrossRef]
- Gerets, H.H.J.; Tilmant, K.; Gerin, B.; Chanteux, H.; Depelchin, B.O.; Dhalluin, S.; Atienzar, F.A. Characterization of primary human hepatocytes, HepG2 cells, and HepaRG cells at the mRNA level and CYP activity in response to inducers and their predictivity for the detection of human hepatotoxins. Cell Biology and Toxicology 2012, 28, 69–87. [Google Scholar] [CrossRef]
- Diseases, B.M.N.I. o. D. a. D. a. K.; LiverTox: Clinical and Research Information on Drug-Induced Liver Injury [Internet]-fluorouracil. In livertox.nih.gov: 2018.
- Alessandrino, F.; Qin, L.; Cruz, G.; Sahu, S.; Rosenthal, M.H.; Meyerhardt, J.A.; Shinagare, A.B. 5-Fluorouracil induced liver toxicity in patients with colorectal cancer: role of computed tomography texture analysis as a potential biomarker. Abdominal Radiology 2019, 44, 3099–3106. [Google Scholar] [CrossRef]
- da Silva, M.C.; Fabiano, L.C.; da Costa Salomão, K.C.; de Freitas, P.L.Z.; Neves, C.Q.; Borges, S.C.; de Souza Carvalho, M. d. G.; Breithaupt-Faloppa, A.C.; de Thomaz, A.A.; dos Santos, A.M.; Buttow, N.C. A Rodent Model of Human-Dose-Equivalent 5-Fluorouracil: Toxicity in the Liver, Kidneys, and Lungs. Antioxidants 2023, 12, 1005. [Google Scholar] [CrossRef]
- Eggert, T.; Greten, T.F. Tumor regulation of the tissue environment in the liver. Pharmacol Ther 2017, 173, 47–57. [Google Scholar] [CrossRef]
- LiverTox: Clinical and Research Information on Drug-Induced Liver Injury; National Institute of Diabetes and Digestive and Kidney Diseases: Bethesda (MD), 2012.
- Merlot, A.M.; Kalinowski, D.S.; Richardson, D.R. Unraveling the mysteries of serum albumin-more than just a serum protein. Frontiers in physiology 2014, 5, 299. [Google Scholar] [CrossRef]
- Diseases, B.M.N.I. o. D. a. D. a. K.; LiverTox: Clinical and Research Information on Drug-Induced Liver Injury [Internet]- ibuprofen. In livertox.nih.gov: 2018.
- de Souza, C.O.; Kurauti, M.A.; de Fatima Silva, F.; de Morais, H.; Curi, R.; Hirabara, S.M.; Rosa Neto, J.C.; de Souza, H.M. Celecoxib and Ibuprofen Restore the ATP Content and the Gluconeogenesis Activity in the Liver of Walker-256 Tumor-Bearing Rats. Cellular Physiology and Biochemistry 2015, 36, 1659–1669. [Google Scholar] [CrossRef]
- Hartung, T.; Daston, G. Are In Vitro Tests Suitable for Regulatory Use? 2009, 111, 233–237. [Google Scholar] [CrossRef]
- Ilic, S.; Drmic, D.; Zarkovic, K.; Kolenc, D.; Brcic, L.; Radic, B.; Djuzel, V.; Blagaic, A.B.; Romic, Z.; Dzidic, S.; Kalogjera, L.; Seiwerth, S.; Sikiric, P. Ibuprofen hepatic encephalopathy, hepatomegaly, gastric lesion and gastric pentadecapeptide BPC 157 in rats. European Journal of Pharmacology 2011, 667, 322–329. [Google Scholar] [CrossRef]
- Bendele, A.M.; Hulman, J.F.; White, S.; Brodhecker, C.; Bendele, R.A. Hepatocellular proliferation in ibuprofen-treated mice. Toxicol Pathol 1993, 21, 15–20. [Google Scholar] [CrossRef]
- Maher, J.J. Cell-specific expression of hepatocyte growth factor in liver. Upregulation in sinusoidal endothelial cells after carbon tetrachloride. J Clin Invest 1993, 91, 2244–52. [Google Scholar] [CrossRef]
- Brass, E.P.; Garrity, M.J. Effect of nonsteroidal anti-inflammatory drugs on glycogenolysis in isolated hepatocytes. Br J Pharmacol 1985, 86, 491–6. [Google Scholar] [CrossRef]
- Klover, P.J.; Mooney, R.A. Hepatocytes: critical for glucose homeostasis. The International Journal of Biochemistry & Cell Biology 2004, 36, 753–758. [Google Scholar]
- Diseases, B.M.N.I. o. D. a. D. a. K.; LiverTox: Clinical and Research Information on Drug-Induced Liver Injury [Internet]- rifampicin. In livertox.nih.gov: 2018.
- Zhang, J.; Wei, Y.; Hu, B.; Huang, M.; Xie, W.; Zhai, Y. Activation of human stearoyl-coenzyme A desaturase 1 contributes to the lipogenic effect of PXR in HepG2 cells. PLoS One 2013, 8, e67959. [Google Scholar] [CrossRef]
- Wu, Q.; Liu, J.; Wang, X.; Feng, L.; Wu, J.; Zhu, X.; Wen, W.; Gong, X. Organ-on-a-chip: recent breakthroughs and future prospects. BioMedical Engineering OnLine 2020, 19, 9. [Google Scholar] [CrossRef] [PubMed]
- Soeters, P.B.; Wolfe, R.R.; Shenkin, A. Hypoalbuminemia: Pathogenesis and Clinical Significance. JPEN J Parenter Enteral Nutr 2019, 43, 181–193. [Google Scholar] [CrossRef] [PubMed]
- Siu, J.; McCall, J.; Connor, S. Systematic review of pathophysiological changes following hepatic resection. HPB (Oxford) 2014, 16, 407–21. [Google Scholar] [CrossRef] [PubMed]
- Moriles, K.E.; Azer, S.A. Alanine Amino Transferase. In StatPearls, StatPearls Publishing Copyright © 2020; StatPearls Publishing LLC.: Treasure Island (FL), 2020. [Google Scholar]
- Aulbach, A.D.; Amuzie, C.J. Chapter 17 - Biomarkers in Nonclinical Drug Development. In A Comprehensive Guide to Toxicology in Nonclinical Drug Development (Second Edition), Faqi, A.S.; Ed. Academic Press: Boston, 2017; pp. 447–471. [Google Scholar]
- Bachhawat, A.K.; Yadav, S. The glutathione cycle: Glutathione metabolism beyond the γ-glutamyl cycle. IUBMB Life 2018, 70, 585–592. [Google Scholar] [CrossRef] [PubMed]
- Lilford, R.J.; Bentham, L.; Girling, A.; Litchfield, I.; Lancashire, R.; Armstrong, D.; Jones, R.; Marteau, T.; Neuberger, J.; Gill, P.; Cramb, R.; Olliff, S.; Arnold, D.; Khan, K.; Armstrong, M.J.; Houlihan, D.D.; Newsome, P.N.; Chilton, P.J.; Moons, K.; Altman, D. Birmingham and Lambeth Liver Evaluation Testing Strategies (BALLETS): a prospective cohort study. Health Technol Assess 2013, 17, 1–307. [Google Scholar] [CrossRef] [PubMed]
- Lala, V.; Goyal, A.; Bansal, P.; Minter, D.A. Liver Function Tests. In StatPearls, StatPearls Publishing Copyright © 2020; StatPearls Publishing LLC.: Treasure Island (FL), 2020. [Google Scholar]
- Lehmann-Werman, R.; Magenheim, J.; Moss, J.; Neiman, D.; Abraham, O.; Piyanzin, S.; Zemmour, H.; Fox, I.; Dor, T.; Grompe, M.; Landesberg, G.; Loza, B.L.; Shaked, A.; Olthoff, K.; Glaser, B.; Shemer, R.; Dor, Y. Monitoring liver damage using hepatocyte-specific methylation markers in cell-free circulating DNA. JCI Insight 2018, 3. [Google Scholar] [CrossRef] [PubMed]
- Berasain, C.; Arechederra, M.; Argemí, J.; Fernández-Barrena, M.G.; Avila, M.A. Loss of liver function in chronic liver disease: An identity crisis. J Hepatol 2023, 78, 401–414. [Google Scholar] [CrossRef]
- Lurie, Y.; Webb, M.; Cytter-Kuint, R.; Shteingart, S.; Lederkremer, G.Z. Non-invasive diagnosis of liver fibrosis and cirrhosis. World J Gastroenterol 2015, 21, 11567–83. [Google Scholar] [CrossRef]
- Arechederra, M.; Recalde, M.; Gárate-Rascón, M.; Fernández-Barrena, M.G.; Ávila, M.A.; Berasain, C. Epigenetic Biomarkers for the Diagnosis and Treatment of Liver Disease. Cancers 2021, 13, 1265. [Google Scholar] [CrossRef]
- Holland, C.H.; Ramirez Flores, R.O.; Myllys, M.; Hassan, R.; Edlund, K.; Hofmann, U.; Marchan, R.; Cadenas, C.; Reinders, J.; Hoehme, S.; Seddek, A.L.; Dooley, S.; Keitel, V.; Godoy, P.; Begher-Tibbe, B.; Trautwein, C.; Rupp, C.; Mueller, S.; Longerich, T.; Hengstler, J.G.; Saez-Rodriguez, J.; Ghallab, A. Transcriptomic Cross-Species Analysis of Chronic Liver Disease Reveals Consistent Regulation Between Humans and Mice. Hepatol Commun 2022, 6, 161–177. [Google Scholar] [CrossRef]
- Gallon, J.; Coto-Llerena, M.; Ercan, C.; Bianco, G.; Paradiso, V.; Nuciforo, S.; Taha-Melitz, S.; Meier, M.A.; Boldanova, T.; Pérez-Del-Pulgar, S.; Rodríguez-Tajes, S.; von Flüe, M.; Soysal, S.D.; Kollmar, O.; Llovet, J.M.; Villanueva, A.; Terracciano, L.M.; Heim, M.H.; Ng, C.K.Y.; Piscuoglio, S. Epigenetic priming in chronic liver disease impacts the transcriptional and genetic landscapes of hepatocellular carcinoma. Mol Oncol 2022, 16, 665–682. [Google Scholar] [CrossRef] [PubMed]
- Bhandari, S.; Larsen, A.K.; McCourt, P.; Smedsrød, B.; Sørensen, K.K. The Scavenger Function of Liver Sinusoidal Endothelial Cells in Health and Disease. Frontiers in physiology 2021, 12, 757469. [Google Scholar] [CrossRef] [PubMed]
| Group | Share of the population (%) | Cell death ratio (%) | Share of the population (%) | Cell death ratio (%) |
|---|---|---|---|---|
| LSEC | HSC | |||
| Control | 4%±1 | 2%±0 | 5%±1 | 2%±1 |
| 5-FU | 6%±0 | 3%±0 | 5%±1 | 5%±1 |
| IBU | 8%±1 | 2%±1 | 3%±1 | 5%±1 |
| RIF | 5%±1 | 3%±1 | 5%±0 | 3%±0 |
| Kupffer | Hepatocytes | |||
| Control | 4%±0 | 3%±1 | 88%±1 | 3%±1 |
| 5-FU | 2%±0 | 12%±0 | 87%±1 | 4%±0 |
| IBU | 2%±0 | 12%±2 | 88%±1 | 2%±1 |
| RIF | 3%±0 | 8%±0 | 88%±0 | 2%±0 |
Disclaimer/Publisher’s Note: The statements, opinions and data contained in all publications are solely those of the individual author(s) and contributor(s) and not of MDPI and/or the editor(s). MDPI and/or the editor(s) disclaim responsibility for any injury to people or property resulting from any ideas, methods, instructions or products referred to in the content. |
© 2024 by the authors. Licensee MDPI, Basel, Switzerland. This article is an open access article distributed under the terms and conditions of the Creative Commons Attribution (CC BY) license (http://creativecommons.org/licenses/by/4.0/).


