Preprint
Article

Evaluation of the Potential of Urinary Volatilomic Patterns of COVID-19 Patients Infected With SARS-CoV-2 for Disease Diagnosis. An Exploratory Study

Altmetrics

Downloads

162

Views

71

Comments

0

Submitted:

03 April 2024

Posted:

04 April 2024

You are already at the latest version

Alerts
Abstract
To assess if SARS-CoV-2 infection induces changes in the urinary volatilomic fingerprint able to be used in the non-invasive COVID-19 diagnosis and management, urine samples of SARS-CoV-2 infected patients (62), recovered COVID-19 patients (30), and non-infected individuals (41) were analysed using solid-phase microextraction technique in headspace mode, combined with gas chromatography hyphenated with mass spectrometry (HS-SPME/GC-MS). In total, 101 volatile organic metabolites (VOMs) from 13 chemical families were identified, being terpenes, phenolic compounds, norisoprenoids, and ketones the most represented groups. Overall, a decrease in the levels of terpenes and phenolic compounds was observed in the control group, whereas norisoprenoids and ketones showed a significant increase. In turn, a remarkable increase was noticed in norisoprenoids and ketones and a milder increase in alcohols, furanic, and sulfur compounds in the recovery group than in the COVID-19 group. Multivariate statistical analysis identified sets of VOMs with the potential to constitute volatile signatures for COVID-19 development and progression. These signatures are composed of D-carvone, 3-methoxy-5-(trifluoromethyl)aniline (MTA), 1,1,6-trimethyl-dihydronaphthalene (TDN), 2-heptanone, and 2,5,5,8a-tetramethyl-1,2,3,5,6,7,8,8-octahydro-1-naphthalenyl ester acetate (TONEA) for COVID-19 infection and nonanoic acid, α-terpinene, β-damascenone, α-isophorone, and trans-furan linalool for patients recovering from the disease. This study provides evidence that changes in the urinary volatilomic profile triggered by SARS-CoV-2 infection constitute a promising and valuable screening and/or diagnostic and management tool for COVID-19 in clinical environment.
Keywords: 
Subject: Chemistry and Materials Science  -   Medicinal Chemistry

1. Introduction

In late 2019, COVID-19, a highly infectious disease caused by the severe acute respiratory syndrome coronavirus 2 (SARS-CoV-2), triggered a tremendous and severe pandemic outbreak. COVID-19 has been identified as a hyperinflammatory syndrome characterised by aberrant immune activation and excessive cytokine release (cytokine storm), ultimately leading to failure in multiple organs [1,2]. As the respiratory virus spread to all countries and/or regions in the world, intermittent lockdowns were imposed as a desperate and unprecedented measure to contain the propagation of the disease [3,4]. The effectiveness of this procedure is still an open debate, although it is widely acknowledged that the delay of virus propagation gave time to healthcare systems to adapt and mitigate the mortality caused by COVID-19 [4,5]. According to the World Health Organization (WHO), 768 million people were infected and over 6.94 million deaths have been estimated (Figure 1) [6]. This has caused a strong impact on society at economic, political, social, educational, environmental, and cultural levels that will last for decades [7,8,9,10].
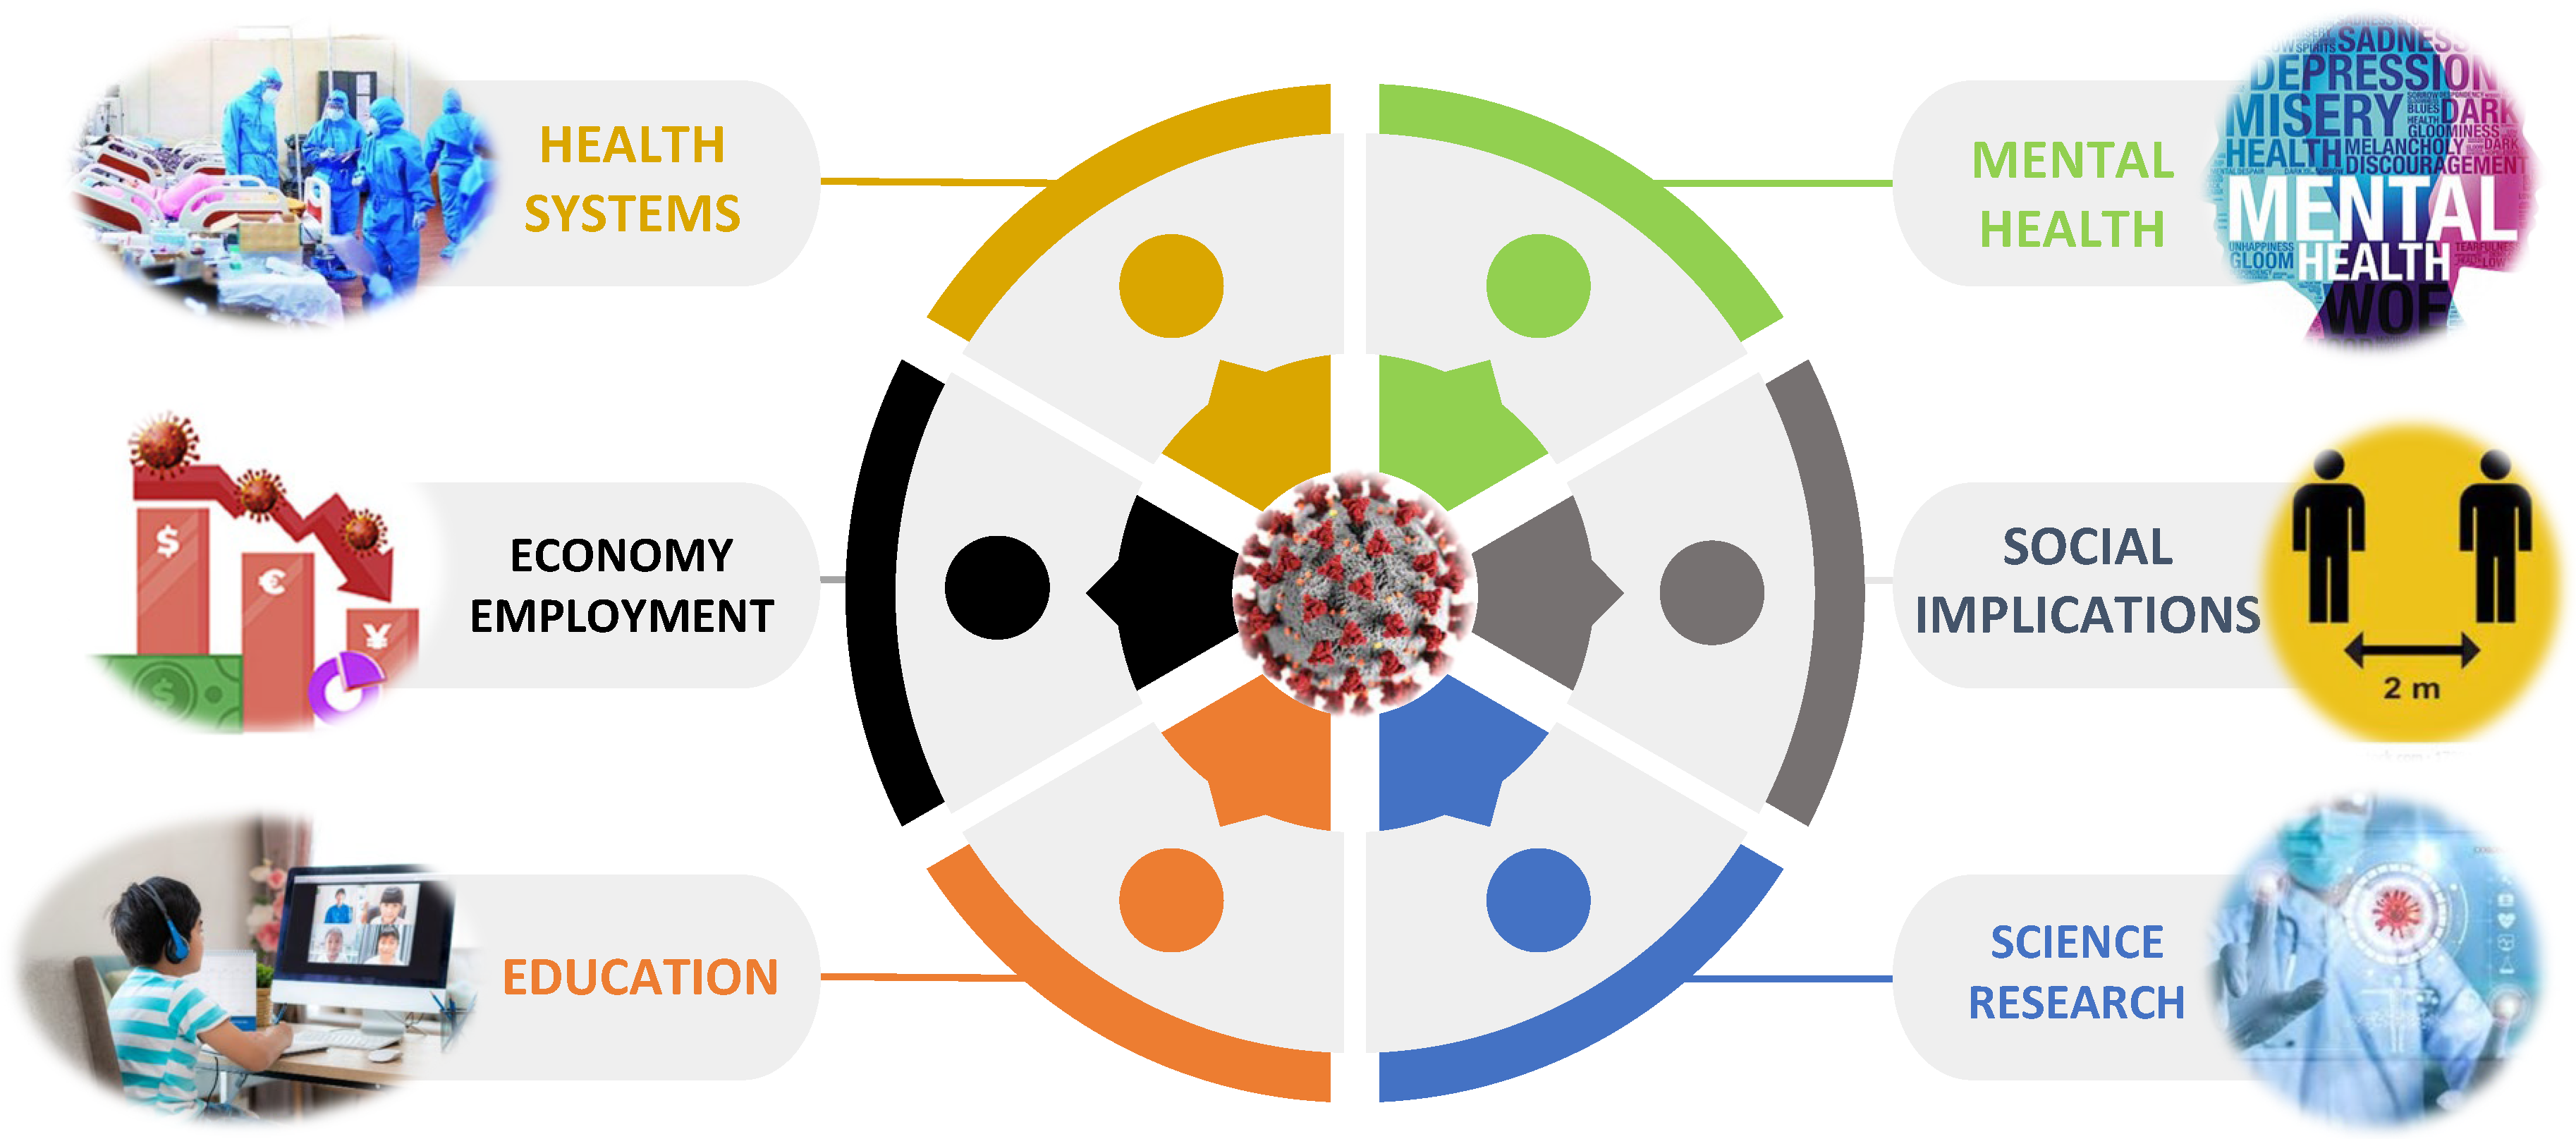
COVID-19 had a huge impact on healthcare systems leading to an immense pressure on healthcare systems, expressed into shortages of beds, medical supplies, and healthcare workers. The businesses closing and layoffs led to millions of job losses, and the adoption remote work policies. On the education system the schools were closed, being the promotion of the online learning the found solution to overcome this. The inequalities in access to technology, and internet connectivity worsened the social differences and put huge challenges for teachers, students, and parents. The social isolation, the fear of infection, and the financial stress contributed to an increased anxiety, depression, and emotional stress, increasing the problems related to mental health, among others [4,5].
However, on the other hand, the tireless search for fast and efficient means of diagnosis and effective therapies, has boosted several areas of science and research. The importance of science in the context of COVID-19 was immense, playing a crucial role in various aspects of understanding, managing, and fighting the pandemic. In understanding the virus, in the vaccine development, in the implementation of public health measures, in epidemiological modelling and in the monitoring the emergence of new variants (Figure 2).
Different kind of tests of COVID-19, namely molecular, antigen and serological, have been a key factor for diagnosis and for managing the pandemic. Real-time reverse transcription-polymerase chain reaction (RT-PCR) and rapid antigen detection tests are the most effective and fast strategies developed to diagnose patients with COVID-19 and control infections in hospitals and communities [11,12]. However, the collection of nasopharyngeal exudates is an invasive procedure that puts healthcare workers at risk of disease transmission due to patients’ sneezing, coughing, or gag reflex [13]. Other limitations of the RT-PCR test are related to the long turnaround time and the requirement for expensive laboratory equipment and highly trained laboratory staff [12,14]. In turn, the results obtained by the antigen detection test may be unreliable because there is no RNA amplification, and in the case of low viral loads, the virus may not be detected, leading to false-negative results [15].
Additionally, the associated costs are relatively high. Besides the enormous capabilities of RT-PCR and other diagnosis platforms, more sensitive and accurate detection assays of SARS-CoV-2 are needed for an early diagnosis. In this context the development of improved analytical tests, simultaneously highly accurate, sensitive, and ultrafast, are extremely important, to diagnose early-stage and even asymptomatic individuals and, therefore, increase and improve the prevention and treatment efficiency.
Studies of secondary volatile organic metabolites (VOMs) have shown promising results in the identification of potential biomarkers for oncological, inflammatory, and respiratory infectious diseases [16,17,18,19,20,21]. VOMs are a rich source of information regarding the health status of an individual, as changes in the levels of these metabolites may be characteristic of specific disease processes [16,22]. VOMs can be found in various biological matrices such as blood, urine, saliva, exhaled air, faeces, and skin exudates [18,20,23,24,25,26,27]. Urinary VOMs are considered intermediate or final products of metabolic pathways [16,28]. Additionally, urine sampling is non-invasive and causes no discomfort to the patients. VOMs analyses require sensitive procedures to avoid contamination and sample loss. Solid-phase microextraction (SPME) is a simple, highly efficient, and easy-to-perform extraction technique that does not require a pre-concentration step prior to analysis [29,30]. The combination of SPME in headspace mode (HS) with gas chromatography coupled with mass spectrometry (GC-MS) analysis allows reliable and reproducible results and has been widely used for the analysis of urinary VOMs [16,17,20,27].
This study aimed to establish the urinary volatilomic profile of COVID-19 patients using HS-SPME/GC-MS as a strategy to identify potential biomarkers for the detection of this infection. The chromatographic data obtained were subjected to multivariable statistical analysis to identify volatile signatures that could discriminate between the presence of COVID-19 and its progression.

2. Materials and Methods

2.1. Chemicals and Reagents

Sodium chloride (NaCl, 99.5%) was obtained from Panreac AppliChem ITW Reagents (Barcelona, Spain). Ultrapure water, produced by a Milli-Q water purification system (Millipore, Bedford, PA, USA), was used to prepare the solutions of hydrochloric acid (HCl, 37%) 5 M and 3-octanol (internal standard, 99%) 2.5 ppm, both acquired to Sigma-Aldrich (St. Louis, MO, USA). Helium of purity 99.9% (He, N60, Air Liquide, Algés, Portugal) was used as the GC mobile phase. Glass vials, SPME holder, and fused silica fibre coating partially cross-linked with 50/30 µm divinylbenzene/carboxen/polydimethylsiloxane (DVB/CAR/PDMS) were purchased from Supelco (Merck KGaA, Darmstadt, Germany). DVB/CAR/PDMS fibres were conditioned according to the manufacturer’s guidelines. Prior to the first daily analysis, the fibres were conditioned for at least 10 min at the operating temperature of the GC injector port.

2.2. Study Design and Samples

This study included a set of 133 subjects: 42 individuals with no known infection (Control Group, CTRL), 61 individuals infected with SARS-CoV-2 (COVID Group, COVID) admitted to the Dr Nelio Mendonça Hospital between 15 May and 20 June 2020 (59 % male and 41% female, age average=56.8±18.6Y), and 30 recovered COVID-19 patients (Recovered Group, RECOV) (58 % male and 42% female, age average=60.7±16.3Y), with a recovery period of more than 3 months. Urine samples were collected at Dr. Nélio Mendonça Hospital (Funchal, Portugal). Samples from healthy subjects were obtained from blood donors, samples from the COVID-19 group were collected from patients diagnosed with COVID-19, and samples from the RECOV group were obtained from patients in their recovery period one month after COVID-19 infection. Upon collection, the samples were frozen at -20 °C until further analysis. This study was approved by the Ethics Committee of Hospital Dr. Nélio Mendonça. All the work described was carried out in accordance with The Code of Ethics of the World Medical Association (Declaration of Helsinki) for experiments involving humans. Informed consent was obtained from all the subjects recruited for this study, their privacy was strictly preserved, and any data beyond the SARS-CoV-2 infection were included in the study. Therefore, dimensions such as age, diet, previous diseases, sex, and sex, were not considered in this study.

2.3. Urinary Volatilome Analysis and Data Processing

HS-SPME extraction was performed according to previously optimised conditions for urine sampling [9]. Briefly, 4 mL of urine sample, previously adjusted to pH 1–2 with 500 µL of HCl (5 M), 0.8 g NaCl and 5 µL 3-octanol 2.5 ppm were placed in an 8 mL glass vial. The vial was placed in a water bath set at 50.0 ± 0.1 C with stirring at 800 rpm, and the SPME fibre was exposed to the headspace for 60 min. After extraction, the SPME fibre was collected and inserted into the injector port of the GC-MS instrument for 6 min at 250 °C, where the analytes were desorbed and transferred directly to the column. Each sample was analysed in triplicate.
The GC-MS analysis was performed in a gas chromatograph Agilent Technologies 6890N Network GC System (Palo Alto, CA, USA) equipped with a BP-20 fused silica column (30 m × 0·25 mm ID × 0·25 µm (SGE, Dortmund, Germany)), and connected to an Agilent 5975 quadrupole inert mass selective detector. The separation of the VOMs was carried out with a temperature gradient of 35 °C for 2 min, followed by an increase to 220 °C (2.5 °C min-1), remaining at this temperature for 5 min, for a total GC run time of 81 min. The column flow rate was maintained at 1 mL min-1. The injector port was operated in the splitless mode and maintained at 250 °C. For the 5975MS system, the temperatures of the transfer line, quadrupole, and ionisation source were 270 °C, 150 °C, and 230 °C, respectively. Data acquisition was performed in scan mode, 30-300 m/z, and the electron multiplier was set to the auto-tune procedure, with the electron impact mass spectra at 70 eV and the ionisation current at 10 µA. The VOMs were identified by comparing the mass spectra obtained with those available in Agilent MS Chemstation software (Palo Alto, CA, USA), which was equipped with a NIST05 mass spectral library with a similarity threshold of 80%.

2.4. Statistical Analyses

The data analyses were performed using Microsoft 365® and MetaboAnalyst 5.0. The data matrix was normalised using the median, log transformation, and mean centring. The normalised data were processed through univariate analysis, specifically a t-test (p-values < 0·05) to identify statistically significant VOMs. Subsequently, multivariate analysis was performed using partial least squares discriminant analysis (PLS-DA). Important variables of the generated PLS-DA model were identified based on the variable importance in projection (VIP) score. The model was further evaluated using a 10-fold cross-validation (CV) and permutation tests. Finally, potential biomarkers were validated through receiver operating characteristic (ROC) curves created using Monte Carlo CV (MCCV) methodology to evaluate the accuracy and precision of the biomarkers.

3. Results

3.1. Characterization of the Urinary Volatilome

The volatile composition of the 132 urine samples was analysed using HS-SPME/GC-MS. The supplementary Figure S1 shows the typical chromatographic profiles obtained for the control (CTRL), COVID-19 patients (COVID), and recovered subject (RECOV) groups using the HS-SPME/GC-MS methodology. Overall, a larger number of peaks with higher intensities were observed in the chromatographic profile of the COVID group than in the CTRL profile (Figure S1, Supplementary material). Furthermore, the number and intensity of peaks in the RECOV group were intermediate between those in the COVID and CTRL groups.
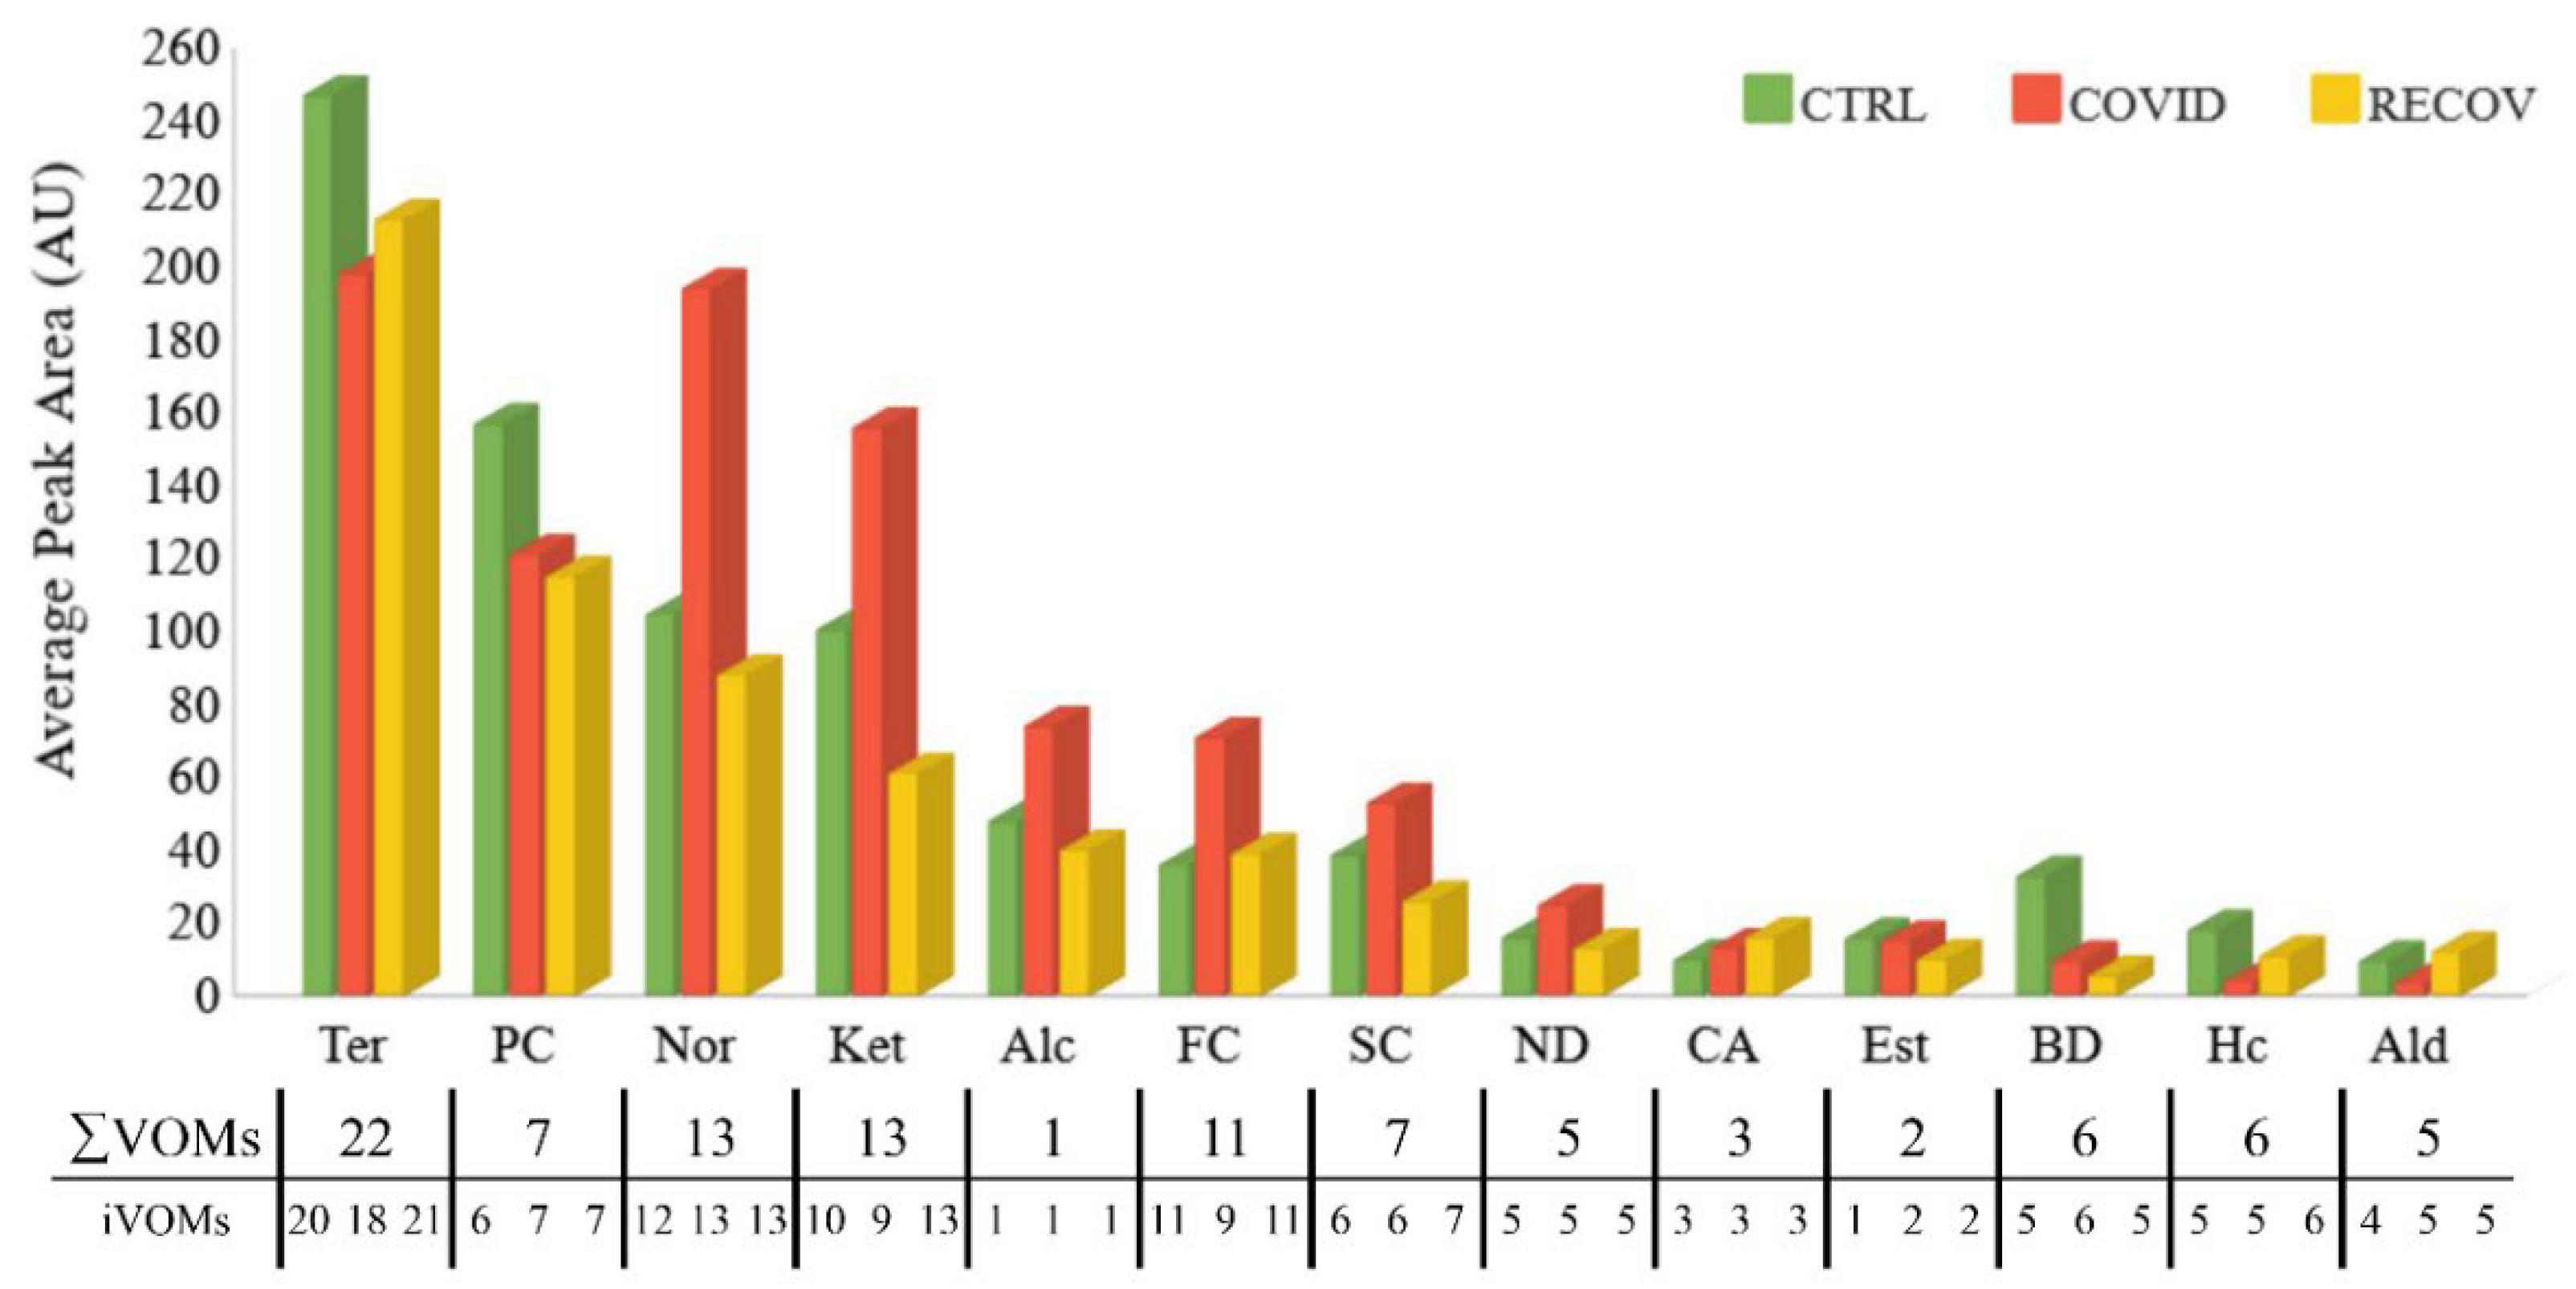
A total of 101 VOMs belonging to 13 chemical families were identified. Data regarding the VOMs detected in the analysed samples, frequency of occurrence, and mean relative peak areas are available in Supplementary Table S1. As shown in Figure 3, terpenes, phenolic compounds, norisoprenoids, and ketones were the main contributors to the urinary volatile profiles of the studied groups. However, there were significant variations in the levels of these and less represented chemical families among the groups studied, with decreased levels of terpenes, phenolic compounds, benzene derivatives, hydrocarbons, and aldehydes in COVID-19 patients compared to the control subjects. In contrast, increased levels of norisoprenoids, ketones, alcohols, furans, sulfur compounds, and naphthalene derivatives were observed. For most chemical families in the RECOV group, the sum of the average peak areas was similar to that of the control group, except for benzene derivatives, terpenes, and phenolic compounds, whose levels were similar to the Covid19 group. It should also be highlighted that the variations in the relative levels of the different chemical families are broadly caused by an increase in the decrease of the same VOMs, as the numbers for each chemical family in each group do not vary significantly. The only exception are ketones, with 10, 9, and 13 ketones identified in CTRL, COVID and RECOV groups, respectively.
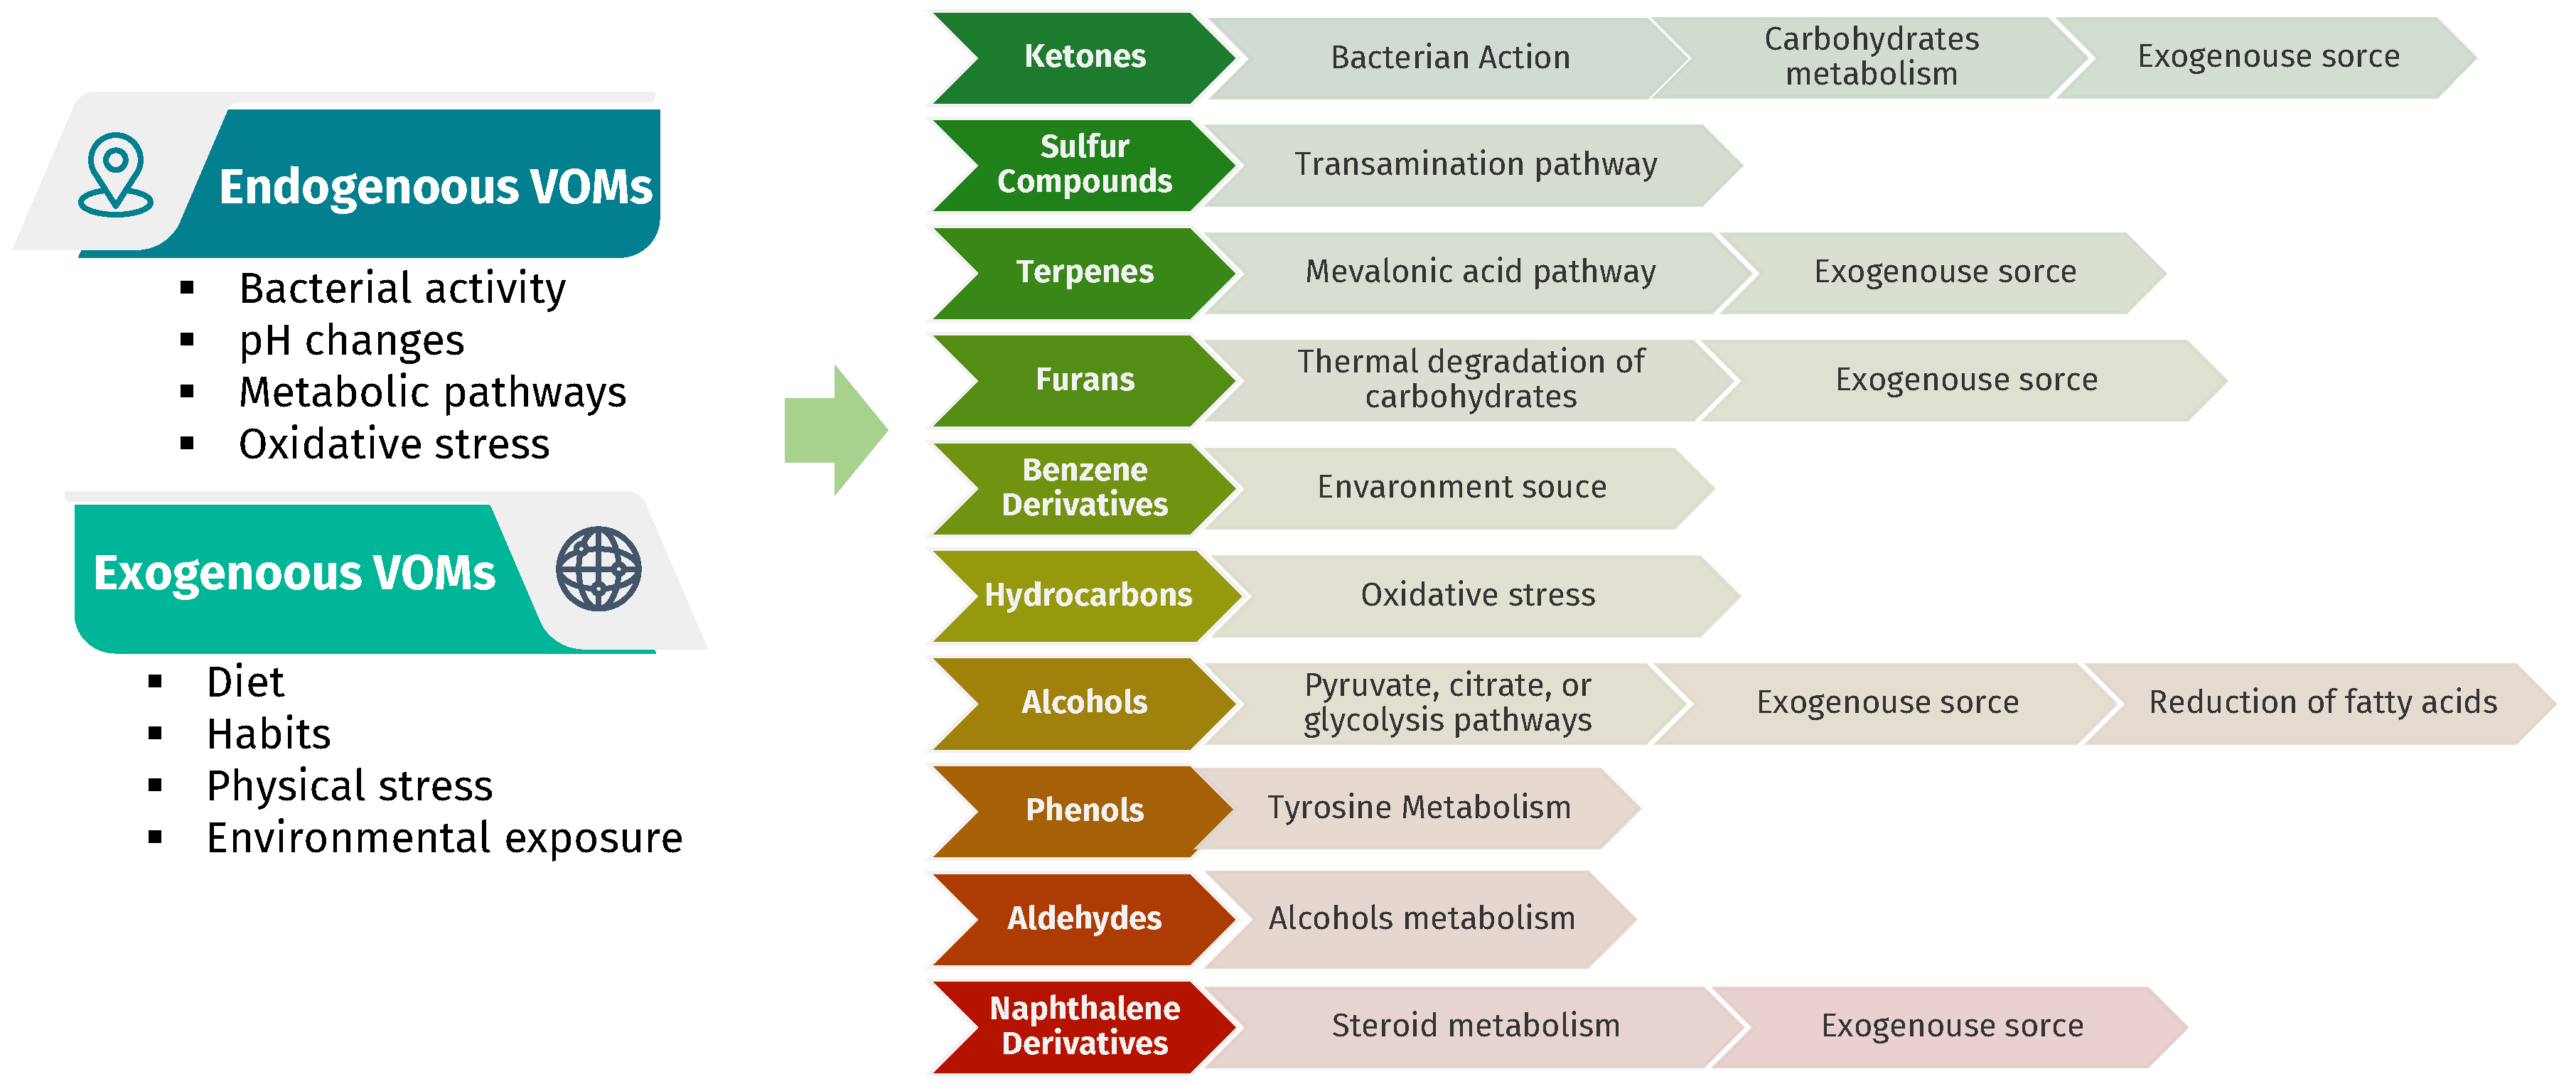
Volatile organic metabolites can have different origins. They can be endogenous as result of bacterial activity or pH changes, can be the product of metabolic pathways or oxidative stress. They can be influenced by external factors, including health status, diet, habits, physical stress, and environmental exposure. So, the human metabolom is highly complex, it’s difficult to understand if an increase or decrease in certain metabolites are related with a specific disease or illness.
This is why it is crucial to establish a relationship between the identified VOMs and their potential endogenous origin; however, the origin of many VOMs have not been clearly defined. Figure 4 shows the metabolomic pathways responsible for the origin of some chemical groups of endogenous VOMs.

3.2. Chemometric Analysis of Urine Samples

A data matrix of the relative peak areas of the 101 VOMs identified in the three groups under study, the COVID, RECOV, and CTRL groups (Supplementary Table S1), was processed using the Metaboanalyst software package [31]. Only VOMs with a frequency of occurrence (FO) higher than 80% in the volatile composition of urine were considered. To obtain a consistent distribution without redundant values, the variables were normalised, and univariate analysis was performed using a t-test (p < 0.05). Consequently, 17 VOMs with insignificant contributions to the statistical analysis were removed from the data matrix.
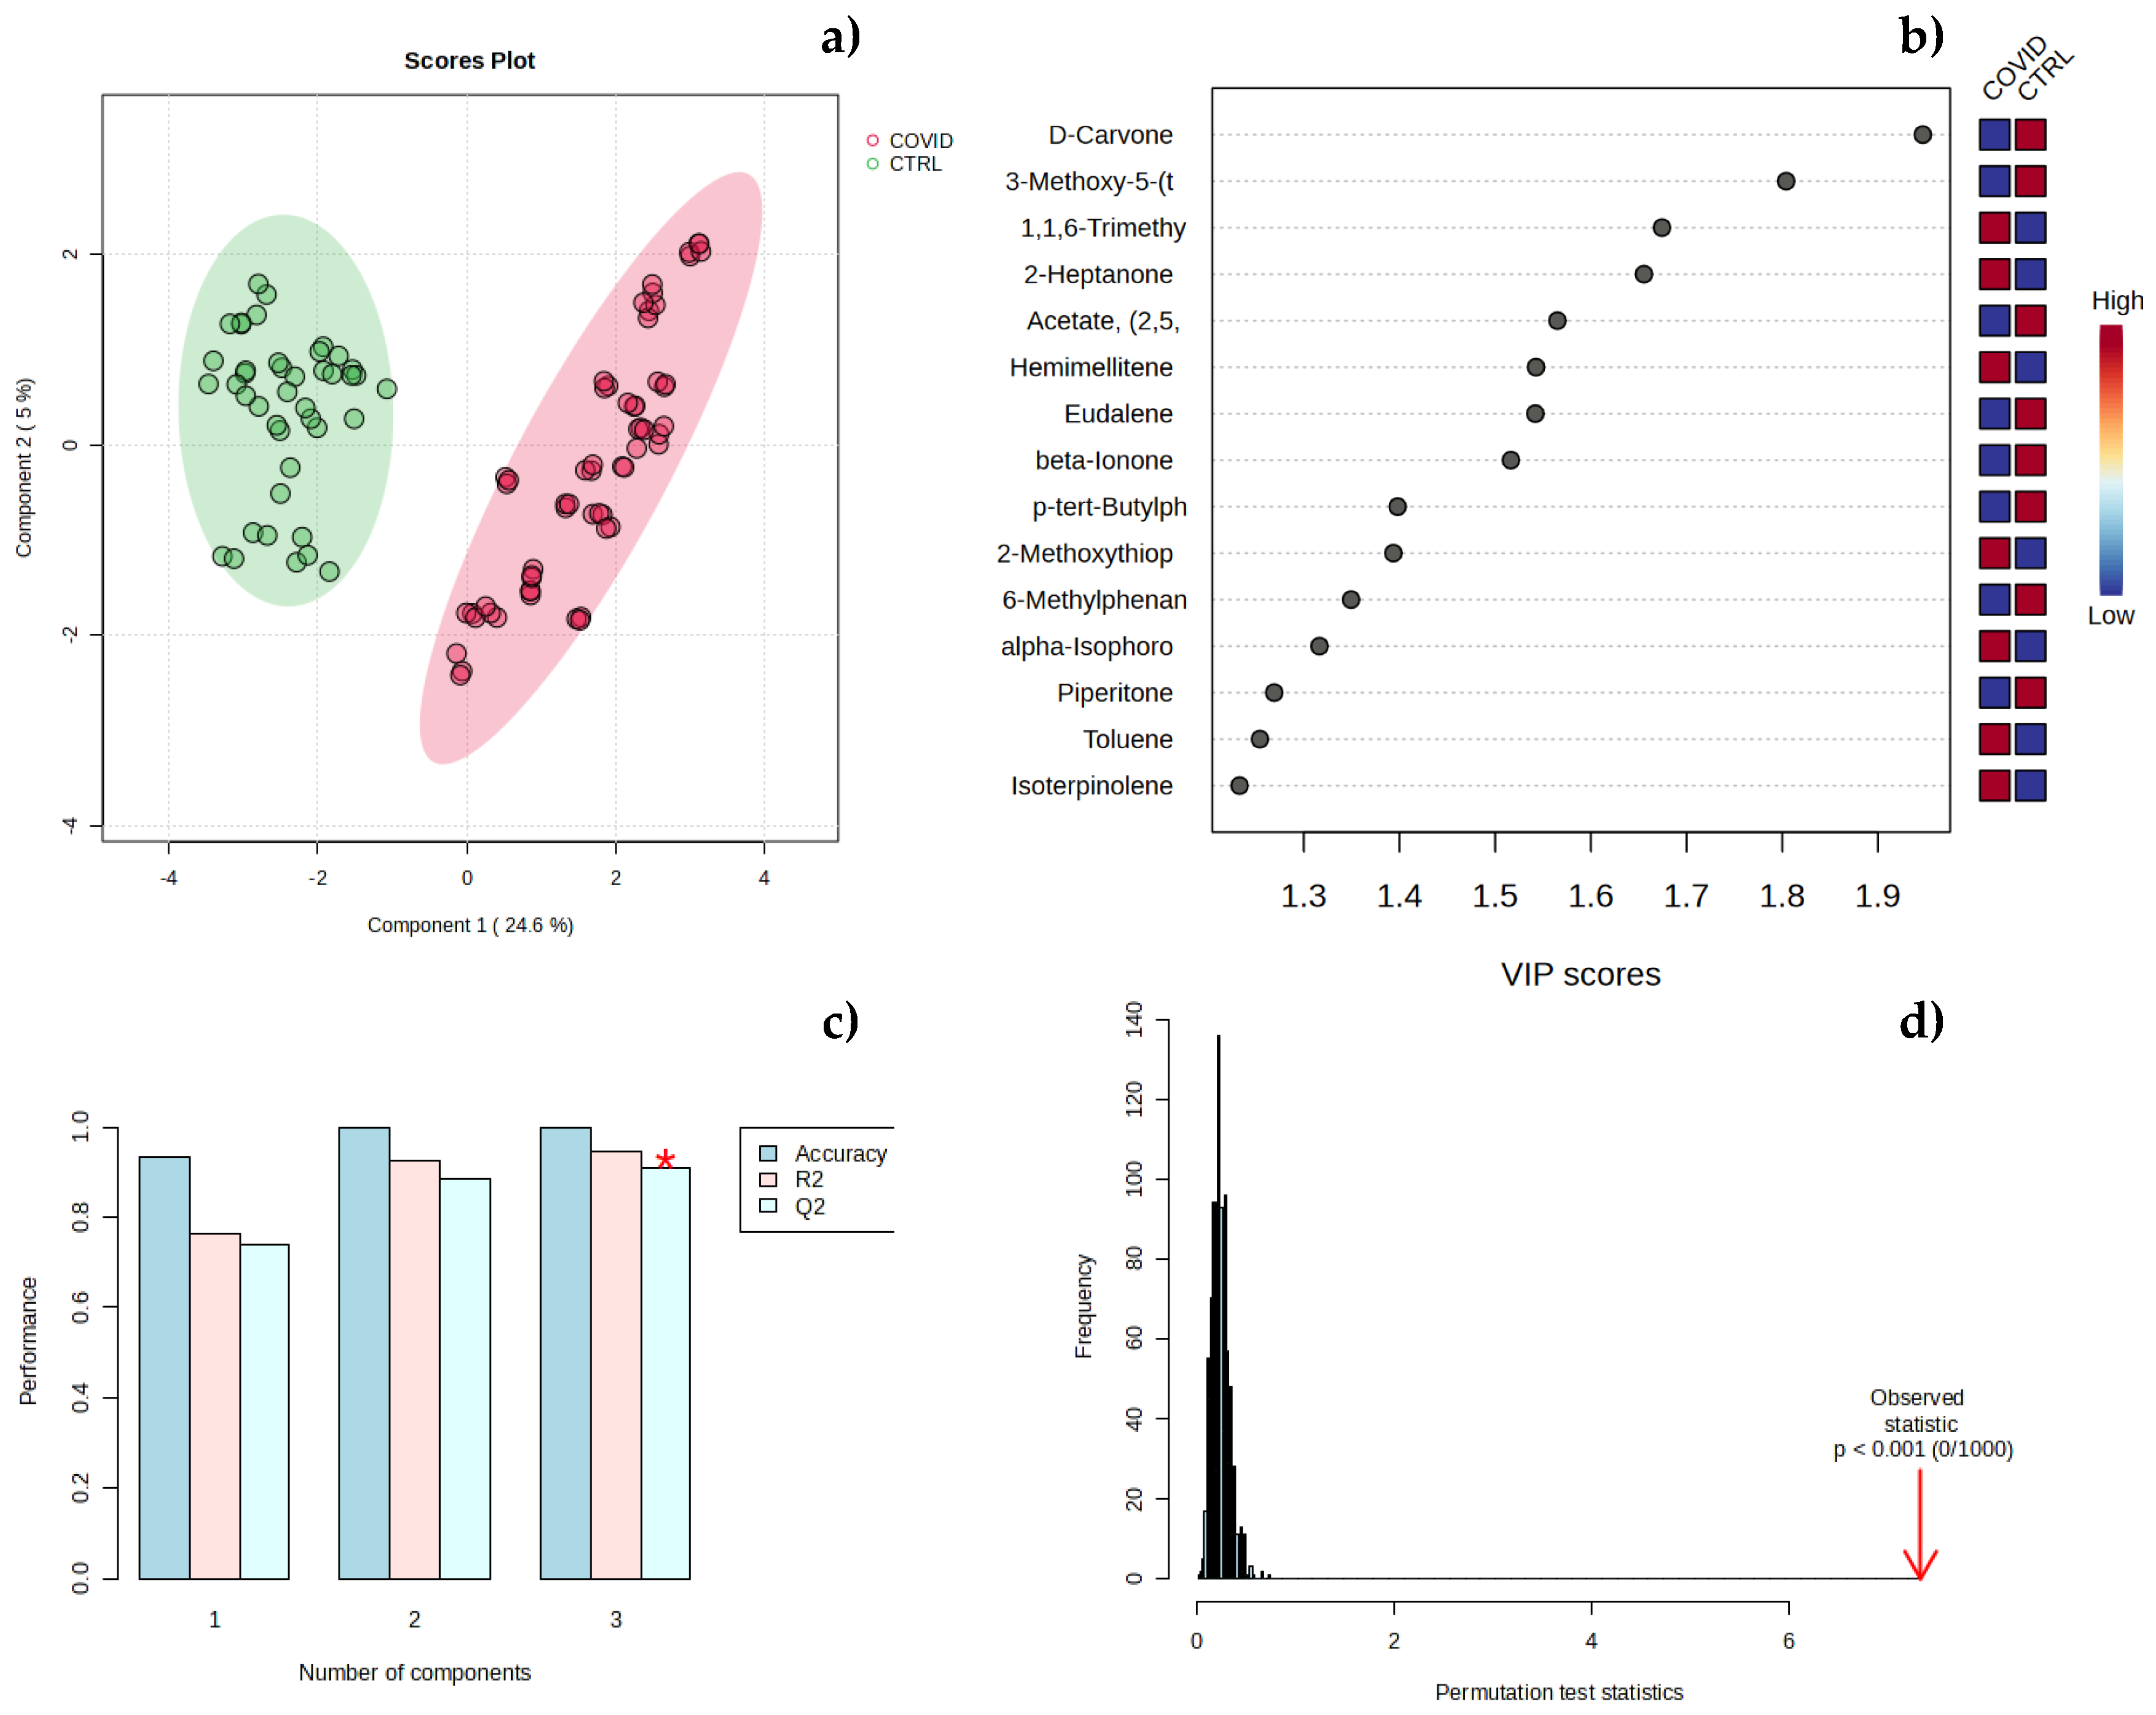
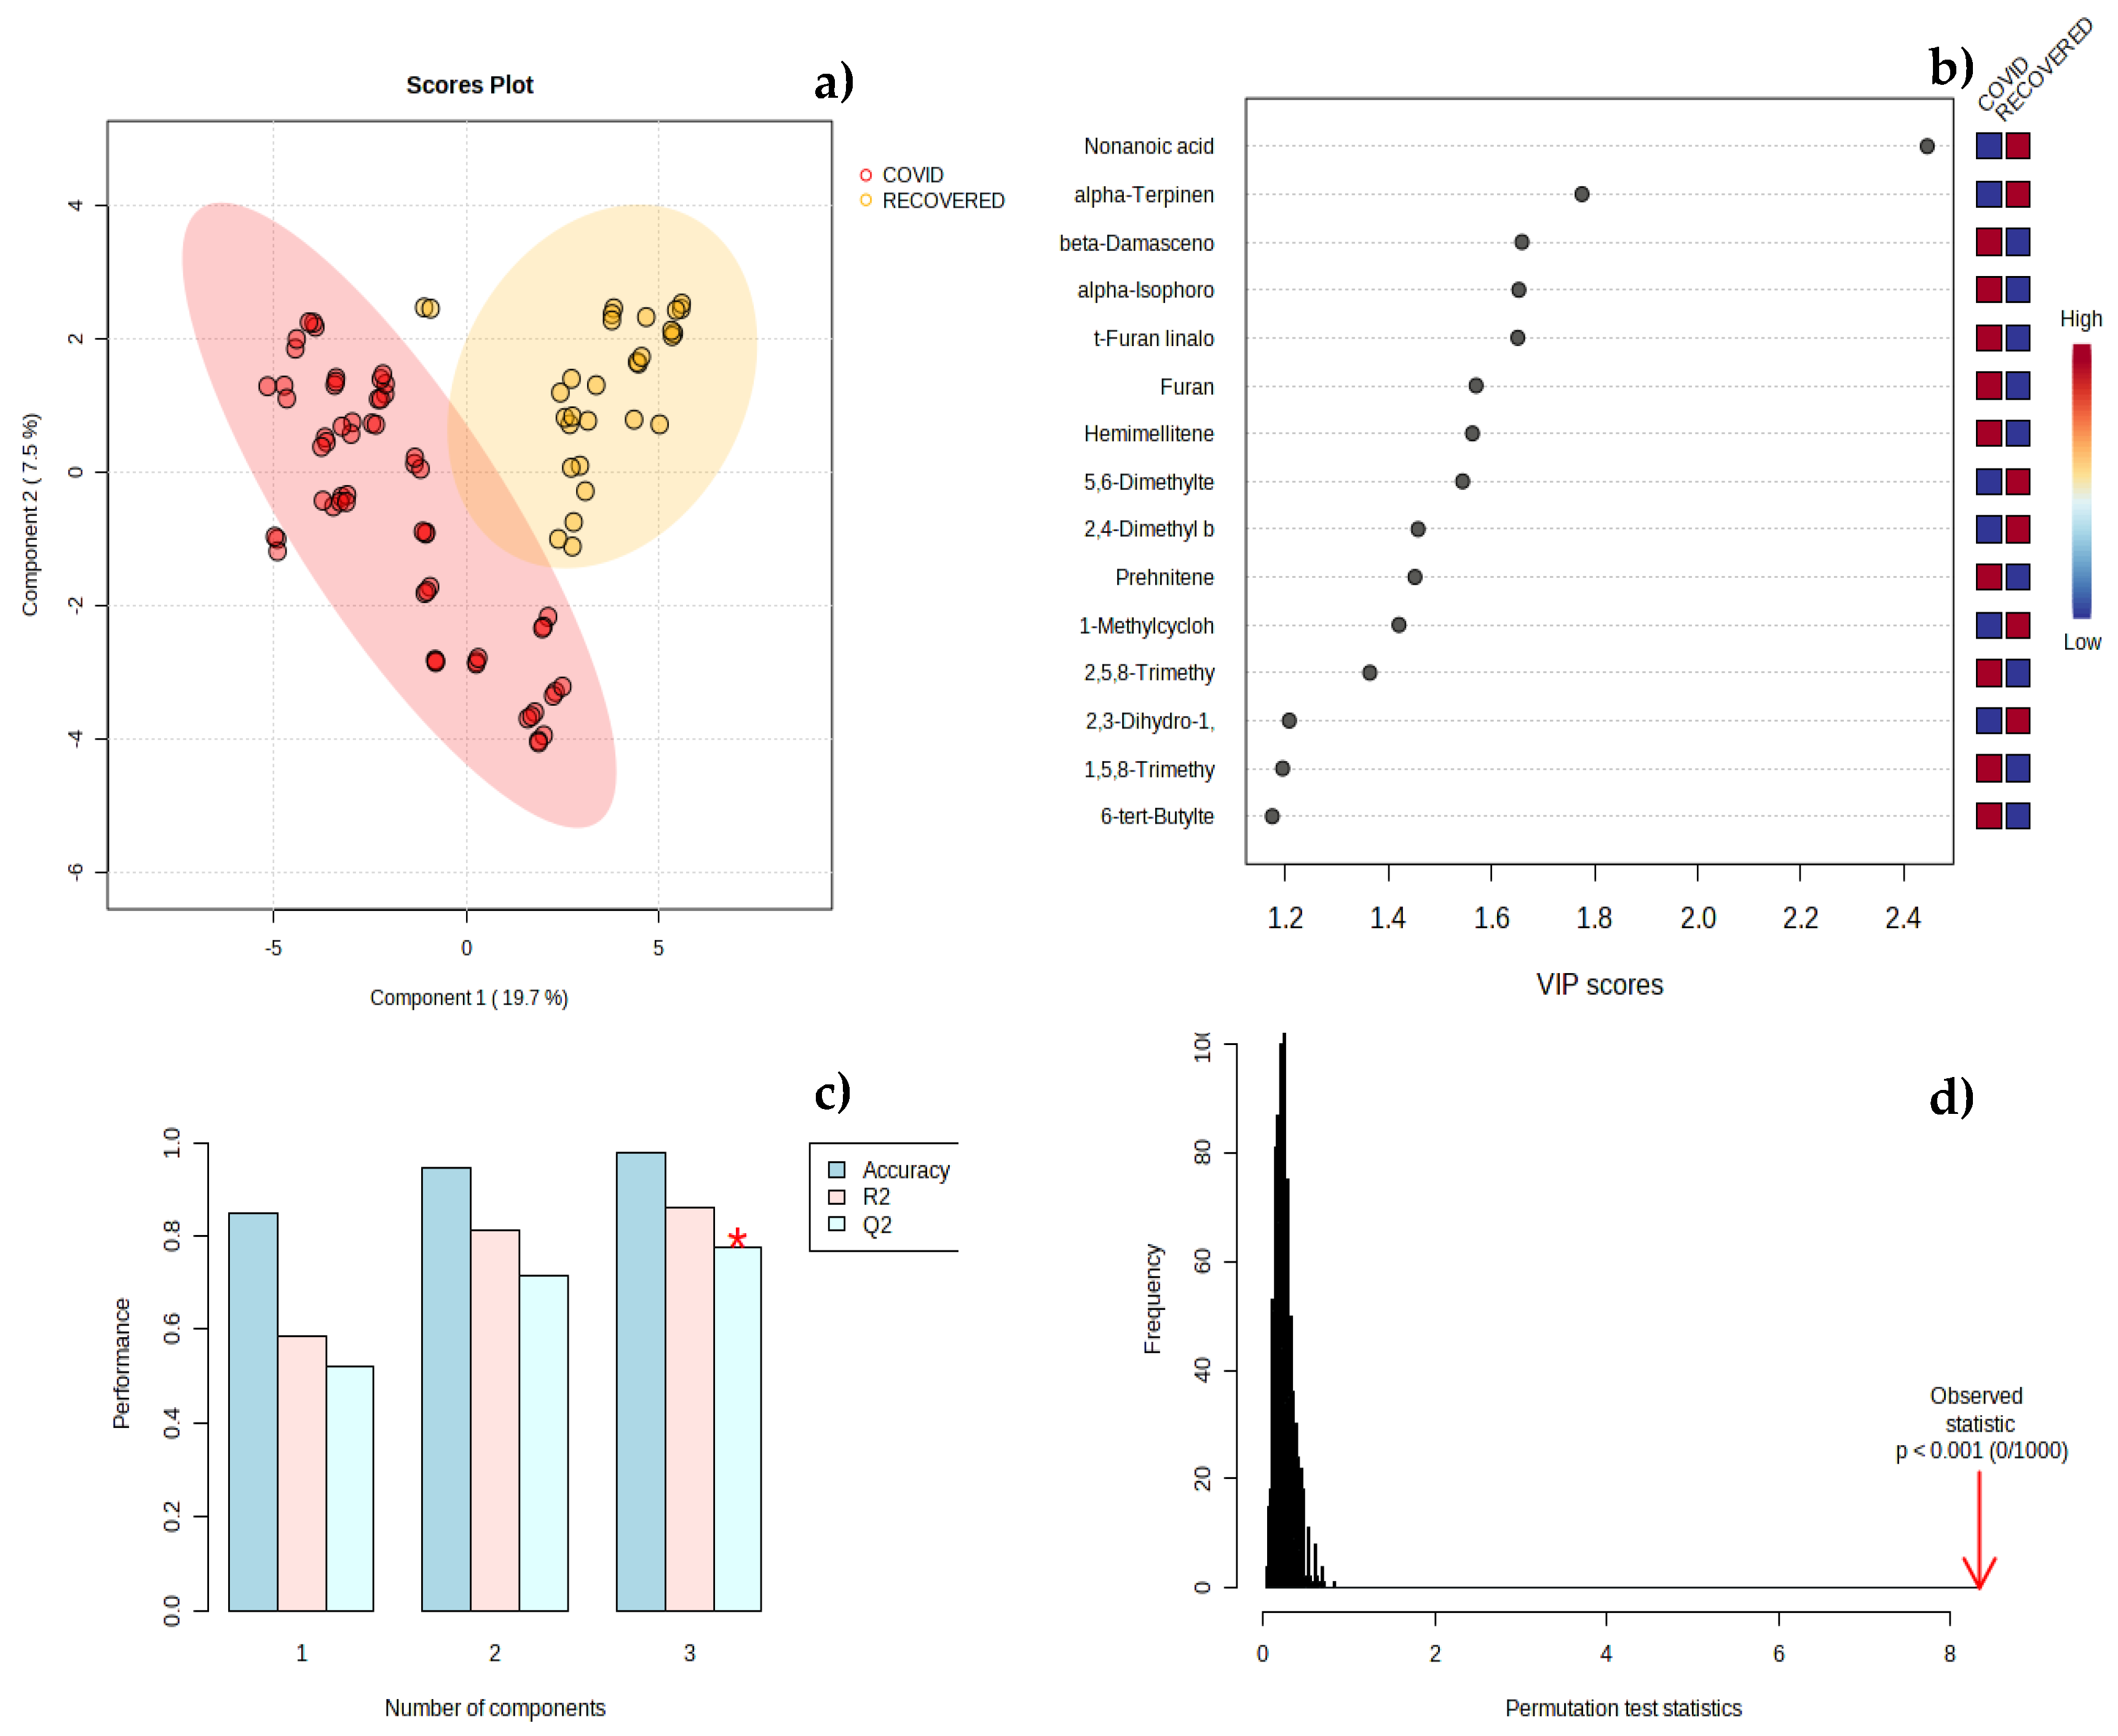
In multivariate pattern recognition procedures like Partial Least Squares Discriminant Analysis (PLS-DA), the information present in the VOMs fingerprint was utilized as multiple variables to visualize group trends and clusters. The outcome of the PLS-DA analysis revealed that there were two distinct groups well-separated for the COVID-CTRL comparison analysis. To evaluate the robustness of the model, a 10-fold cross validation performance was conducted using PLS-DA (Figure 5). Figure 5c showed R2 and Q2 values close to 1, which represent respectively the goodness of fit and the predictive ability for distinguishing between different study groups. (*) represented the best value of Q2 for the PLS-DA model. A random permutation test involving 1000 permutations, was carried out to assess the statistical significance of the class discrimination obtained (Figure 5d). Additionally, the top 10 variables of important in projection (VIP > 1) score plot was reported (Figure 5b) that illustrates the relative contributions of the metabolites in explaining the variance observed between the COVID and CTRL groups. 1,1,6-Trimethyl-dihydronaphthalene (TDN) and 2-heptanone showed a more significant contribution for the COVID groups and D-carvone and 3-Methoxy-5-(trifluoromethyl)aniline (MTA) showed a more significant contribution for the CTRL group.
The same multivariate analysis was performed to compare the data of SARS-CoV-2 infected urine samples with the recovered from COVID-19 urine samples (Figure 6). Even in this case, the PLS-DA segregated the COVID and RECOV samples in two well-separated clusters corresponding with the infected and on the mend patients (Figure 6a). The 10-fold CV performance and permutation test showed a good robustness of the PLS-DA model (Figure 6c,d). In the Figure 6b, VIP score plot revealed that β-damascenone α-isophorone gave a higher significant contribution to discriminate COVID group and nonanoic acid and α-terpinene gave a most significant contribution to discriminate RECOV group.
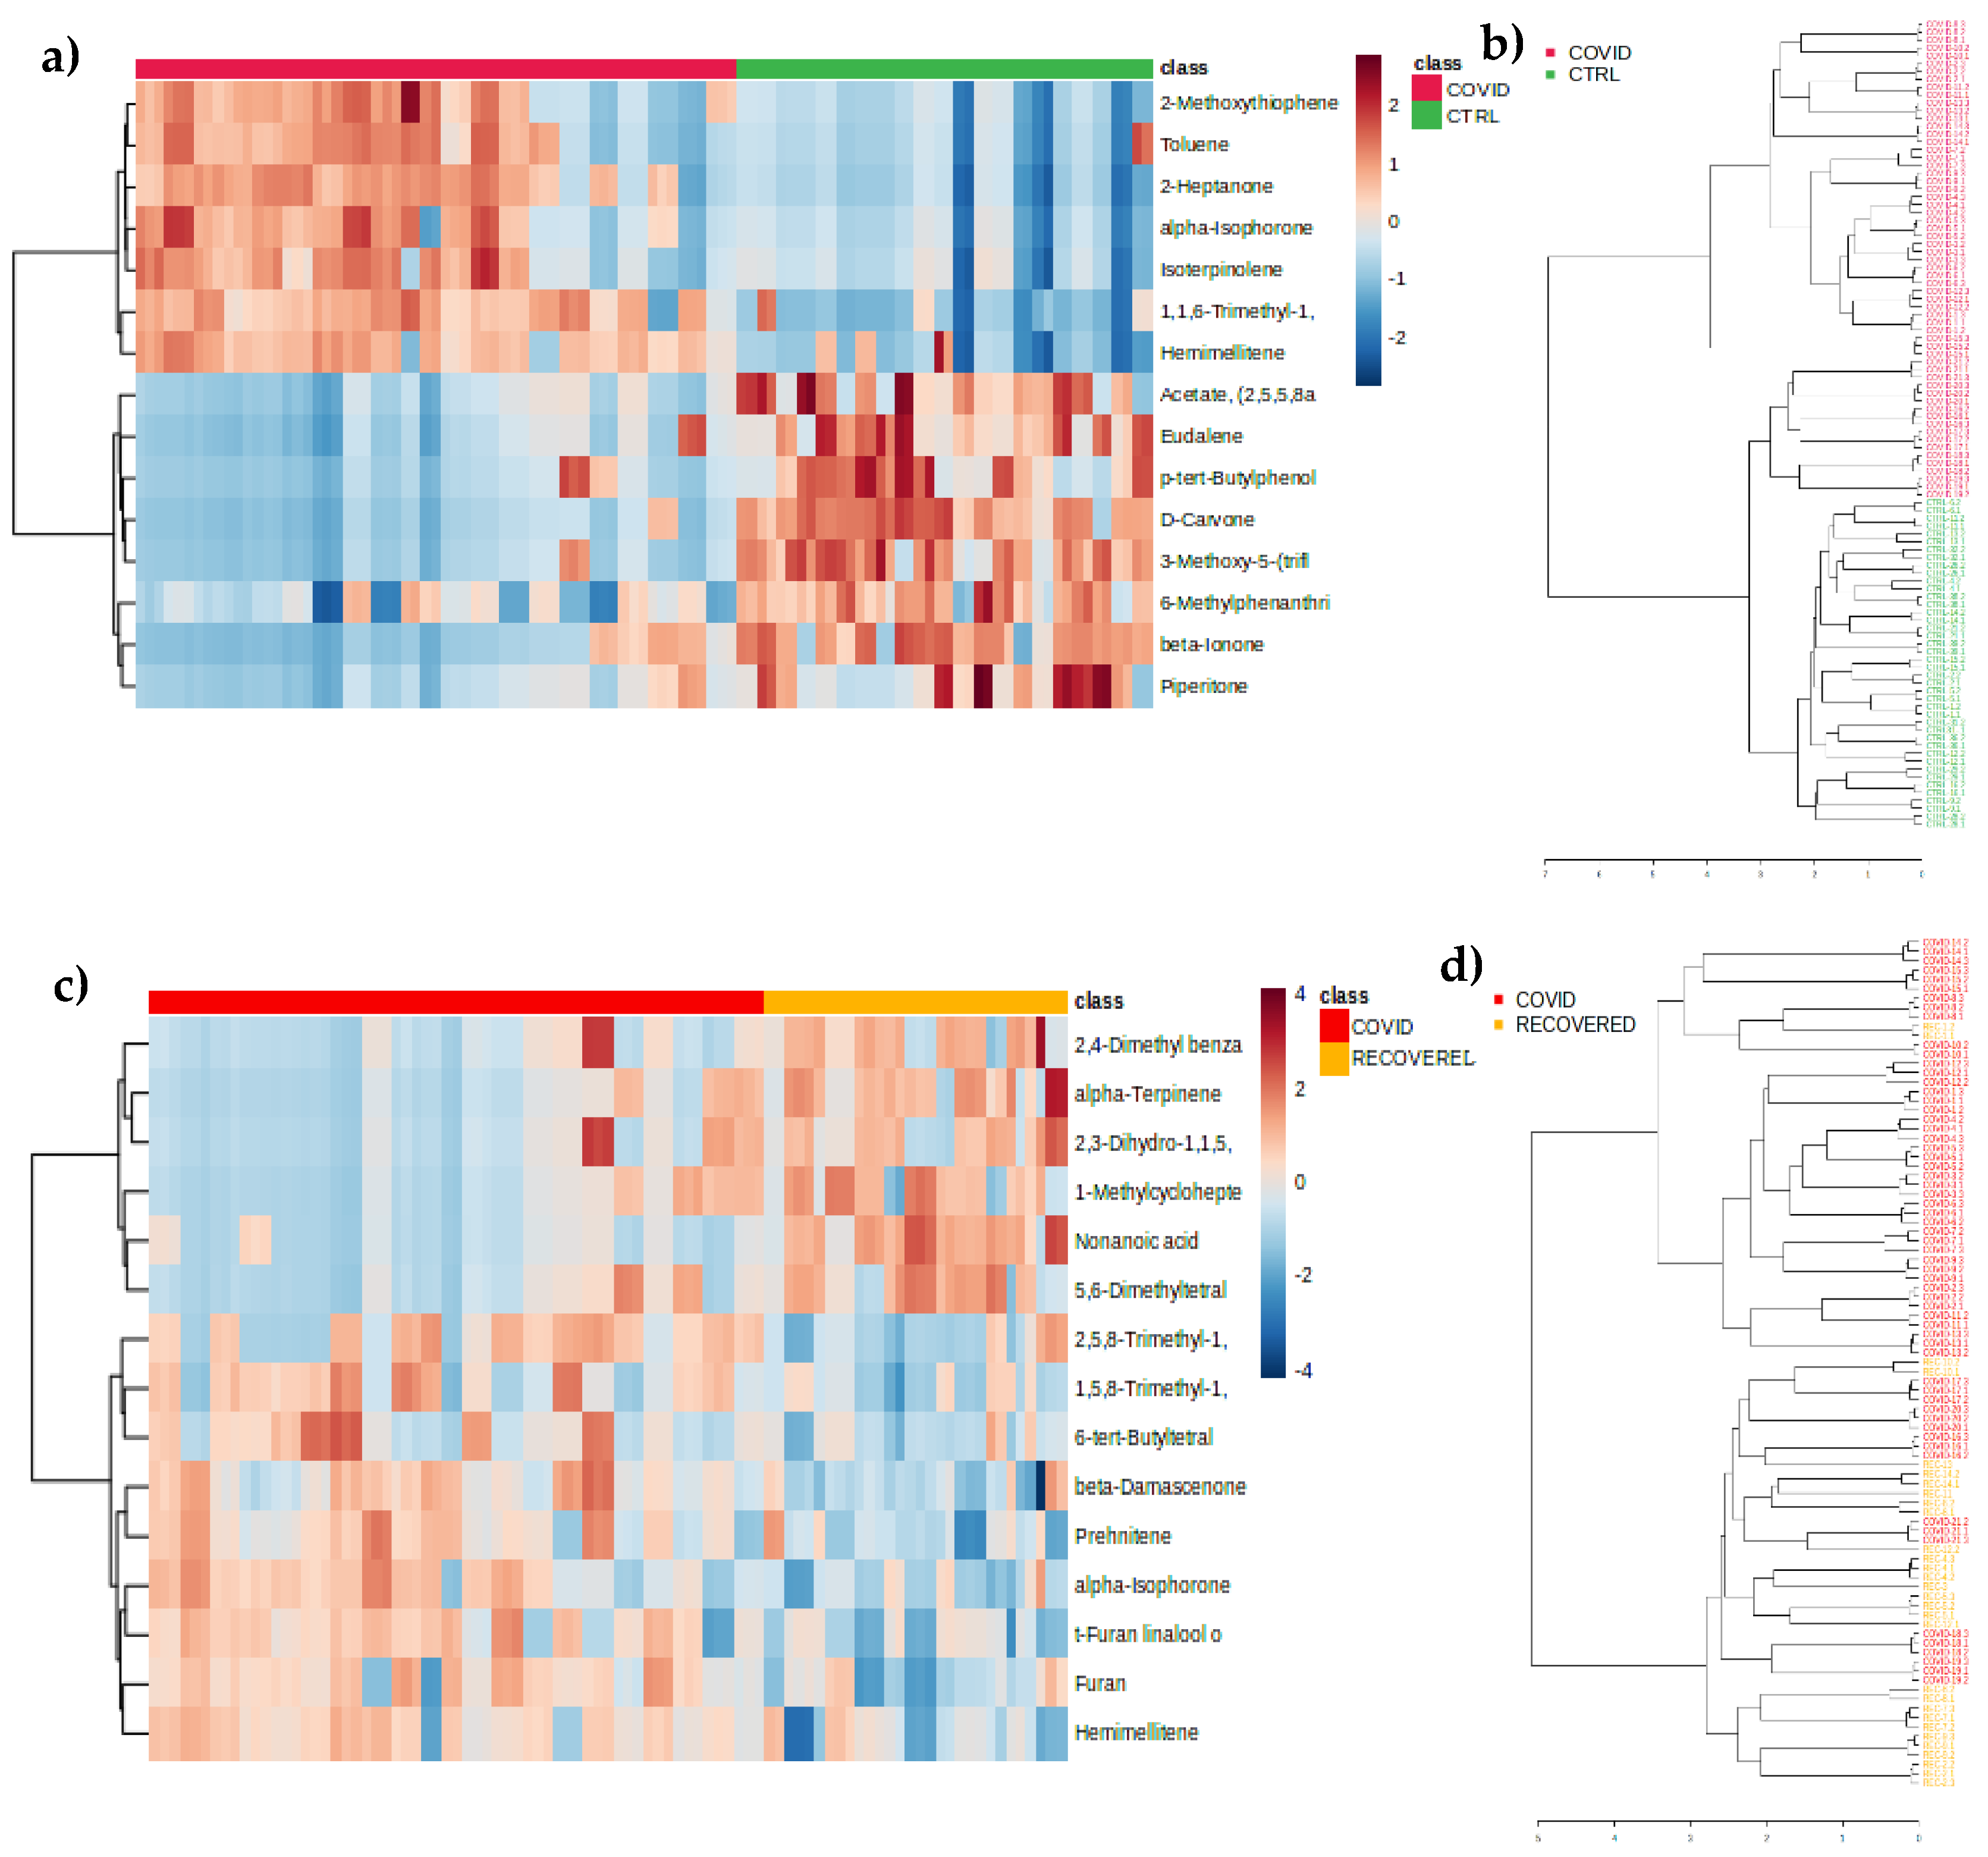
Hierarchical clustering analysis of the volatilomic data was carried out for the two comparisons, COVID-CTRL and COVID-RECOV, through the heatmap and dendogram. Heatmap was created using Spearman’s distance correlation to build a visual representation of the data set, specially focusing on the 15 most relevant metabolites to discriminate the two groups of study. Heat map allows an intuitive description of the relationship between samples and detected volatile metabolites. The coloured representation of the cells corresponds to the concentration of the detected VOMs for each sample (dark blue, less concentrated, and dark red, more concentrated).
The comparison between COVIDand CTRL groups, the analysis revealed two well-defined clusters (Figure 7a). The urinary VOMs 2-methoxythiophene, toluene, α-isophorone, TDN, hemimellitene showed a higher correlation with urine profile of COVID-19 patients. Piperitone, β-ionone, D-carvone, eudalene resulted more related with urinary profile of CTRL (control) group. Dendogram was able to split completely the samples in two groups matching the real group of study (Figure 7b). Although the heatmap was perfectly able to cluster volatilomic data from COVID-19 patients and recovered individuals, the clusters accuracy was visually lower than the first analysis (COVID-CTRL), highlighting that the COVID-19 patients’ urinary profile is closer to the recovered individuals. Urinary VOMs such as hemimellitene, furan, β-damascenone, and α-isophorone showed a higher correlation with COVID group, while 2,4-dimethylbenzaldehyde, nonanoic acid, 1-methylcycloheptene, and α-terpinene were more related with recovered indiciduals’ volatile profile (Figure 7c). Dendogram divided only partially the samples of these two different groups (Figure 7d).
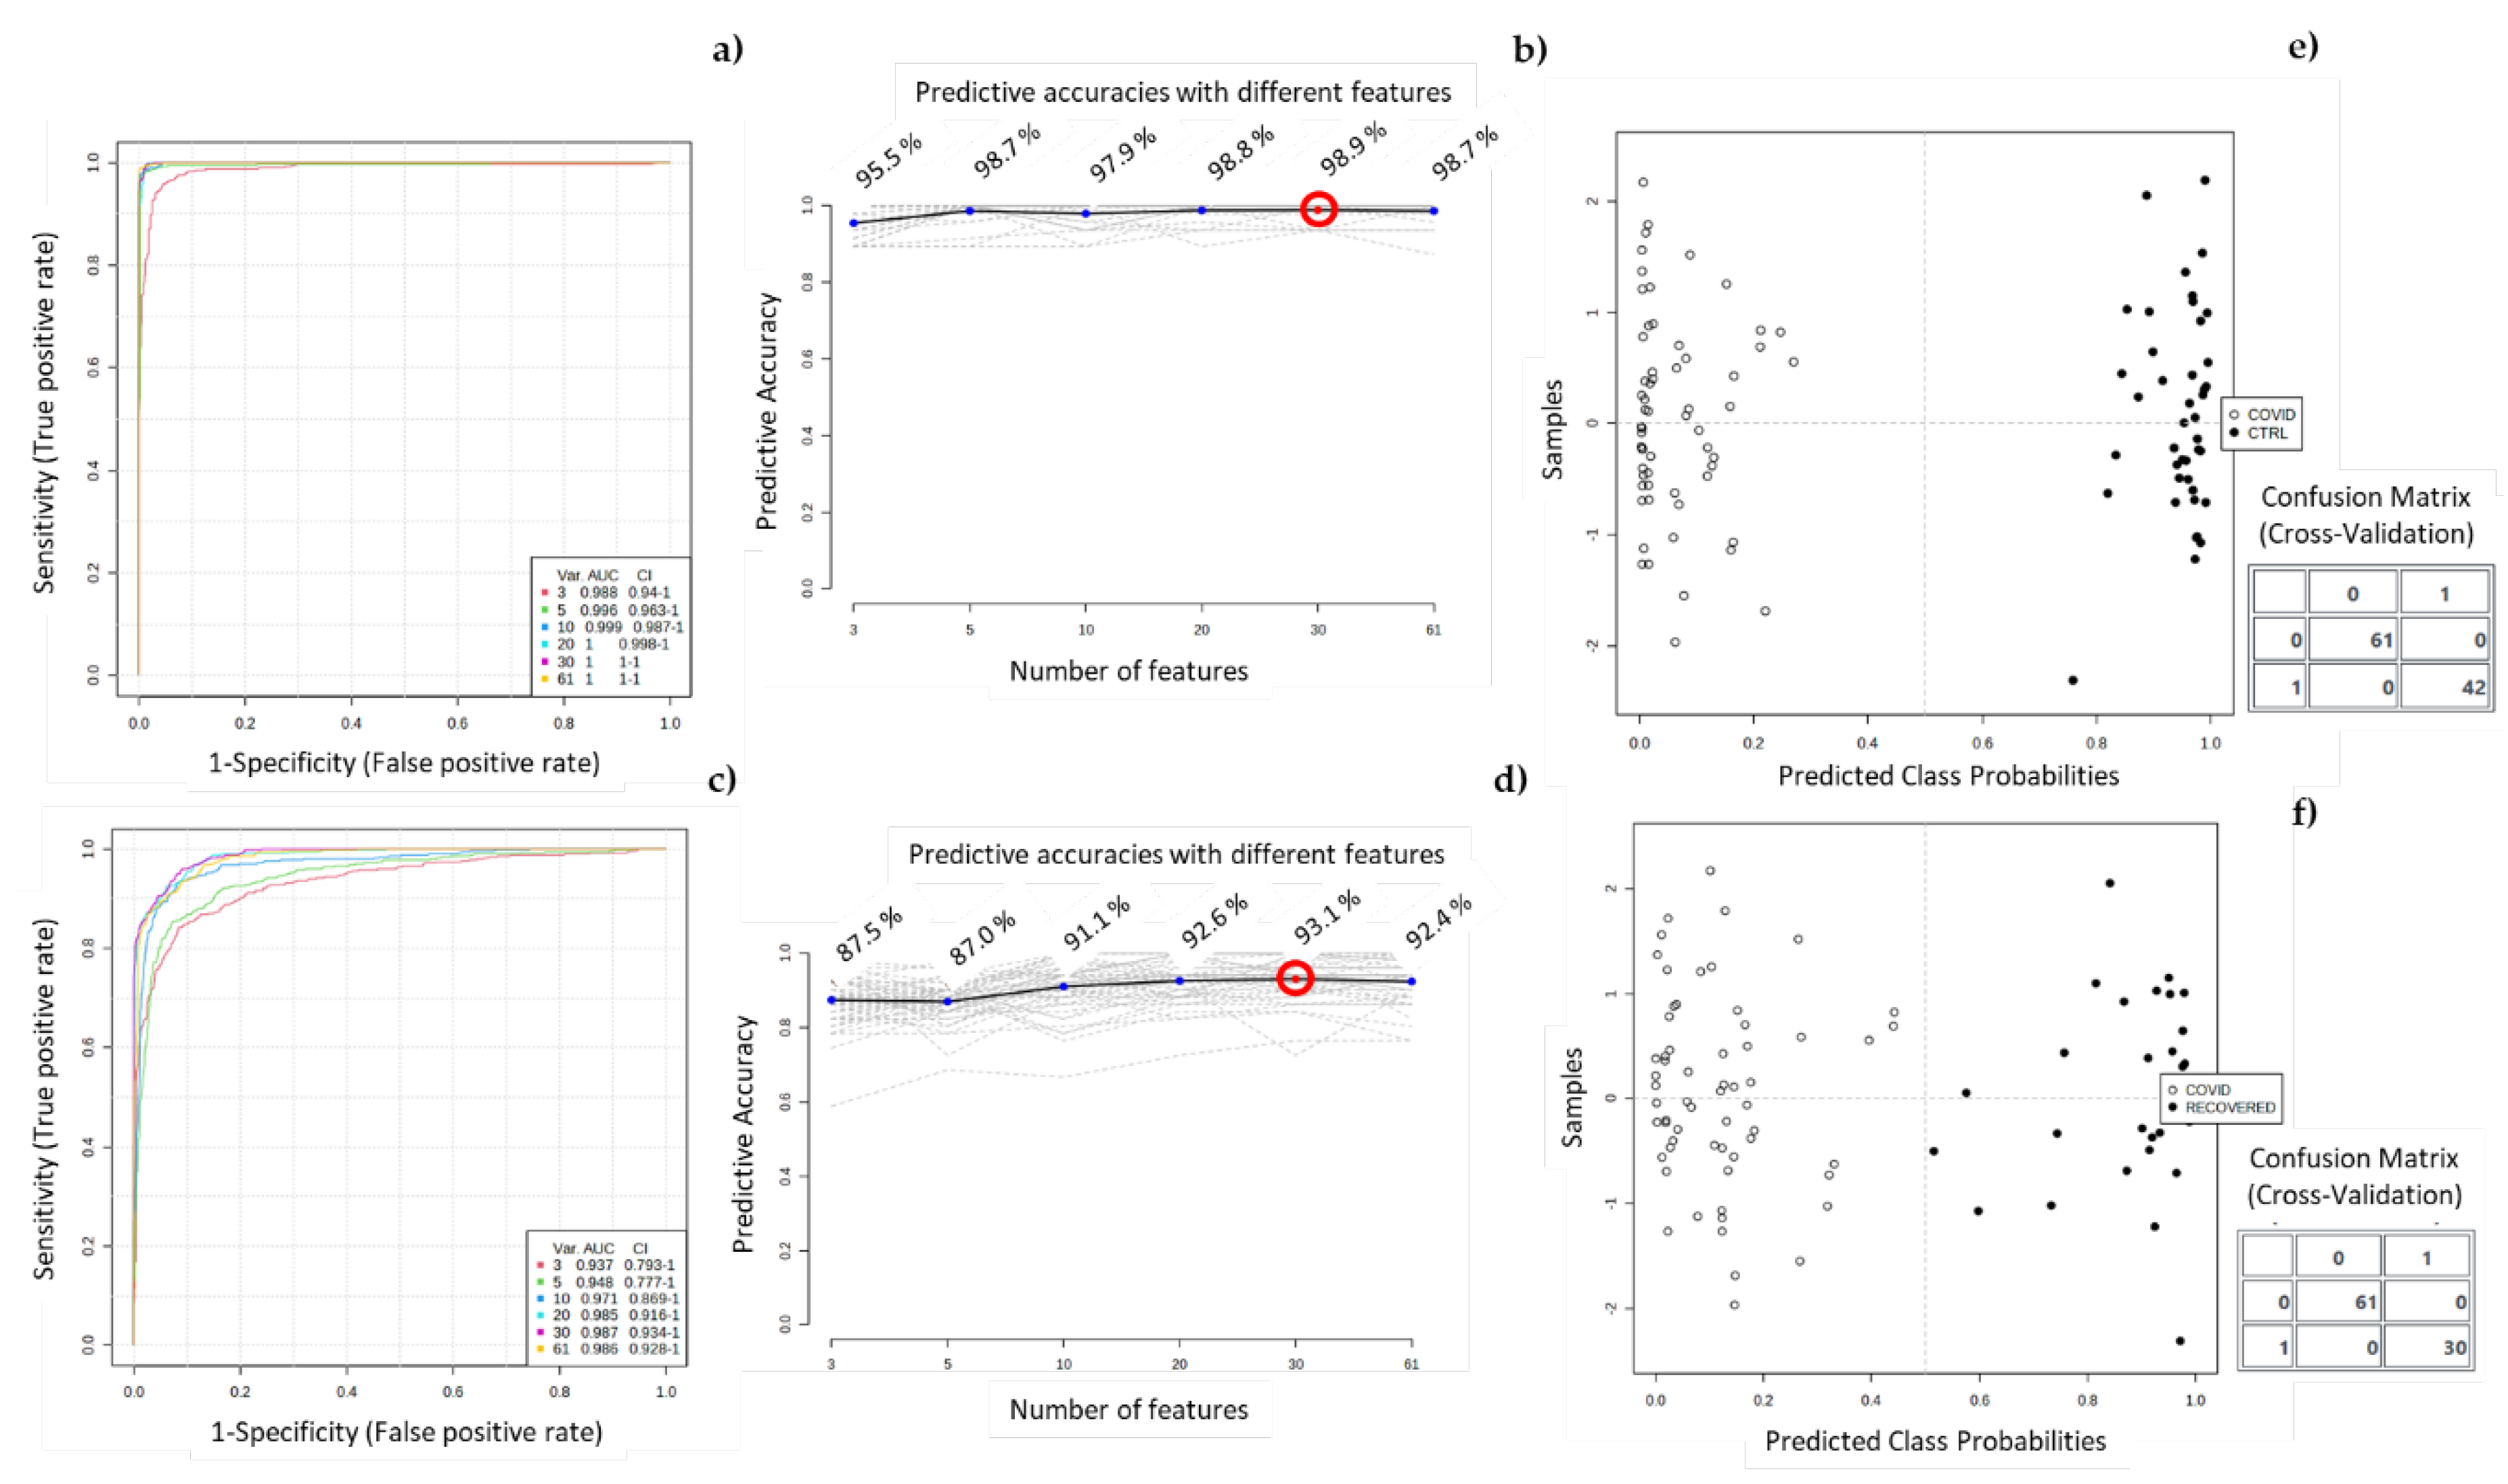
For the classification of true positives and false positives and the predictive ability, multivariate exploratory receiver operating characteristic (ROC) curves were created using Monte Carlo cross-validation (MCCV) methodology. The features importance, selected using 2/3 of the samples, were utilized to construct classification models, which were validated on the remaining 1/3 of the samples that were not initially used. This process was repeated several times to determine the performance of each model and calculate confidence intervals. From these samples, the top 3, 5, 10, 20, 30, and 61 important features were identified, and the built curves were reported (Figure 8a,c). Figure 8a display the ROC curve for different sets of important features for the COVID-CTRL (COVID-19 patients and control subjects). The area under the curve (AUC) values obtained, ranging from 0.988 to 1, indicated excellent discriminative accuracy between the two groups. Plot in the Figure 8c illustrated the ROC curves for the COVID-RECOV comparison (COVID-19 patients and infected subject in the recovering period). In this case, the area under the curve (AUC) values fell in a range from 0.937 to 0.987 that also show an optimal ability to discriminate between the groups of study. These values were calculated with a 95% confidence interval, demonstrating the reliability of the results. Figure 8b,d illustrated the predictive accuracy of the biomarker models as the number of features increases. As more features are included in the models, the predictive accuracy improves. This suggests that the selected features contribute to the differentiation between the controls (CTRL) and COVID-19 (COVID) groups, and between COVID and recovered (RECOV) groups. The predicted class probabilities were assessed through the performance of the classification model for COVID-CTRL groups (Figure 8e) and COVID-RECOV groups (Figure 8f). Overall, the results demonstrate promising performance of the biomarker models, with high accuracy in distinguishing between the two groups.
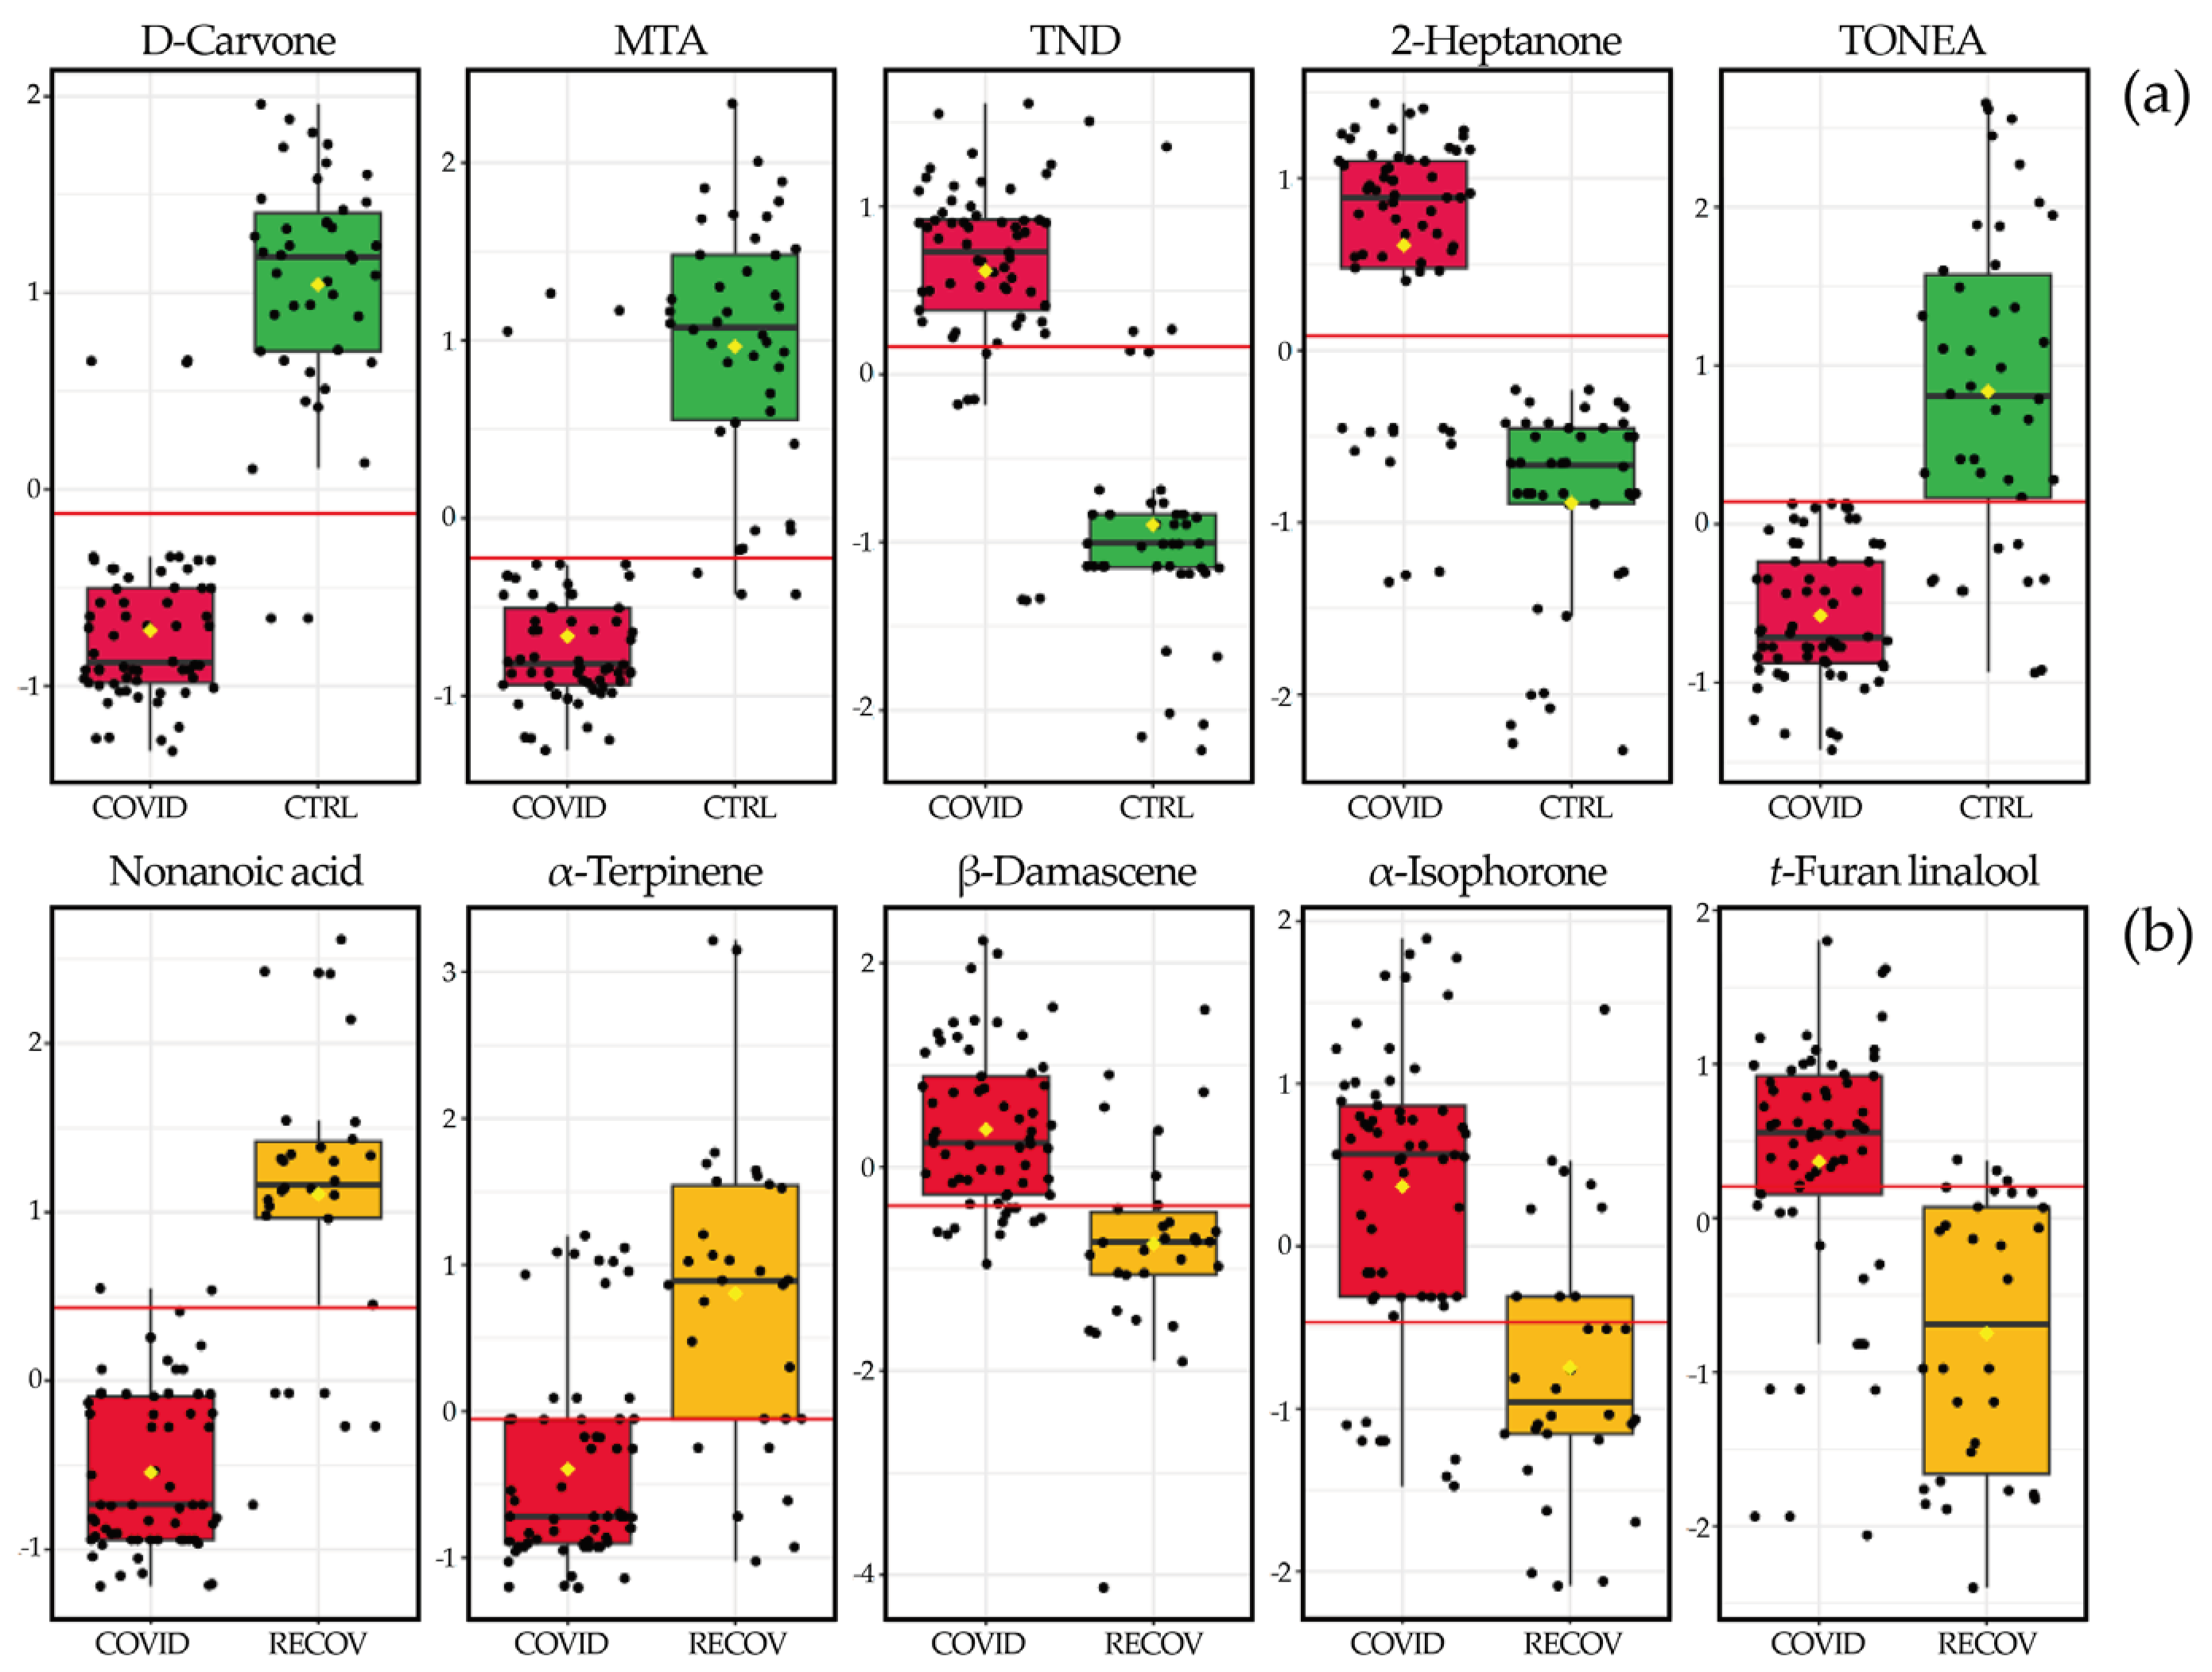
The boxplots of the most important variables (VOMs) for discriminating between COVID and CTRL groups, and between COVID and RECOV, were plotted in Figure 9.
Some VOMs, such as D-carvone, MTA, TDN, and α-terpinene, are associated with diet [13,14,15,16,32,33] and as a result, their interpretation as potential biomarkers for COVID-19 infection and progression is not straightforward.

3. Discussion

This study focused on the analysis of the volatile composition of the urine of patients infected with SARS-CoV-2 upon recovery. Overall, 101 different VOMs were identified in the urine of the recruited subjects, and statistically significant differences were found between these groups and control subjects. Accordingly, a volatile signature composed of D-carvone, MTA, TDN, 2-heptanone, and TONEA and nonanoic acid, α-terpinene, β-damascenone, α-isophorone, and t-furan linalool were defined for COVID-19 patients and patients recovered from the disease, respectively. Correspondent boxplots show sharp variations in the levels of the referred VOMs between analysed groups. The interpretation of these variations in urine composition is hindered by the fact that they undergo modifications due to various factors, including metabolic processes, pH fluctuations, bacterial activity, and the degradation of urine components. Additionally, external factors such as diet, lifestyle habits, health conditions, physical stress, and the environment also play a role in affect its composition [16,34]. Terpenes are often associated with exogenous sources, such as beverages, foods, and flavouring ingredients, although they can also be produced through the mevalonic acid pathway [28,35]. Carotenoid-rich foods are a source of volatile norisoprenoids, which are produced through enzymatic degradation and have been reported in other studies involving volatile urinary fingerprinting [36]. Phenolic compounds are often found in urine as by-products of metabolic processes, but they can also be produced through the consumption of food, beverages, industrial chemicals, and environmental pollutants [37]. Ketones are a key subgroup of chemicals detected in urine, and multiple metabolic pathways are involved in their production, including carbohydrate metabolism, decarboxylation of oxo-acids, and lipid peroxidation [38,39]. Some studies have suggested that a considerable portion of ketones in urine may stem from gut bacterial activity, external sources such as foodstuffs, beverages, flavouring ingredients, or pollution [31,40]. To our knowledge, this is the first study to reveal changes in the urinary volatilomic profile following SARS-CoV-2 infection and recovery from COVID-19. Such changes define volatile signatures with the potential to be used in noninvasive COVID-19 diagnosis and management. In this context, the number of samples constitutes a limitation of this study, which can be circumvented by future disease outbreaks. In this scenario, the experimental conditions, safety protocols, and collaboration between the research entities involved in this study can be promptly activated, allowing the recruitment of more subjects and relevant clinical information. Age, diet, previous clinical condition, sex, and gender, for instance, were interferents that could not be included in the present study.

4. Conclusion

A novel, fast, and sensitive analytical approach was developed and successfully applied in diagnosis of COVID-19 infection. This exploratory study using HS-SPME/GC-MS, unveiled significant differences in the volatilomic patterns of COVID-19 patients and recovered patients compared to control subjects, evidencing that SARS-CoV-2 infection triggered metabolic changes that also affect the urinary volatile composition of the infected patients. This constitutes a signature with potential for COVID-19 diagnosing and monitoring of the disease progression with potential to be successfully used in clinical applications. Overall, the results show the feasibility of using urine samples for the non-invasive COVID-19 diagnosis and further studies with larger cohorts are desirable, envisaging the developing of this complementary tool for COVID-19 diagnosis.

Supplementary Materials

The following supporting information can be downloaded at the website of this paper posted on Preprints.org, Figure S1: Multivariate analysis of volatile profiles of the COVID19 and CTRL groups; Table S1: Identified metabolites in urine samples of COVID19 patients, patients who recovered from COVID19 and healthy patients.

Author Contributions

Conceptualisation, J.S.C.; investigation, G.R. and J.N.; sample collection, C.P.O.; writing of the original draft preparation, G.R. and J.N.; review and editing, C.P.O.; V.G.; J.A.M.P., R.P. and J.S.C.; Visualization, J.A.M.P., R.P. and J.S.C.; Supervision: J. S. C., R. P., and J. A. M. P.; Funding Acquisition: J.S.C.. All authors have read and agreed to the published version of the manuscript. All authors confirm that they have full access to all data in the study and accept the responsibility to submit the manuscript for publication.

Funding

This work was supported by FCT-Fundação para a Ciência e a Tecnologia through the CQM Base Fund-UIDB/00674/2020 and Programmatic Fund-UIDP/00674/2020, by ARDITI-Agência Regional para o Desenvolvimento da Investigação Tecnologia e Inovação through the project M1420-01-0145-FEDER-000005-Centro de Química da Madeira-CQM+ (Madeira 14-20 Program). and by Fundação para a Ciência e Tecnologia through Madeira 14-2020 program to the Portuguese Mass Spectrometry Network through the PROEQUIPRAM program M14-20 M1420-01-0145-FEDER-000008.

Informed Consent Statement

Informed consent was obtained from all the subjects involved in the study (Supplementary Material).

Data Availability Statement

The study protocol and datasets generated and analysed during the current study will be available with publication from the corresponding author upon reasonable request.

Acknowledgments

The authors would like to thank all the staff members at the SESARAM, EPE-RAM and Dr. Nélio Mendonça Hospital for providing the help to conduct this research. We would also like to thank all the donors who participated in this study. The authors also acknowledge financial support from the Giulia Riccio was supported by a PhD scholarship given by Università Cattolica del Sacro Cuore, 00168 Rome, Italy. Jorge A. M. Pereira was supported by a research contract given by Centro de Química da Madeira and Universidade da Madeira.

Conflicts of Interest

The authors declare no conflict of interest.

Sample Availability

Not applicable

References

  1. Huang, C.; Wang, Y.; Li, X.; Ren, L.; Zhao, J.; Hu, Y.; Zhang, L.; Fan, G.; Xu, J.; Gu, X.; et al. Clinical features of patients infected with 2019 novel coronavirus in Wuhan, China. Lancet 2020, 395, 497–506. [Google Scholar] [CrossRef] [PubMed]
  2. Vasbinder, A.; Padalia, K.; Pizzo, I.; Machado, K.; Catalan, T.; Presswalla, F.; Anderson, E.; Ismail, A.; Hutten, C.; Huang, Y.; et al. SuPAR, biomarkers of inflammation, and severe outcomes in patients hospitalized for COVID-19: The International Study of Inflammation in COVID-19. J. Med. Virol. 2024, 96, e29389. [Google Scholar] [CrossRef] [PubMed]
  3. Kabir, M.A.; Ahmed, R.; Chowdhury, R.; Iqbal, S.M.A.; Paulmurugan, R.; Demirci, U.; Asghar, W. Management of COVID-19: current status and future prospects. Microbes Infect. 2021, 23, 104832. [Google Scholar] [CrossRef] [PubMed]
  4. Talic, S.; Shah, S.; Wild, H.; Gasevic, D.; Maharaj, A.; Ademi, Z.; Li, X.; Xu, W.; Mesa-Eguiagaray, I.; Rostron, J.; et al. Effectiveness of public health measures in reducing the incidence of covid-19, SARS-CoV-2 transmission, and covid-19 mortality: systematic review and meta-analysis. BMJ 2021, 375, e068302. [Google Scholar] [CrossRef] [PubMed]
  5. Li, Y.; Undurraga, E.A.; Zubizarreta, J.R. Effectiveness of Localized Lockdowns in the COVID-19 Pandemic. Am. J. Epidemiol. 2022, 191, 812–824. [Google Scholar] [CrossRef] [PubMed]
  6. World Health Organization. WHO Coronavirus (COVID-19) Dashboard. Availabe online: (accessed on 21 June 2023).
  7. Jones, E.A.K.; Mitra, A.K.; Bhuiyan, A.R. Impact of COVID-19 on Mental Health in Adolescents: A Systematic Review. Int. J. Environ. Res. Public. Health 2021, 18. [Google Scholar] [CrossRef] [PubMed]
  8. Ventriglio, A.; Castaldelli-Maia, J.M.; Torales, J.; Chumakov, E.M.; Bhugra, D. Personal and social changes in the time of COVID-19. Ir J Psychol Med 2021, 38, 315–317. [Google Scholar] [CrossRef] [PubMed]
  9. May, T.; Aughterson, H.; Fancourt, D.; Burton, A. ‘Stressed, uncomfortable, vulnerable, neglected’: a qualitative study of the psychological and social impact of the COVID-19 pandemic on UK frontline keyworkers. BMJ Open 2021, 11, e050945. [Google Scholar] [CrossRef] [PubMed]
  10. Miyah, Y.; Benjelloun, M.; Lairini, S.; Lahrichi, A. COVID-19 Impact on Public Health, Environment, Human Psychology, Global Socioeconomy, and Education. Scientific World Journal 2022, 2022, 5578284. [Google Scholar] [CrossRef] [PubMed]
  11. Zhang, Y.; Clarke, S.P.; Wu, H.; Li, W.; Zhou, C.; Lin, K.; Wang, J.; Wang, J.; Liang, Y.; Wang, X.; et al. A comprehensive overview on the transmission, pathogenesis, diagnosis, treatment, and prevention of SARS-CoV-2. J. Med. Virol. 2023, 95, e28776. [Google Scholar] [CrossRef] [PubMed]
  12. Abusrewil, Z.; Alhudiri, I.M.; Kaal, H.H.; El Meshri, S.E.; Ebrahim, F.O.; Dalyoum, T.; Efrefer, A.A.; Ibrahim, K.; Elfghi, M.B.; Abusrewil, S.; et al. Time scale performance of rapid antigen testing for SARS-CoV-2: Evaluation of 10 rapid antigen assays. J. Med. Virol. 2021, 93, 6512–6518. [Google Scholar] [CrossRef] [PubMed]
  13. Pasomsub, E.; Watcharananan, S.P.; Boonyawat, K.; Janchompoo, P.; Wongtabtim, G.; Suksuwan, W.; Sungkanuparph, S.; Phuphuakrat, A. Saliva sample as a non-invasive specimen for the diagnosis of coronavirus disease 2019: a cross-sectional study. Clin. Microbiol. Infect. 2021, 27, 285 e281–285 e284. [Google Scholar] [CrossRef]
  14. Teymouri, M.; Mollazadeh, S.; Mortazavi, H.; Naderi Ghale-Noie, Z.; Keyvani, V.; Aghababaei, F.; Hamblin, M.R.; Abbaszadeh-Goudarzi, G.; Pourghadamyari, H.; Hashemian, S.M.R.; et al. Recent advances and challenges of RT-PCR tests for the diagnosis of COVID-19. Pathol. Res. Pract. 2021, 221, 153443. [Google Scholar] [CrossRef] [PubMed]
  15. Merino, P.; Guinea, J.; Munoz-Gallego, I.; Gonzalez-Donapetry, P.; Galan, J.C.; Antona, N.; Cilla, G.; Hernaez-Crespo, S.; Diaz-de Tuesta, J.L.; Gual-de Torrella, A.; et al. Multicenter evaluation of the Panbio COVID-19 rapid antigen-detection test for the diagnosis of SARS-CoV-2 infection. Clin. Microbiol. Infect. 2021, 27, 758–761. [Google Scholar] [CrossRef] [PubMed]
  16. Berenguer, C.V.; Pereira, F.; Pereira, J.A.M.; Camara, J.S. Volatilomics: An Emerging and Promising Avenue for the Detection of Potential Prostate Cancer Biomarkers. Cancers (Basel) 2022, 14. [Google Scholar] [CrossRef] [PubMed]
  17. Silva, C.; Perestrelo, R.; Silva, P.; Tomas, H.; Camara, J.S. Breast Cancer Metabolomics: From Analytical Platforms to Multivariate Data Analysis. A Review. Metabolites 2019, 9, 102. [Google Scholar] [CrossRef] [PubMed]
  18. Bond, A.; Greenwood, R.; Lewis, S.; Corfe, B.; Sarkar, S.; O’Toole, P.; Rooney, P.; Burkitt, M.; Hold, G.; Probert, C. Volatile organic compounds emitted from faeces as a biomarker for colorectal cancer. Alimentary Pharmacology & Therapeutics 2019, 49, 1005–1012. [Google Scholar] [CrossRef]
  19. Markar, S.R.; Brodie, B.; Chin, S.-T.; Romano, A.; Spalding, D.; Hanna, G.B. Profile of exhaled-breath volatile organic compounds to diagnose pancreatic cancer. BJS (British Journal of Surgery) 2018, 105, 1493–1500. [Google Scholar] [CrossRef] [PubMed]
  20. Taunk, K.; Porto-Figueira, P.; Pereira, J.A.M.; Taware, R.; da Costa, N.L.; Barbosa, R.; Rapole, S.; Câmara, J.S. Urinary Volatomic Expression Pattern: Paving the Way for Identification of Potential Candidate Biosignatures for Lung Cancer. Metabolites 2022, 12. [Google Scholar] [CrossRef] [PubMed]
  21. Opitz, P.; Herbarth, O. The volatilome - investigation of volatile organic metabolites (VOM) as potential tumor markers in patients with head and neck squamous cell carcinoma (HNSCC). J Otolaryngol Head Neck Surg 2018, 47, 42. [Google Scholar] [CrossRef] [PubMed]
  22. Sethi, S.; Nanda, R.; Chakraborty, T. Clinical application of volatile organic compound analysis for detecting infectious diseases. Clin. Microbiol. Rev. 2013, 26, 462–475. [Google Scholar] [CrossRef] [PubMed]
  23. Gallagher, M.; Wysocki, C.J.; Leyden, J.J.; Spielman, A.I.; Sun, X.; Preti, G. Analyses of volatile organic compounds from human skin. Br. J. Dermatol. 2008, 159, 780–791. [Google Scholar] [CrossRef] [PubMed]
  24. Neerincx, A.H.; Vijverberg, S.J.H.; Bos, L.D.J.; Brinkman, P.; van der Schee, M.P.; de Vries, R.; Sterk, P.J.; Maitland-van der Zee, A.-H. Breathomics from exhaled volatile organic compounds in pediatric asthma. Pediatr. Pulmonol. 2017, 52, 1616–1627. [Google Scholar] [CrossRef]
  25. Kusano, M.; Mendez, E.; Furton, K.G. Comparison of the Volatile Organic Compounds from Different Biological Specimens for Profiling Potential*. J. Forensic Sci. 2013, 58, 29–39. [Google Scholar] [CrossRef] [PubMed]
  26. Sola-Martínez, R.A.; Sanchez-Solis, M.; Lozano-Terol, G.; Gallego-Jara, J.; García-Marcos, L.; Cánovas Díaz, M.; de Diego Puente, T.; Group, T.N.S. Relationship between lung function and exhaled volatile organic compounds in healthy infants. Pediatr. Pulmonol. 2022, 57, 1282–1292. [Google Scholar] [CrossRef] [PubMed]
  27. Riccio, G.; Berenguer, C.V.; Perestrelo, R.; Pereira, F.; Berenguer, P.; Ornelas, C.P.; Sousa, A.C.; Vital, J.A.; Pinto, M.d.C.; Pereira, J.A.M.; et al. Differences in the Volatilomic Urinary Biosignature of Prostate Cancer Patients as a Feasibility Study for the Detection of Potential Biomarkers. Cur. Oncol. 2023, 30, 4904–4921. [Google Scholar] [CrossRef] [PubMed]
  28. Silva, C.L.; Passos, M.; Camara, J.S. Solid phase microextraction, mass spectrometry and metabolomic approaches for detection of potential urinary cancer biomarkers--a powerful strategy for breast cancer diagnosis. Talanta 2012, 89, 360–368. [Google Scholar] [CrossRef]
  29. Arthur, C.L.; Pawliszyn, J. Solid-Phase Microextraction with Thermal-Desorption Using Fused-Silica Optical Fibers. Anal. Chem. 1990, 62, 2145–2148. [Google Scholar] [CrossRef]
  30. Camara, J.S.; Perestrelo, R.; Berenguer, C.V.; Andrade, C.F.P.; Gomes, T.M.; Olayanju, B.; Kabir, A.; C, M.R.R.; Teixeira, J.A.; Pereira, J.A.M. Green Extraction Techniques as Advanced Sample Preparation Approaches in Biological, Food, and Environmental Matrices: A Review. Molecules 2022, 27. [Google Scholar] [CrossRef]
  31. Pang, Z.; Chong, J.; Zhou, G.; de Lima Morais, D.A.; Chang, L.; Barrette, M.; Gauthier, C.; Jacques, P.E.; Li, S.; Xia, J. MetaboAnalyst 5.0: narrowing the gap between raw spectra and functional insights. Nucleic Acids Res. 2021, 49, W388–W396. [Google Scholar] [CrossRef] [PubMed]
  32. Câmara, J.S.; Perestrelo, R.; Berenguer, C.V.; Andrade, C.F.P.; Gomes, T.M.; Olayanju, B.; Kabir, A.; Rocha, C.M.R.; Teixeira, J.A.; Pereira, J.A.M. Green Extraction Techniques as Advanced Sample Preparation Approaches in Biological, Food, and Environmental Matrices: A Review. Molecules 2022, 27. [Google Scholar] [CrossRef] [PubMed]
  33. de Lacy Costello, B.; Amann, A.; Al-Kateb, H.; Flynn, C.; Filipiak, W.; Khalid, T.; Osborne, D.; Ratcliffe, N.M. A review of the volatiles from the healthy human body. J. Breath Res. 2014, 8, 014001. [Google Scholar] [CrossRef] [PubMed]
  34. Pang, Z.; Chong, J.; Zhou, G.; de Lima Morais, D.A.; Chang, L.; Barrette, M.; Gauthier, C.; Jacques, P.; Li, S.; Xia, J. MetaboAnalyst 5.0: narrowing the gap between raw spectra and functional insights. Nucleic Acids Res. 2021, 49, W388–W396. [Google Scholar] [CrossRef] [PubMed]
  35. Wishart, D.S.; Guo, A.; Oler, E.; Wang, F.; Anjum, A.; Peters, H.; Dizon, R.; Sayeeda, Z.; Tian, S.; Lee, B.L.; et al. HMDB 5.0: the Human Metabolome Database for 2022. Nucleic Acids Res. 2022, 50, D622–D631. [Google Scholar] [CrossRef] [PubMed]
  36. Riccio, G.; Berenguer, C.; Perestrelo, R.; Pereira, F.; Berenguer, P.; Ornelas, C.; Sousa, A.; Vital, J.; Pinto, M.; Pereira, J.; et al. Differences in the Volatilomic Urinary Biosignature of Prostate Cancer Patients as a Feasibility Study for the Detection of Potential Biomarkers. Cur. Oncol. in press. 2023. [CrossRef] [PubMed]
  37. Jala, A.; Dutta, R.; Josyula, J.V.N.; Mutheneni, S.R.; Borkar, R.M. Environmental phenol exposure associates with urine metabolome alteration in young Northeast Indian females. Chemosphere 2023, 317, 137830. [Google Scholar] [CrossRef] [PubMed]
  38. Buszewski, B.; Ulanowska, A.; Ligor, T.; Jackowski, M.; Klodzinska, E.; Szeliga, J. Identification of volatile organic compounds secreted from cancer tissues and bacterial cultures. J. Chromatogr. B Analyt. Technol. Biomed. Life. Sci. 2008, 868, 88–94. [Google Scholar] [CrossRef]
  39. Mills, G.A.; Walker, V. Headspace solid-phase microextraction profiling of volatile compounds in urine: application to metabolic investigations. J. Chromatogr. B Biomed. Sci. Appl. 2001, 753, 259–268. [Google Scholar] [CrossRef]
  40. Zhang, J.J.; Dong, X.; Liu, G.H.; Gao, Y.D. Risk and Protective Factors for COVID-19 Morbidity, Severity, and Mortality. Clin. Rev. Allergy Immunol. 2023, 64, 90–107. [Google Scholar] [CrossRef]
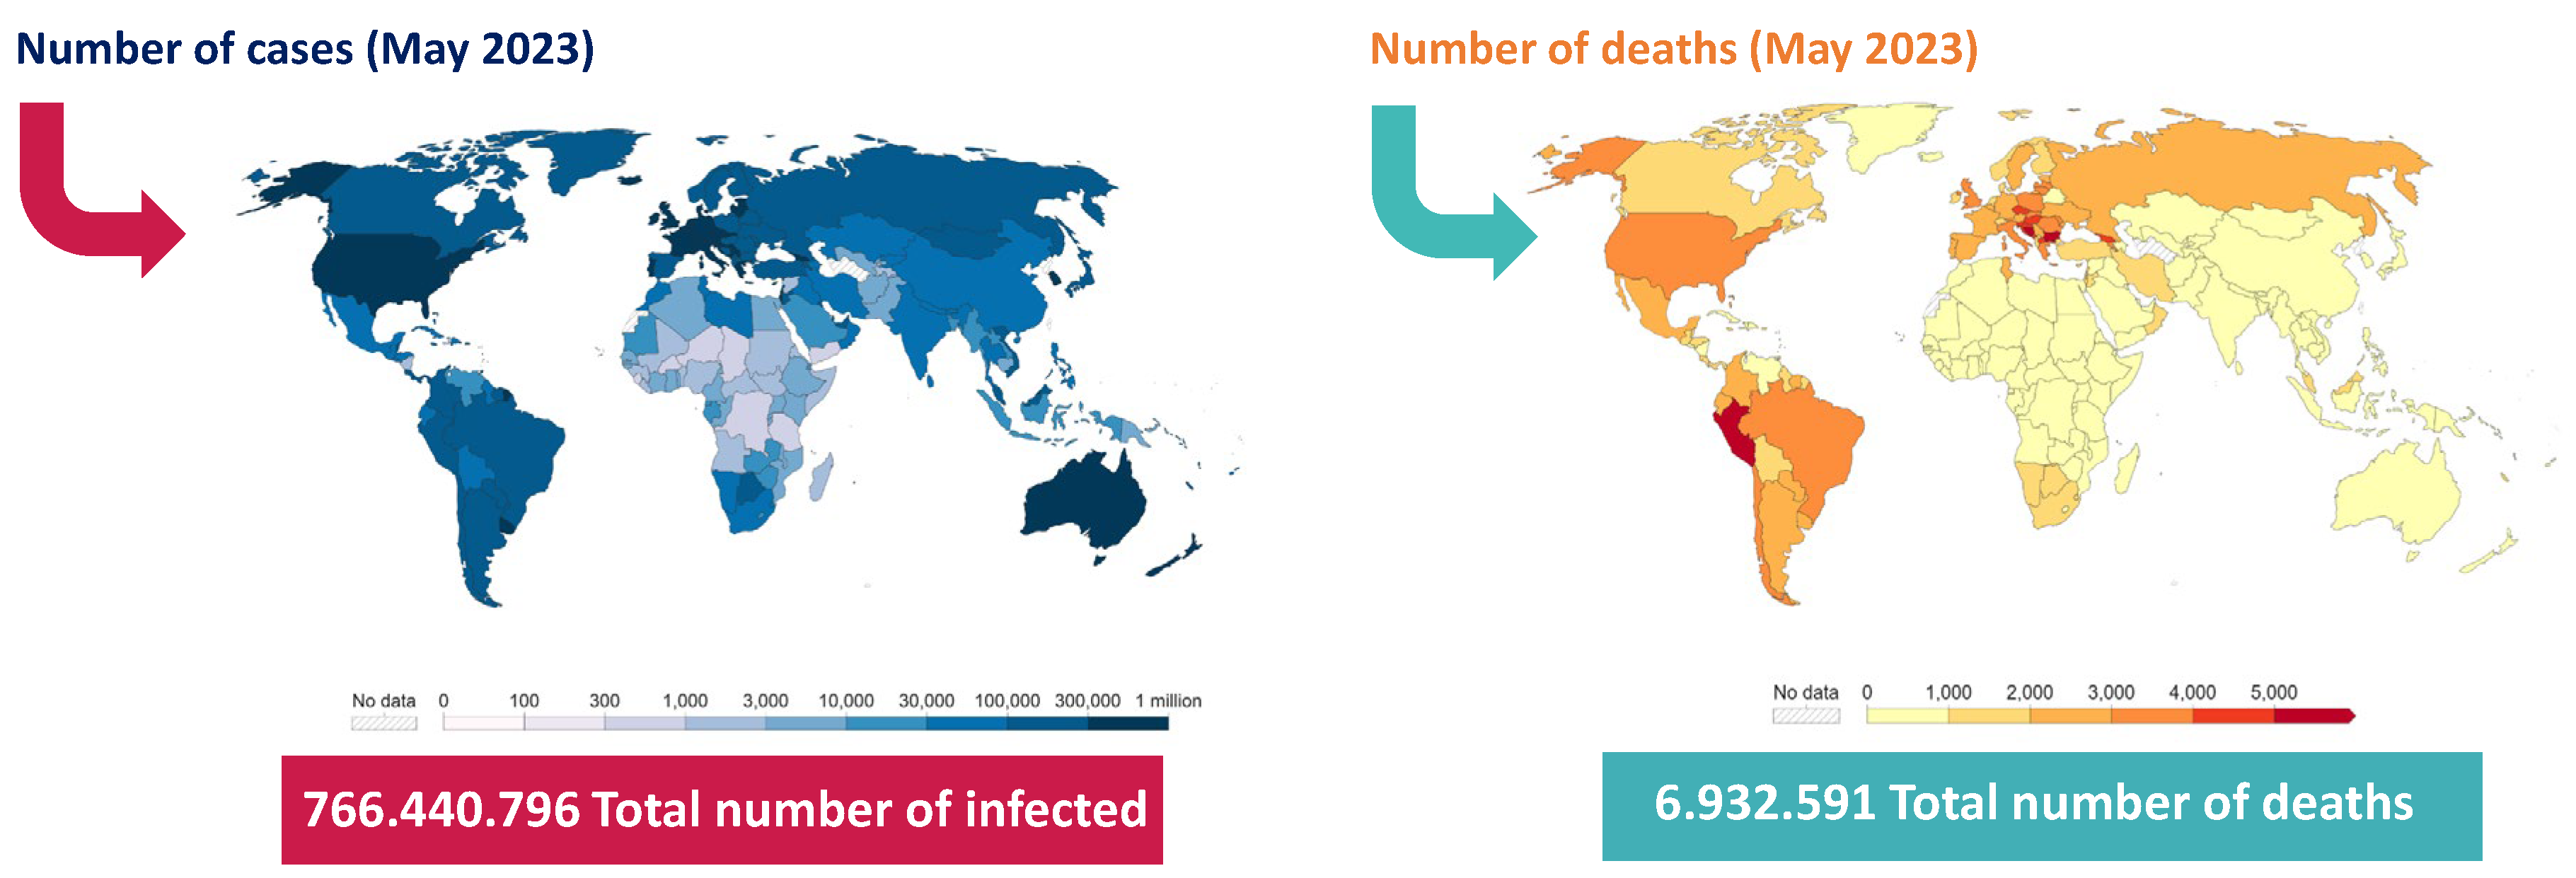
Figure 1. Impact of COVID-19 outbreak in terms of cases and deaths.
Preprints 103045 g001
Figure 2. Impact of COVID-19 outbreak in different fields of society.
Preprints 103045 g002
Figure 3. Distribution of total peak area of the chemical family in the control (CTRL, n = 42), COVID-19 (COVID, n = 61), and recovered (RECOV, n = 30) groups. The average peak areas were normalised areas obtained by the ratio between the peak areas of each VOM and the respective IS peak areas. ∑VOMs indicate the sum of different VOMs identified in each class; iVOMs indicate the number of VOMs identified in each recruited group and class. The RSD was less than 30%. Ter: Terpenes; PC: Phenolic Compounds; Nor: Norisoprenoids; Ket: Ketones; Alc: Alcohols; FC: Furanic Compounds; SC: Sulfur Compounds; ND: Naphthalene Derivatives; CA: Carboxylic Acid; Est: Esters; BD: Benzene Derivatives; Hc: Hydrocarbons; Ald: Aldehydes.
Preprints 103045 g003
Figure 4. Potential origins of urinary VOMs.
Preprints 103045 g004
Figure 5. Multivariate analysis of COVID-19 and control groups data. a) Application of partial least-squares discriminant analysis (PLS-DA) to the obtained data. b) Variables of importance in projection (VIP) scores plot, representing the important features identified by the PLS-DA. The coloured boxes on the right indicate the mean relative peak areas of the corresponding metabolites in the two group under study. c) 10-fold CV performance of the PLS-DA classification using a different number of components (* represents the best Q2 value, the best classifier). d) PLS-DA model validation by permutation tests based on 1000 permutations of the VOMs obtained by GC-MS of the urine samples from the groups under study.
Preprints 103045 g005
Figure 6. Multivariate analysis of COVID (infected) and RECOV (infected on the mend) groups data. a) Application of partial least-squares discriminant analysis (PLS-DA) to the obtained data. b) Variables of importance in projection (VIP) scores plot, representing the important features identified by the PLS-DA. The coloured boxes on the right indicate the mean relative peak areas of the corresponding metabolites in the two group under study. c) 10-fold CV performance of the PLS-DA classification using a different number of components (* represents the best Q2 value, the best classifier). d) PLS-DA model validation by permutation tests based on 1000 permutations of the VOMs obtained by GC-MS of the urine samples from the groups under study.
Preprints 103045 g006
Figure 7. Hierarchical clustering analysis. Heat map visualization using the top 15 metabolites with more significance by Spearman’s correlation of a) COVID (infected) and CTRL (control) samples and b) of COVID (infected) and RECOV (infected in the recovering stage) samples. Dendrogram analysis using Spearman’s distance measure and average linkage for c) COVID-CTRL and d) COVID-RECOV.
Preprints 103045 g007
Figure 8. Receiver Operating Characteristic (ROC) curves analysis for the predictive model with a com-bination of metabolites calculated from the logistic regression analysis using different metabo-lites selected by the VIP (> 1.0) values respectively for a) COVID-CTRL and c) COVID-RECOV. Predictive accuracy plot of biomarker models with an increasing number of features to discriminate between b) COVID and CTRL and d) COVID and RECOV. The most accurate biomarker model is highlighted by the red dots. Predicted class probabilities based on a structure of a 2 × 2 matrix to assess the performance of a classification model: e) COVID-CTRL groups; and f) COVID-RECOVERED groups.
Preprints 103045 g008
Figure 9. Boxplots of the most important variables (VOMs) for discriminating between (a) COVID-CTRL and (b) COVID - RECOV. MTA - 3-methoxy-5-(trifluoromethyl)aniline; TND - 1,1,6-Trimethyl-dihydronaphthalene.
Preprints 103045 g009
Disclaimer/Publisher’s Note: The statements, opinions and data contained in all publications are solely those of the individual author(s) and contributor(s) and not of MDPI and/or the editor(s). MDPI and/or the editor(s) disclaim responsibility for any injury to people or property resulting from any ideas, methods, instructions or products referred to in the content.
Copyright: This open access article is published under a Creative Commons CC BY 4.0 license, which permit the free download, distribution, and reuse, provided that the author and preprint are cited in any reuse.
Prerpints.org logo

Preprints.org is a free preprint server supported by MDPI in Basel, Switzerland.

Subscribe

© 2024 MDPI (Basel, Switzerland) unless otherwise stated