Preprint
Article

Preliminary Evaluation of Poly-(Sorbitol-Co-Citrate Adipate) Properties for Application as Biomaterial

Altmetrics

Downloads

80

Views

15

Comments

0

Submitted:

04 April 2024

Posted:

04 April 2024

You are already at the latest version

Alerts
Abstract
This study evaluated the stability of the Poly-(sorbitol-co-citrate adipate) with potential applica-tion in the biomedical area. Thus, the physical, chemical and microbiological stability of this was investigated. First, the chemical stability in alkaline phosphate buffer (pH 7.4) was evaluated for 5 days. In aqueous solution, the copolymer acidified the medium indicating the presence of residual citric acid. In the moisture absorption test the results obtained followed the pH, reinforcing the presence of citric acid. In the evaluation of the antimicrobial activity the results indicate that the copolymer did not allow the growth of the yeast Saccharomyces cerevisiae, as the only source of carbon. However, in the cell lysis phase and due to the restriction of access to nutrients in the culture medium, the copolymer showed a loss of mass due to its use by the microorganism. Thus, it presented biodegradability property under extreme conditions of cell culture.
Keywords: 
Subject: Chemistry and Materials Science  -   Polymers and Plastics

1. Introduction

In the last decade biomaterials have been responsible for a significant portion of products used in the health area [1]. Its uses are the widest and most varied, from biomedical devices (such as hemodialysis systems, blood circulation tubes and biosensors), implantable materials (such as plaques, bone substitutes, tendons, meshes, sutures, heart valves, lenses, teeth) devices for the release of drugs (in the form of films, implants and particles), artificial organs (such as kidney, liver, heart, pancreas, lungs, skin) and even dressings [2,3].
Biomaterials are devices that come into contact with biological systems and can be made of synthetic polymers, natural among other different chemical compounds, such as bioceramics, bioglasses, metals and etc. [3,4]. They can have different formats from solids, liquids, pastes to gels.
Among its advantages are its ease of manufacture and production in different formats, such as particles, films, wires, etc. [5].
Other prominent factors presented by polymeric biomaterials are their low cost, compared to other types of biomaterials and their ability to obtain with different chemical, thermal and mechanical properties, thus, it is possible to adjust its characteristics to the applications of interest [6].
Polymers are macromolecules consisting of covalent bonds between repeated units, the meros, along their main chain [7]. These are often obtained by polymerization reactions or via the action of microorganisms. These can be divided into two classes: synthetic polymers, derived from non-renewable or petrochemical sources, such as adipic acid that is derived from the oxidation reaction of cyclohexanol or cyclohexanone with nitric acid, having copper and vanadium as catalyst agents [8]. And natural polymers, also known as biopolymers, because they have natural origin such as alginate, chitosan, chitin, pectin and gums and the compounds used in this work such as sorbitol [9] and citric acid [10]. The studied copolymer poly-(sorbitol co-citrate adipate) is so named because it results from the junction of different "mere" citric and adipic acids that were polycondensated with sorbitol generating the copolymer and water as a byproduct. Adipic acid was used to provide hardness to the polymer, however, although it comes from a petrochemical source it is a biodegradable material. Thus, we understand that poly-(sorbitol co-citrate adipate) can be considered a biopolymer.
In this context, the present study presents a preliminary investigation of some biological properties, such as moisture absorption, degradation in aqueous medium and controlled pH and antimicrobial properties of poly-(sorbitol co-citrate adipate) application as biomaterial.

2. Materials and Methods

2.1. Materials

2.1.1. Reagents

The following reagents were used to study the synthesis of biopolymer: Sorbitol P.A. (Dynamic and Cromaline brands); adipic acid P.A (Dynamics); citric acid P.A. (Synth and Chemistry Brazil brands). Sodium chloride (VETEC), sodium phosphate (VETEC) and monobasic sodium phosphate (VETEC) were used in the preparation of the PBS buffer solution. Sodium phosphate (C.R.Q.), calcium chloride (PROCHEMICALS) and magnesium sulfate (SOFAR) were used to prepare the culture medium solution. All reagents have a content of more than 99 %.

2.1.2. Equipment

For the synthesis of polymer were used: stirrer and magnetic heater (IKA C-MAG MS10) and drying and sterilization oven (SOLIDSTEEL SSA 30 L); For counting in chamber Neubauer was used vortex mixer (VIXAR) and counting chamber (TIEFE -NEUBAUER). For absorbance measurements, spectrophotometer (GOLD SPECTRULAB 53) was used. For pH measurements, digital pH meter (DELLAB) was used.

2.2. Methods

2.2.1. Synthesis of the Copolymer

The polymerization was performed in a three-mouth flask of 100 mL, in which were coupled thermometer and Allihn column, properly cooled with water and connected with vapor retention system, arranged in a U-glass joint filled with silica gel. The system was kept under constant magnetic agitation and glycerin heating bath, in ambient atmosphere. The reactants were weighed in different proportions as shown in Table 1, transferred to the reaction system and heated to total fusion at approximately 120 °C ± 0.5 °C. The reaction was conducted for 2 h at a temperature of 135.0 ± 0.5 °C in the reaction medium. Soon after, it was proceeded with curing by heat treatment in greenhouse 80.0 ± 5.0 °C, to the ambient atmosphere for 8 days [11,12].

2.2.2. Evaluation of Atmospheric Humidity Absorption

Three samples of previously synthesized polymers (see Table 1) were weighed in an analytical balance (A having 1.0183 g, B having 1, 0092 g and C 0.9978 g). The samples were exposed to atmospheric air in the laboratory for 13 days, and daily had their mass determined in analytical balance. Atmospheric conditions of temperature and relative humidity were also recorded [13].

2.2.3. Degradation Test in Buffer Solution

Three samples of each polymer (A, B and C) were weighed in an analytical balance. These samples were then deposited in 25 mL of PBS buffer solution (pH 7.2) for 6 consecutive days because this pH value is close to the value found in human blood. The mass of the samples was determined after the first day, still wet, and on the sixth day, after being dried in an oven for 24 h at 50.0 ± 0.5 °C [14].

2.2.4. Degradation Test in Distilled Water

A sample of 2 g of each polymer (A, B and C) was weighed. These samples were immersed in 100 mL of distilled water and the pH of the solution was measured over 7 days with the aid of pHmetro [13].

2.2.5. Antimicrobial Test

2.2.5.1. Preparation of the Inoculum

In the preparation of the culture medium were used 140 mL distilled water; 0.7 g of yeast (Saccharomyces cerevisiae); 0.35 g of sodium phosphate; 0.35 g of calcium chloride and 0.35 g of magnesium sulfate. The polymers A, B and C were macerated in mortar and with pistil. In seven 125 mL Erlenmeyer 20 mL of culture medium were added, along with a small amount of the respective macerated polymers, except in the control, where only the medium with yeasts was added, without the presence of the polymer. Both were incubated for 4 days at 30.0 °C ± 0.5 °C. Each copolymer was evaluated by this methodology twice with tests labeled in the following order: A, B, C, and Control, where the letter represents the evaluated polymer and the numeral the respective repetition of the experiment [14].

2.2.5.2. Absorbance Count

Over the four days, samples were taken daily to read the absorbances in a spectrophotometer at 620 nm wavelength, which is a typical wavelength for cell counting [15].

2.2.5.3. Counting in Chamber Neubauer

Before counting, serial dilution was performed, being 1:10 > 1:100 > 1:1000. In this way it was possible to count the dilution 103. After this dilution the samples were passed in the vortex to homogenize the cell suspension and then the coverslip was placed on the chamber. With the aid of a pipette, 10 µl of sample was injected below the cover glass, above the chamber and brought to the microscope. The counting was performed in the quadrants of the extremities of the vertices of the chamber. The values of the four quadrants were then summed and the mean was determined. The real value of cell count was calculated by Equation 1 [14].
A = a × 10 × D i l u t i o n   r a t e
Where A and a are respectively the actual value of the cell count and the value counted by the analyst.

3. Results and Discussion

3.1. Evaluation of Atmospheric Humidity Absorption

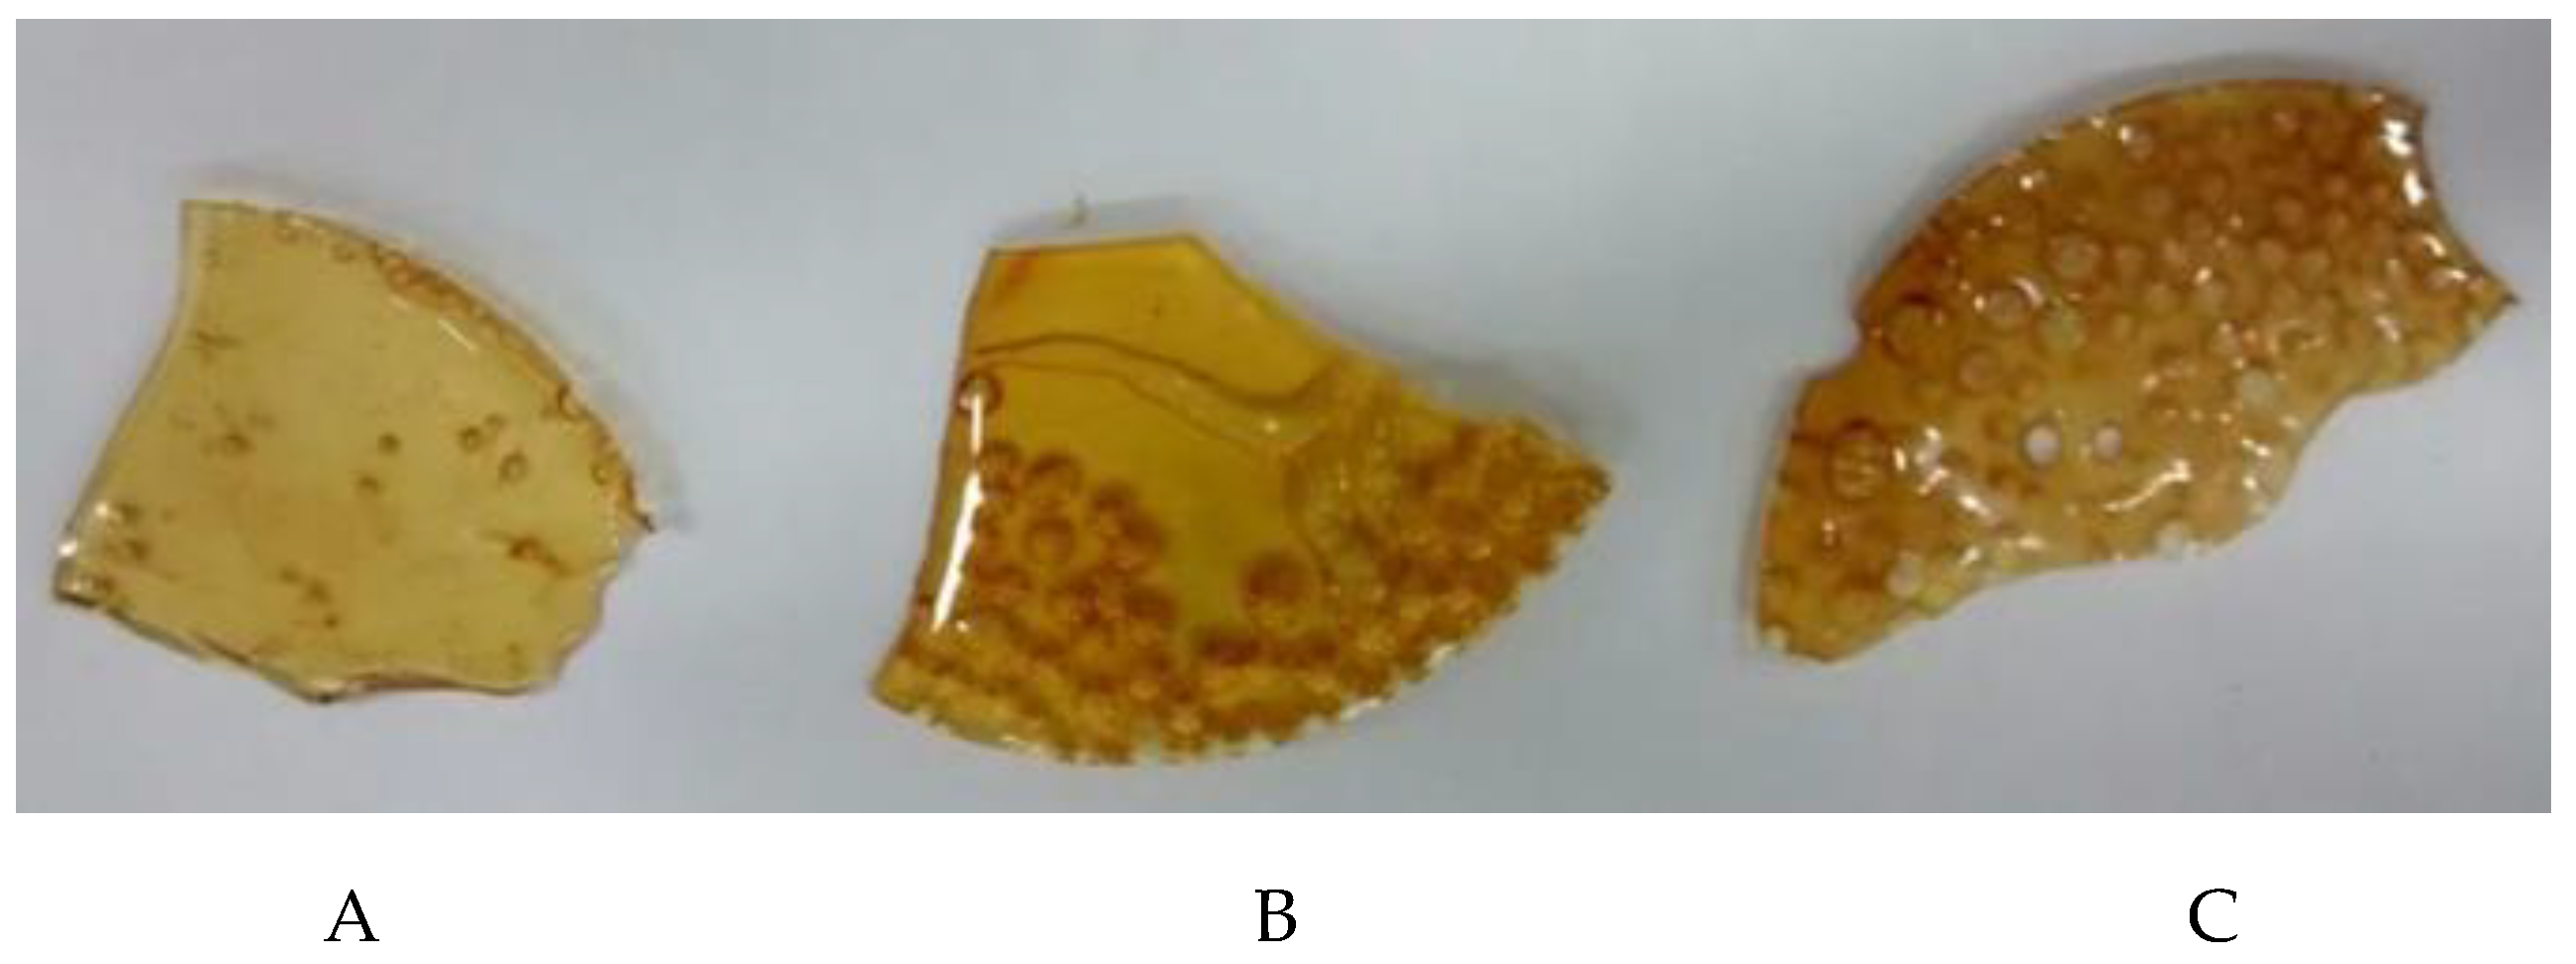
The phenomenon in which water molecules hydrate the polymer matrix is complex. Firstly, the water molecules diffuse into the spaces between the macromolecular chains due to intermolecular forces. In addition, fluid percolates into the microfractures, imperfections in the material produced during polymer synthesis, to fill these empty spaces. In addition to intermolecular forces, fluids tend to penetrate the polymer matrix due to capillarity [5] (Figure 1 and Figure 2).
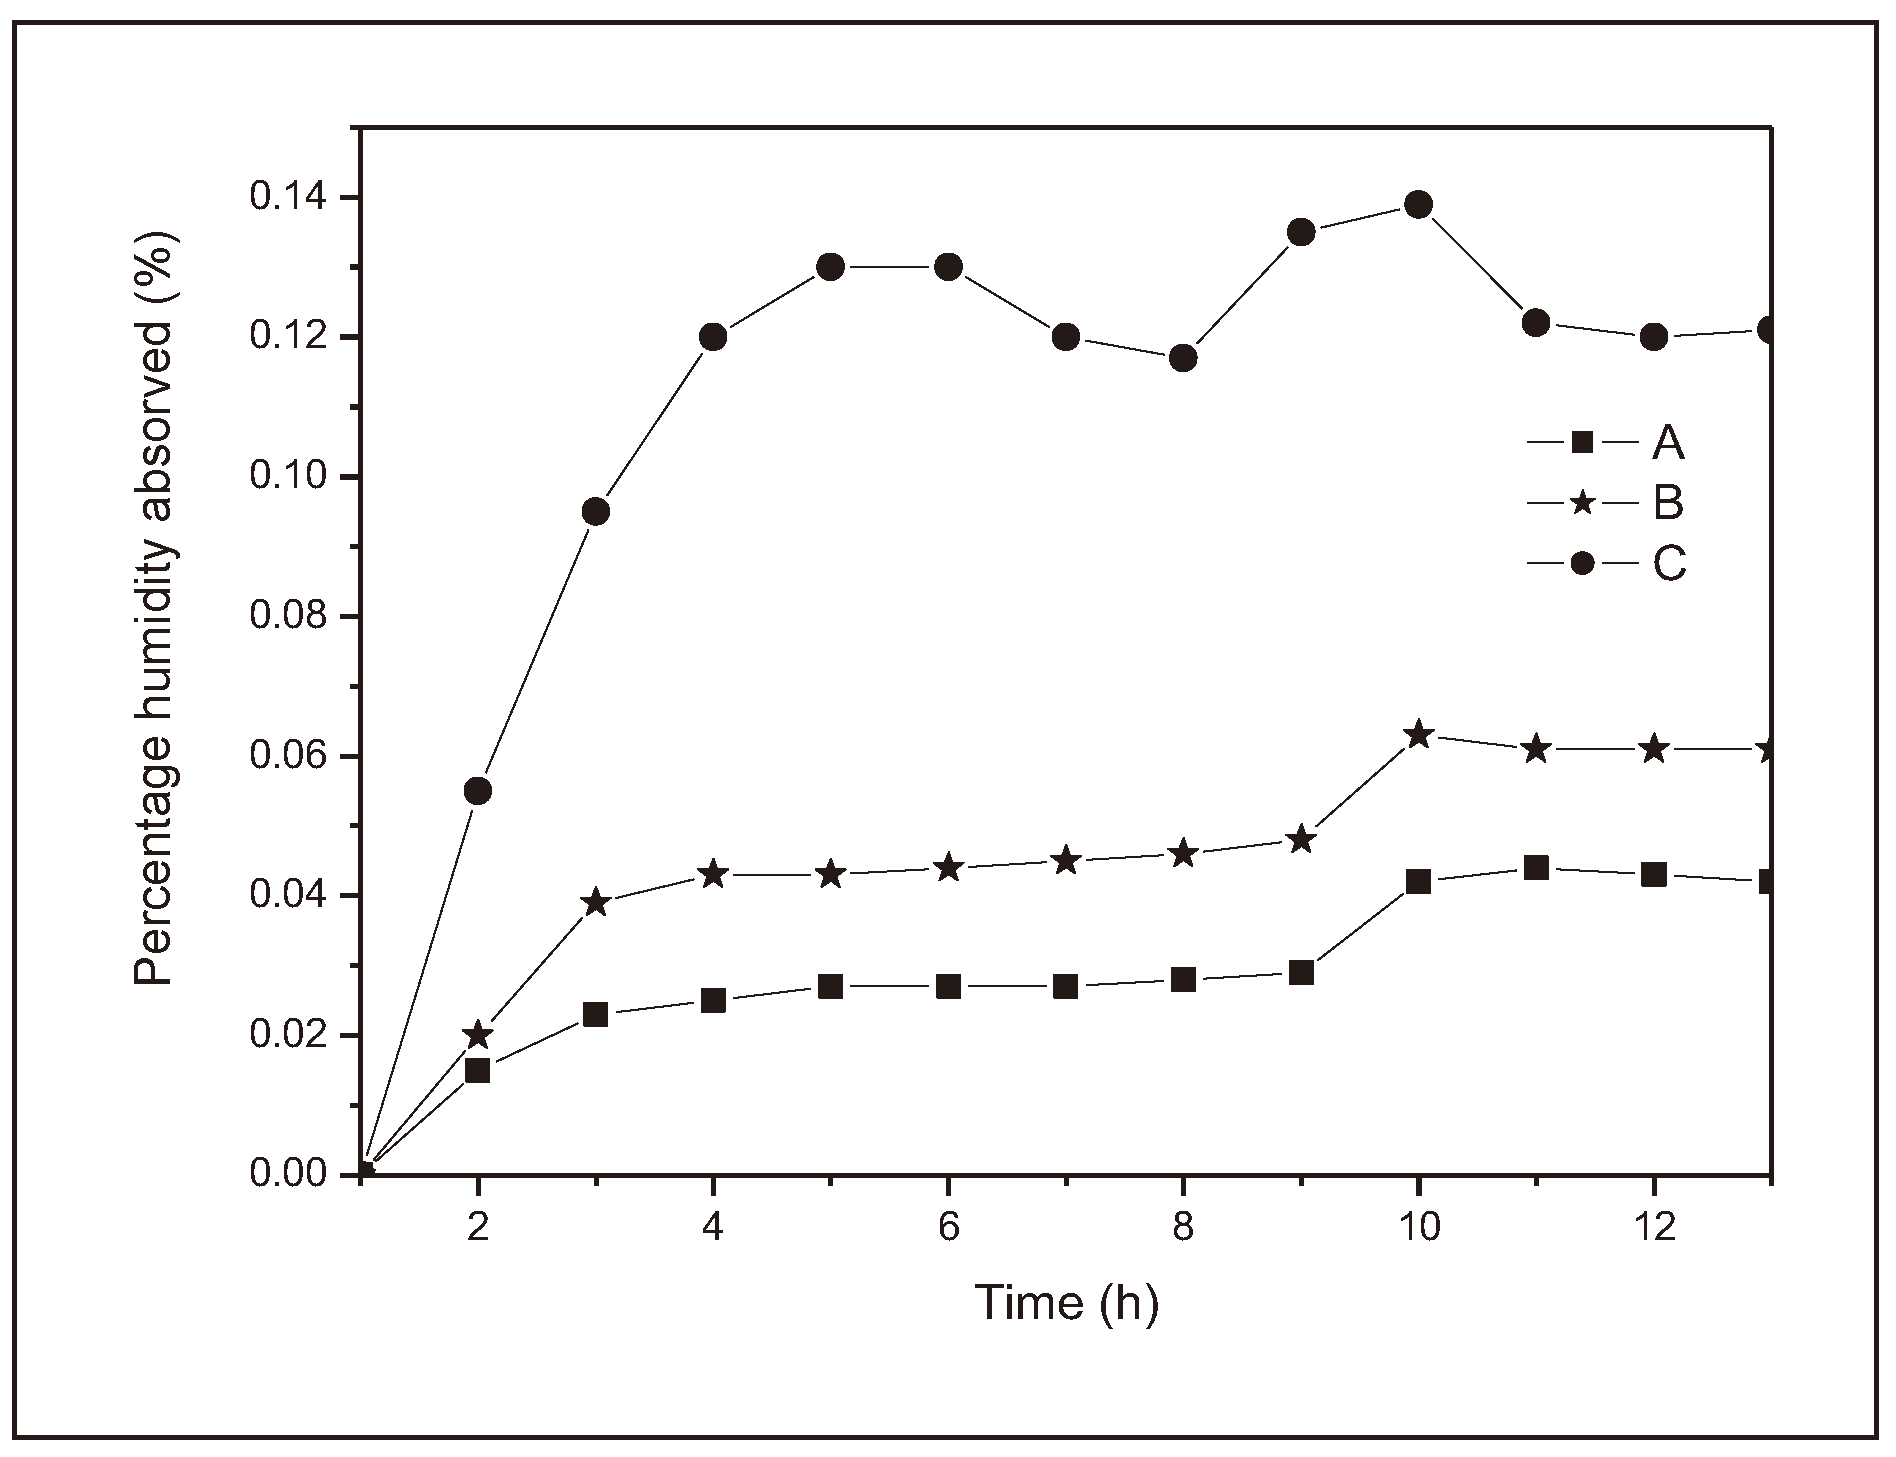
Over the course of the days, the selected samples had an average temperature of 25.5 °C, with a maximum of 25.9 °C and a minimum of 23.1 °C. The relative humidity remained between 60-70 %. Figure 3 illustrates the behavior of the samples evaluated over a 240 h.
As can be seen from Figure 3, of the three different polymers, polymer C absorbed the greatest amount of water, 12.45 % of its initial mass, polymer A absorbed the least amount of water, 3.44 % of its initial mass and B showed an intermediate behavior between A and C, absorbing 5.30 % of its mass. All the samples reached saturation on the sixth day of exposure, although there were fluctuations from the sixth day onwards (144 h) due to warmer or less humid days.
It can therefore be inferred that, as the presence of citric acid in the reaction medium increases, there is an increase in the material's ability to absorb water. Looking at the molecular structure of citric acid, it has seven oxygen atoms, while the adipic acid molecule has only two. The water molecule and the oxygenated functions of macromolecules interact with each other forming intramolecular hydrogen bonds resulting from the interaction between the oxygen and hydrogen atoms present in the organic functions of carboxylic acid and alcohol [7]. As a result, the greater presence of citric acid derivatives in the structure leads to an increase in the likelihood of hydrogen bond-type interactions and, consequently, greater hydrophilicity, i.e., the material's greater affinity with water.
However, citric acid on its own is very soluble in water (133 g/100 g of water) [10]. Thus, if there is residual citric acid intrinsically and/or impregnated in the polymer structure, an increase in the amount of this acid used would cause an increase in water absorption, also contributing to the result observed in Figure 3.
Similarly, the three polymers studied (A, B and C) reach a saturation point, and its value fluctuates due to environmental variations, i.e., a maximum degree of hydration that is not exceeded (Figure 3). However, there is a need for very precise control of environmental conditions to assess this occurrence and confirm whether the oscillations are due to variations in environmental conditions.
The curves produced by polymers A and B (Figure 3) behave very closely, reaching saturation on the sixth day. It showed some oscillations between the sixth and tenth days due to variations in environmental conditions, as already discussed, and a slight but continuous decrease from the tenth day onwards, possibly resulting from the start of the polymer degradation process due to the breakdown of hydrolysable bonds. Curve C (Figure 3) showed the same saturation time, however, the oscillations due to environmental conditions were much more severe and did not allow for further observations. Table 2 shows the molar ratio of citric acid to sorbitol and the percentage mass variation on the sixth day.
As can be seen in Table 2, doubling the molar proportion of citric acid from 0.5 to 1 resulted in an increase in water absorption of around 50 %. However, when this proportion was doubled again from 1 to 2, there was an increase of approximately 135 % in the initial mass. Considering the proximity between the curves of A and B (Figure 3) and the marked increase in water absorption of C compared to A and B (Table 2), there are indications that there is a considerable amount of residual citric acid in sample C, while the same conclusion cannot be made with the present test for samples A or B.
Similar results were obtained [16] when analyzing water absorption by the polymer class poly-(sorbitol sebacate citrate). As the author increased the proportion of sebacic acid (correlated to adipic acid), the final material began to absorb less water. The authors attribute this tendency to the greater presence of long, hydrophobic chain portions. On the other hand, the increased presence of citrate in the material led to a drastic improvement in hydrophilicity due to the oxygenated groups. The percentage gain for the class of polymers mentioned ranged from 1.14 % to 12.84 % [16].
One of the ways in which polyesters degrade is through the chemical breakdown of hydrolysable bonds. The hydrolysis reaction is the reverse reaction to the esterification reaction, i.e., the reverse process of polymer synthesis. If this process takes place in an acidic environment, acid and alcohol are formed. If it takes place in an alkaline environment, a carboxylic acid salt and water are formed [7].
For any technological application that the biopolymer studied may have, account must be taken of how long the material takes to break down, otherwise early degradation could cause harm to the patient's health. It is therefore necessary to understand the speed at which the developed polymer degrades. In this way, we can establish suitable applications for the material and its time of use.
Blood pH is known to be between 7.35 and 7.45 [17]. Therefore, the buffered pH of 7.2 was defined as the fixed value for evaluation, due to the proximity of this value to the natural pH value of human arterial blood. In this test, samples of polymers A, B and C are submitted to an aqueous solution at a stable pH of 7.2 maintained by a phosphate-salt buffer. This is considered relevant as it approximates the behavior of the medium-polymer system and at the same time is an indication of the biodegradability of the material, although no living organisms are used in this process. Table 3 shows the percentage decrease in mass for polymers A, B and C after three days of degradation.
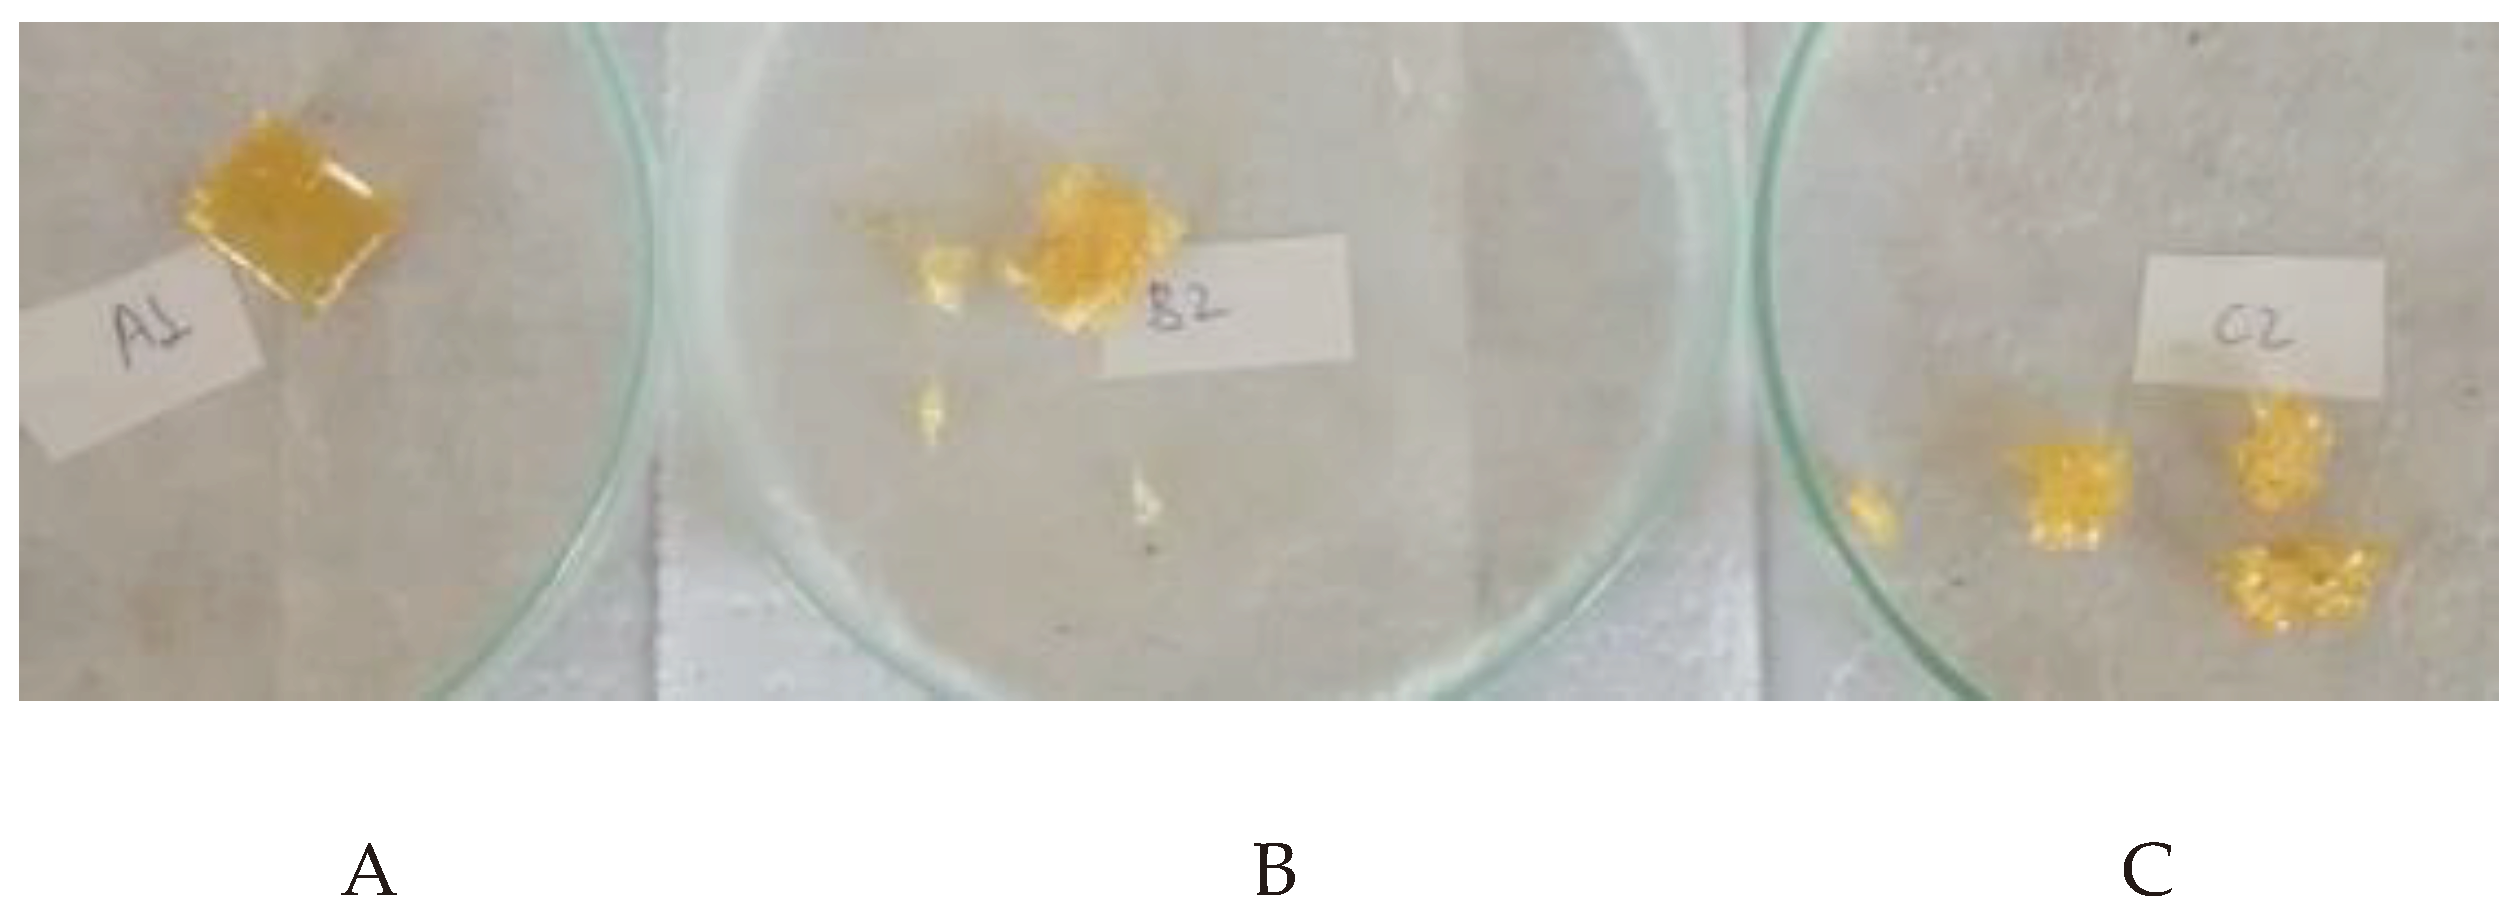
Of the samples analyzed, the one with the smallest decrease in mass (0.66 %) was the polymer A sample, i.e., the one with the lowest proportion of citric acid. The greatest mass loss was in sample C (45.56 %). Polymer B showed an intermediate result between A and C of 20.98 %. The results show that the loss of mass follows the increase in citric acid. Figure 4 shows the polymers after degradation and drying.
Figure 4 shows that the degradation of the samples followed the trend of mass loss shown in Table 3. Polymer C disintegrated the most, while polymer A remained practically intact after exposure to the buffer solution (Figure 4). These results show that there was increasing degradation of the material as the proportion of citric acid increased.
There are two possible hypotheses for this trend. The first is that the polymer synthesized with a greater presence of citric acid in the reaction medium is intrinsically more degradable than those with a lower presence. The improvement or worsening of a material's chemical degradability is due to the profile of the chemical bonds that make up the macromolecule, i.e., depending on the ligands involved, a given chemical bond would be susceptible to cleavage by a water molecule. However, assertions to this effect would require an in-depth study of the structure of the macromolecule to understand how the linkage was achieved.
Another possible, and more likely, hypothesis is that the excess reagent content remained residually in the polymer structure, i.e., as the proportion of citric acid increased, this substance remained, in whole or in part, as excess reaction. If the citric acid had remained as an excess, the result would be that it would quickly solubilize due to its high solubility in water, causing damage to the integrity of the solid. In addition, it is known that ester hydrolysis is catalyzed by acid [7,19] and it is likely that the greater presence of acid would increase the speed of the biopolymer degradation reaction, although it is difficult to precisely state the relationship between acid catalyst concentration and reaction speed and this is only a qualitative analysis [19].
In their work, [16] obtained degradation times that varied considerably for the compositions of poly-(sorbitol sebacate citrate). In six days of experimental tests, the sample that degraded the most was composed of 1:1:1, which degraded 100 % on the sixth day. When the author reduced the citric acid composition to 0.5, degradation became slower, reaching around 75 % on the sixth day. It is important to note that although the reaction systems in the present work and in the research by [16] were similar, there was dissonant behavior at this point.
Due to the uncertainties produced at this stage, it was decided to follow the hydrolysis reaction, but this time in an unbuffered medium as a way of evaluating the pH profile over time to produce firmer conclusions at a low experimental cost.

3.2. Degradation Test in Distilled Water

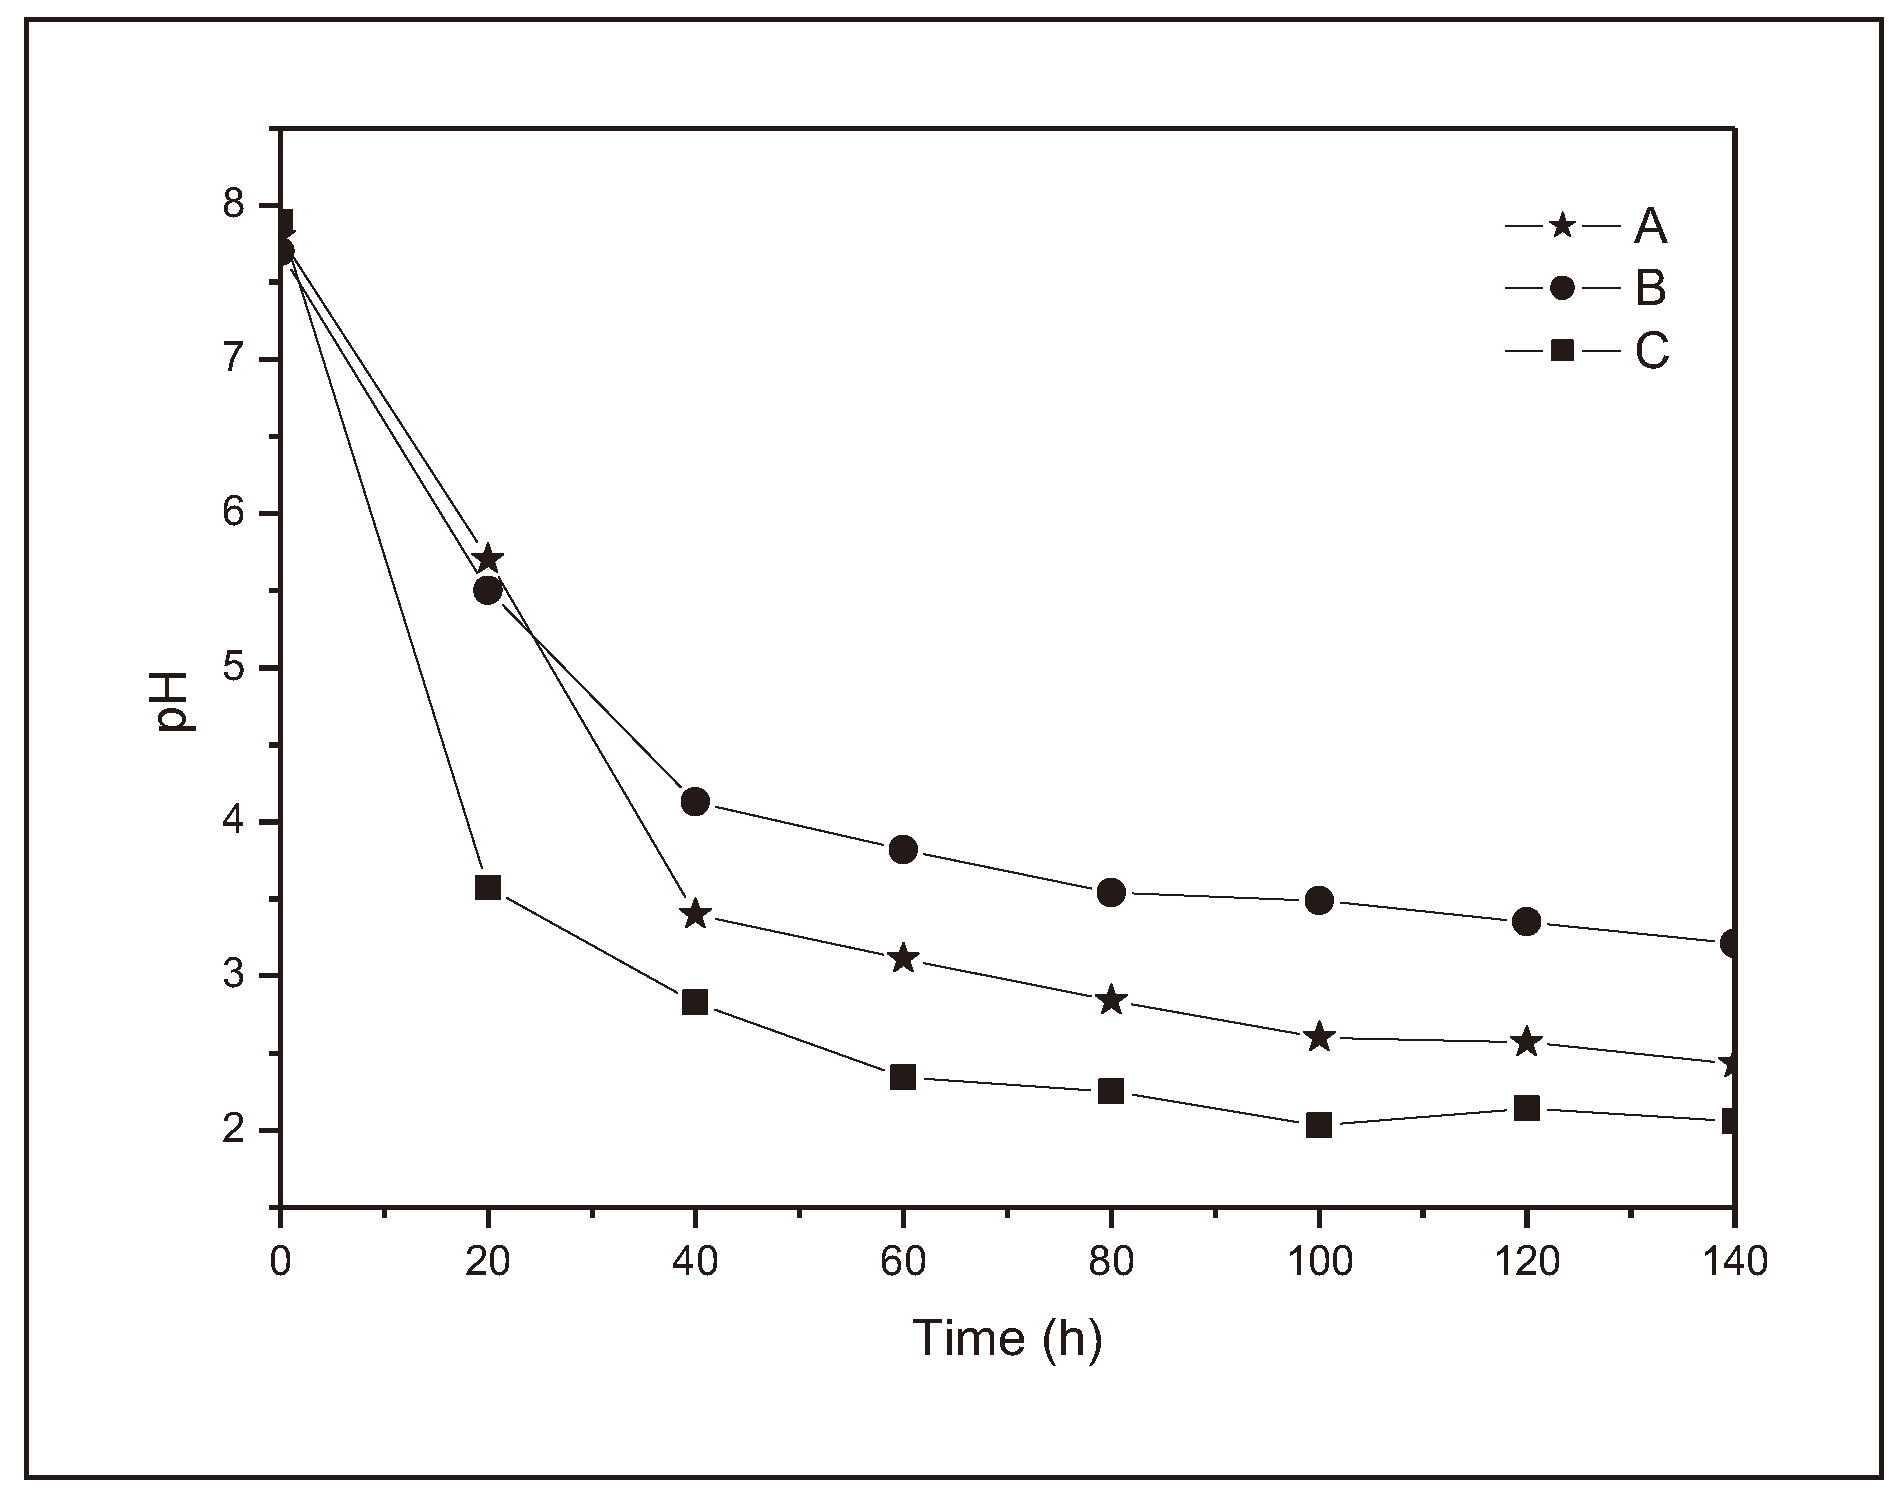
For the water degradation test, the variation in pH over time was evaluated, as it is a relevant piece of data regarding the behavior of the three polymers in solution. Insofar as an increase in pH is to be expected, these are esters that hydrolyze, acidifying the medium. Figure 5 shows the behavior of the samples over 140 h.
All the samples showed similar behavior once submerged in distilled water. The pH measured before insertion was 7.89, i.e., slightly basic. The pH of the medium dropped dramatically in the first hour after the samples were placed, as can be seen in Figure 5.
During this period, the sample that allowed the greatest acidification of the medium was sample C (up to pH 2.87). The sample that allowed the least acidification of the medium was sample A (up to pH 5.47). Sample B showed an intermediate value between A and C with a pH of 3.50. This drastic drop in pH value can be attributed to the presence of excess citric acid in the polymer crosslinker. In fact, if we compare the results obtained in the test in water with buffer and analyze the marked absorption of moisture in this material, we conclude that there is residual citric acid and that once in solution it quickly solubilized causing acidification of the medium. Figure 5 shows that the polymer that caused the greatest drop in pH was polymer C, followed by B and finally A.
In the final part of the graph, the pH of the medium decreased more smoothly. However, if you look closely, you can see that the lines relating to polymers A and B are almost parallel from 20 h onwards; on the other hand, the line relating to polymer C is close to horizontal. There is a similarity between A and B because, although polymer B has residual acid, this increase was not enough to make the solubilization phenomenon more pronounced than the polymer hydrolysis phenomenon. On the other hand, the fact that the C line is almost horizontal means that a large part of the sample is made up of excess acid and was therefore solubilized quickly at the start of the experiment. After 5 days, sample A reached pH 3.29, B 2.42 and C 2.01. Table 4 summarizes the results obtained [20,21].
It can therefore be concluded from the distilled water tests, tests in distilled water with PBS buffer and the atmospheric humidity exposure test, that there is a hydrophilic polymer in all the polymer compositions evaluated. It is also concluded that the best composition of the medium is one with low concentrations of citric acid.
Thus, based on the definition proposed by [19] citric acid [10] should be used as a crosslinking agent, i.e., as a "bridge" between macromolecular chains [22,23]. Furthermore, this same acid, for the system in question, did not prove to be a satisfactory building block for chain increase [3]. Therefore, based on the experimental data, it is believed that the best molar ratio is around 1 mol of sorbitol to 0.5 mol of citric acid to 1 mol of adipic acid, although it would be interesting to evaluate even lower concentrations of citric acid or values slightly higher than 0.5 of citric acid in relation to sorbitol.

3.3. Antimicrobial Test

One of the important aspects of developing biopolymers for potential biomedical applications is evaluating their behavior in biological systems. Although biocompatibility testing of a material involves a series of extensive procedures aimed at guaranteeing the safety of the application of the developed material, one of the practical options for analyzing the behavior of a polymer in biological systems is to carry out antimicrobial tests. These tests are an assessment of how the presence of a given material limits or aids the growth of certain cultures of microorganisms in specific media.
[15] evaluated the properties of agarose biofilm in inhibiting the growth of cultures of Staphylococcus aureus (UFPEDA 02), Pseudomonas aeruginosa (UFPEDA 416) and Candida albicans (UFPEDA 1007). This author proposes diffusion tests in which the biofilm is in contact with the microorganisms in Mueller-Hinton (bacteria) and Sabouraud (yeasts) liquid culture media. They are incubated at 37 °C for 24 h for bacteria and 48 h for yeasts. In this way, cell growth is assessed by comparing the turbidity value of the culture media enriched with biofilms (biopolymers) with a control (free of microorganisms).
In this work, we propose changes in the methodology that consists in using poor culture media as a substrate for growth of microorganisms, that is, using a medium that contains only the micronutrients necessary for cell growth, but that had restrictions on the number of macronutrients. Thus, we try to force the yeast culture (Saccharomyces cerevisiae) to use the biopolymer itself as substrate for its growth. However, in the case of drastic conditions for the growth of microorganisms, it is chosen to perform an experiment that would last 48 h, as proposed by [15] using a longer time so that there is time for measurable cell growth.
Although the literature uses visual analysis to determine the positive response of the antimicrobial test, it is chosen to evaluate the growth.

3.4. Quantifying Cell Density by Absorbance

Quantifying cell density by absorbance is an indirect technique that is sensitive to variations in the turbidity of the medium. With the exponential multiplication of cells within the culture medium, the light incident on the sample is partially absorbed and this loss is then correlated to the concentration of the medium in cells.
Seven 125 mL conical flasks were used, into which the culture medium and each of the biopolymers were inserted, except for the control in which there was only culture medium. Before being inserted, the polymers synthesized in this work were sprayed. The available samples of polymers B and C were reduced to a suitable size, but the polymer called "A", due to the properties of this material, could only be partially reduced to smaller pieces. All samples were incubated for 96 h at 30 °C. The tests were carried out in duplicate. The results of the average absorbance values obtained over time are listed in Table 5.
According to the results obtained, all the polymers synthesized (A, B and C) showed similar values for absorbance, with values in the 2.3 to 2.6 % range.
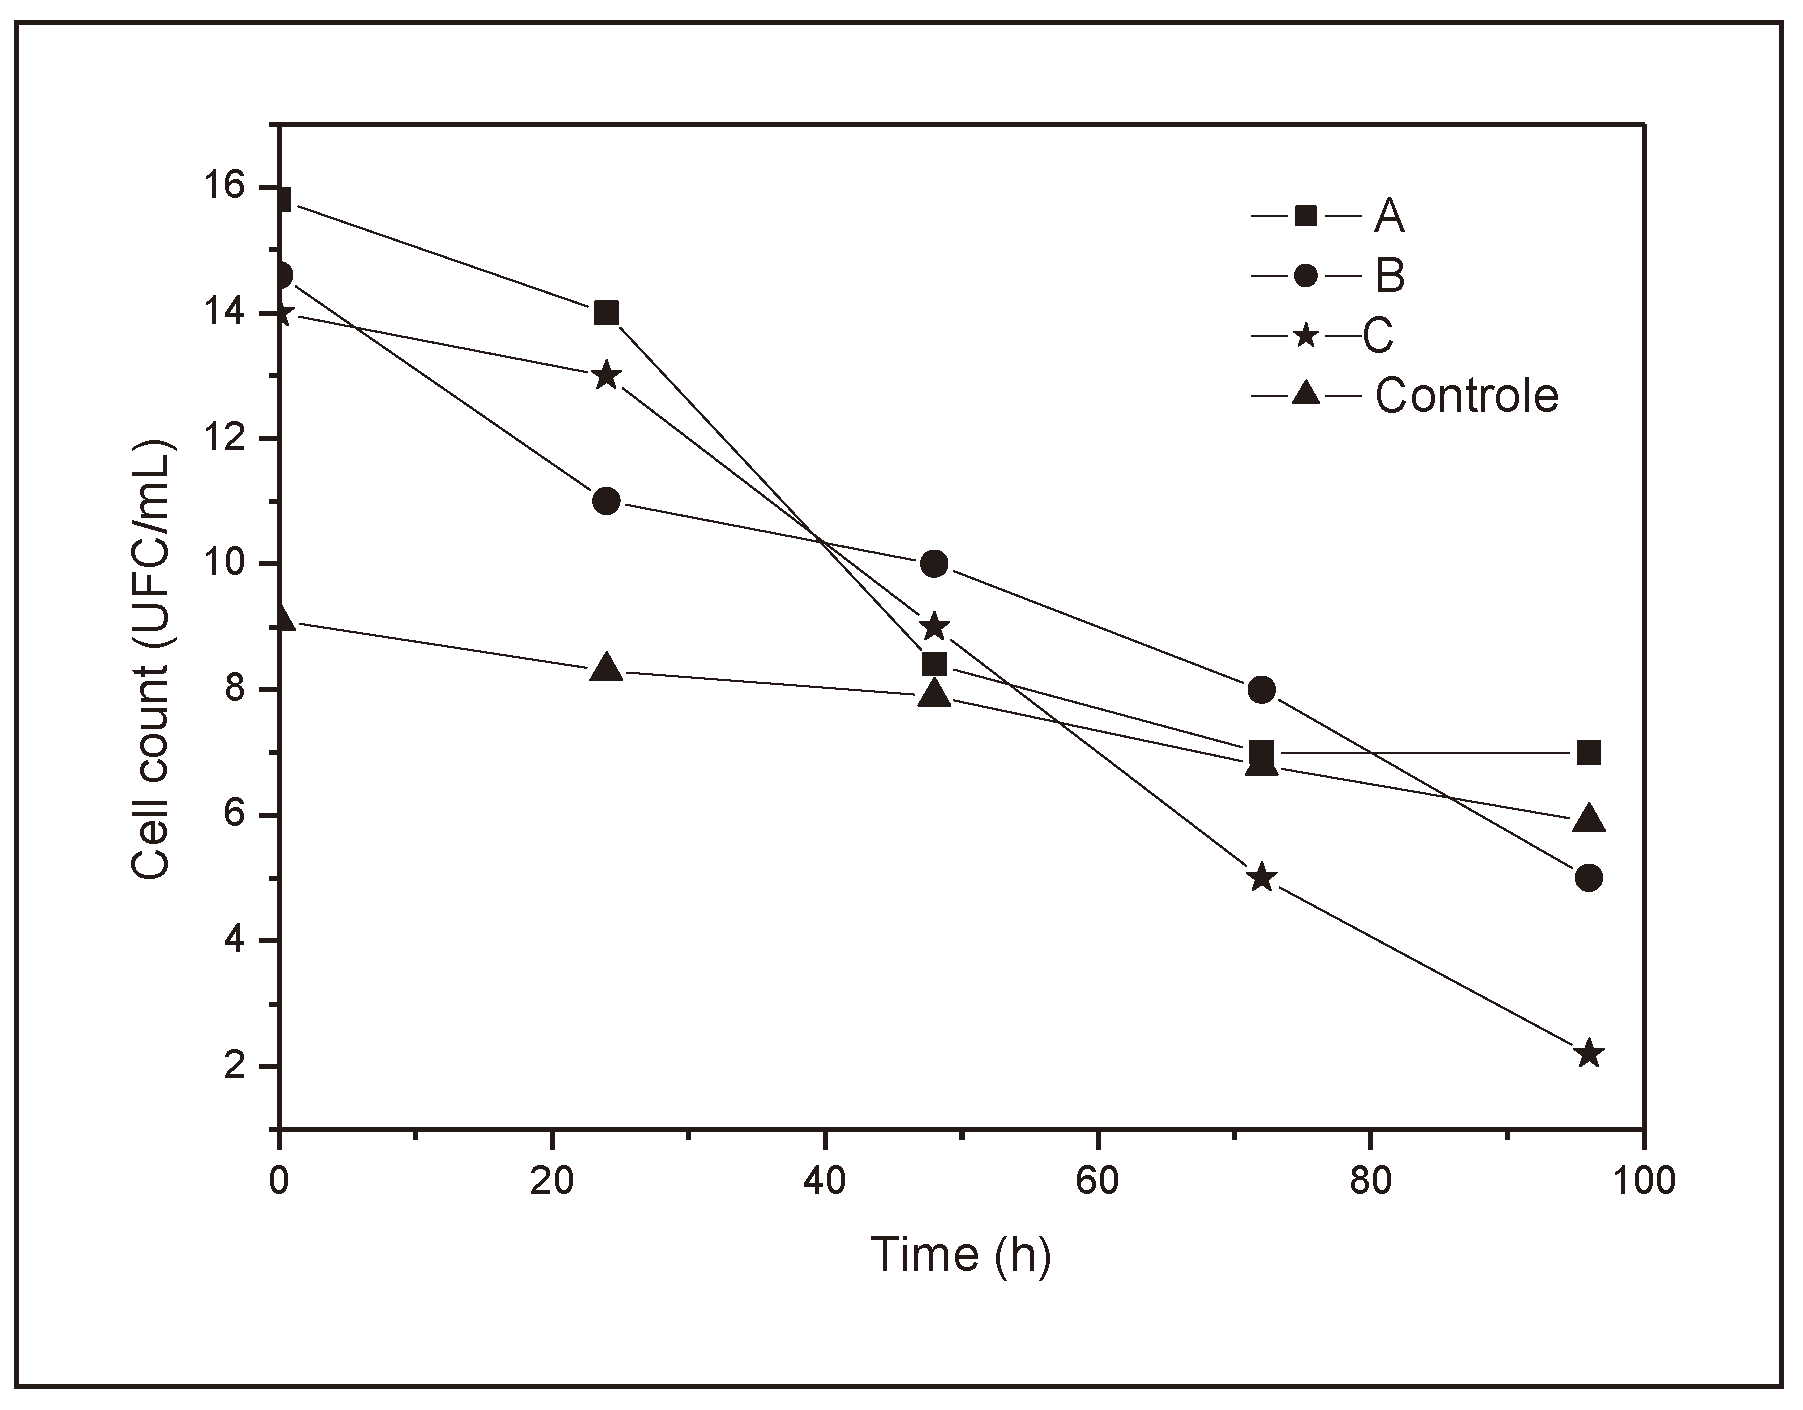
It can be seen in Figure 6 that all the samples showed more pronounced cell growth between the first and second day and on the third day. However, from the fourth day onwards, cell growth was slower, i.e., they showed a curve with behavior characteristic of microbial growth. However, sample C was the only one that showed values capable of surpassing the growth shown in the control, while A and B, despite showing a typical cell growth curve, were always below the control, suggesting some inhibition of growth. However, the very presence of the polymers can alter the absorbance values of the medium as they are solid particles [17].
Considering the above, it can be concluded that there was slight growth in all the culture media. However, the results are not sufficient to determine the causes of the difference in growth between the polymers, so we moved on to a direct cell count, the Neubauer chamber count.

3.5. Cell Count in the Culture Medium Containing the Polymers Studied

The Neubauer chamber was used for cell counting. Due to the high concentration of cells, it was necessary to carry out serial dilutions of 1:10, 1:100 and 1:1000. In this way it was possible to count at a dilution of 10-3.
After this dilution, the samples were vortexed to homogenize the cell suspension and then a coverslip was placed over the Neubauer chamber. Using a pipette, a small amount of approximately 10 µL of the sample was injected below the coverslip and above the chamber and taken to the microscope.
As yeast is a larger cell, the quadrants close to the vertex of the coverslip were counted. The values for each polymer are added together and the average is calculated by multiplying by the dilution factor. The results are summarized in Table 5.
Once again, to make the results more comprehensible, the data was plotted on curves versus the period. The curves are shown in Figure 6.
Looking at Figure 6, the growth behavior of the S. cerevisiae yeast in the presence and absence (control) of the polymer studied is similar and like the control, between the second and third day of testing, with a slight growth of cells in contrast to an exponential growth expected for a medium rich in macronutrients. After this period, there was a sharp decrease in the number of cells in the medium, most likely due to the exhaustion of energy resources. The values for polymer B are distant from the data set, probably due to a smaller number of cells in the inoculation phase, which resulted in a translated curve.
[15] in his work, in which a biopolymer was produced from agarose incorporated with silver nanoparticles, evaluated the antimicrobial activity of the nanoparticles once added to the biopolymer. Agarose is known to be a substance rich in macronutrients. As such, it is an important carbon source for cell growth, which results in an exponential increase in the cell population. Biopolymers of this type are rapidly consumed by bacteria and transformed into biomass, carbon dioxide and water, which is the very definition presented by the European Committee for Standardization for the process of biopolymer degradation [4].
Thus, the author's hypothesis was that by introducing the nanoparticles, antimicrobial activity could be observed for the bacteria S. aureus, P. aeruginoia and C. albicans. However, the results of the liquid test only showed inhibition of S. aureus. In the present study, slow cell growth (characteristic of a medium poor in macronutrients) was observed, unlike [15], probably due to the absence of additional carbon sources in the medium. However, under drastic conditions the yeasts used the biopolymer as a carbon source, reducing their rate of population decrease in the death phase.
Considering that there was growth in the culture medium at values and trends very close to the control, it is believed that the yeast colony was indifferent to the presence of the polymer in the growth phase, i.e., the growth curves were similar for the set of data obtained. However, in the yeast death phase, the cell population decrease was slower, indicating the use of the polymer as a substrate. Thus, for the microorganism evaluated, the biopolymer proved to have non-antimicrobial characteristics, although it was used under drastic conditions as a substrate, with a biodegradable character [15].

4. Conclusions

After synthesizing biopolymers with promising applications, their behavior in a 7.2 buffer solution was evaluated. The sample that lost the most mass over the period evaluated was polymer C, followed by B and A. This fact makes it possible to raise two hypotheses: (1) additions of citric acid impair the cross-linking of rubber or (2) the addition of citric acid in experiments B and C was in excess during the course of the reaction and, at the end, remained in excess between the macromolecular chains.
In the moisture absorption test, once exposed to the atmosphere, the behavior of the samples remained similar to that observed in the test with the buffer, with C absorbing a greater amount of atmospheric moisture, 12.60 %, followed by B with 5.66 % and A with 3.71 %. Note that the percentages are in relation to the dry sample mass.
In addition, when the test is carried out in distilled water, the hypothesis that there is unreacted citric acid is more appropriate. As can be seen in Figure 16, there was a drastic drop in the pH of the medium as soon as the samples were inserted and, after this period, the decrease was considerably milder.
From the tests carried out, it was concluded that citric acid, in high concentrations, remained in excess in the medium and, in view of this fact, for future work it is suggested to improve the proportion of citric acid in such a way that it does not remain in the post-synthesis. The hydrophilic nature of the material is also noteworthy.
The antimicrobial nature of the polymers developed was also assessed through a test which consisted of macerating samples of all three polymers and separately inserting each polymer into a medium incubated with yeast (Saccharomyces cerevisiae). A medium low in macronutrients was prepared so that the cells were forced to consume the polymer as a substrate.
Over four days, the cells were counted using an indirect method, spectrophotometry, and a direct method, chamber counting. From the results obtained, it was concluded that in the growth phase, the yeasts were indifferent to the polymer; however, in the death phase, the samples containing polymer had a slower population decrease, indicating consumption of the polymer as a substrate. Thus, for the microorganism evaluated, the biopolymer proved not to be antimicrobial, although it was used under drastic conditions as a substrate, suggesting that it was biodegradable.

Author Contributions

Conceptualization, R.C.Z.L.; methodology, R.C.Z.L., B.S. and A. De U. T.; validation, R.C.Z.L., B.S. and A. De U. T.; formal analysis, R.C.Z.L., B.S. and A. De U. T.; investigation, A. De U. T.; resources, R.C.Z.L.; writing—original draft preparation, R.C.Z.L., B.S. and A. De U. T.; writing—review and editing, R.C.Z.L. and B.S. and visualization, R.C.Z.L.; supervision, R.C.Z.L.; project administration, R.C.Z.L.; funding acquisition, R.C.Z.L. and A. De U. T. All authors have read and agreed to the published version of the manuscript.

Funding

This work was supported by the Federal University of São João del Rei/UFSJ.

Institutional Review Board Statement

Not applicable.

Informed Consent Statement

Not applicable.

Data Availability Statement

Data are contained within the article.

Acknowledgments

The authors would like to thank the financial and infrastructure support of the Federal University of São João Del Rei/UFSJ, the National Council for Scientific and Technological Development (CNPq) and the Coordination for the Improvement of Higher Education Personnel (CAPES).

Conflicts of Interest

The authors declare no conflicts of interest.

References

  1. Xu, R.; Fang, Y.; Zhang, Z.; Cao, Y.; Yan, Y.; Gan, L.; Xu, J.; Zhou, G. Recent advances in composite hydrogels: synthesis, classification, and application in the treatment of bone defects. Biomater. Sci. 2024, 12, 308–329. [Google Scholar] [CrossRef]
  2. Zheng, Y.; Du, Y.; Chen, L.; Mao, W.; Pu, Y.; Wang, S.; Wang, D. Recent advances in shape memory polymeric nanocomposites for biomedical applications and beyond. Biomater. Sci. 2024. [CrossRef] [PubMed]
  3. Oleksy, M.; Dynarowicz, K.; Aebisher, D. Advances in Biodegradable Polymers and Biomaterials for Medical Applications—A Review. Molecules 2023, 28, 6213. [Google Scholar] [CrossRef] [PubMed]
  4. de Oliveira, B.K.; Balzaretti, N.M.; Buchner, S. Biovidros e Biovitrocerâmicas: uma revisão sobre suas propriedades. Ciência e Natura. Santa Maria 2023, 45, 28–46. [Google Scholar] [CrossRef]
  5. Alaneme, K.K.; Oke, S. Water absorption characteristics of polyester matrix composites reinforced with oil palm ash and oil palm fibre. Usak University Journal of Material Sciences 2013, 2, 109–120. [Google Scholar] [CrossRef]
  6. Santos, M.G.; Araújo, J.; Carmo, C.; Santos, L.; Botelho, M.F.; Laranjo, M.; Sobral, A.J. Synthesis and in vitro biocompatibility studies of novel alkoxy 4,4-difluoro-4-bora-3a,4a-diaza-s-indacenes. Materials 2023, 16, 7085. [Google Scholar] [CrossRef] [PubMed]
  7. Carrey, F.A. Química Orgânica, v.2, 2nd ed.; AMGH Editora: São Paulo, 2011. [Google Scholar]
  8. Bhandari, S.; Khatun, R.; Poddar, M.K.; Kothari, A.C.; Bal, R. Direct oxidation of cyclohexane to adipic acid in air over Co3O4.ZrO2 nanostructured catalyst. Molecular Catalysis 2022, 528, 112473–112484. [Google Scholar] [CrossRef]
  9. Zarour, P.K.; Vieco, N.; Ramos, A.P.; Nácher-Vázquez, M.; Mohedano, M.L.; López, P. Food ingredients synthesized by lactic acid bacteria sorbitol. In Microbial production of food ingredients and additives; Holban, A.M., Grumezescu, A.M., Eds.; Elsevier (Academic Press), 2018; Volume 4, pp. 89–124. [Google Scholar] [CrossRef]
  10. Ciriminna, R.; Meneguzzo, F.; Delisi, R.; et al. Citric acid: emerging applications of key biotechnology industrial product. Chemistry Central Journal 2017, 11, 22–31. [Google Scholar] [CrossRef] [PubMed]
  11. de Ulhôa Torres, A.; Sarrouh, B.; Lofrano, R.C. Synthesis and characterization of the poly-(sorbitol co-citrate adipate) a biopolymer aiming to obtain a biomaterial. Revista Eletrônica em Gestão, Educação e Tecnologia Ambiental 2022, 26, 1–11. [Google Scholar] [CrossRef]
  12. De Rezende, D.J.L.F.; Sarrouh, B.; Naves, F.L.; Lofrano, R.C.Z. Use of residual glycerin and glycerol in biopolymer preparation. Revista Eletrônica em Gestão, Educação e Tecnologia Ambiental 2019, 23, 01–07. [Google Scholar] [CrossRef]
  13. Duta, L.; Grumezescu, V. The effect of doping on the electrical and dielectric properties of hydroxyapatite for medical applications: from powders to thin films. Materials 2024, 17, 640. [Google Scholar] [CrossRef] [PubMed]
  14. Pistone, A.; de Gaetano, A.; Piperopoulos, E.; Abate, C. Effect of sodium hydroxide and tripolyphosphate on curcumin release from chitosan-based macroparticles. Materials 2023, 16, 5850. [Google Scholar] [CrossRef] [PubMed]
  15. Fischer, M.R.; Garcia, M.C.; Nogueira, A.L.; Porto, L.M.; Schneider, A.L.; Pezzin, A.P. Biossíntese e caracterização de nanocelulose bacteriana para engenharia de tecidos. Revista Matéria 2017, 1–17. [Google Scholar] [CrossRef]
  16. Pasupuleti, S.; Madras, G. Synthesis and degradation of sorbitol-based polymers. Journal of Applied Polymer Science 2011, 121, 2861–2869. [Google Scholar] [CrossRef]
  17. Pendino, J.C.; Hess, L.; Beltrame, S.; Castillo, G.A.-E.; Trujillo, J. Gradiente de saturação de oxigênio e concentração de lactato entre átrio direito e artéria pulmonar no pós-operatório imediato de cirurgia cardíaca com circulação extracorpórea. Revista Brasileira de Terapia Intensiva 2017, 29, 287–292. [Google Scholar]
  18. Umoren, S.A.; Solomon, M.M.; Saji, V.S. Copolymers. In Polymeric Materials in Corrosion Inhibition: Fundamentals and Applications; Elsevier (Academic Press), 2022; Volume 21, pp. 489–519. [Google Scholar] [CrossRef]
  19. Shefer, A.; Gottlieb, M. Effect of crosslinks on the glass transition temperature of end-linked elastomers. Macromolecules 1992, 25, 4036–4042. [Google Scholar] [CrossRef]
  20. Ammar, C.; Alminderej, F.M.; Yel-Ghoul, Y.; Jabli, M.; Shafiquzzaman, M. Preparation and Characterization of a New Polymeric Multi-Layered Material Based K-Carrageenan and Alginate for Efficient Bio-Sorption of Methylene Blue Dye. Polymers 2021, 13, 411. [Google Scholar] [CrossRef]
  21. Kędzierska, M.; Sala, K.; Bańkosz, M.; Wroniak, D.; Gajda, P.; Potemski, P.; Tyliszczak, B. Investigation of physicochemical properties and surface morphology of hydrogel materials incorporating rosehip extract. Materials 2023, 16, 6037. [Google Scholar] [CrossRef] [PubMed]
  22. Lee, Y.B.; Lim, S.; Lee, Y.; Park, C.H.; Lee, H.J. Green chemistry for crosslinking biopolymers: recent advances in riboflavin-mediated photochemistry. Materials 2023, 16, 1218. [Google Scholar] [CrossRef]
  23. Müller, R.J. Biodegradability of Polymers: Regulations and Methods for Testing. In: RIEDEL, U. et al. Biopolymers, v.10. p. 365-374, 2005. Available online: https://application.wiley-vch.de/books/biopoly/index.html.
Figure 1. Images of the polymers obtained A (left), B (center) and C (right). Source: Elaborated by the authors.
Preprints 103089 g001
Figure 2. Images of the polymer obtained in experiment A: immediately after preparation (a) and after exposure for seven days to the ambient atmosphere (b). Source: Elaborated by the authors.
Preprints 103089 g002
Figure 3. Graph of the percentage amount of humidity absorbed by polymers A, B and C over time. Source: Elaborated by the authors.
Preprints 103089 g003
Figure 4. Polymer samples A, B and C after immersion in alkaline phosphate buffer pH 7.2 and drying. Source: Elaborated by the authors.
Preprints 103089 g004
Figure 5. Behavior of polymers A, B and C over the incubation time in relation to pH. Source: Elaborated by the authors.
Preprints 103089 g005
Figure 6. Number of cells (UFC/mL) as a function of incubation time for the studied polymers (A, B, C and Control). Source: Elaborated by the authors.
Preprints 103089 g006
Table 1. List of the different molar ratios of reagents used in the polymerizations.
Experiments Sorbitol (mol) Citric Acid (mol) Adipic Acid (mol)
A 1.0 0.5 1.0
B 1.0 1.0 1.0
C 1.0 2.0 1.0
Source: Elaborated by the authors.
Table 2. Values of percentage mass increases of polymers A, B and C obtained in the moisture absorption tests.
Polymers Molar propotion of citric acid Incrise mass (%) Variation in citric acid quantity (%)
A 0.5 3.55 -
B 1.0 5.30 ~ 50
C 1.0 12.45 ~ 135
Source: Elaborated by the authors.
Table 3. Percentage decrease in mass of polymers A, B and C after 6 days immersion in pH 7.2 buffer solution and subsequent oven drying.
Polymers Increase mass (%)
A 0.66
B 20.98
C 45.56
Source: Elaborated by the authors.
Table 4. Average absorbance values obtained at 620 nm over 96 h for the polymers studied.
Time (h) A B C Control
24 2,3210 2,3135 2,3135 2,4130
48 2,4005 2,4215 2,4215 2,4560
72 2,4230 2,4420 2,4420 2,4740
96 2,4265 2,4555 2,4555 2,5640
Source: Elaborated by the authors.
Table 5. Values obtained in number of cells per mL for each of the polymers studied.
Time (h) A B C Control
24 17,5 17,1 17,5 17,3
48 14,0 11,0 13,0 13,0
72 8,5 10,0 8,5 9,0
96 7,0 8,0 8,0 5,0
Source: Elaborated by the authors.
Disclaimer/Publisher’s Note: The statements, opinions and data contained in all publications are solely those of the individual author(s) and contributor(s) and not of MDPI and/or the editor(s). MDPI and/or the editor(s) disclaim responsibility for any injury to people or property resulting from any ideas, methods, instructions or products referred to in the content.
Copyright: This open access article is published under a Creative Commons CC BY 4.0 license, which permit the free download, distribution, and reuse, provided that the author and preprint are cited in any reuse.
Prerpints.org logo

Preprints.org is a free preprint server supported by MDPI in Basel, Switzerland.

Subscribe

© 2024 MDPI (Basel, Switzerland) unless otherwise stated