4. Discussion
According to the data from the Sea Around Us Project, the exploitation levels in high seas fisheries increased notably from the 1950s onwards. In 2014, almost 47% of the high seas fish stocks were either over-exploited or collapsed, and 37% were exploited at their full capacity [
38]. Similar estimates from the FAO [
79] suggest that 64% of high seas stocks are overfished or undergoing overfishing. High seas fish stocks have potential for much more than their 5 to 10% contribution towards global catches. Without the healthy high seas stocks replenishing those of the EEZs, the catches from national waters would more rapidly decline [
9,
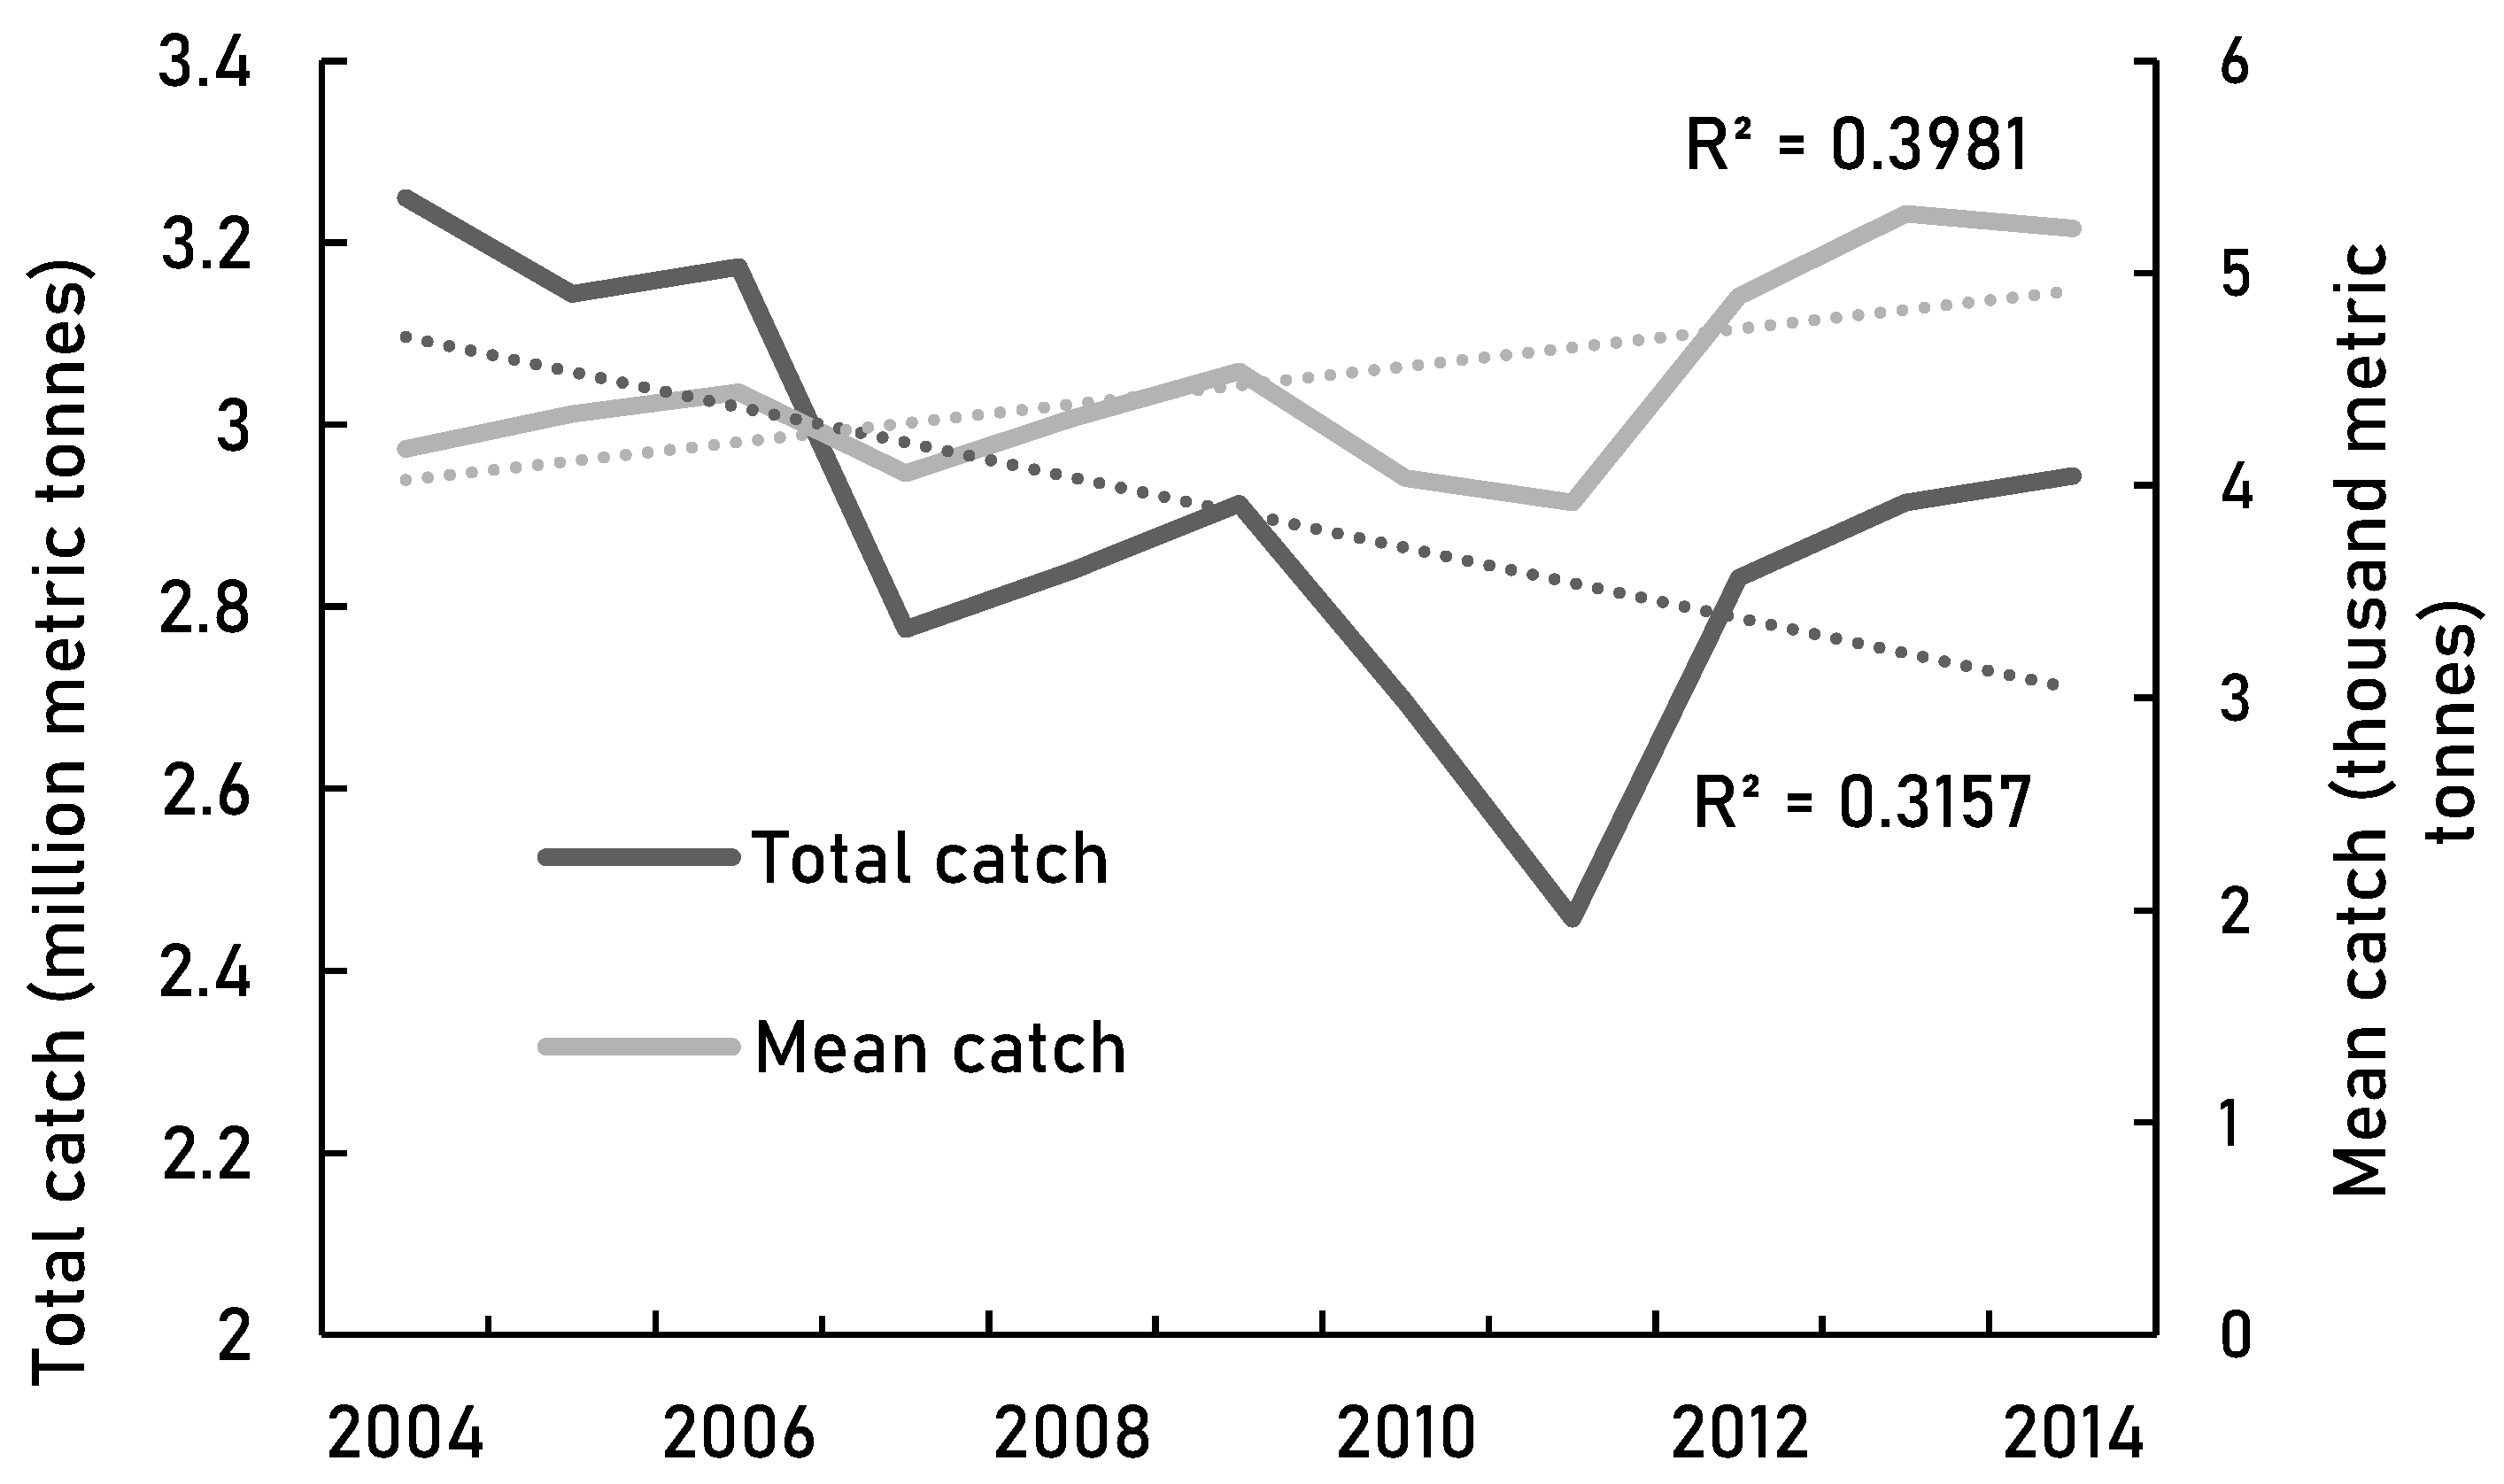
80]. We demonstrate a potential negative trend in the high seas total catches from the 2000s onwards (
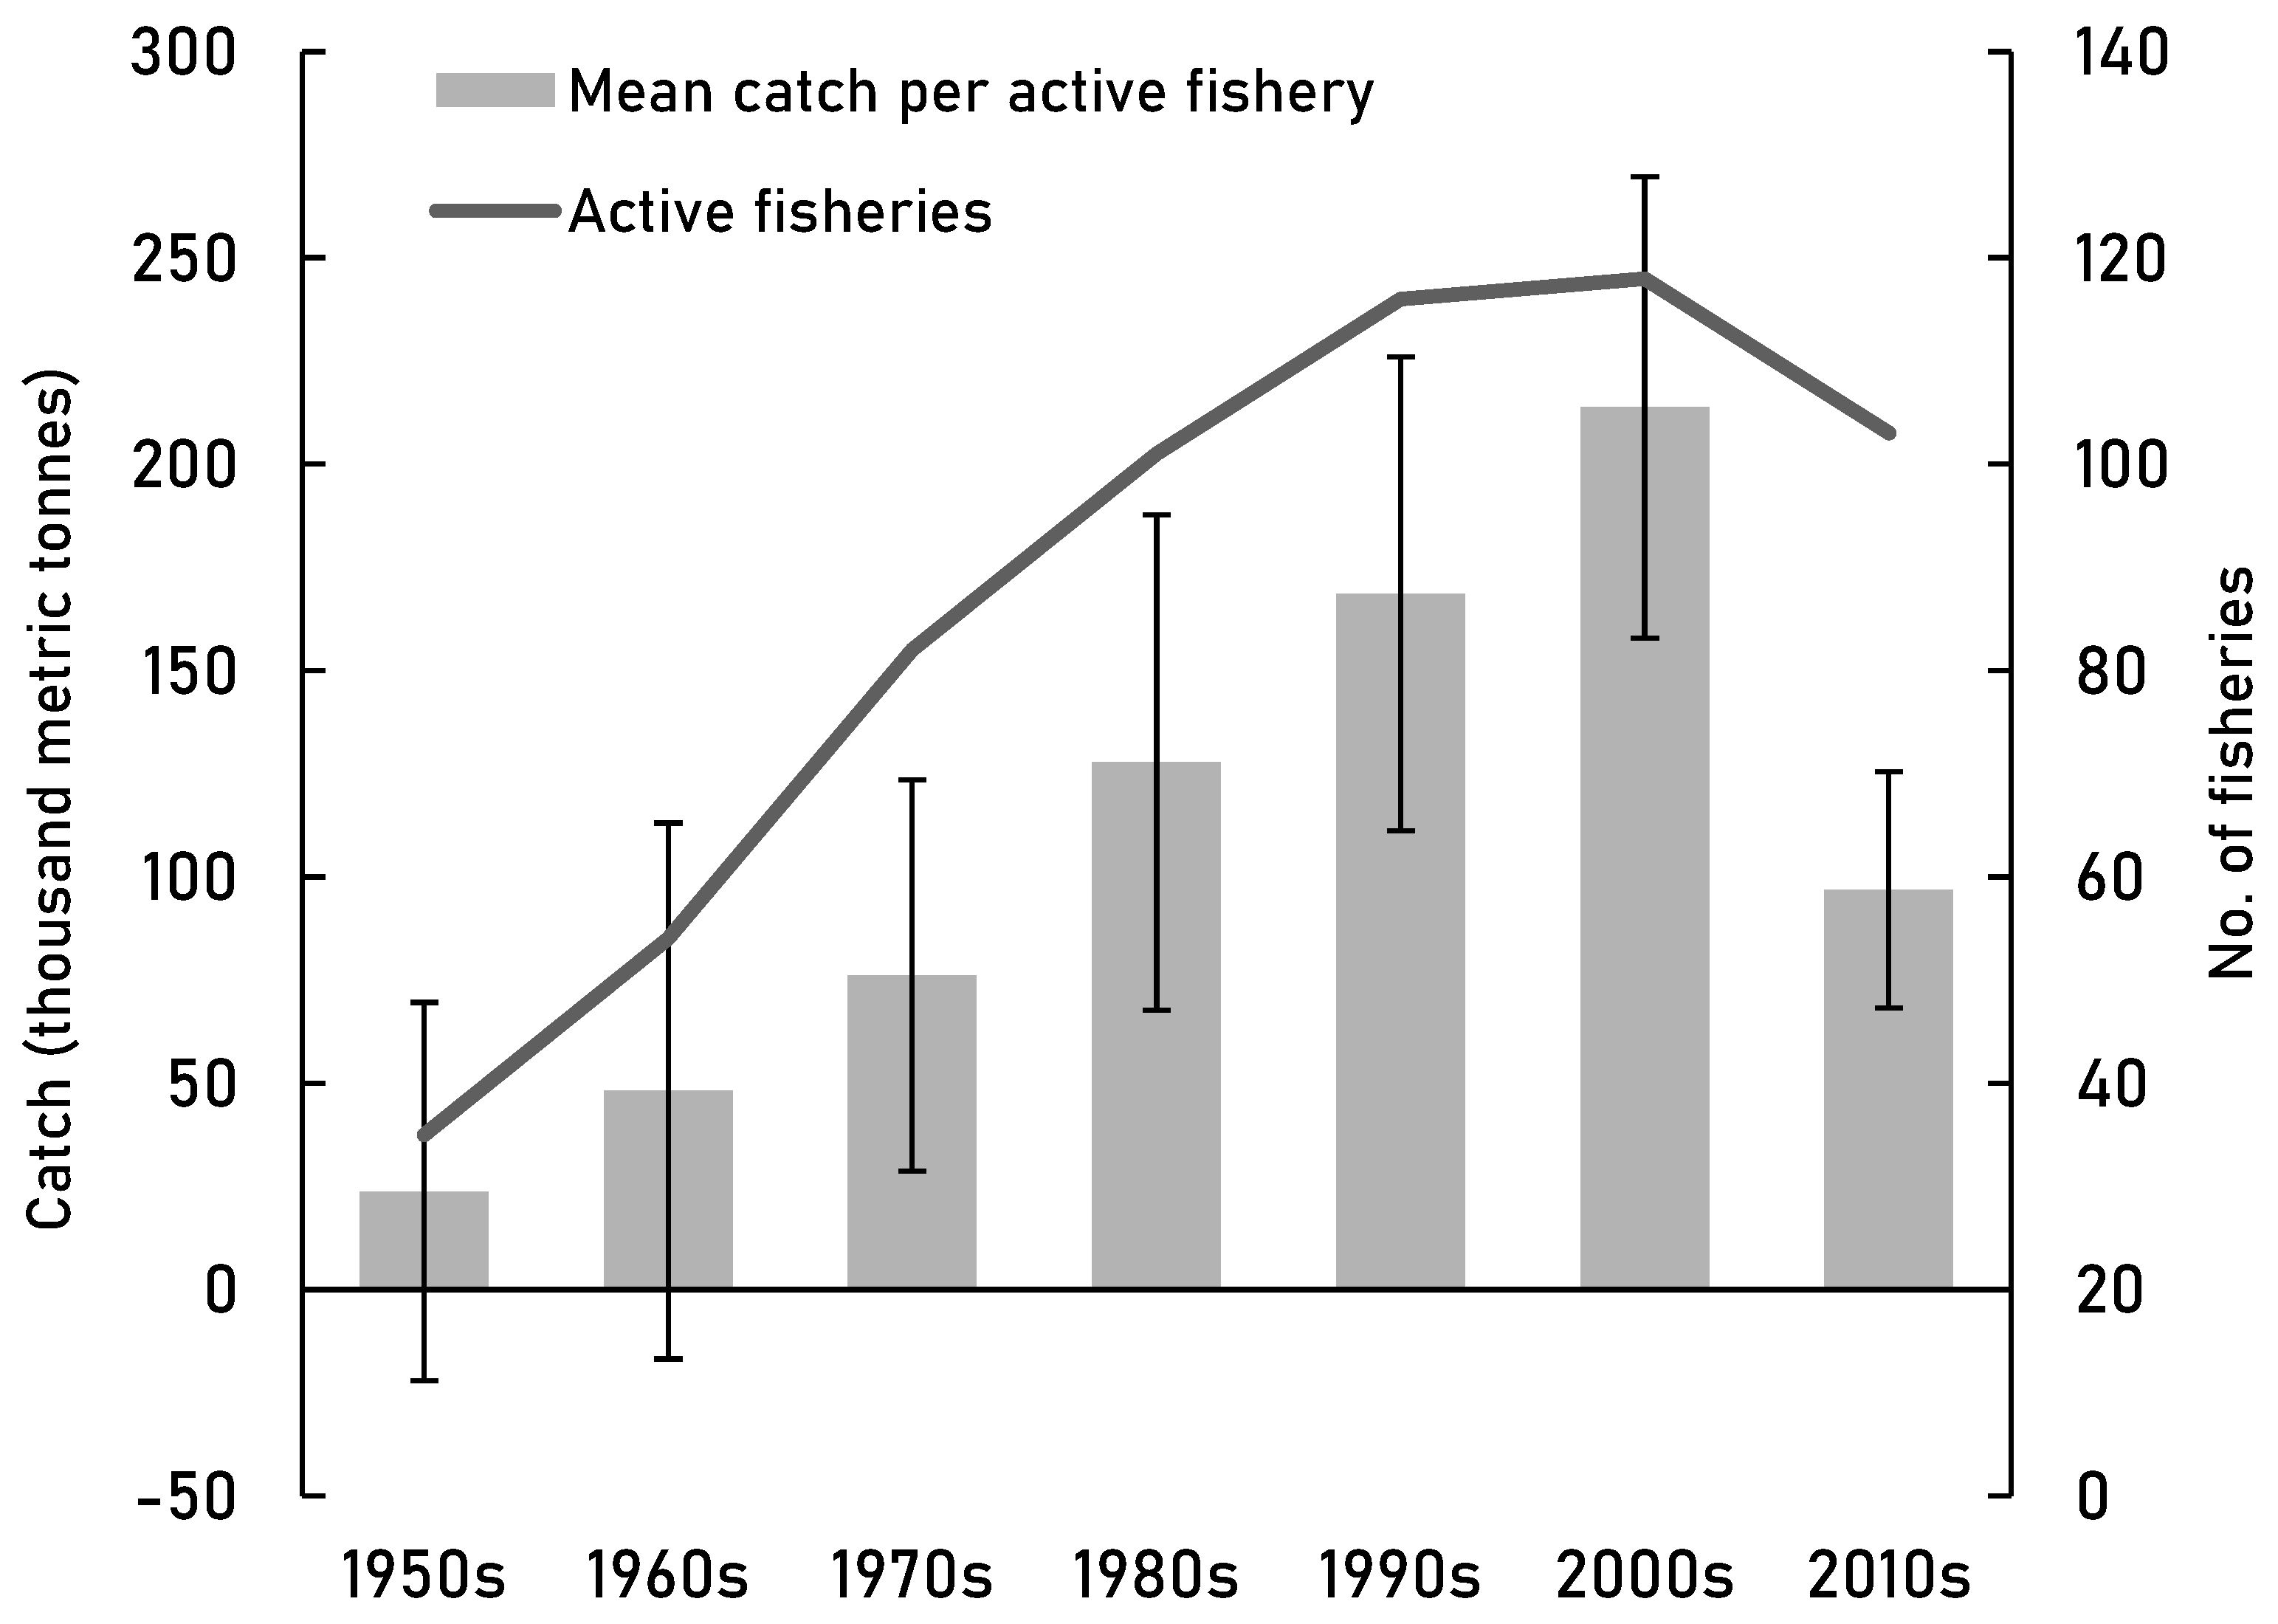
Figure 4a) and suggest a decline in mean catches of fisheries between the 2000s and 2010s (
Figure 3). This would support the findings of a global decline of 22% in catch per unit area since 1996 [
9]. It also suggests that the adverse effects of intense fishing pressure of the EEZs [
5,
71] are slowly being replicated on the high seas. We found the catches to be highly variable among countries. This could be due to the diversity of countries fishing on the high seas; the economic background of the country defines the size and efficacy of their fishing fleets and the extent to which the fleets are subsidised [
81]. Furthermore, the gear-specific catches differed significantly (
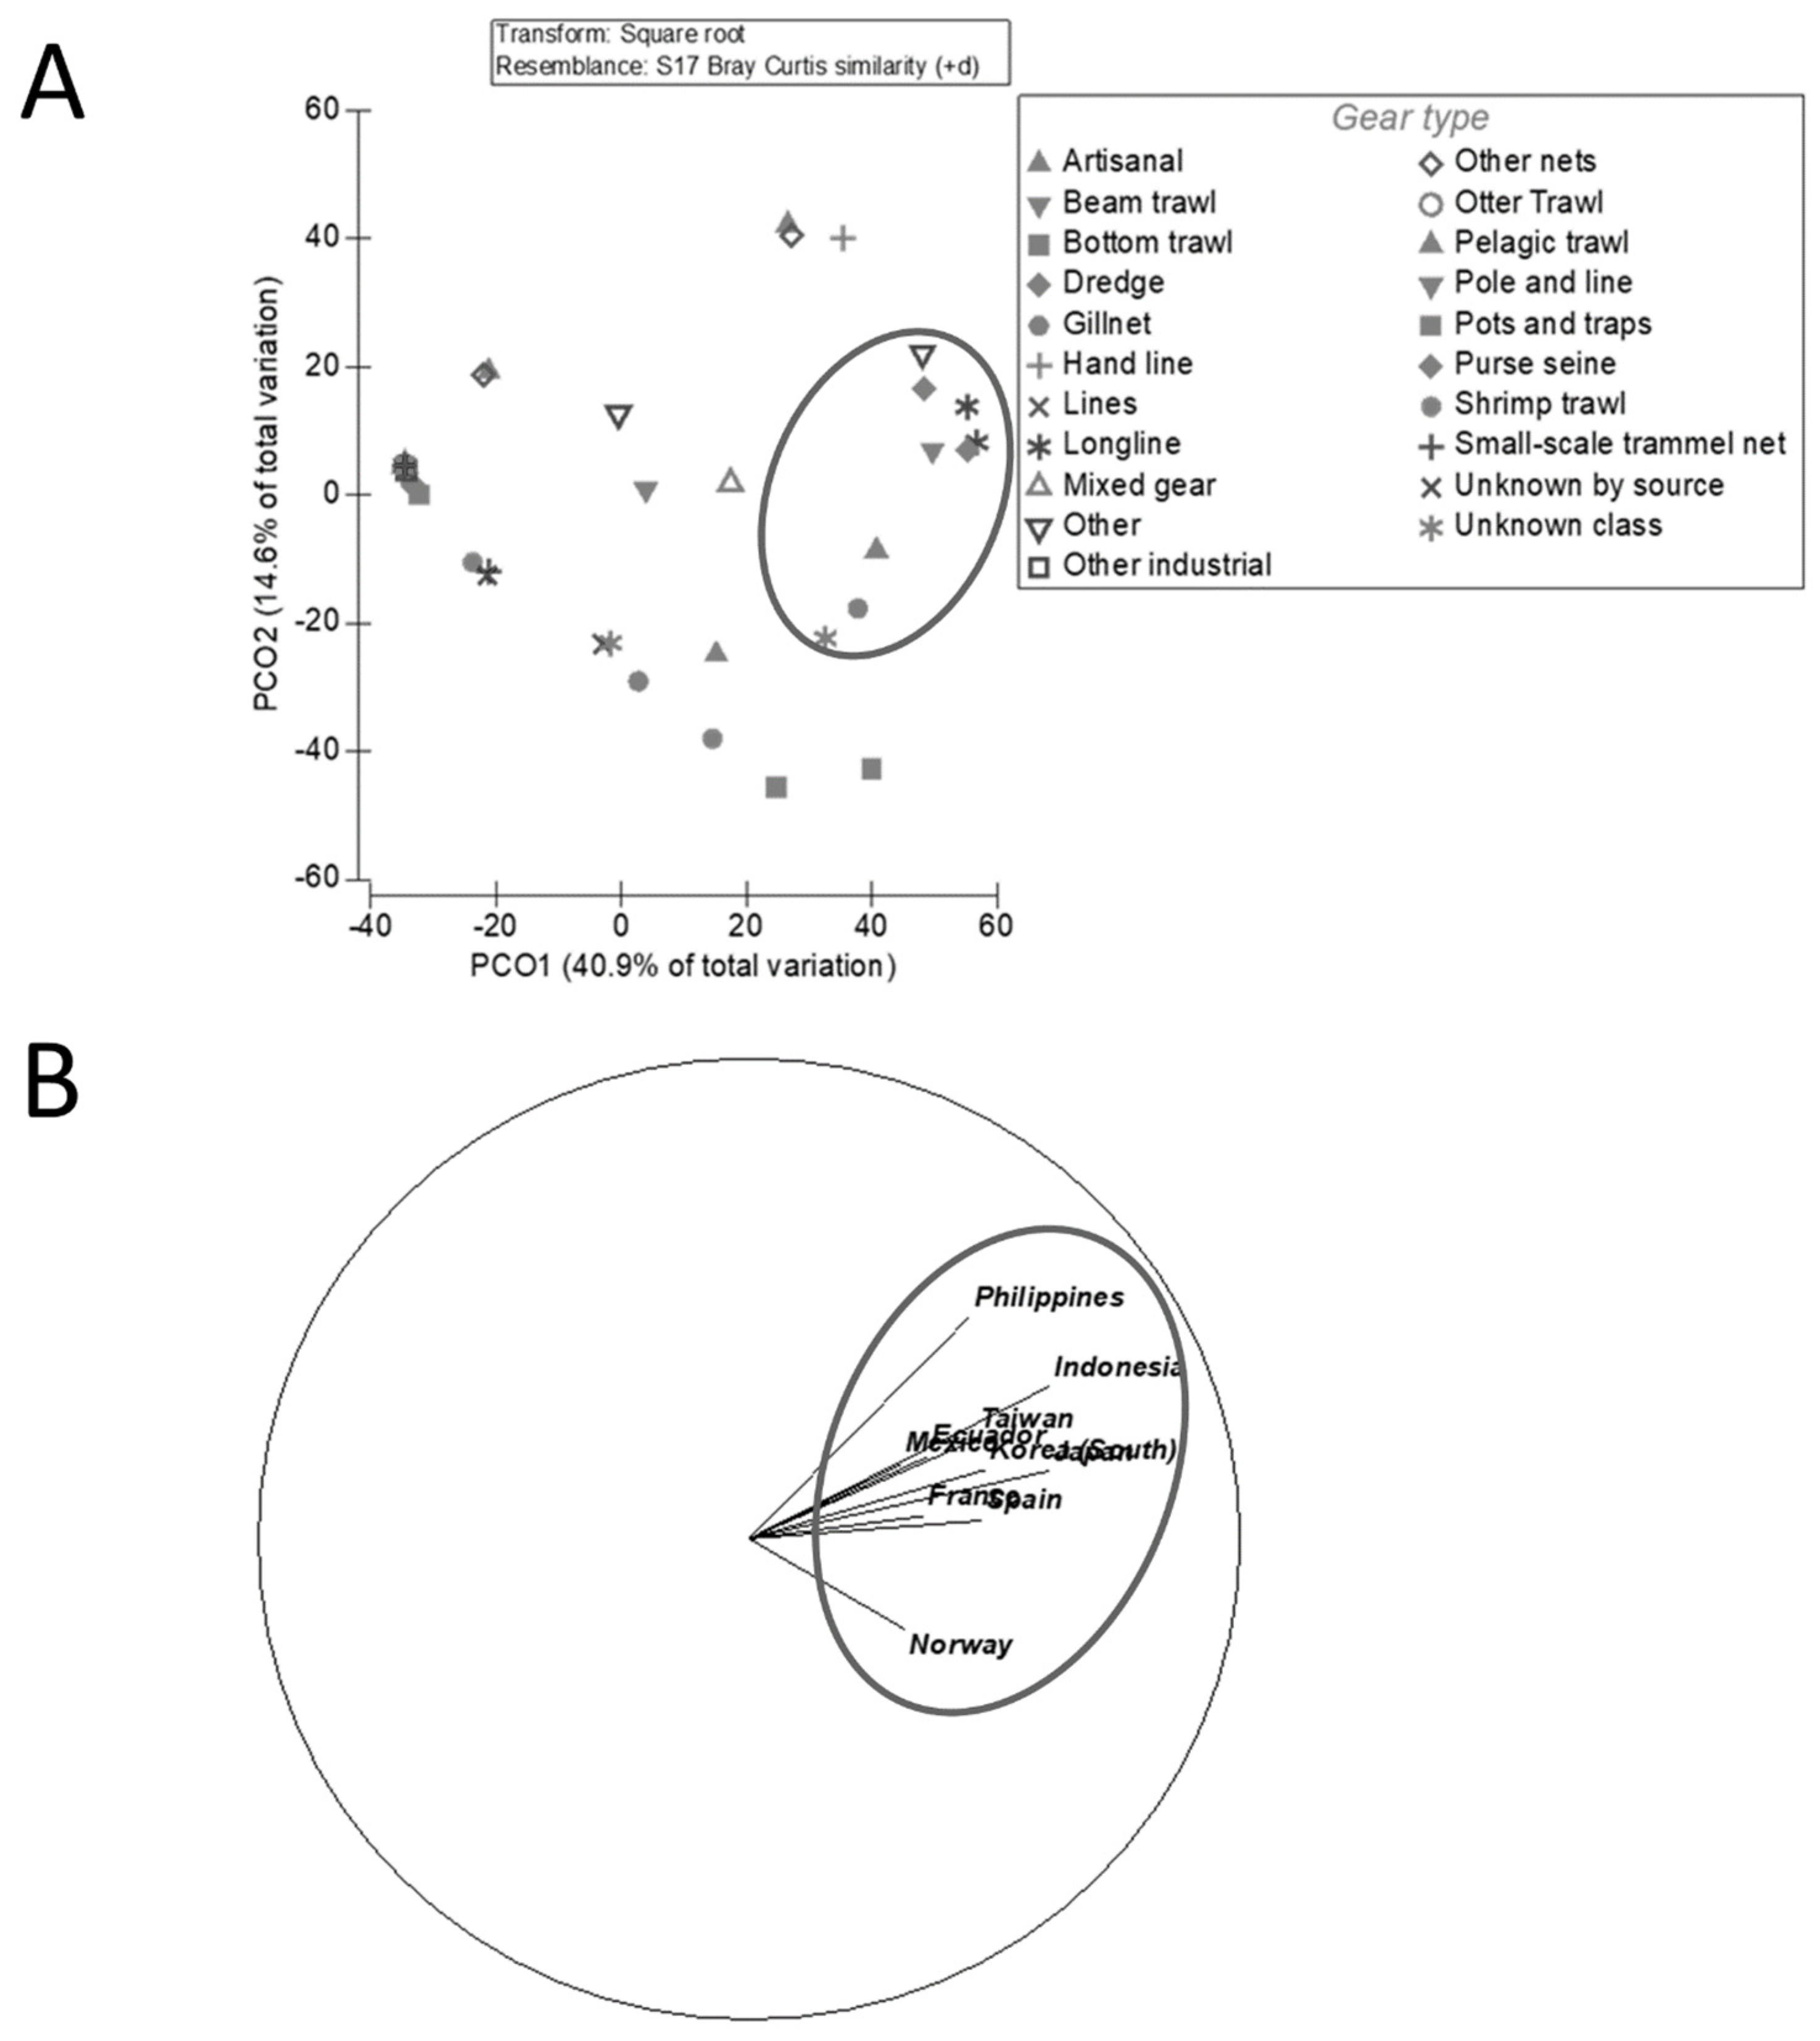
Figure 6A). Contrary to the globally common gears (bottom trawl, seine net, and pelagic trawl [
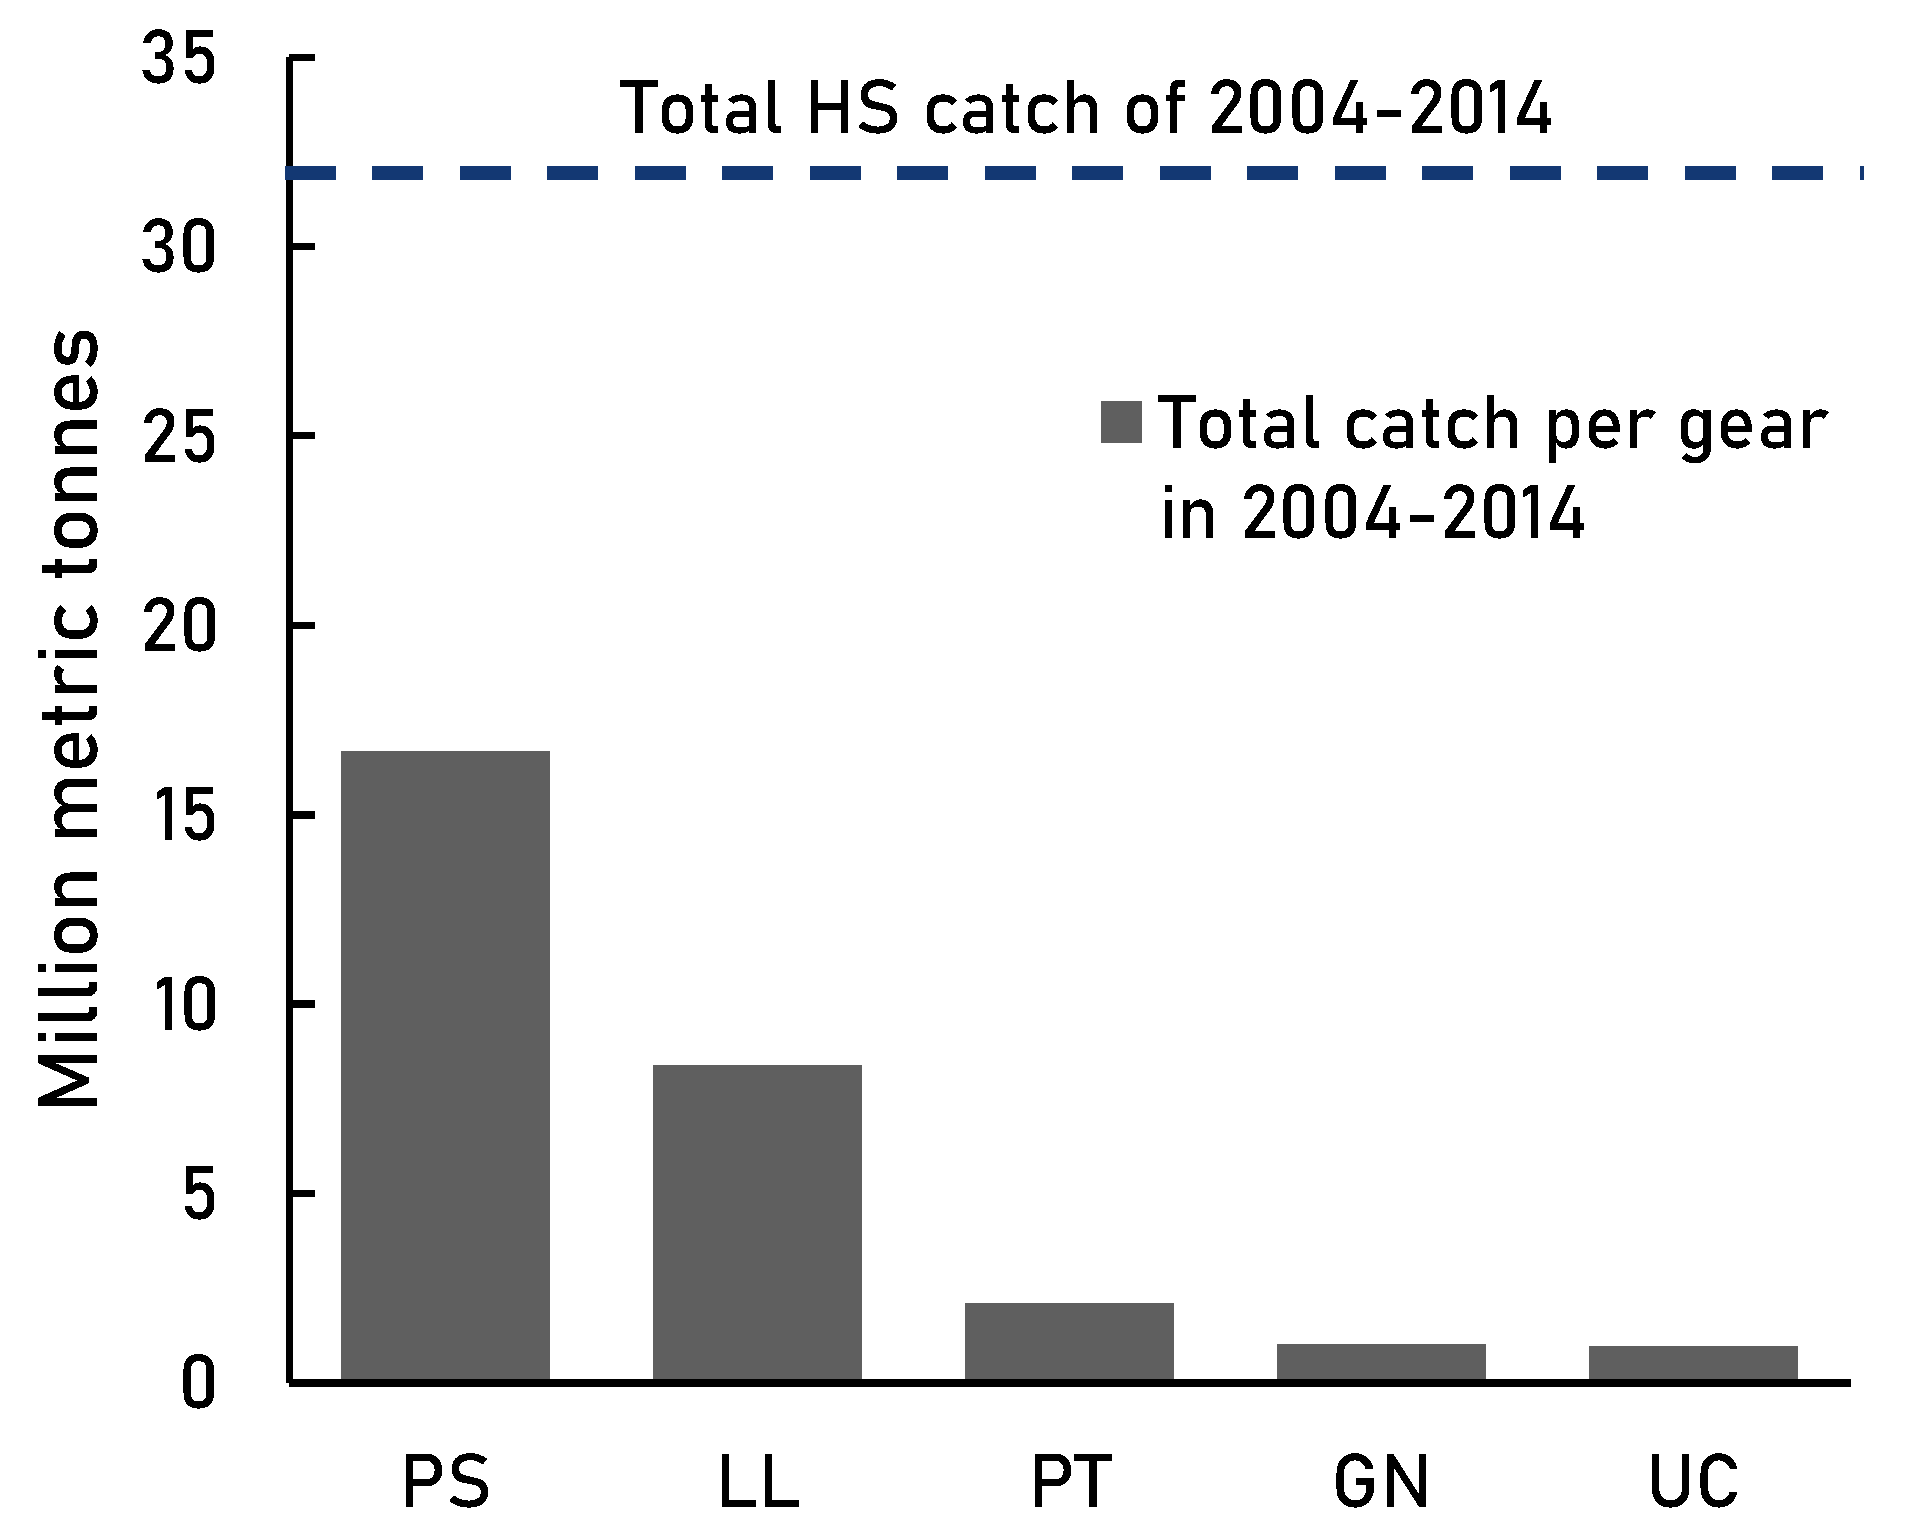
7]), purse seine and longline overpowered most of the other high seas gears such as gillnet and pole and line both in catch and popularity (
Table 6). Longline was also recognised as the most common high seas gear by Sala et al. [
2]. The wide use of these two gears demonstrates their fishing power; top fisheries opt for efficient gear with high catch levels at the cost of large amounts of non-target catch [
21,
23].
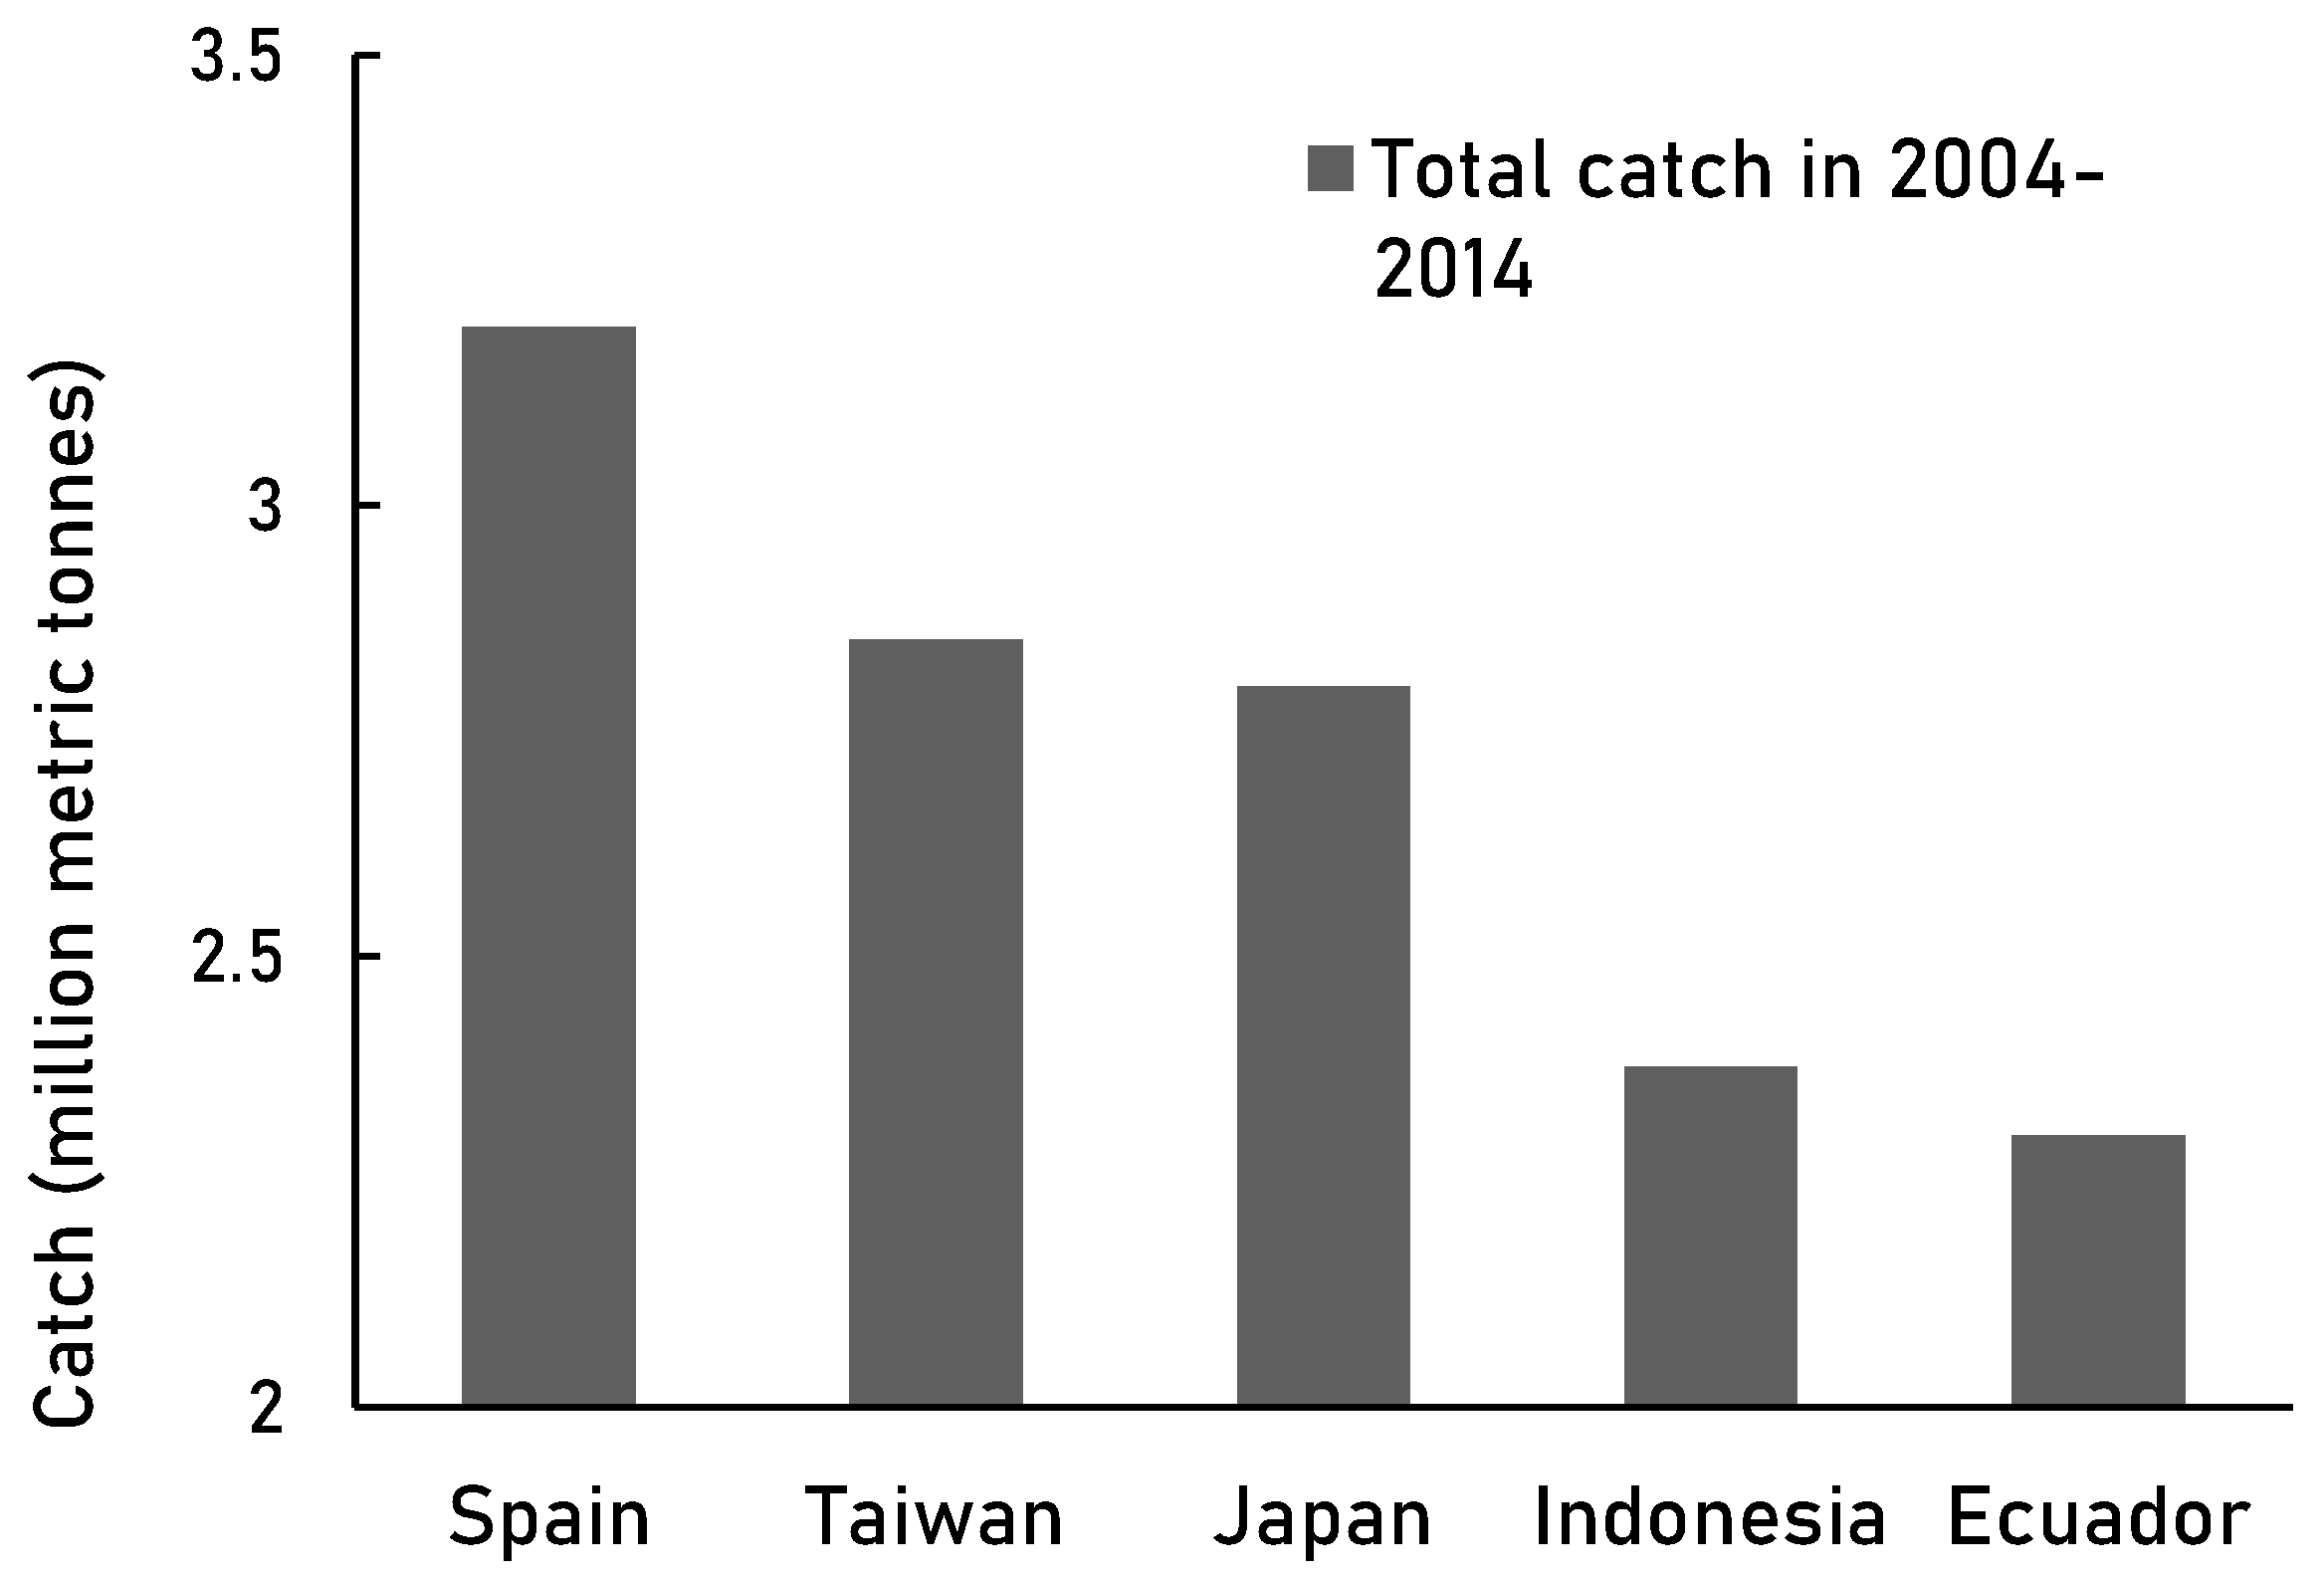
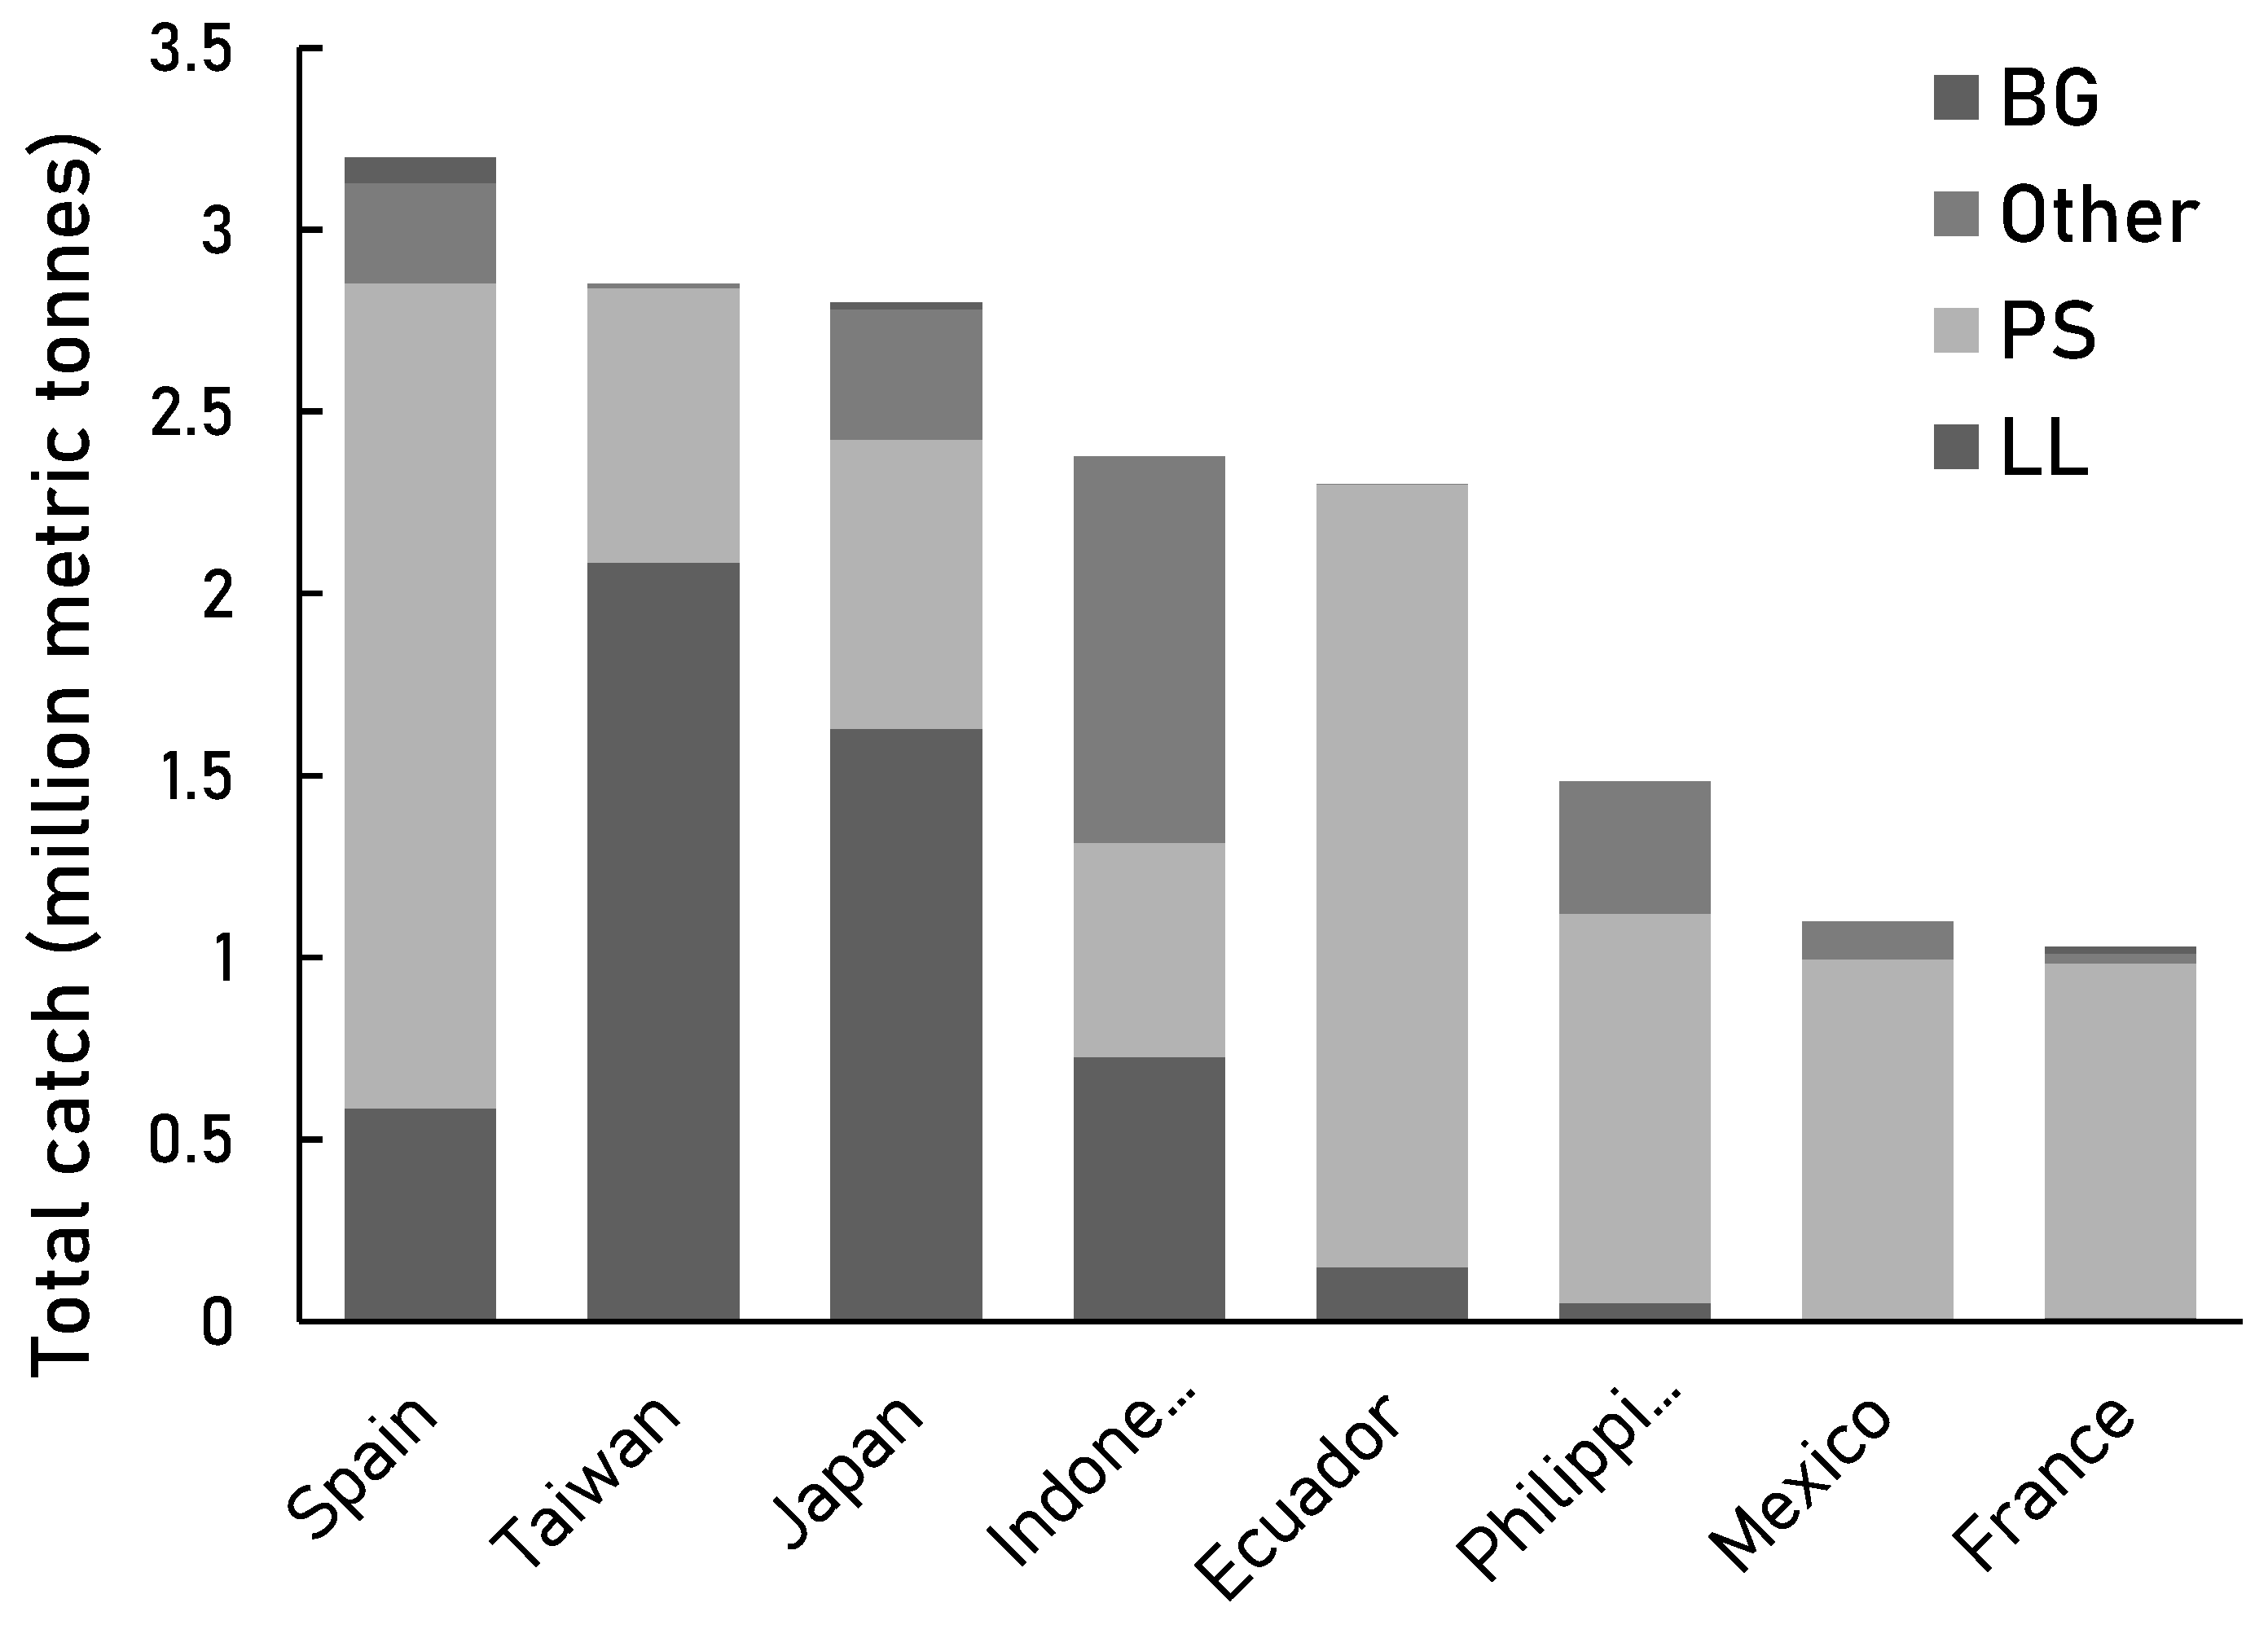
Similarly, we found that purse seine and longline were also the main fishing gears used by the high-catch countries such as Spain, Taiwan, Japan, Indonesia, and Ecuador in 2004-2014 (
Figure 6B). In addition to Spain and Taiwan, South Korea and China were largely responsible for expanding the fisheries coverage from 60% to 90% globally [
9]. Indonesia, Japan, South Korea, and Taiwan were also recognised as dominant high seas fisheries in 2006 [
26] and accounted for most of the global catch in 2000-2010 [
1]. In addition, all the above countries along with China comprised 77% of the high seas fisheries [
2]. In respect to our case study, the distant water fleet of China, it is worrying that a leading (legal) industrial fishery is not only the highest-ranking illegal fishery in the world [
82], but also pushes smaller high seas fisheries towards illegal fishing [
83]. The displacement of legal fishing effort due to illegal fishing by top high seas fisheries can, thus, result in more illegal fishing when smaller fisheries are left without a choice, providing yet another reason for ending illegal fishing altogether.
The high seas pose a challenge to all stakeholders from the exploiters of its natural resources to the entities willing to preserve them. Acting on the issues affecting the high seas would be an important step towards the Aichi Target 11 and the SDG 14 [
66,
67,
68], as currently only 5.3% of the aimed 10% ocean protection has been fulfilled and IUU fishing is still ongoing [
11,
58]. However, high seas fisheries are not currently comprehensively managed, nor are the high seas ecosystems properly protected [
15,
37,
46,
84]. Moreover, inequality prevails on the high seas; high-income nations perform 97% of the industrial fishing in the high seas, leaving a mere crumb of the fish stocks to low-income nations [
84,
85]. The findings of this paper confirm these inequalities: approximately 90% of the countries fishing in the high seas catch less than 500,000 tonnes each decade. Facilitating IUU fishing through inadequate enforcement and governance needlessly exacerbates the equality and sustainability issues of high seas fisheries [
46,
60]. The damage from IUU fishing in the high seas increases the economic burden for countries already losing billions of US dollars due to IUU fishing in their national waters and cripples conservational efforts [
58,
59]. Placing all the enforcement pressure on the flag states, while RFMOs are sending mixed messages seems to benefit neither the high seas ecosystems, nor curbing IUU fishing [
15,
16,
37]. It is evident that tackling the IUU activity on the high seas requires transparent international effort [
76,
86]. Cooperation between global, regional, and national sectors underpins the success of that effort [
86,
87]. Implementing overarching international governance as the key element of high seas management has already been called for in the reports from the Global Ocean Commission [
76] and Greenpeace [
41].
The compliance of not only the flag states but their respective fleets is crucial in impairing IUU operations on the high seas and, therefore, effective surveillance of the high seas along with meticulous port inspections are of great importance [
86,
88]. Due to the vast area of the high seas, the surveillance would rely heavily on monitoring the high seas vessels remotely and improving port enforcement and governance. IUU catches are far less likely to be landed in ports of strongly governed countries, whereas busy ports with good access to markets are more likely to receive illegal catches [
45]. IUU catches could be traced and simultaneously deterred with applying DNA test on landings and a rigorous traceability system based on sharing IUU fishing information, e.g., valid licences, and which areas are closed for fishing [
48,
89]. Fortunately, as the technology develops, it provides myriad of methods for monitoring fishing effort globally; automatic identification system (AIS) and vessel monitoring system (VMS) technologies are already widely used [
61,
90], while studies looking into using remote sensing and cross-matching of, e.g., VMS and AIS data are emerging to locate vessels at sea [
91,
92,
93].
We found several issues in reporting levels of the high seas catches. Reporting levels of landings were higher than that of discards (
Table 9), which were almost completely unreported apart from some exceptions in 2004-2014 (
Table 9 and
Table 11). We detected further variation in reporting levels between countries and gear types. For example, although some fisheries such as Dominica, Georgia, and Sierra Leone were not amongst the high-catch countries of 2004-2014, none of them reported any of their catch to relevant authorities (
Table 10). Furthermore, while bottom trawls caught less fish, almost a third of it was unreported (
Table 10). Our results suggest that looking at the reporting levels of individual countries and gear types in addition to their respective catch quantities could provide valuable insights to the ‘who’ and ‘how’ aspects of IUU fishing, while pointing towards potential non-compliance cases in fisheries.
Nevertheless, merely solving the issues of patchwork governance on the high seas would not be enough as the threat of overfishing persists. To protect the high seas ecosystems and the fish stocks within, it is essential not to wait until holistic and sustainable management measures are in place. Including MPAs in high seas fisheries management could bring both economic and ecological benefits [
94]. Due to the migratory nature of many high seas species, studies have suggested the implementation of MPA networks could be applied on the high seas [
95,
96]. However, we also consider an MPA concept that has only recently been explored; large mobile MPAs (mMPAs; [
29]). The main principle of an mMPA of any size is having clear, mobile boundaries. Oceanographic boundaries such as sea surface temperature, or geographic features such as eddies and currents act as indicators for species presence [
29]. The boundaries can be altered in almost real-time to benefit both the migratory species as well as the foraging grounds, nursery areas, and habitats. This would bring considerable benefits to many of the vulnerable high seas species: Key migratory routes as no-take zones would protect key species such as sea turtles, swordfish, and tunas. Large mMPAs would also improve connectivity between other MPAs and between the high seas and national waters, which would allow the species with wide home ranges to move freely without interruptions from fisheries [
29]. Moreover, solutions such as environmental niche models for fleets could help predict the potential clashing spots between fisheries and marine wildlife [
97]. High seas mMPAs would further increase the resilience of those ecosystems and protect them from overfishing and climate change as the species undergo home range shifts [
9,
29,
32,
33].
Finally, it is important to consider the livelihoods these management measures would affect. After all, in addition to the high seas ecosystems and fish stocks, it is the futures of the high seas fishers and fishing companies that are directly influenced. The concerns for future income are universally valid, when planning conservation measures [
98]. While innovative solutions to high seas management arise frequently, only some of them acknowledge the sociological and societal effects in full [
99,
100]. Stakeholder engagement and satisfaction are important elements in fisheries management; without fishers marine conservation cannot go forward. Fishers are key stakeholders, and the ideal management solutions are ‘win-win-win’ situations, from which fishers, ecosystems, and communities benefit from. As studies of high seas stakeholder engagement are still scarce, studies from inshore fisheries could provide valuable insights as to how to activate that engagement and achieve those ‘win-win-win’ outcomes in high seas fisheries. For example, a study by Rees et al. [
101] approached local pot fishers in the Lyme Bay Reserve, UK, with a suggestion: if the fishers reduced their fishing intensity and opted for more sustainable and low-impact fishing methods, their catches would increase with less effort. This would result in the preservation of their livelihoods, the ecosystem, and increase fished stocks. The suggestion later became reality: as a result, reducing the fishing impact and damage to the seabed, the Lyme Bay rocky and soft coral reefs and structurally complex benthic habitat increased the fish biomass by 4.5 times and the fishers began catching 2.5 times more fish with less effort than before [
102]. The work of the DEFRA, the Blue Marine Foundation, and University of Plymouth in the Lyme Bay Reserve has shown that investing in local inshore fisheries and fishers can work. The need to subsidise high seas fisheries will decrease as the thriving economy and ecosystem support the communities closer to home. The money freed from subsidies could be put towards protecting, for example, nursery habitats.
4.1. Future Recommendations
Although the Lyme Bay Reserve fisheries are coastal, they serve as an important example of the success of sustainable fisheries management, and similar approaches should be investigated in the context of the high seas fish stocks and ecosystems. The SAUP catch reconstructions [
38] are an ample and comprehensive resource for studying the high seas fisheries in general and estimating the extent of IUU fishing occurring in the high seas. The scope of this paper was relatively broad and, therefore, more in-depth studies are required. For example, new studies could look further into the following aspects within the SAUP dataset in conjunction with the other available high seas data:
Association between catch quantities of countries and their reporting levels; are fisheries with certain catch levels (low, medium, or high) more or less likely to have unreported catches?
The role of subsidies in different catch levels of high seas fisheries; is the amount and type of subsidies (i.e., beneficial, harmful, or ambiguous; [
2] connected with gear types and the reporting levels of catches?
In addition to ‘country’ and ‘gear type’, what are the other drivers of catch variation in high seas, and are the other potential drivers natural or anthropogenic?
The sustainability of high seas fishing gears; what are the fleet demographics (e.g., fleet size, employees, subsidies, and landing values) of different high seas gears, and could the use of purse seine and longline be restricted to reduce overcapacity?
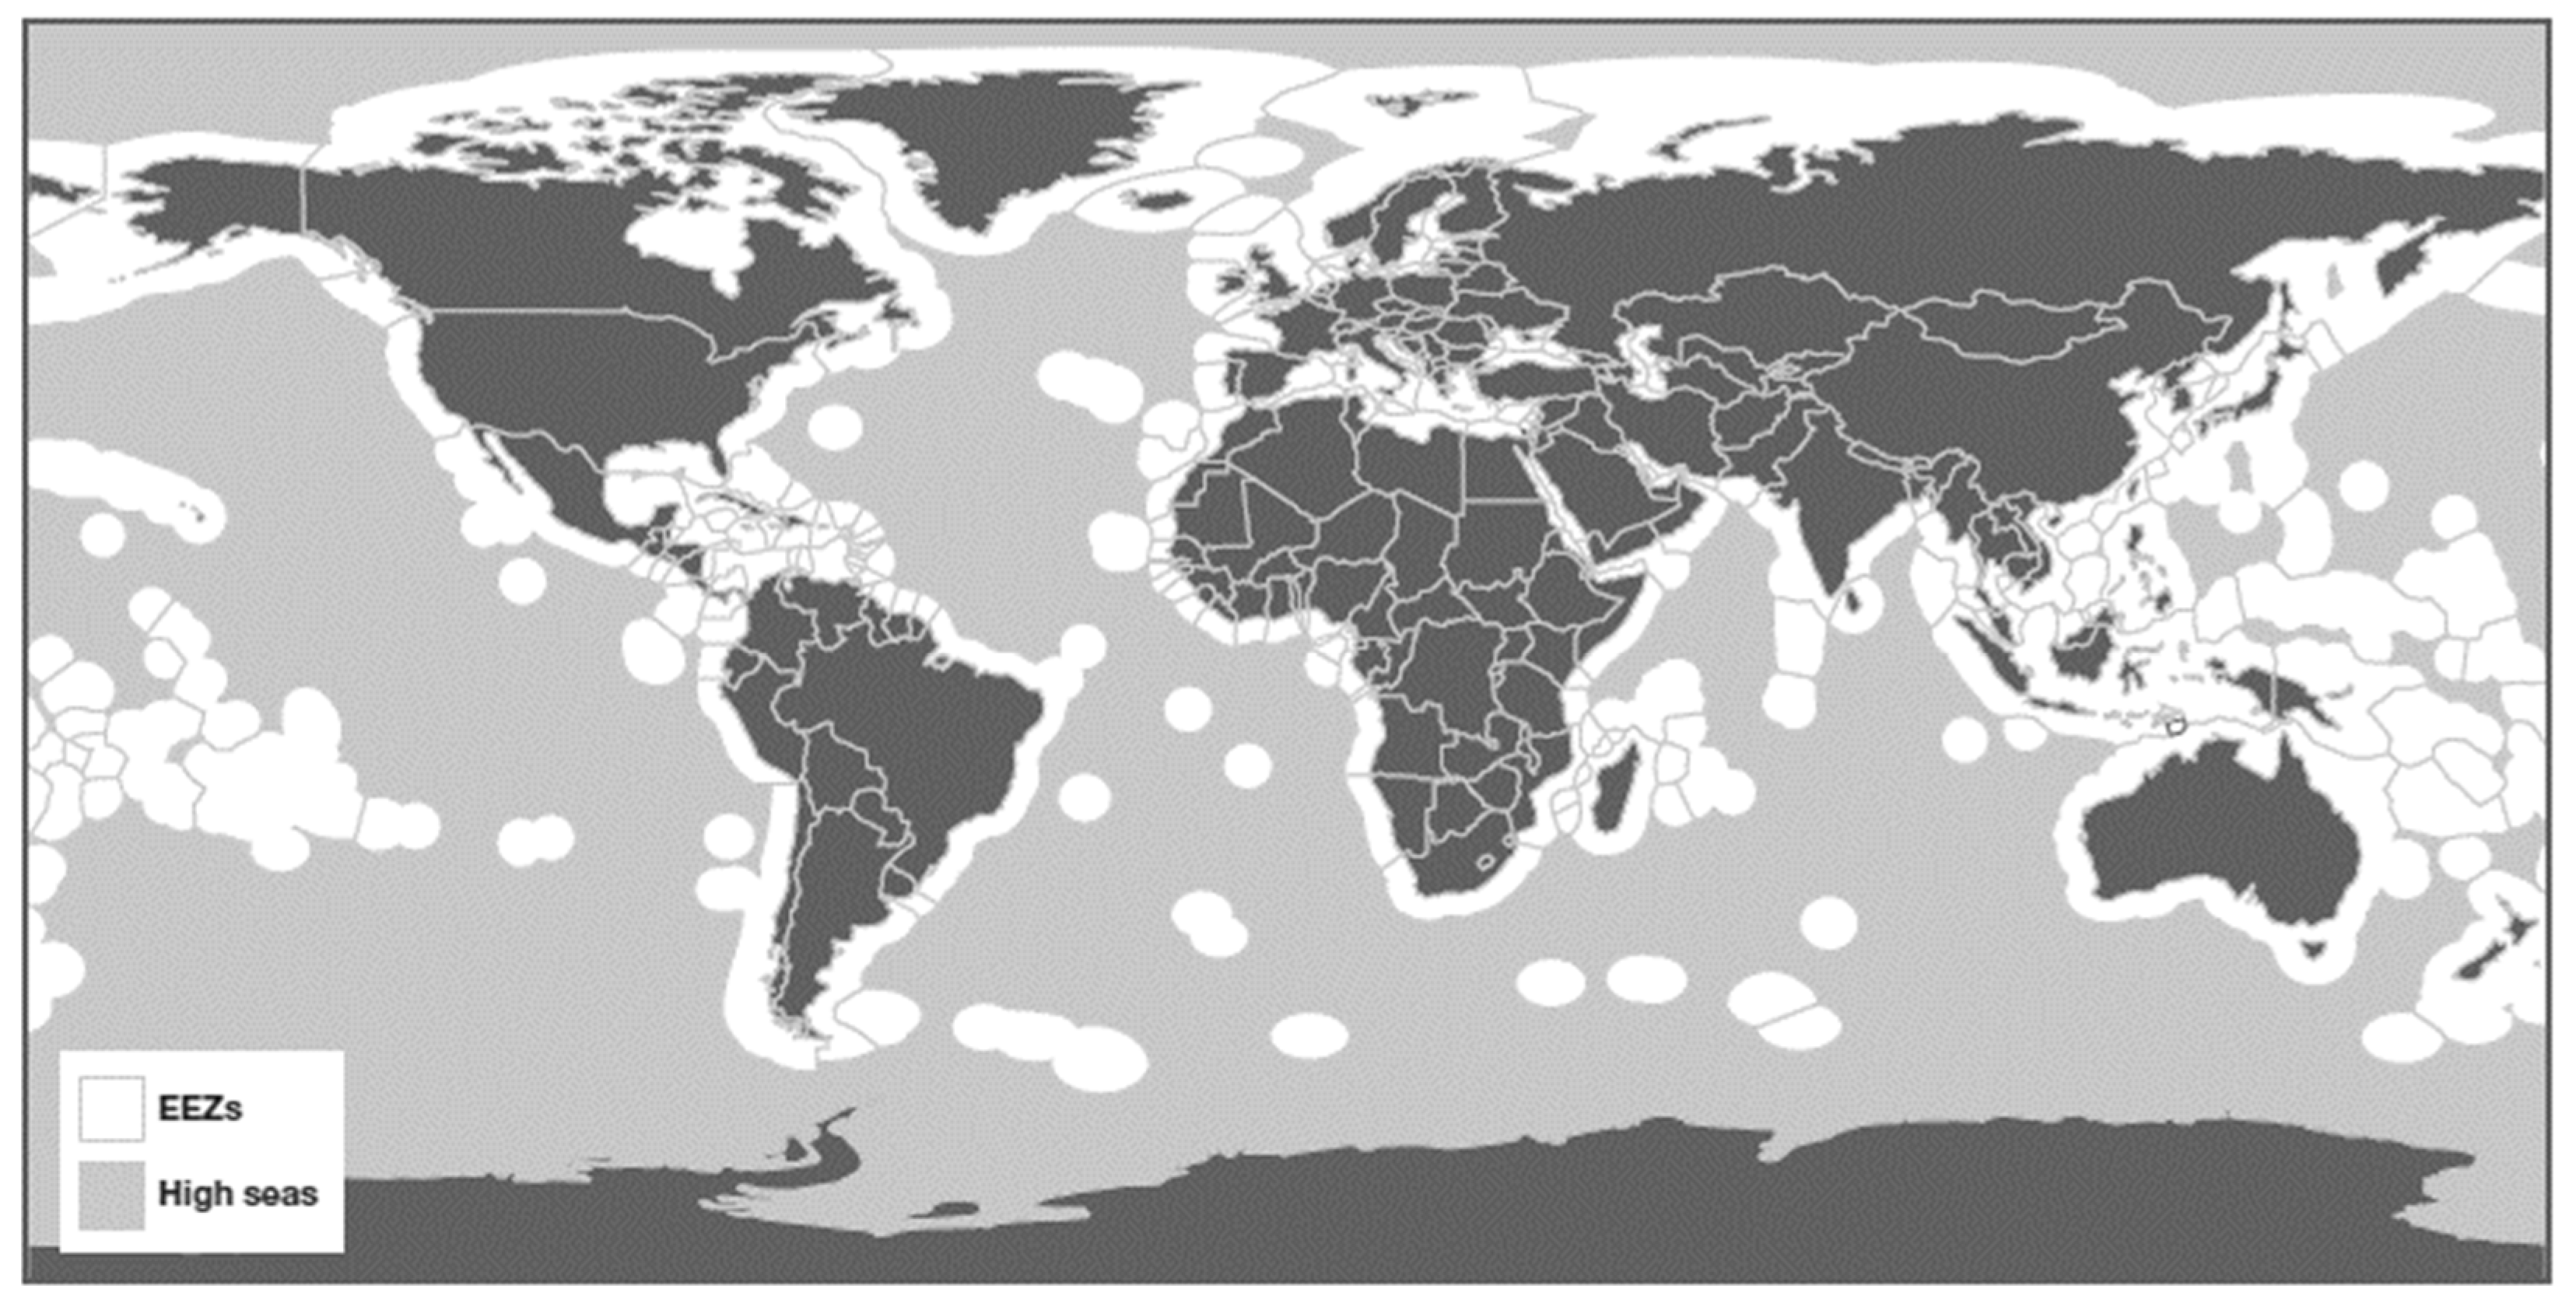
Figure 1.
Map of the global high seas [
1].
Figure 1.
Map of the global high seas [
1].
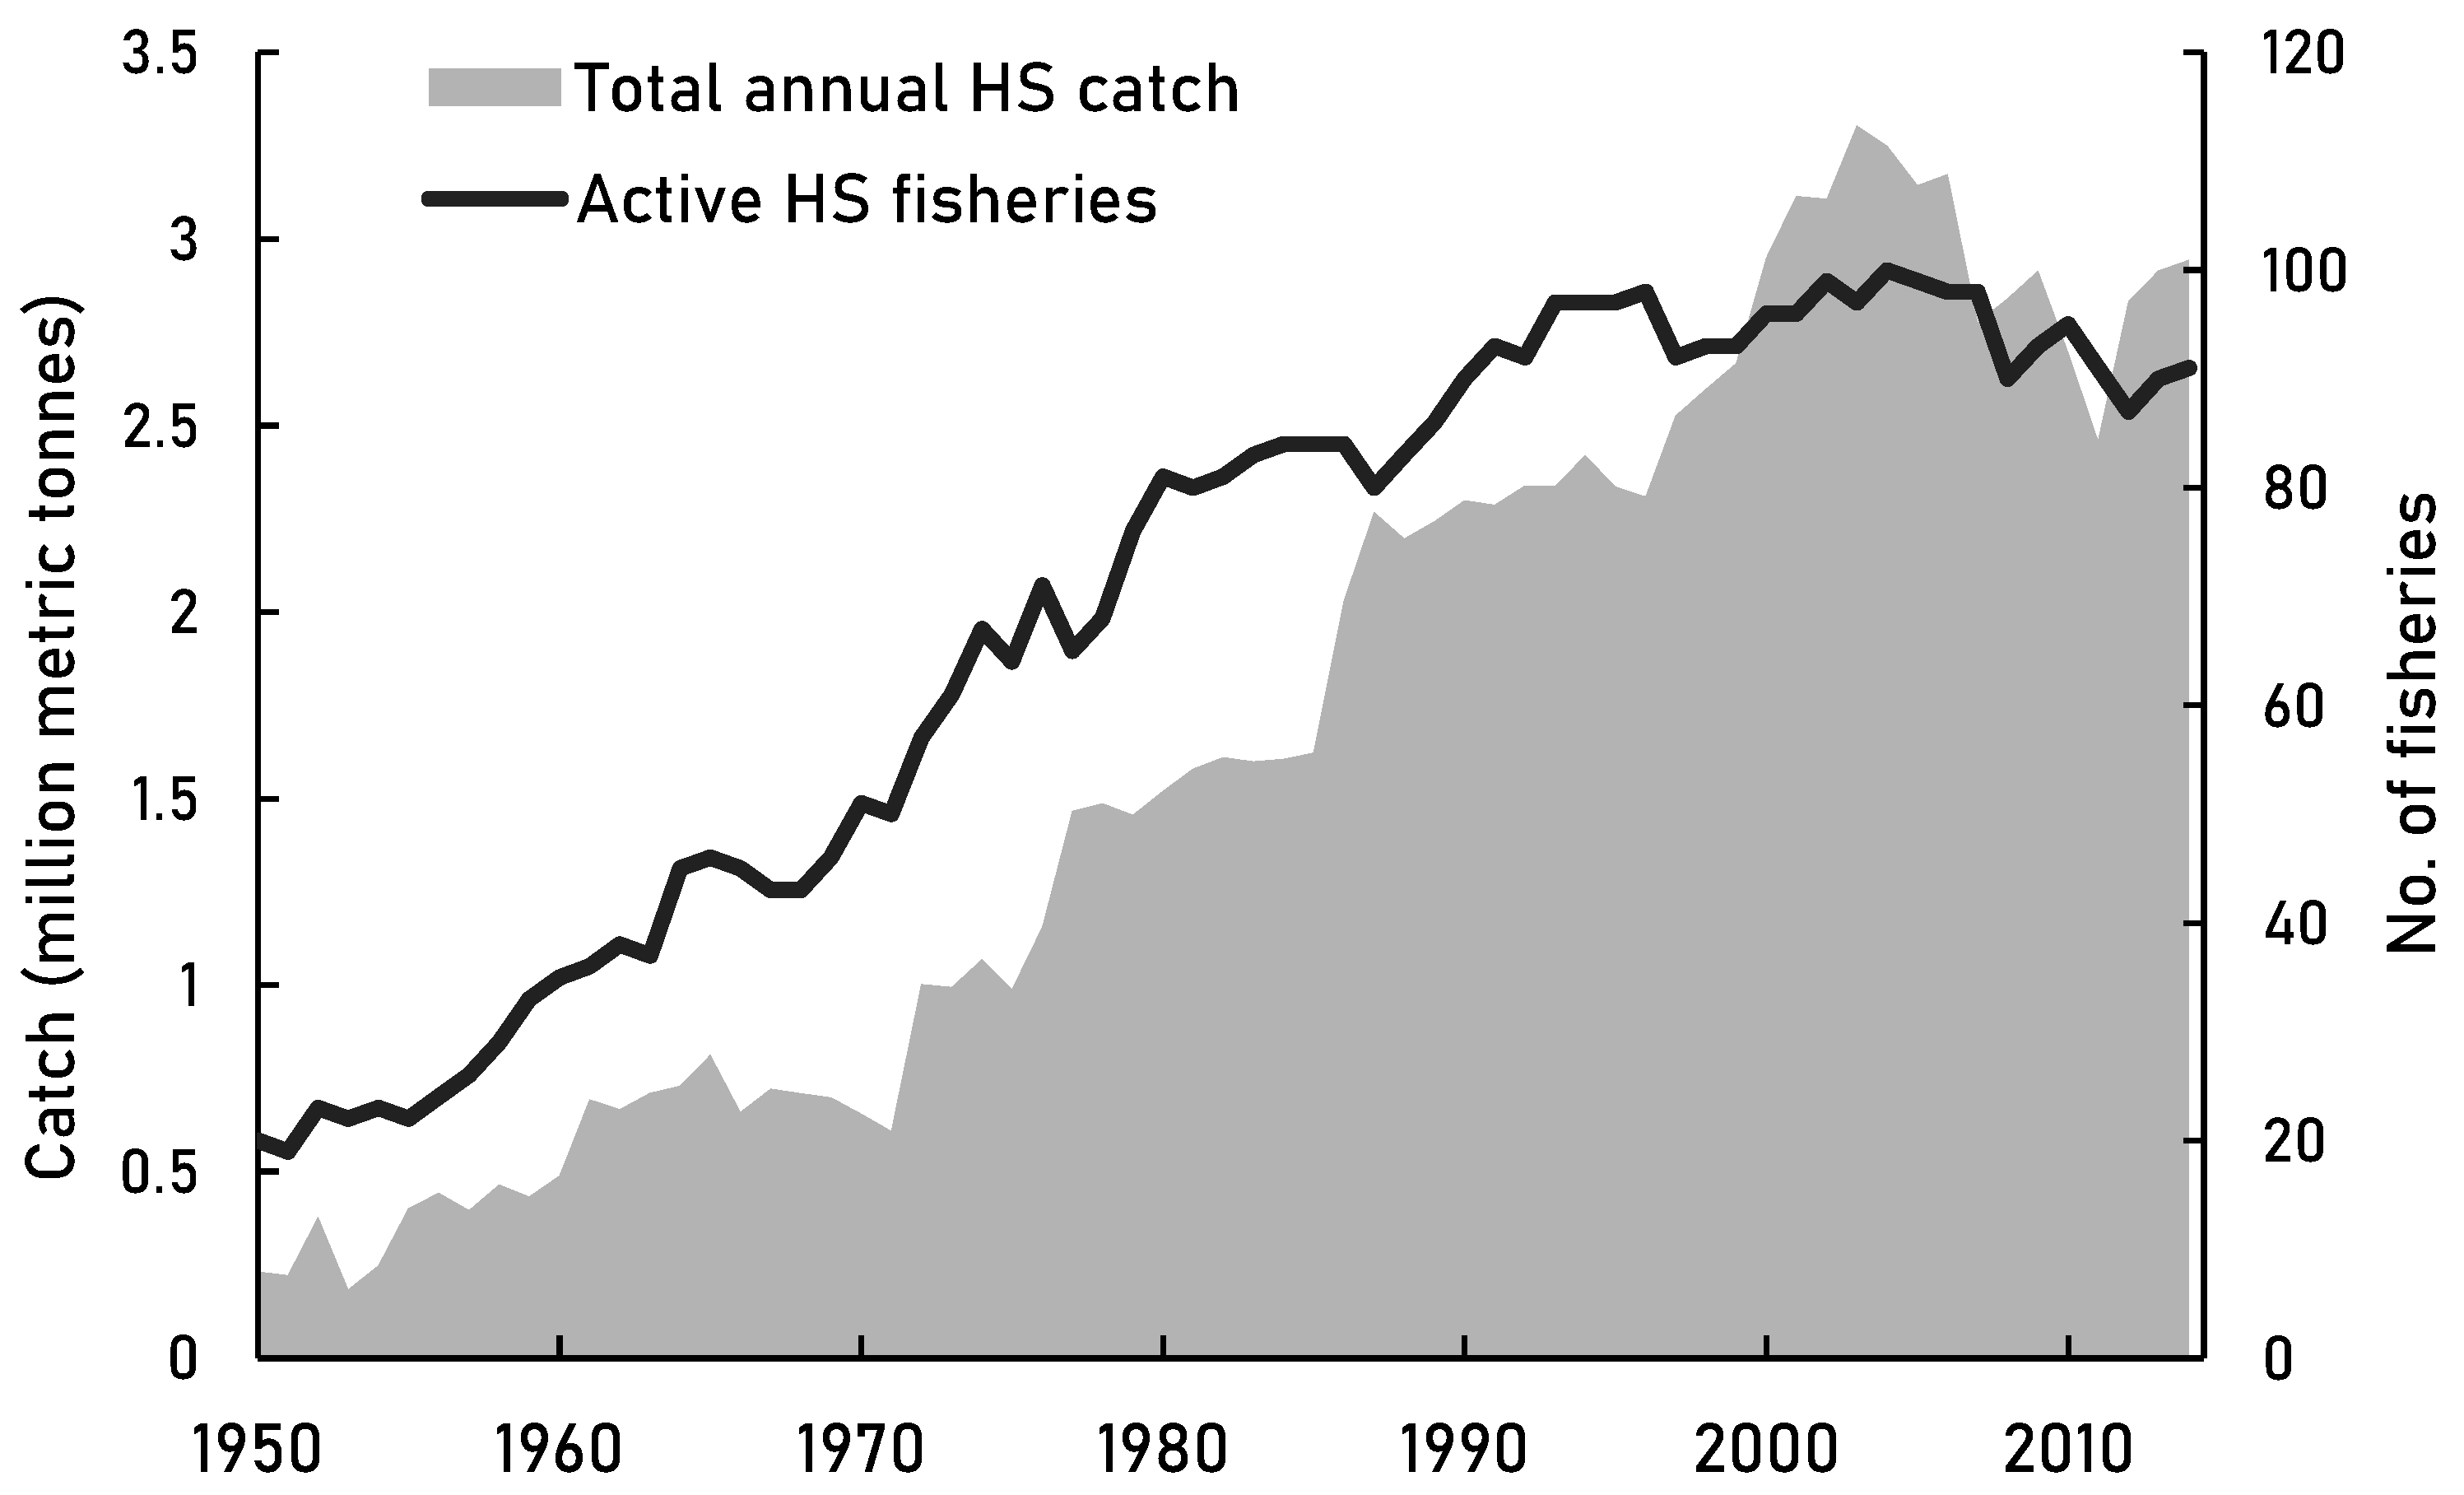
Figure 2.
The catch reconstructions data (Pauly et al., 2020) of the high seas through 1950-2014. Changes in total annual catches of active high seas fisheries over time along with the number of active high seas fisheries.
Figure 2.
The catch reconstructions data (Pauly et al., 2020) of the high seas through 1950-2014. Changes in total annual catches of active high seas fisheries over time along with the number of active high seas fisheries.
Figure 3.
The catch reconstructions data (Pauly et al., 2020) of the high seas through 1950-2014. The mean high seas catch (± 1 SEM) and the number of active fisheries per decade.
Figure 3.
The catch reconstructions data (Pauly et al., 2020) of the high seas through 1950-2014. The mean high seas catch (± 1 SEM) and the number of active fisheries per decade.
Figure 4.
The trends for high seas catch from SAUP data [
38]. and B) Top 5 high seas fisheries in 2004-2014 [
38].
Figure 4.
The trends for high seas catch from SAUP data [
38]. and B) Top 5 high seas fisheries in 2004-2014 [
38].
Figure 5.
The top 5 high seas fisheries in 2004-2014 [
38].
Figure 5.
The top 5 high seas fisheries in 2004-2014 [
38].
Figure 6.
The PCO (A) and country ordination (B) regarding variation in catch by countries that caught over 1 million tonnes in 2004-2014, and the fishing gears those countries used. Blue circles illustrate strong relationships with gear types (A) and country (B).
Figure 6.
The PCO (A) and country ordination (B) regarding variation in catch by countries that caught over 1 million tonnes in 2004-2014, and the fishing gears those countries used. Blue circles illustrate strong relationships with gear types (A) and country (B).
Figure 7.
Fishing gear trends of the countries with catches of over 1 million tonnes in 2004-2014 - Gear-specific catches compared to the total catch of 2004-2014. Gear abbreviations: ‘PS’ = purse seine, ‘LL’ = longline, and ‘BG’ = all benthic gears. ‘Other’ includes gears with smaller contributions towards the total catch of countries.
Figure 8.
Fishing gear trends of the countries with catches of over 1 million tonnes in 2004-2014 - Gear-use distribution within countries. Gear abbreviations: ‘PS’ = purse seine, ‘LL’ = longline, and ‘BG’ = all benthic gears. ‘Other’ includes gears with smaller contributions towards the total catch of countries.
Table 1.
Top 10 of subsidised high seas fleets, adapted from Sala et al., (2018).
Table 1.
Top 10 of subsidised high seas fleets, adapted from Sala et al., (2018).
| Country |
Subsidies (Million us$) |
% of Global Subsidies |
| Japan |
841 |
20.1 |
| Spain |
603 |
14.4 |
| China |
418 |
10.0 |
| South Korea |
409 |
9.8 |
| United States |
256 |
6.1 |
| Taiwan |
244 |
5.8 |
| France |
195 |
4.7 |
| Indonesia |
102 |
2.4 |
| Mexico |
32 |
0.8 |
| Panama |
25 |
0.6 |
Table 2.
IUU fishing scenarios adapted from Sumaila et al. (2020) according to the estimated contributions of high seas catches (5% and 10%) towards the global catches of fisheries (Sala et al., 2018).
Table 2.
IUU fishing scenarios adapted from Sumaila et al. (2020) according to the estimated contributions of high seas catches (5% and 10%) towards the global catches of fisheries (Sala et al., 2018).
| High Seas |
5% Scenario |
10% Scenario |
| IUU catch(million metric T) |
0.42 - 0.74 |
0.88 - 1.56 |
| Gross IUU revenue (billion US$) |
0.47 - 0.89 |
1.0 - 1.89 |
| Tax revenue loss (billion US$) |
0.11 - 0.21 |
0.22 - 0.44 |
| Economic loss (billion US$) |
1.37 - 2.63 |
2.89 - 5.56 |
Table 3.
SAUP dataset and the variables for years 1950-2014 (Pauly et al., 2020).
Table 3.
SAUP dataset and the variables for years 1950-2014 (Pauly et al., 2020).
| Variable |
Key |
| Year |
Year of fishing |
| Fishing entity |
Country with active HS fishery |
| Fishing sector |
Industrial, artisanal |
| Gear type |
See Table 4 |
| Catch type |
Landings, discards |
| Reporting status |
Reported or unreported catch |
| End use type |
Direct human consumption, discard, fish meal and oil, other |
| Sum of tonnes |
Sum of catch in tonnes (t) |
| Landed value |
Value of catch (US$) |
Table 4.
Gear types used by high seas fleets in 1950-2014 (Pauly et al., 2020).
Table 4.
Gear types used by high seas fleets in 1950-2014 (Pauly et al., 2020).
| Gear class |
Gear type |
| Mobile |
beam trawl |
| |
bottom trawl |
| |
dredge |
| |
otter trawl |
| |
pelagic trawl |
| |
purse seine |
| |
shrimp trawl |
| |
encircling nets |
| Static |
longline |
| |
gillnet |
| |
pots or traps |
| |
small scale trammel net |
| |
pole and line |
| |
hand lines |
| |
artisanal fishing gear |
| Unknown or other |
mixed gear |
| other |
| |
other industrial |
| |
other nets |
| |
unknown by source |
| |
unknown class |
Table 5.
Descriptive statistics of high seas catch by decade, SAUP data (Pauly et al., 2020). All tonnages in thousand metric tonnes.
Table 5.
Descriptive statistics of high seas catch by decade, SAUP data (Pauly et al., 2020). All tonnages in thousand metric tonnes.
| Decade |
Active fisheries |
Mean catch |
StDev |
SEM |
Total catch |
| 1950s |
35 |
97 |
± 271 |
± 46 |
3395 |
| 1960s |
54 |
128 |
± 477 |
± 65 |
6885 |
| 1970s |
82 |
133 |
± 429 |
± 47 |
10877 |
| 1980s |
101 |
181 |
± 604 |
± 60 |
18271 |
| 1990s |
116 |
208 |
± 619 |
± 57 |
24113 |
| 2000s |
118 |
259 |
± 607 |
± 56 |
30568 |
| 2010s |
103 |
134 |
± 290 |
± 29 |
13843 |
Table 6.
Descriptive statistics of purse seine and longline fisheries for both 1950-2014 and 2004-2014. All catches in thousand metric tonnes.
Table 6.
Descriptive statistics of purse seine and longline fisheries for both 1950-2014 and 2004-2014. All catches in thousand metric tonnes.
| Time period |
Gear type |
Avg catch |
StdDev |
Total catch |
Catch (% of total) |
No. of user countries |
User countries (% of N) |
| 1950-2014 |
Purse seine |
8.7 |
± 27.9 |
42,424.2 |
39.3 |
82 |
57.3 |
| Longline |
5.6 |
± 23.4 |
33,634.1 |
31.2 |
107 |
74.8 |
| 2004-2014 |
Purse seine |
13.2 |
± 33.8 |
16,659.5 |
52.2 |
64 |
55.2 |
| Longline |
4.1 |
± 16.1 |
8,363.0 |
26.2 |
92 |
79.3 |
Table 7.
Tonnages of reported and unreported discards by decade.
Table 7.
Tonnages of reported and unreported discards by decade.
| |
Discards |
| Decade |
Reported (t) |
Unreported (t x 1000) |
| 1950-1959 |
- |
857 |
| 1960-1969 |
- |
2862 |
| 1970-1979 |
- |
2780 |
| 1980-1989 |
- |
3122 |
| 1990-1999 |
- |
3174 |
| 2000-2009 |
23 |
2603 |
Table 8.
Top 5 unreported gear-specific catches for 1950-2014. All tonnages in thousand metric tonnes. Contribution (%) of gear-specific catch was calculated from total catch of each catch type category. The number of fisheries in each category: N(all catches)=131, N(landings)=39, and N(discards)=131.
| Catch type |
Gear type |
Mean catch |
StdDev |
Total catch |
Catch (% of total) |
No. of user countries |
User countries (% of N) |
| All catches |
Longline |
3.5 |
± 12.6 |
7818.4 |
45.0 |
82 |
62.6 |
| Bottom trawl |
2.7 |
± 11.2 |
5188.4 |
29.9 |
45 |
34.4 |
| Purse seine |
1.9 |
± 8.5 |
3406.0 |
19.6 |
75 |
57.3 |
| Unknown class |
0.9 |
± 2.6 |
602.5 |
3.5 |
15 |
11.5 |
| Gillnet |
0.2 |
± 0.7 |
141.1 |
0.8 |
31 |
23.7 |
| Landings |
Unknown class |
0.962 |
± 2.890 |
386.5 |
49.60 |
4 |
10.3 |
| Bottom trawl |
0.539 |
± 1.753 |
385.7 |
49.49 |
24 |
61.5 |
| Longline |
0.014 |
± 0.056 |
5.2 |
0.67 |
19 |
48.7 |
| Purse seine |
0.004 |
± 0.014 |
1.0 |
0.13 |
4 |
10.3 |
| Other nets |
0.004 |
± 0.021 |
0.3 |
0.04 |
2 |
5.1 |
| Discards |
Longline |
4.2 |
± 13.8 |
7813.2 |
47.1 |
82 |
62.6 |
| Bottom trawl |
4.0 |
± 14.0 |
4802.8 |
29.0 |
45 |
34.4 |
| Purse seine |
2.1 |
± 9.0 |
3405.0 |
20.5 |
75 |
57.3 |
| Unknown class |
0.8 |
± 2.1 |
216.0 |
1.3 |
15 |
11.5 |
| Gillnet |
0.2 |
± 0.8 |
141.0 |
0.9 |
31 |
23.7 |
Table 9.
Reporting rates of high seas fisheries that caught over 1 million tonnes in 2004-2014. Note: Two decimal places were included in the percentages for added accuracy as some countries had smaller values.
Table 9.
Reporting rates of high seas fisheries that caught over 1 million tonnes in 2004-2014. Note: Two decimal places were included in the percentages for added accuracy as some countries had smaller values.
| Country |
Landings |
Discards |
| Reported (%) |
Unreported (%) |
Total (%) |
Reported (%) |
Unreported (%) |
Total (%) |
| Ecuador |
5.60 |
0.00 |
5.60 |
0.00 |
2.57 |
2.57 |
| France |
7.04 |
0.07 |
7.04 |
0.00 |
2.98 |
2.98 |
| Indonesia |
8.60 |
0.00 |
8.59 |
0.00 |
2.58 |
2.58 |
| Japan |
28.52 |
2.98 |
28.51 |
82.63 |
49.68 |
49.68 |
| Mexico |
4.65 |
65.86 |
4.68 |
0.00 |
1.32 |
1.32 |
| Norway |
3.30 |
4.88 |
3.30 |
4.76 |
1.73 |
1.73 |
| Philippines |
5.59 |
0.00 |
5.59 |
0.00 |
1.26 |
1.26 |
| South Korea |
8.41 |
4.43 |
8.40 |
12.61 |
12.16 |
12.16 |
| Spain |
14.72 |
21.78 |
14.72 |
0.00 |
6.05 |
6.05 |
| Taiwan |
13.58 |
0.00 |
13.57 |
0.00 |
19.65 |
19.65 |
| Total % |
100.00 |
100.00 |
100.00 |
100.00 |
100.00 |
100.00 |
Table 10.
Top 5 high seas fishing gears and countries with highest rates of unreported catch in 2004-2014. Percentage of unreported catch was derived from the overall catch, which included both reported and unreported catches, as well as both ‘landings’ and ‘discards’ categories).
Table 10.
Top 5 high seas fishing gears and countries with highest rates of unreported catch in 2004-2014. Percentage of unreported catch was derived from the overall catch, which included both reported and unreported catches, as well as both ‘landings’ and ‘discards’ categories).
| Gear type |
Unreported catch (%) of total |
Country |
Unreported catch (%) of total |
| Bottom trawl |
28 |
Dominica |
100 |
| Other industrial |
25 |
Georgia |
100 |
| Dredge |
23 |
Sierra Leone |
100 |
| Longline |
20 |
Saint Pierre & Miquelon (Fr.) |
66 |
| Unknown by source |
13 |
Fiji |
28 |
Table 11.
Top 5 unreported gear-specific catches for 2004-2014. All tonnages in thousand metric tonnes. Contribution (%) of gear-specific catch was calculated from total catch of each catch type category. The number of fisheries in categories: N(all catches)=100, N(landings)=29, and N(discards)=100.
| Catch type |
Gear type |
Average catch |
StdDev |
Total catch |
Catch (% of total) |
No. of user countries |
User countries (% of N) |
| All catches |
Longline |
2.0 |
± 6.4 |
1644.4 |
60.7 |
69 |
69.0 |
| Purse seine |
1.5 |
± 3.7 |
719.9 |
26.6 |
57 |
57.0 |
| Bottom trawl |
0.5 |
± 0.9 |
157.9 |
5.8 |
27 |
27.0 |
| Unknown class |
0.7 |
± 1.5 |
86.9 |
3.2 |
12 |
12.0 |
| Pelagic trawl |
0.6 |
± 1.5 |
39.6 |
1.5 |
9 |
9.0 |
| Landings |
Bottom trawl |
0.439 |
± 0.912 |
49.1 |
56.4 |
13 |
44.8 |
| Unknown class |
0.642 |
± 1.302 |
33.4 |
38.3 |
3 |
10.3 |
| Longline |
0.017 |
± 0.066 |
4.5 |
5.2 |
18 |
62.1 |
| Other |
0.007 |
± 0.017 |
0.1 |
0.1 |
3 |
10.3 |
| Gillnet |
0.003 |
± 0.002 |
0.026 |
0.03 |
2 |
6.9 |
| Discards |
Longline |
3.0 |
± 7.7 |
1639.9 |
62.5 |
67 |
67.0 |
| Purse seine |
1.5 |
± 3.7 |
719.9 |
27.5 |
57 |
57.0 |
| Bottom trawl |
0.5 |
± 0.9 |
108.7 |
4.1 |
27 |
27.0 |
| Unknown class |
0.8 |
± 1.7 |
53.5 |
2.0 |
12 |
12.0 |
| Pelagic trawl |
0.7 |
± 1.7 |
39.6 |
1.5 |
8 |
8.0 |
