Submitted:
04 April 2024
Posted:
05 April 2024
You are already at the latest version
Abstract
Keywords:
1. Introduction
2. Materials and Methods
2.1. Species Identification from Tannery Wastewaters
2.1.1. Tannery Wastewater Collection and Preparation
2.1.2. Species Isolation
2.1.3. Species Identification
2.2. Microorganism Identification from Leather Biodegradation Assay
2.2.1. ISO:20136:2020: Determination of Leather Degradability by Microorganisms’ Assay
2.2.2. Wastewater and Leather Biodegradation Assay Sample Collection
2.2.3. DNA Extraction and Quality Control
2.2.4. Sequence Library Preparation
2.2.5. Sequencing
2.2.6. Bioinformatic Analysis
3. Results
3.1. Species Identification from Tannery Wastewaters Treatment Plant (Curtidos Serpiel S.A., Caudete, Spain)
3.1.1. Species Identification
3.2. Microorganism Identification from Leather Biodegradation Assay Using ISO 20136:2020
3.2.1. ISO:20136: Leather- Determination of Degradability by Microorganisms
3.2.2. Sequencing
3.2.3. Bioinformatics and Species Identification
4. Discussion
4.1. Species Identification from Tannery Wastewaters
4.2. Microorganism Identification from Leather Biodegradation Assay
4.2.1. ISO:20136:2020: Leather- Determination of Degradability by Microorganisms
4.2.2. Bioinformatics and Species Identification
5. Conclusions
Author Contributions
Funding
Data Availability Statement
Conflicts of Interest
References
- Covington, A.D. Tanning Chemistry: The Science of Leather; Royal Society of Chemistry, 2009; ISBN 978-0-85404-170-1.
- Muthukrishnan, L. Nanotechnology for Cleaner Leather Production: A Review. Environ Chem Lett 2021, 19, 2527–2549. [Google Scholar] [CrossRef]
- Hao, D.; Wang, X.; Liang, S.; Yue, O.; Liu, X.; Hao, D.; Dang, X. Sustainable Leather Making — An Amphoteric Organic Chrome-Free Tanning Agents Based on Recycling Waste Leather. Science of The Total Environment 2023, 867, 161531. [Google Scholar] [CrossRef] [PubMed]
- Rosu, L.; Varganici, C.; Crudu, A.; Rosu, D.; Bele, A. Ecofriendly Wet–White Leather vs. Conventional Tanned Wet–Blue Leather. A Photochemical Approach. Journal of Cleaner Production 2018, 177, 708–720. [Google Scholar] [CrossRef]
- Gao, D.; Li, X.; Cheng, Y.; Lyu, B.; Ma, J. The Modification of Collagen with Biosustainable POSS Graft Oxidized Sodium Alginate Composite. International Journal of Biological Macromolecules 2022, 200, 557–565. [Google Scholar] [CrossRef] [PubMed]
- Ariram, N.; Madhan, B. Development of Bio-Acceptable Leather Using Bagasse. Journal of Cleaner Production 2020, 250, 119441. [Google Scholar] [CrossRef]
- Hassan, M.M.; Harris, J.; Busfield, J.J.C.; Bilotti, E. A Review of the Green Chemistry Approaches to Leather Tanning in Imparting Sustainable Leather Manufacturing. Green Chem. 2023, 25, 7441–7469. [Google Scholar] [CrossRef]
- Hansen, É.; de Aquim, P.M.; Gutterres, M. Environmental Assessment of Water, Chemicals and Effluents in Leather Post-Tanning Process: A Review. Environmental Impact Assessment Review 2021, 89, 106597. [Google Scholar] [CrossRef]
- Basaran, B.; Ulaş, M.; Bitlisli, B.; Aslan, A. Distribution of Cr (III) and Cr (VI) in Chrome Tanned Leather. Indian Journal of Chemical Technology 2008, 15, 511–514. [Google Scholar]
- Anderson, R.A. Nutritional Role of Chromium. Science of The Total Environment 1981, 17, 13–29. [Google Scholar] [CrossRef] [PubMed]
- Wang, Y.; Su, H.; Gu, Y.; Song, X.; Zhao, J. Carcinogenicity of Chromium and Chemoprevention: A Brief Update. OncoTargets and Therapy 2017, 10, 4065–4079. [Google Scholar] [CrossRef]
- Chojnacka, K.; Skrzypczak, D.; Mikula, K.; Witek-Krowiak, A.; Izydorczyk, G.; Kuligowski, K.; Bandrów, P.; Kułażyński, M. Progress in Sustainable Technologies of Leather Wastes Valorization as Solutions for the Circular Economy. Journal of Cleaner Production 2021, 313, 127902. [Google Scholar] [CrossRef]
- Leather Goods Market - Industry Analysis Report 2032. Available online: https://www.gminsights.com/industry-analysis/leather-goods-market (accessed on 30 January 2024).
- Oruko, R.O.; Selvarajan, R.; Ogola, H.J.O.; Edokpayi, J.N.; Odiyo, J.O. Contemporary and Future Direction of Chromium Tanning and Management in Sub Saharan Africa Tanneries. Process Safety and Environmental Protection 2020, 133, 369–386. [Google Scholar] [CrossRef]
- Fela, K.; Wieczorek-Ciurowa, K.; Konopka, M.; Woźny, Z. Present and Prospective Leather Industry Waste Disposal. Polish Journal of Chemical Technology 2011, 13, 53–55. [Google Scholar] [CrossRef]
- Alam, N.; Sayid Mia, Md.A.; Ahmad, F.; Rahman, M. An Overview of Chromium Removal Techniques from Tannery Effluent. Applied Water Science 2020, 10. [Google Scholar] [CrossRef]
- Benalia, M.C.; Youcef, L.; Bouaziz, M.G.; Achour, S.; Menasra, H. Removal of Heavy Metals from Industrial Wastewater by Chemical Precipitation: Mechanisms and Sludge Characterization. Arab J Sci Eng 2022, 47, 5587–5599. [Google Scholar] [CrossRef]
- Kocaoba, S.; Cetin, G.; Akcin, G. Chromium Removal from Tannery Wastewaters with a Strong Cation Exchange Resin and Species Analysis of Chromium by MINEQL+. Sci Rep 2022, 12, 9618. [Google Scholar] [CrossRef] [PubMed]
- Younas, F.; Niazi, N.K.; Bibi, I.; Afzal, M.; Hussain, K.; Shahid, M.; Aslam, Z.; Bashir, S.; Hussain, M.M.; Bundschuh, J. Constructed Wetlands as a Sustainable Technology for Wastewater Treatment with Emphasis on Chromium-Rich Tannery Wastewater. Journal of Hazardous Materials 2022, 422, 126926. [Google Scholar] [CrossRef] [PubMed]
- Boussouga, Y.-A.; Okkali, T.; Luxbacher, T.; Schäfer, A.I. Chromium (III) and Chromium (VI) Removal and Organic Matter Interaction with Nanofiltration. Science of The Total Environment 2023, 885, 163695. [Google Scholar] [CrossRef] [PubMed]
- Villaseñor-Basulto, D.L.; Kadier, A.; Singh, R.; Navarro-Mendoza, R.; Bandala, E.; Peralta-Hernández, J.M. Post-Tanning Wastewater Treatment Using Electrocoagulation: Optimization, Kinetics, and Settlement Analysis. Process Safety and Environmental Protection 2022, 165, 872–886. [Google Scholar] [CrossRef]
- Krishna, R.; Chintalpudi, V.; Muddada, S. Application of Biosorption for Removal of Heavy Metals from Wastewater. In; 2018 ISBN 978-1-78923-472-5.
- Fernández, P.M.; Viñarta, S.C.; Bernal, A.R.; Cruz, E.L.; Figueroa, L.I.C. Bioremediation Strategies for Chromium Removal: Current Research, Scale-up Approach and Future Perspectives. Chemosphere 2018, 208, 139–148. [Google Scholar] [CrossRef] [PubMed]
- GracePavithra, K.; Jaikumar, V.; Kumar, P.S.; SundarRajan, P. A Review on Cleaner Strategies for Chromium Industrial Wastewater: Present Research and Future Perspective. Journal of Cleaner Production 2019, 228, 580–593. [Google Scholar] [CrossRef]
- Pradhan, D.; Sukla, L.B.; Sawyer, M.; Rahman, P.K.S.M. Recent Bioreduction of Hexavalent Chromium in Wastewater Treatment: A Review. Journal of Industrial and Engineering Chemistry 2017, 55, 1–20. [Google Scholar] [CrossRef]
- Sutkowy, M.; Kłosowski, G. Use of the Coenobial Green Algae Pseudopediastrum Boryanum (Chlorophyceae) to Remove Hexavalent Chromium from Contaminated Aquatic Ecosystems and Industrial Wastewaters. Water 2018, 10, 712. [Google Scholar] [CrossRef]
- Bakshi, A.; Panigrahi, A.K. Chromium Contamination in Soil and Its Bioremediation: An Overview. In Advances in Bioremediation and Phytoremediation for Sustainable Soil Management: Principles, Monitoring and Remediation; Malik, J.A., Ed.; Springer International Publishing: Cham, 2022; pp. 229–248. ISBN 978-3-030-89984-4. [Google Scholar]
- Cunningham, S.D.; Ow, D.W. Promises and Prospects of Phytoremediation. Plant Physiology 1996, 110, 715–719. [Google Scholar] [CrossRef] [PubMed]
- Landfill Waste - European Commission. Available online: https://environment.ec.europa.eu/topics/waste-and-recycling/landfill-waste_en (accessed on 29 January 2024).
- Directive 2008/98/EC of the European Parliament and of the Council of 19 November 2008 on Waste and Repealing Certain Directives (Text with EEA Relevance); 2008; Vol. 312;
- Ding, W.; Liu, H.; Remón, J.; Jiang, Z.; Chen, G.; Pang, X.; Ding, Z. A Step-Change toward a Sustainable and Chrome-Free Leather Production: Using a Biomass-Based, Aldehyde Tanning Agent Combined with a Pioneering Terminal Aluminum Tanning Treatment (BAT-TAT). Journal of Cleaner Production 2022, 333, 130201. [Google Scholar] [CrossRef]
- A Guide to Modern Leather Making. Available online: https://www.leathernaturally.org/a-guide-to-modern-leather-making/ (accessed on 31 March 2024).
- Yu, Y.; Lin, Y.; Zeng, Y.; Wang, Y.; Zhang, W.; Zhou, J.; Shi, B. Life Cycle Assessment for Chrome Tanning, Chrome-Free Metal Tanning, and Metal-Free Tanning Systems. ACS Sustainable Chem. Eng. 2021, 9, 6720–6731. [Google Scholar] [CrossRef]
- Zhou, Y.; Ma, J.; Gao, D.; Li, W.; Shi, J.; Ren, H. A Novel Chrome-Free Tanning Approach Based on Sulfonated Tetraphenyl Calix [4]Resorcinarene: Preparation and Application. Journal of Cleaner Production 2018, 201, 668–677. [Google Scholar] [CrossRef]
- China, C.R.; Maguta, M.M.; Nyandoro, S.S.; Hilonga, A.; Kanth, S.V.; Njau, K.N. Alternative Tanning Technologies and Their Suitability in Curbing Environmental Pollution from the Leather Industry: A Comprehensive Review. Chemosphere 2020, 254, 126804. [Google Scholar] [CrossRef]
- Sardroudi, N.P.; Sorolla, S.; Casas, C.; Bacardit, A. A Study of the Composting Capacity of Different Kinds of Leathers, Leatherette and Alternative Materials. Sustainability 2024, 16, 2324. [Google Scholar] [CrossRef]
- ISO ISO 17088:2021. Available online: https://www.iso.org/standard/74994.html (accessed on 19 March 2024).
- IULTCS ISO 20136:2020. Available online: https://www.iso.org/standard/75892.html (accessed on 20 November 2023).
- NZYMicrobial gDNA Isolation Kit. Available online: https://www.nzytech.com/en/mb21702-nzy-microbial-gdna-isolation-kit/ (accessed on 16 November 2023).
- GFX PCR DNA and Gel Band Purification Kits. Available online: https://www.cytivalifesciences.com/en/us/shop/molecular-and-immunodiagnostics/pcr-cleanup-and-size-selection/illustra-gfx-pcr-dna-and-gel-band-purification-kits-p-00386 (accessed on 1 February 2024).
- Español - Curtidos Segorbe S.L. Available online: http://www.curtidosegorbe.com/curtidos-segorbe-s-l/espanol/ (accessed on 22 February 2024).
- Collagen from bovine achilles tendon powder, suitable for substrate for collagenase | 9007-34-5. Available online: http://www.sigmaaldrich.com/ (accessed on 20 November 2023).
- Ake, A.H.J.; Hafidi, M.; Ouhdouch, Y.; Jemo, M.; Aziz, S.; El Fels, L. Microorganisms from Tannery Wastewater: Isolation and Screening for Potential Chromium Removal. Environmental Technology & Innovation 2023, 31, 103167. [Google Scholar] [CrossRef]
- QIAsymphony PowerFecal Pro DNA Kit. Available online: https://www.qiagen.com/us/products/discovery-and-translational-research/dna-rna-purification/dna-purification/microbial-dna/qiasymphony-powerfecal-pro-dna-kit?catno=938036 (accessed on 20 November 2023).
- QIAamp DNA Accessory Set, Micro and Mini Kits - QIAGEN. Available online: https://www.qiagen.com/us/products/discovery-and-translational-research/dna-rna-purification/dna-purification/genomic-dna/qiaamp-dna-kits?catno=56304 (accessed on 20 November 2023).
- Nextera XT DNA Library Prep Kit | Sequence Small Genomes, Plasmids, cDNA. Available online: https://emea.illumina.com/products/by-type/sequencing-kits/library-prep-kits/nextera-xt-dna.html (accessed on 20 November 2023).
- Klindworth, A.; Pruesse, E.; Schweer, T.; Peplies, J.; Quast, C.; Horn, M.; Glöckner, F.O. Evaluation of General 16S Ribosomal RNA Gene PCR Primers for Classical and Next-Generation Sequencing-Based Diversity Studies. Nucleic Acids Research 2013, 41, e1. [Google Scholar] [CrossRef] [PubMed]
- Quant-iTTM PicoGreenTM dsDNA Assay Kits and dsDNA Reagents. Available online: https://www.thermofisher.com/order/catalog/product/es/en/P7589 (accessed on 20 November 2023).
- Bioanalyzer Instruments for Sample Quality Control | Agilent. Available online: https://www.agilent.com/en/product/automated-electrophoresis/bioanalyzer-systems/bioanalyzer-instrument (accessed on 8 February 2024).
- Thermo Scientific™ Estándar de ADN GeneRuler Mix, listo para su uso - Marcadores de peso molecular de ácidos nucleicos Productos bioquímicos y reactivos. Available online: https://www.fishersci.es/shop/products/fermentas-generuler-ready-to-use-dna-ladder-mix-1/11531605 (accessed on 8 February 2024).
- Church, D.L.; Cerutti, L.; Gürtler, A.; Griener, T.; Zelazny, A.; Emler, S. Performance and Application of 16S rRNA Gene Cycle Sequencing for Routine Identification of Bacteria in the Clinical Microbiology Laboratory. Clinical Microbiology Reviews 2020, 33. [Google Scholar] [CrossRef] [PubMed]
- Oksanen, J.; Blanchet, F.G.; Friendly, M.; Kindt, R.; Legendre, P.; McGlinn, D.; Minchin, P.R.; O’hara, R.B.; Simpson, G.L.; Solymos, P. Vegan: Community Ecology Package. R Package Version 2.5-7. 2020. Preprint at 2022, 3–1.
- Graciano-Ávila, G.; Aguirre-Calderón, Ó.A.; Alanís-Rodríguez, E.; Lujan-Soto, J.E. Composición, Estructura y Diversidad de Especies Arbóreas En Un Bosque Templado Del Noroeste de México. Ecosistemas y recursos agropecuarios 2017, 4, 535–542. [Google Scholar] [CrossRef]
- Moreno, C.E. Métodos Para Medir La Biodiversidad. M&T–Manuales y Tesis SEA, Vol. 1. Zaragoza 2001, 84, 2. [Google Scholar]
- Kim, B.-R.; Shin, J.; Guevarra, R.; Lee, J.H.; Kim, D.W.; Seol, K.-H.; Lee, J.-H.; Kim, H.B.; Isaacson, R. Deciphering Diversity Indices for a Better Understanding of Microbial Communities. J Microbiol Biotechnol 2017, 27, 2089–2093. [Google Scholar] [CrossRef] [PubMed]
- National Center for Biotechnology Information. Available online: https://www.ncbi.nlm.nih.gov/ (accessed on 20 February 2024).
- Ijaz, U.Z.; Sivaloganathan, L.; McKenna, A.; Richmond, A.; Kelly, C.; Linton, M.; Stratakos, A.C.; Lavery, U.; Elmi, A.; Wren, B.W. Comprehensive Longitudinal Microbiome Analysis of the Chicken Cecum Reveals a Shift from Competitive to Environmental Drivers and a Window of Opportunity for Campylobacter. Frontiers in microbiology 2018, 9, 2452. [Google Scholar] [CrossRef] [PubMed]
- Beye, M.; Fahsi, N.; Raoult, D.; Fournier, P.-E. Careful Use of 16S rRNA Gene Sequence Similarity Values for the Identification of Mycobacterium Species. New Microbes New Infect 2017, 22, 24–29. [Google Scholar] [CrossRef]
- Stackebrandt, E. Taxonomic Parameters Revisited: Tarnished Gold Standards. Microbial Today 2006, 33, 152. [Google Scholar]
- Rossi-Tamisier, M.; Benamar, S.; Raoult, D.; Fournier, P.-E. Cautionary Tale of Using 16S rRNA Gene Sequence Similarity Values in Identification of Human-Associated Bacterial Species. International Journal of Systematic and Evolutionary Microbiology 2015, 65, 1929–1934. [Google Scholar] [CrossRef]
- Rani, N.; Kaur, G.; Kaur, S.; Mutreja, V.; Pandey, N. Plant Growth-Promoting Attributes of Zinc Solubilizing Dietzia Maris Isolated from Polyhouse Rhizospheric Soil of Punjab. Curr Microbiol 2022, 80, 48. [Google Scholar] [CrossRef] [PubMed]
- Gharibzahedi, S.M.T.; Razavi, S.H.; Mousavi, M. Potential Applications and Emerging Trends of Species of the Genus Dietzia: A Review. Ann Microbiol 2014, 64, 421–429. [Google Scholar] [CrossRef]
- Venil, C.K.; Malathi, M.; Devi, P.R. Characterization of Dietzia Maris AURCCBT01 from Oil-Contaminated Soil for Biodegradation of Crude Oil. 3 Biotech 2021, 11, 291. [Google Scholar] [CrossRef] [PubMed]
- Gillard, B.; Chatzievangelou, D.; Thomsen, L.; Ullrich, M.S. Heavy-Metal-Resistant Microorganisms in Deep-Sea Sediments Disturbed by Mining Activity: An Application Toward the Development of Experimental in Vitro Systems. Frontiers in Marine Science 2019, 6. [Google Scholar] [CrossRef]
- Gholami, M.; Etemadifar, Z. Isolation and Characterization of a Novel Strain of Genus Dietzia Capable of Multiple-Extreme Resistance. Microbiology 2015, 84, 389–397. [Google Scholar] [CrossRef]
- Tandukar, M.; Huber, S.J.; Onodera, T.; Pavlostathis, S.G. Biological Chromium(VI) Reduction in the Cathode of a Microbial Fuel Cell. Environ. Sci. Technol. 2009, 43, 8159–8165. [Google Scholar] [CrossRef] [PubMed]
- Qian, J.; Wei, L.; Liu, R.; Jiang, F.; Hao, X.; Chen, G.-H. An Exploratory Study on the Pathways of Cr (VI) Reduction in Sulfate-Reducing Up-Flow Anaerobic Sludge Bed (UASB) Reactor. Sci Rep 2016, 6, 23694. [Google Scholar] [CrossRef] [PubMed]
- Dey, S.; Paul, A.K.; Dey, S.; Paul, A.K. Assessment of Heavy Metal Tolerance and Hexavalent Chromium Reducing Potential of <em>Corynebacterium Paurometabolum</Em> SKPD 1204 Isolated from Chromite Mine Seepage. AIMSBOA 2016, 3, 337–351. [Google Scholar] [CrossRef]
- Viti, C.; Pace, A.; Giovannetti, L. Characterization of Cr(VI)-Resistant Bacteria Isolated from Chromium-Contaminated Soil by Tannery Activity. Curr Microbiol 2003, 46, 1–5. [Google Scholar] [CrossRef] [PubMed]
- Lun, L.; Li, D.; Yin, Y.; Li, D.; Xu, G.; Zhao, Z.; Li, S. Characterization of Chromium Waste Form Based on Biocementation by Microbacterium Sp. GM-1. Indian J Microbiol 2016, 56, 353–360. [Google Scholar] [CrossRef]
- Mishra, S.; Chen, S.; Saratale, G.D.; Saratale, R.G.; Romanholo Ferreira, L.F.; Bilal, M.; Bharagava, R.N. Reduction of Hexavalent Chromium by Microbacterium Paraoxydans Isolated from Tannery Wastewater and Characterization of Its Reduced Products. Journal of Water Process Engineering 2021, 39, 101748. [Google Scholar] [CrossRef]
- Chaudhary, P.; Beniwal, V.; Umar, A.; Kumar, R.; Sharma, P.; Kumar, A.; Al-Hadeethi, Y.; Chhokar, V. In Vitro Microcosm of Co-Cultured Bacteria for the Removal of Hexavalent Cr and Tannic Acid: A Mechanistic Approach to Study the Impact of Operational Parameters. Ecotoxicology and Environmental Safety 2021, 208, 111484. [Google Scholar] [CrossRef] [PubMed]
- Upadhyay, N.; Vishwakarma, K.; Singh, J.; Mishra, M.; Kumar, V.; Rani, R.; Mishra, R.K.; Chauhan, D.K.; Tripathi, D.K.; Sharma, S. Tolerance and Reduction of Chromium(VI) by Bacillus Sp. MNU16 Isolated from Contaminated Coal Mining Soil. Front Plant Sci 2017, 8, 778. [Google Scholar] [CrossRef] [PubMed]
- Zheng, Z.; Li, Y.; Zhang, X.; Liu, P.; Ren, J.; Wu, G.; Zhang, Y.; Chen, Y.; Li, X. A Bacillus Subtilis Strain Can Reduce Hexavalent Chromium to Trivalent and an nfrA Gene Is Involved. International Biodeterioration & Biodegradation 2015, 97, 90–96. [Google Scholar] [CrossRef]
- Ayele, A.; Godeto, Y. Bioremediation of Chromium by Microorganisms and Its Mechanisms Related to Functional Groups. Journal of Chemistry 2021, 2021, 1–21. [Google Scholar] [CrossRef]
- Bhattacharya, A.; Gupta, A.; Kaur, A.; Malik, D. Alleviation of Hexavalent Chromium by Using Microorganisms: Insight into the Strategies and Complications. Water Science and Technology 2019, 79, 411–424. [Google Scholar] [CrossRef] [PubMed]
- Chen, X.; Zhao, Y.; Zhang, C.; Zhang, D.; Yao, C.; Meng, Q.; Zhao, R.; Wei, Z. Speciation, Toxicity Mechanism and Remediation Ways of Heavy Metals during Composting: A Novel Theoretical Microbial Remediation Method Is Proposed. Journal of Environmental Management 2020, 272, 111109. [Google Scholar] [CrossRef] [PubMed]
- Leong, Y.K.; Chang, J.-S. Bioremediation of Heavy Metals Using Microalgae: Recent Advances and Mechanisms. Bioresource Technology 2020, 303, 122886. [Google Scholar] [CrossRef] [PubMed]
- Javanbakht, V.; Alavi, S.A.; Zilouei, H. Mechanisms of Heavy Metal Removal Using Microorganisms as Biosorbent. Water Sci Technol 2014, 69, 1775–1787. [Google Scholar] [CrossRef] [PubMed]
- Wang, J.; Chen, C. Biosorbents for Heavy Metals Removal and Their Future. Biotechnology Advances 2009, 27, 195–226. [Google Scholar] [CrossRef] [PubMed]
- Mishra, S.; Doble, M. Novel Chromium Tolerant Microorganisms: Isolation, Characterization and Their Biosorption Capacity. Ecotoxicol Environ Saf 2008, 71, 874–879. [Google Scholar] [CrossRef] [PubMed]
- Hossan, S.; Hossain, S.; Islam, M.R.; Kabir, M.H.; Ali, S.; Islam, M.S.; Imran, K.M.; Moniruzzaman, M.; Mou, T.J.; Parvez, A.K.; et al. Bioremediation of Hexavalent Chromium by Chromium Resistant Bacteria Reduces Phytotoxicity. Int J Environ Res Public Health 2020, 17, 6013. [Google Scholar] [CrossRef] [PubMed]
- Zhao, J.; Wu, Q.; Tang, Y.; Zhou, J.; Guo, H. Tannery Wastewater Treatment: Conventional and Promising Processes, an Updated 20-Year Review. J Leather Sci Eng 2022, 4, 10. [Google Scholar] [CrossRef]
- Hong, S.-H.; Bunge, J.; Jeon, S.-O.; Epstein, S.S. Predicting Microbial Species Richness. Proceedings of the National Academy of Sciences 2006, 103, 117–122. [Google Scholar] [CrossRef] [PubMed]
- Sahoo, S.; Sahoo, R.K.; Gaur, M.; Behera, D.U.; Sahu, A.; Das, A.; Dey, S.; Dixit, S.; Subudhi, E. Environmental Carbapenem-Resistant Acinetobacter Baumannii in Wastewater Receiving Urban River System of Eastern India: A Public Health Threat. Int. J. Environ. Sci. Technol. 2023, 20, 9901–9910. [Google Scholar] [CrossRef]
- Hu, L.; Liu, B.; Li, S.; Zhong, H.; He, Z. Study on the Oxidative Stress and Transcriptional Level in Cr(VI) and Hg(II) Reducing Strain Acinetobacter Indicus Yy-1 Isolated from Chromium-Contaminated Soil. Chemosphere 2021, 269, 128741. [Google Scholar] [CrossRef] [PubMed]
- Sevak, P.; Pushkar, B.; Mazumdar, S. Mechanistic Evaluation of Chromium Bioremediation in Acinetobacter Junii Strain B2w: A Proteomic Approach. J Environ Manage 2023, 328, 116978. [Google Scholar] [CrossRef]
- Zakaria, Z.A.; Zakaria, Z.; Surif, S.; Ahmad, W.A. Biological Detoxification of Cr(VI) Using Wood-Husk Immobilized Acinetobacter Haemolyticus. Journal of Hazardous Materials 2007, 148, 164–171. [Google Scholar] [CrossRef] [PubMed]
- Fadhil, G.; Alhadithi, H.; E. A.Al-Razzaq Bioremediation of Polycyclic Aromatic Hydrocarbon by Acinetobacter Species Isolated from Ecological Source. Journal of Environmental Biology 2017, 38, 785–789. [Google Scholar] [CrossRef]
- Abdulmalik, A.F.; Yakasai, H.M.; Usman, S.; Muhammad, J.B.; Jagaba, A.H.; Ibrahim, S.; Babandi, A.; Shukor, M.Y. Characterization and Invitro Toxicity Assay of Bio-Reduced Hexavalent Chromium by Acinetobacter Sp. Isolated from Tannery Effluent. Case Studies in Chemical and Environmental Engineering 2023, 8, 100459. [Google Scholar] [CrossRef]
- Montes-Robledo, A.; Baena-Baldiris, D.; Baldiris-Avila, R. Reduction of Cr(VI) by Planktonic Cells and Biofilm of Acinetobacter Sp. (ADHR1) Isolated from Electroplating Wastewater. Environmental Technology & Innovation 2024, 33, 103521. [Google Scholar] [CrossRef]
- Ghosh, A.; Sah, D.; Chakraborty, M.; Rai, J.P.N. Bio-Mediated Detoxification of Heavy Metal Contaminated Soil and Phytotoxicity Reduction Using Novel Strain of Brevundimonas Vancanneytii SMA3. Heliyon 2023, 9, e22344. [Google Scholar] [CrossRef] [PubMed]
- Lee, Y.W.; Lee, K.H.; Lee, S.Y.; Im, W.-T. Brevundimonas Fluminis Sp. Nov., Isolated from a River. International Journal of Systematic and Evolutionary Microbiology 2020, 70, 204–210. [Google Scholar] [CrossRef] [PubMed]
- Liu, L.; Feng, Y.; Wei, L.; Zong, Z. Genome-Based Taxonomy of Brevundimonas with Reporting Brevundimonas Huaxiensis Sp. Nov. Microbiology Spectrum 2021, 9. [Google Scholar] [CrossRef] [PubMed]
- Peng, M.; Zhao, Z.; Liang, Z. Biodegradation of Ochratoxin A and Ochratoxin B by Brevundimonas Naejangsanensis Isolated from Soil. Food Control 2022, 133, 108611. [Google Scholar] [CrossRef]
- Naqqash, T.; Imran, A.; Hameed, S.; Shahid, M.; Majeed, A.; Iqbal, J.; Hanif, M.K.; Ejaz, S.; Malik, K.A. First Report of Diazotrophic Brevundimonas Spp. as Growth Enhancer and Root Colonizer of Potato. Sci Rep 2020, 10, 12893. [Google Scholar] [CrossRef] [PubMed]
- Sharma, P.; Chaturvedi, P.; Chandra, R.; Kumar, S. Identification of Heavy Metals Tolerant Brevundimonas Sp. from Rhizospheric Zone of Saccharum Munja L. and Their Efficacy in in-Situ Phytoremediation. Chemosphere 2022, 295, 133823. [Google Scholar] [CrossRef] [PubMed]
- Zhang, X.; Gong, Z.; Allinson, G.; Li, X.; Jia, C. Joint Effects of Bacterium and Biochar in Remediation of Antibiotic-Heavy Metal Contaminated Soil and Responses of Resistance Gene and Microbial Community. Chemosphere 2022, 299, 134333. [Google Scholar] [CrossRef] [PubMed]
- Ali, A.; Li, M.; Su, J.; Li, Y.; Wang, Z.; Bai, Y.; Ali, E.F.; Shaheen, S.M. Brevundimonas Diminuta Isolated from Mines Polluted Soil Immobilized Cadmium (Cd2+) and Zinc (Zn2+) through Calcium Carbonate Precipitation: Microscopic and Spectroscopic Investigations. Science of The Total Environment 2022, 813, 152668. [Google Scholar] [CrossRef] [PubMed]
- Yang, X.; Li, Y.; Feng, R.; Chen, J.; Alwathnani, H.A.; Xu, W.; Rensing, C. Characterization of Two Highly Arsenic-Resistant Caulobacteraceae Strains of Brevundimonas Nasdae: Discovery of a New Arsenic Resistance Determinant. International Journal of Molecular Sciences 2022, 23, 5619. [Google Scholar] [CrossRef]
- Soto, J.; Charles, T.C.; Lynch, M.D.J.; Larama, G.; Herrera, H.; Arriagada, C. Genome Sequence of Brevundimonas Sp., an Arsenic Resistant Soil Bacterium. Diversity 2021, 13, 344. [Google Scholar] [CrossRef]
- Huang, R.-R.; Yang, S.-R.; Zhen, C.; Ge, X.-F.; Chen, X.-K.; Wen, Z.-Q.; Li, Y.-N.; Liu, W.-Z. Genomic Molecular Signatures Determined Characterization of Mycolicibacterium Gossypii Sp. Nov., a Fast-Growing Mycobacterial Species Isolated from Cotton Field Soil. Antonie van Leeuwenhoek 2021, 114, 1735–1744. [Google Scholar] [CrossRef] [PubMed]
- Dahl, J.L.; Gatlin III, W.; Tran, P.M.; Sheik, C.S. Mycolicibacterium Nivoides Sp. Nov Isolated from a Peat Bog. Int J Syst Evol Microbiol 2021, 71, 004438. [Google Scholar] [CrossRef] [PubMed]
- Jeong, J.; Ahn, S.; Truong, T.C.; Kim, J.-H.; Weerawongwiwat, V.; Lee, J.-S.; Yoon, J.-H.; Sukhoom, A.; Kim, W. Description of Mycolicibacterium Arenosum Sp. Nov. Isolated from Coastal Sand on the Yellow Sea Coast. Curr Microbiol 2024, 81, 73. [Google Scholar] [CrossRef] [PubMed]
- Pan, X.; Li, Z.; Huang, S.; Huang, Y.; Wang, Q.; Tao, Z.; Hu, W. Mycolicibacterium Aurantiacum Sp. Nov. and Mycolicibacterium Xanthum Sp. Nov., Two Novel Actinobacteria Isolated from Mangrove Sediments. International Journal of Systematic and Evolutionary Microbiology 2022, 72, 005595. [Google Scholar] [CrossRef] [PubMed]
- Zhu, G.-X.; Chen, X.; Wu, Y.-J.; Wang, H.-L.; Lu, C.-M.; Wang, X.-M.; Zhang, Y.; Liu, Z.-C.; He, J.-B.; Tang, S.-K.; et al. Mycolicibacterium Arseniciresistens Sp. Nov., Isolated from Lead–Zinc Mine Tailing, and Reclassification of Two Mycobacterium Species as Mycolicibacterium Palauense Comb. Nov. and Mycolicibacterium Grossiae Comb. Nov. International Journal of Systematic and Evolutionary Microbiology 2024, 74, 006221. [Google Scholar] [CrossRef] [PubMed]
- Kim, K.K.; Lee, K.C.; Eom, M.K.; Kim, J.-S.; Kim, D.-S.; Ko, S.-H.; Kim, B.-H.; Lee, J.-S. Variibacter Gotjawalensis Gen. Nov., Sp. Nov., Isolated from Soil of a Lava Forest. Antonie van Leeuwenhoek 2014, 105, 915–924. [Google Scholar] [CrossRef] [PubMed]
- Yang, W.; Wang, S.; Ni, W.; Rensing, C.; Xing, S. Enhanced Cd-Zn-Pb-Contaminated Soil Phytoextraction by Sedum Alfredii and the Rhizosphere Bacterial Community Structure and Function by Applying Organic Amendments. Plant Soil 2019, 444, 101–118. [Google Scholar] [CrossRef]
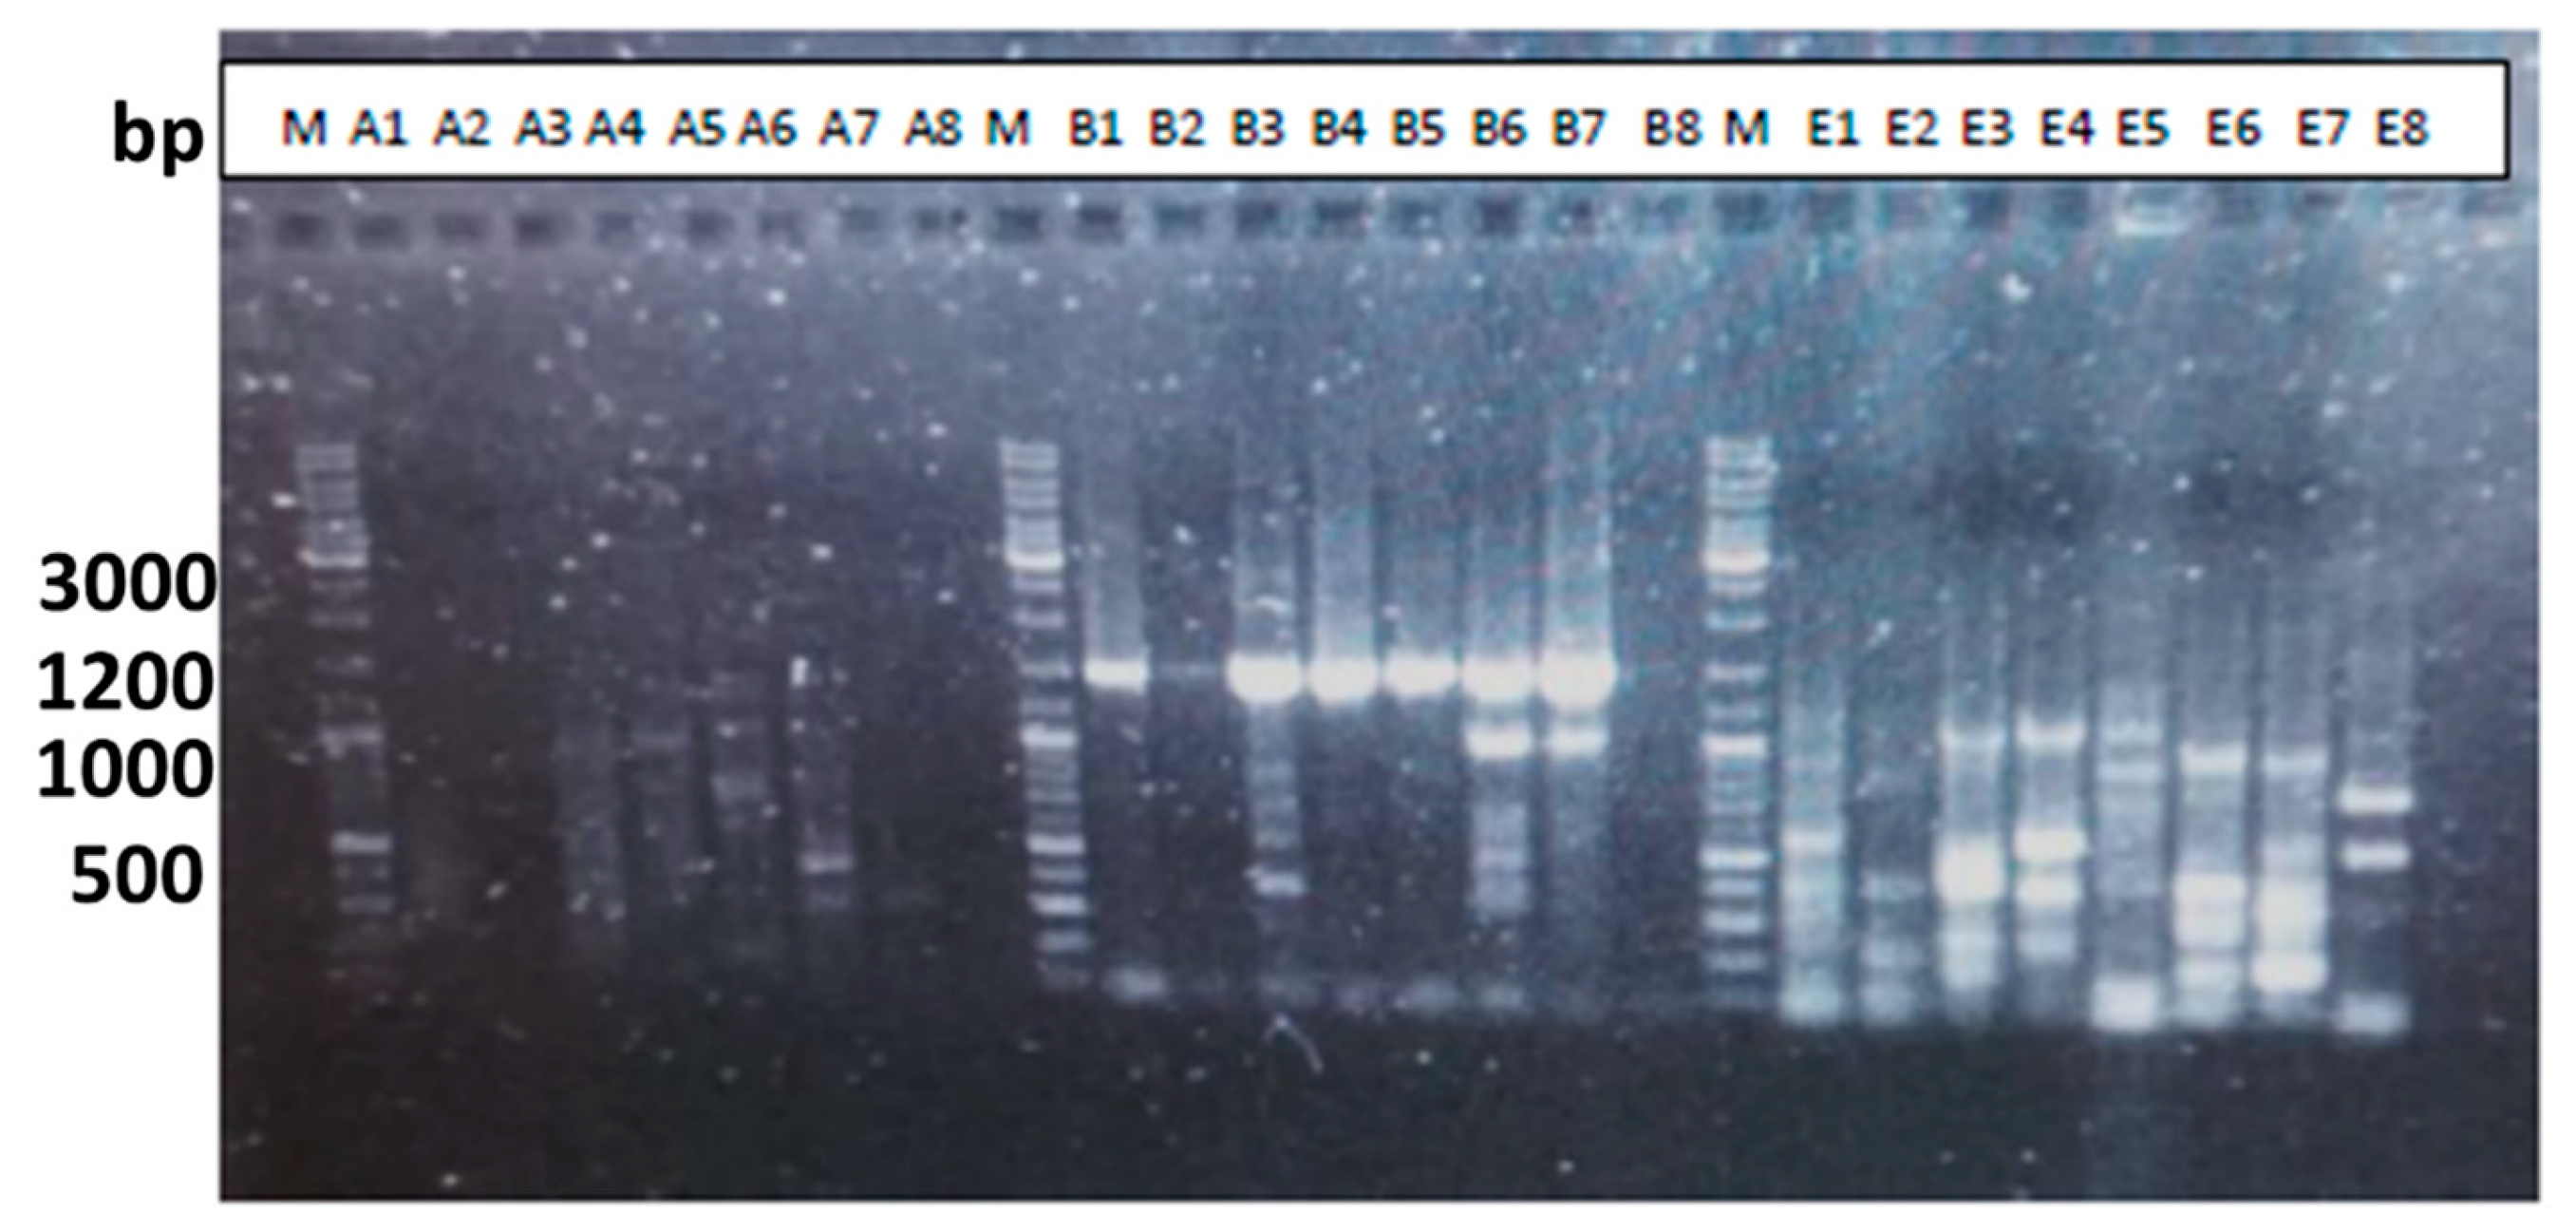
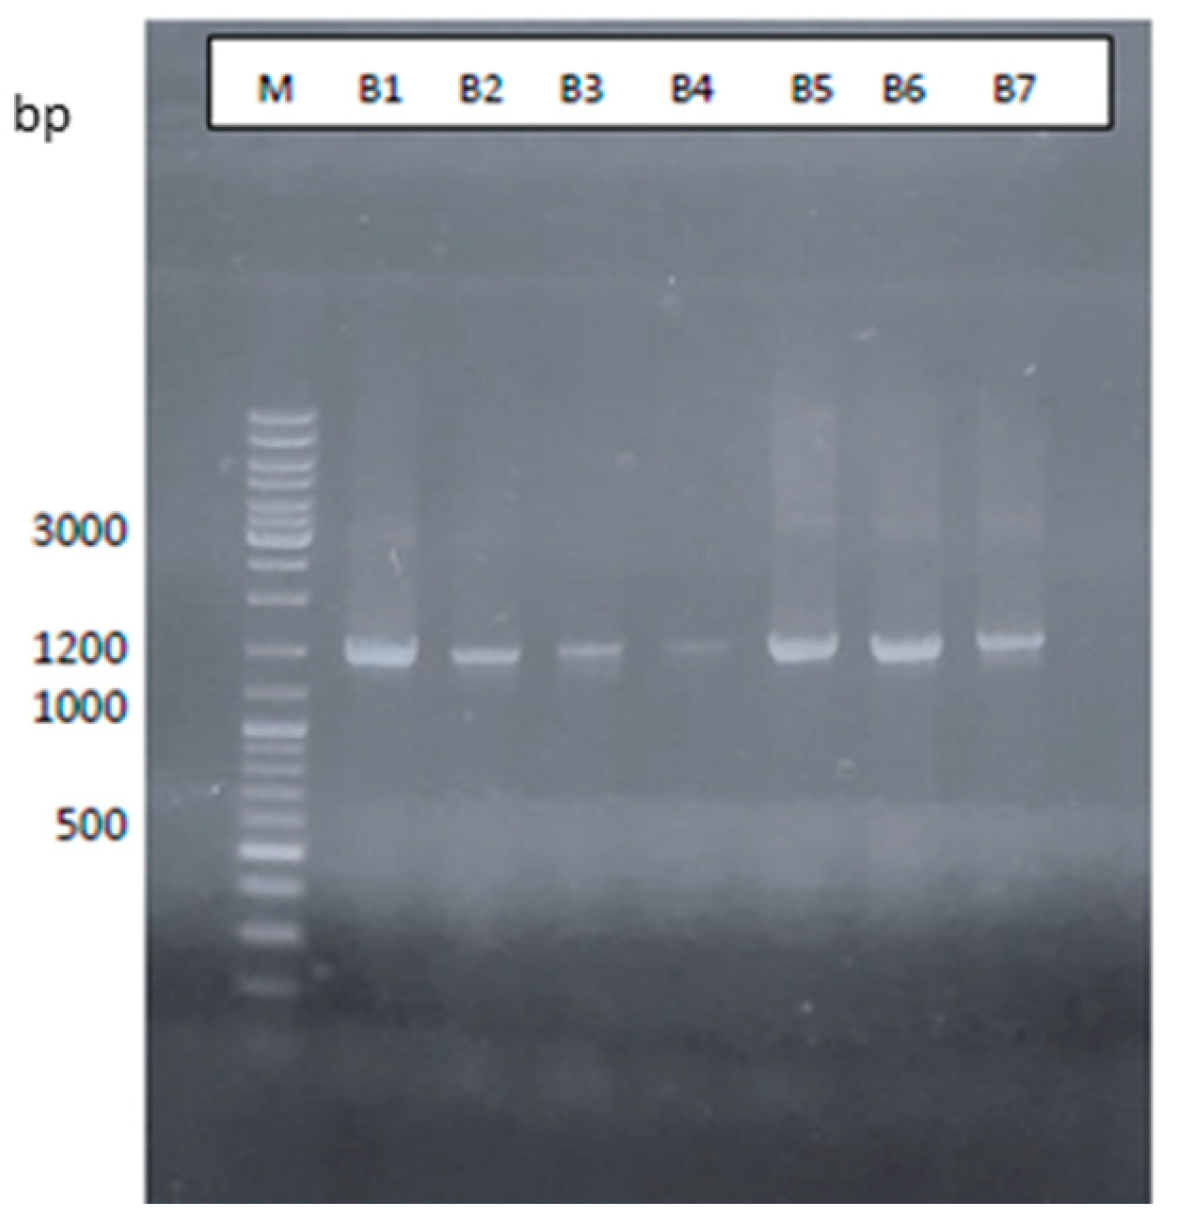

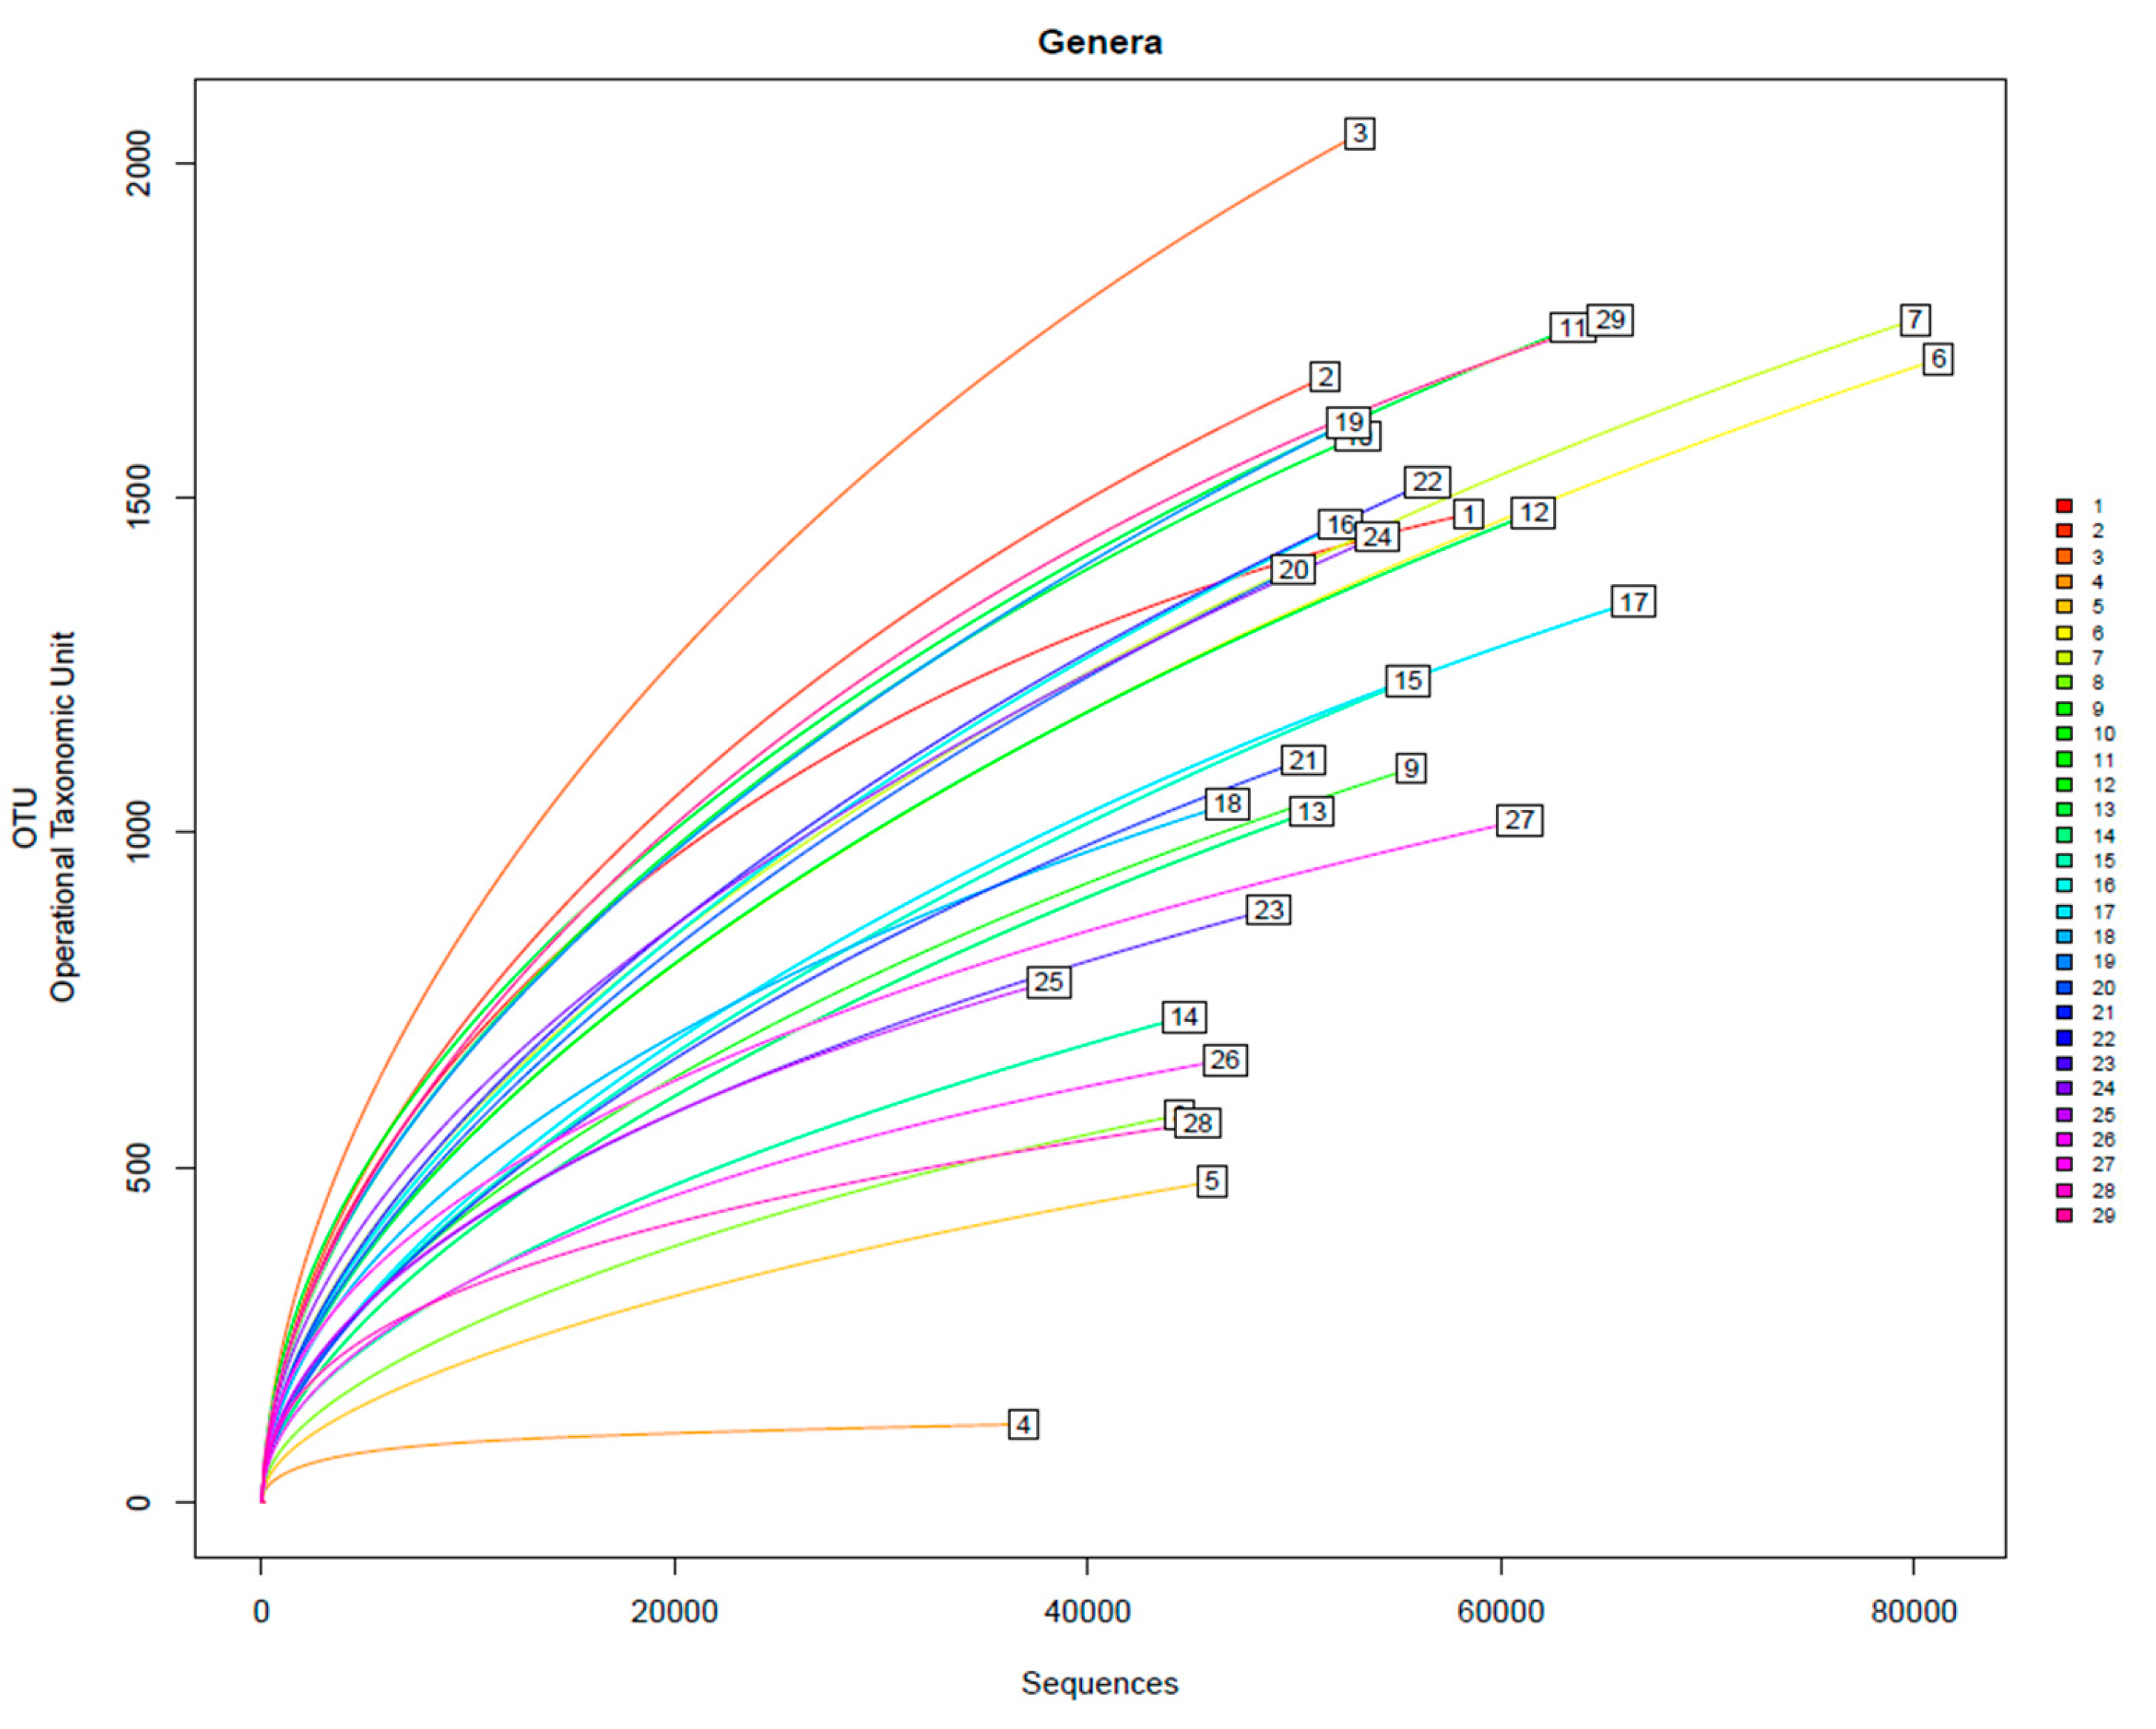
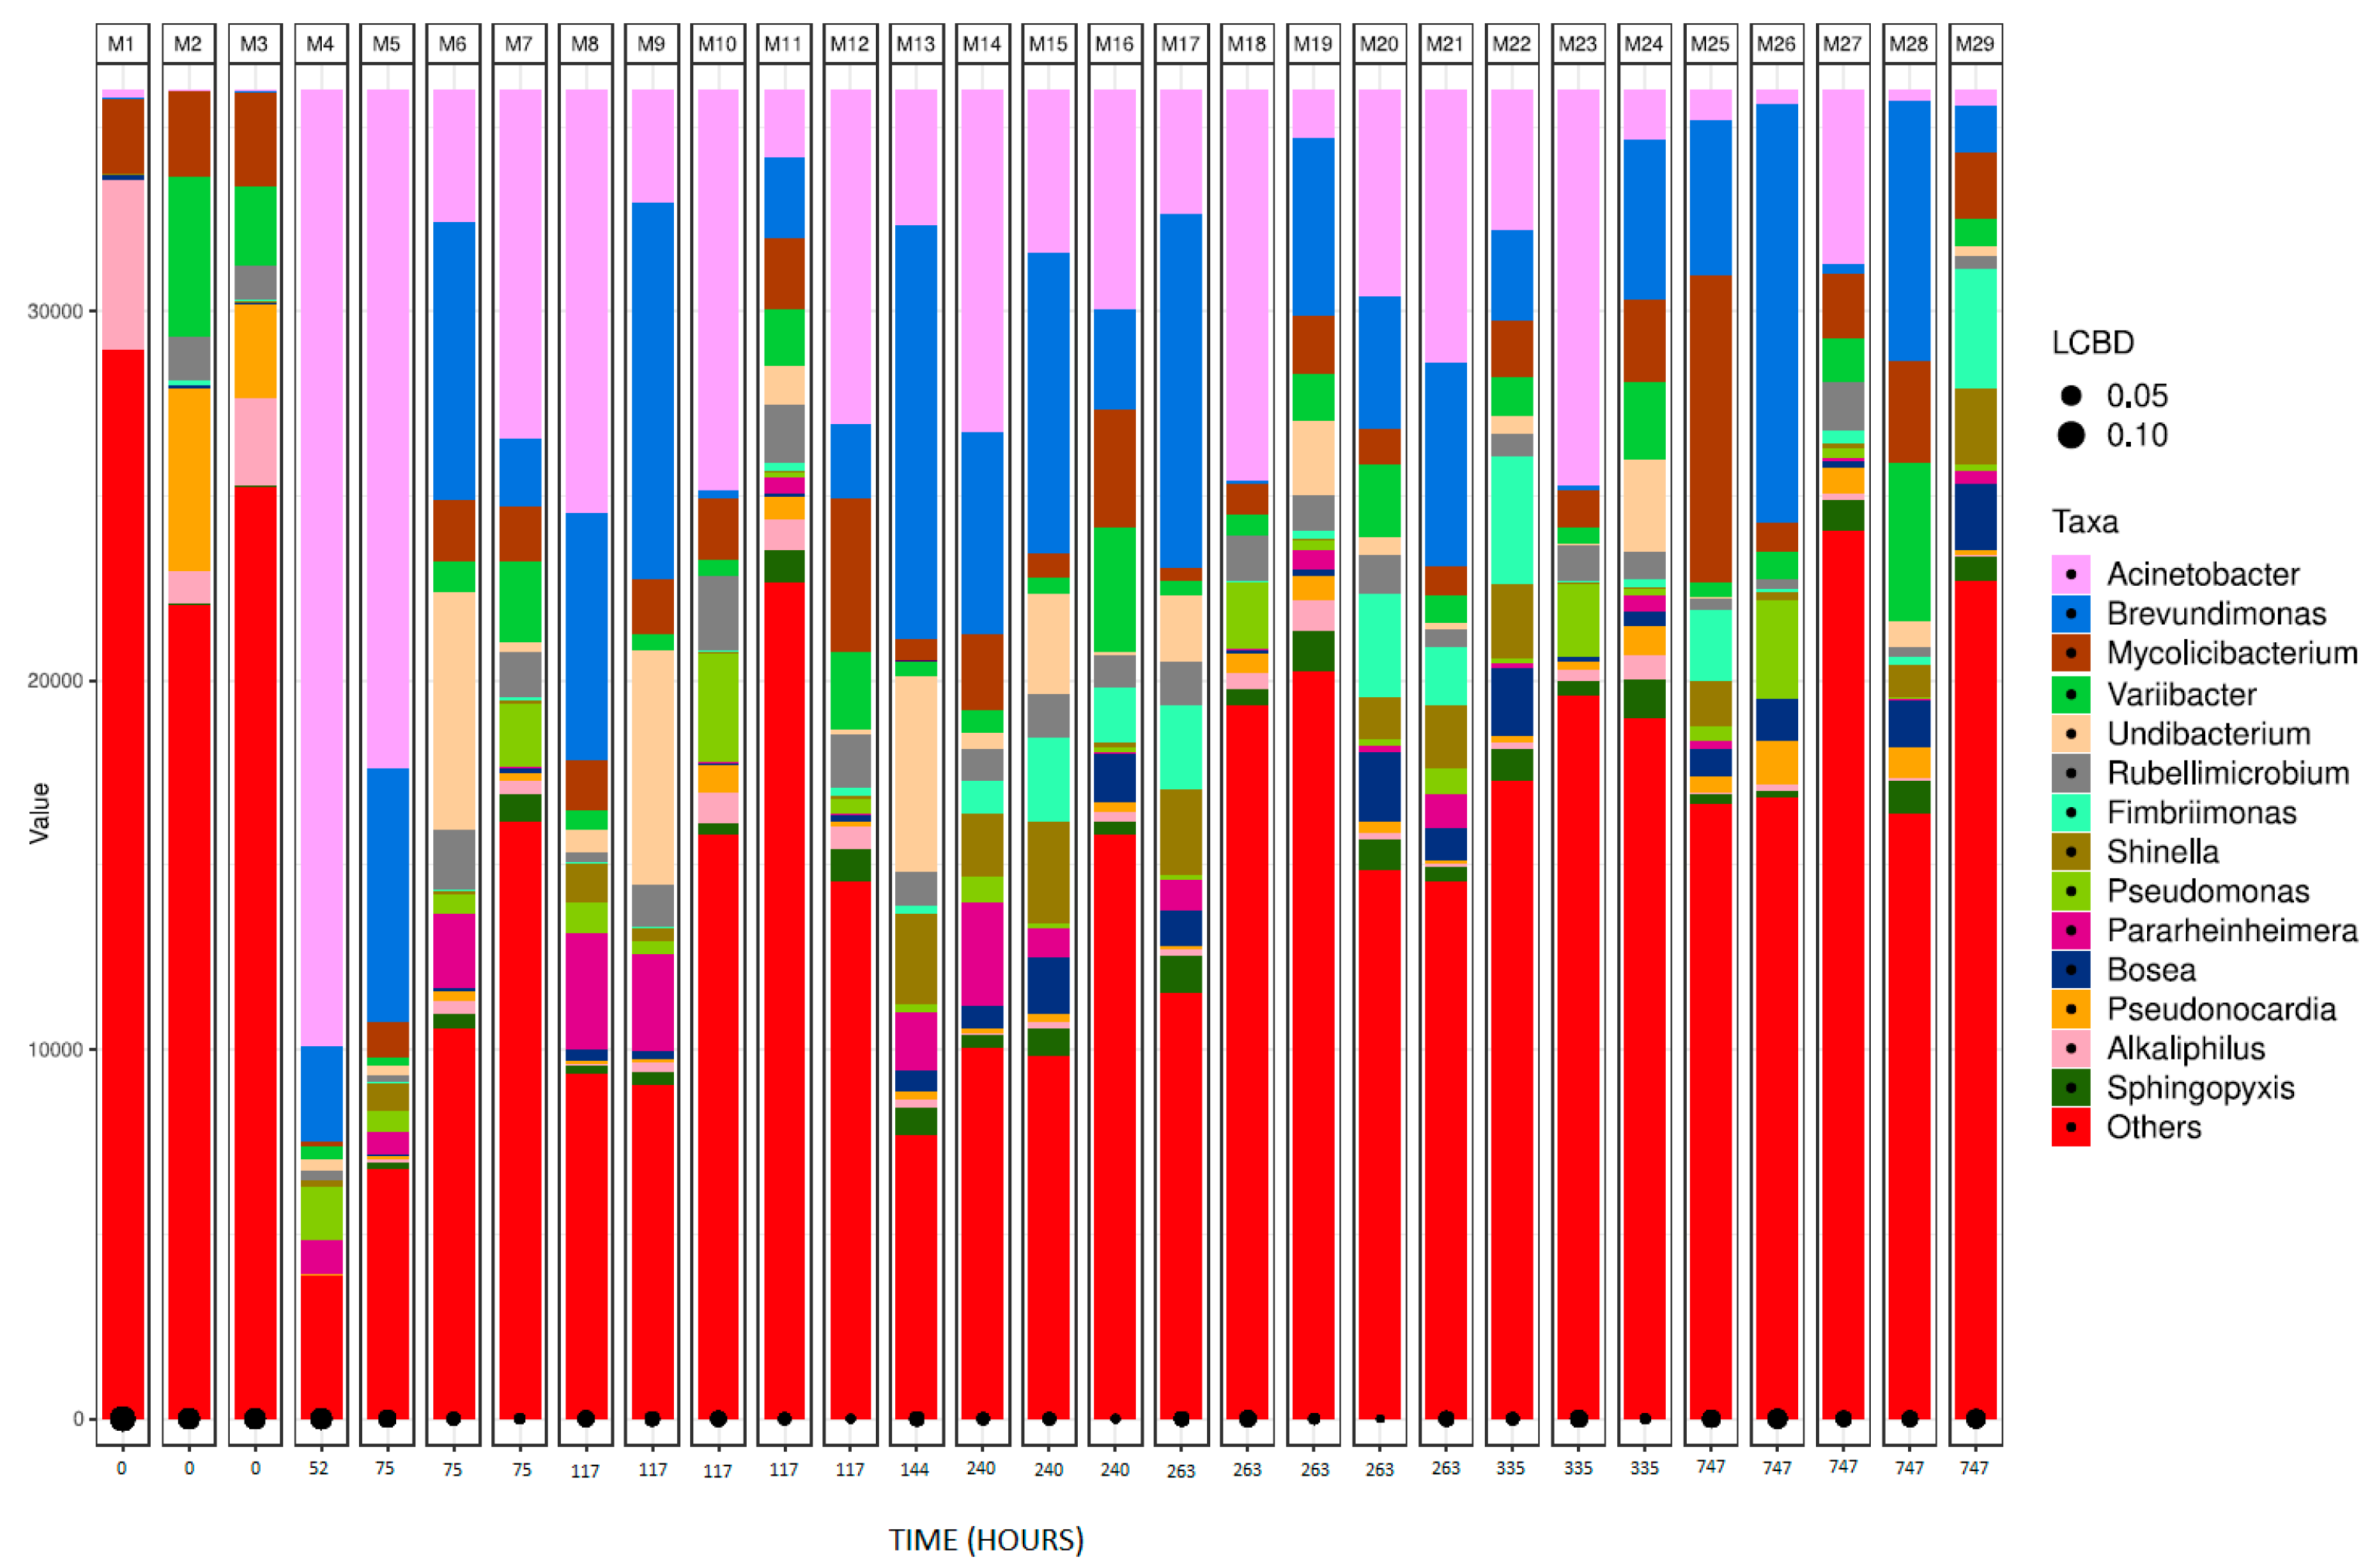
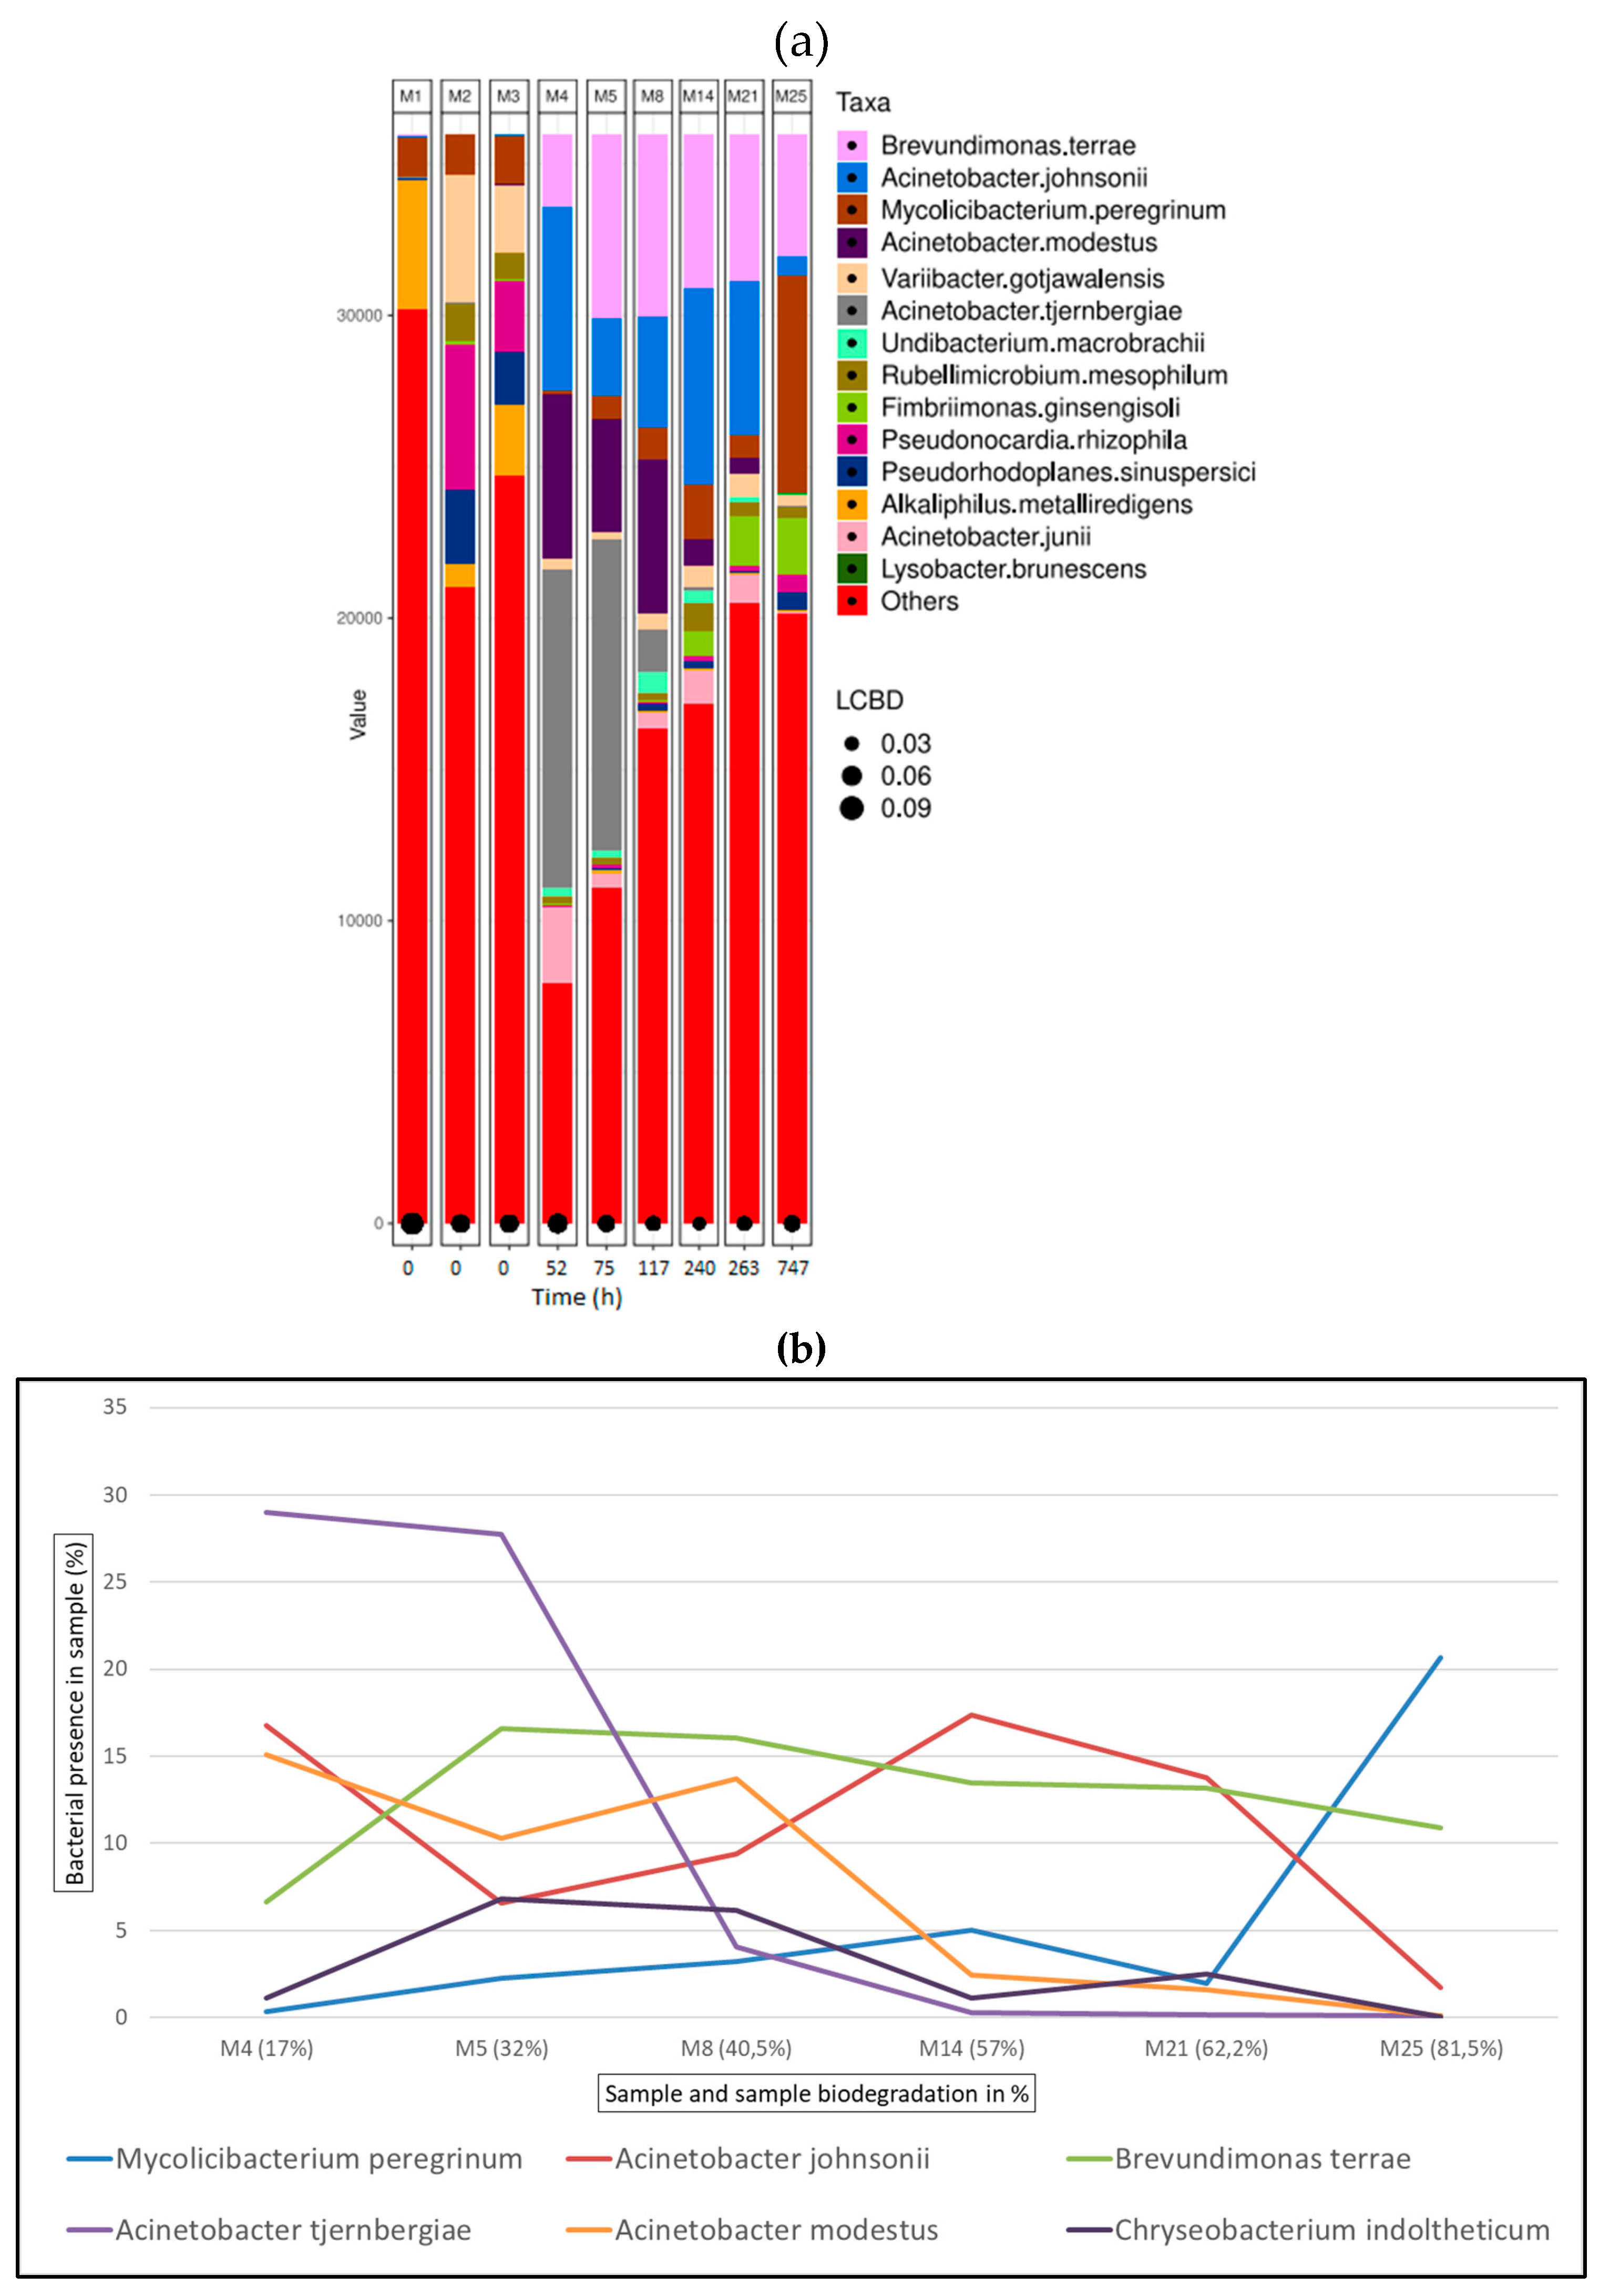
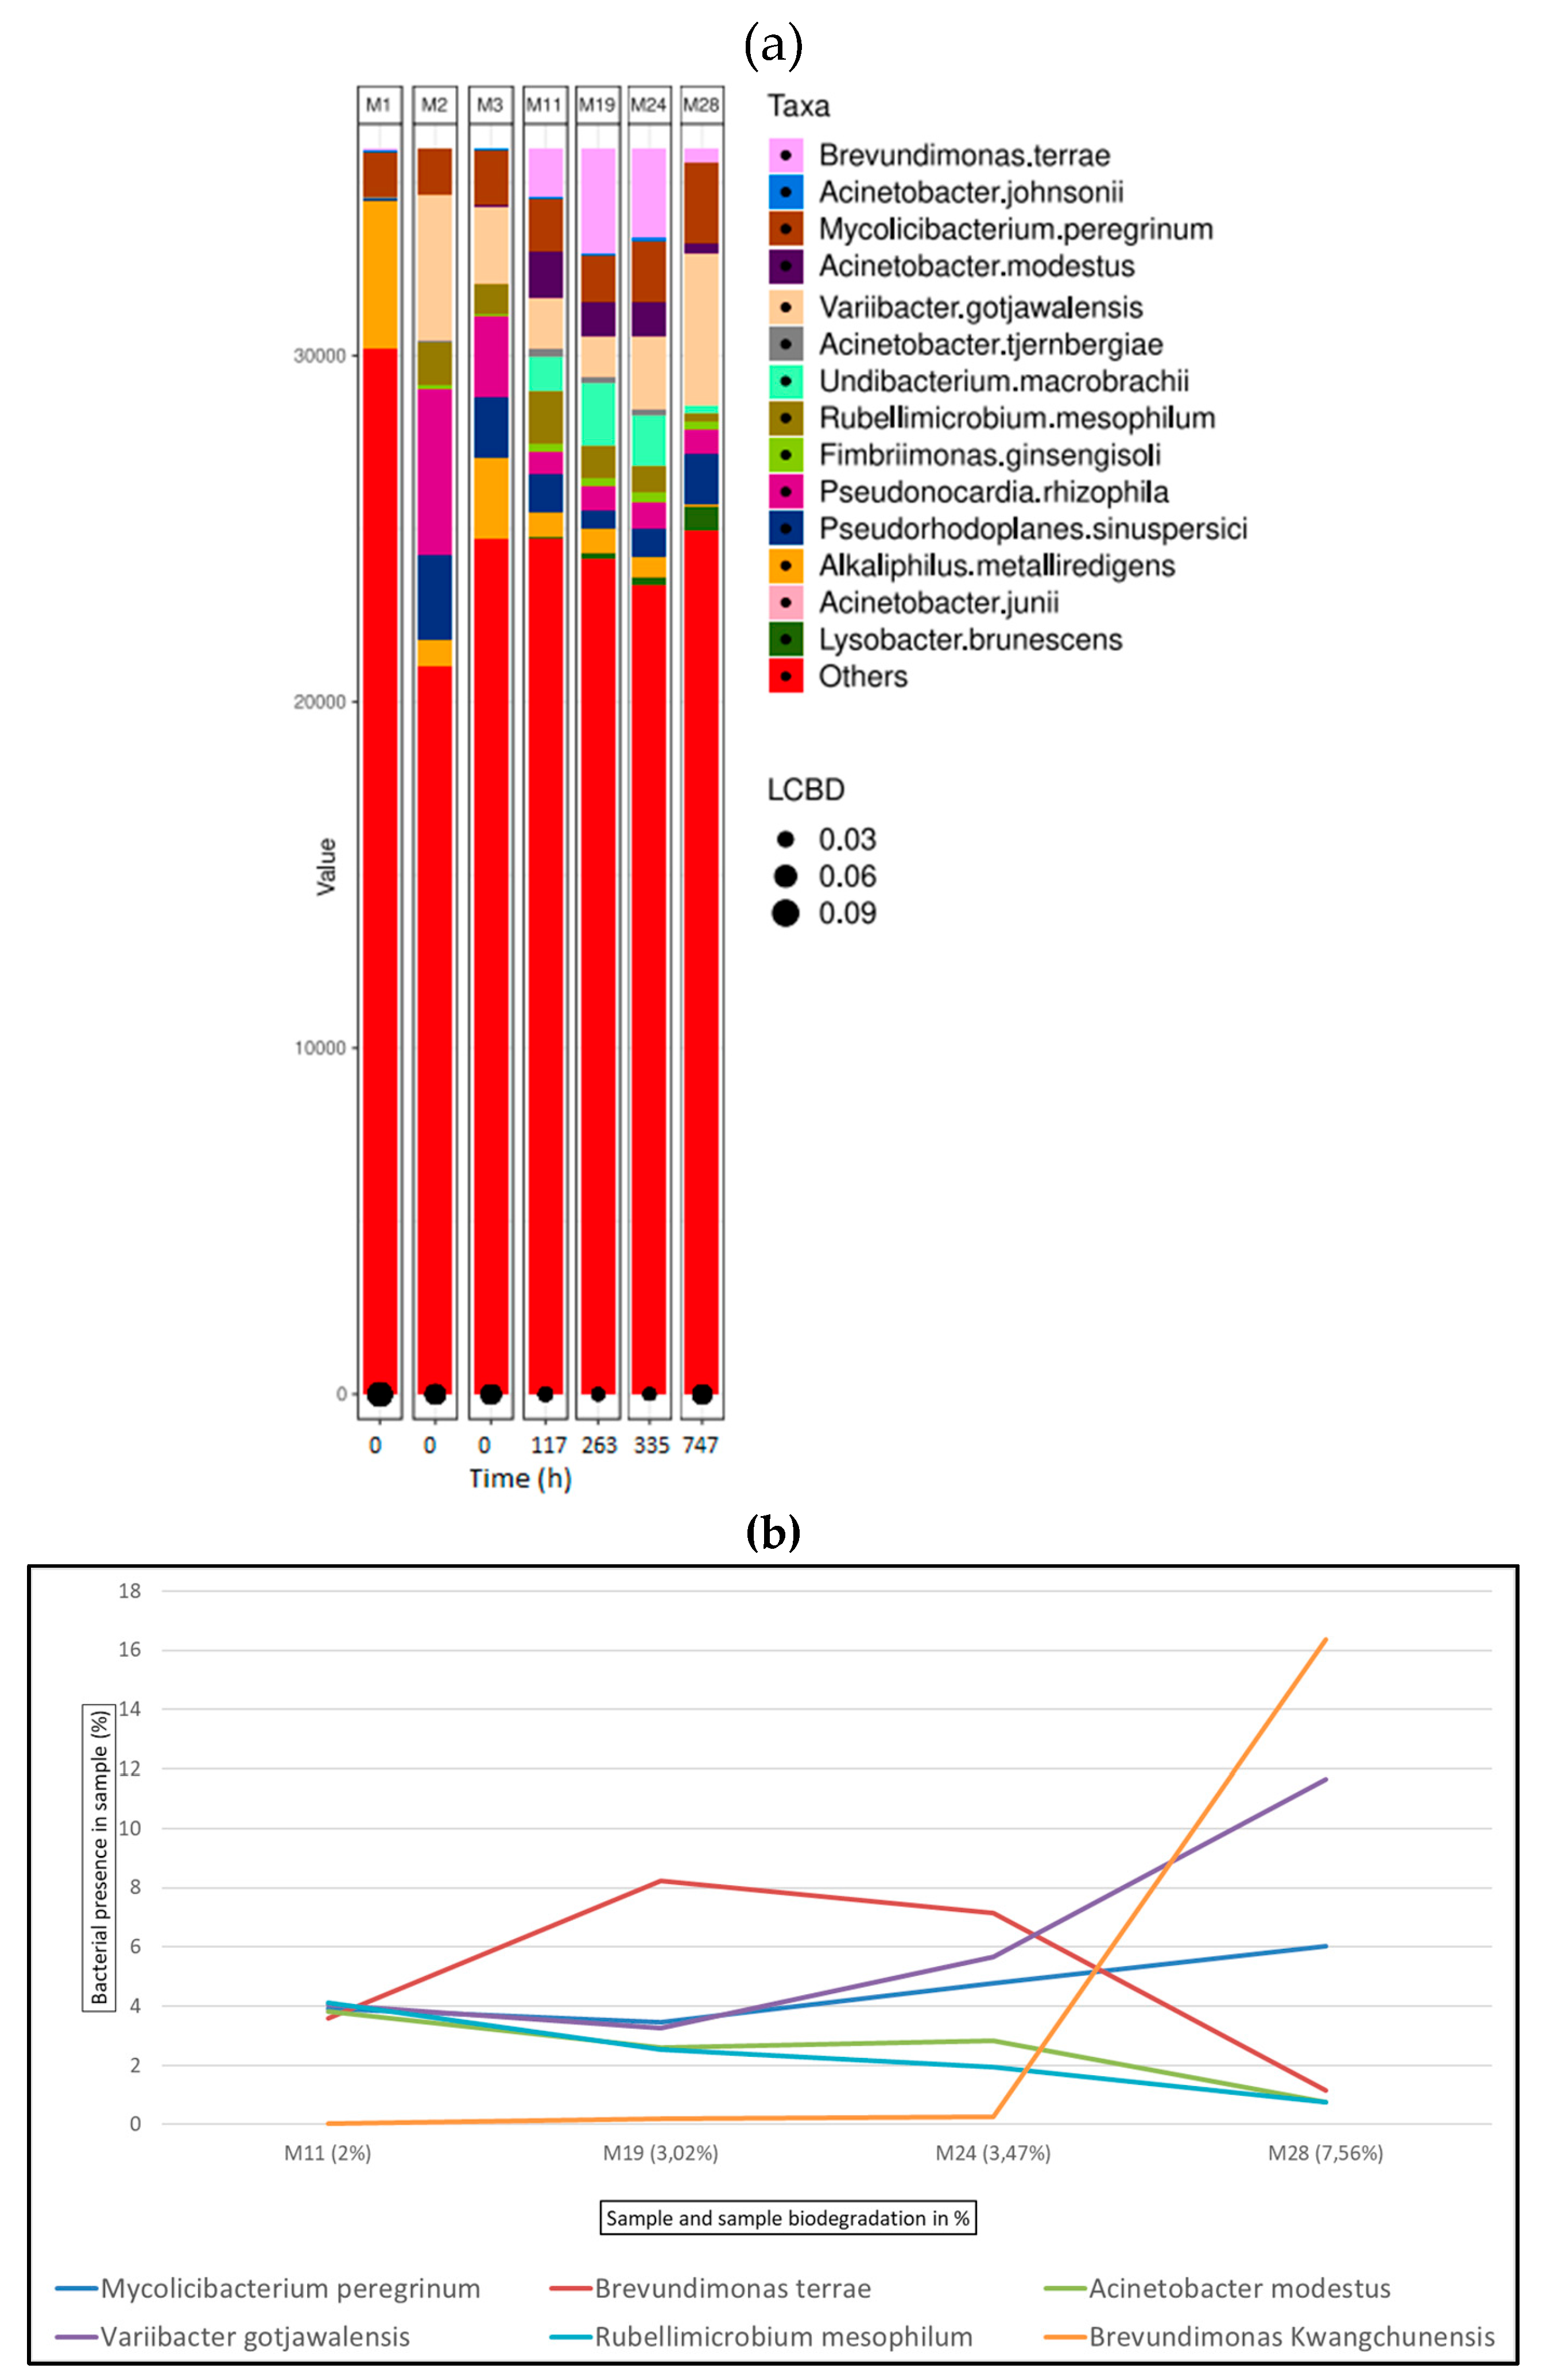
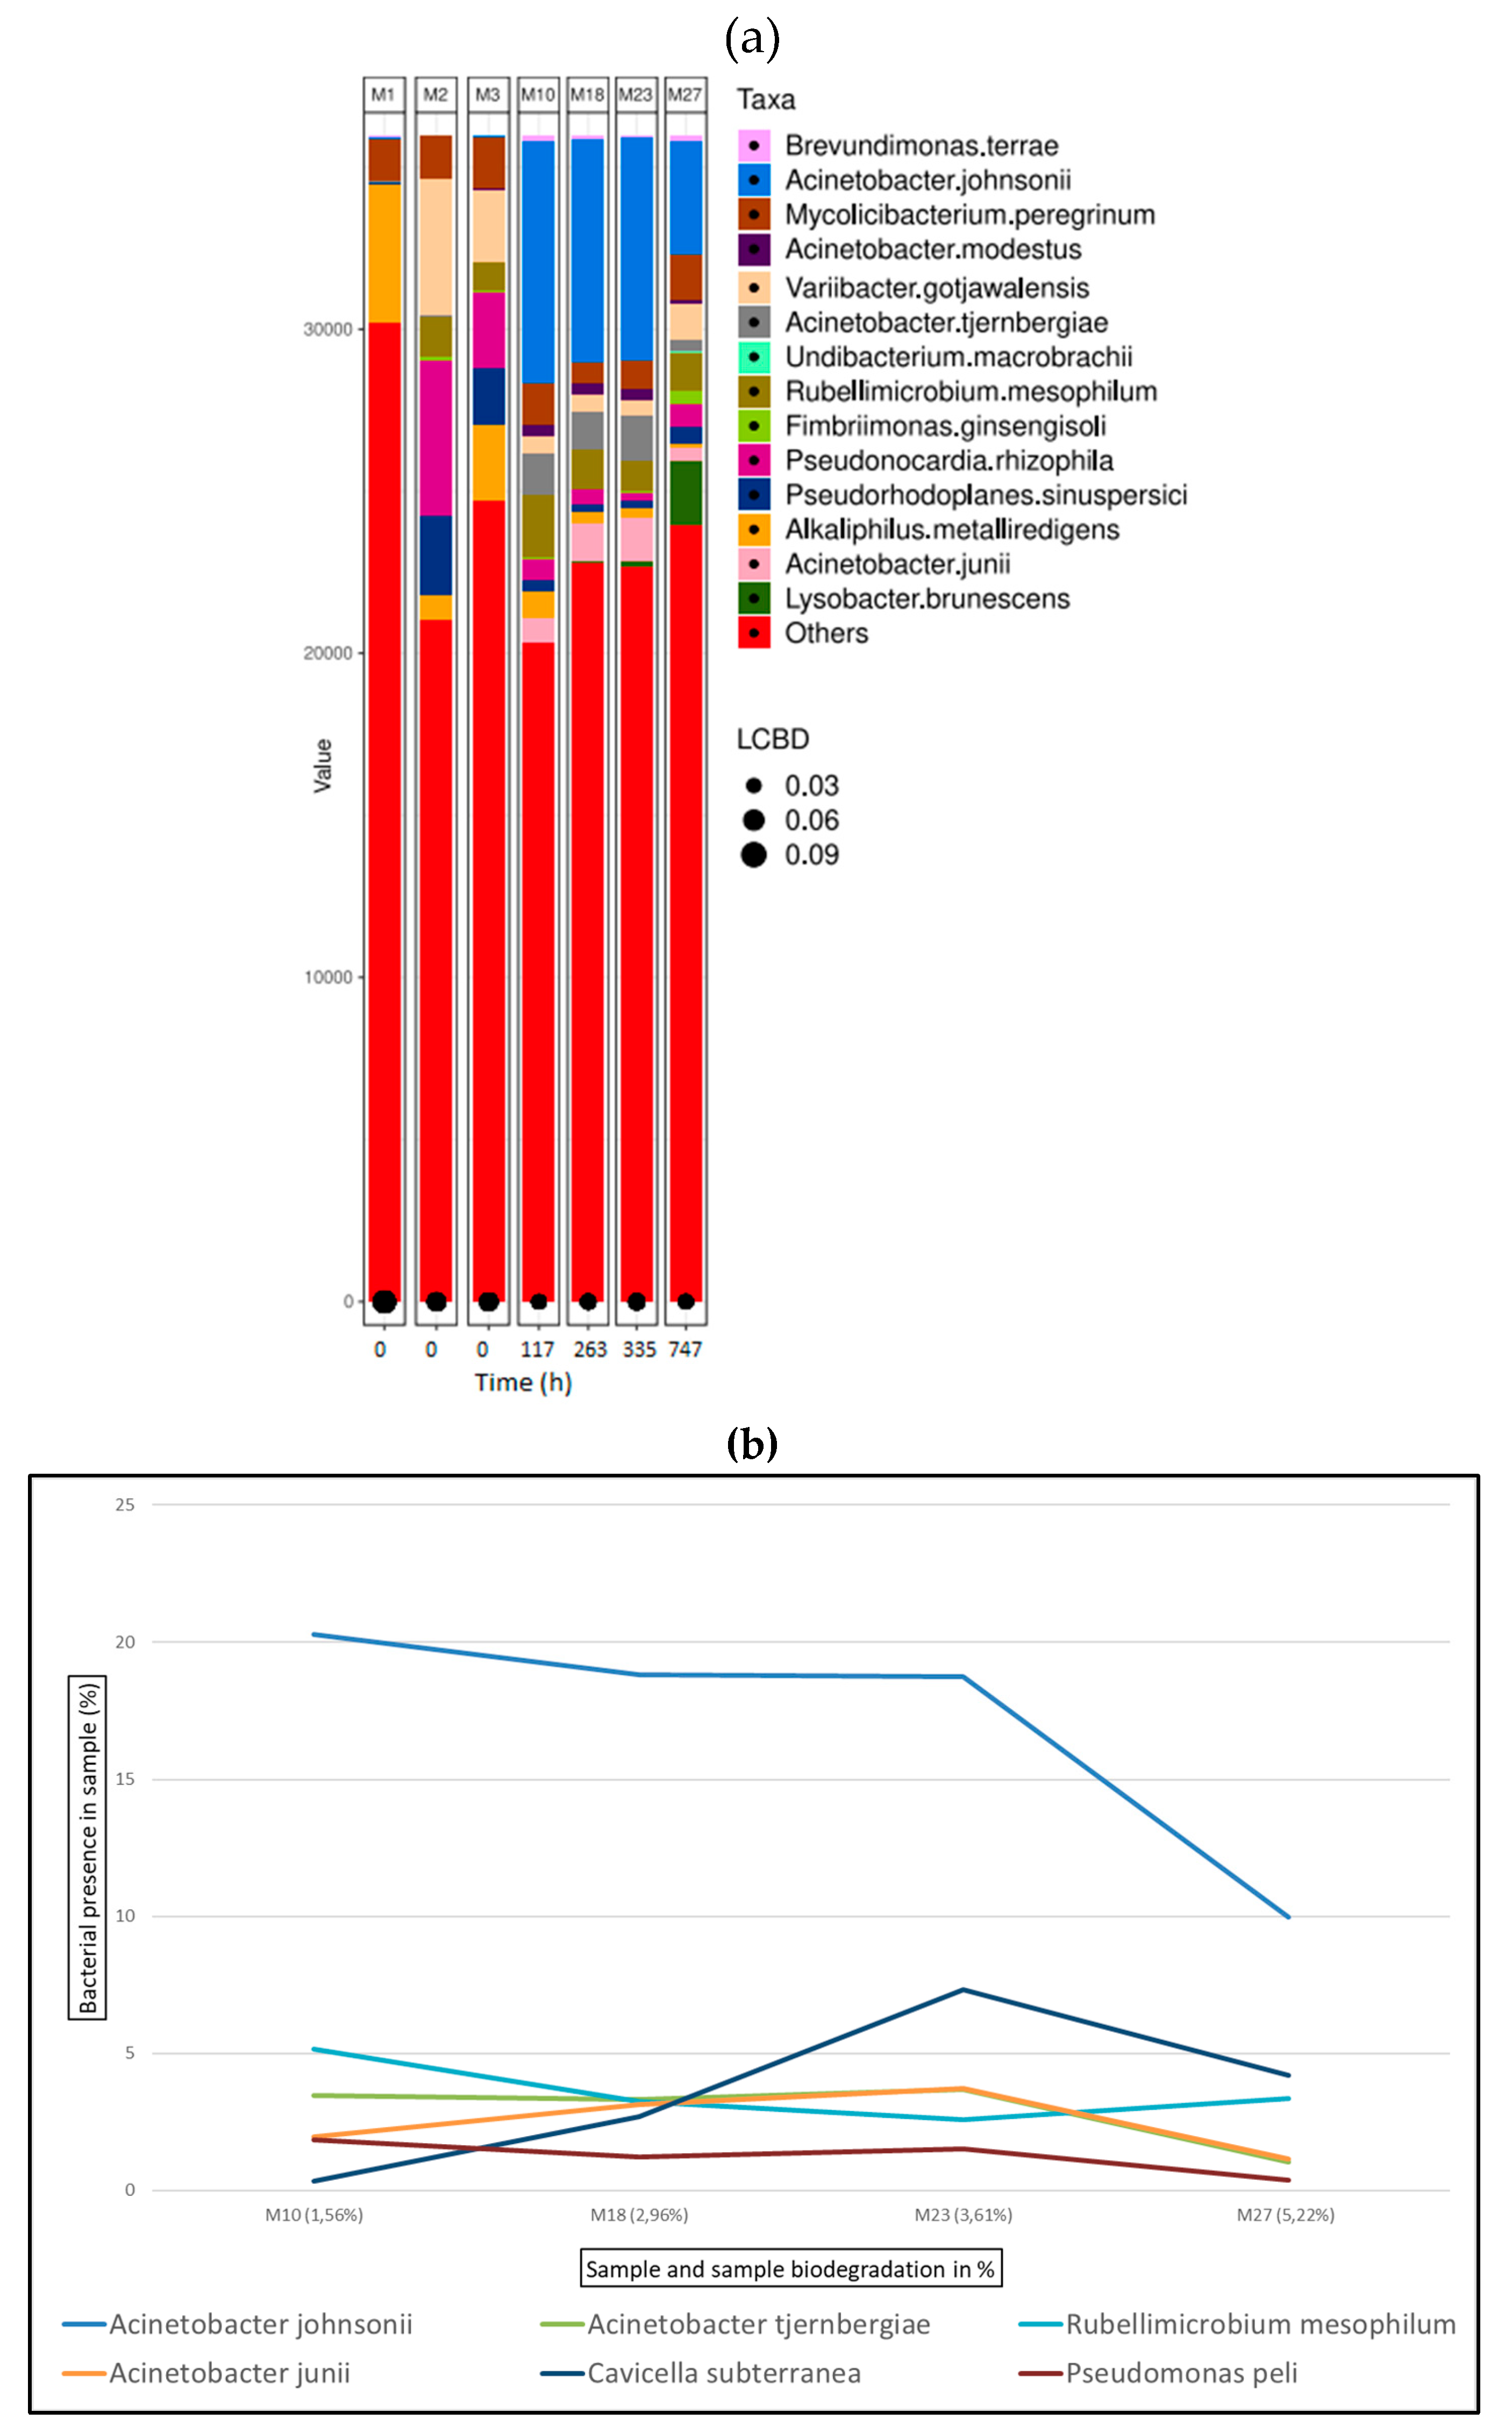
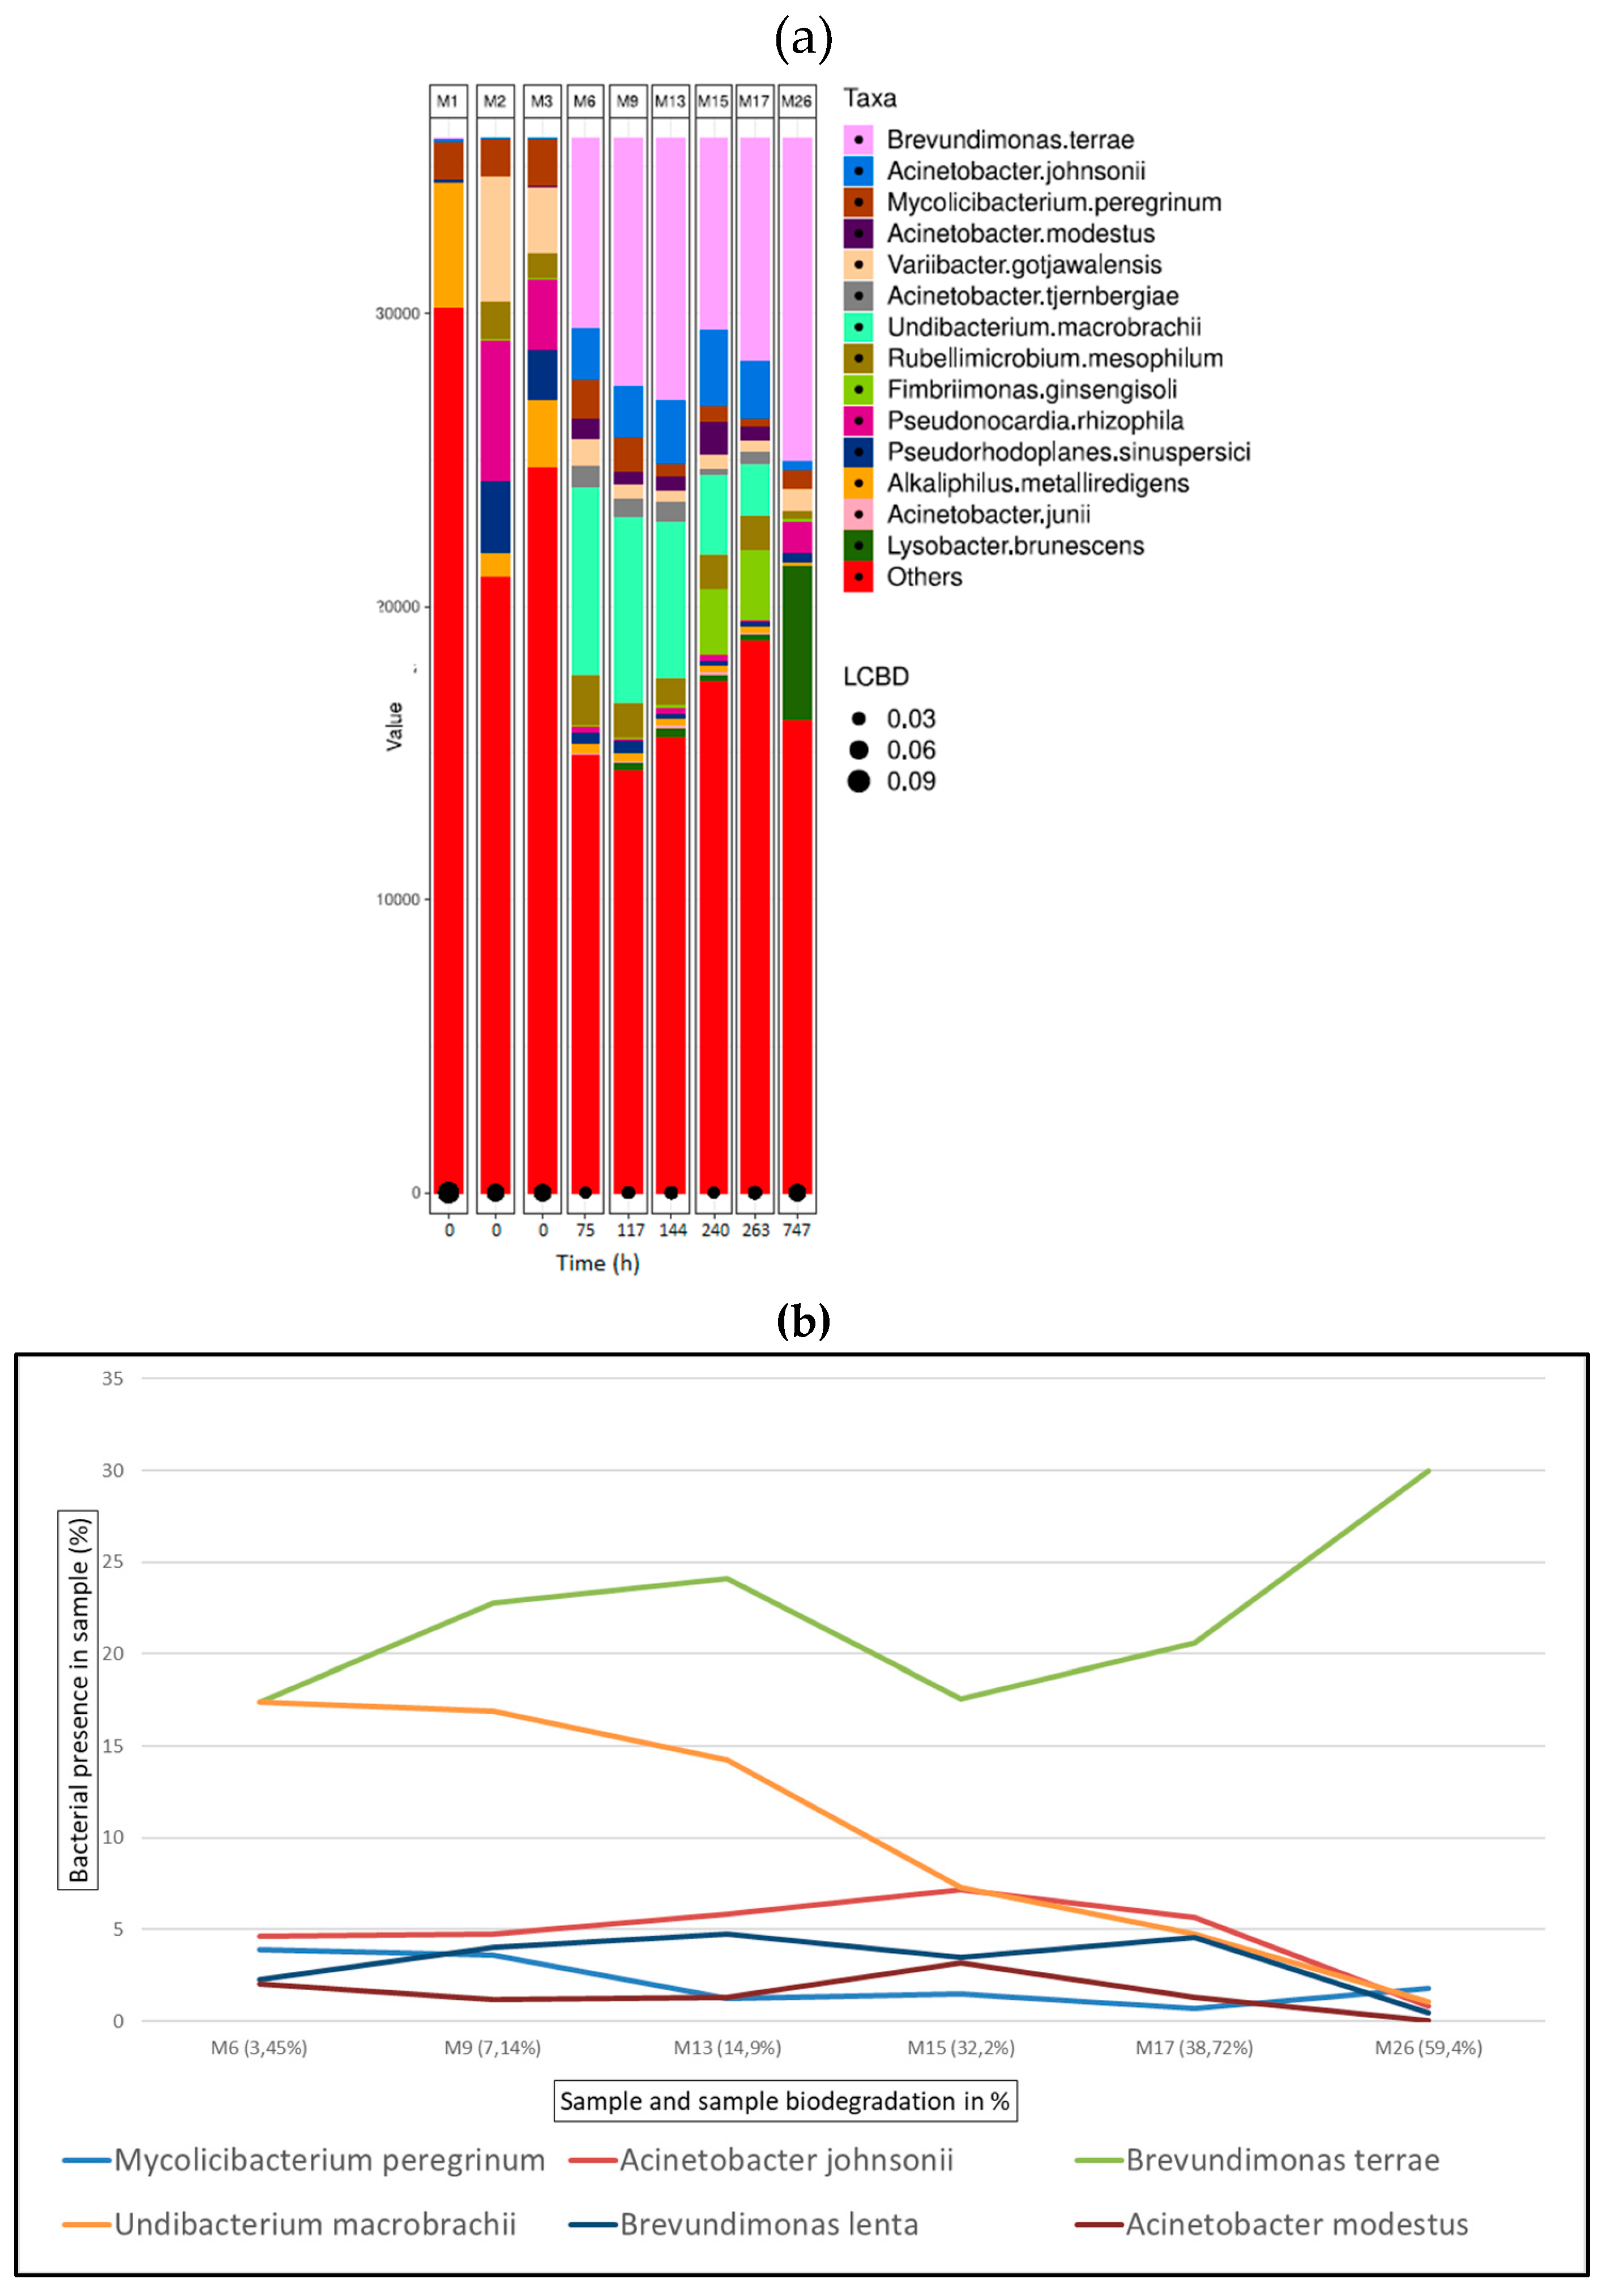
| Sample | Tanning agent | Carbon% | Weight (g) | Erlenmeyer Flask Ref |
|---|---|---|---|---|
| Control | None | 50.60 | 0.5047 | 2 |
| S1 | Oxazolidine | 44.76 | 0.5006 | 4 |
| S2 | Glutaraldehyde | 47.76 | 0.5002 | 7 |
| S3 | Chromium | 36.11 | 0.5012 | 10 |
| S4 | Aluminium | 41.45 | 0.5036 | 14 |
| Sample | Time (h)1 | E. Flask Ref | Leather Sample | Volume (ml)2 | Biodegradation (%)3 |
|---|---|---|---|---|---|
| M1 | 0 | - | None | 70 | 0 |
| M2 | 0 | - | None | 50 | 0 |
| M3 | 0 | - | None | 50 | 0 |
| M4 | 52 | 2 | Control | 70 | 17 |
| M5 | 75 | 2 | Control | 50 | 32 |
| M6 | 75 | 4 | S1 | 60 | 3.45 |
| M7 | 75 | 14 | S4 | 60 | 3.52 |
| M8 | 117 | 2 | Control | 60 | 40.5 |
| M9 | 117 | 4 | S1 | 50 | 7.14 |
| M10 | 117 | 7 | S2 | 60 | 1.56 |
| M11 | 117 | 10 | S3 | 50 | 2 |
| M12 | 117 | 14 | S4 | 50 | 4.6 |
| M13 | 144 | 4 | S1 | 50 | 14.9 |
| M14 | 240 | 2 | Control | 60 | 57 |
| M15 | 240 | 4 | S1 | 60 | 32.2 |
| M16 | 240 | 14 | S4 | 60 | 8.2 |
| M17 | 263 | 4 | S1 | 60 | 38.72 |
| M18 | 263 | 7 | S2 | 60 | 2.96 |
| M19 | 263 | 10 | S3 | 50 | 3.02 |
| M20 | 263 | 14 | S4 | 50 | 11.2 |
| M21 | 263 | 7 | S2 | 50 | 62.2 |
| M22 | 335 | 14 | S4 | 50 | 13.68 |
| M23 | 335 | 7 | S2 | 50 | 3.61 |
| M24 | 335 | 10 | S3 | 50 | 3.47 |
| M25 | 747 | 2 | Control | 50 | 81.5 |
| M26 | 747 | 4 | S1 | 50 | 59.4 |
| M27 | 747 | 14 | S4 | 50 | 5.22 |
| M28 | 747 | 10 | S3 | 50 | 7.56 |
| M29 | 747 | 14 | S4 | 50 | 23.21 |
| Name | Top-hit taxon | Similarity (%) | Completeness (%) | Length (bp) |
|---|---|---|---|---|
| Species 1 | Dietzia maris | 99.48 | 94.4 | 1355 |
| Species 2 | Trichococcus pasteurii | 99.21 | 94.3 | 1396 |
| Species 3 | Corynebacterium lubricantis | 97.86 | 97.7 | 1034 |
| Species 4 | Microbacterium laevaniformans | 99.47 | 95.8 | 1370 |
| Species 5 | Bacillus safensis | 99.36 | 96.2 | 1416 |
| Species 6 | ProteiniphilumAB243818_s | 99.26 | 98 | 1419 |
| Species 7 | ProteiniphilumAB243818_s | 95.80 | 97 | 1405 |
| Sample | Shannon | Chao 1 |
|---|---|---|
| M1 | 4.56 | 2127 |
| M2 | 4.62 | 2816 |
| M3 | 5.05 | 3383 |
| M4 | 2.70 | 266 |
| M5 | 3.07 | 1205 |
| M6 | 4.05 | 3296 |
| M7 | 4.65 | 3177 |
| M8 | 3.68 | 1344 |
| M9 | 3.79 | 2232 |
| M10 | 4.59 | 2817 |
| M11 | 5.24 | 3295 |
| M12 | 4.55 | 3053 |
| M13 | 3.77 | 2284 |
| M14 | 3.96 | 1821 |
| M15 | 4.16 | 2818 |
| M16 | 4.68 | 3068 |
| M17 | 4.10 | 2553 |
| M18 | 4.33 | 2040 |
| M19 | 5.11 | 3406 |
| M20 | 4.72 | 2972 |
| M21 | 4.16 | 2198 |
| M22 | 4.84 | 3049 |
| M23 | 4.10 | 1837 |
| M24 | 4.99 | 3031 |
| M25 | 4.01 | 1506 |
| M26 | 3.32 | 1217 |
| M27 | 4.73 | 1903 |
| M28 | 4.15 | 1105 |
| M29 | 4.94 | 2727 |
Disclaimer/Publisher’s Note: The statements, opinions and data contained in all publications are solely those of the individual author(s) and contributor(s) and not of MDPI and/or the editor(s). MDPI and/or the editor(s) disclaim responsibility for any injury to people or property resulting from any ideas, methods, instructions or products referred to in the content. |
© 2024 by the authors. Licensee MDPI, Basel, Switzerland. This article is an open access article distributed under the terms and conditions of the Creative Commons Attribution (CC BY) license (http://creativecommons.org/licenses/by/4.0/).


