1. Introduction
Hepatocellular carcinoma (HCC) represents the most frequent primary liver cancer and the third leading cause of death related to this illness worldwide [
1]. Several etiological factors are associated with HCC genesis, i.e., HBV and HCV viral infection, diseases linked with metabolic disorders, and excessive alcohol intake, which are amongst the most frequent [
2]. On the other hand, HCC development is associated with an increase in oxidative, inflammatory, fibrogenic, and proliferative events and an increase in growth and cellular death [
3]. Mutations in specific genes involved in these processes mediate many of these processes. In recent years, interest has grown in studying the effects of the environment on the expression of critical genes involved in the genesis of various diseases, including cancer. More importantly, understanding the expression of a given gene when altered and without modifying its nucleotide sequence has become a key issue in this new era of pharmaceutics and epigenomics [
4].
Epigenetic modifications depend on environmental factors that favor changes in a particular gene expression, while no alterations in its DNA sequence occur [
5]. Two types of epigenetic modifications related to the initiation and development of cancer are known: DNA methylation and histone modifications. DNA methylation mainly occurs on the cytosine ring, specifically CpG islands, driven by DNA methyltransferases (DNMTs) activity. Global hypomethylation of the genome is a common feature in many cancers, including HCC. This widespread hypomethylation can contribute to genomic instability and the activation of other oncogenes. Primarily, methylation of the gene promoter region causes transcriptional repression, while methylation in the gene body promotes gene expression in various cancers, including HCC [
4].
On the other hand, experimental models are an adequate strategy for evaluating the efficacy and safety of new drugs [
6]. Castro-Gil et al. used an HCC animal model administering diethylnitrosamine (DEN) and 2-acetylaminofluorene (2AAF) to rats. This method limited weight gain and increased hepatomegaly and liver changes. Also, increased levels of liver cancer markers like γ-GTP, prostaglandin reductase 1, and GSTP1 were found. Importantly, this experimental model allowed the study of HCC development from its earliest stages to its final stage [
7].
Pirfenidone (PFD) is a drug with important pharmacological properties; evidence from basic and clinical studies has shown that PFD has antifibrotic, antioxidant, and anti-inflammatory effects [
8]. In in vitro models, PFD can inhibit proliferation, promote apoptosis of HepG2 cells [
9], and regulate SIRT1-related mechanisms [
10]. Silva-Gómez et al. demonstrated that PFD efficacy is involved in preventing HCC genesis via induction of p50 nuclear translocation, modifying the p65/p50 ratio in favor of p50, and knocking down IL-6, TNF-α, and COX-2 expression. In the early stages of experimental HCC PFD also changed the expression of p53, the activation of caspase-3p17, and the cleavage of PARP-1 [
11].
Previous studies have reported that overexpression levels of oncogenes such as c-Myc, cyclinD1, ß-catenin, and tumor suppressor genes such as p53, E-cadherin, DLC-1, and pRb are downregulated to different degrees during the development of HCC. Particularly, c-Myc is associated with hypomethylation, while p53 has been associated with hypermethylation in its promoter sequence [
12].
Our main goal in this study was to elucidate whether PFD regulates the formation of DNMT1/3a complexes and restores global DNA methylation, which might be related to HCC progression.
4. Discussion
HCC is a gradual damage process generated by deregulation of gene expression and aberrant molecular signaling, which trigger histopathological and physiological alterations in the liver. Additionally, epigenetic alterations contribute to the inception of this pathology development. DNA methylation is the most studied epigenetic modification, and the most consistent in various types of human cancer, including HCC [
12,
13].
PPARs role in HCC remains controversial. PPARα high expression may inhibit tumor cell growth by preventing cell division and initiating cell death via IκBα and NF-κB signaling pathways, as reported by several authors [
14]. Additionally, PPARα overexpression was linked to extended survival times in HCC patients [
15]. Moreover, the involvement of PPARα in NOX1-mediated angiogenesis has been disclosed. NOX1 presence decreases PPARα activity, whereas its absence increases its expression, preventing endothelial cell migration and angiogenesis [
16]. Our findings indicate that PFD treatment increased PPARα expression, mostly in cytoplasmic fractions, improving lipid metabolism and slowing HCC development.
On the other hand, PPARγ are transcription factors that play an important role in HCC development. However, the available evidence is not yet conclusive, nor is it entirely clear whether the ligands of this molecule promote or prevent the tumorigenic process. In different cell lines, and in human HCC, increased expression of PPARγ plays an important role in moderately and poorly differentiated tumors [
17]; although the mechanisms are not yet well understood, it has been suggested that the use of antagonists blocking PPARγ activity, promote cell arrest and death through apoptosis of HCC cells [
18]. In a recent study conducted by our research group, an increase in PPARγ expression at cytoplasmic and nuclear levels in liver tissue of patients with HCC was observed. Furthermore, observations derived from an in-silico assay, allowed us to conclude that PFD is an agonist that interacts with PPARγ ligand-binding domain (LBD). Its mechanism of action was elucidated
in vitro, using the HepG2 cell line, and an in vivo model of chemical hepatocarcinogenesis at 30 days. In these studies, PFD treatment induced PPARγ nuclear translocation, increased IkB-α expression, p53, and caspase 3-p17 activity; in addition, it prevented the inflammatory process by blocking the activity of NF-κB p65, that is, it intervened in antitumor and anti-inflammatory mechanisms characteristic of this disease [
11].
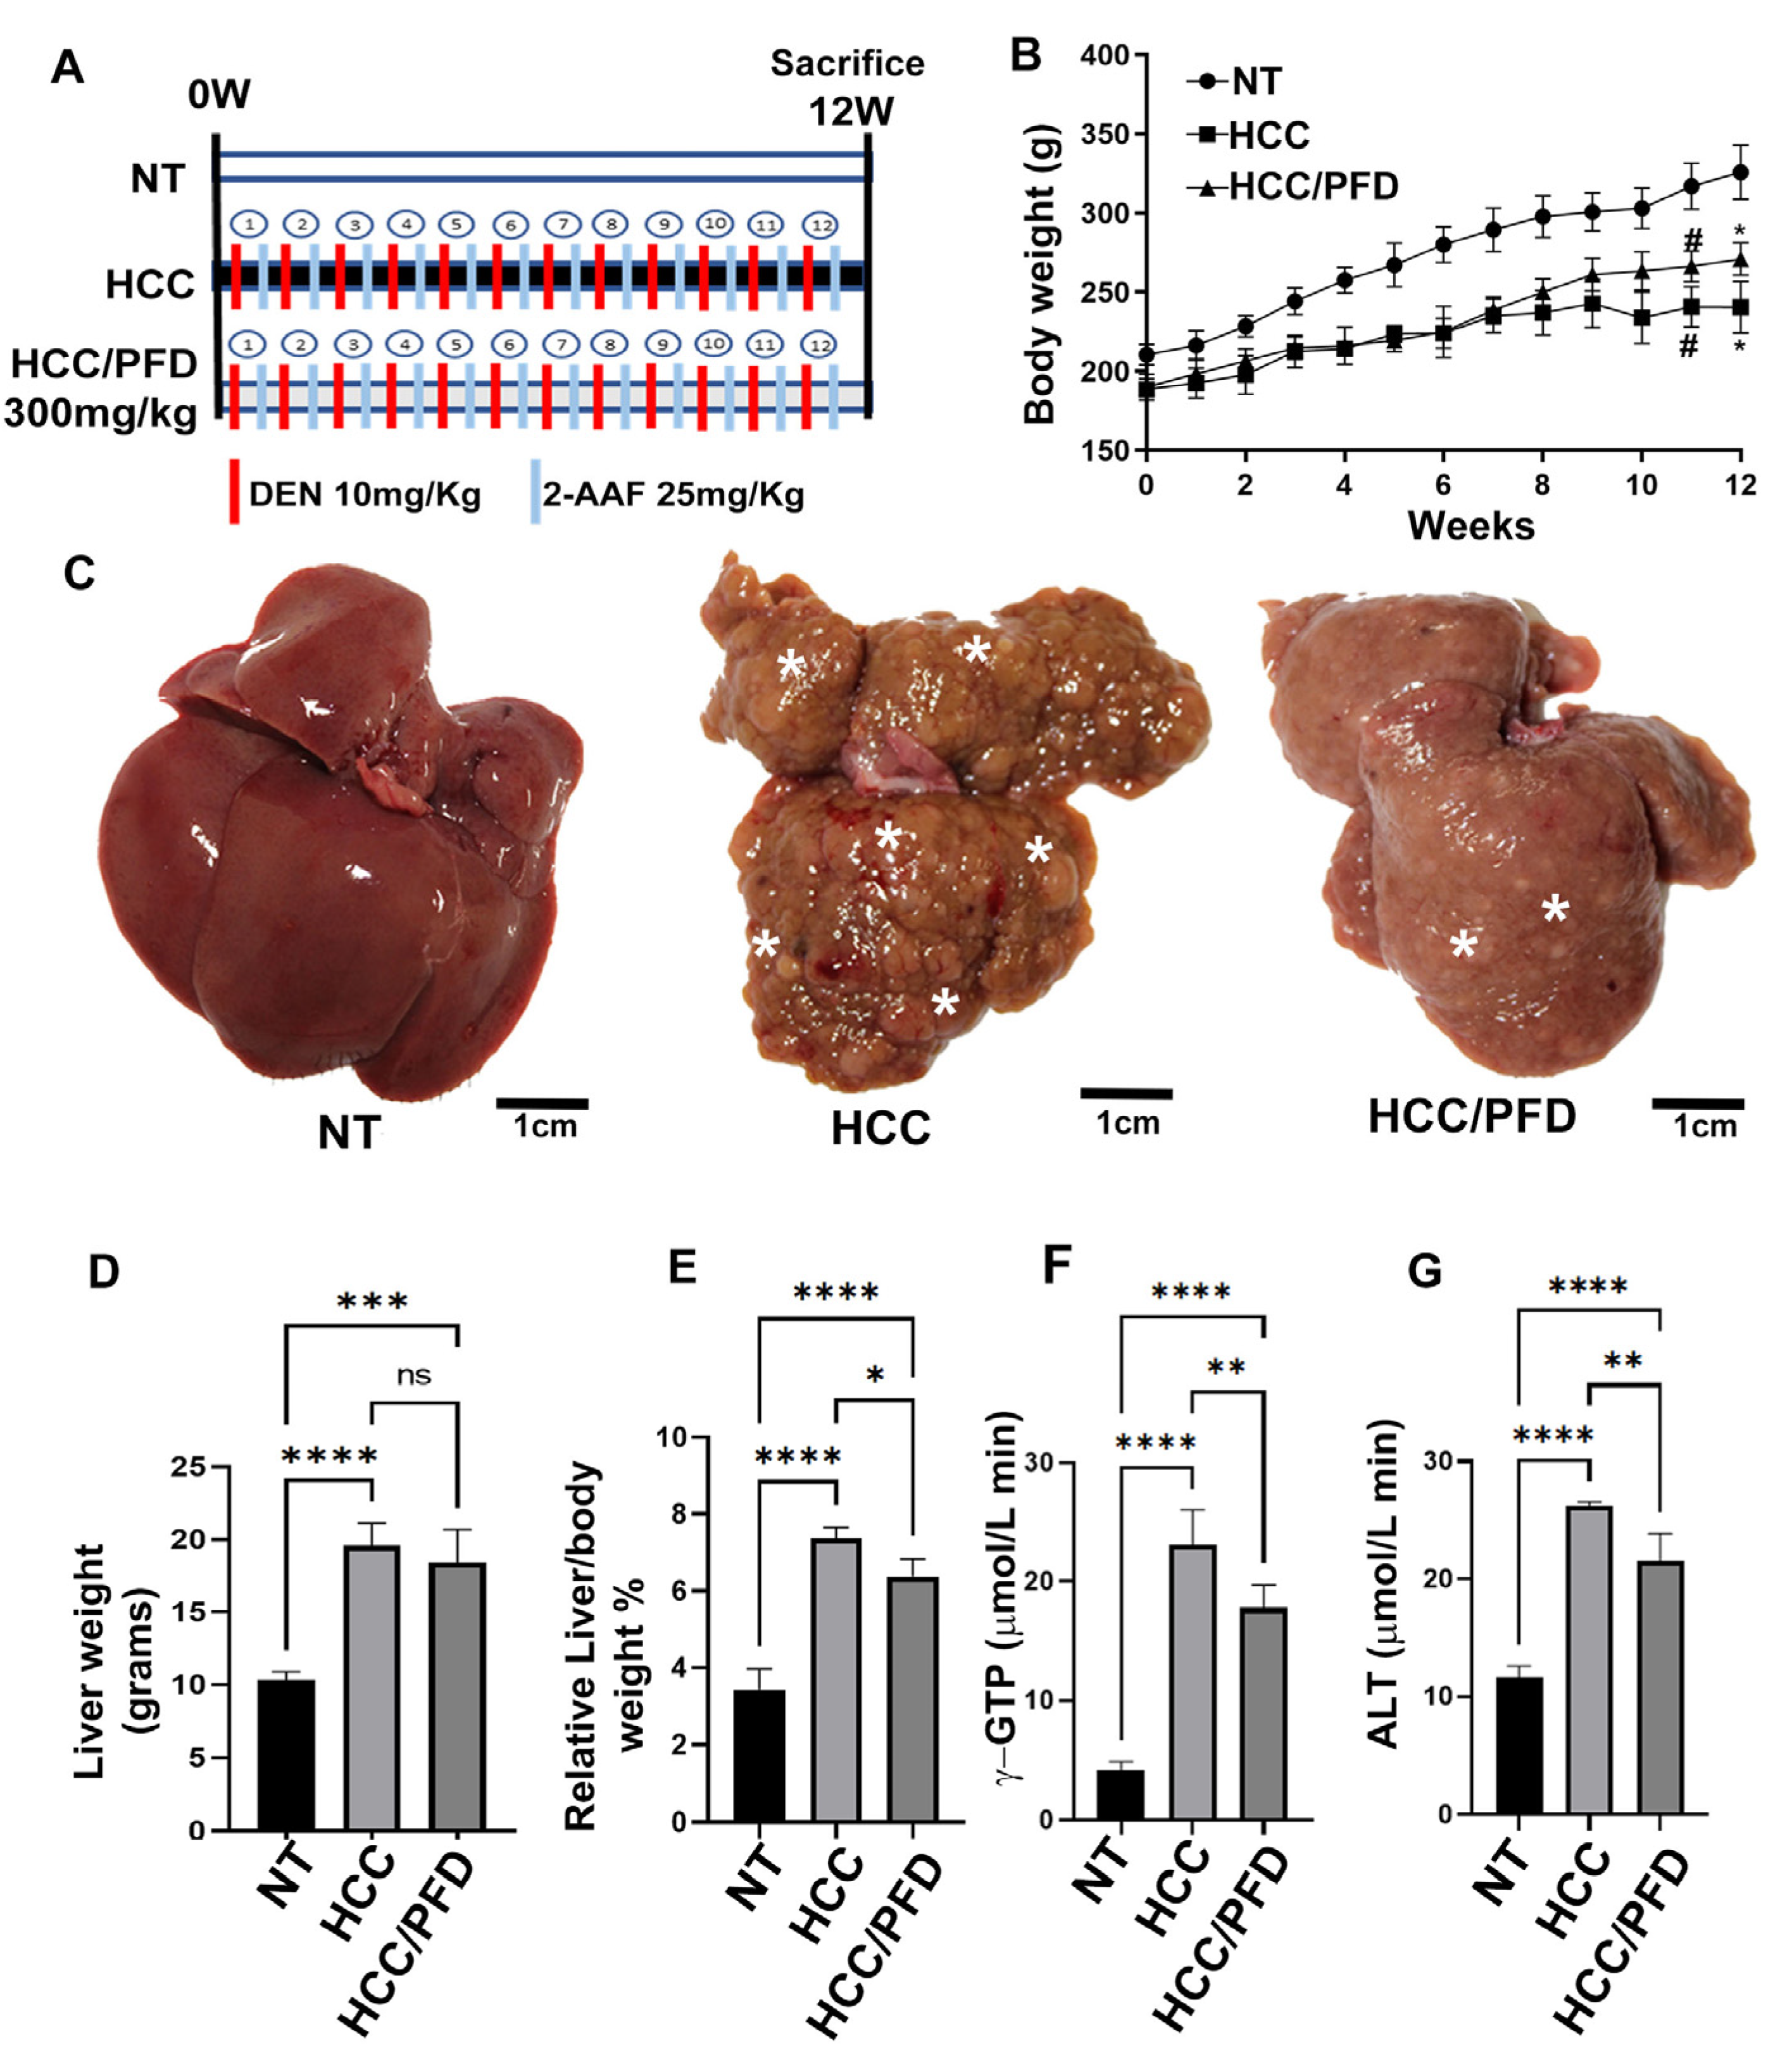
Our results indicate that PFD treatment (300 mg/kg) prevented weight loss, maintained normal liver enzyme activity, and delayed tumor formation (
Figure 1). There is evidence that the use of PPAR agonists, such as pioglitazone (10 mg/kg), is beneficial in preventing HCC development and reducing the formation of macroscopic tumor nodules [
19].
In this work, we have also demonstrated that animals treated with PFD, maintained intact hepatic cytoarchitecture, prevented synthesis and accumulation of extracellular matrix fibers, and decreased GPC3 expression significantly. Regarding this, Capurro et al. found that non-glycosylated GPC3 protein forms a complex with Wnt-β-catenin pathway proteins, they also demonstrated that glycosaminoglycan chains are not required to stimulate Wnt signaling and hepatocellular carcinoma growth [
20]. Also, Hu et al. demonstrated that curcumin treatment inhibits Wnt/-β-catenin signaling in addition to downregulating GPC3 expression, in vitro experiments confirmed that silencing the expression of GPC3 potentiates the effects of curcumin on Wnt/β-catenin signaling; while in vivo experiments showed that this drug inhibits cell proliferation and induces apoptosis in HepG2 cells [
21]. Our results indicate that PFD can decrease GPC3 membrane expression, preventing β-catenin translocation to the nucleus, and reducing c-Myc oncogene expression (
Figure 2A,I).
Several evidence have postulated the antifibrogenic mechanism exerted by PFD. Lv et al. observed that PFD reduced pulmonary fibrosis, in vitro and in vivo, by regulating the Wnt/GSK-3β/β-catenin pathway and the TGF-β1/Smad2/3 signaling pathway [
22]. More recently, our research group postulated that the molecular interaction of PFD with PPARγ and its effects on the redistribution and signaling of β-catenin in the HepG2 line might be responsible for this molecular pathway [
23]
DNA methylation, primarily carried out by DNMT1, DNMT3a, and DNMT3b, plays a crucial role in epigenetic reprogramming. DNA methyltransferase inhibitors, such as 5-azacitidine, can greatly improve the efficiency of reprogramming and change gene expression, which can affect p53-mediated cell fate decisions like apoptosis or proliferation [
12]. Also, abnormal Wnt/β-catenin activation is linked to DNA methylation and affects tumor suppressor genes like E-cadherin. This is because Wnt/β-catenin activation helps to keep tumors cell stem-like in liver and other types of cancer. It is important to note that abnormal DNA methylation plays a substantial role in cancer growth by changing genes related to the Wnt/β-catenin pathway and changes in its translated process. Furthermore, evidence suggests a regulatory link between c-Myc activity and DNMTs, specifically DNMT1 and DNMT3a [
12]. Elevated c-Myc levels have been linked to increased DNA methylation activity by DNMT3a. The connection between c-Myc and DNMT3a is important for c-Myc specific methylation [
12,
13], which controls transcription of many genes, including those that regulate cell cycle. Additionally, it has been proposed that c-Myc proto-oncogene overexpression can induce DNA damage by generating reactive oxygen species (ROS), promoting oncogenesis [
12]. Although DNMT1 and p53 are involved in distinct cellular processes, there can be interactions between different cellular pathways. Several research has demonstrated that p53 regulates DNMT1 synthesis, and alterations to p53 function, could impact DNA methylation patterns. Cancer development can be linked to molecular alterations through both, DNMT1 and p53 dysregulation [
24].
In humans, tumors show differential changes in DNA methylation patterns, and hypermethylation of gene-specific promoters has been documented, though genome-wide hypomethylation may also occur [
25,
26,
27,
28,
29]. It is obvious then, that a strong controversy exists regarding this issue. In early stages of hepatocarcinoma, an overexpression of DNMT1, DNMT3a, and DNMT3b is suggested, as well as an increase in methylation of specific genes in patients with HCC [
28,
29,
30,
31]. Along these lines, this response is observed in experimental models of early HCC [
32,
33]. These findings suggest that abnormal DNA methylation predicts poor survival in patients with this disease. Conversely to these facts, it has been established that in normal cells, heterochromatin is highly methylated, therefore transcriptional activity is epigenetically silenced; however, in several types of cancer, global hypomethylation is observed, for example, methylation of LINE-1 (long interspersed nucleotide elements) maintains genomic stability and integrity. Loss of methylation increases genomic instability and increases the likelihood of mitotic recombination, leading to tumor development [
31]. Also, in a study by Eden A et al., DNA hypomethylation is proposed to favor cancer promotion by altering chromosome stability. This research group also states that further characterization of the relationship between DNA methylation, chromatin composition, and structure is required to understand how hypomethylation affects DNA structure and integrity in cancer [
35].
Our results indicate that in HCC group there is a decrease in the expression of DNMT1 and DNMT3a, this response correlated with global DNA hypomethylation, while PFD treatment induced overexpression of both isoforms of DNMTs, and the scaffolding protein UHRF1, which could explain, at least in part, the reversal of global DNA hypomethylation caused by carcinogenic damage. Additionally, 5-Aza is a DNA demethylating drug that inhibits DNMT activity by forming covalent adducts with the catalytic region of the enzyme and DNMT1 degradation as a result. [
36]. Also, in vitro studies have demonstrated the reactivation of tumor suppressor genes, including p53 [
24]. In this work, we found that 5-Aza administration reduces global DNA methylation, and DNMT1 and DNMT3a expression; nonetheless, PFD reduces 5-azacitidine effects on both DNMTs (
Figure 5). A study conducted by Nishimori H et al. observed that there is an increase in PCNA expression in HCC patients [
37]. Interestingly, our findings reveal that PFD treatment reduces the expression of this protein, while in HCC group, it remains increased (
Figure 4A). On the other hand, in our in vitro assay, 5-Aza treatment in HepG2 cells reduces PCNA expression. A similar response was observed by Tikoo K. et al. [
38]. This group postulates that 5-Aza incorporation into DNA causes direct cytotoxicity and antiproliferative effects on tumor cells. Our results show that treatment with 5-Aza/PFD maintains basal levels of PCNA, however, it is necessary to carry out additional experiments to clearly understand PFD effects on PCNA.
Yu J et al. were the first to suggest that the loss of a PPARγ allele increases the development of HCC. They postulated that PPARγ suppresses tumor cell growth by reducing cell proliferation and inducing G2/M phase arrest and apoptosis. Thus, PPARγ acts as a tumor suppressor gene in the liver [
39]. Likewise, Lee YK et al. demonstrated that PPARγ2 is expressed in liver tissue, specifically in hepatocytes, and its expression level correlates with the expression and phosphorylation of SREBP1, leading to fat accumulation induced by pathological conditions, such as obesity and diabetes, promoting HCC development [
40].
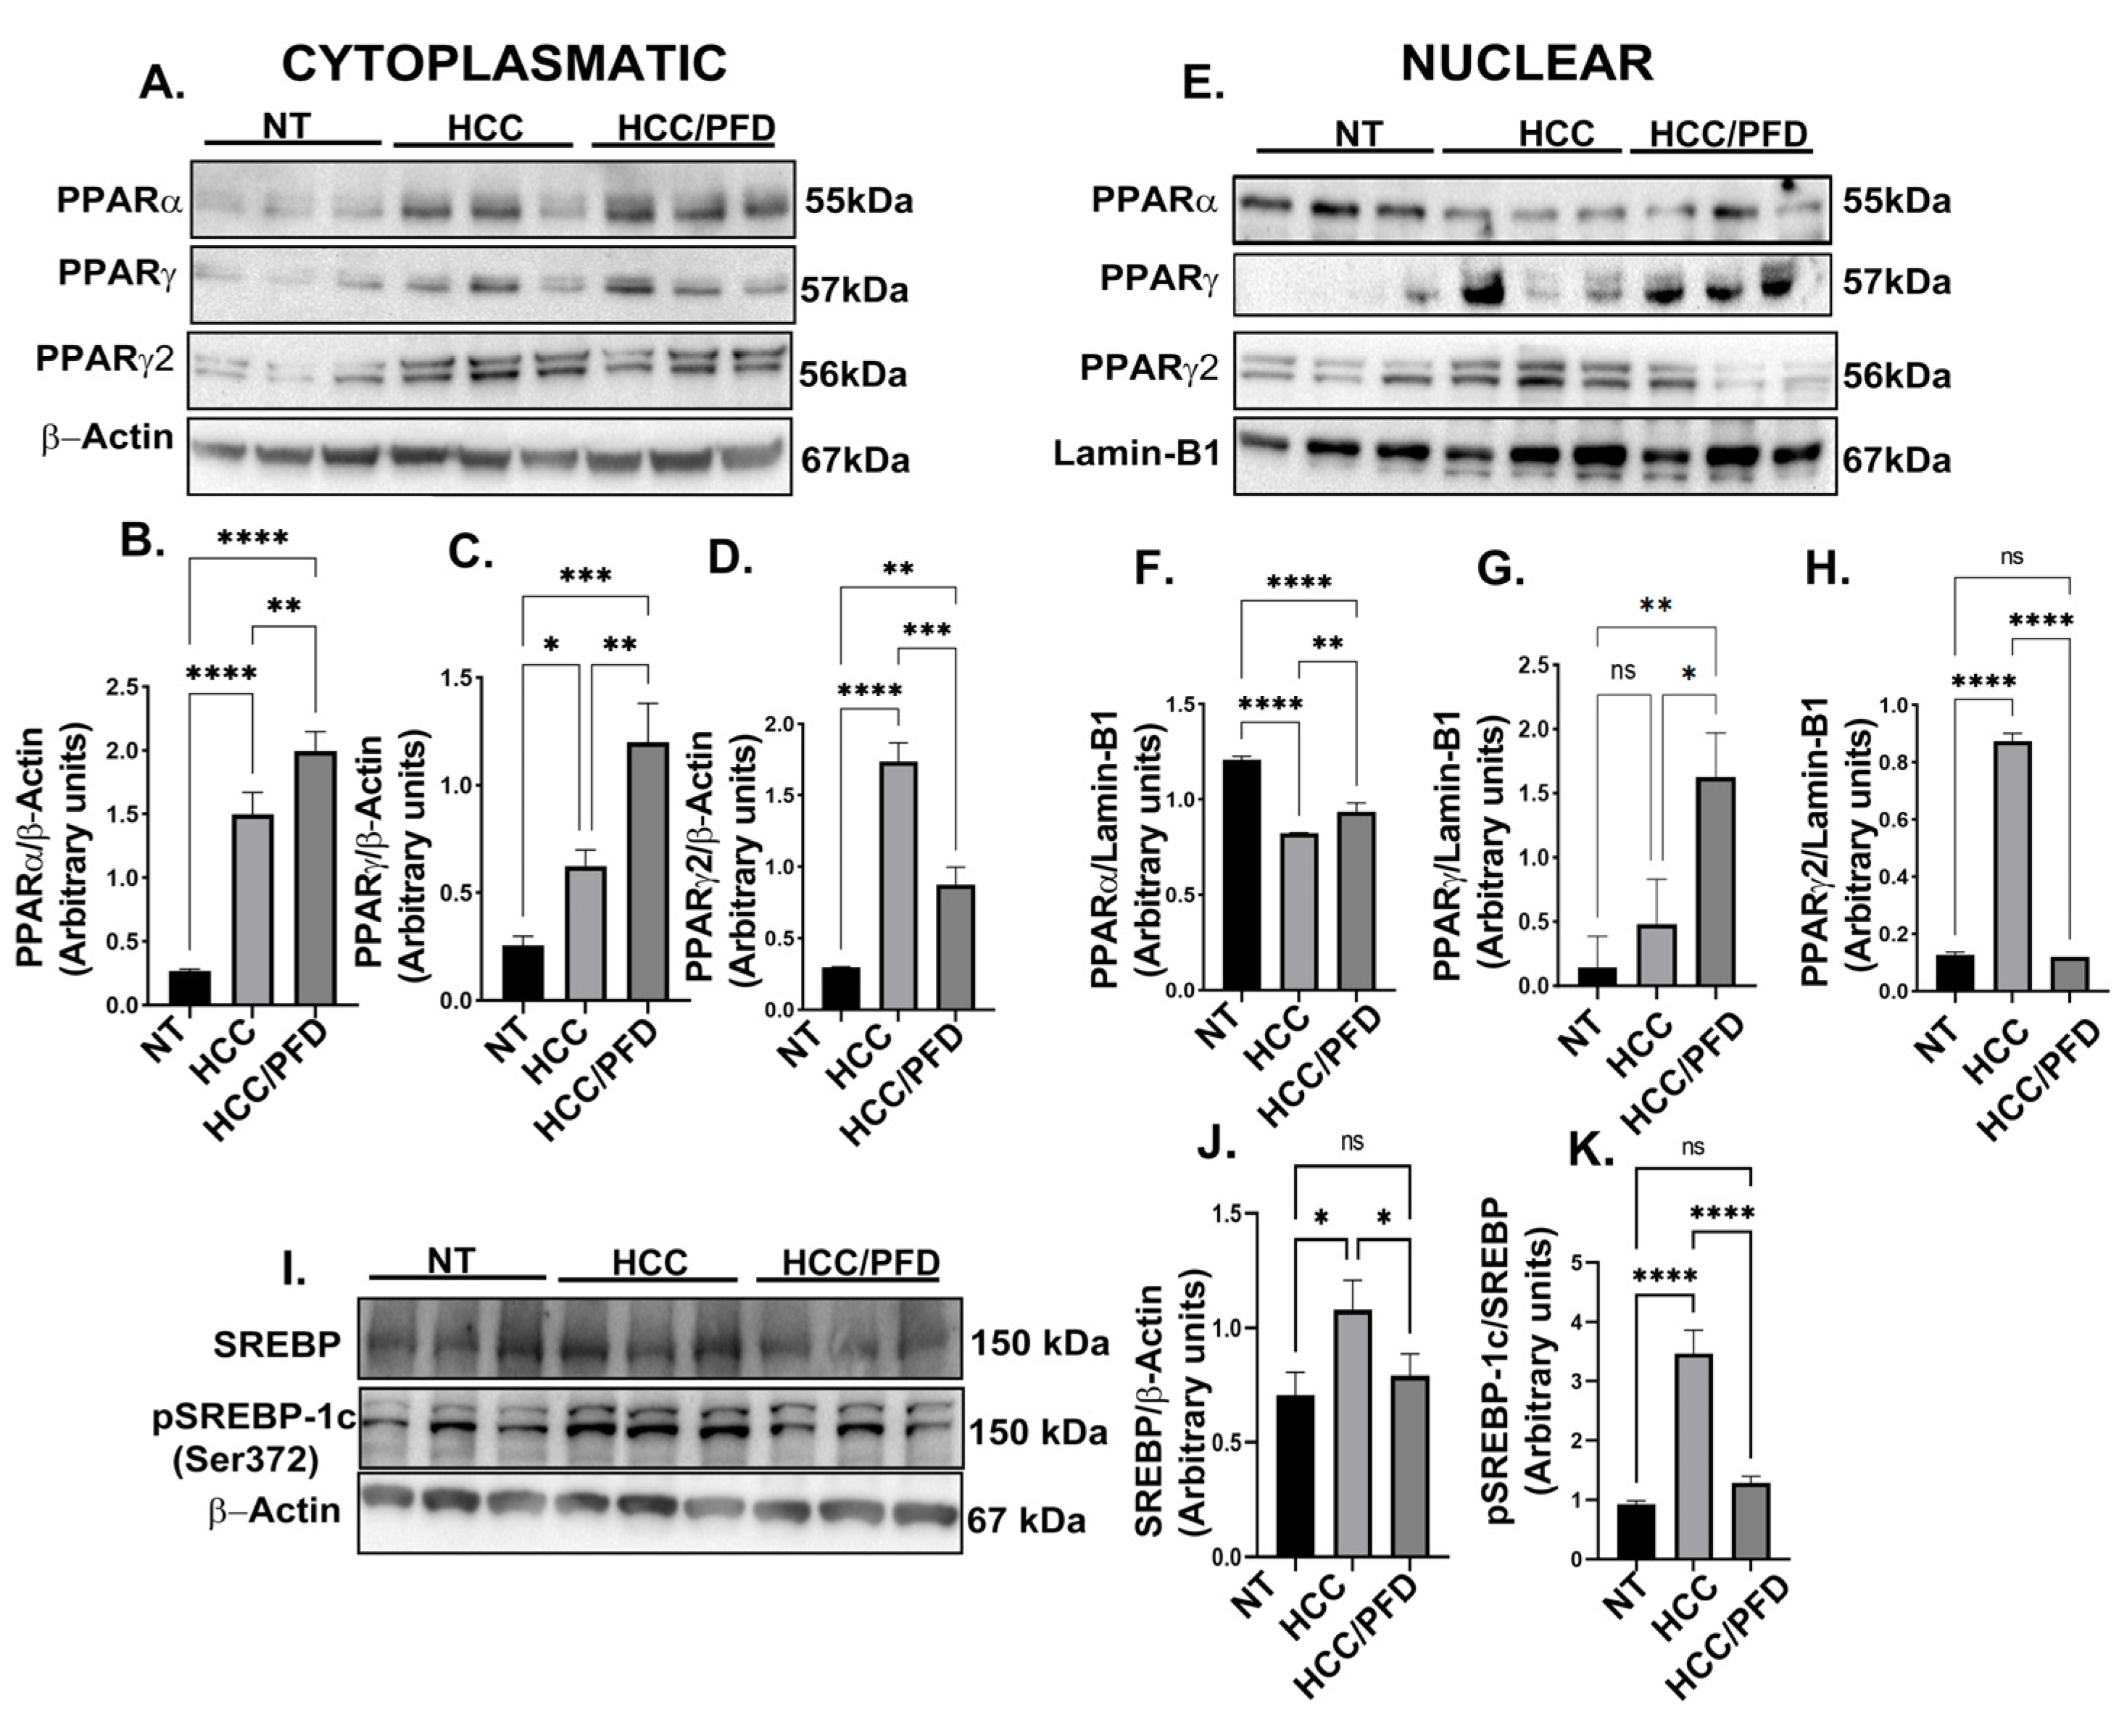
Our results showed that PFD treatment induced PPARγ translocation to the nucleus, and correlated with c-Myc expression inhibition (
Figure 3), we also showed that in HCC group, PPARγ2 is overexpressed both in cytoplasm and nuclear fractions, contributing to lipid accumulation mediated by SREBP-1c, however, PFD treatment significantly reduced PPARγ2 expression and SREBP-1c (Ser372) phosphorylation, reducing hepatic steatosis present in liver tissue from animals of HCC group (
Figure 3I,J.
Pazienza et al. showed that PPARγ and DNMT1 play an important role in the development of carcinogenesis, having the same expression patterns in cell lines derived from human pancreatic cancer [
41]. Recently, Ceccarelli et al. postulated that activation of PPARγ with eicosatetraenoic acid promotes physical interaction with DNMT1 and HDAC1 in CpG island of Hic-1 gene [
42].
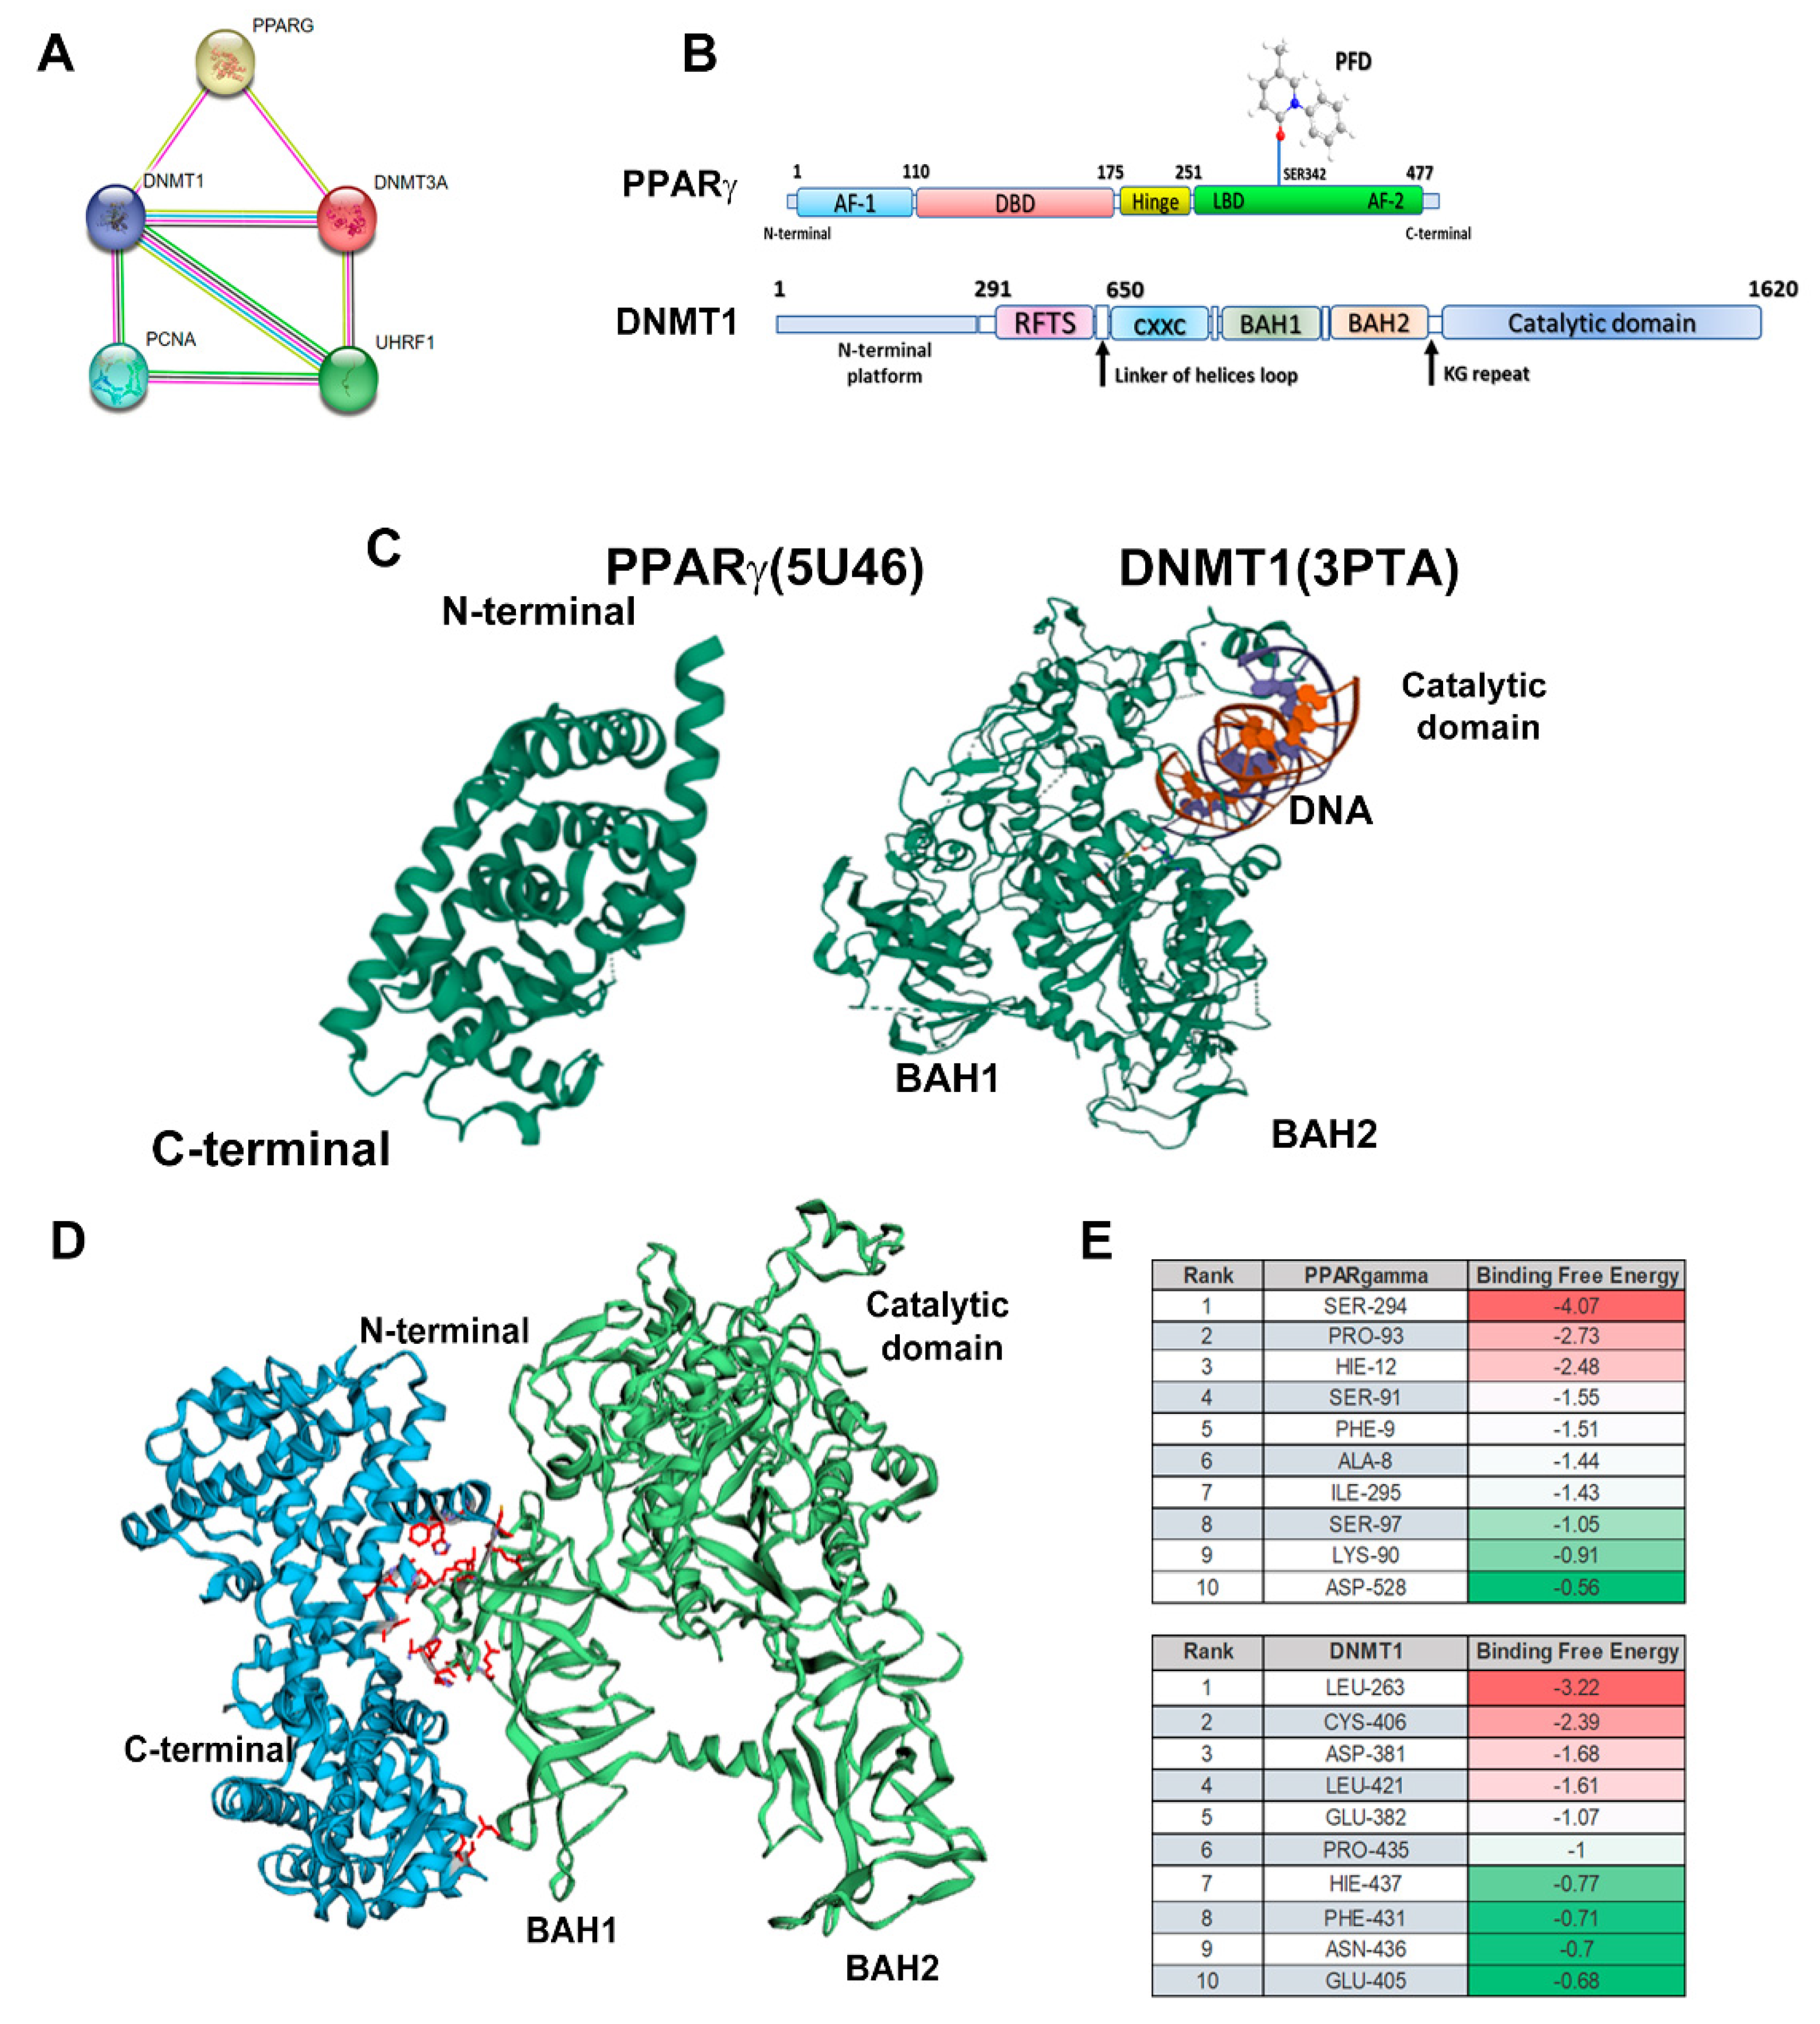
Furthermore, Sharma A et al. evaluated in an in-silico model the potential role of PPARγ-DNMT1 interaction via PPAR-binding elements (PPRE) [
43]. This evidence indicates that is possible that PFD activates PPARγ facilitating the formation of complexes with BAH1 domain of DNMT1, thus increasing the activity of this enzyme. Here, we performed a molecular interaction analysis through STRING demonstrating that PPARγ interacts with DNMT1 and DNMT3a.
Author Contributions
H. O. M-R., Conceptualization, Investigation, Methodology, Formal analysis, Writing – original draft, Visualization. L. F. S-S., Investigation, Conceptualization, Methodology, Formal analysis, Writing – original draft, Visualization. M. G-M., Investigation, Methodology, Writing – review & editing. S. A-O., Investigation, Formal analysis, Visualization. F C-C., Investigation, Formal analysis. C. F-G., Visualization. A. S-R., Methodology, Formal analysis. J.G-B., Methodology, Formal analysis. M. A-L., Visualization. A. S., Writing – review & editing, Visualization. J A-B., Conceptualization, Writing – review & editing, Supervision, Funding acquisition. H. C.M-R., Conceptualization, Methodology, Investigation, Visualization, Re-sources, Writing – review & editing, Supervision, Funding acquisition.
Figure 1.
Liver damage caused by chemicals is prevented by PFD. (A) Established experimental design; NT, non-treated group; HCC, hepatocellular carcinoma group injected weekly with DEN (50 mg/kg/i. p.) plus 2AAF (25 mg/kg/p. o); HCC/PFD group, HCC treatment plus 300 mg/kg PFD from week 0. All experimental groups were euthanized after 12 weeks. (B) Weekly logging of body weight. (C) Representative images of livers after 12 weeks of treatment. Greater size and number of dysplastic nodules were observed in HCC group than in the HCC/PFD group (white asterisks). (D) Graph of the liver weight at the end of treatment. (E) The ratio of liver weight to body weight of animals in each study group. (F) Serum gamma-glutamyl transferase (GTP) assay. (G) Serum alanine transaminase (ALT) assay. Data are presented as mean ± SD using ANOVA followed by Tukey’s multiple comparison test. ns, not significantly difference, *p < 0.05, **p < 0.01, ***p < 0.001, ****p<0.0001.
Figure 2.
PFD prevented alteration of hepatic architecture, fibrosis, and neoplastic lesions. (A) Photomicrograph representative of H&E staining (H&E) of groups at 12 weeks. Deformed portal tracts and thickened hepatic plaques are evident in HCC (asterisks). (B) Quantification of atypical hepatocytes. Cells with many nuclei and changes in the nuclear-cytoplasmic ratio (asterisk), in addition to numerous steatosis sites (yellow arrows). (C) Masson’s trichrome staining (MT). (D) Quantification of the percentage of collagen fibers deposited in the liver tissues of the different groups. (E) Representative expression of GPC3. Hepatic GPC-3 was analyzed in tissue by immunohistochemistry using primary anti-rabbit GPC-3 antibody. (F) Percentage of areas positive for GPC-3. (G) Representative western blot of cytoplasmic β-catenin. (H) Quantification of β-catenin expression. (I) Western blotting representative of the nuclear fraction of β-catenin and c-Myc. J) Quantification of β-catenin nuclear expression. (K) Quantification of c-Myc nuclear expression. Significantly different at **p < 0.001, ***, p < 0.0001 and ****p<0.00001.
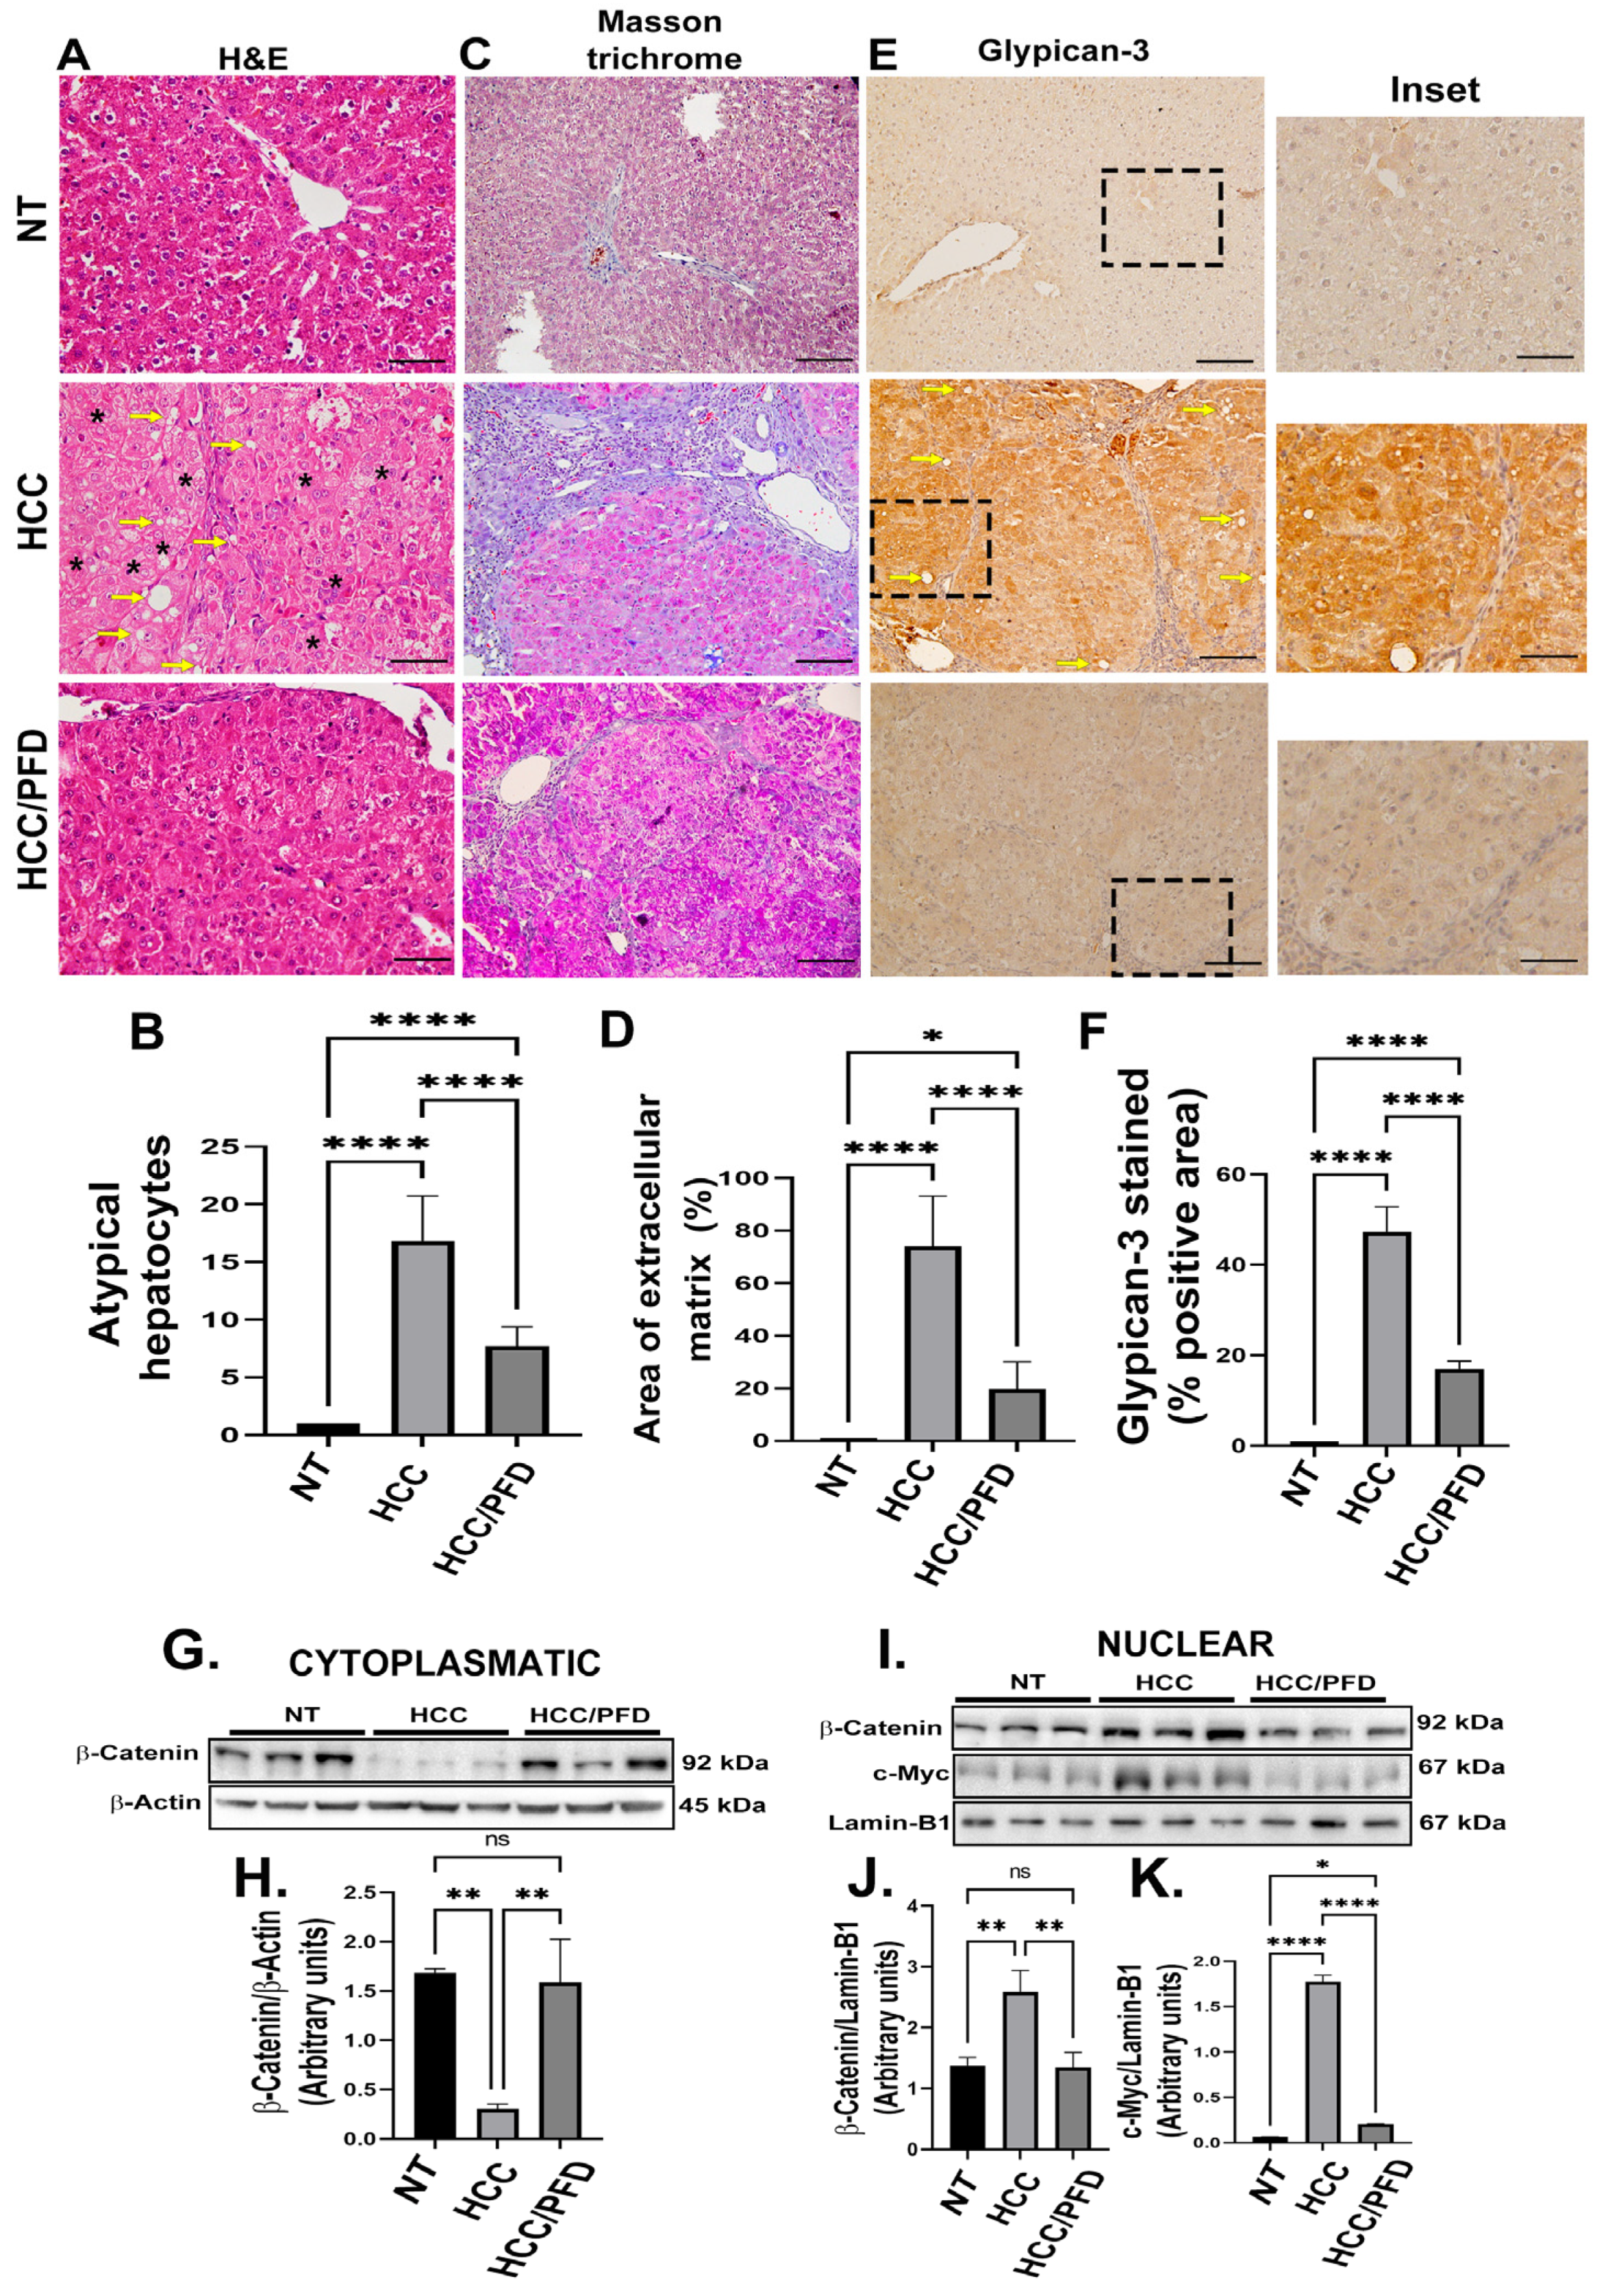
Figure 3.
PFD modulates the expression and subcellular localization of PPAR isoforms and SREBP1. (A) Western blot representative of the cytoplasmic expression of different PPAR isoforms. (B) Densitometry determination of PPARα expression, (C) PPARɣ and (D) PPARɣ2. (E) Western blotting representative of the nuclear expression of different isoforms of PPARs. (F) Densitometry determination of the nuclear expression of PPARα (G) PPARɣ and (H) PPARɣ2. (I) Western blot representative of total and phosphorylated SREBP expression. (J) Graph of the determination of SREBP expression and (K) pSREBP-1c (ser372). The results are shown as the mean ± standard deviation (SD) of triplicate assays. One-way ANOVA and Tukey’s post-hoc tests were performed. Significantly different at *p<0.05, **p < 0.001, *** p < 0.0001 and ****p<0.00001.
Figure 4.
Pirfenidone modulates the expression of enzymes that modify DNA and promote global methylation. (A) Representative western blots of DNMT1, DNMT1Ac, DNMT3a, DNMT3b, UHRF1, and PCNA. (B) Graphs showing the relative expression levels of DNMT1, (C) DNMT1Ac, (D) DNMT3a, (E) DNMT3b, (F) UHRF1, and (G) PCNA. (H) Representative images of the nuclear localization of DNMT1 and 5-mC in liver tissues. Nuclei were stained with DAPI (blue), DNMT1 (green) and 5-Methylcytosine (5-mC) (red). Images were captured using an epifluorescence microscope. White asterisks indicate positivity to the different markers analyzed. (I) Graph showing the number of positive hepatocytes for DNMT1. (J) Dot blot representative of global DNA methylation through the detection of 5mC. (K) Quantification of densitometry results of the relative levels of 5mC. (L) Determination of overall percentage of methylated DNA. One-way ANOVA and Tukey’s post-hoc tests were performed. Significantly different at *p<0.05, **p < 0.001, ***p< 0.0001, ****p<0.00001.
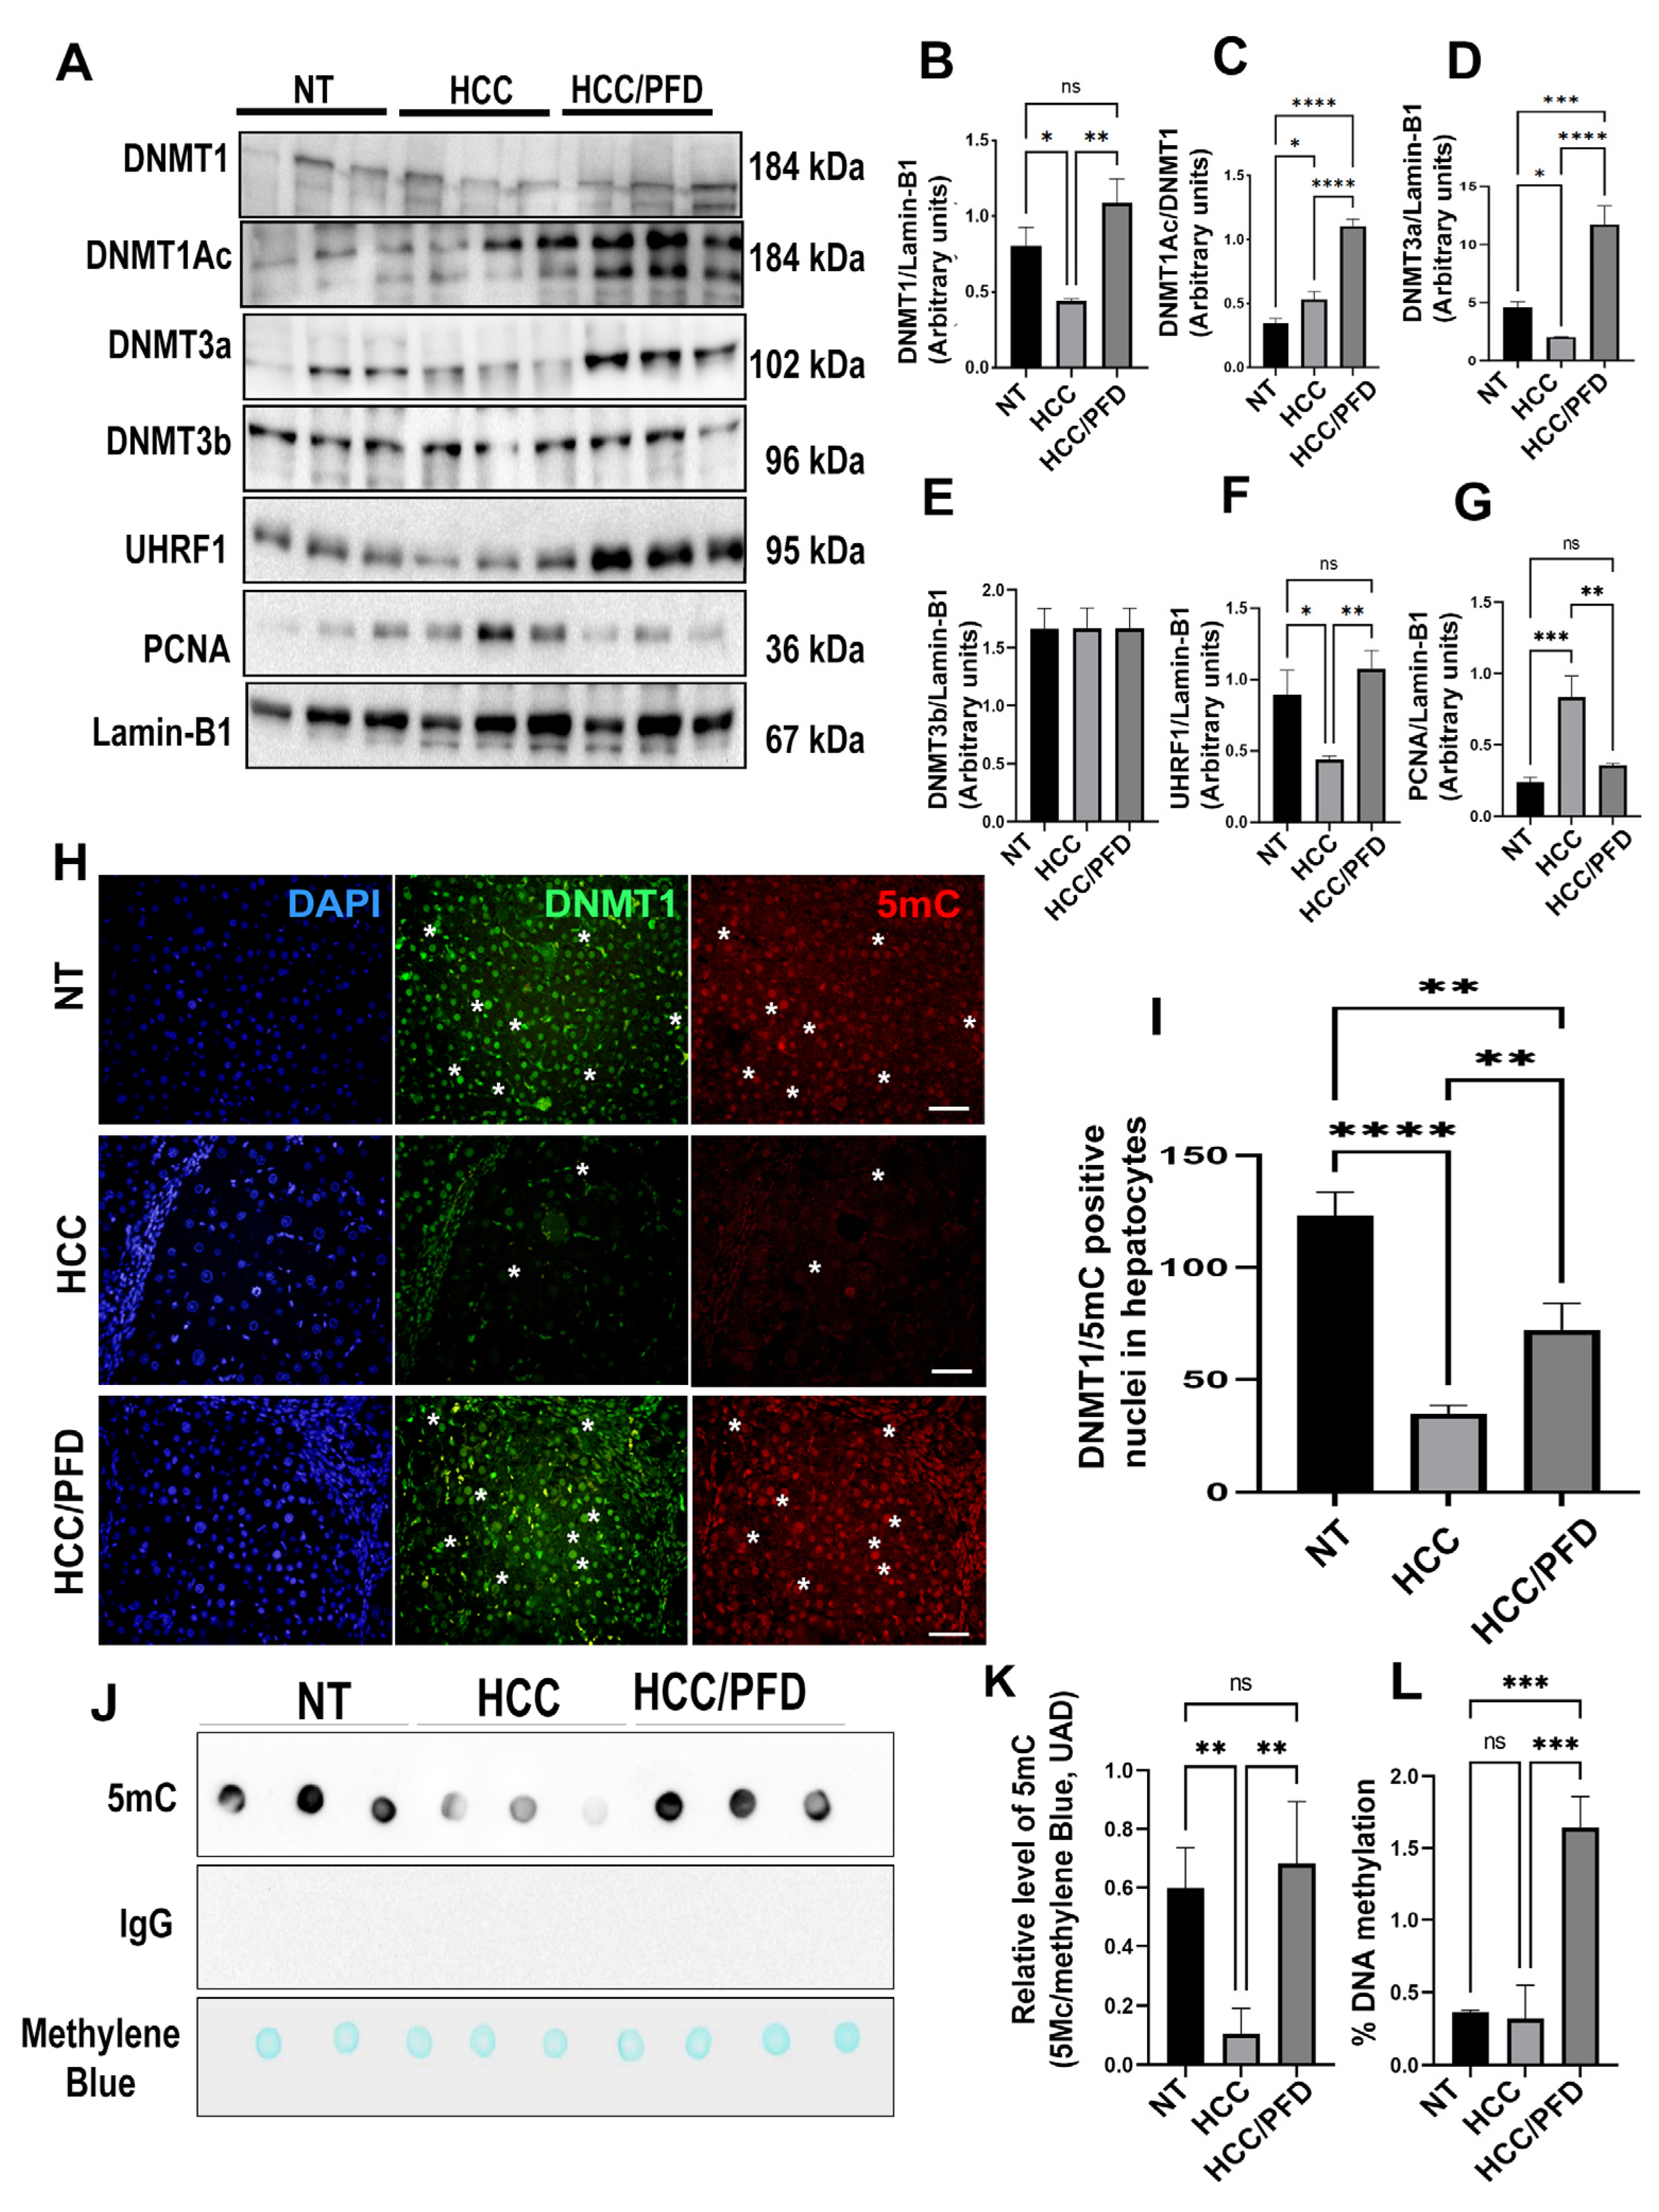
Figure 5.
In vitro, pirfenidone affects the synthesis of enzymes altering DNA global methylation (A) Representative western blots for DNMT1, acDNMT1, DNMT3a, DNMT3b, UHRF1, and PCNA. (B) Relative expression of DNMT1, acDNMT1, DNMT3a, DNMT3b, UHRF1 and PCNA. Lamin-B1 was used as a loading control. (C) Representative western blots for p53, β-Catenin and c-Myc. (D) Relative expression of p53, β-Catenin and c-Myc. Lamin-B1 was used as a loading control. (E) HepG2 cell nuclei were stained with DNMT1, DNMT3a and DNMT3B (green) and 5-Methylcytosine (red). White asterisks indicate positivity to the different markers analyzed. (F) Dot-blot representative of global DNA methylation through 5mC detection. (J) quantification for 5mC relative levels, methylene blue was used as a DNA loading control. The results are shown as the mean ± standard deviation (SD) of triplicate assays. One-way ANOVA and Tukey’s post-hoc tests were performed. Significantly different at * p<0.05, **p < 0.001, *** p < 0.0001 and ****p<0.00001.

Figure 6.
Analysis of the protein-protein interaction between PPARɣ and DNMT1. (A) STRING database was used to generate a comprehensive protein-protein interaction (PPI) network between PPARɣ and DNMT1. (B) The interaction between PFD and PPARɣ is depicted, along with a linear representation of PPARɣ and DNMT1 and their corresponding structural domains. (C) The 3D structures of PPARɣ (5U46) and DNMT1 (3PTA) obtained from the Protein Data Bank (
https://www.rcsb.org/). (D) The high-scoring docking poses from the docking simulation of PPARγ-DNMT1 proteins are shown, with PPARγ (cyan blue) serving as a possible receptor and DNMT1 (green) as a possible ligand. Interacting amino acids are highlighted in red. (E) Amino acid residues and free energy that allow for the interaction between PPARγ and DNMT1 are depicted.
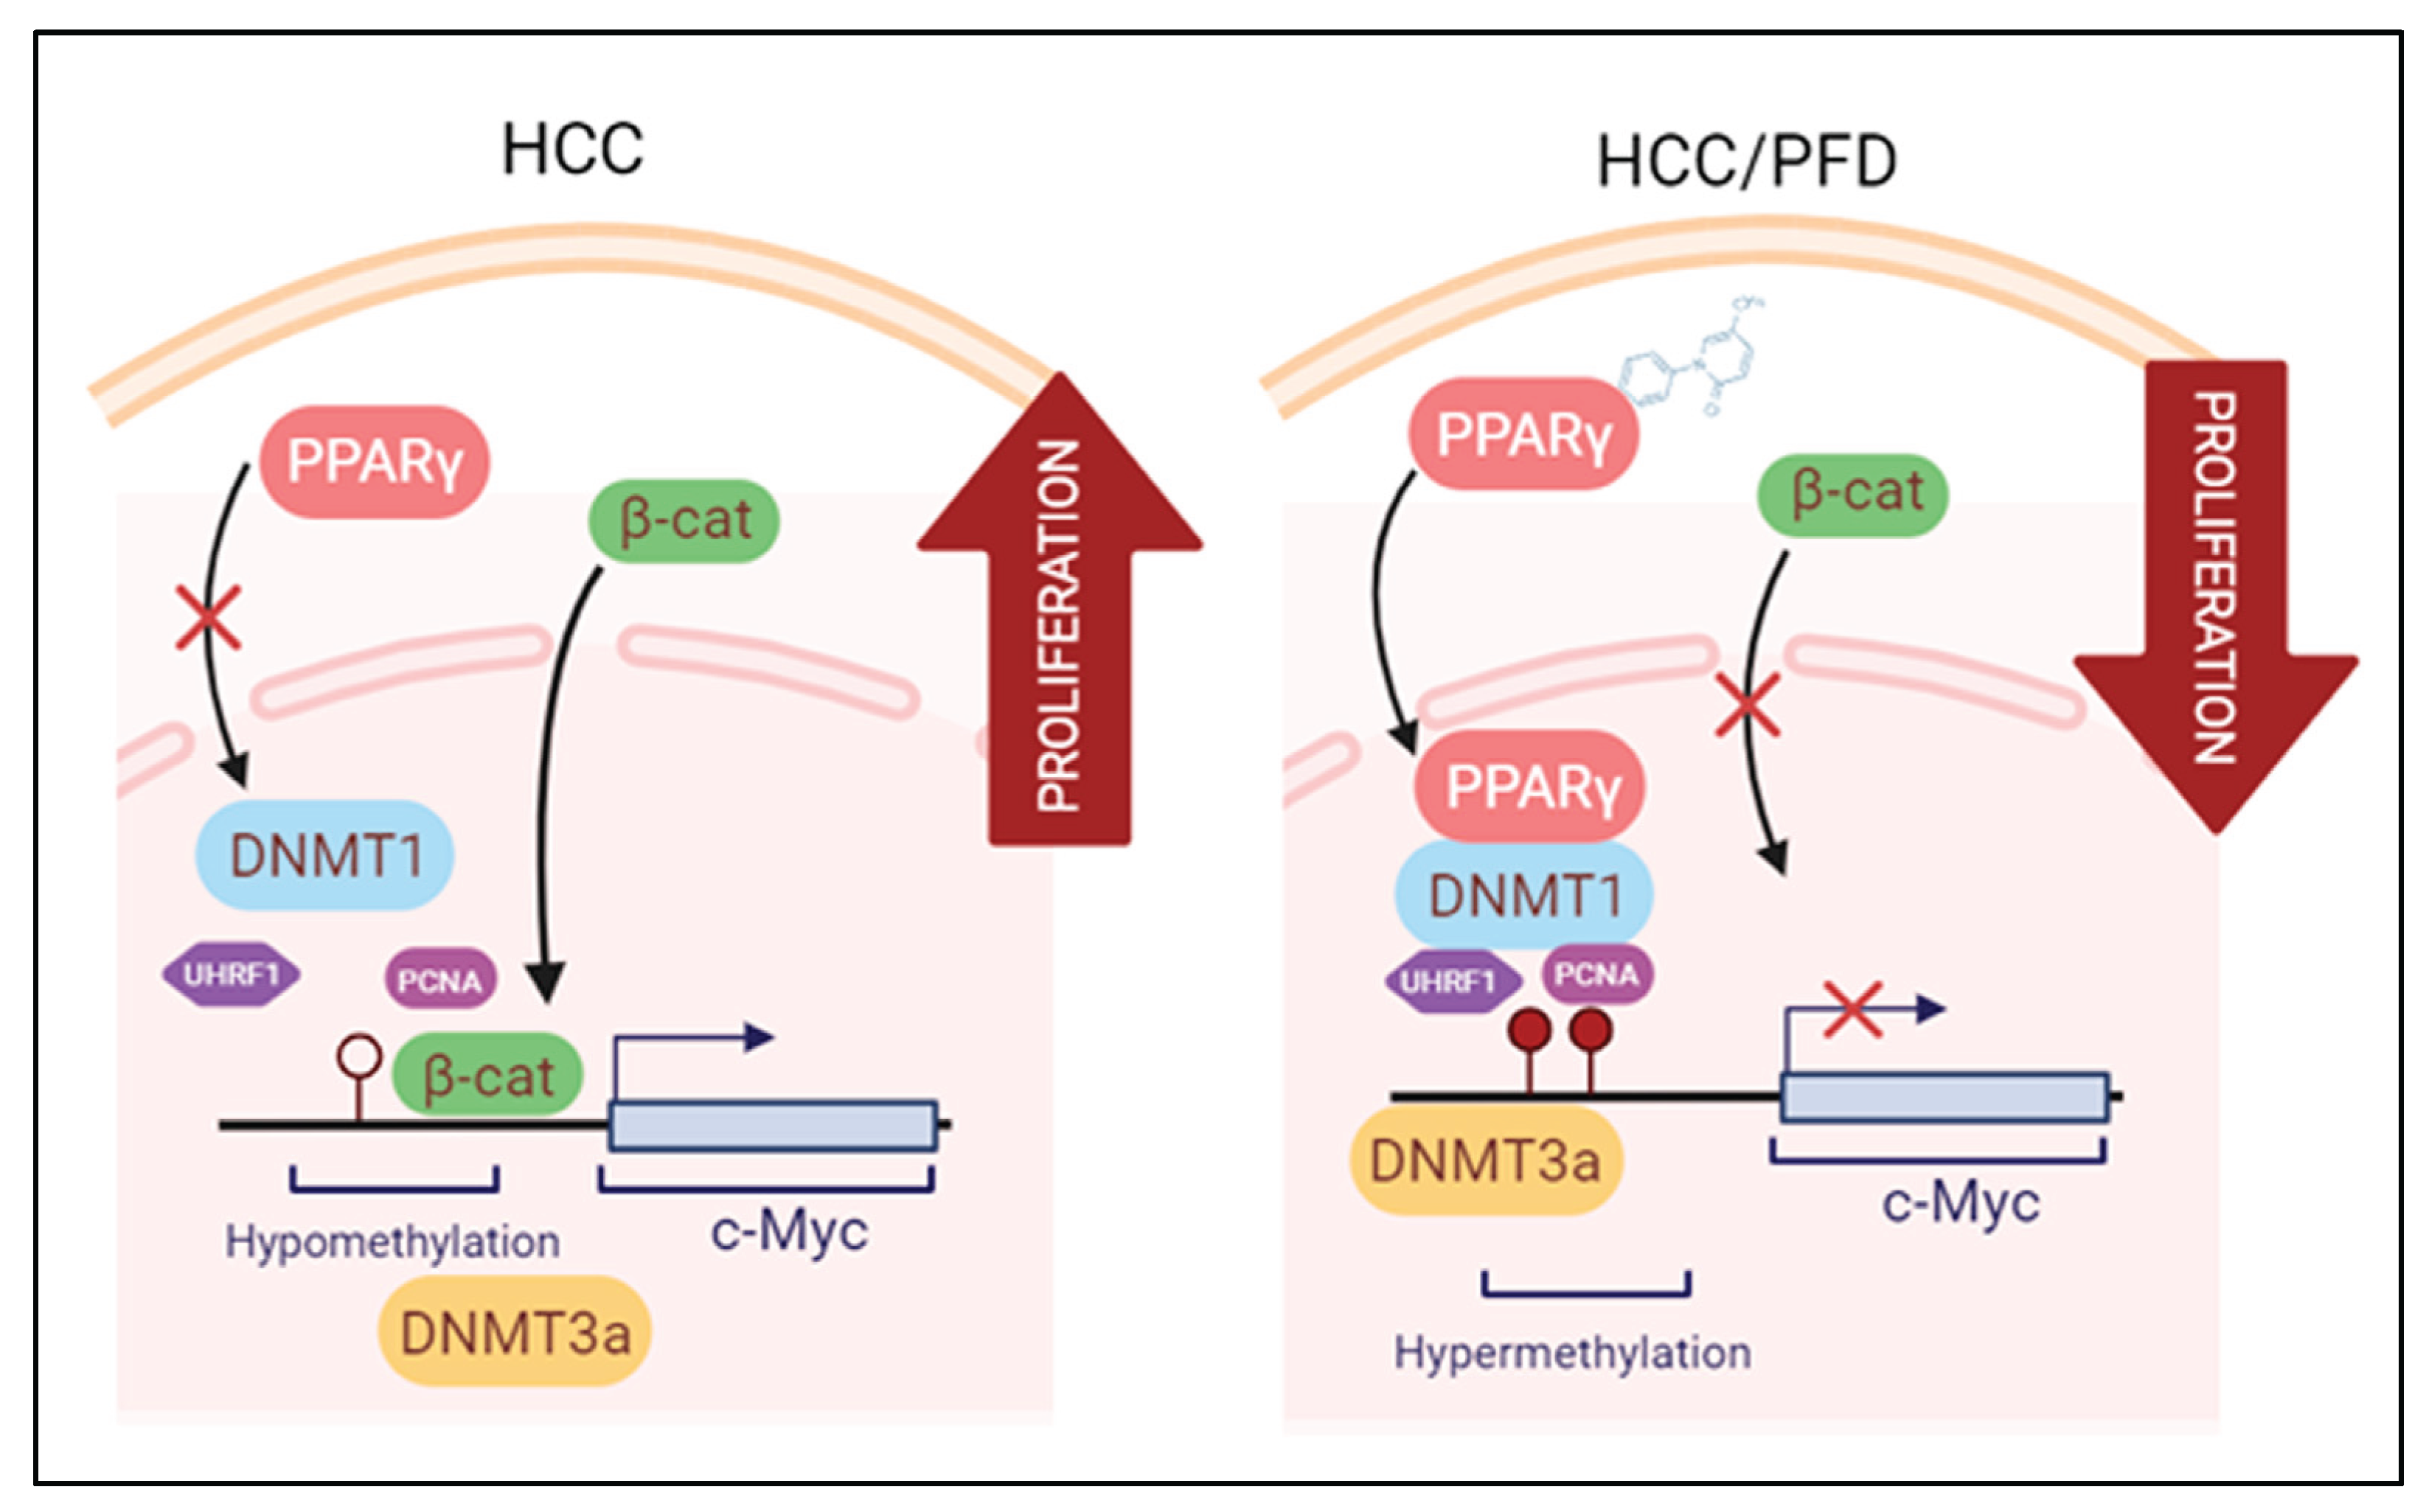
Figure 7.
Modulation of epigenetic markers induced during HCC is the proposed mechanism exerted by PFD. Left panel: Molecular mechanisms activated during HCC growth: β-catenin crosses into the nucleus, facilitating c-Myc oncogene transcription. Right panel: PFD is a PPARγ ligand/agonist that alters DNMT1 and DNMT3a function, promoting DNA hypermethylation, and reducing c-Myc expression. These mechanisms together could suppress aberrant cell division leading to HCC.
Table 1.
Effects of PFD on number of hepatocellular nodules in rats.
Table 1.
Effects of PFD on number of hepatocellular nodules in rats.
| Groups |
No of rats with nodules / total rats |
Nodule incidence (%) |
Total no. of nodules |
Average no. of nodules/nodule bearing liver (nodule multiplicity) |
Nodules relative to size (% of total no.) |
| ≥3 mm |
<3 to >1mm |
≤1 mm |
| NT |
0/0 |
0 |
0 |
0 |
0 |
0 |
0 |
| HCC |
6/6 |
100 |
424 |
106±36.36* |
12 |
30 |
58 |
| HCC/PFD |
6/6 |
90 |
227 |
57±12.66* |
8 |
15 |
76 |
Table 2.
Histologic alterations induced at 12 weeks.
Table 2.
Histologic alterations induced at 12 weeks.
| Histological parameter |
NT |
HCC |
HCC/PFD |
| Hyperplasia |
- |
+ |
+ |
| Dysplasia |
- |
+ |
- |
| Cancer cell |
- |
+ (MD) |
+(WD) |
| Cellular infiltration |
- |
1 |
0 |
| Fibrosis |
- |
3 |
2 |
| Oval cells |
- |
3 |
1 |
| Ballooning degeneration |
- |
3 |
1 |
| Steatosis |
- |
++ |
- |
| Cholestasis |
- |
0 |
0 |
| Mallory bodies |
- |
+ |
- |
| Lobular inflammation |
- |
1 |
0 |
| Periportal bile ducts proliferation |
- |
1 |
0 |
