Submitted:
04 April 2024
Posted:
05 April 2024
You are already at the latest version
Abstract
Keywords:
1. Introduction
2. Materials and Methods
2.1. Data Processing
2.2. Ground-Based and Satellite Datasets
2.3. Statistical Metrics
3. Results and Discussion
3.1. Comparison of Model against Satellite and Ground-Based Measurements
3.1.1. Evaluation of Effective UV Products
3.1.2. Evaluation of PAR
3.2. PAR and UV Climatology and Trends
3.2.1. Climatology
3.2.2. Trends
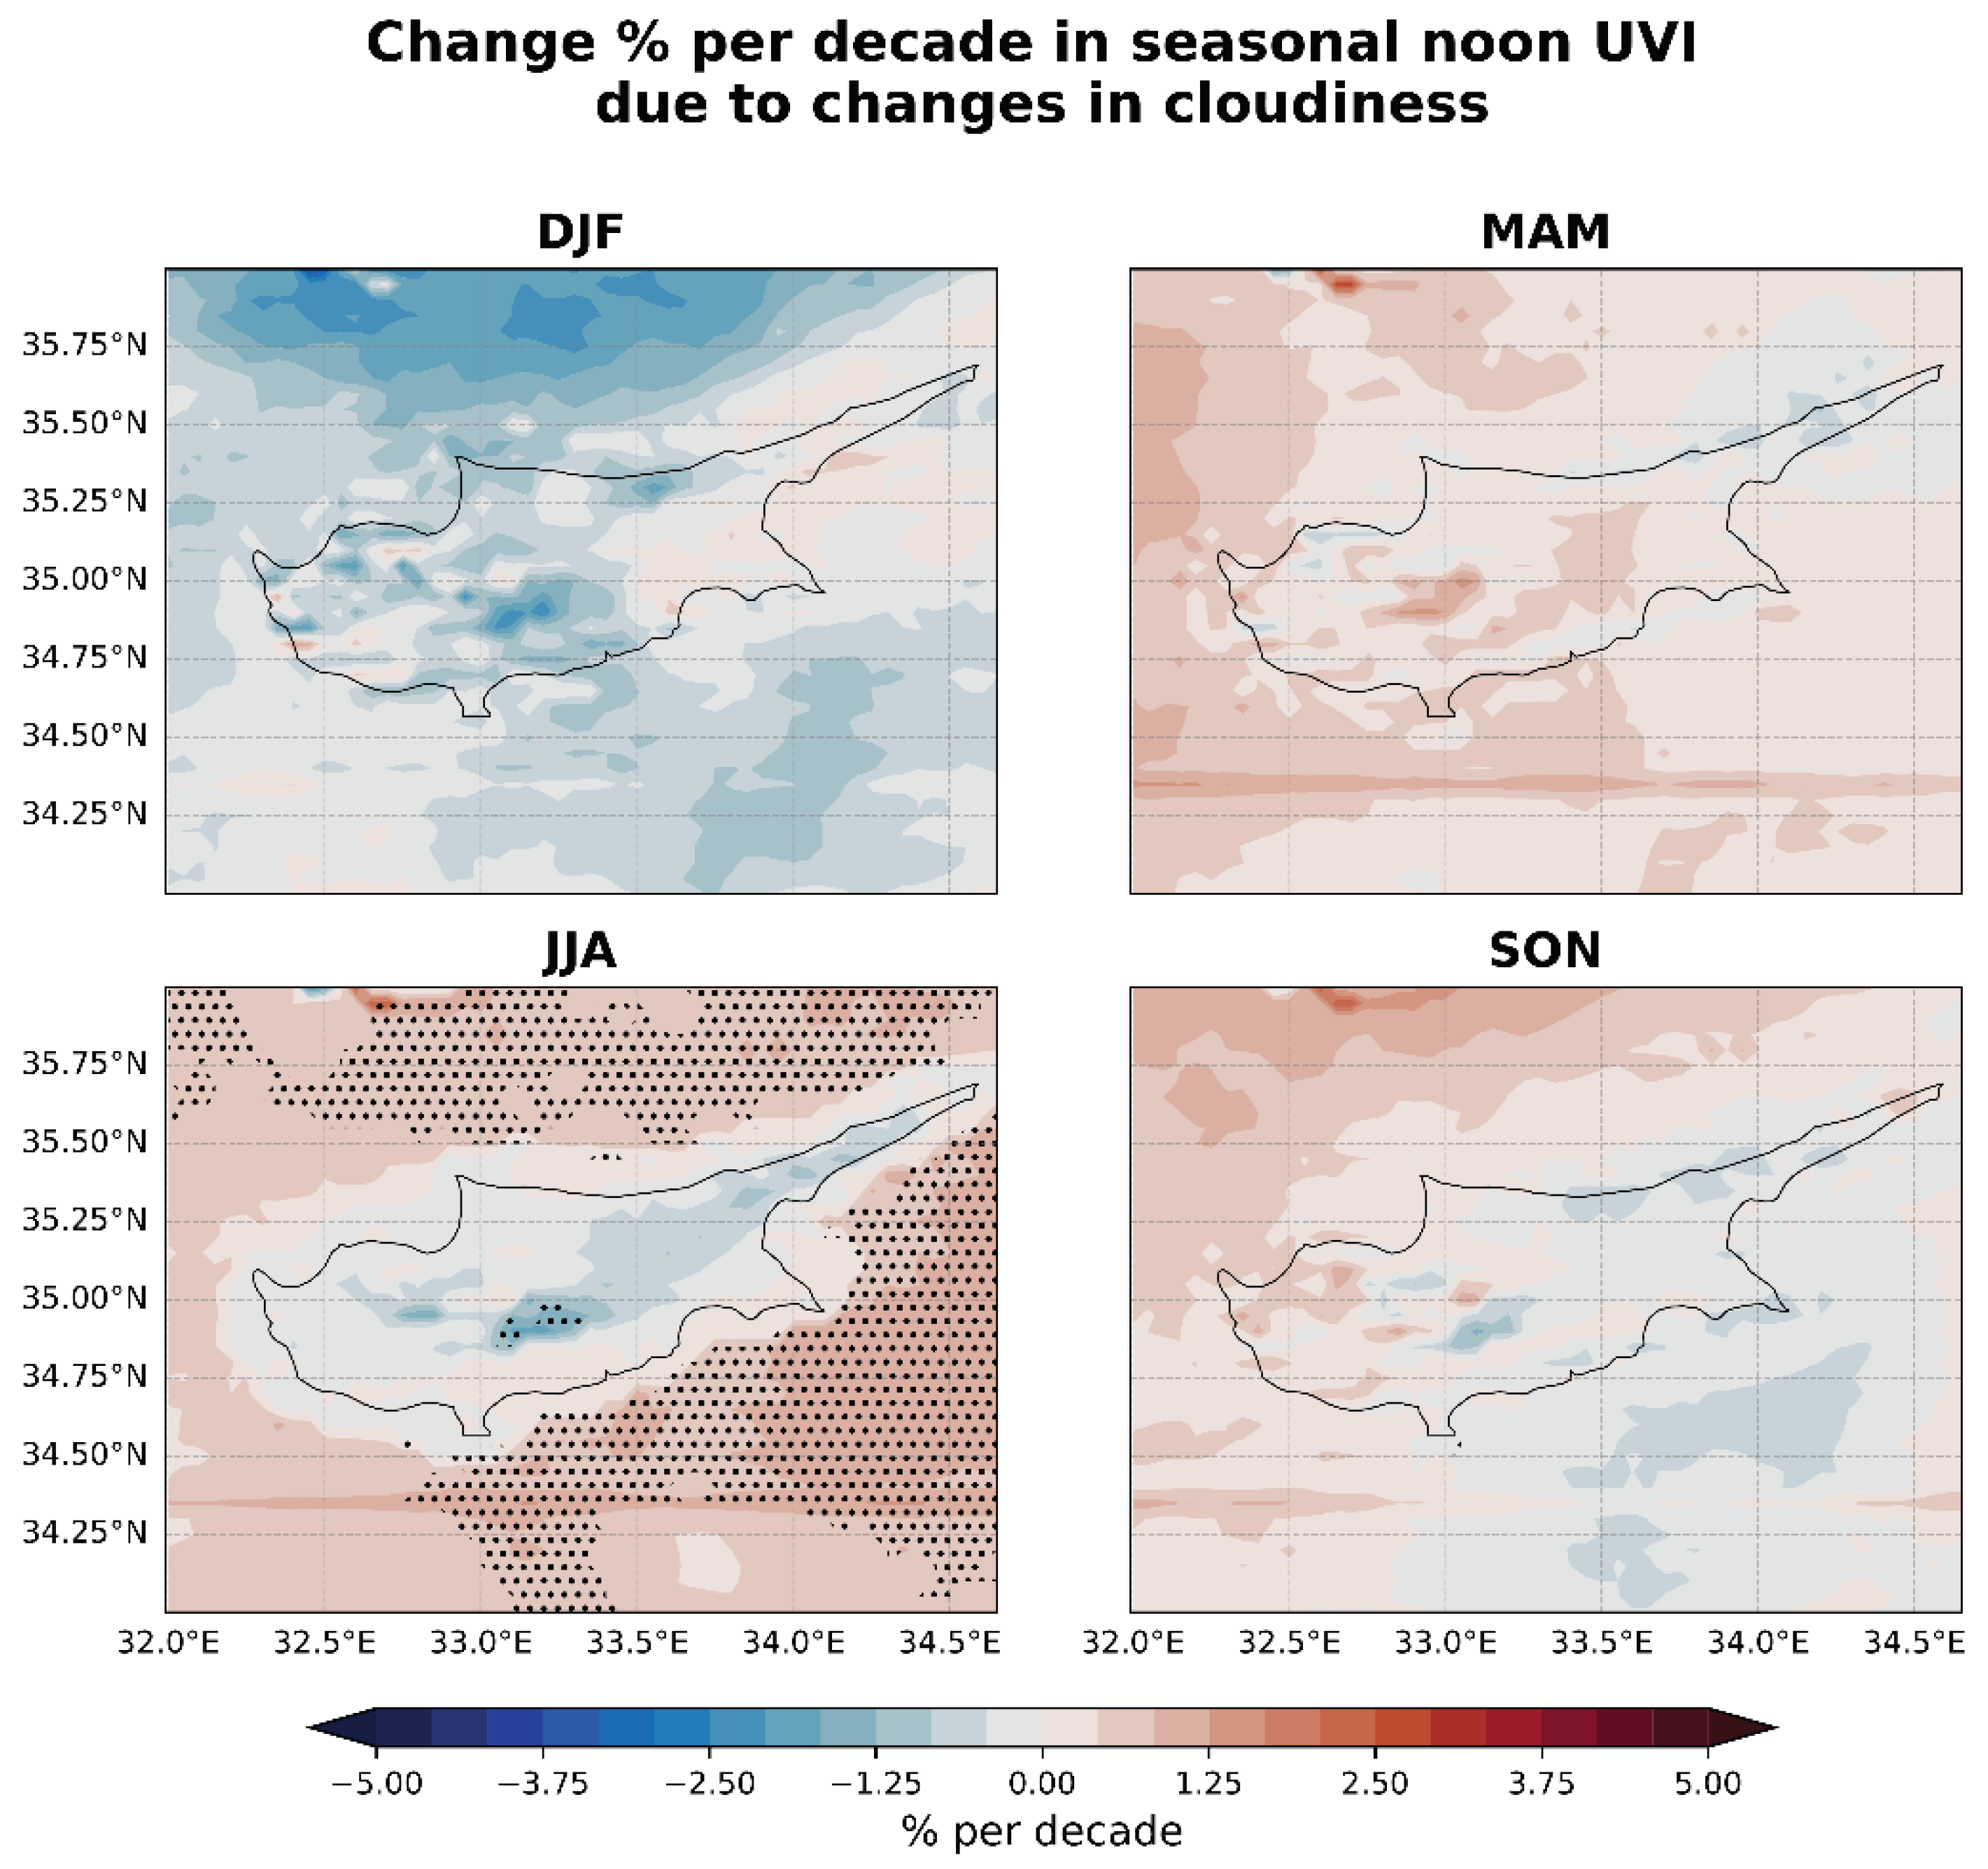
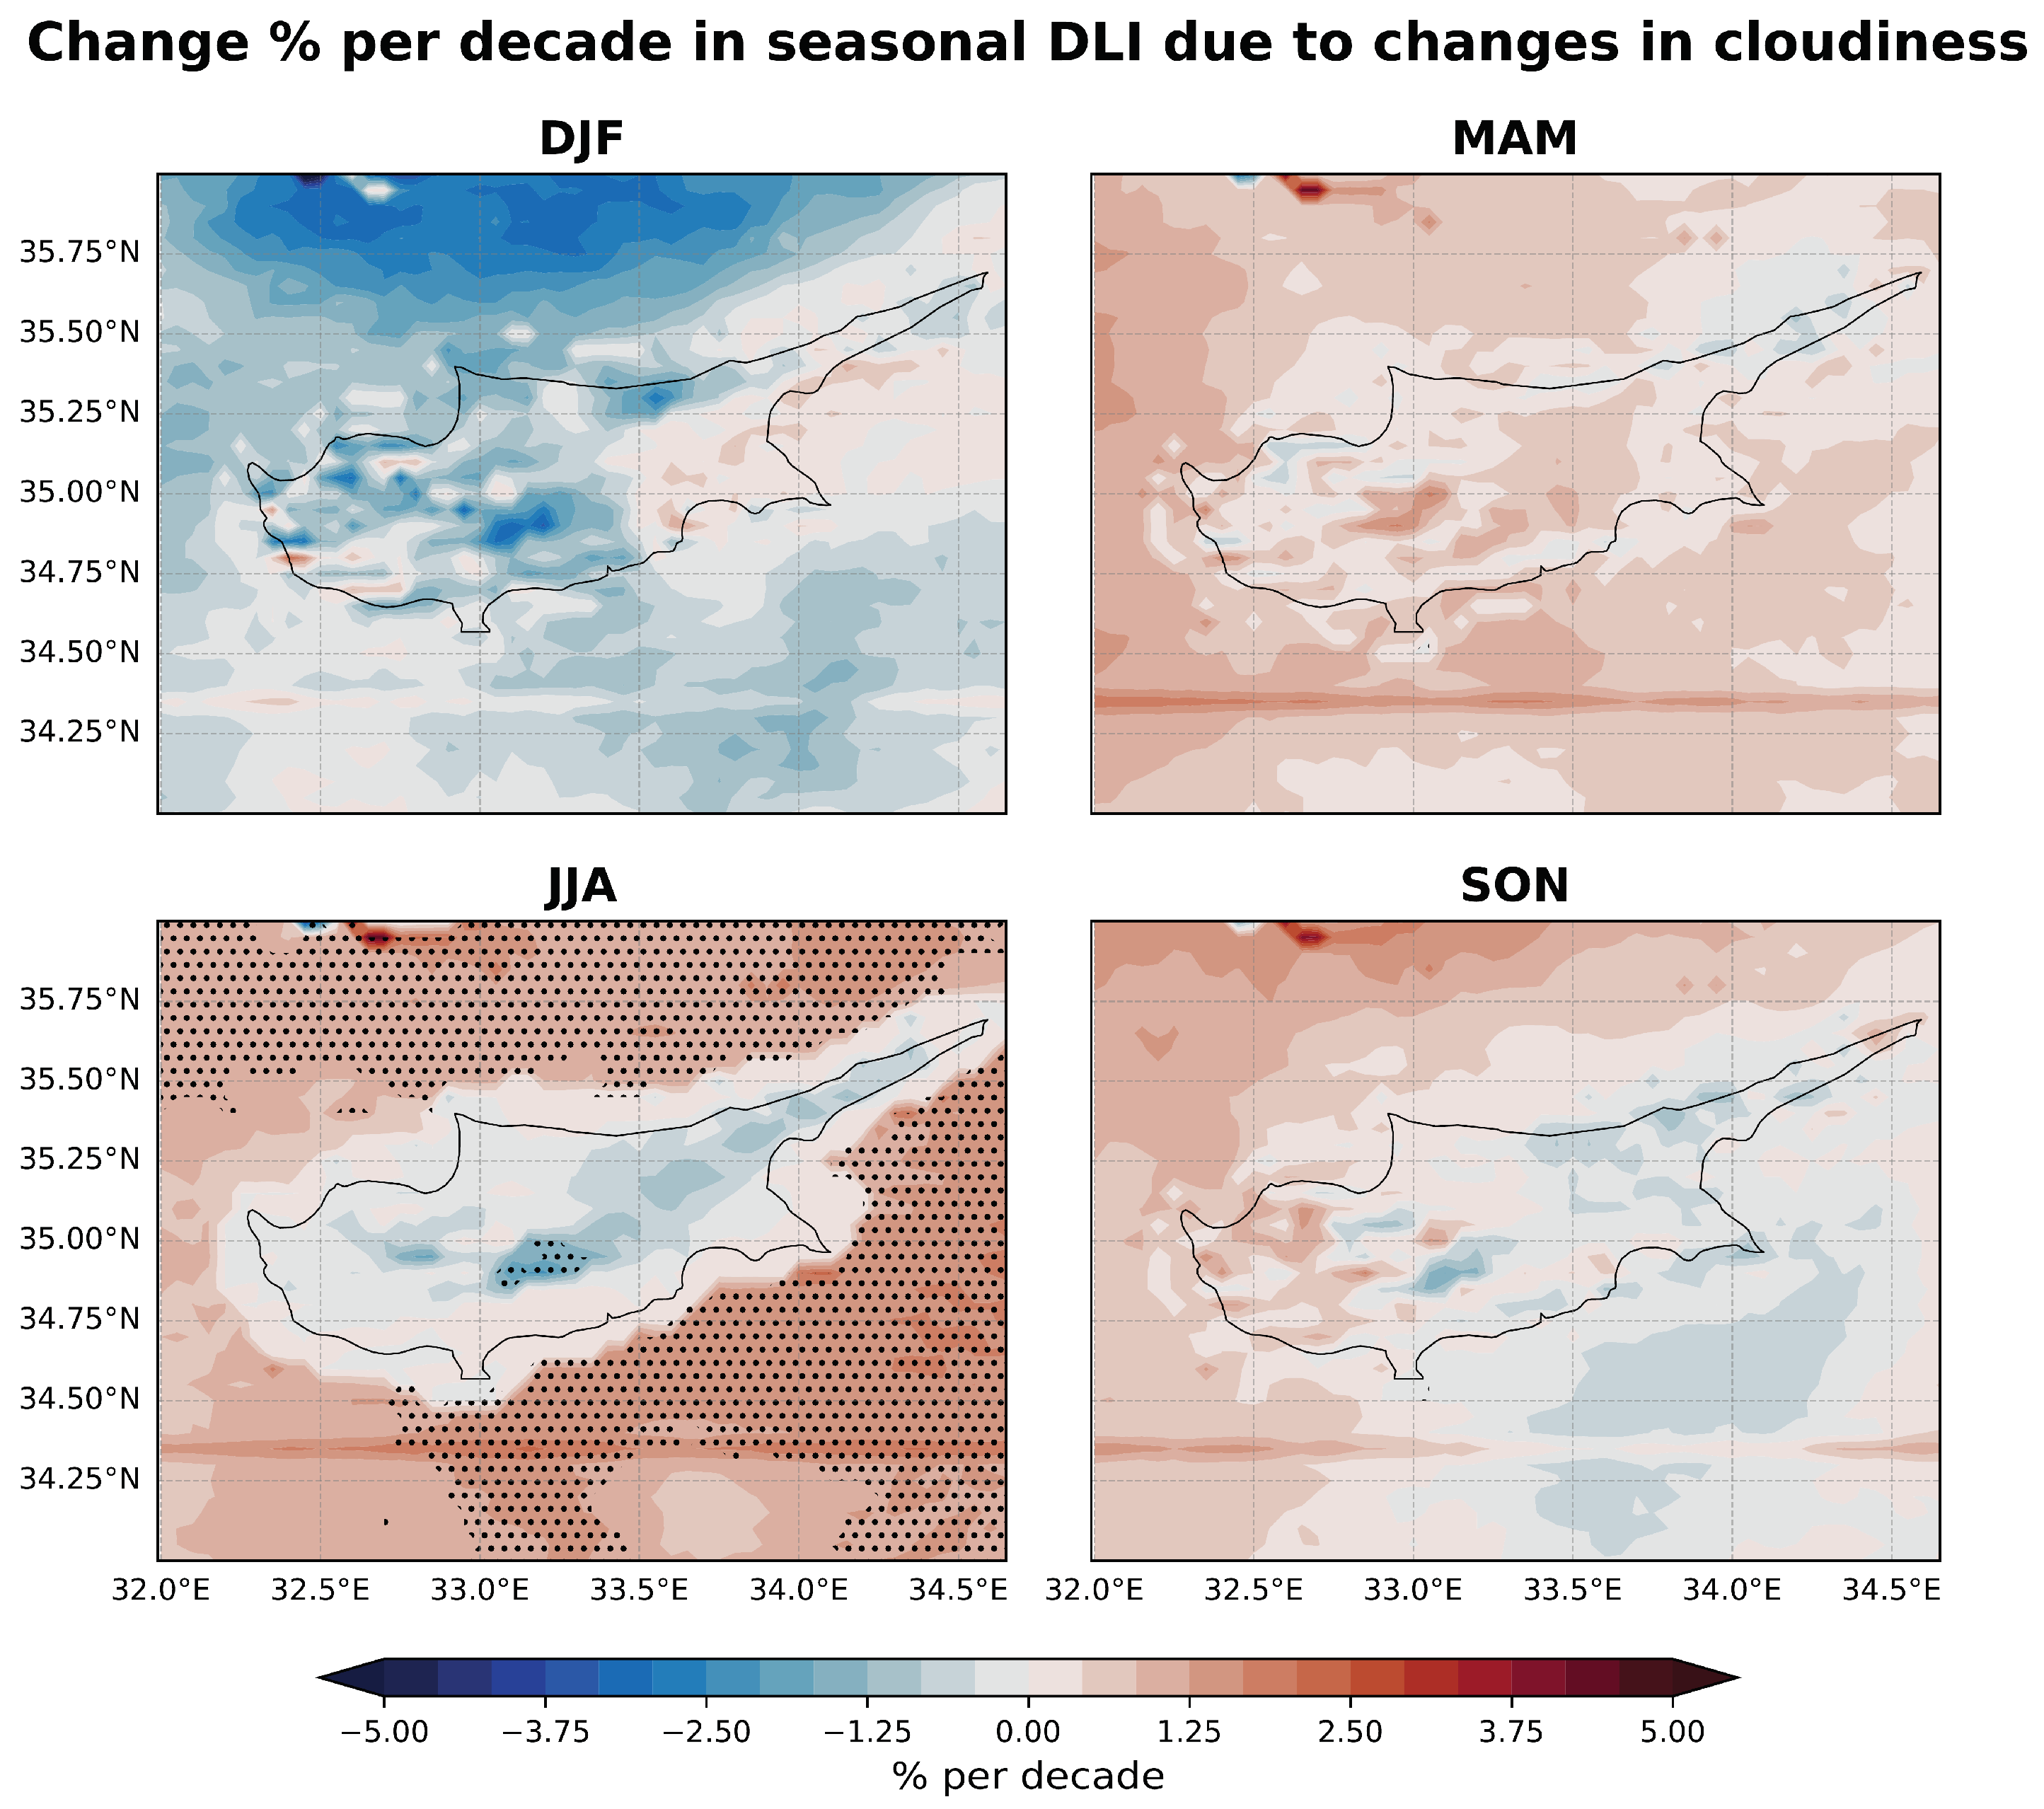
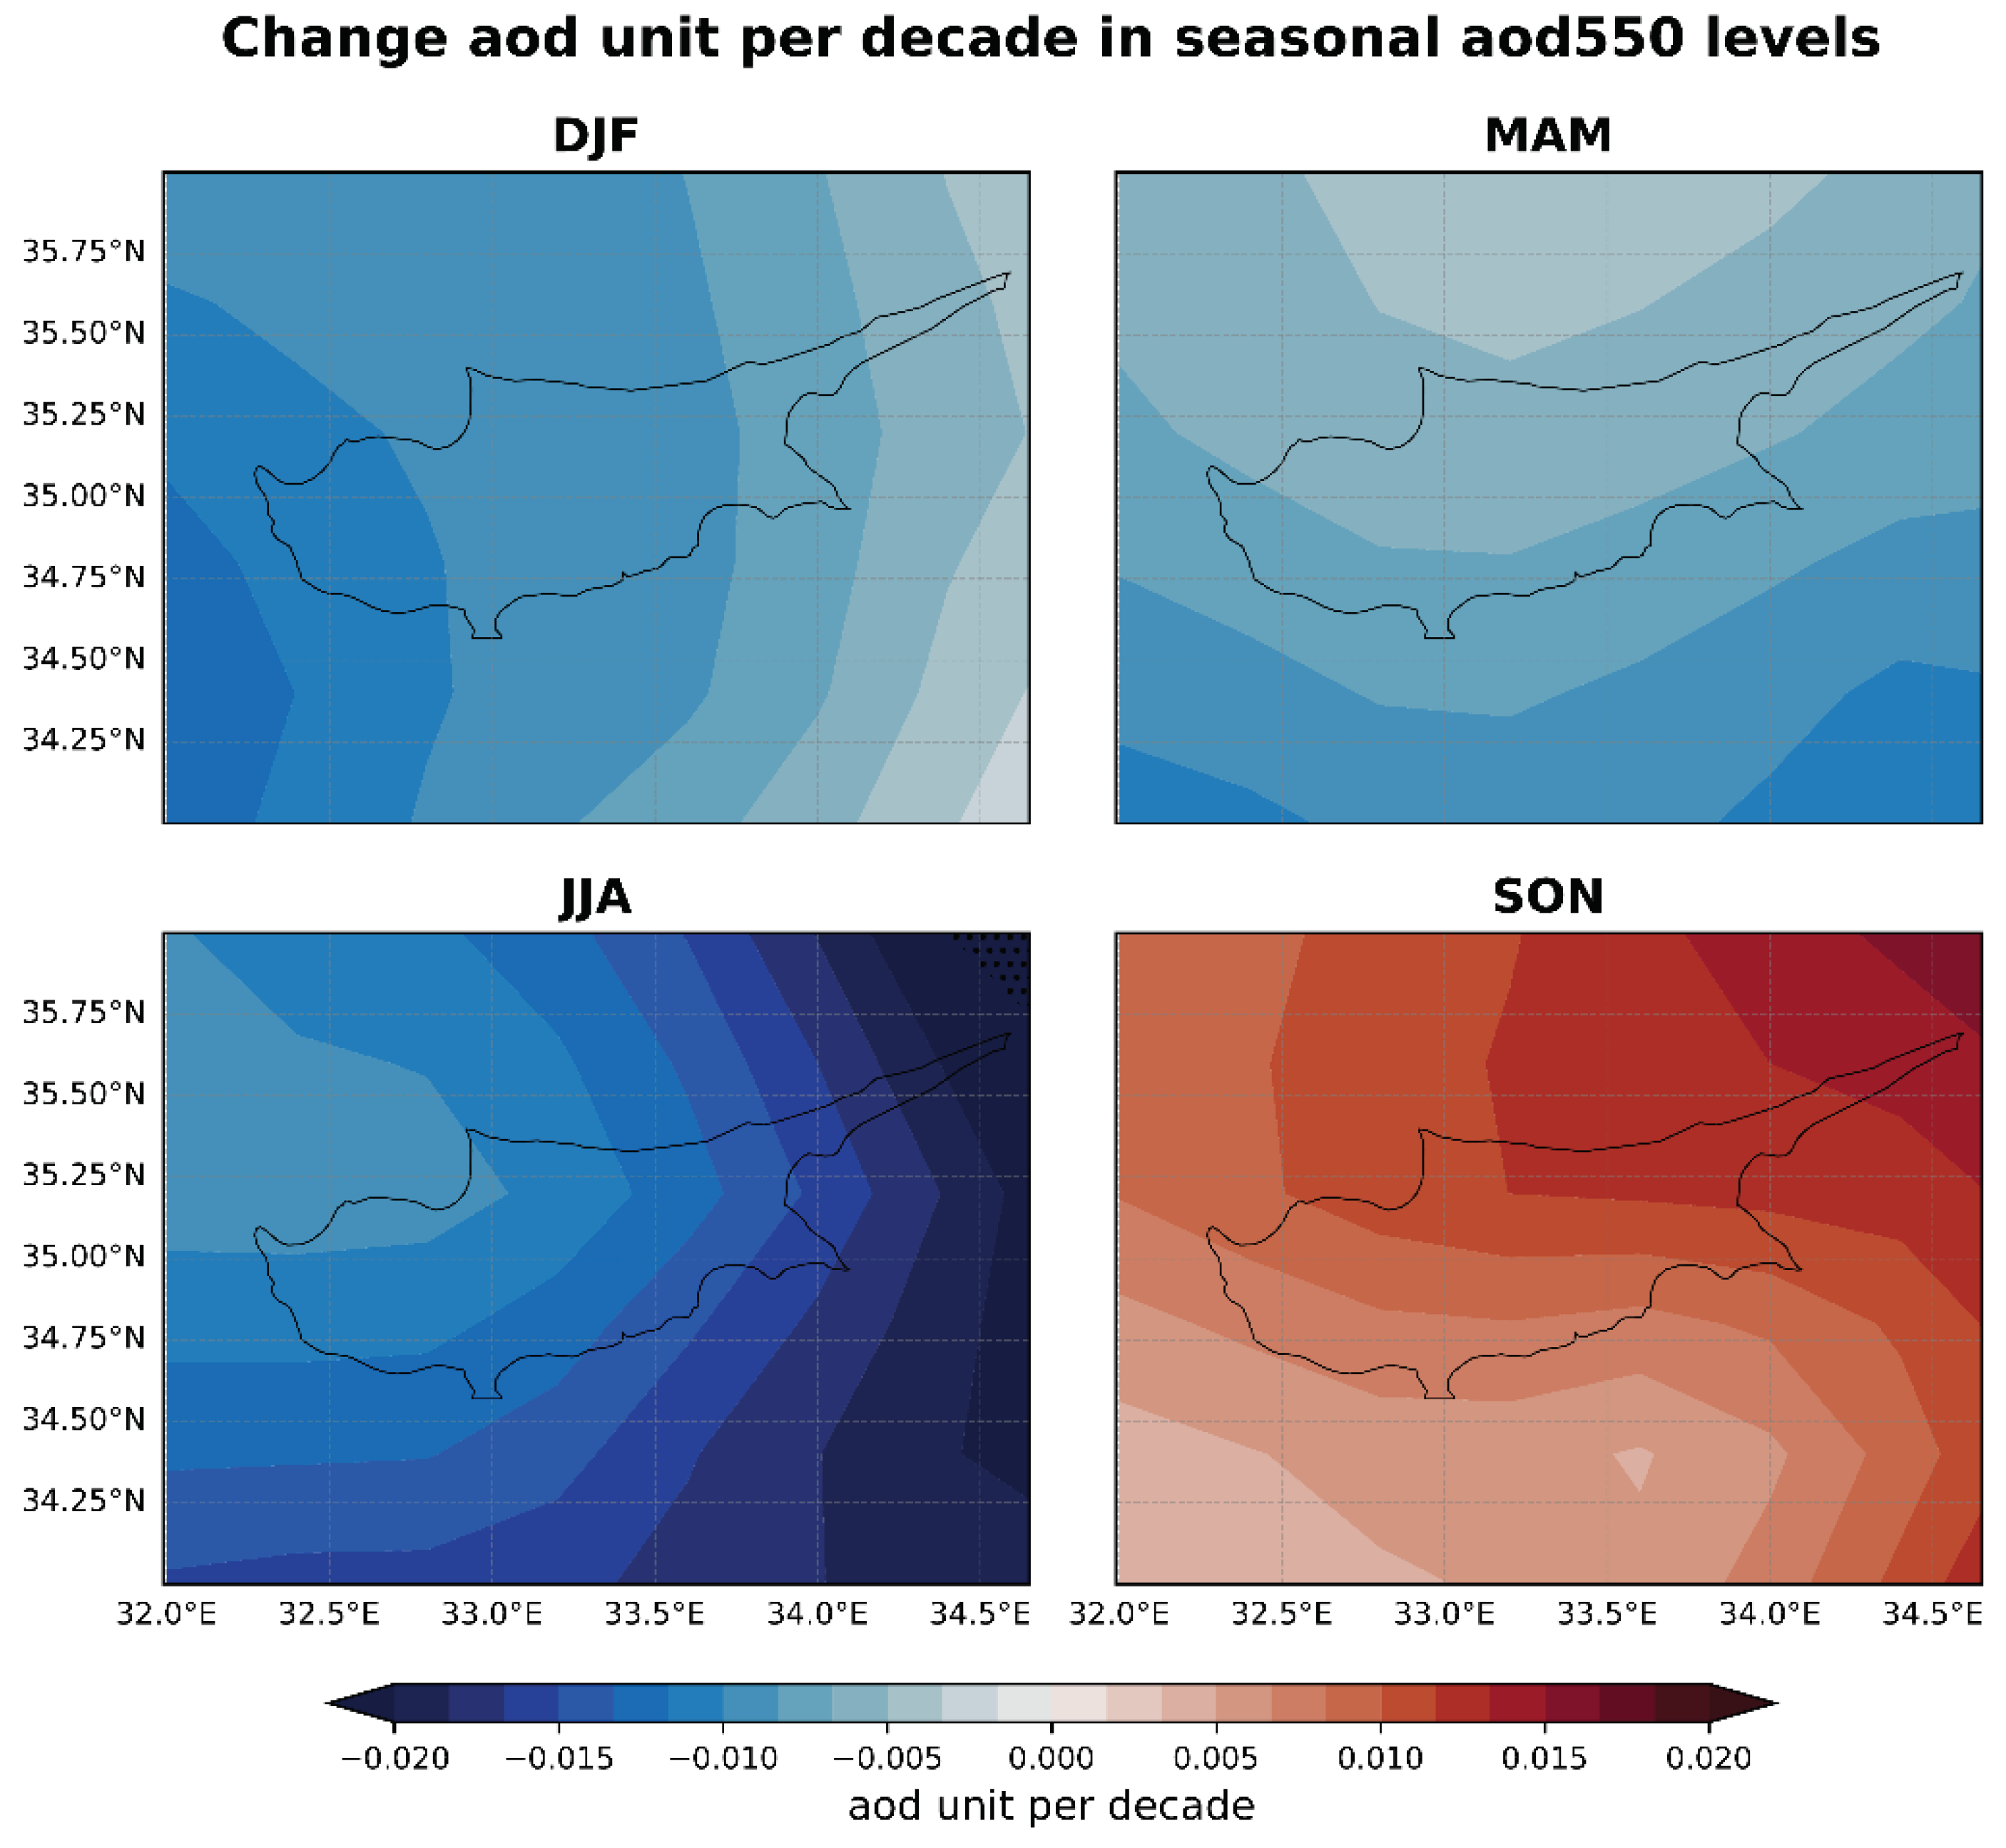
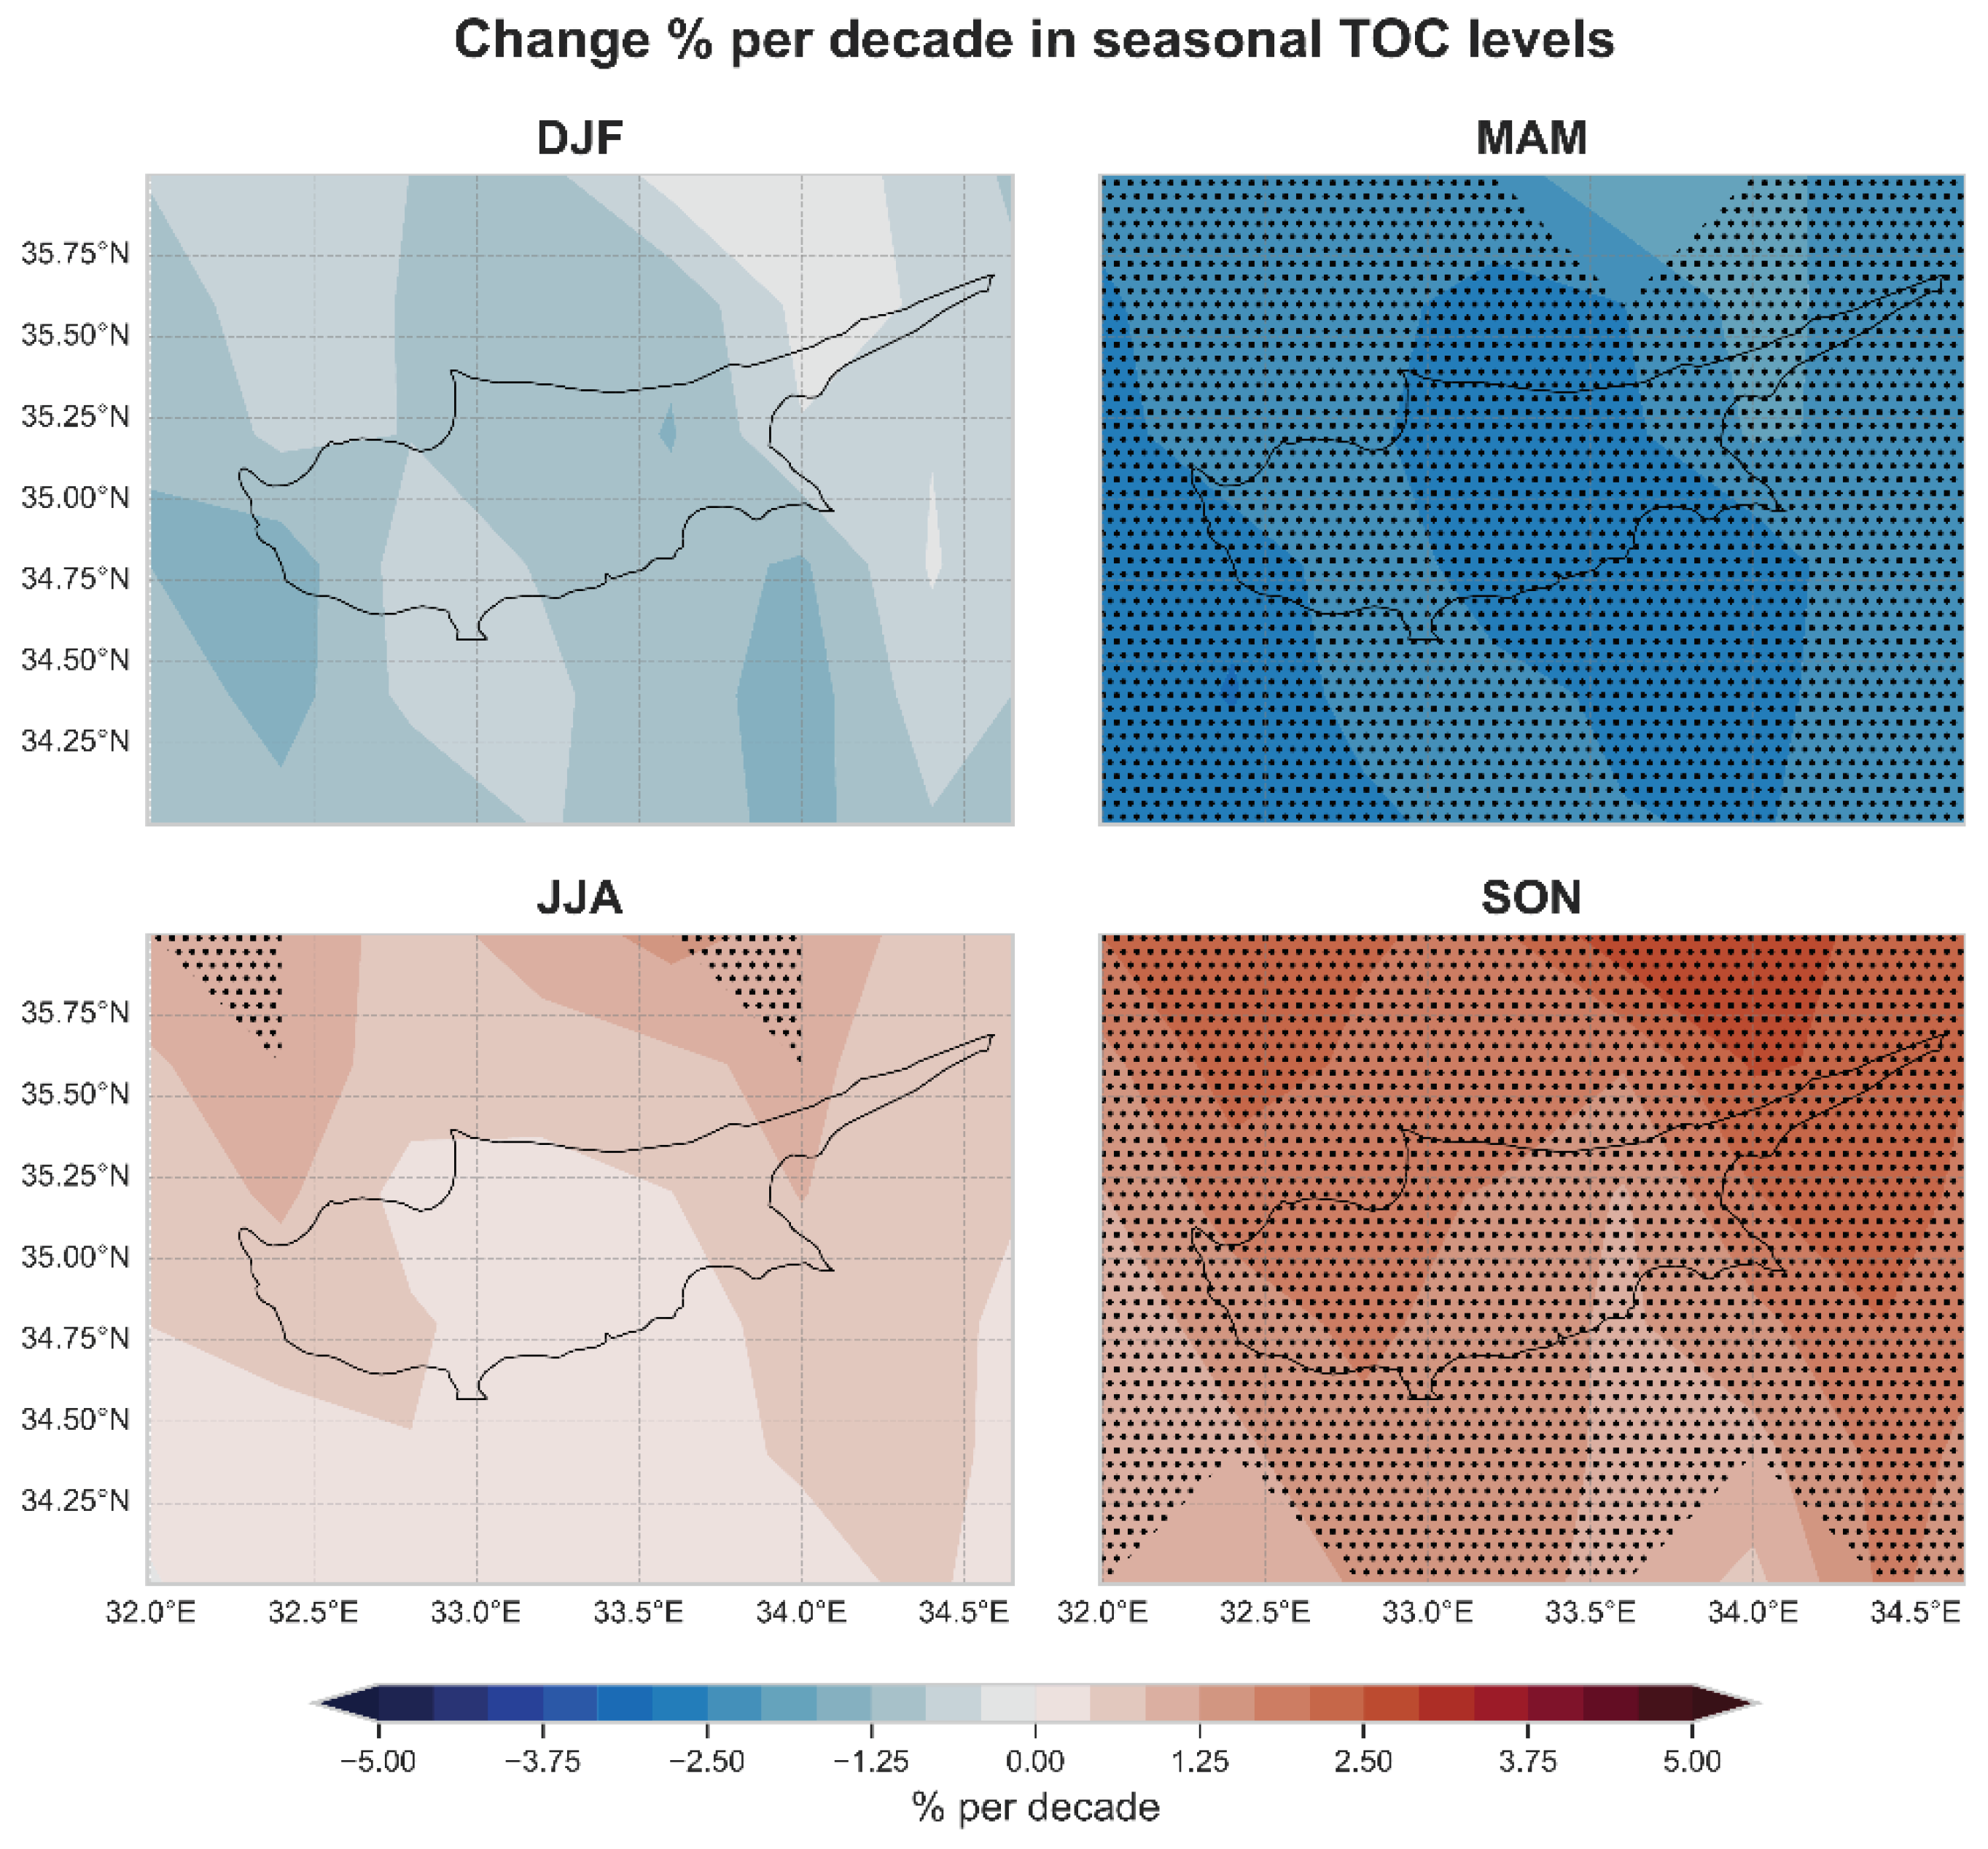
4. Summary and Conclusions
Author Contributions
Funding
Data Availability Statement
Acknowledgments
Conflicts of Interest
Appendix A
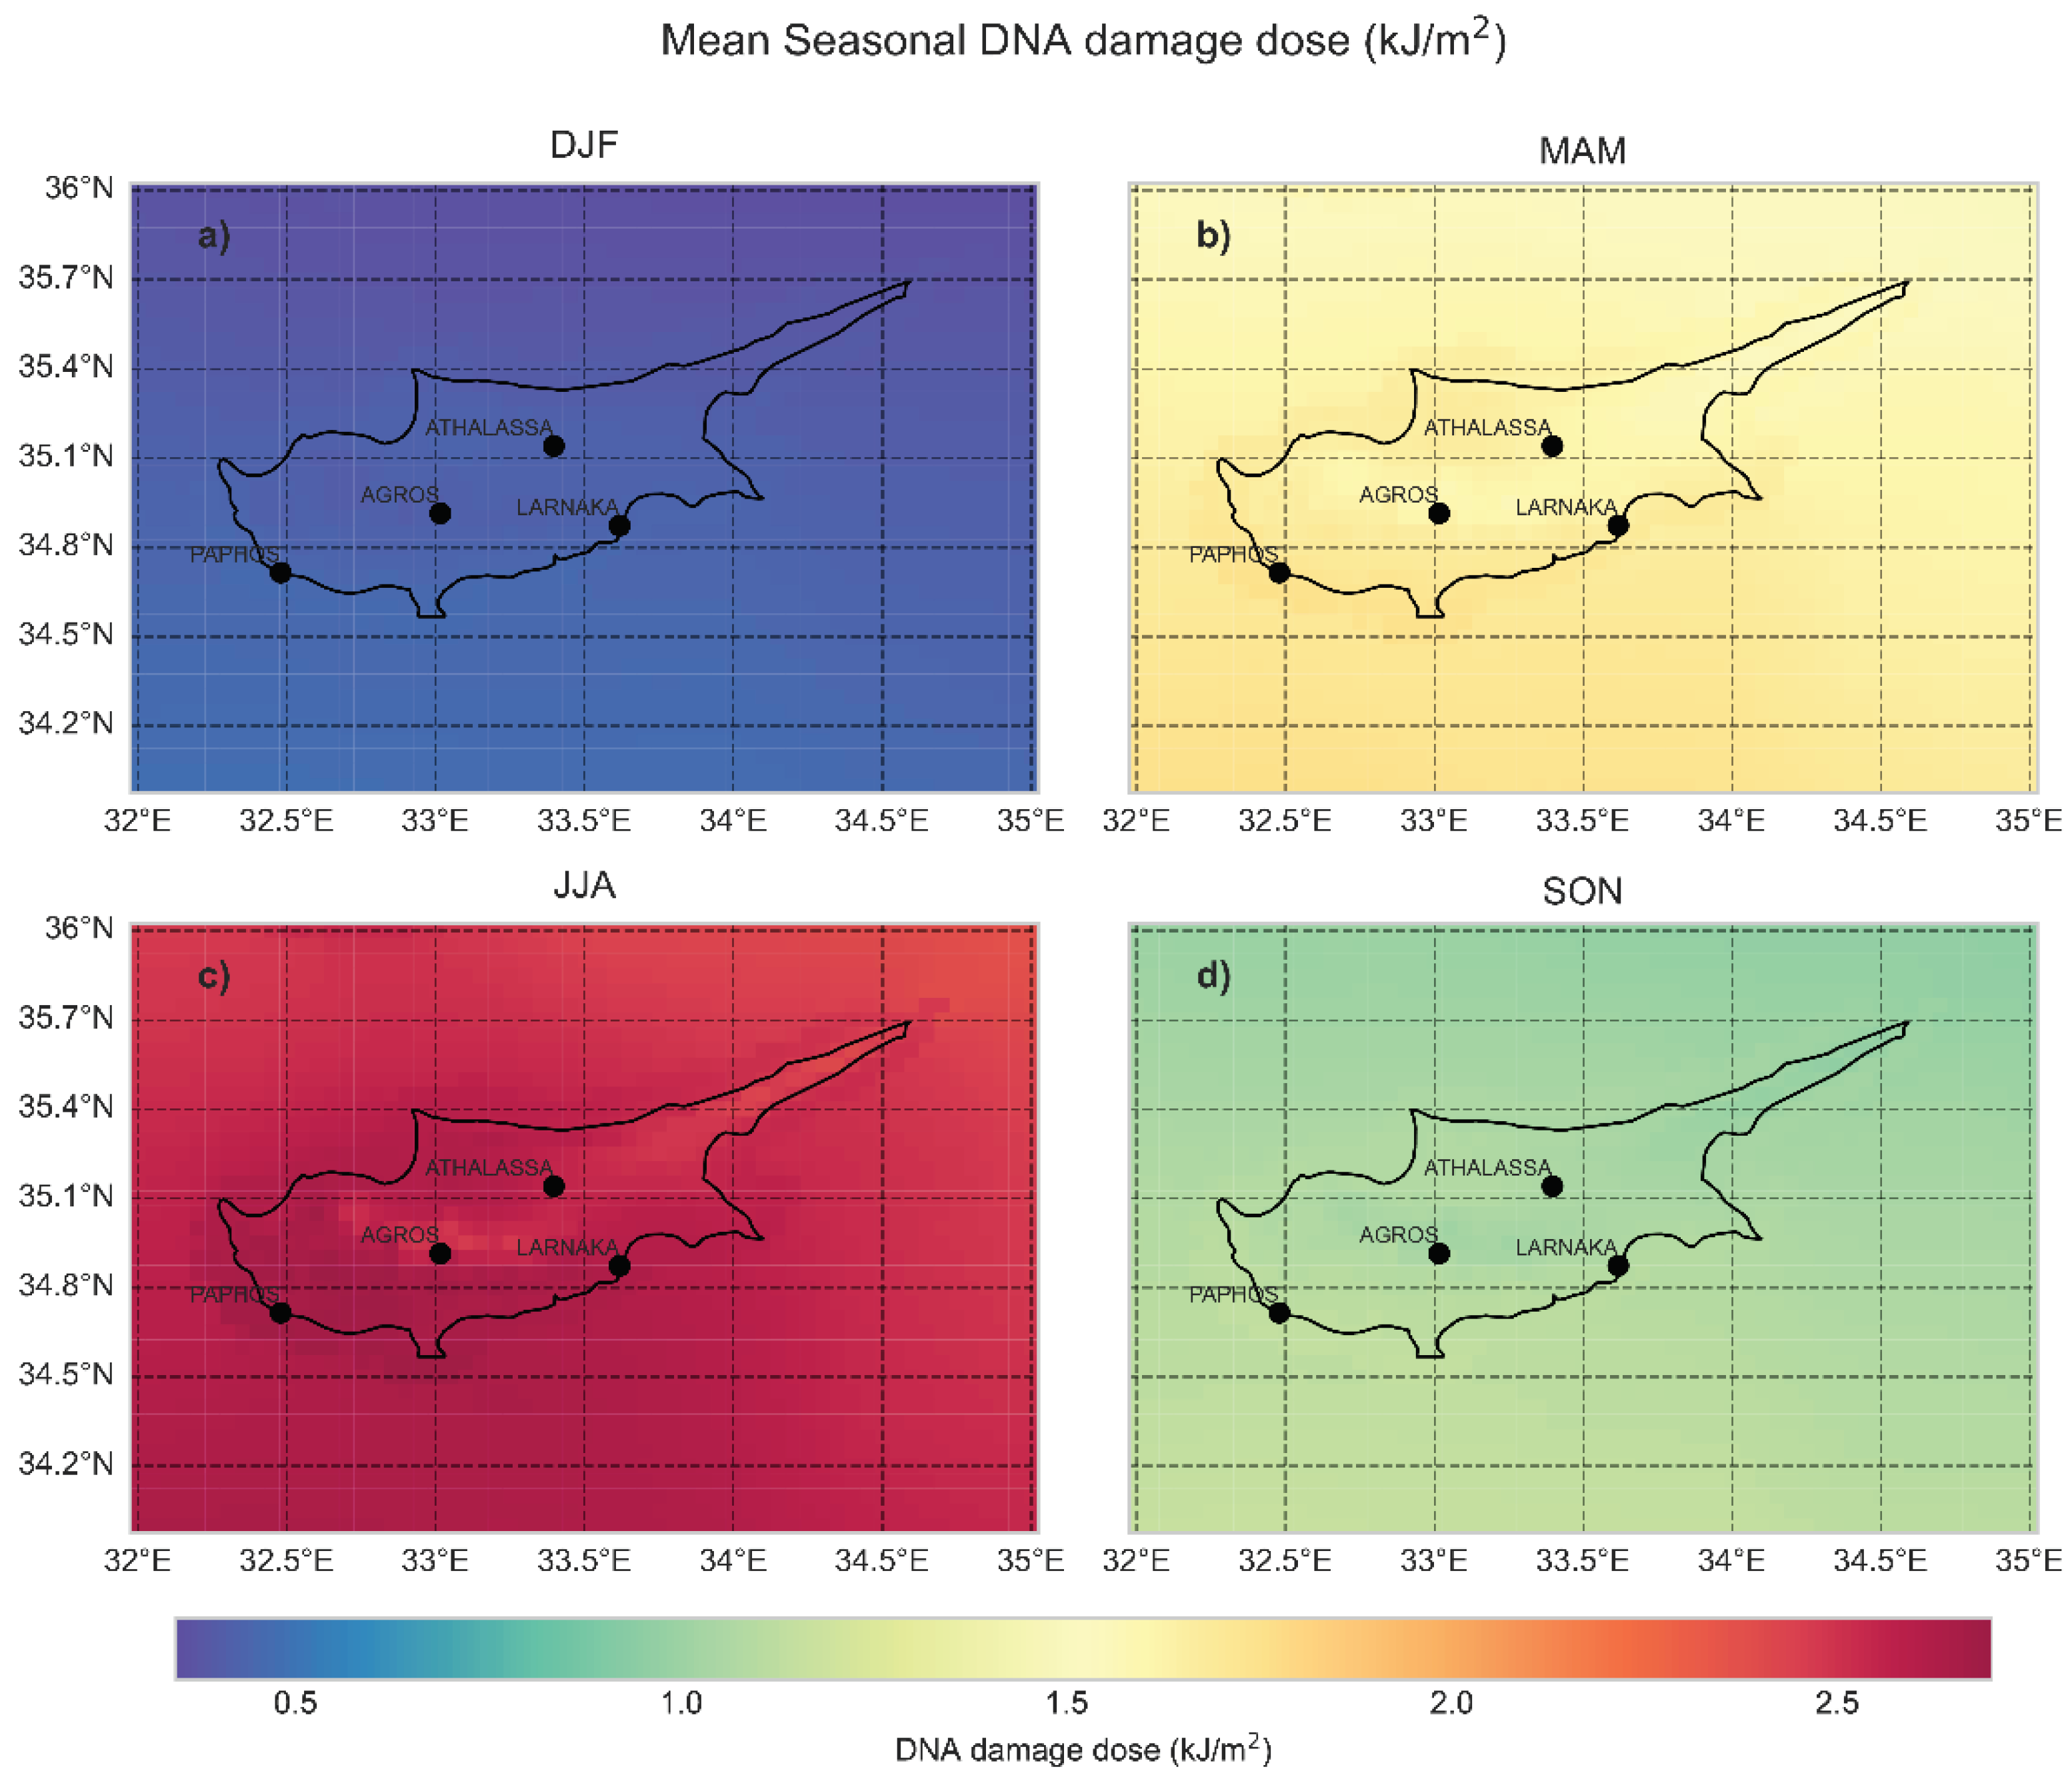
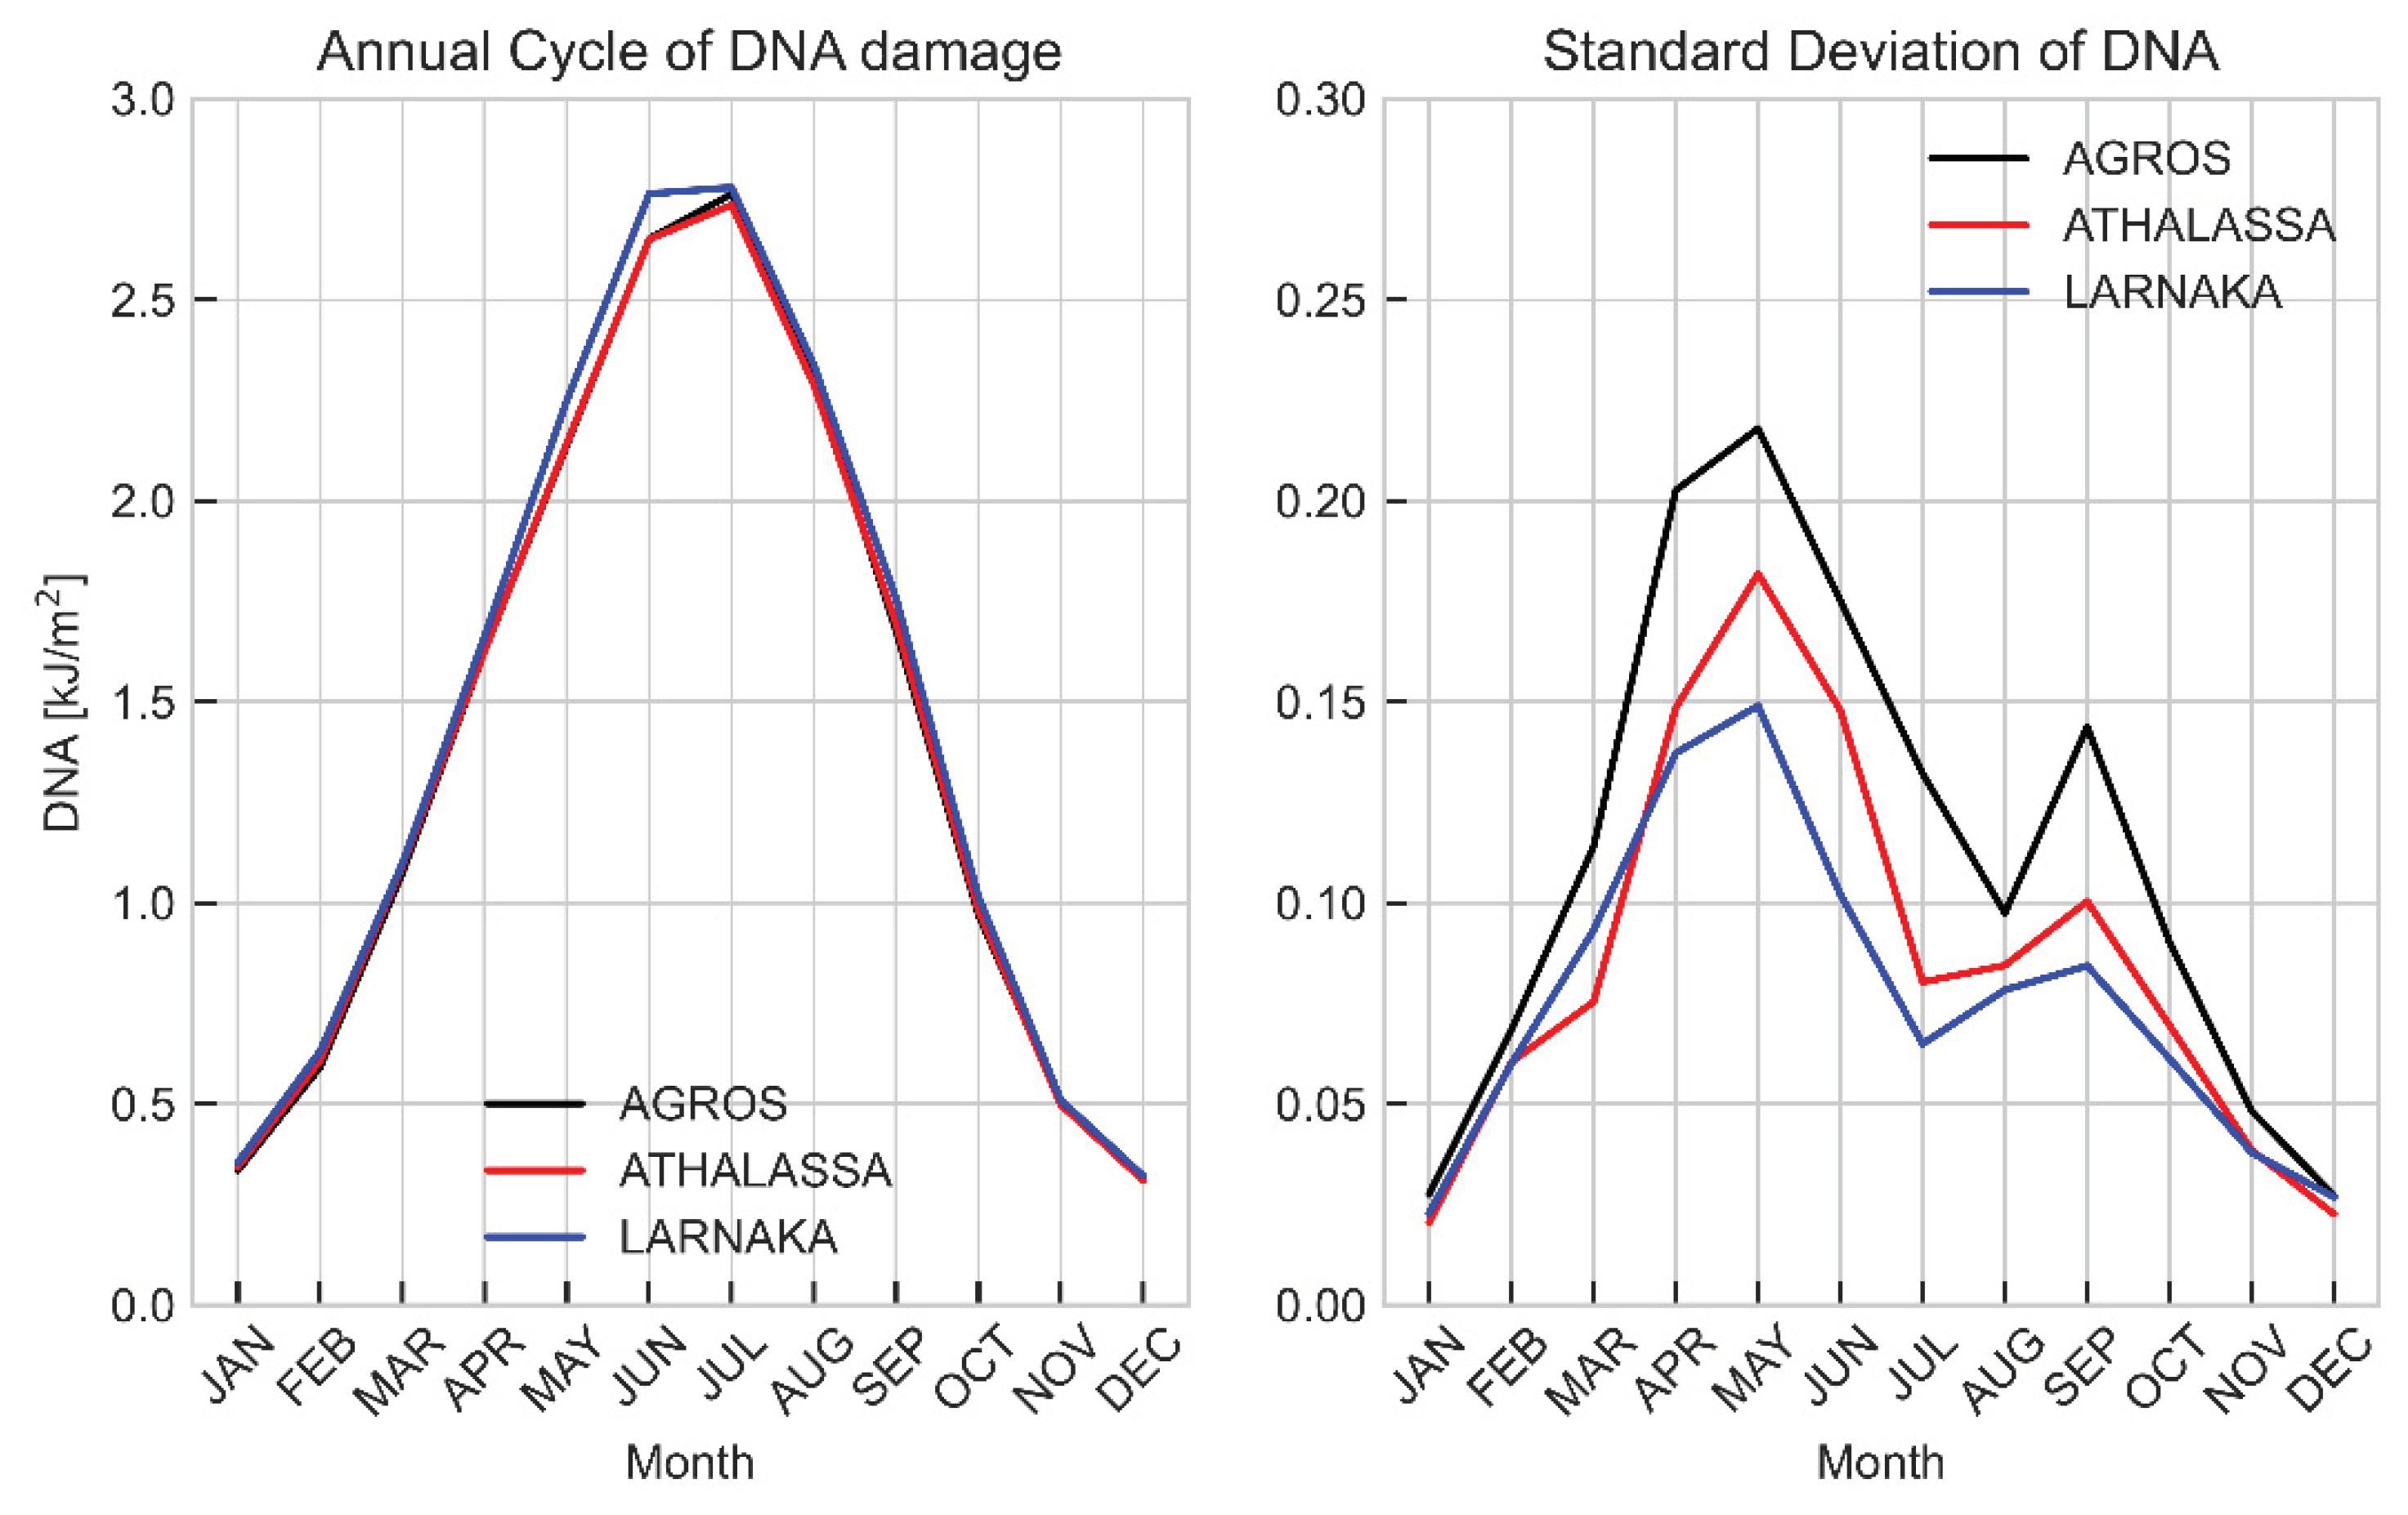
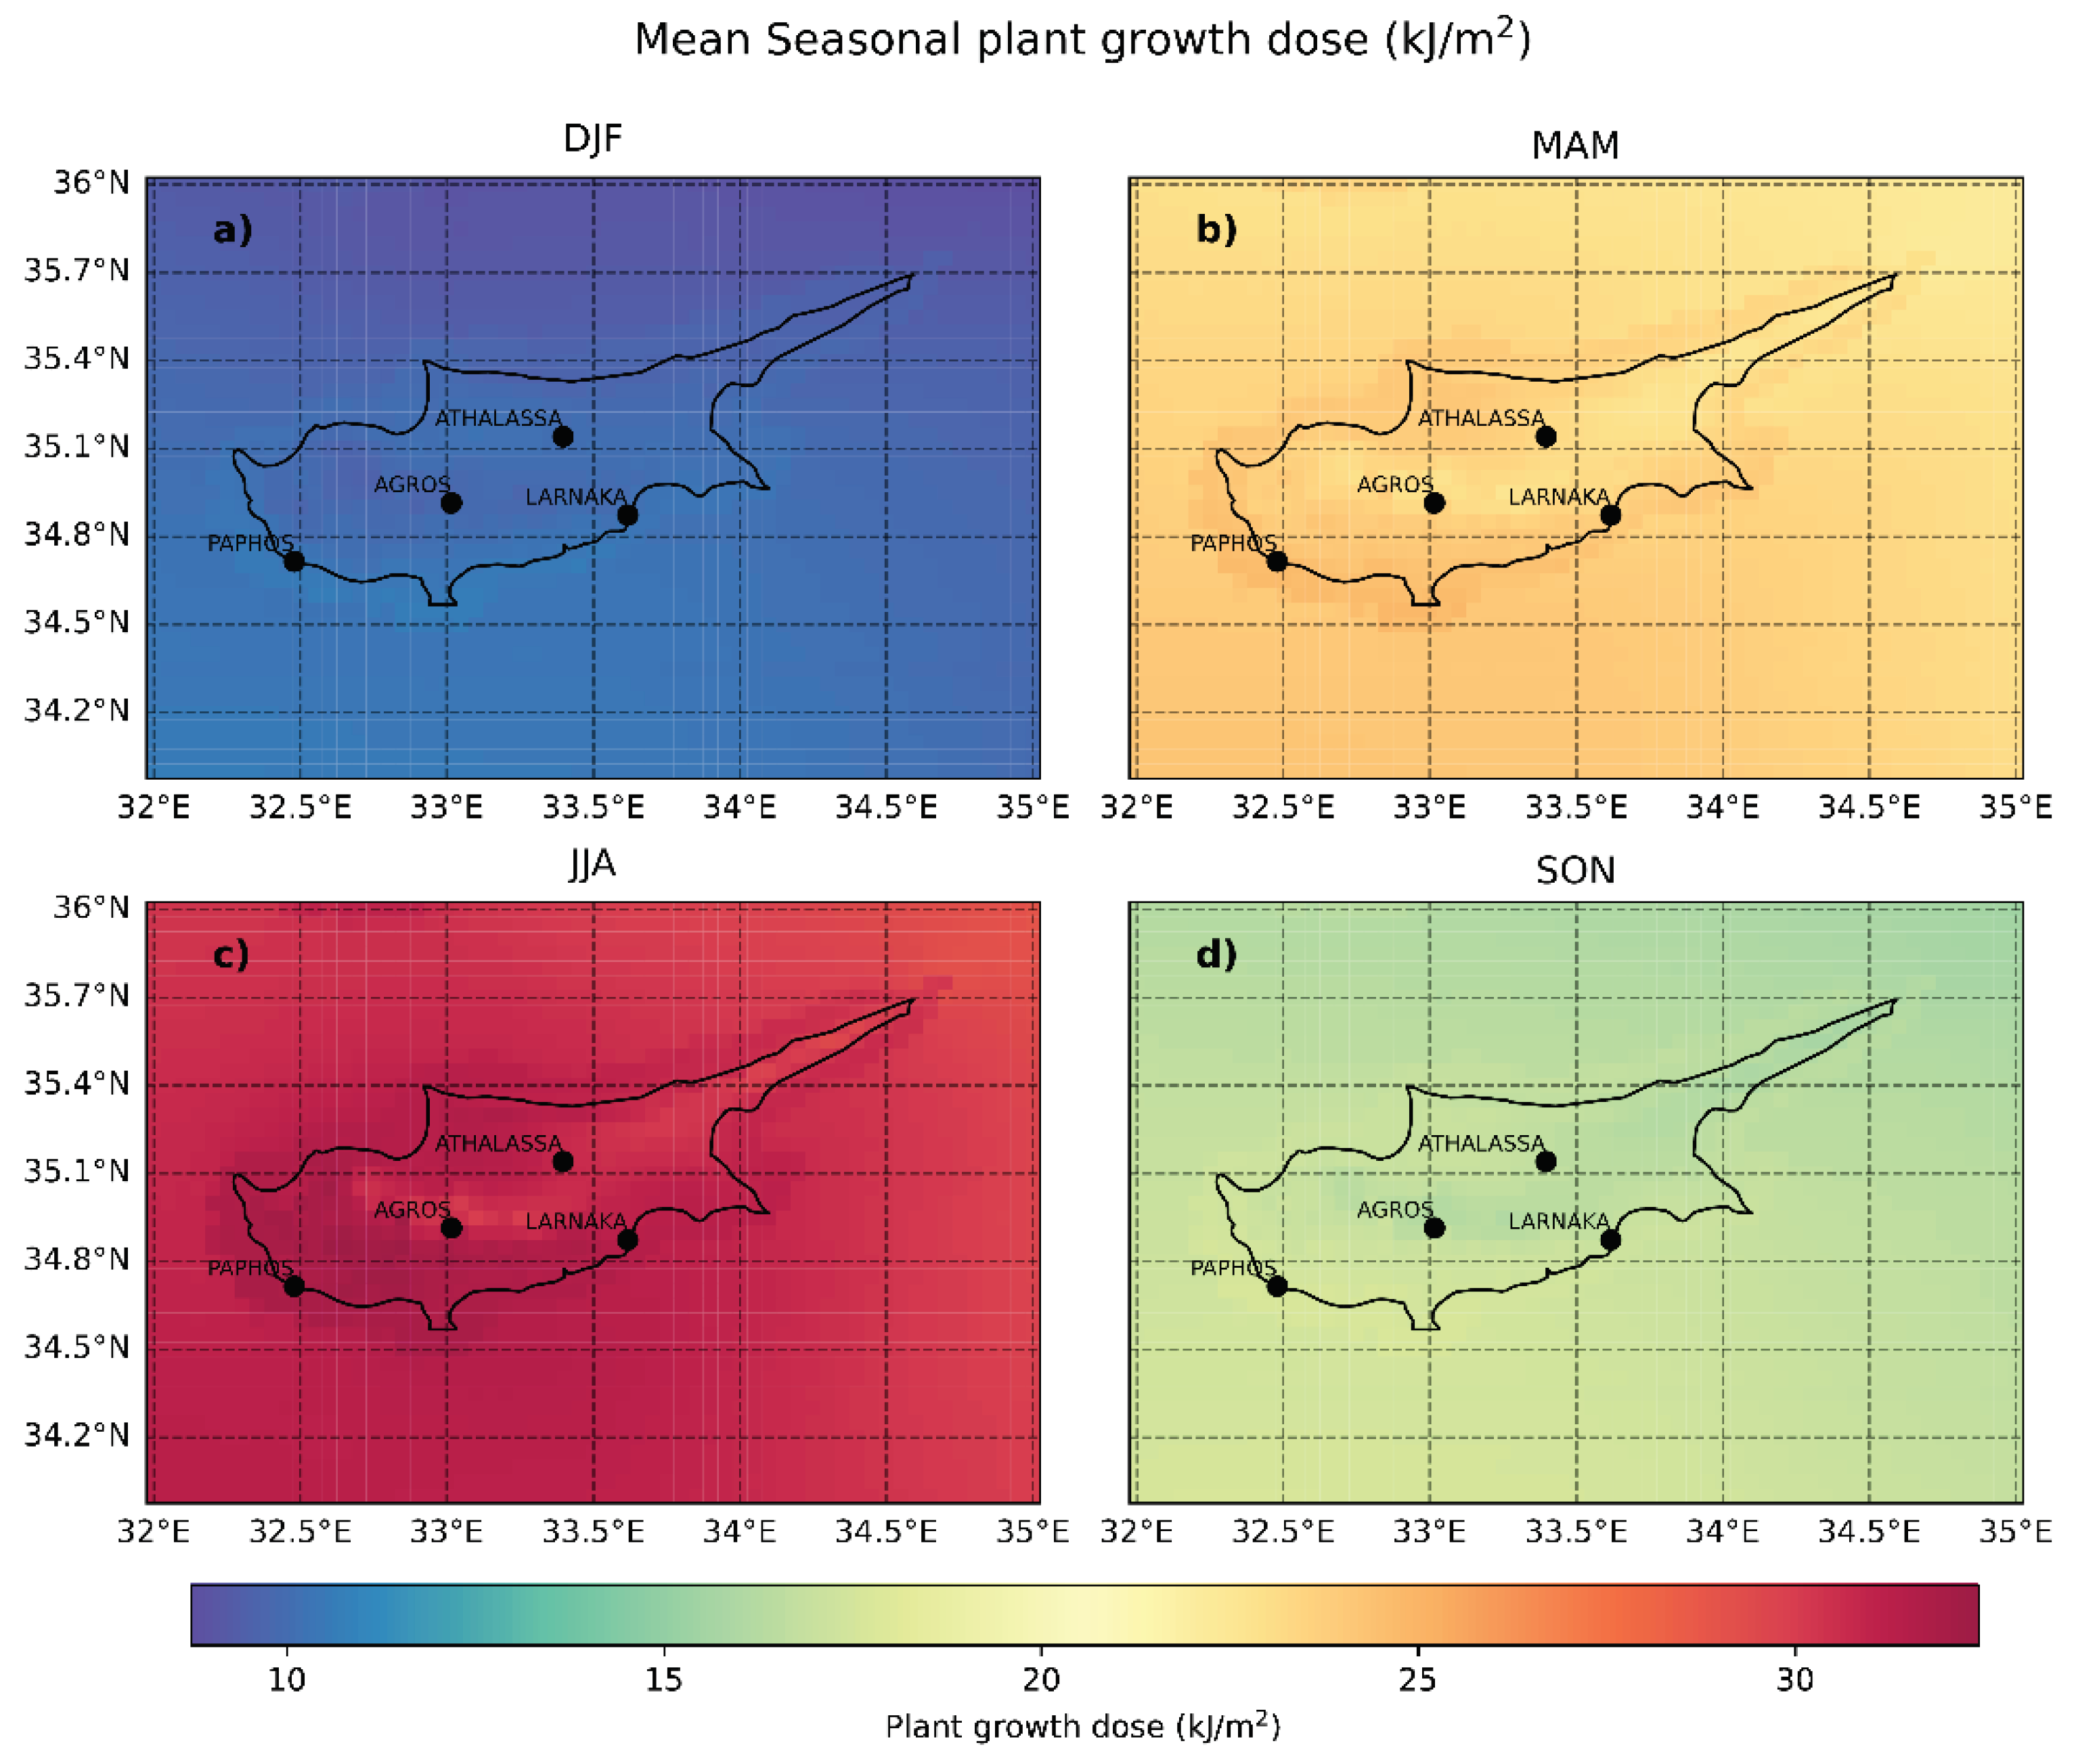
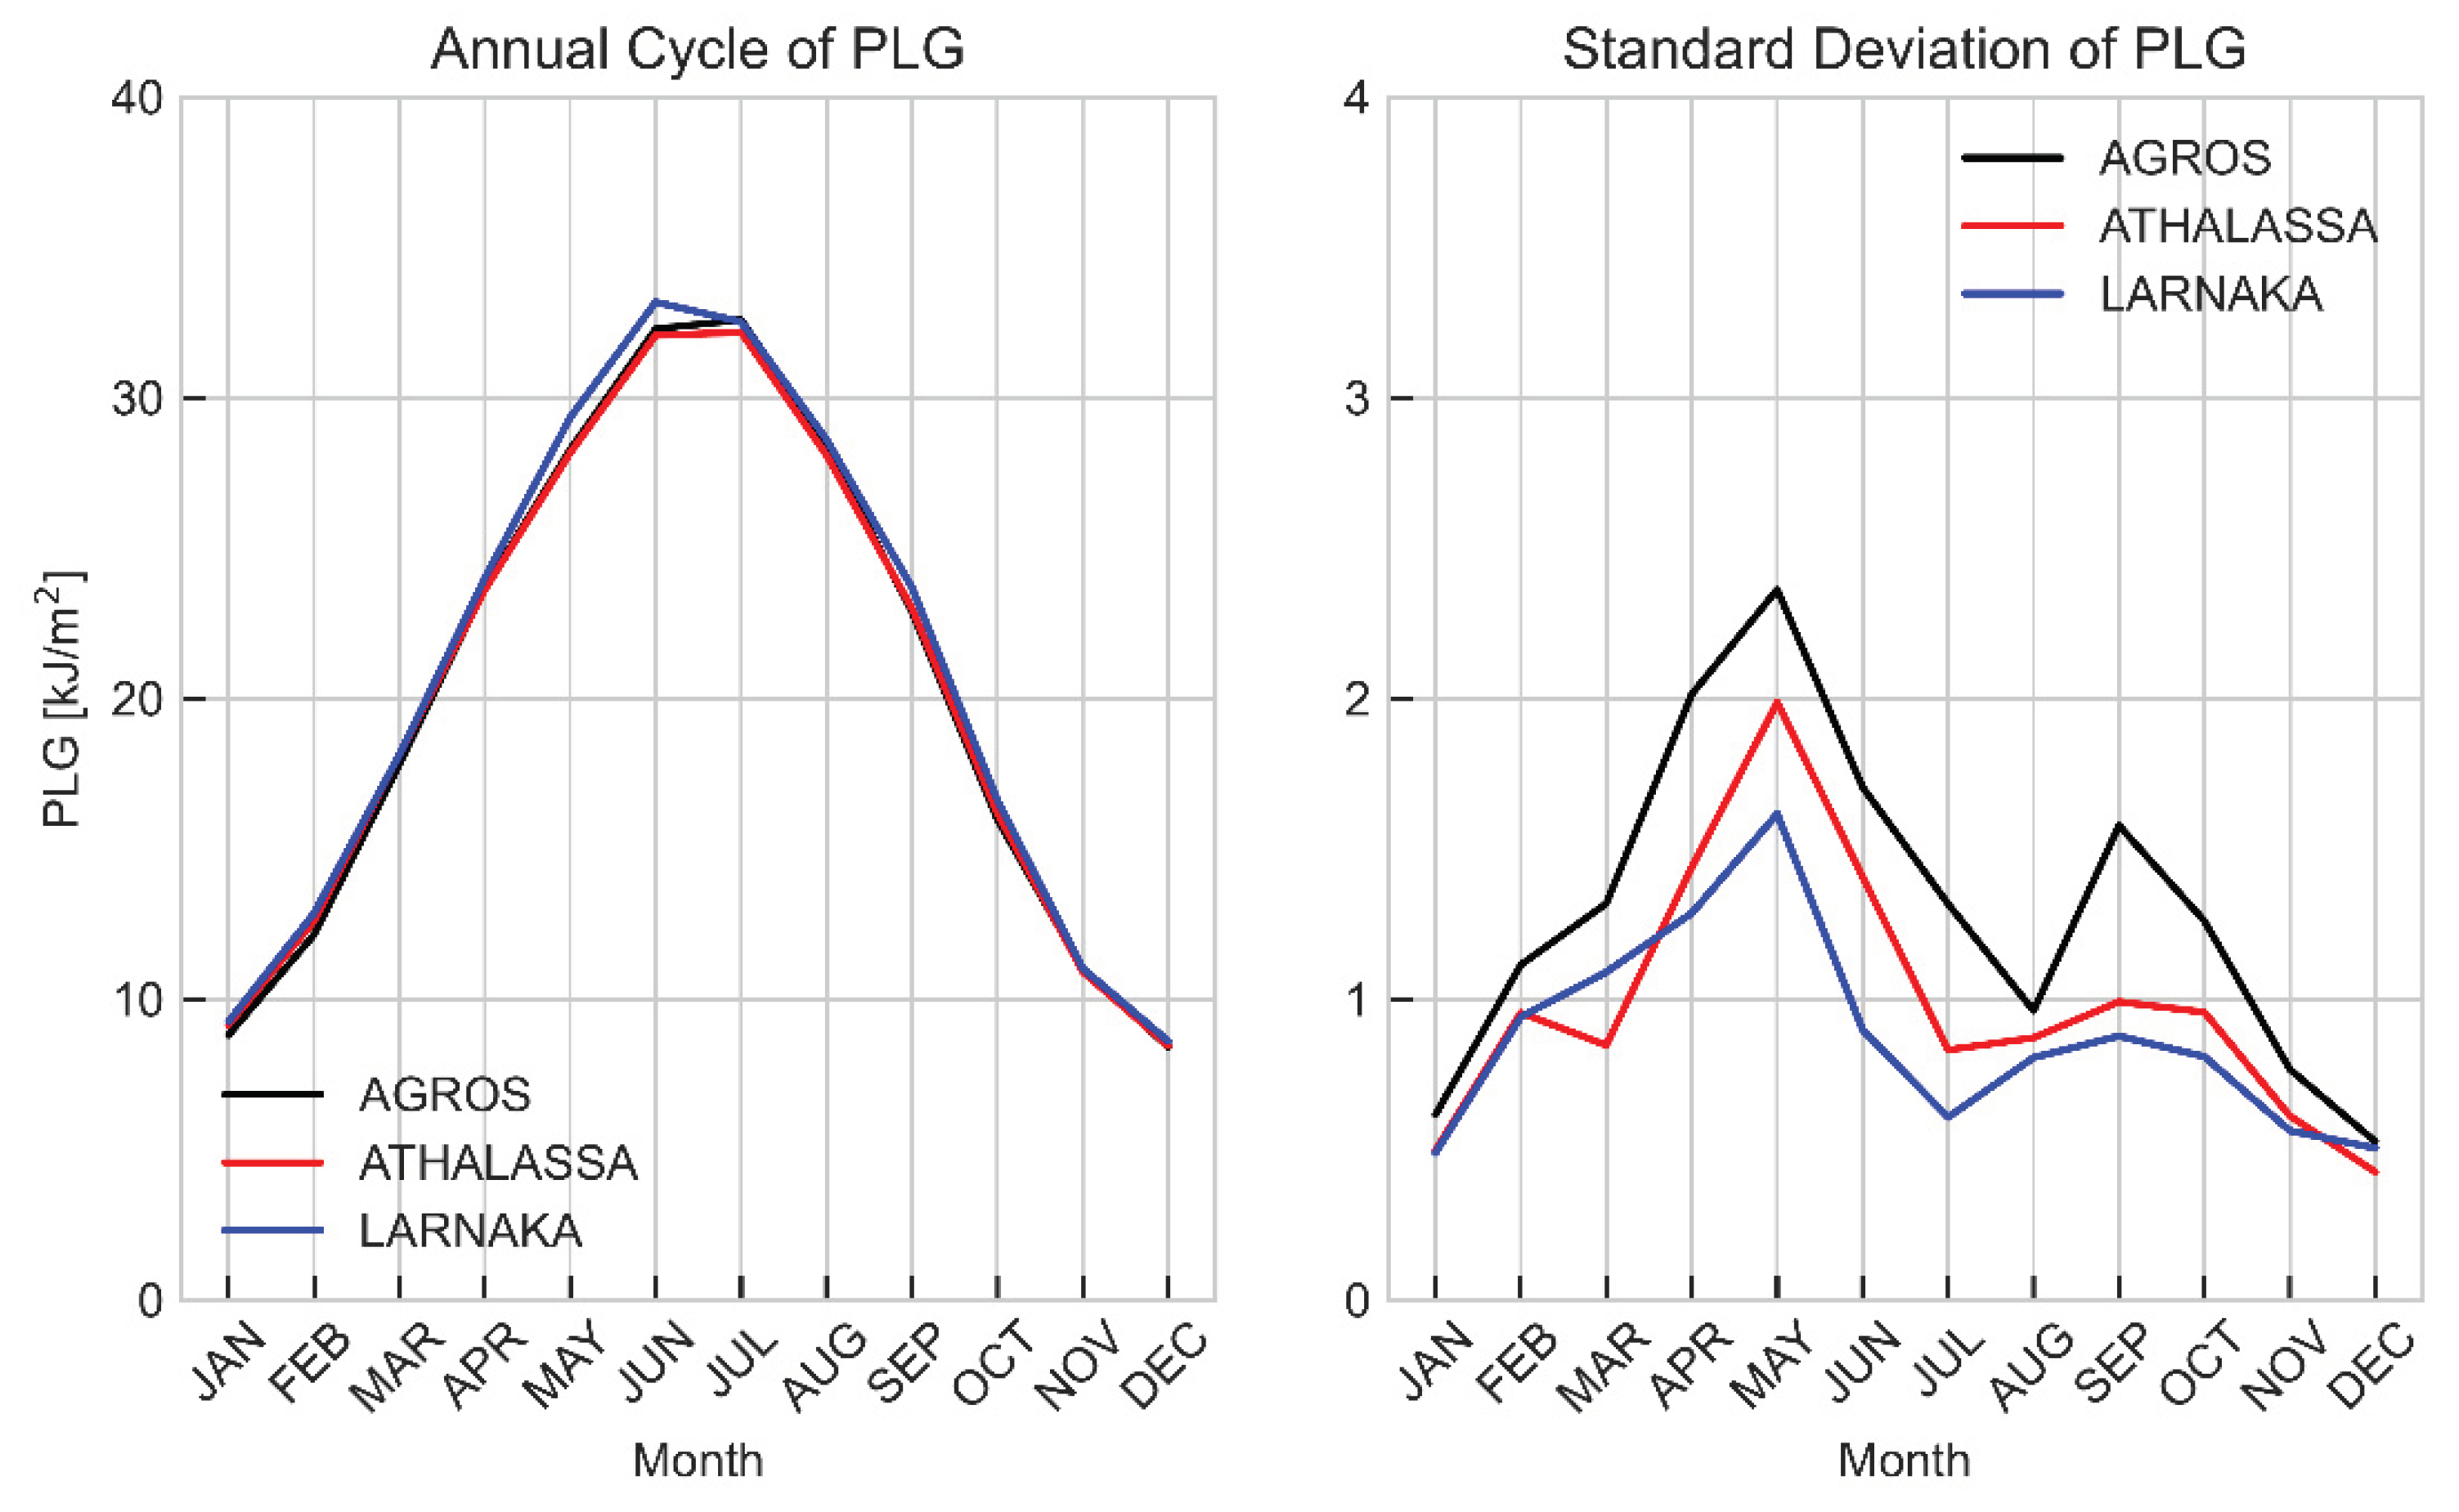
References
- McCree, K.J. Photosynthetically Active Radiation. In Physiological Plant Ecology I: Responses to the Physical Environment; Lange, O.L., Nobel, P.S., O.C.B. and, Z.H., Eds.; Springer Berlin Heidelberg: Berlin, Heidelberg, 1981; pp. 41–55. ISBN 978-3-642-68090-8. [Google Scholar]
- McCree, K.J. Test of Current Definitions of Photosynthetically Active Radiation against Leaf Photosynthesis Data. Agricultural Meteorology 1972, 10, 443–453. [Google Scholar] [CrossRef]
- Alados, I.; Foyo-Moreno, I.; Alados-Arboledas, L. Photosynthetically Active Radiation: Measurements and Modelling. Agric For Meteorol 1996, 78, 121–131. [Google Scholar] [CrossRef]
- Fu, F.X.; Tatters, A.O.; Hutchins, D.A. Global Change and the Future of Harmful Algal Blooms in the Ocean. Mar Ecol Prog Ser 2012, 470, 207–233. [Google Scholar] [CrossRef]
- Lesser, M.P.; Farrell, J.H. Exposure to Solar Radiation Increases Damage to Both Host Tissues and Algal Symbionts of Corals during Thermal Stress. Coral Reefs 2004, 23, 367–377. [Google Scholar] [CrossRef]
- Chukwujindu Nwokolo, S.; Ogbulezie, J.C.; Umunnakwe Obiwulu, A. Impacts of Climate Change and Meteo-Solar Parameters on Photosynthetically Active Radiation Prediction Using Hybrid Machine Learning with Physics-Based Models. Advances in Space Research 2022, 70, 3614–3637. [Google Scholar] [CrossRef]
- Thomas, C.; Wandji Nyamsi, W.; Arola, A.; Pfeifroth, U.; Trentmann, J.; Dorling, S.; Laguarda, A.; Fischer, M.; Aculinin, A. Smart Approaches for Evaluating Photosynthetically Active Radiation at Various Stations Based on MSG Prime Satellite Imagery. Atmosphere 2023, 14, 1259. [Google Scholar] [CrossRef]
- Aguiar, L.J.G.; Fischer, G.R.; Ladle, R.J.; Malhado, A.C.M.; Justino, F.B.; Aguiar, R.G.; da Costa, J.M.N. Modeling the Photosynthetically Active Radiation in South West Amazonia under All Sky Conditions. Theor Appl Climatol 2012, 108, 631–640. [Google Scholar] [CrossRef]
- Zempila, M.-M.; Taylor, M.; Bais, A.; Kazadzis, S. Modeling the Relationship between Photosynthetically Active Radiation and Global Horizontal Irradiance Using Singular Spectrum Analysis. J Quant Spectrosc Radiat Transf 2016, 182, 240–263. [Google Scholar] [CrossRef]
- Sun, Z.; Liang, H.; Liu, J.; Shi, G. Estimation of Photosynthetically Active Radiation Using Solar Radiation in the UV–Visible Spectral Band. Solar Energy 2017, 153, 611–622. [Google Scholar] [CrossRef]
- de Blas, M.; García-Rodríguez, A.; García, I.; Torres, J.L. Validation and Calibration of Models to Estimate Photosynthetically Active Radiation Considering Different Time Scales and Sky Conditions. Advances in Space Research 2022, 70, 1737–1760. [Google Scholar] [CrossRef]
- Thomas, C.; Wandji Nyamsi, W.; Arola, A.; Pfeifroth, U.; Trentmann, J.; Dorling, S.; Laguarda, A.; Fischer, M.; Aculinin, A. Smart Approaches for Evaluating Photosynthetically Active Radiation at Various Stations Based on MSG Prime Satellite Imagery. Atmosphere 2023, 14, 1259. [Google Scholar] [CrossRef]
- Liou, K.-N. An Introduction to Atmospheric Radiation; Elsevier, 2002; Volume 84. [Google Scholar]
- Brasseur, G.; Simon, P.C. Stratospheric Chemical and Thermal Response to Long-Term Variability in Solar UV Irradiance. J Geophys Res 1981, 86, 7343–7362. [Google Scholar] [CrossRef]
- Brasseur, G.; De Rudder, A.; Keating, G.M.; Pitts, M.C. Response of Middle Atmosphere to Short-Term Ultraviolet Variations: 2. Theory. J Geophys Res 1987, 92, 903–914. [Google Scholar] [CrossRef]
- Lucas, R.M.; Yazar, S.; Young, A.R.; Norval, M.; De Gruijl, F.R.; Takizawa, Y.; Rhodes, L.E.; Sinclair, C.A.; Neale, R.E. Human Health in Relation to Exposure to Solar Ultraviolet Radiation under Changing Stratospheric Ozone and Climate. Photochemical and Photobiological Sciences 2019, 18, 641–680. [Google Scholar] [CrossRef]
- Zerefos, C.; Fountoulakis, I.; Eleftheratos, K.; Kazantzidis, A. Long-Term Variability of Human Health-Related Solar Ultraviolet-B Radiation Doses from the 1980s to the End of the 21st Century. Physiol Rev 2023, 103, 1789–1826. [Google Scholar] [CrossRef] [PubMed]
- Diffey, B.L. Solar Ultraviolet Radiation Effects on Biological Systems. Phys Med Biol 1991, 36, 299–328. [Google Scholar] [CrossRef] [PubMed]
- McKinlay, A.F. Reference action spectrum for ultraviolet induced erythema in human skin. CIE-journal 1987, 6, 17–22. [Google Scholar]
- Setlow, R.B. The Wavelengths in Sunlight Effective in Producing Skin Cancer: A Theoretical Analysis. Proc Natl Acad Sci U S A 1974, 71, 3363–3366. [Google Scholar] [CrossRef] [PubMed]
- WHO Health and Environmental Effects of Ultraviolet Radiation:A Scientific Summary of Environmental Health Criteria 160 Ultraviolet Radiation ((WHO/EHG/95.16).
- Taylor, H.R.; West, S.K.; Rosenthal, F.S.; Muñoz, B.; Newland, H.S.; Abbey, H.; Emmett, E.A. Effect of Ultraviolet Radiation on Cataract Formation. New England Journal of Medicine 1988, 319, 1429–1433. [Google Scholar] [CrossRef]
- Jablonski, N.G.; Chaplin, G. The Evolution of Human Skin Coloration. J Hum Evol 2000, 39, 57–106. [Google Scholar] [CrossRef]
- Juzeniene, A.; Brekke, P.; Dahlback, A.; Andersson-Engels, S.; Reichrath, J.; Moan, K.; Holick, M.F.; Grant, W.B.; Moan, J. Solar Radiation and Human Health. Reports on Progress in Physics 2011, 74, 066701. [Google Scholar] [CrossRef]
- Holick, M.F. High Prevalence of Vitamin D Inadequacy and Implications for Health. Mayo Clin Proc 2006, 81. [Google Scholar] [CrossRef]
- Juzeniene, A.; Moan, J. Beneficial Effects of UV Radiation Other than via Vitamin D Production. Dermatoendocrinol 2012, 4. [Google Scholar] [CrossRef]
- Vanicek, K.; Frei, T. UV- Index for the Public; Publication of the European Communities: Brussels, Belgium, 2005. [Google Scholar]
- CIE Action Spectrum for the Production of Previtamin D3 in Human Skin (CIE Publication 174, ISBN 3 901 906 50 9); 2006.
- Kazantzidis, A.; Bais, A.F.; Zempila, M.M.; Kazadzis, S.; Den Outer, P.N.; Koskela, T.; Slaper, H. Calculations of the Human Vitamin D Exposure from UV Spectral Measurements at Three European Stations. Photochemical and Photobiological Sciences 2009, 8, 45–51. [Google Scholar] [CrossRef]
- Lucas, R.M.; Yazar, S.; Young, A.R.; Norval, M.; De Gruijl, F.R.; Takizawa, Y.; Rhodes, L.E.; Sinclair, C.A.; Neale, R.E. Human Health in Relation to Exposure to Solar Ultraviolet Radiation under Changing Stratospheric Ozone and Climate. Photochemical and Photobiological Sciences 2019, 18, 641–680. [Google Scholar] [CrossRef]
- Webb, A.R.; Kazantzidis, A.; Kift, R.C.; Farrar, M.D.; Wilkinson, J.; Rhodes, L.E. Colour Counts: Sunlight and Skin Type as Drivers of Vitamin D Deficiency at UK Latitudes. Nutrients 2018, 10, 457. [Google Scholar] [CrossRef]
- Schreiner, M.; Mewis, I.; Huyskens-Keil, S.; Jansen, M.A.K.; Zrenner, R.; Winkler, J.B.; O’Brien, N.; Krumbein, A. UV-B-Induced Secondary Plant Metabolites - Potential Benefits for Plant and Human Health. CRC Crit Rev Plant Sci 2012, 31, 229–240. [Google Scholar] [CrossRef]
- Kataria, S.; Jajoo, A.; Guruprasad, K.N. Impact of Increasing Ultraviolet-B (UV-B) Radiation on Photosynthetic Processes. J Photochem Photobiol B 2014, 137, 55–66. [Google Scholar] [CrossRef]
- Frohnmeyer, H.; Staiger, D. Ultraviolet-B Radiation-Mediated Responses in Plants. Balancing Damage and Protection. Balancing Damage and Protection. Plant Physiol 2003, 133. [Google Scholar] [CrossRef]
- Zerefos, C.S.; Bais, A.F.; Meleti, C.; Ziomas, I.C. A Note on the Recent Increase of Solar UV-B Radiation over Northern Middle Latitudes. Geophys Res Lett 1995, 22, 1245–1247. [Google Scholar] [CrossRef]
- Kerr, J.B.; McElroy, C.T. Evidence for Large Upward Trends of Ultraviolet-B Radiation Linked to Ozone Depletion. Science (1979) 1993, 262, 1032–1034. [Google Scholar] [CrossRef]
- Lubin, D.; Jensen, E.H. Effects of Clouds and Stratospheric Ozone Depletion on Ultraviolet Radiation Trends. Nature 1995, 377, 710–713. [Google Scholar] [CrossRef]
- Madronich, S.; McKenzie, R.L.; Björn, L.O.; Caldwell, M.M. Changes in Biologically Active Ultraviolet Radiation Reaching the Earth’s Surface. J Photochem Photobiol B 1998, 46, 5–19. [Google Scholar] [CrossRef]
- Madronich, S. Implications of Recent Total Atmospheric Ozone Measurements for Biologically Active Ultraviolet Radiation Reaching the Earth’s Surface. Geophys Res Lett 1992, 19, 37–40. [Google Scholar] [CrossRef]
- Godin-Beekmann, S.; Azouz, N.; Sofieva, V.F.; Hubert, D.; Petropavlovskikh, I.; Effertz, P.; Ancellet, G.; Degenstein, D.A.; Zawada, D.; Froidevaux, L.; et al. Updated Trends of the Stratospheric Ozone Vertical Distribution in the 60°S-60°N Latitude Range Based on the LOTUS Regression Model. Atmos Chem Phys 2022, 22, 11657–11673. [Google Scholar] [CrossRef]
- Fountoulakis, I.; Diémoz, H.; Siani, A.M.; Di Sarra, A.; Meloni, D.; Sferlazzo, D.M. Variability and Trends in Surface Solar Spectral Ultraviolet Irradiance in Italy: On the Influence of Geopotential Height and Lower-Stratospheric Ozone. Atmos Chem Phys 2021, 21, 18689–18705. [Google Scholar] [CrossRef]
- Fountoulakis, I.; Bais, A.F.; Fragkos, K.; Meleti, C.; Tourpali, K.; Maria Zempila, M. Short- and Long-Term Variability of Spectral Solar UV Irradiance at Thessaloniki, Greece: Effects of Changes in Aerosols, Total Ozone and Clouds. Atmos Chem Phys 2016, 16, 2493–2505. [Google Scholar] [CrossRef]
- Fountoulakis, I.; Diémoz, H.; Siani, A.M.; Laschewski, G.; Filippa, G.; Arola, A.; Bais, A.F.; De Backer, H.; Lakkala, K.; Webb, A.R.; et al. Solar UV Irradiance in a Changing Climate: Trends in Europe and the Significance of Spectral Monitoring in Italy. Environments - MDPI 2020, 7, 1. [Google Scholar] [CrossRef]
- Meleti, C.; Bais, A.F.; Kouremeti, N.; Garane, K.; Kazadzis, S.; Zerefos, C. Factors Affecting Solar Ultraviolet Irradiance Measured since 1990 at Thessaloniki, Greece. Int J Remote Sens 2009, 30, 4167–4179. [Google Scholar] [CrossRef]
- Zerefos, C.S.; Tourpali, K.; Eleftheratos, K.; Kazadzis, S.; Meleti, C.; Feister, U.; Koskela, T.; Heikkilä, A. Evidence of a Possible Turning Point in Solar UV-B over Canada, Europe and Japan. Atmos Chem Phys 2012, 12, 2469–2477. [Google Scholar] [CrossRef]
- De Bock, V.; De Backer, H.; Van Malderen, R.; Mangold, A.; Delcloo, A. Relations between Erythemal UV Dose, Global Solar Radiation, Total Ozone Column and Aerosol Optical Depth at Uccle, Belgium. Atmos Chem Phys 2014, 14, 12251–12270. [Google Scholar] [CrossRef]
- Kambezidis, H.D. The Solar Radiation Climate of Athens: Variations and Tendencies in the Period 1992–2017, the Brightening Era. Solar Energy 2018, 173, 328–347. [Google Scholar] [CrossRef]
- Wild, M.; Wacker, S.; Yang, S.; Sanchez-Lorenzo, A. Evidence for Clear-Sky Dimming and Brightening in Central Europe. Geophys Res Lett 2021, 48, e2020GL092216. [Google Scholar] [CrossRef]
- Manara, V.; Bassi, M.; Brunetti, M.; Cagnazzi, B.; Maugeri, M. 1990–2016 Surface Solar Radiation Variability and Trend over the Piedmont Region (Northwest Italy). Theor Appl Climatol 2019, 136, 849–862. [Google Scholar] [CrossRef]
- Papachristopoulou, K.; Fountoulakis, I.; Gkikas, A.; Kosmopoulos, P.G.; Nastos, P.T.; Hatzaki, M.; Kazadzis, S. 15-Year Analysis of Direct Effects of Total and Dust Aerosols in Solar Radiation/Energy over the Mediterranean Basin. Remote Sens 2022, 14, 1535. [Google Scholar] [CrossRef]
- Kazadzis, S.; Founda, D.; Psiloglou, B.E.; Kambezidis, H.; Mihalopoulos, N.; Sanchez-Lorenzo, A.; Meleti, C.; Raptis, P.I.; Pierros, F.; Nabat, P. Long-Term Series and Trends in Surface Solar Radiation in Athens, Greece. Atmos Chem Phys 2018, 18, 2395–2411. [Google Scholar] [CrossRef]
- Cos, J.; Doblas-Reyes, F.; Jury, M.; Marcos, R.; Bretonnière, P.A.; Samsó, M. The Mediterranean Climate Change Hotspot in the CMIP5 and CMIP6 Projections. Earth System Dynamics 2022, 13, 321–340. [Google Scholar] [CrossRef]
- Tuel, A.; Eltahir, E.A.B. Why Is the Mediterranean a Climate Change Hot Spot? J Clim 2020, 33, 5829–5843. [Google Scholar] [CrossRef]
- Fountoulakis, I.; Kosmopoulos, P.; Papachristopoulou, K.; Raptis, I.-P.; Mamouri, R.-E.; Nisantzi, A.; Gkikas, A.; Witthuhn, J.; Bley, S.; Moustaka, A.; et al. Effects of Aerosols and Clouds on the Levels of Surface Solar Radiation and Solar Energy in Cyprus. Remote Sens 2021, 13, 2319. [Google Scholar] [CrossRef]
- Jacovides, C.P.; Tymvios, F.S.; Asimakopoulos, D.N.; Theofilou, K.M.; Pashiardes, S. Global Photosynthetically Active Radiation and Its Relationship with Global Solar Radiation in the Eastern Mediterranean Basin. Theor Appl Climatol 2003, 74, 227–233. [Google Scholar] [CrossRef]
- Kalogirou, S.A.; Pashiardis, S.; Pashiardi, A. Statistical Analysis and Inter-Comparison of Erythemal Solar Radiation for Athalassa and Larnaca, Cyprus. Renew Energy 2017, 111, 580–597. [Google Scholar] [CrossRef]
- Kalogirou, S.A.; Pashiardis, S.; Pashiardi, A. Statistical Analysis and Inter-Comparison of the Global Solar Radiation at Two Sites in Cyprus. Renew Energy 2017, 101, 1102–1123. [Google Scholar] [CrossRef]
- Pashiardis, S.; Kalogirou, S.A.; Pelengaris, A. Statistical Analysis for the Characterization of Solar Energy Utilization and Inter-Comparison of Solar Radiation at Two Sites in Cyprus. Appl Energy 2017, 190, 1138–1158. [Google Scholar] [CrossRef]
- Webb, A.R.; Slaper, H.; Koepke, P.; Schmalwieser, A.W. Know Your Standard: Clarifying the CIE Erythema Action Spectrum. Photochem Photobiol 2011, 87, 483–486. [Google Scholar] [CrossRef]
- Setlow, R.B. The Wavelengths in Sunlight Effective in Producing Skin Cancer: A Theoretical Analysis. Proc Natl Acad Sci U S A 1974, 71, 3363–3366. [Google Scholar] [CrossRef]
- Bernhard, G.; Mayer, B.; Seckmeyer, G.; Moise, A. Measurements of Spectral Solar UV Irradiance in Tropical Australia. Journal of Geophysical Research Atmospheres 1997, 102, 8719–8730. [Google Scholar] [CrossRef]
- Caldwell, M.M. Plant Response to Solar Ultraviolet Radiation. In Physiological Plant Ecology I; 1981.
- Caldwell, M.M. Plant Life and Ultraviolet Radiation: Some Perspective in the History of the Earth’s UV Climate. Bioscience 1979, 29, 520–525. [Google Scholar] [CrossRef]
- Emde, C.; Buras-Schnell, R.; Kylling, A.; Mayer, B.; Gasteiger, J.; Hamann, U.; Kylling, J.; Richter, B.; Pause, C.; Dowling, T.; et al. The LibRadtran Software Package for Radiative Transfer Calculations (Version 2.0.1). Geosci Model Dev 2016, 9, 1647–1672. [Google Scholar] [CrossRef]
- Mayer, B.; Kylling, A. Technical Note: The LibRadtran Software Package for Radiative Transfer Calculations - Description and Examples of Use. Atmos Chem Phys 2005, 5, 1855–1877. [Google Scholar] [CrossRef]
- Buras, R.; Dowling, T.; Emde, C. New Secondary-Scattering Correction in DISORT with Increased Efficiency for Forward Scattering. J Quant Spectrosc Radiat Transf 2011, 112, 2028–2034. [Google Scholar] [CrossRef]
- Gasteiger, J.; Emde, C.; Mayer, B.; Buras, R.; Buehler, S.A.; Lemke, O. Representative Wavelengths Absorption Parameterization Applied to Satellite Channels and Spectral Bands. J Quant Spectrosc Radiat Transf 2014, 148, 99–115. [Google Scholar] [CrossRef]
- Anderson, G. and C.S. and K.F. and C.J. and S.E. AFGL (Air Force Geophysical Laboratory) Atmospheric Constituent Profiles (0. 120km). Environmental Research Papers; 1986.
- Kurucz, R.L. Synthetic Infrared Spectra. Symposium - International Astronomical Union 1994, 154, 523–531. [Google Scholar] [CrossRef]
- Shettle, E.P. Models of Aerosols, Clouds and Precipitation for Atmospheric Propagation Studies. AGARD Conf. 1989. [Google Scholar]
- Zempila, M.M.; Van Geffen, J.H.G.M.; Taylor, M.; Fountoulakis, I.; Koukouli, M.E.; Van Weele, M.; Van Der A, R.J.; Bais, A.; Meleti, C.; Balis, D. TEMIS UV Product Validation Using NILU-UV Ground-Based Measurements in Thessaloniki, Greece. Atmos Chem Phys 2017, 17, 7157–7174. [Google Scholar] [CrossRef]
- Qu, Z.; Oumbe, A.; Blanc, P.; Espinar, B.; Gesell, G.; Gschwind, B.; Klüser, L.; Lefèvre, M.; Saboret, L.; Schroedter-Homscheidt, M.; et al. Fast Radiative Transfer Parameterisation for Assessing the Surface Solar Irradiance: The Heliosat-4 Method. Meteorologische Zeitschrift 2017, 26, 33–57. [Google Scholar] [CrossRef]
- Lefèvre, M.; Oumbe, A.; Blanc, P.; Espinar, B.; Gschwind, B.; Qu, Z.; Wald, L.; Schroedter-Homscheidt, M.; Hoyer-Klick, C.; Arola, A.; et al. McClear: A New Model Estimating Downwelling Solar Radiation at Ground Level in Clear-Sky Conditions. Atmos Meas Tech 2013, 6, 2403–2418. [Google Scholar] [CrossRef]
- Staiger, H.; Den Outer, P.N.; Bais, A.F.; Feister, U.; Johnsen, B.; Vuilleumier, L. Hourly Resolved Cloud Modification Factors in the Ultraviolet. Atmos Chem Phys 2008, 8, 2493–2508. [Google Scholar] [CrossRef]
- Inness, A.; Ades, M.; Agustí-Panareda, A.; Barr, J.; Benedictow, A.; Blechschmidt, A.M.; Jose Dominguez, J.; Engelen, R.; Eskes, H.; Flemming, J.; et al. The CAMS Reanalysis of Atmospheric Composition. Atmos Chem Phys 2019, 19, 3515–3556. [Google Scholar] [CrossRef]
- Kinne, S. The MACv2 Aerosol Climatology. Tellus B Chem Phys Meteorol 2019, 71, 1–21. [Google Scholar] [CrossRef]
- Veefkind, J.P.; de Haan, J.F.; Brinksma, E.J.; Kroon, M.; Levelt, P.F. Total Ozone from the Ozone Monitoring Instrument (OMI) Using the DOAS Technique. IEEE Transactions on Geoscience and Remote Sensing 2006, 44, 1239–1244. [Google Scholar] [CrossRef]
- McCree, K.J. The Action Spectrum, Absorptance and Quantum Yield of Photosynthesis in Crop Plants. Agricultural Meteorology 1971, 9, 191–216. [Google Scholar] [CrossRef]
- Thimijan, R.W.; Heins, R.D. Photometric, Radiometric, and Quantum Light Units of Measure: A Review of Procedures for Interconversion. HortScience 1983, 18, 818–822. [Google Scholar] [CrossRef]
- Korczynski, P.C.; Logan, J.; Faust, J.E. Mapping Monthly Distribution of Daily Light Integrals across the Contiguous United States. Horttechnology 2002, 12. [Google Scholar] [CrossRef]
- Pfeifroth, U.; Kothe, S.; Drücke, J.; Trentmann, J.; Schröder, M.; Selbach, N.; Hollmann, R. Surface Radiation Data Set - Heliosat (SARAH) - Edition 3 2023.
- Mueller, R.; Behrendt, T.; Hammer, A.; Kemper, A. A New Algorithm for the Satellite-Based Retrieval of Solar Surface Irradiance in Spectral Bands. Remote Sens 2012, 4, 622–647. [Google Scholar] [CrossRef]
- Van Geffen, J.; Van Weele, M.; Allaart, M.; Van der A, R. Dataset: TEMIS UV Index and UV Dose Operational Data Products, Version 2. 2017.
- Greene, W.W.H. Econometric Analysis, 7th ed; 2012; Volume 97.
- Nisantzi, A.; Mamouri, R.E.; Ansmann, A.; Schuster, G.L.; Hadjimitsis, D.G. Middle East versus Saharan Dust Extinction-to-Backscatter Ratios. Atmos Chem Phys 2015, 15, 7071–7084. [Google Scholar] [CrossRef]
- Achilleos, S.; Mouzourides, P.; Kalivitis, N.; Katra, I.; Kloog, I.; Kouis, P.; Middleton, N.; Mihalopoulos, N.; Neophytou, M.; Panayiotou, A.; et al. Spatio-Temporal Variability of Desert Dust Storms in Eastern Mediterranean (Crete, Cyprus, Israel) between 2006 and 2017 Using a Uniform Methodology. Science of the Total Environment 2020, 714, 136693. [Google Scholar] [CrossRef]
| Parameter | Range for UVI, VID, DNA, PLG, PLD |
Range for PAR |
|---|---|---|
| Aerosol Optical Depth (AOD) at 550 nm | 0 – 2, step = 0.1 | 0 – 2, step = 0.05 |
| Angstrom Exponent (AE) | 0.4 – 2, step = 0.4 | 0.4 – 2, step = 0.4 |
| Single Scattering Albedo (SSA) | 0.6 – 1, step = 0.1 | 0.6 – 1, step = 0.1 |
| Solar Zenith Angle (SZA) | 1° – 89°, step = 2° | 1° – 89°, step = 1° |
| Total Ozone Column (TOC) | 200 – 600 DU, step = 10 DU | 200 – 500 DU, step = 100 DU |
| Columnar Water Vapor (TCWV) | 2 cm | 0.5 – 3 cm, step = 0.5 cm |
| Surface Albedo | 0.05 | 0.2 |
| Parameter | libRadtran settings |
|---|---|
| Number of streams | 6 |
| Solver | sdisort [66] |
| Molecular absorption parameterization | reptran coarse [67] |
| Atmospheric profile | Standard US atmosphere [68] |
| Extraterrestrial solar spectrum | Kurucz [69] |
| Aerosol profile | Settle (1990) [70] |
| Parameter | Source | Spatial resolution | Temporal resolution | Main reference |
|---|---|---|---|---|
| AOD550, AE, TCWV | CAMS global reanalysis (EAC4) | 0.75x0.75 degrees | 3 hours | [75] |
| SSA | MACv3 aerosol climatology | 0.4x0.4 degrees | Monthly | [76] |
| TOC | OMI AURA Level 3 | 0.25x0.25 | Daily | [77] |
| CMF | CAMS solar radiation | 0.05x0.05 | 15-min | [72] |
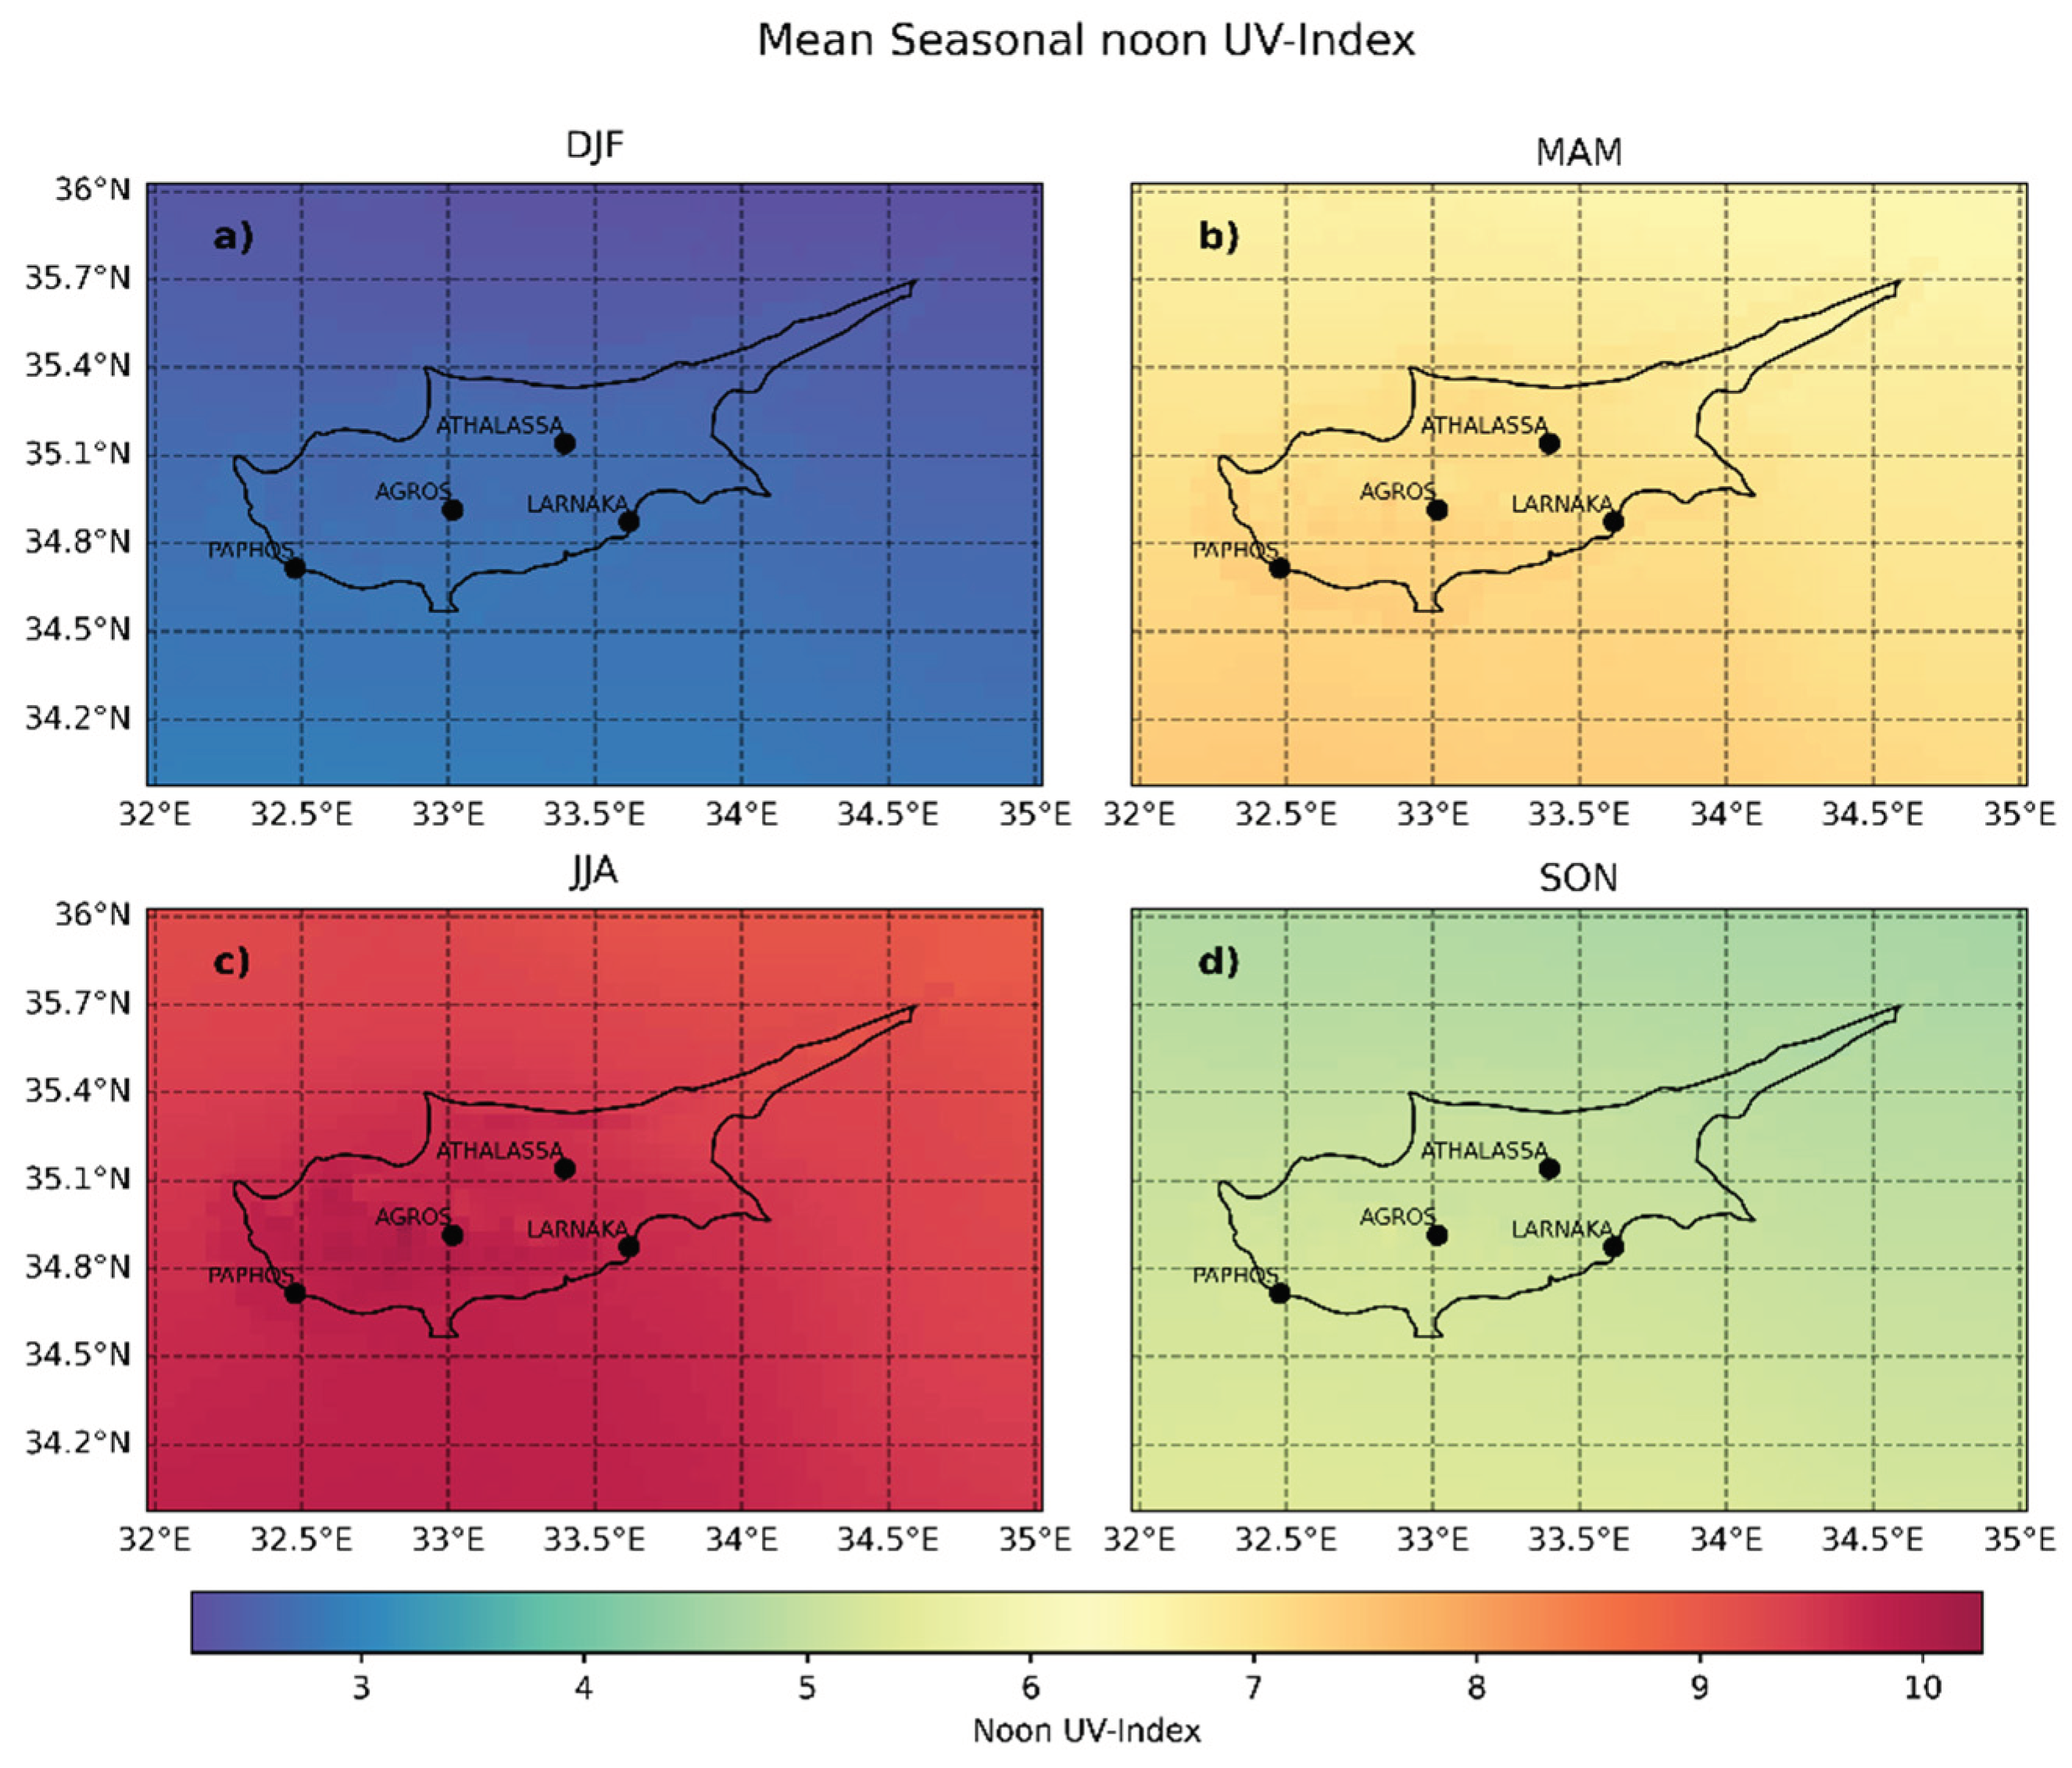
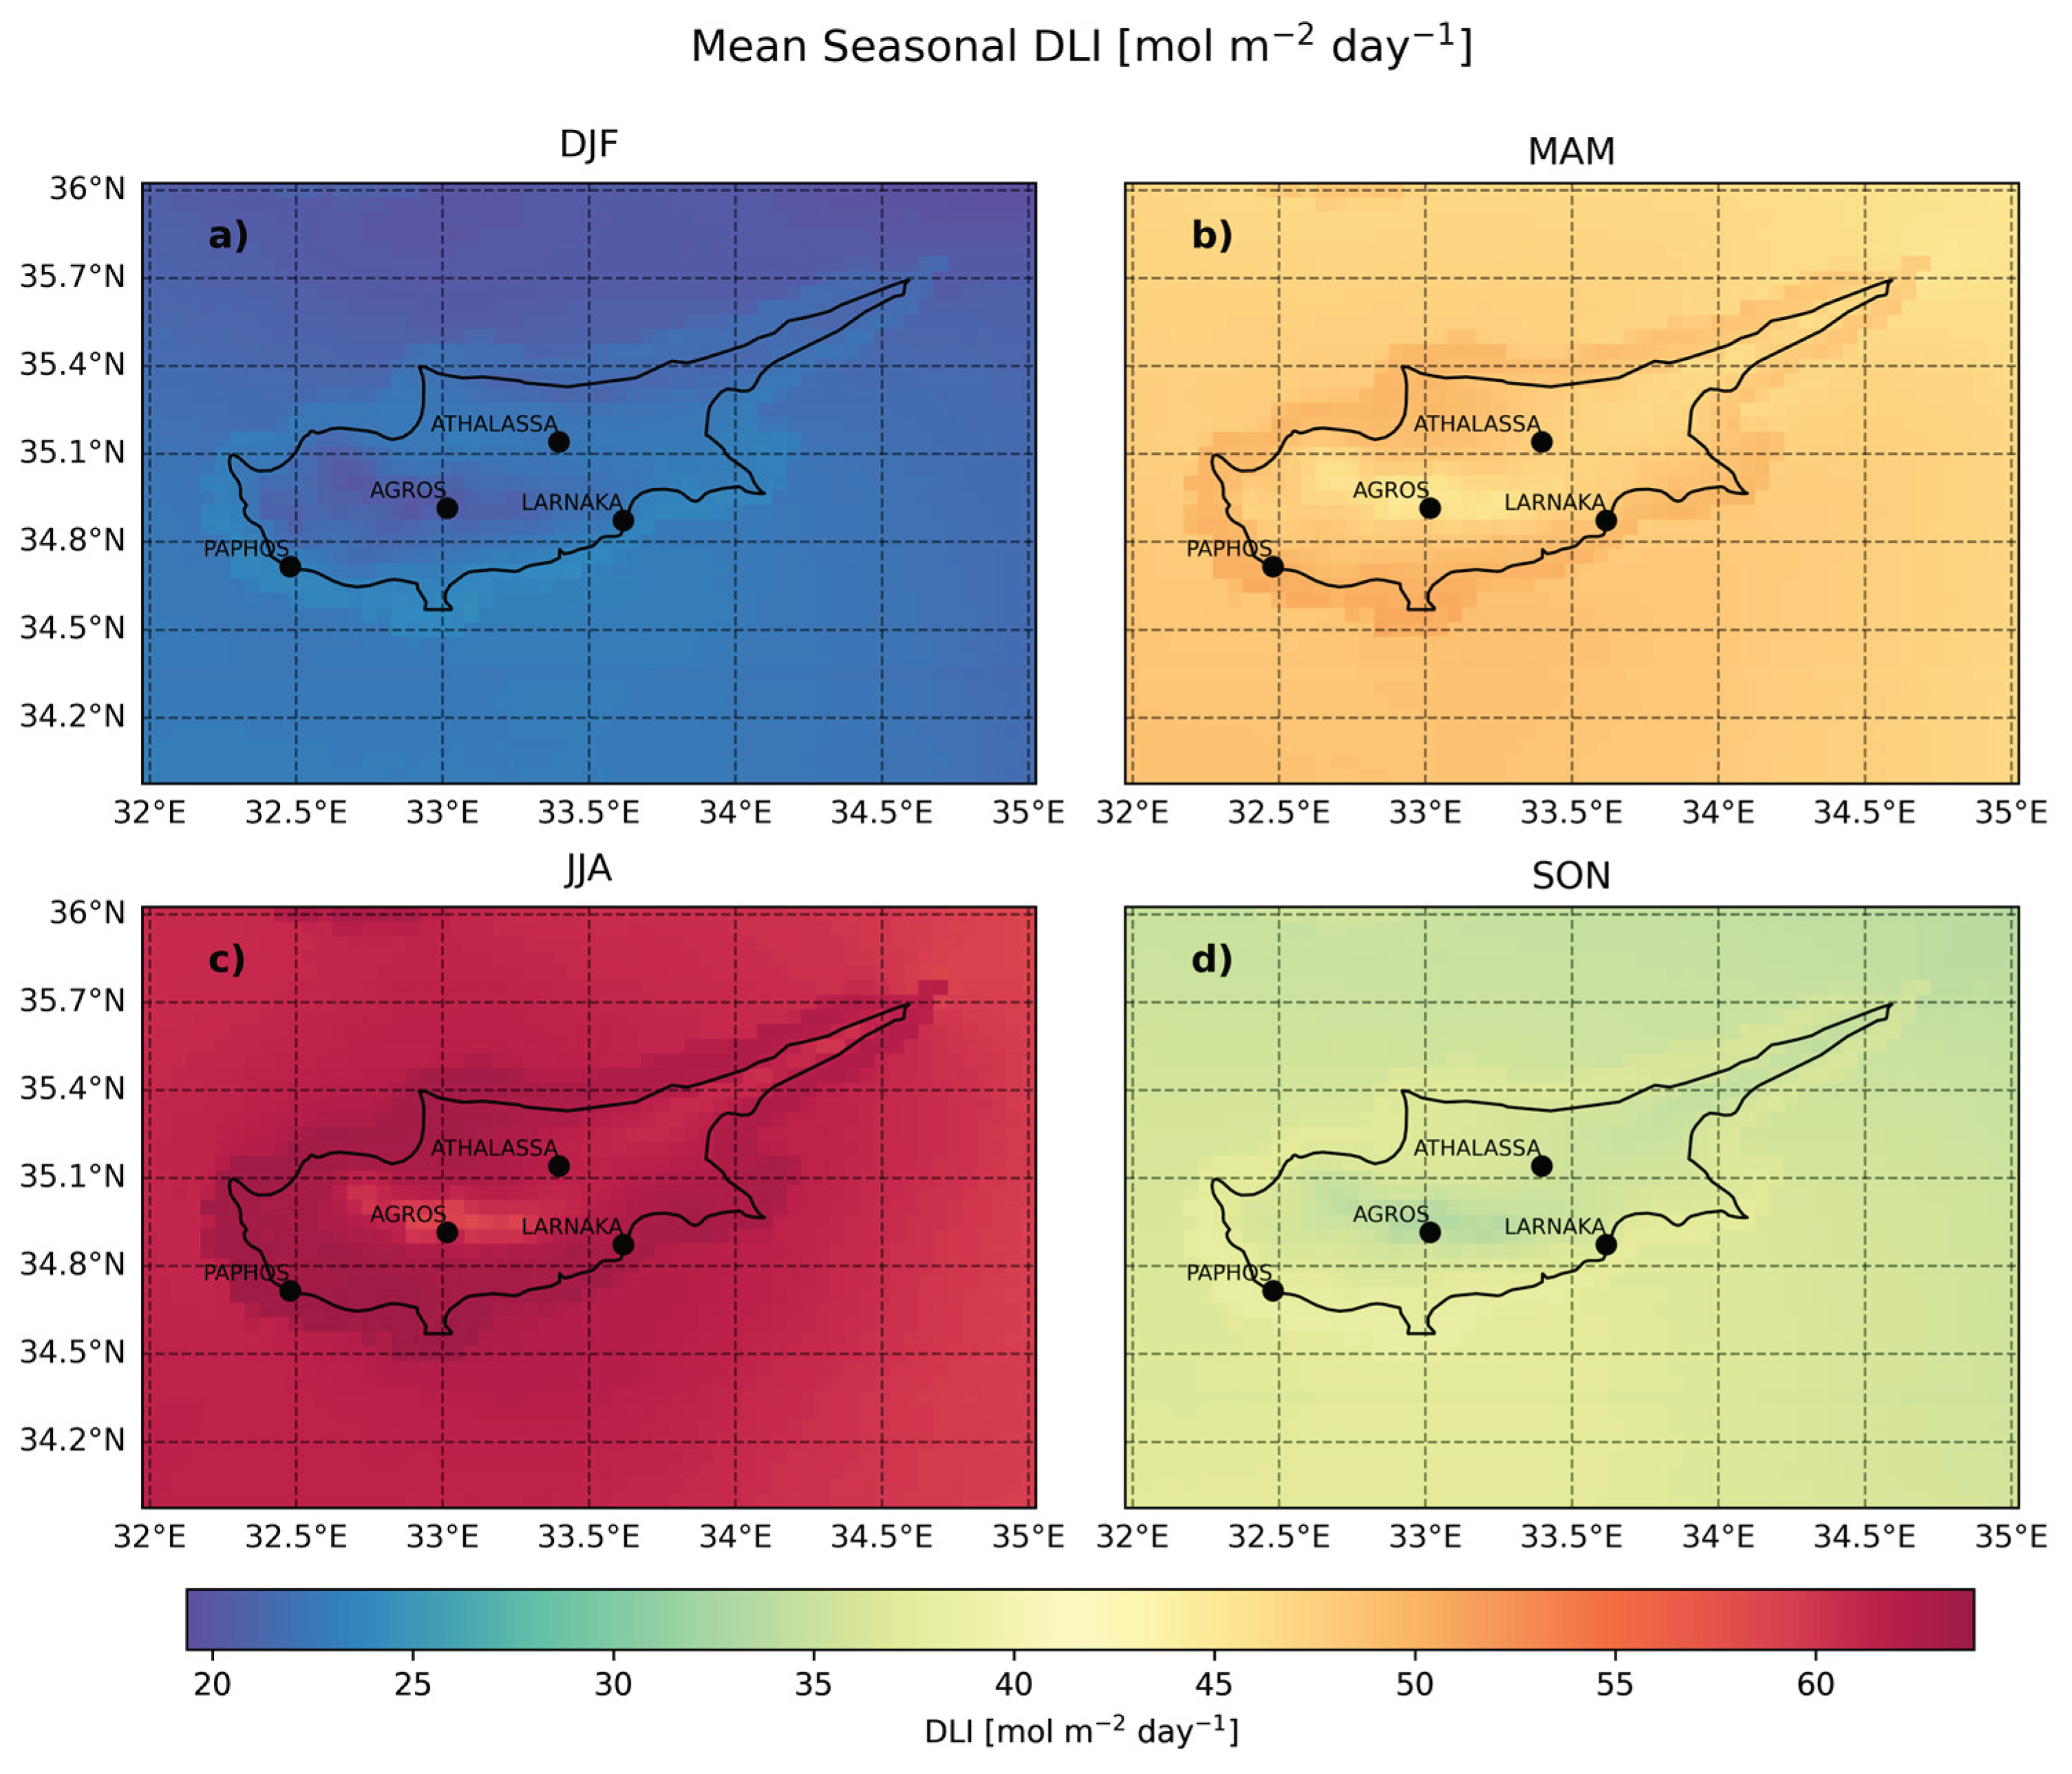
| Season | Mean noon UVI | Standard Deviation of mean noon UVI | Mean DLI (mol m-2 day-1) | Standard Deviation of mean DLI (mol m-2 day-1) |
|---|---|---|---|---|
| Winter | 2.6 | 0.18 | 21.9 | 1.02 |
| Spring | 7.0 | 0.24 | 47.8 | 0.98 |
| Summer | 9.5 | 0.24 | 61.4 | 1.12 |
| Autumn | 5.0 | 0.21 | 36.1 | 0.95 |
Disclaimer/Publisher’s Note: The statements, opinions and data contained in all publications are solely those of the individual author(s) and contributor(s) and not of MDPI and/or the editor(s). MDPI and/or the editor(s) disclaim responsibility for any injury to people or property resulting from any ideas, methods, instructions or products referred to in the content. |
© 2024 by the authors. Licensee MDPI, Basel, Switzerland. This article is an open access article distributed under the terms and conditions of the Creative Commons Attribution (CC BY) license (http://creativecommons.org/licenses/by/4.0/).


