1. Introduction
The coast of southern China is often hit by TCs in summer. On average 4 to 7 TCs affected Hong Kong each year and generally bring severe weather to the territory. For TC forecasting and warning services, one major challenge is the rapid intensification (RI) of TC. The HKO has developed a number of tools to forecast the intensity change of TCs. Some examples include post-processing of intensity forecast from global numerical weather prediction (NWP) models and application of artificial intelligence (Tam et al., 2021; Xu et al., 2021; Griffin et al., 2022; Wei et al., 2023).
Forecasting TC intensity and in particular rapid intensification (RI; defined as the 95th percentile of 24-hour intensity changes (Kaplan et al., 2003)) has been one of the major challenges in the weather forecast operation. With increasing model resolution and improved physical schemes with grid resolvable dynamical and thermodynamical processes as well as the use of air-sea coupled NWP models, there is significant improvement in TC track and intensity forecast. However, model capability of predicting TC intensity accurately or RI of TCs which involves multi-scale processes remains limited. It may be due to inadequate model capability in providing sufficient heat and energy to support RI (Huang et al., 2024). In fact, the accuracy of TC track forecast will also be affected by that of the intensity forecast as stronger TCs typically extend through the depth of the troposphere and are steered by a deep-layer mean wind while weaker storms typically have less vertical depth and a shallower layer of average winds in the steering environmental flow (WMO, 2017).
Under the background of climate change, air and sea temperatures increase, and thermodynamic environments around TCs have become more favourable for intensification and storm surges will become more severe (Chen et al., 2020). In fact, a significant increase in intensification rates have been observed in multiple basins (e.g. Kishtawal et al., 2012; Mei and Xie, 2016; Balaguru et al., 2018; Bhatia et al., 2019). The forecasting challenges associated with these RI events are likely exacerbated by the upward trend in the proportion of TCs that achieve RI in future projection (Bhatia et al., 2022). There are knowledge and data gaps in identification and understanding of the mechanisms of RI of TCs when they come close to the coastal region and shortly before making landfall in some cases. They pose significant threat to human lives and properties as well as socioeconomic developments to coastal regions like the PRD in southern China. There are also limited studies of RI of TCs in the SCS, and most of them are focussed on TCs in oceans like Atlantic Ocean and Pacific Ocean. It is thus important to gather more upper ocean profiles for data assimilation in air-sea coupled NWP models, or construction of training sets for development and implementation of machine learning models, or development of empirical models or nowcasting tools to supplement NWP model forecast for the benefit of real-time operational forecasting. The datasets are also useful to long-term climatological studies for sustainable development of the marine environment, and coastal land use planning and management.
Satellite altimetry observations have revealed that oceanic subsurface warm features such as eddies and currents could make a critical contribution to the sudden intensification of high-impact TCs. These warm features are characterized by high ocean heat content or tropical cyclone heat potential (TCHP) and can effectively limit the TC self-induced negative feedback from ocean cooling to favour intensification (Lin et al., 2013). There are numerous studies of using machine learning techniques to predict RI of TCs based on parameters describing the heat content of ocean and the energy exchanges between the ocean and the atmosphere with the incorporation of the thermal conditions of the upper ocean (Kim et al., 2024). Understanding the ocean’s role in generating intense TCs or realising RI that can produce high storm surge events by the landfalling TC is of utmost importance to national meteorological and hydrological centres (NMHSs) which provide official weather forecast and warnings to the public and users.
TCs interact not only with ocean surface but with the entire upper-ocean column (typically from the surface, down to a depth of 100m, it is also key to understand the air–sea interaction during the passage of a TC, not only in terms of SST, but also of the upper-ocean thermal structure (UOTS) (Lin et al., 2009a). Many intense TCs, such as Hurricane Katrina (2005) and Cyclone Nargis (2008), which claimed more than 130,000 lives in Myanmar, suddenly intensified while traveling over regions of positive upper-ocean thermal anomalies, such as warm ocean eddies (Scharroo et al., 2005; Lin et al., 2009b).
In recent years, there are increasingly more attention on the role of salinity on the intensification of TCs and some considered that the upper ocean salinity profile might be the missing piece to tackle the problem of RI. It is commonly known that strong winds of TC induce vertical mixing and sea surface cooling that acts as a negative feedback on the TC intensity. In the western tropical Atlantic, near-surface ocean salinity stratification is substantially enhanced by freshwater lens of the Amazon-Orinoco River system which acts to inhibit TC-induced oceanic mixing and SST cooling (Balaguru et al., 2012; Grodsky et al., 2012). The reduction in SST cooling caused by salinity stratification has a noticeable positive impact on TCs undergoing RI but the impact of salinity on more weakly intensifying storms is considered insignificant in the study of rapidly intensifying TCs in the eastern Caribbean and western tropical Atlantic by Balaguru et al. (2020). Similar results are also obtained for the storms over the post-monsoon Bay of Bengal (BoB) where a thick barrier layer with strong salinity stratification induced by the freshwater from rainfall and river runoff during the summer monsoon season formed above the top of the thermocline in the northern BoB limits TC-induced sea surface cooling and in turn favours TC intensification (Fan et al., 2020). However, there are limited studies about such impact on the WNP and the SCS.
This paper summarizes the observations of sea temperature and salinity profile under water, especially in the last 100 m or so below sea surface, and their possible relationship with the intensity changes of selected TCs that have significant impact on Hong Kong in recent years. Though the number of cases is limited, this serves as the first documentation of salinity profile and its relationship with TC intensity in the WNP and SCS basin, and may stimulate further studies, especially statistical analysis, for more TC cases in this region.
2. Data and Methods
2.1. Sea Temperature and Salinity Profiles
The sea temperature and salinity profile data analysed along the track of TCs under study were generated from CORA2 developed by NMDIS (Fu et al., 2023). The ocean variables in the CORA2 product, including sea surface height (SSH), 3D temperature, salinity, and current, are saved on a global uniform horizontal grid of 0.1° × 0.1° and 50 layers at 3-hour intervals. The RSME of subsurface temperature of CORA2 was about 0.87°C and that of salinity was about 0.15 psu.
2.2. Observations Used in Data Assimilation for CORA2
The assimilated observations include in-situ temperature-salinity (T-S) profiles, altimeter sea-level anomaly (SLA), satellite sea-surface temperature (SST), and TOPEX/POSEIDON global tide model (TPXO8) surface tidal elevation. The T-S profiles are from the data archive of the NMDIS, World Ocean Database (WOD) 2018 (Garcia et al., 2018), Global Temperature and Salinity Profile Project (GTSPP), and the Array for real-time geostrophic oceanography (Argo) Project. The altimeter SLA comes from the gridded Archiving, Validation and Interpretation of Satellite Oceanographic (AVISO) data which are part of the Copernicus Marine Environment Monitoring (CMEMS) dataset and merges all the altimetry mission measurements into a daily grid with a spatial resolution of 0.25 degrees (Pujol et al., 2016). The daily NOAA Optimum Interpolation Sea Surface Temperature version 2 (OISSTv2) SST data with a resolution of 0.25 degrees x 0.25 degrees (Reynolds et al., 2007). Generally more than 10 Argo float temperature and salinity profiles within the region traversed by the TCs under study, viz. Super Typhoon Hato (20-24 August 2017), Super Typhoon Mangkhut (7-17 September 2018), Typhoon Talim (14-18 July 2023), Super Typhoon Saola (24 August – 3 September 2023) and Severe Typhoon Koinu (30 September -10 October 2023), were used in the data assimilation.
2.3. Oceanic Dynamical Model Used for CORA2
The CORA2 used the MITgcm oceanic dynamical model (Marshall et al., 1997), which solves the 3-D primitive equations with the implicit linear free-surface under the hydrostatic and Boussinesq approximations. A cube-sphere grid projection allowing a relatively even grid spacing throughout the whole model domain with no singularities was adopted in the model (Adcroft et al., 2004). The model domain covers the whole globe. The horizontal grid spacing is about 9 km. There are 50 vertical levels with thickness ranging from 10 m near the surface to around 450 m at the maximum model depth of 6150 m. The topography data are taken from the General Bathymetric Chart of the Ocean (GEBCO08) bathymetry data at a resolution of 30 arc-seconds. The atmospheric forcing variables include 10-m wind, 2-m temperature and humidity, total precipitation, surface downward shortwave and longwave radiative fluxes from the Japanese 55-year Reanalysis (JRA-55) of the Japan Meteorological Agency (Kobayashi et al., 2015; Harada et al., 2016). The wind stress over the ocean is calculated following the bulk formulas of Large and Pond (1981). Seasonal climatology is used for runoff (Fekete et al., 2002). The model employs quadratic bottom boundary layer drag and there is no parametrization of topographic internal wave drag (Arbic et al., 2018).
2.4. Tropical Cyclone Data
Intense TCs in recent years which necessitated the issuance of TC Warning Signal Number 8 (which gives warning of gale or storm force winds) or even the highest TC Signal No.10 (warning of hurricane force winds) in Hong Kong, namely Super Typhoons Hato in 2017 and Mangkhut in 2018, Typhoon Talim, Super Typhoon Saola and Severe Typhoon Koinu in 2023, were selected to study the impact of sea temperature and salinity over a depth of about 150 m on TC intensity changes, and in particular RI. Three-hourly positions and intensity were interpolated from the HKO’s best-track analyses which are performed after the passage of each TC over the western North Pacific (WNP) and the SCS (i.e. the area bounded by the Equator – 45°N, 100°E – 180°E) based on all TC-related observational data and information collected, including the unconventional ones, or the operational warning track if best-track data are not available at the time of analysis. The best-track dataset consists of analysed positions of TCs, maximum sustained surface wind, and minimum sea-level pressure at 6-hourly intervals covering all TCs reaching or above the strength of tropical depression over the above-mentioned area. The intensity is based on the maximum 10-minute sustained wind near the centre of the TC.
2.5. RI Thresholds Used in the SCS
The RI thresholds adopted for use in the SCS basin are slightly different from those in the Atlantic and eastern North Pacific (ENP) where 1-minute average wind speed near the TC centre is used (Kaplan et al., 2010). The HKO TC best track analysis is based on 10-minute average wind speed near the TC centre for the analysed intensity. According to the recommendation of the World Meteorological Organization (WMO) (Harper et al., 2010), a conversion factor of 0.93 is used for the conversion of 1-minute average to 10-minute average. Rounding down to the nearest 5 knots, a RI threshold of intensity gain of 25 knots in 24 hours was adopted for the SCS basin. To keep forecast consistency and continuity for TCs entering the SCS from the WNP, the same set of RI was also adopted for the WNP in the study. As the SCS is a relatively small basin surrounded by major land masses, there is less room in general for TCs to intensify rapidly before making landfall as compared with the WNP. An intensity gain of 45 knots in 48 hours would be equivalent to the 99th percentile in the SCS, while it is only the 95th percentile in the WNP (Tam et al., 2021).
3. Results and Discussions
3.1. Super Typhoon Hato in August 2017
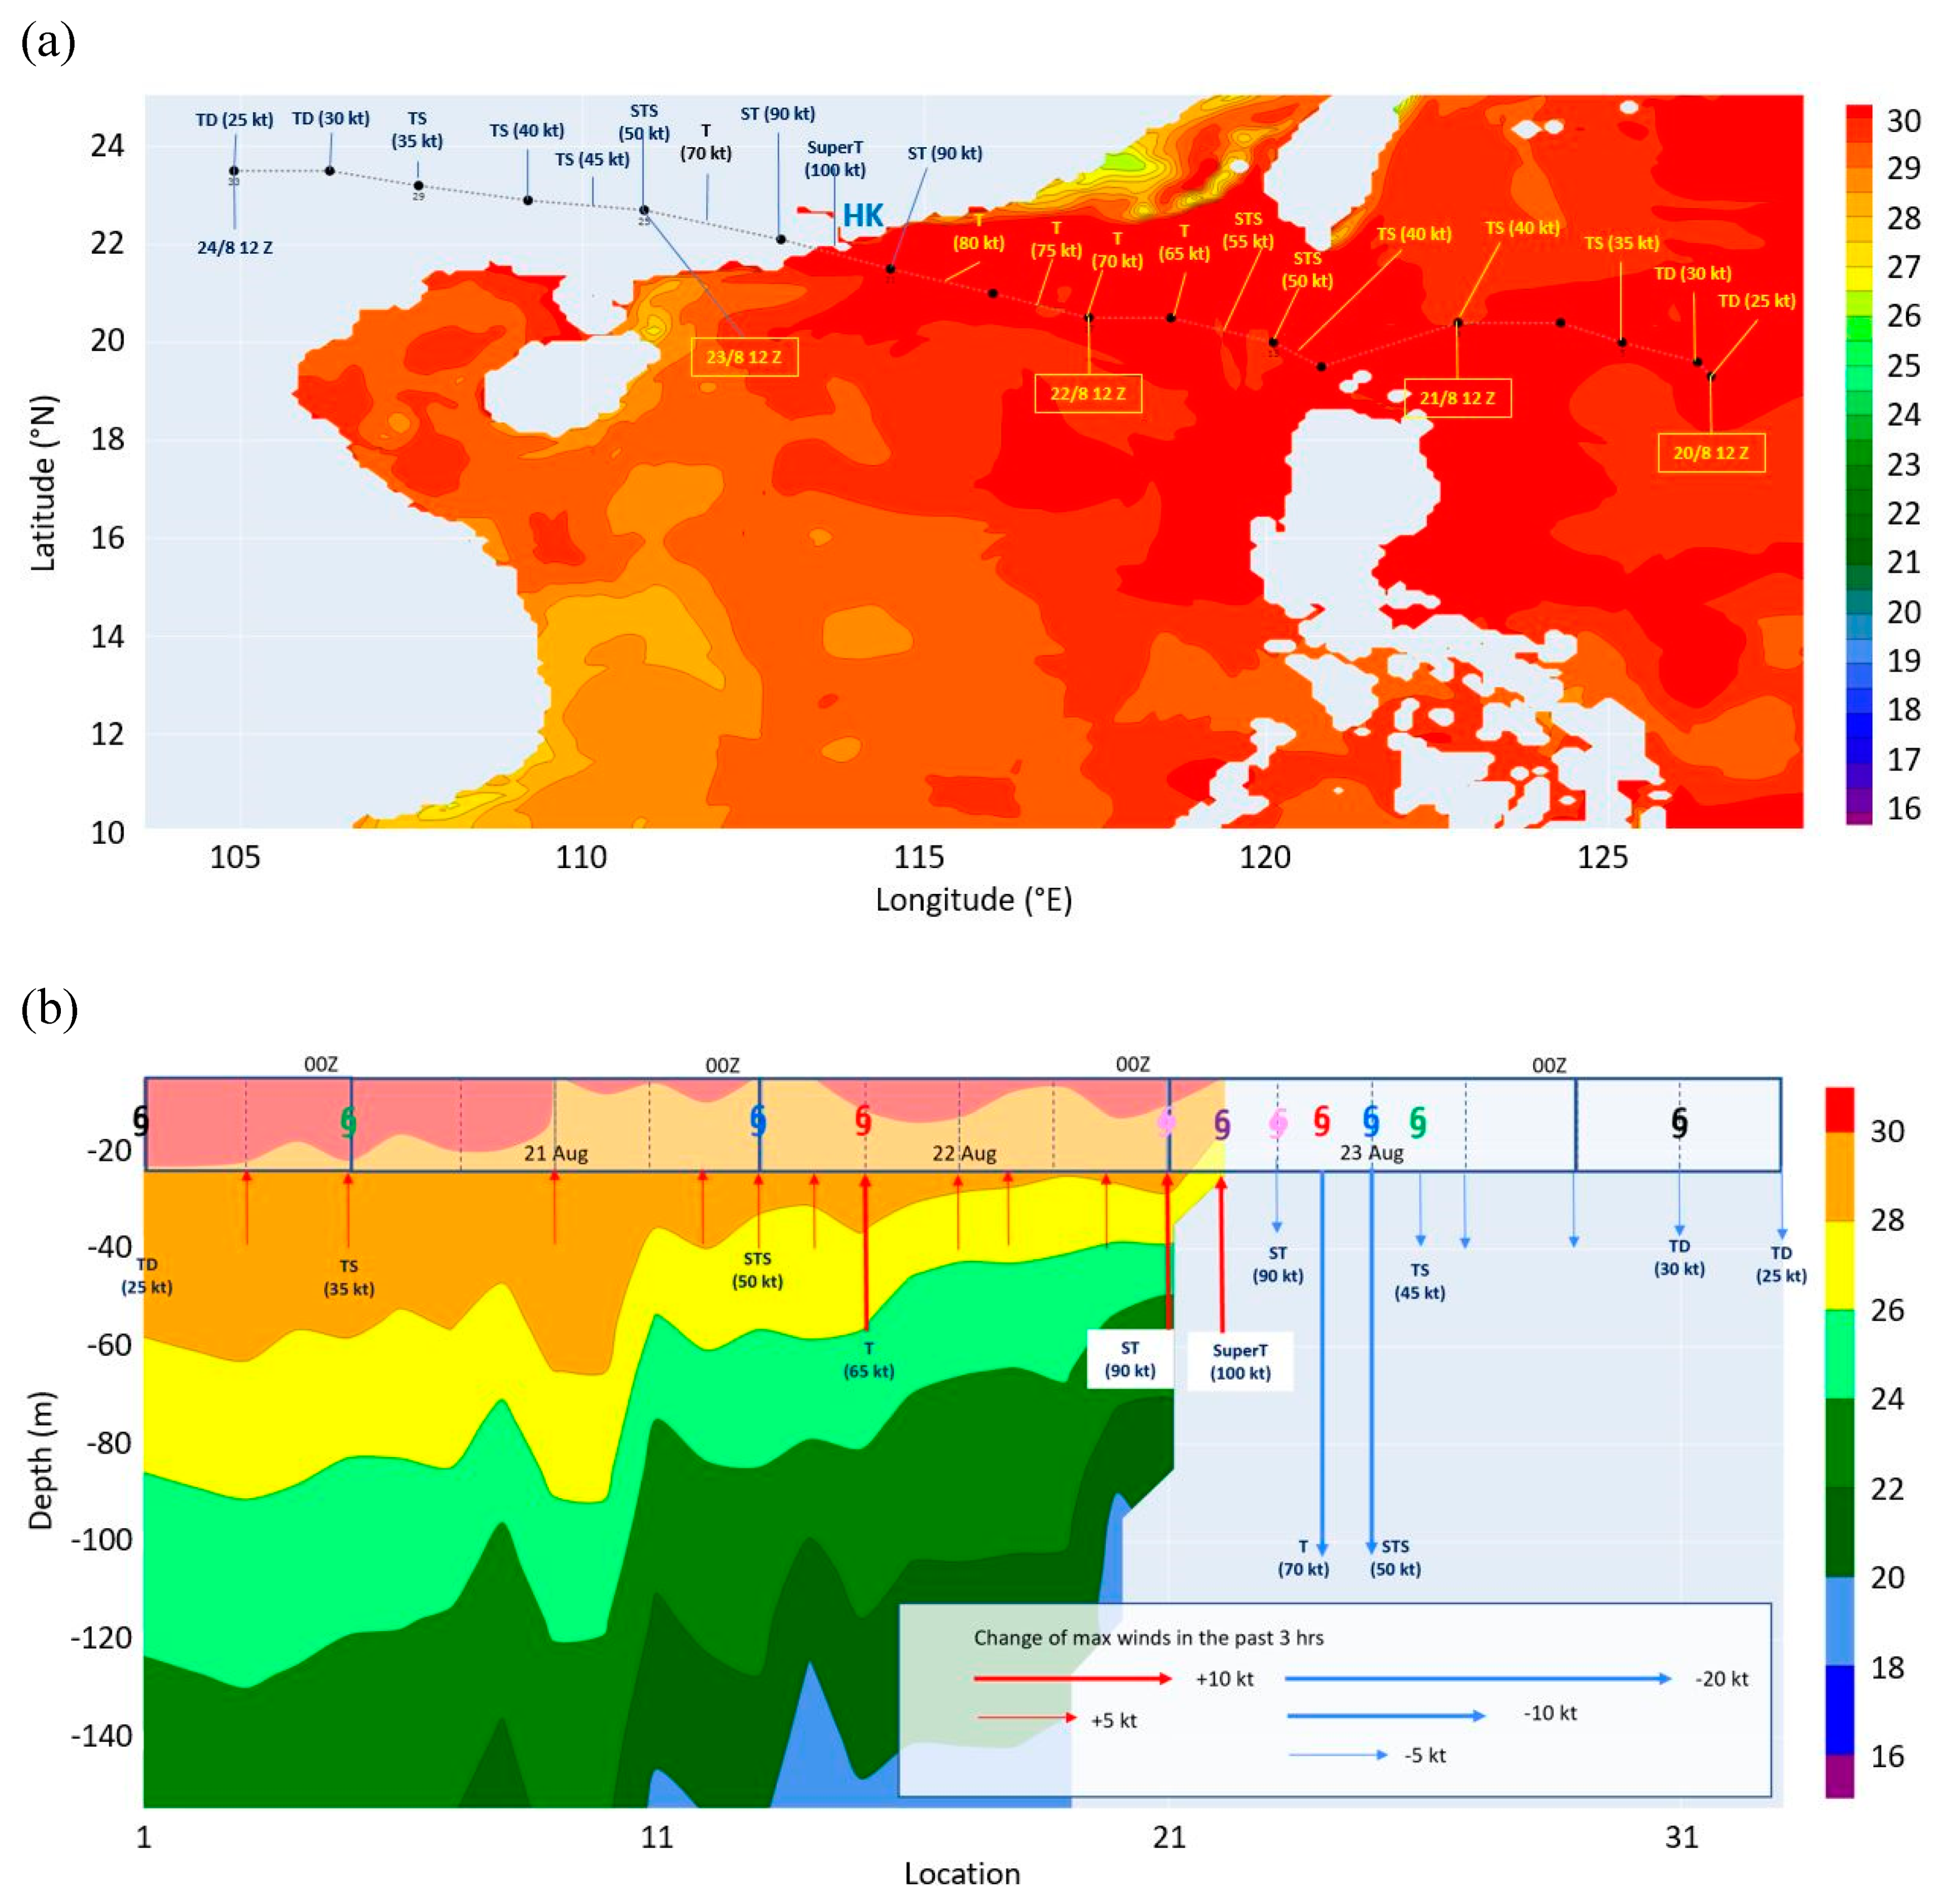
Super Typhoon Hato brought severe storm surge and damaging winds to the coastal region of the PRD, including Hong Kong and Macao (Choy et al., 2020). Record-high sea levels were recorded at many places, and there were serious flooding and significant casualties and economic losses over the region, in particular the inner Harbor area of Macau which experienced the worst flooding since 1925. One major challenge of forecasting Hato is its RI over the northeastern part of the SCS, with an intensity gain of 45 knots in 24 hours, and strengthening to a super typhoon with an estimated sustained wind of 100 knots near its centre at around 03 UTC 23 August 2017, just a couple of hours before it made landfall at about 100 km west of Hong Kong. The circulation of Hato was compact and the radius of gale force winds was about 160 km. The track and intensity of Hato overlaid on the SST plot are given in
Figure 1(a). From the depth-location plot of sea temperatures in
Figure 1(b), Hato was the only one, among the five TCs studied in this paper, experienced persistently high SST along its track, over 30°C with a vertical extent of about 20 m below the sea surface. The relatively high sea temperature is considered to be a major factor for the intensification of Hato. After the passage of Hato over the SCS, the SST drop was only about 1°C and upwelling was not significant.
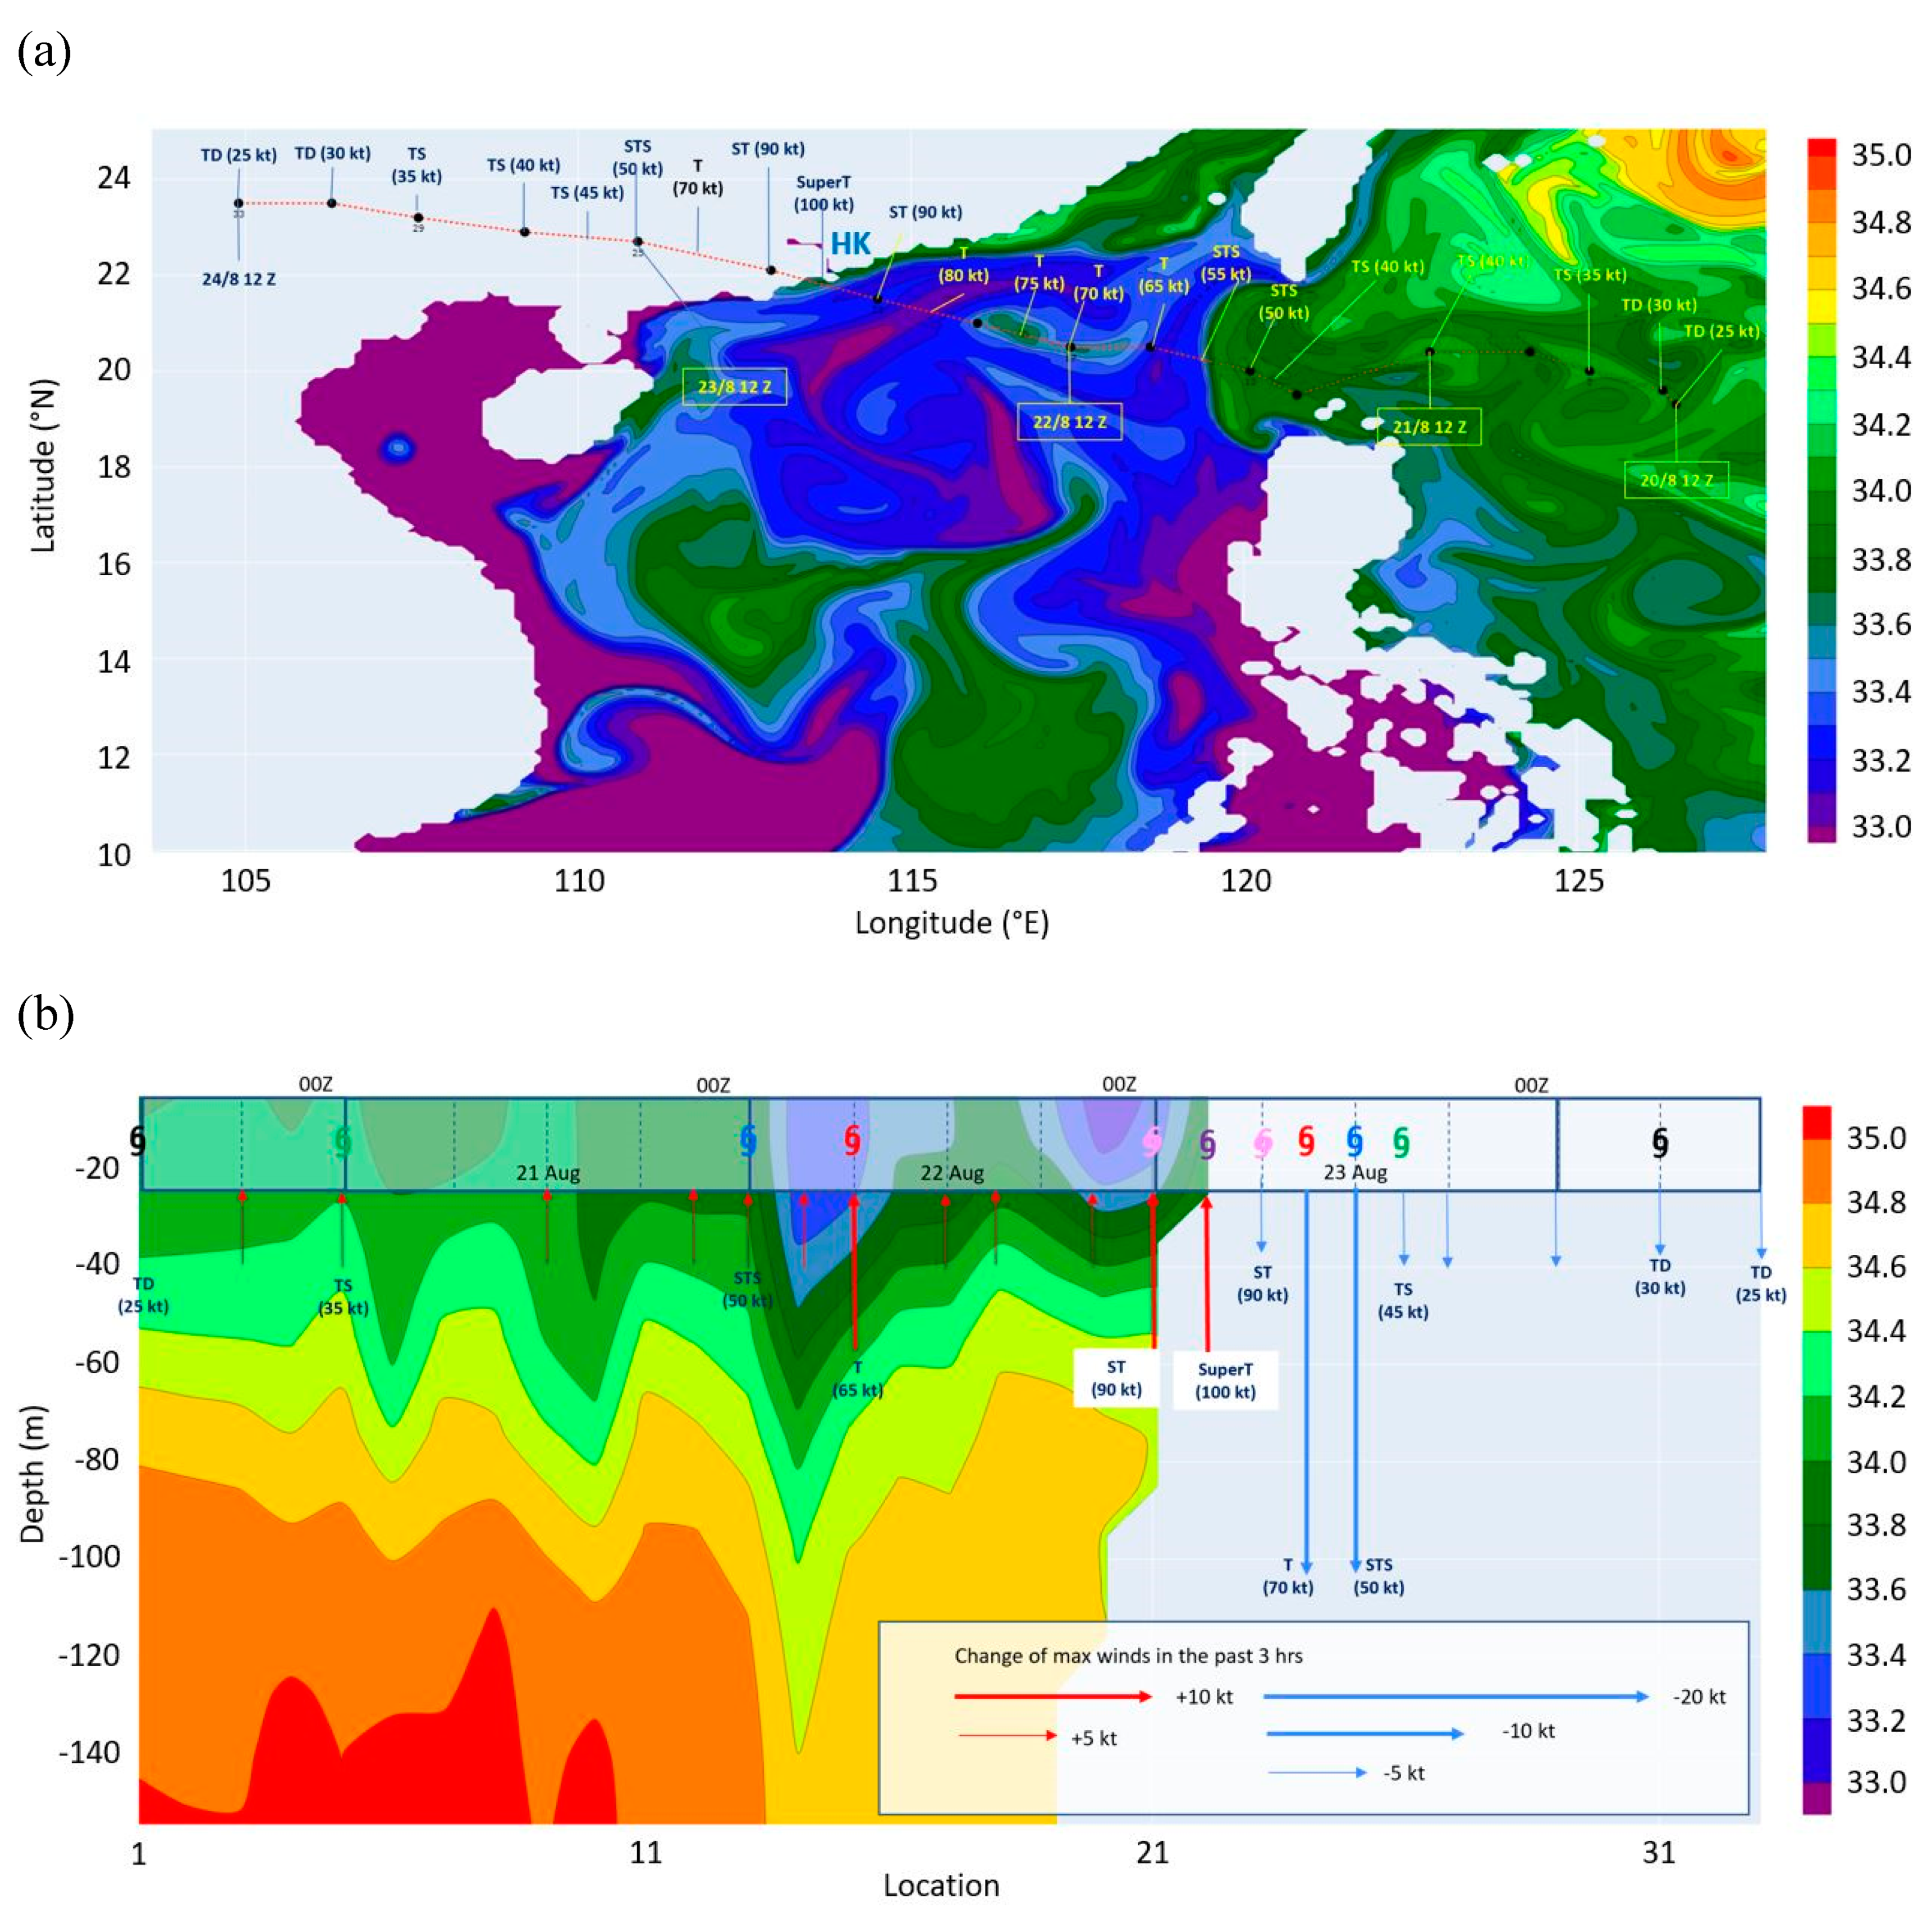
The sea surface salinity (SSS) and the salinity profile along the track of Hato could be found in
Figure 2(a) and 2(b) respectively. The significant rapid changes of intensity, namely, with a 3-hour increase of 10 knots in the central maximum wind at around 06 UTC 22 August and also 00 UTC on 23 August, are found to have good correlation with a relatively low SSS, namely below 33.4 psu, and a relatively strong salinity stratification, in the order of a change of 1 psu per 100 m of water depth. This is the first time that SSS and vertical salinity profile are documented for Hato in 2017. These factors are considered to have major contribution to the intensification of Hato.
3.2. Super Typhoon Mangkhut in September 2018
Super Typhoon Mangkhut in 2018 was characterized by its extensive circulation, ferocious winds and fast movement as well as special wind structure (Choy et al., 2020). It brought damaging winds and severe storm surge to the coast of Pearl River estuary, leading to damages of many buildings and coastal structures, as well as serious inundation of low-lying areas. Although Mangkhut showed signs of weakening after it moved across Luzon and took on a track further away from Hong Kong as compared with Hato, its extensive circulation with a radius of gale force winds of about 400 km and maintenance of intensity as a severe typhoon before making landfall at about 160 km west of Hong Kong still caused widespread and serious impacts as well as record-breaking storm surges since record began in 1954 in Hong Kong.
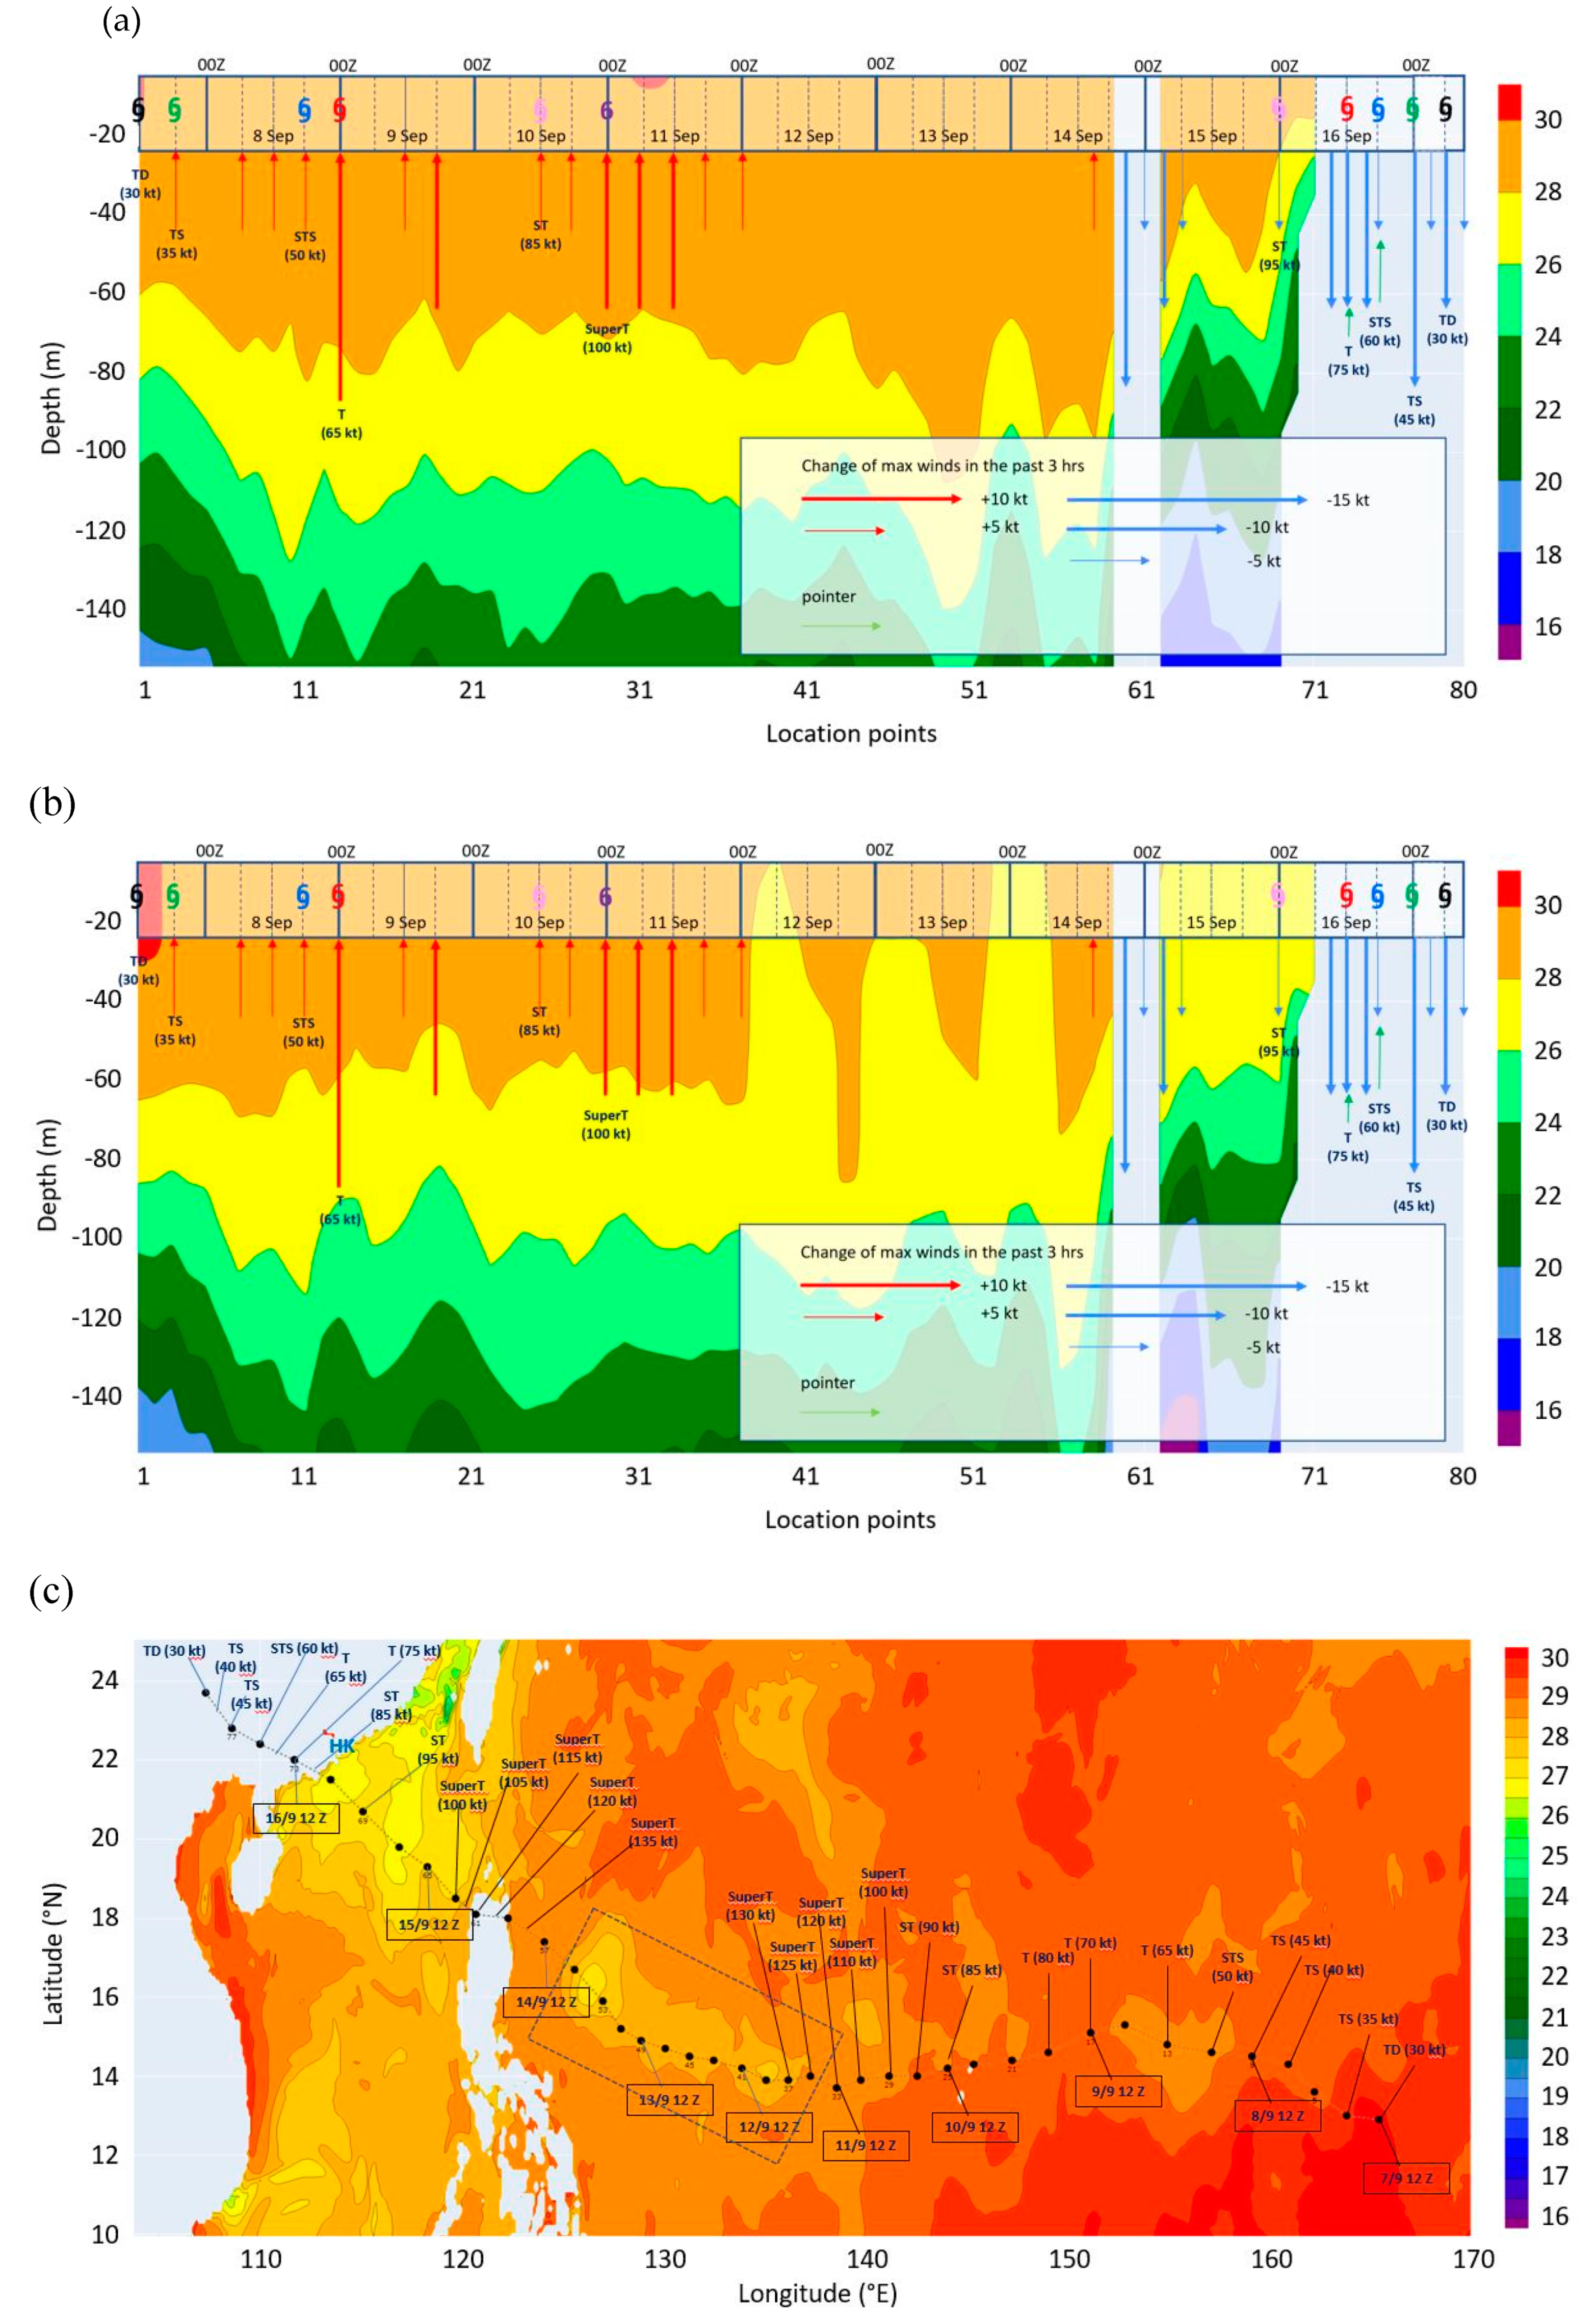
The RI of Mangkhut over the WNP with an intensity gain of 35 knots in 24 hours and central maximum wind strengthening to 125 knots at around 18 UTC on 11 September 2018 was difficult to forecast. A peak intensity of 135 knots was attained shortly before it moved across Luzon. The sea temperature profiles along the track of Mangkhut could be found in
Figure 3(a) before its passage and
Figure 3(b) after its passage. Compared to Hato, the SST over the SCS in the case of Mangkhut was not particularly high. One main point of interest is that after the passage of Mangkhut, there was significant upwelling of sea water with SST drop of about 3°C at the location points 35 and 55 (dotted blue rectangle in
Figure 3(c)) over the seas east of Luzon.
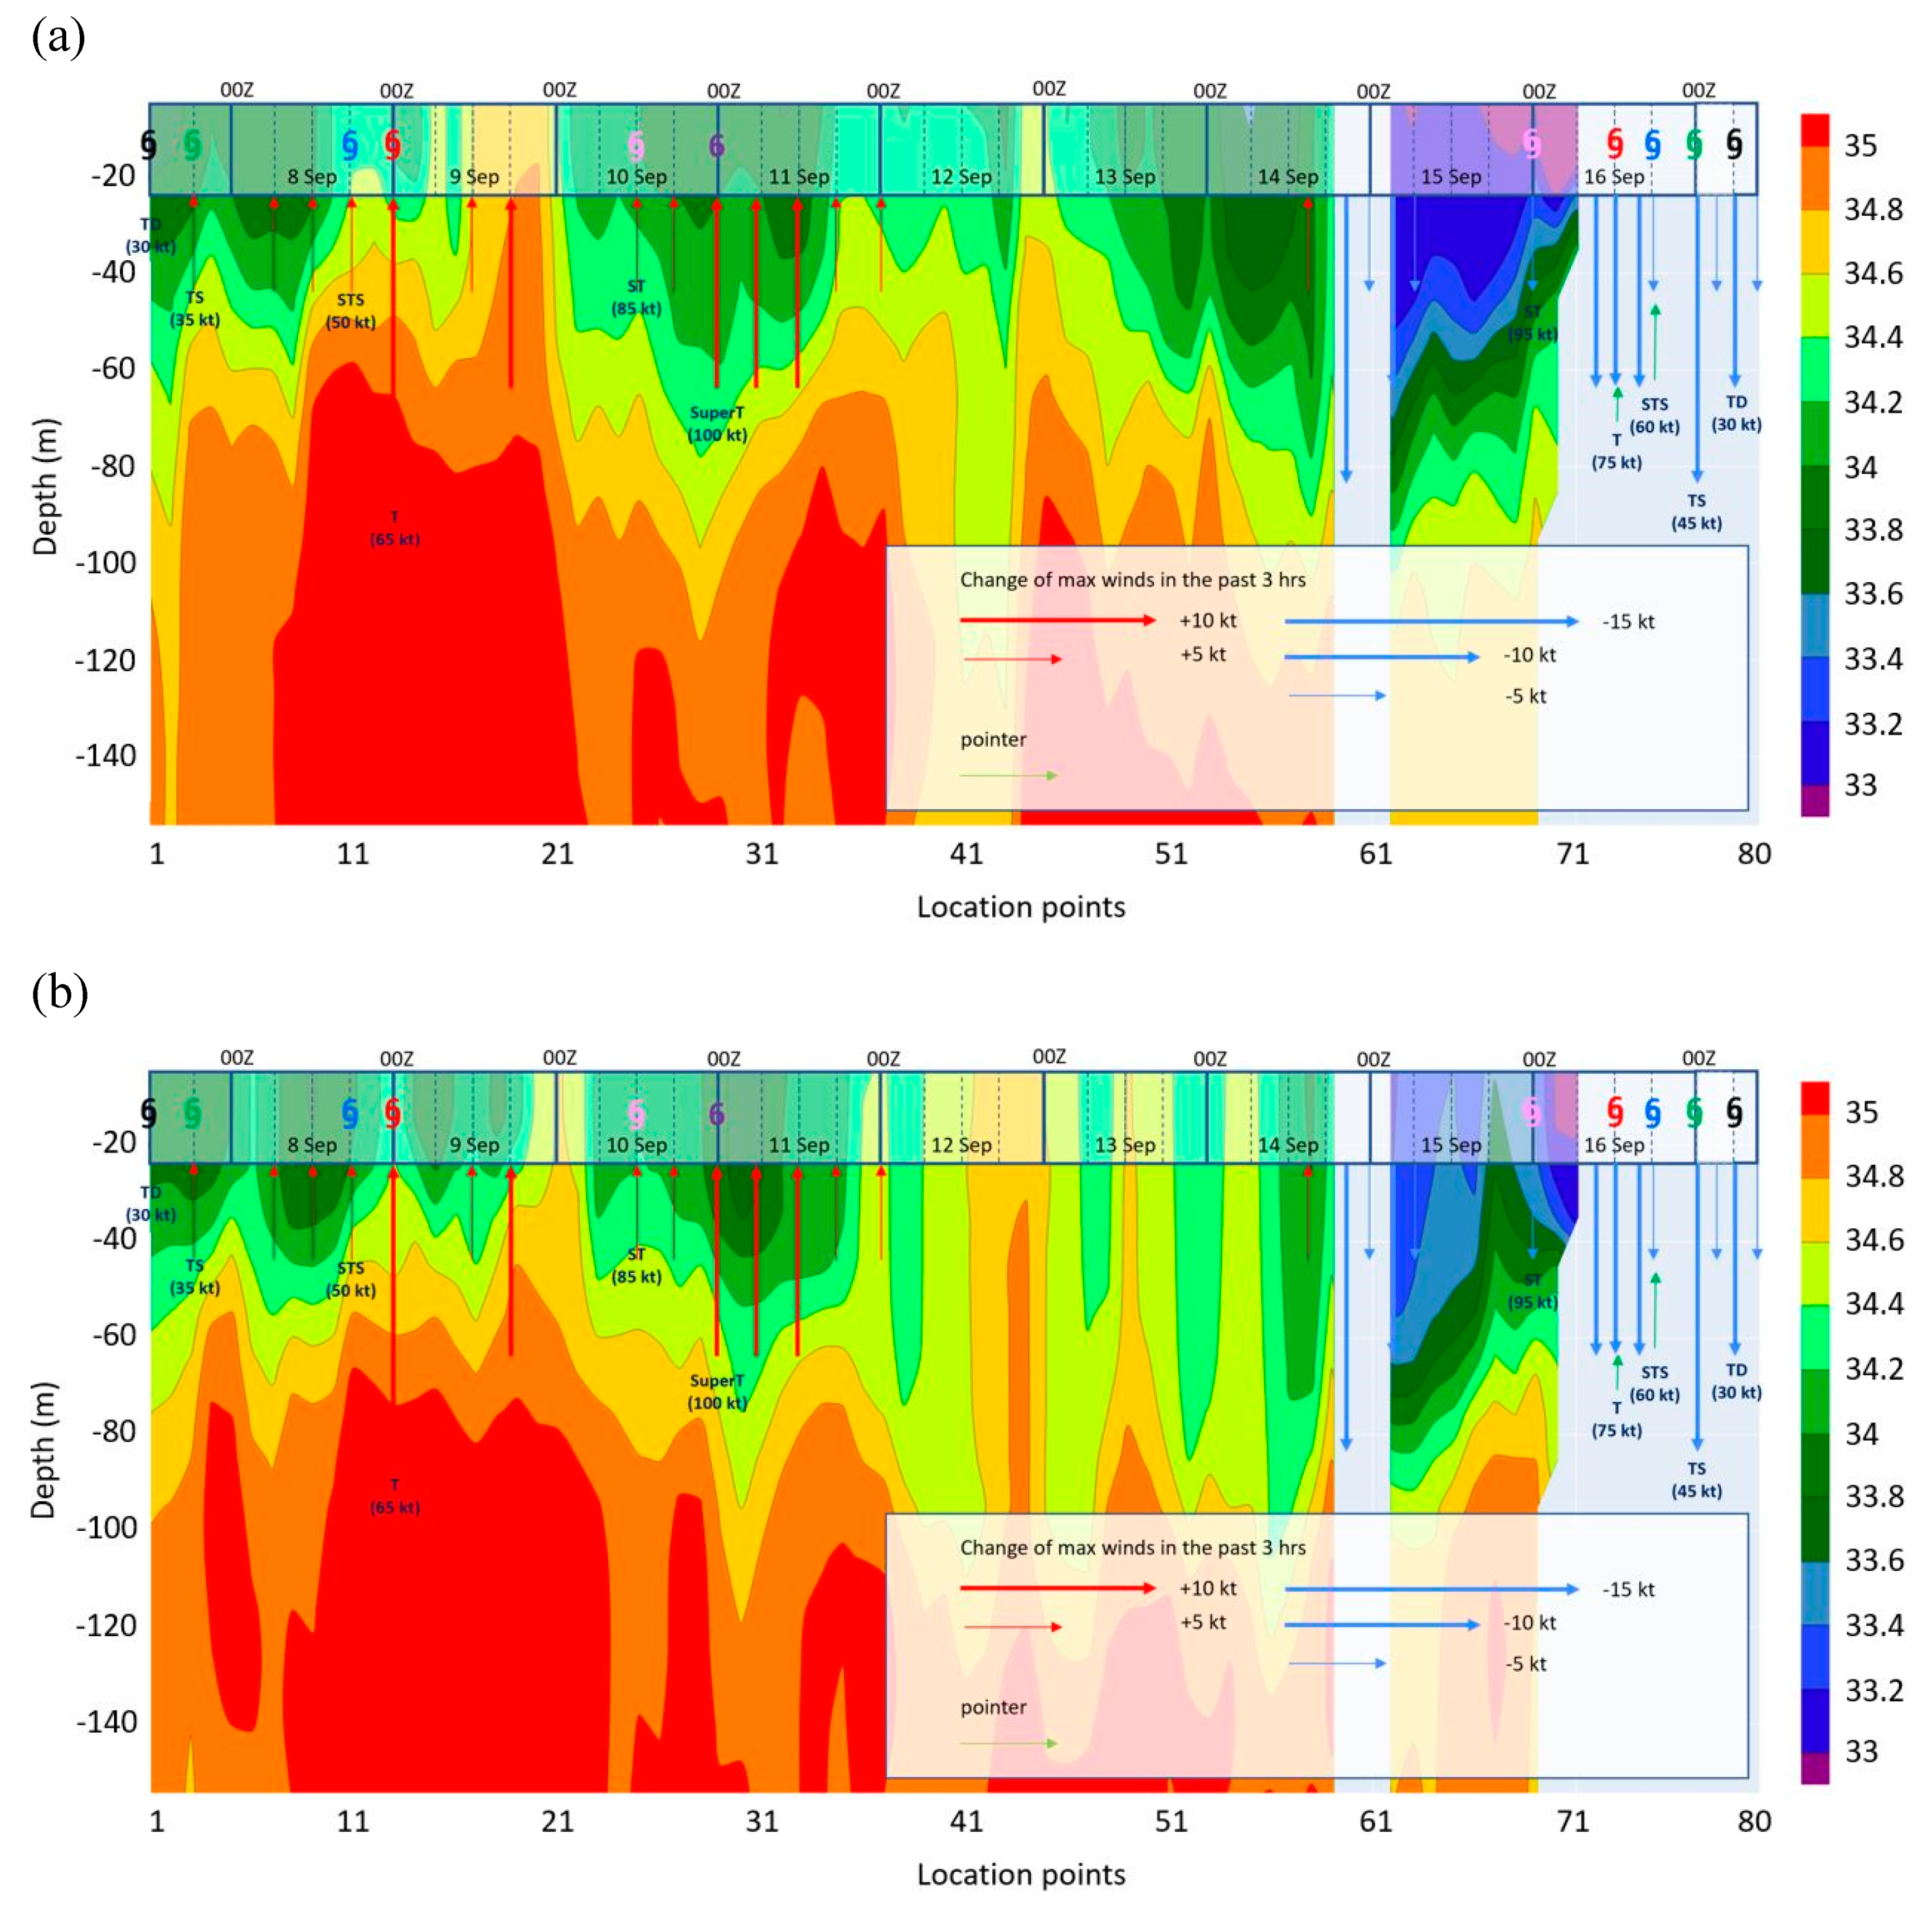
From the salinity profiles before (
Figure 4(a)) and after (
Figure 4(b)) the passage of Mangkhut, the SSS was relatively low in general over the areas where Mangkhut intensified relatively rapidly, with a 3- to 6-hourly increase of intensity in the order of 10 knots, though it is not a necessary condition, namely, between location points 15 and 20 where Mangkhut was near 150°E, the SSS was relatively high and the salinity stratification is rather minor. The salinity stratification was generally stronger in the neighbouring points, again in the order of 0.8 to 1 psu over a water depth of 100 m. With the extensive circulation of Mangkhut, SSS and salinity stratification over a much larger area would have impact on the intensity change of Mangkhut.
Over the SCS, the SSS was again rather low (34 psu or so) and the salinity stratification was relatively strong (in the order of 0.8 psu per a depth of 100 m), as could be seen in
Figure 4(a). Mangkhut did not intensify further over this region, but just maintained a rather high intensity of 125 knots. After its passage, apart from SST cooling as a result of vertical mixing at these locations, the SSS also increased with less salinity stratification (
Figure 4(b)). Salinity profiles also suggested vertical mixing of sea water in the first 100-120 m or so below the sea surface. Such mixing might be related to the inhibition of further intensification of Mangkhut over the SCS, though the intensity remained at a relatively high value of 125 knots.
3.3. Typhoon Talim in July 2023
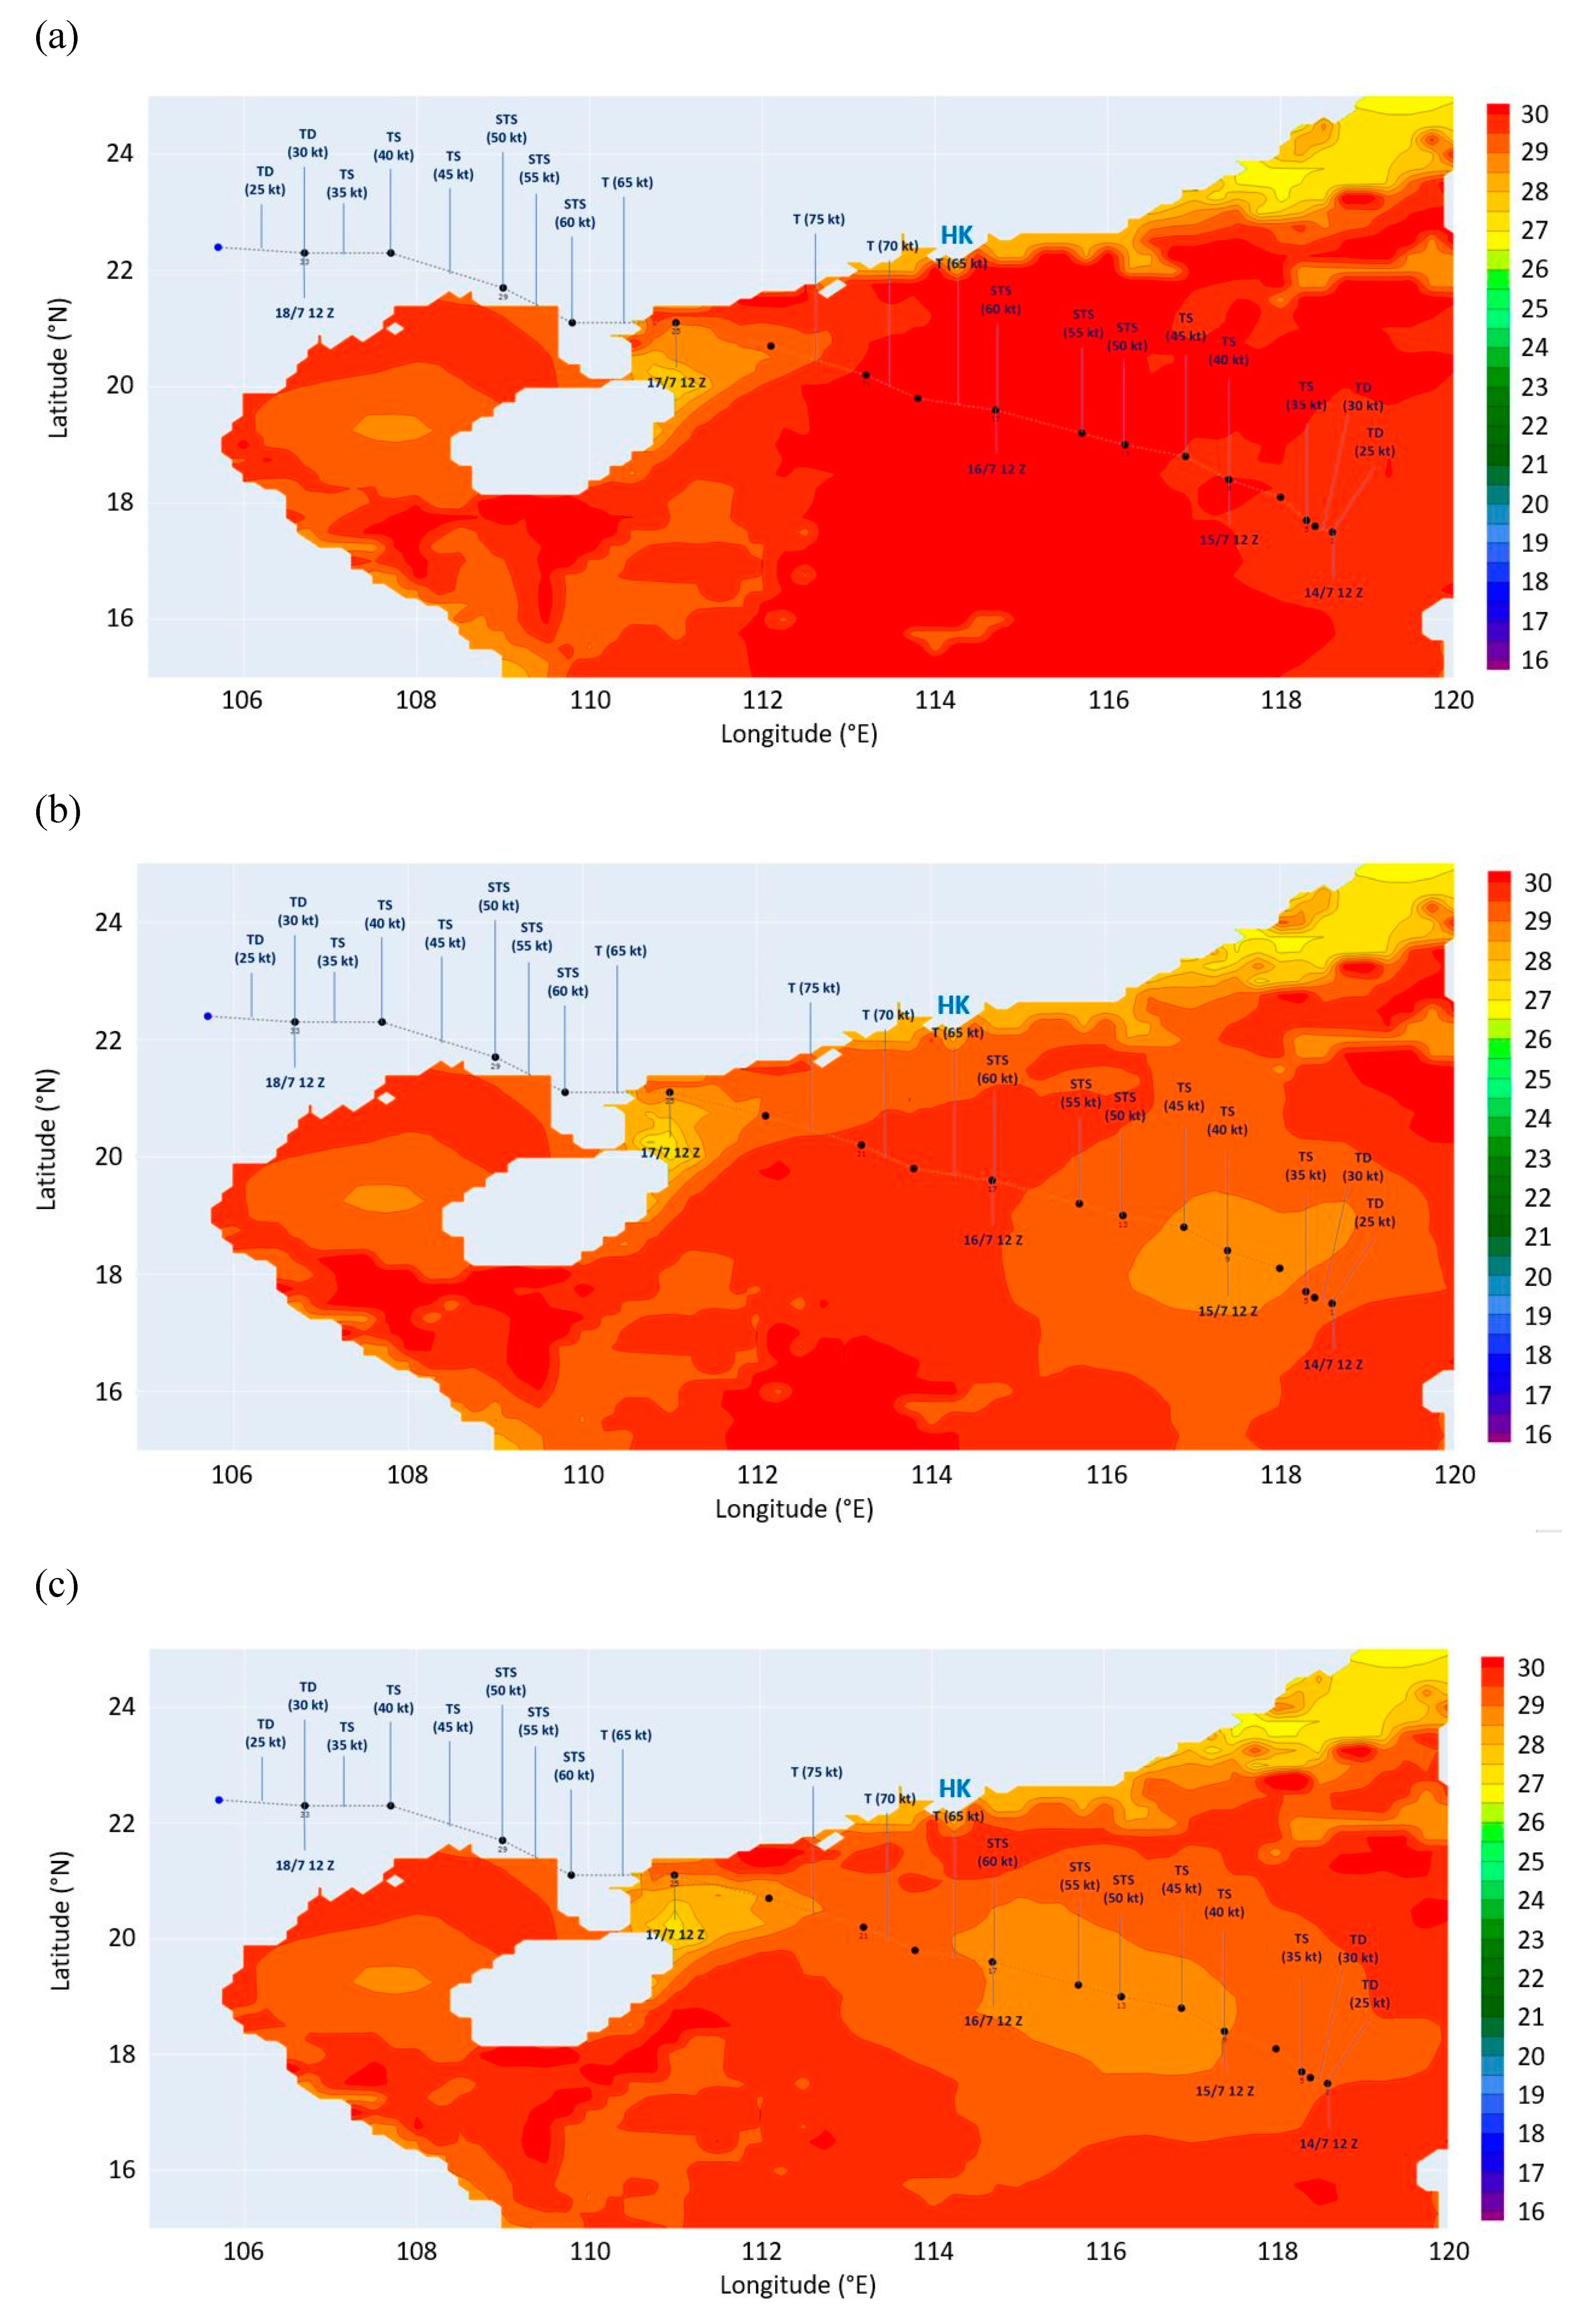
Figure 5 shows a sequence of SST distribution over the northern part of the SCS for Super Typhoon Talim in 2023. It illustrated the cooling of SST after the passage of Talim, suggesting the occurrence of vertical mixing of sea water and thus inhibition of rapid intensification of Talim in the region.
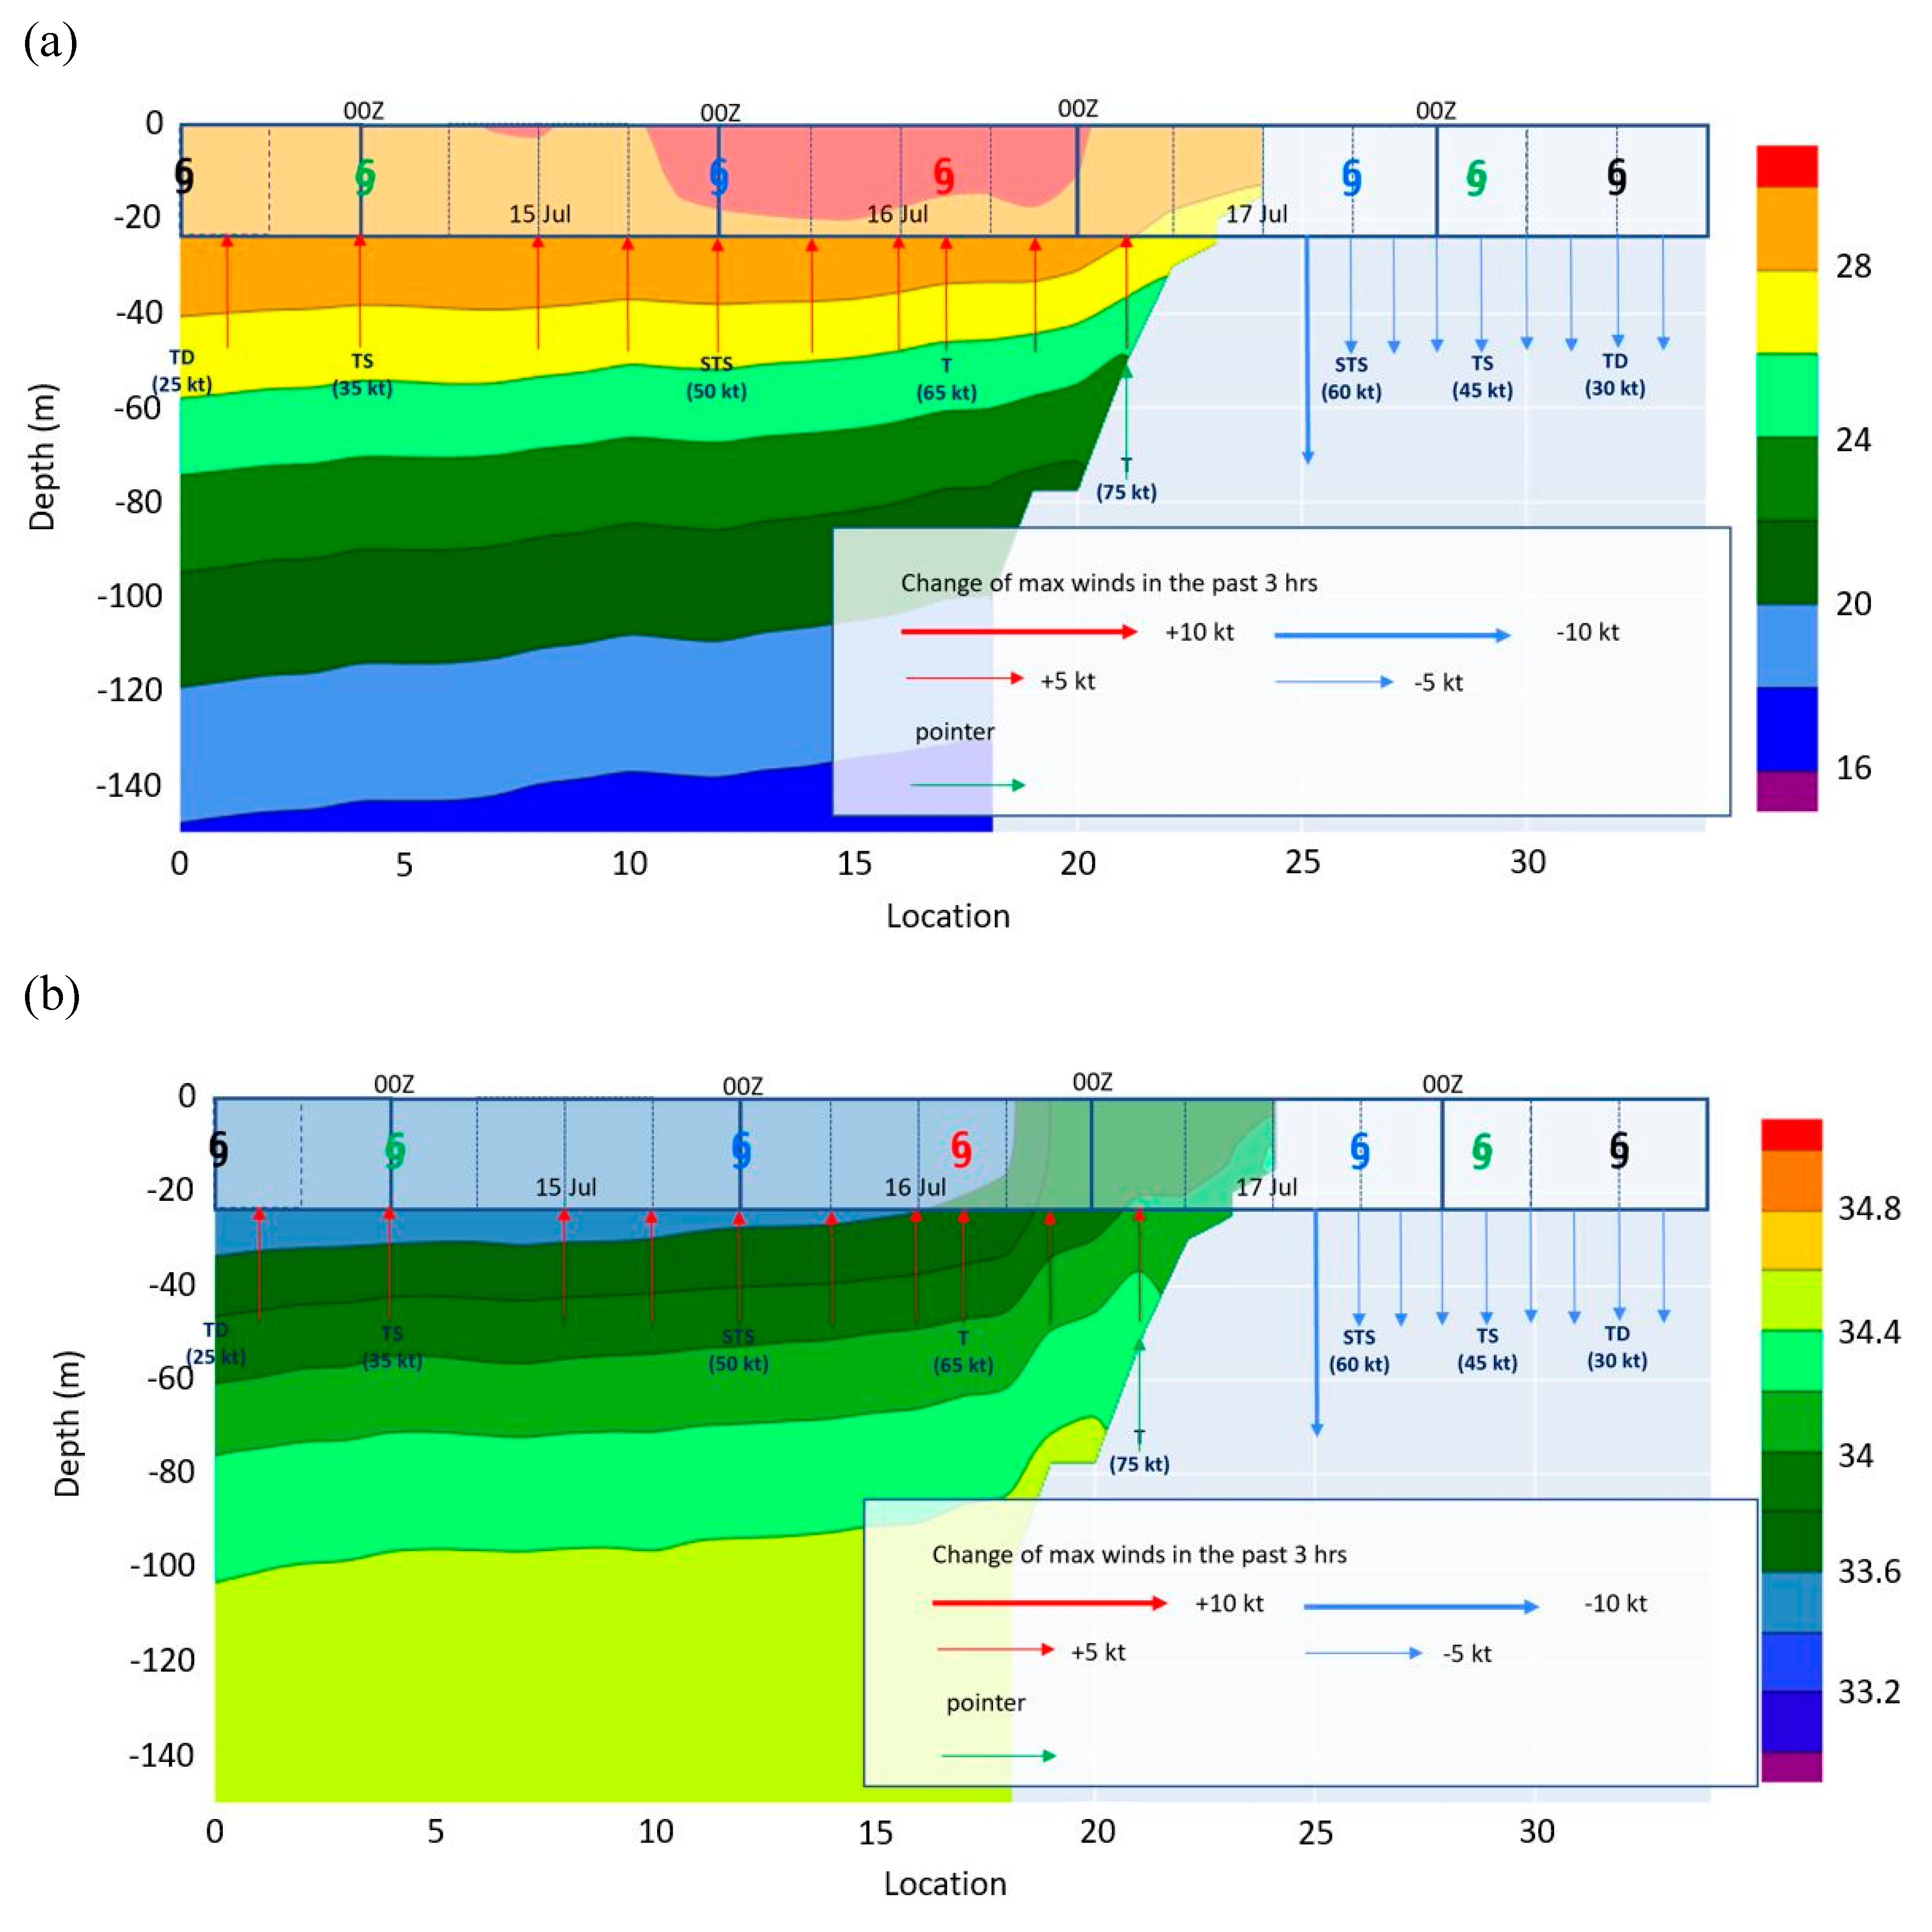
However, like Hato, the SST was rather high in the case of Talim (
Figure 6(a)), reaching 30°C over some parts of its track. The salinity stratification was also relatively strong within the first 100 m or so below the sea surface, with a change of around 1 psu over this depth (
Figure 6(b)). As such, though vertical mixing was expected to occur in this case, the relatively high SST and strong salinity stratification still favoured intensification of Talim to some degree.
3.4. Super Typhoon Saola in September 2023
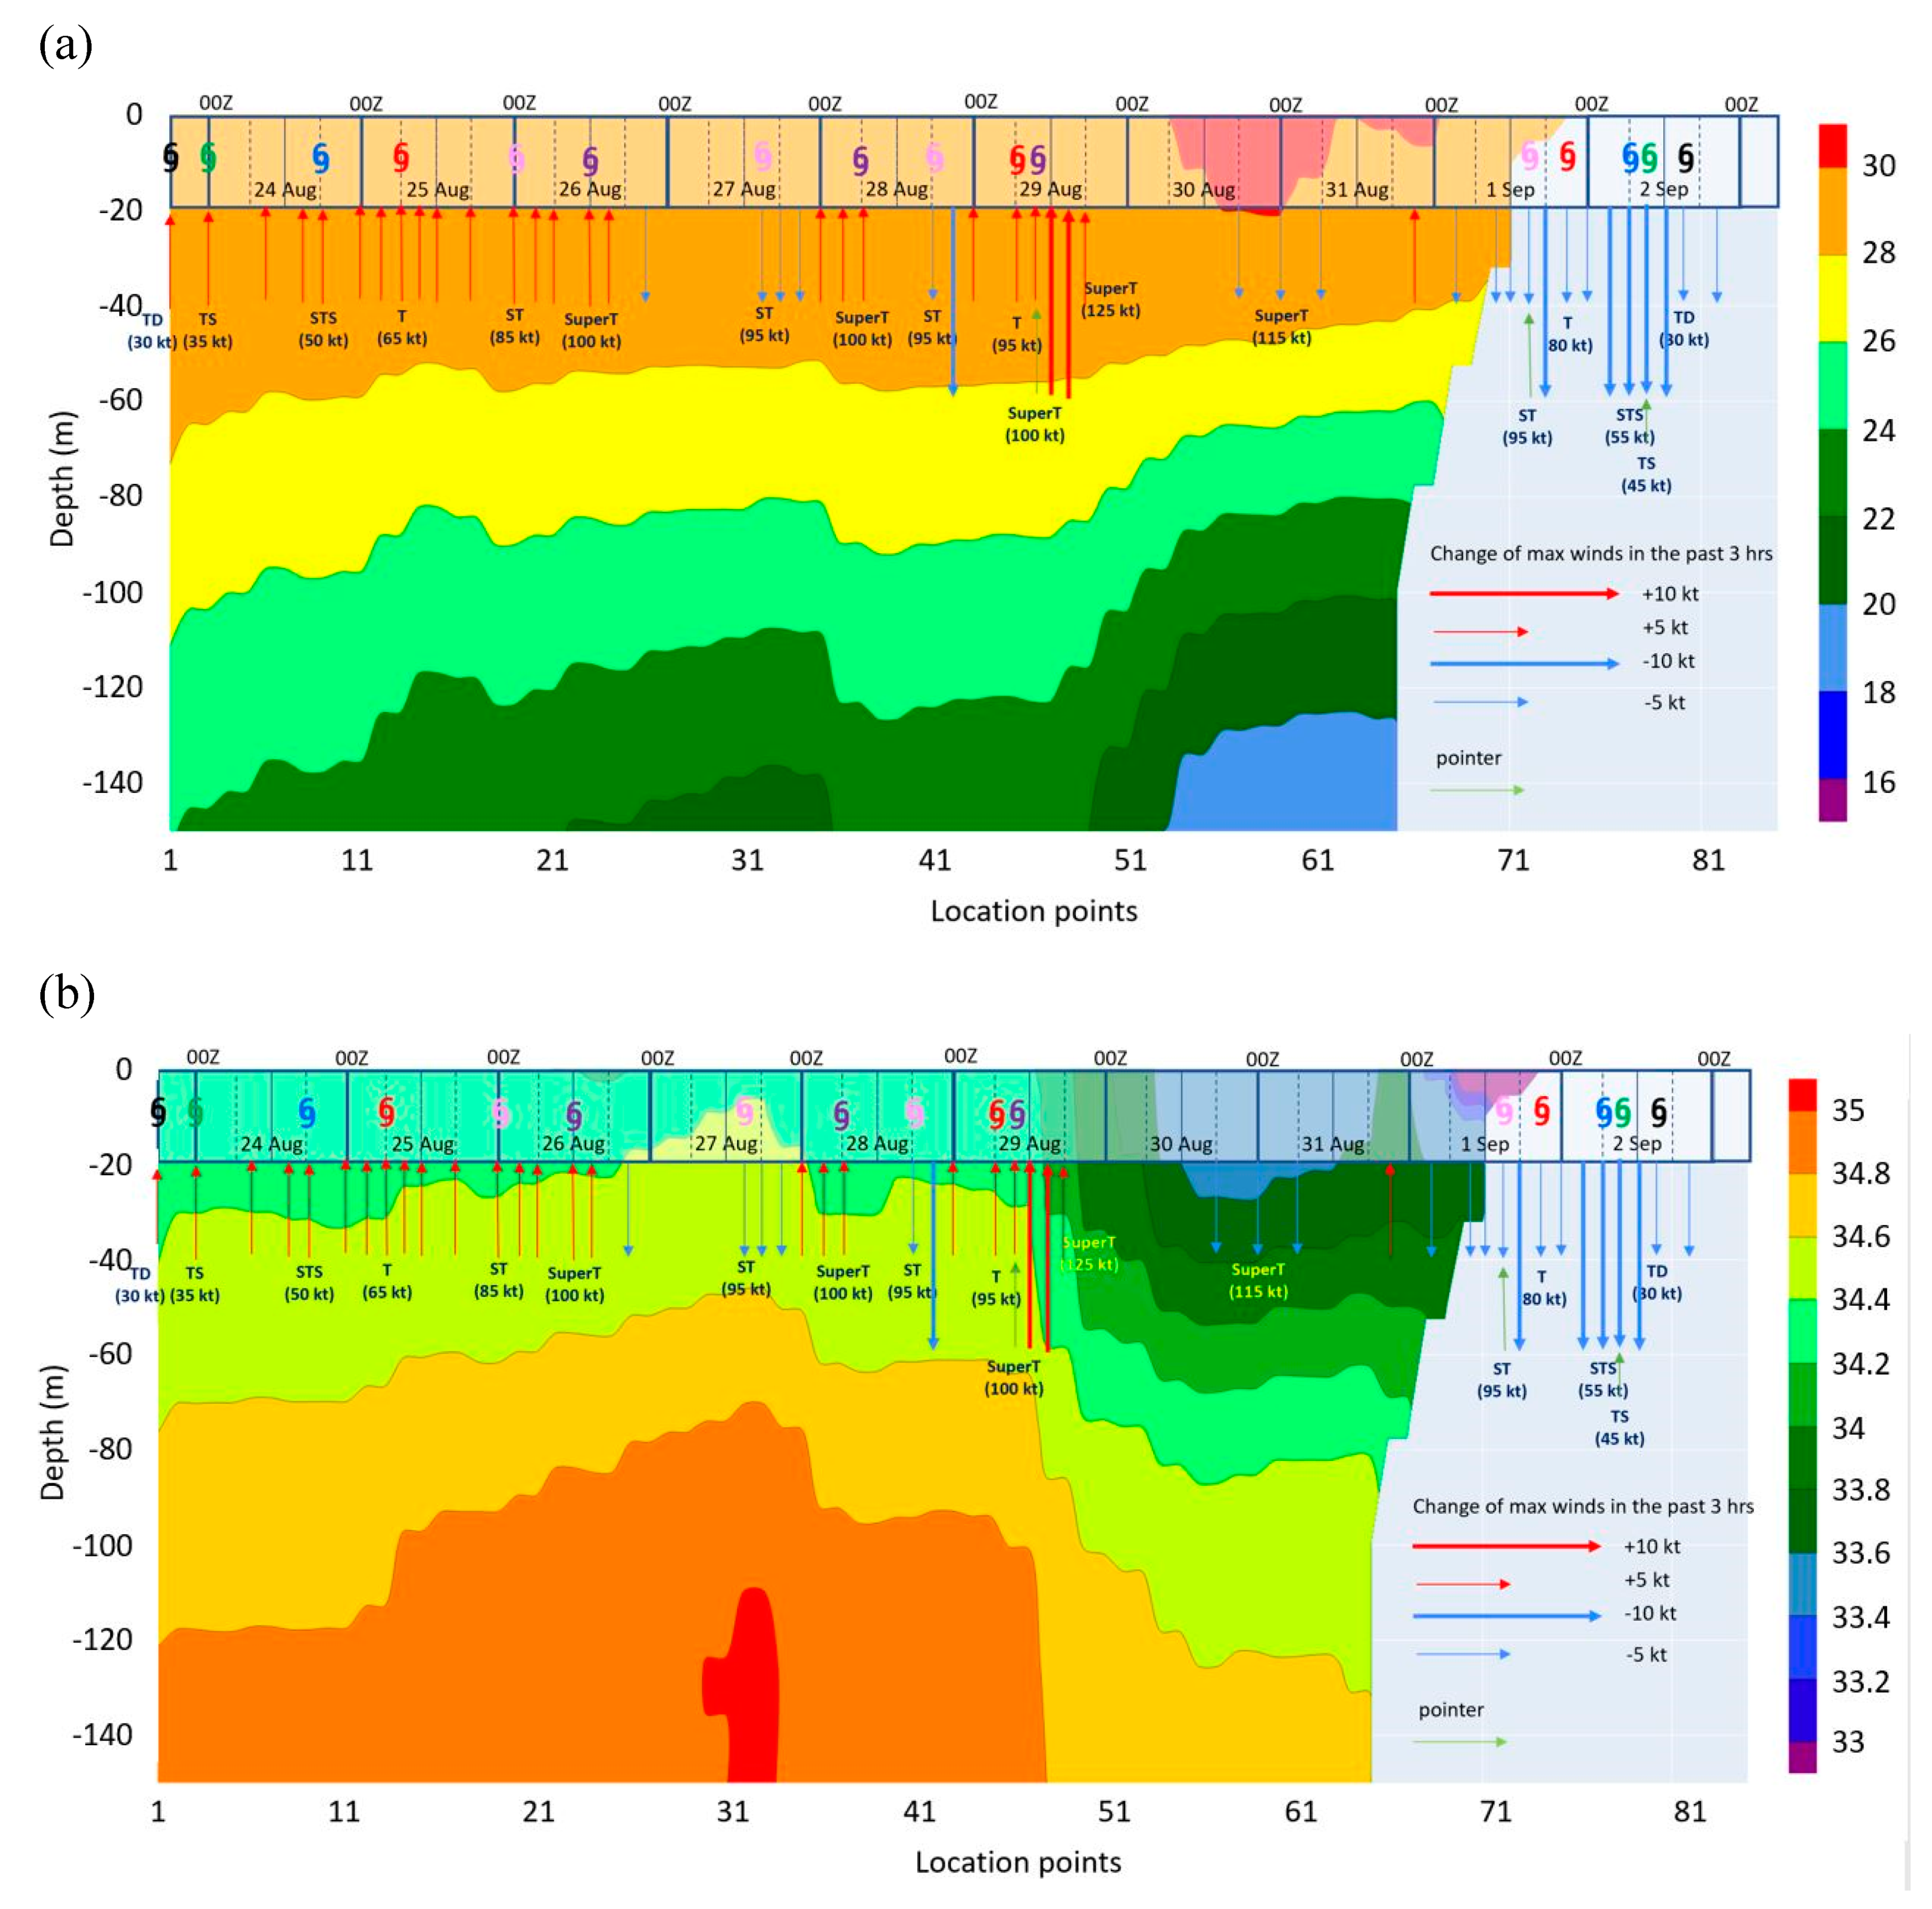
Saola necessitated the issuance of the Hurricane Signal No. 10 again since Super Typhoon Mangkhut hitting Hong Kong in 2018. Saola attained its peak intensity of 120 knots at the SCS, making it the second strongest TC in the SCS since the Hong Kong Observatory’s records began in 1950. It brought high winds to Hong Kong. Some documentation of the observation and forecasting of Saola could be found in Chan et al. (2023), He et al. (2023) and Lau et al. (2024). The sea temperature and salinity profiles along the track of Saola are given in
Figure 7(a) and 7(b) respectively. In general, the SST was not particularly high in this case, and the salinity stratification was not very strong over the WNP, though Saola intensified gradually, with 3-hourly to 6-hourly intensity increases of around 5 knots. RI occurred twice during the life history of Saola, one between location points 11 and 19 over the WNP near Luzon with an intensity gain of 30 knots in 24 hours and strengthening to a severe typhoon of 85 knots at around 00 UTC 26 August 2023, and another between location points 43 and 49 again near Luzon with an intensity gain of 10 knots in 3 hours and 35 knots in 24 hours, strengthening to a super typhoon of 125 knots. This coincides with the region of sharp gradient of salinity from the WNP to the SCS, and a relatively strong salinity stratification (around 0.8 psu per the first 100 m below sea surface). Over the SCS, the SST was higher and SSS was lower. Saola did not intensity further, but such factors may contribute to the maintenance of Saola at a relatively strong intensity (super typhoon of 115 knots) on approach to the coast of southern China.
3.5. Severe Typhoon Koinu in October 2023
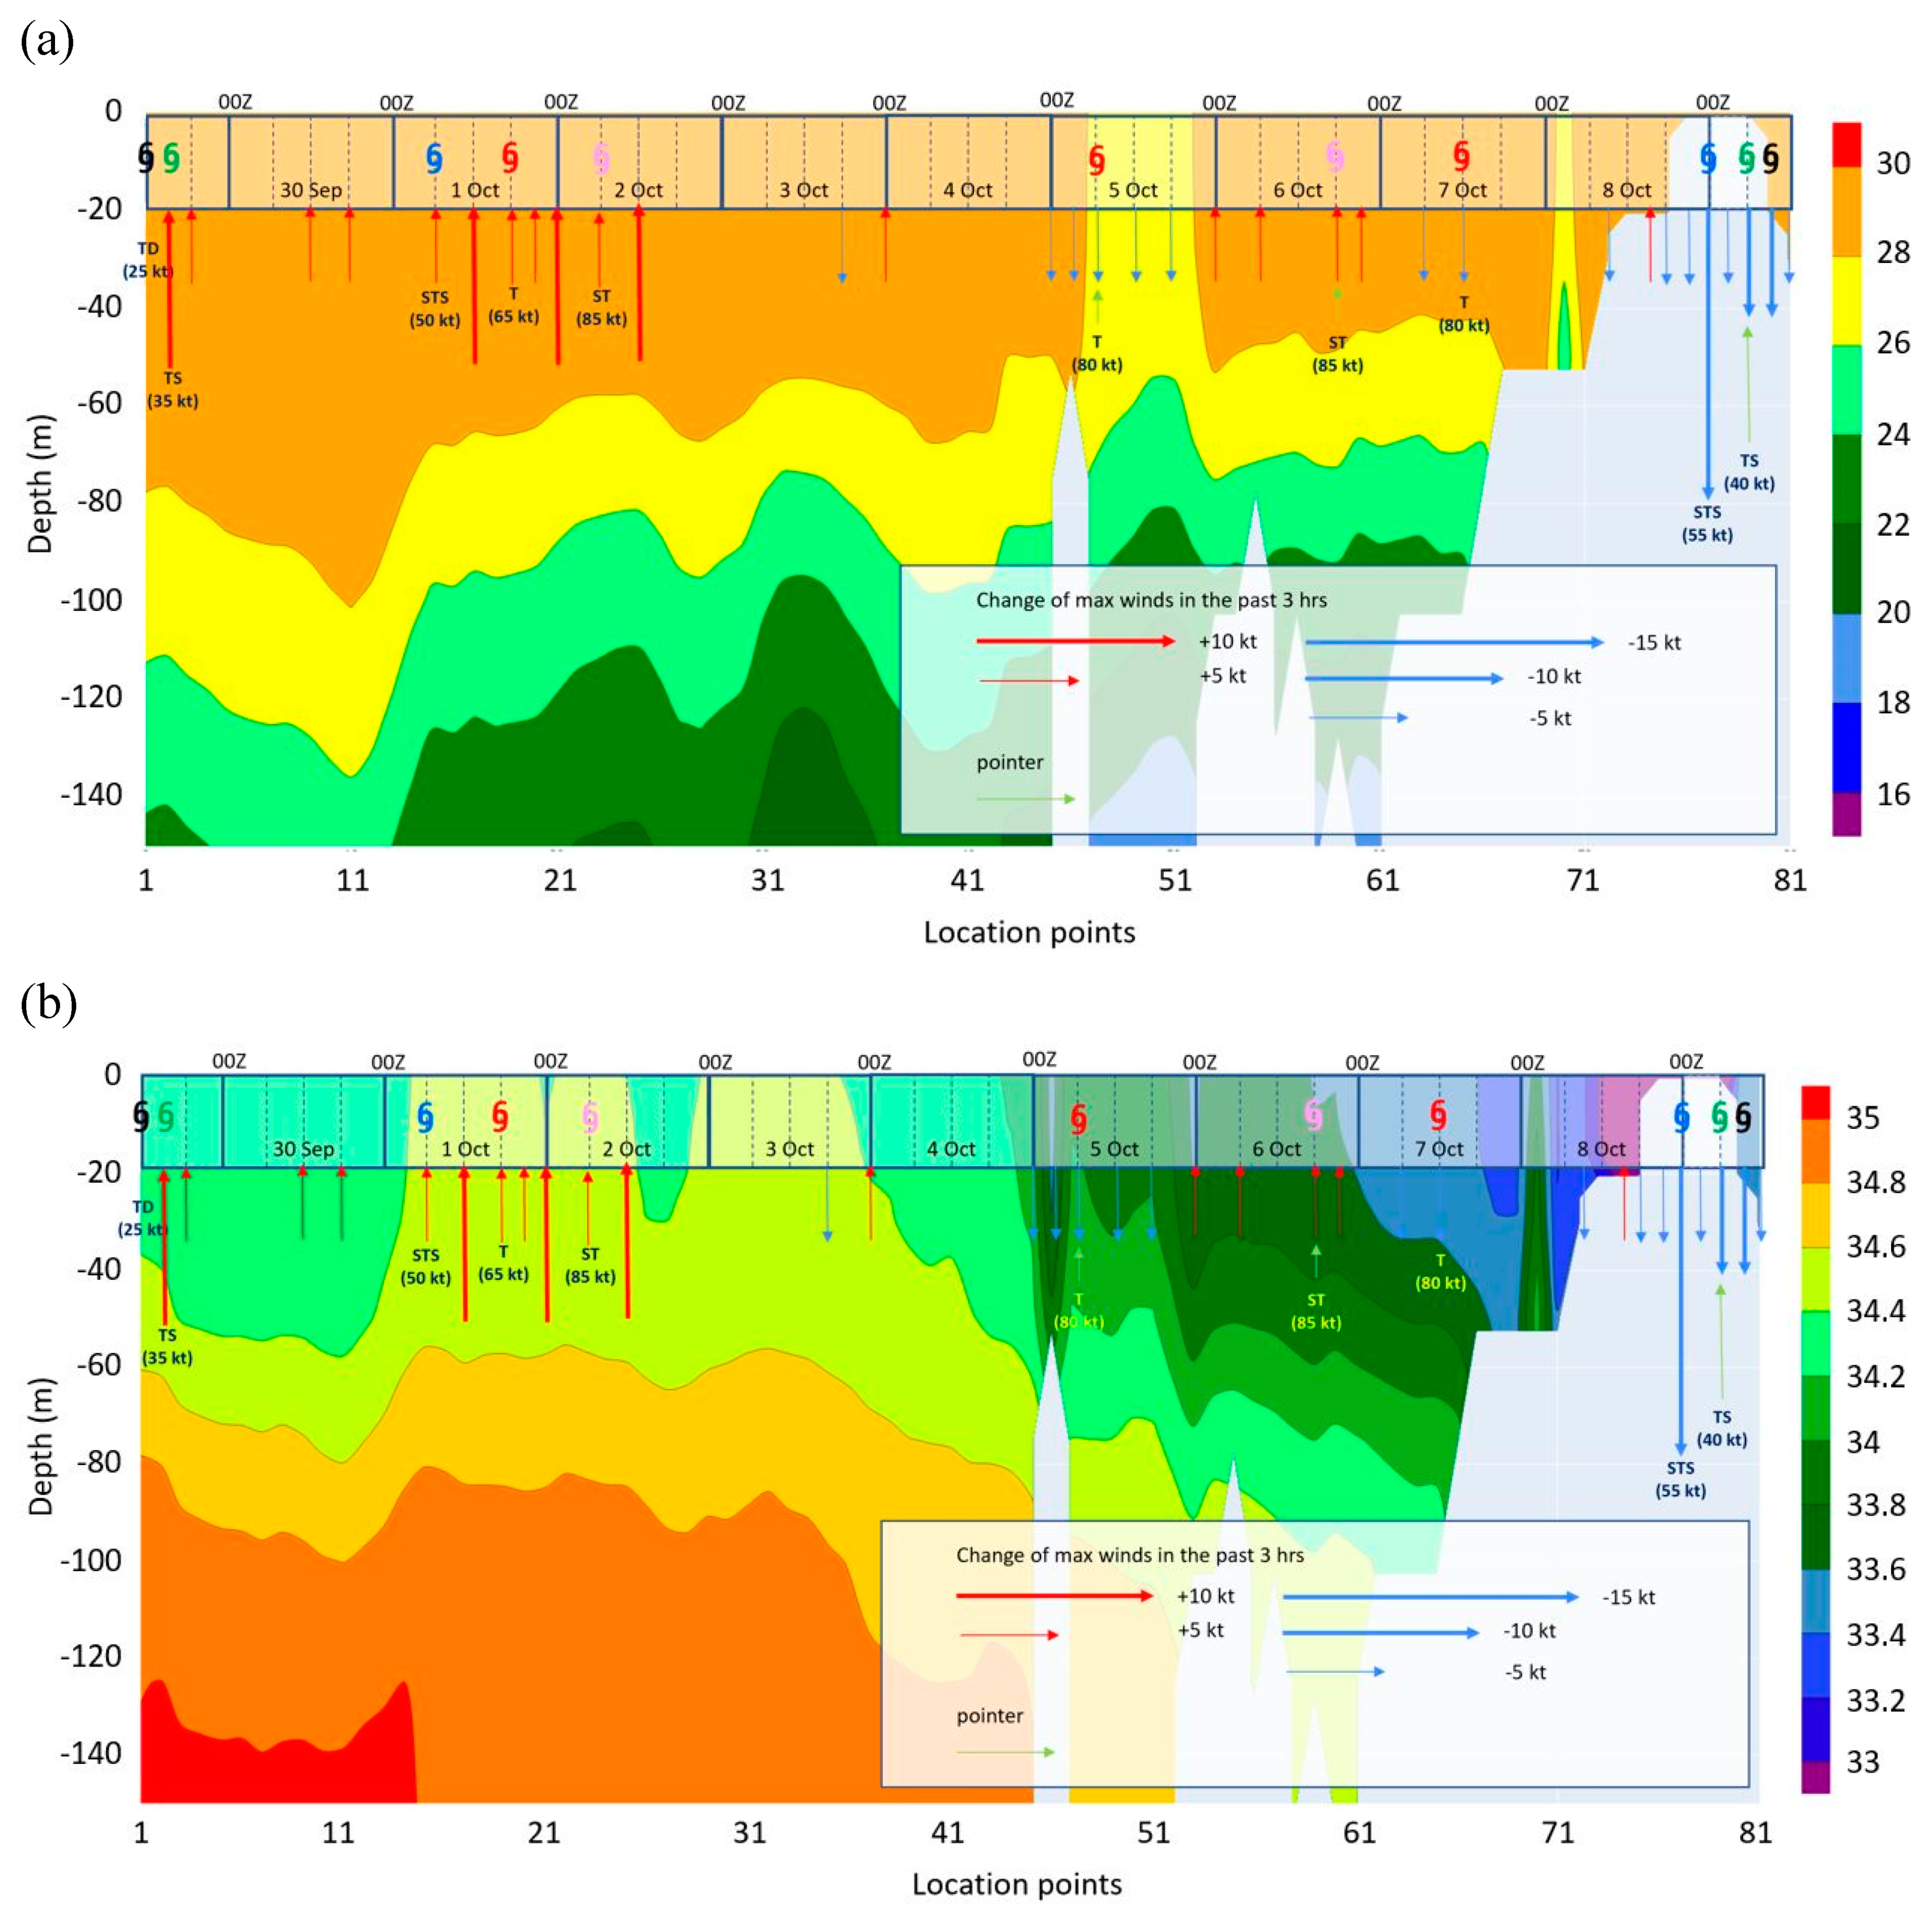
Koinu was not a particularly severe typhoon affecting the south China coastal areas. Some observations of Koinu are summarized in He and Chan (2024). Koinu got a peak intensity of 85 knots over the SCS. Its radius of gale force winds decreased from around 280 km to 85 km when it came close to Hong Kong. The sea temperature and salinity profiles (
Figure 8(a) and 8(b) respectively) do not show up significant features. The SST was slightly below 30°C, and the salinity stratification got a relatively minor value of 0.6 psu over a depth of 100 m. However, RI did occur between location points 17 and 25 over the WNP with an intensity gain of 35 knots in 24 hours and strengthening to a severe typhoon of 95 knots at around 12 UTC 2 October 2023. However, SST was not particularly high over there, and the SSS was rather high (33.4 psu). SST, SSS and salinity stratification may not be the major factors contributing towards the intensification of Koinu. Moreover, the weakening of Koinu at the location points 45 to 51 in the northeastern part of the SCS might be related to the rather low SST, which appears to be related to vertical mixing of sea water. The circulation became increasingly more compact when it moved across the northern part of the SCS. It also interacted with the northeast monsoon prevailing over southern China. The mechanism of the intensity change of Koinu over the SCS required detailed analysis of both dynamical and thermodynamical processes with air-sea interaction at different scales.
4. Summary and Conclusions
From the above case studies of super typhoons over the WNP and the SCS, some major observations are summarized below:
- (a)
Relatively high SST (30 degree Celsius or above) and relatively strong salinity stratification in the first 100 m or so below sea surface (0.8 to 1 psu) may be associated with more rapid intensification of TCs, or at least maintenance of relatively high intensity values;
- (b)
However, the observation in (a). is not found to be a necessary condition – there could be situations with rather rapid intensification of TCs without the occurrence of the observations in (a);
- (c)
Vertical mixing of the sea in the first 100 m or above may inhibit the rapid intensification of TCs, or even lead to the weakening of TCs;
- (d)
SSS of 34 psu or lower or a stratification of 0.5 psu or higher favour RI or maintenance of TC strength;
- (e)
Persistently low SSS and strong stratification in the SCS near the PRD which should be related to the freshwater discharge from rivers and rainwater, noting that PRD is the 29th highest fresh water discharge around the world; and
- (f)
There is a rather sharp gradient of SSS from the WNP to the SCS. However, this does not mean that TCs are going to intensify once entering the SCS. Factors such as salinity stratification and SST still play important roles.
From case studies of major TCs affecting Hong Kong in recent years, it is found that there could be some degree of correlation of intensification/maintenance of relatively high intensity of TCs with salinity profiles over the SCS. SST of 30°C and salinity stratification of 0.8 to 1 psu over a depth of 100 m might be used as a rules-of-thumb for considering in the forecast of TC intensification over this region.
The contributions of various environmental factors including large-scale environmental forcing, thermodynamics and inner-core processes to TC intensity change and RI have not been analysed thoroughly and quantified in the present study. However, this study is the first attempt to document the impact of temperature and salinity profile at a depth of around 150 m for recent intense TCs in the SCS. More statistical analysis of TCs over this basin would be carried out in order to evaluate the probability of RI of TCs which are about to make landfall over the south China coast.
References
- Adcroft, A.; Campin, J.; Hill, C.; Marshall, J. Implementation of an atmosphere-ocean general circulation model on the expanded spherical cube. Mon. Weather Rev. 2004, 132, 2845–2863. [Google Scholar] [CrossRef]
- Arbic, B.K. , Alford, M.H., Ansong, J.K., Buijsman, M.C. et al. A primer on global internal tide and internal gravity wave continuum modelling in HYCOM and MITgcm. In Chassignet, El, A. Pascual, J.J. Tintorė, Verron (Eds.), New Frontiers in Operational Oceanography. GODAE Ocean View, 2018; pp. 307-392.
- Balaguru, K. , Chang, P., Saravanan, R., Leung, L.R., Xu, Z., Li. M. & Hsieh, J.-S. Ocean barrier layers’ effect on tropical cyclone intensification. Proc. Natl. Acad. Sci. U.S.A. 2012, 109, 14343–14347. [Google Scholar] [PubMed]
- Balaguru, K. , Foltz, G.R. & Leung, L.R. Increasing magnitude of hurricane rapid intensification in the central and eastern tropical atlantic. Geophy. Res. Lett. 2018, 45, 4238–4247. [Google Scholar]
- Balaguru, K. , Foltz, G.R., Leung, J.R., Kaplan, J., Xu, W., Reul, N. & Chapron, B. Pronounced impact of salinity on rapidly intensifying tropical cyclones. Bull. Am. Meteorol. Soc. 2020, 101, E1497–D1511. [Google Scholar] [CrossRef]
- Bhatia, K.T. , Vecchi, G.A., Knutson, T.R., Murakami, H., Kossin, J., Dixon, K.W. & Whitlock, C.E. Recent increases in tropical cyclone intensification rates. Nat. Commun. 2019, 10, 635. [Google Scholar] [CrossRef]
- Bhatia, K. , Baker, A., Yang, W.C., Vecchi, G., Knutson, T., Murakami, H., Kossin, J., Hodges, K., Dixon, K., Bronselaer, B. & Whitlock, C. A potential explanation for the global increase in tropical cyclone rapid intensification. Nat. Commun. 2022, 13, 6626. [Google Scholar] [CrossRef] [PubMed]
- Chan, P.W. , Choy, C.W. & Chiu, Y.Y. Observational study of Super Typhoon Saola in 2023 when it was close to Hong Kong. Y. Observational study of Super Typhoon Saola in 2023 when it was close to Hong Kong. Preprints 2023, 2023091688. [Google Scholar] [CrossRef]
- Chen, J.L. , Wang, Z. Q., Tam, C.Y., Lau, N.C., Lau, D.S & Mok, H.Y. Impacts of climate change on tropical cyclones and induced storm surges in the Pearl River Delta region using pseudo-global-warming method. Sci. Rep. 2020, 10, 1965. [Google Scholar] [CrossRef]
- Choy, C. W. , Lau, D.S. & He, Y.H. Super typhoons Hato and Mangkhut, part I: analysis of maximum intensity and wind structure. Wea 2020, 77, 314–320. [Google Scholar] [CrossRef]
- Fan, K. , Wang X. & He, Z. Control of salinity stratification on recent increase in tropical cyclone intensification rates over the postmonsoon Bay of Bengal. Control of salinity stratification on recent increase in tropical cyclone intensification rates over the postmonsoon Bay of Bengal. Environ. Res. Lett. 2020, 15. [Google Scholar] [CrossRef]
- Fekete, B.M. , Vörösmarty, C.J., Grabs, W. High-resolution fields of global runoff combining observed river discharge and simulated water balances. Global Biogeochem. Cycl. 2002, 16, 15–1. [Google Scholar] [CrossRef]
- Fu, H.L. , Dan, B., Gao, Z.G., Wu, X.R., Chao, G.F., Zhang, L.X., Zhang, Y.Q., Liu, K.X., Zhang, X.S. & Li, W. Global ocean reanalysis CORA2 and its inter comparison with a set of other reanalysis products. Front. Mar. Sc. 2023, 10, 1084186. [Google Scholar] [CrossRef]
- Garcia, H. E. , Boyer, T.P., Locarnini, R.A., Baranova, O.K., Zweng, M.M. (2018) World Ocean Database 2018: User’s Manual (prerelease). A.V. Mishonov, Technical Ed., NOAA, Silver Spring, MD Available at https://www.nodc.noaa.gov/OC5/WOD/pr_wod.
- Griffin, S. M. , Wimmers, A., Velden, C.S. Predicting rapid intensification in North Atlantic and eastern North Pacific tropical cyclones using a convolutional neural network. Weather Forecast. 2022, 37, 1333–1355. [Google Scholar] [CrossRef]
- Grodsky, S.A. , Reul, N., Lagerloef, G., Reverdin, G., Carton, J.A., Chapron, B., Quilfen, Y., Kudryavtsev, V.N. & Kao, H.Y. Haline hurricane wake in the Amazon/Orinoco plume: AQUARIUS/SACD and SMOS observations. Geophys. Res. Lett. [CrossRef]
- Harada, Y. , Kamahori, H., Kobayashi, C., Endo, H., Kobayashi, S., Ota, Y., Onoda, H., Onogi, K., Miyaoka, K. & Takahashi, K. The JRA-55 Reanalysis: Representation of atmospheric circulation and climate variability. J. Meteor. Soc. Japan 2016, 94, 269–302. [Google Scholar] [CrossRef]
- Harper, B.A. , Kepert, J.D. & Ginger, J.D. (2010) Guidelines for converting between various wind averaging periods in tropical cyclone conditions. WMO/TD-.
- He, J.Y. , Chan, P.W., Chan Y.W. & Cheung, P. Super Typhoon Saola (2023) over the northern part of the South China Sea – Aircraft data analysis. Atmosphere 2023, 14, 1595. [Google Scholar] [CrossRef]
- He, Y.H. & Chan, P. W. Challenges in the Forecasting of Severe Typhoon Koinu in 2023. Atmosphere 2024, 15, 31. [Google Scholar] [CrossRef]
- Hong, J.; Wu, Q. Modulation of global sea surface temperature on tropical cyclone rapid intensification frequency. Environ. Res. Commun. 2021, 3, 041001. [Google Scholar] [CrossRef]
- Huang, Y.Y. , Zhang, Y. J. ( Vol. 106, 101431. [CrossRef]
- Kaplan, J. & DeMaria, M. (2003) Large-scale characteristics of rapidly intensifying tropical cyclones in the North Atlantic basin. Weather Forecast., 18, 1093-1108. [CrossRef]
- Kaplan, J. , DeMaria M.; Knaff, J.A. A revised tropical cyclone rapid intensification index for the Atlantic and eastern North Pacific basins. Weather Forecast. 2010, 25, 220–241. [Google Scholar] [CrossRef]
- Kim, S.H. , Lee, W.J., Kang, H.W. & Kang, S.K. Predicting rapid intensification of tropical cyclones on the western North Pacific: a machine learning and net energy gain rate approach. Front. Mar. Sci. [CrossRef]
- Kishtawal, C.M. , Jaiswal, N., Singh, R. & Niyogi, D. Tropical cyclone intensification trends during satellite era (1986-2010). Geophys. Res. Lett. 2012, 39, L10810. [Google Scholar] [CrossRef]
- Kobayashi, S. , Ota, Y., Harada, Y., Ebita, A, Moriya, M., Onoda, H., Onogi, K., Kamahori, H., Kobayashi, C., Endo, H., Miyaoka, K., Takahashi, K. The JRA-55 reanalysis: general specifications and basic characteristics. J. Meteor. Soc. Japan 2015, 93, 5–48. [Google Scholar] [CrossRef]
- Large, W.G. & Pond, S. Open ocean momentum flux measurements in moderate to strong winds. J. Phys. Oceanogr. 1981, 11, 324–336. [Google Scholar]
- Lau, D.S. , Chan, W.S., Wong, Y.C., Lam, C.C. & Chan, P.W. Hindcast insights from storm surge forecasting of Super Typhoon Saola (2309) in Hong Kong with the Sea, Lake and Overland Surges from Hurricanes Model. Atmosphere 2024, 15, 17. [Google Scholar] [CrossRef]
- Liu, K.S. & Chan, J.C.L. Growing threat of rapidly-intensifying tropical cyclones in East Asia. Adv. Atmos. Sc. 2022, 39, 222–234. [Google Scholar]
- Li, Y. , Tang, Y., Wang, S., Toumi, R., Song, X.Z. & Wang, Q. Recent increases in tropical cyclone rapid intensification events in global offshore regions. Nat. Commun. 2023, 14, 5167. [Google Scholar] [CrossRef] [PubMed]
- Lin, I-I, Pun, I. F. & Wu, C.C. Upper ocean thermal structure and the western North Pacific category-5 typhoons part II: dependence on translation speed. Mon. Wea. Rev. 2009, 137, 3744–3757. [Google Scholar]
- 33. Lin, I-I, Chen, C.H., Pun, I.F., Liu, W.T. & Wu, C.C. Warm ocean anomaly, air sea fluxes, and the rapid intensification of tropical cyclone Nargis (2008). Geophys. Res. Lett.
- Lin, I-I. , Goni, G.J., Knaff, J.A., Forbes, C. & Ali, M.M. Ocean heat content for tropical cyclone intensity forecasting and its impact on storm surge. Nat Hazards 2013, 66, 1481–1500. [Google Scholar] [CrossRef]
- Marshall, J. , Adcroft, A., Hill, C., Perelman L. & Heisey, C. A finite volume, incompressible Navier-Stokes model for studies of the ocean on parallel computers. J. Geophys. Res. 1997, 102, 5753–5766. [Google Scholar]
- Mei, W. & Xie, S.-P. Intensification of landfalling typhoons over the northwest Pacific since the late 1970s. Nat. Geosci. 2016, 9, 753–757. [Google Scholar] [CrossRef]
- Pujol, M. , Faugėre, Y., Taburet, G., Dupuy, S., Pelloquin, C., Ablain, M. et al. DUACS DT2014: the new muti-mission altimeter data set reprocessed over 20 years. Ocean Sci. 2016, 12, 1067–1090. [Google Scholar] [CrossRef]
- Reynolds, R. , Smith, T., Liu, C., Chelton, D., Casey, K. & Schlax, M. Daily high-resolution-blended analysis for sea surface temperature. J. Cli. 2007, 20, 5473–5496. [Google Scholar] [CrossRef]
- Scharroo, R. , Smith, W.H.F., Lillibridge, J.L. Satellite altimetry and the intensification of Hurricane Katrina. Eos Trans AGU 2005, 86, 366. [Google Scholar] [CrossRef]
- Song, J. , Duan, Y. & Klotzbach, P.J. Increasing trend in rapid intensification magnitude of tropical cyclones over the western North Pacific. Environ. Res. Lett. 2020, 15, 084043. [Google Scholar]
- Tam, H.F. , Choy, W.C. & Wong, W.K. Development of objective forecast guidance on tropical cyclone rapid intensity change. Meteorol Appl. 2021, 28, e1981. [Google Scholar] [CrossRef]
- Wei, Y. , Yang, R., Sun, D. Investigating tropical cyclone rapid intensification with an advanced artificial intelligence system and gridded reanalysis data. Atmosphere 2023, 14, 195. [Google Scholar] [CrossRef]
- 43. WMO (2017) Global Guide to Tropical Cyclone Forecasting. WMO-No.
- Xu, W. , Balaguru, K., August, A., Lalo, N., Hodas, N., DeMaria, M. et al. Deep learning experiments for tropical cyclone intensity forecasts. Weather Forecast 2021, 36, 1453–1470. [Google Scholar] [CrossRef]
- Zhao, H. , Duan, X., Raga, G.B. & Klotzbach, P.J. Changes in characteristics of rapidly intensifying western North Pacific tropical cyclones related to climate regime shifts. J. Clim. 2018, 31, 8163–8179. [Google Scholar]
|
Disclaimer/Publisher’s Note: The statements, opinions and data contained in all publications are solely those of the individual author(s) and contributor(s) and not of MDPI and/or the editor(s). MDPI and/or the editor(s) disclaim responsibility for any injury to people or property resulting from any ideas, methods, instructions or products referred to in the content. |
© 2024 by the authors. Licensee MDPI, Basel, Switzerland. This article is an open access article distributed under the terms and conditions of the Creative Commons Attribution (CC BY) license (http://creativecommons.org/licenses/by/4.0/).
