1. Introduction
Antibiotics have increased life expectancy, improved the quality of human life, and significantly contributed to animal health and livestock production efficiency in recent decades. Despite these advantages, the widespread use of antibiotics has led to growing levels of antimicrobial resistance (AMR), in particular to first-line antibiotics [
1]. Antimicrobial resistance poses a significant global problem in both human and veterinary medicine [
2]. To address this issue, the use of subtherapeutic doses of antibiotics as growth promoters in animal nutrition was banned in the European Union (EU) already in 2003 (Regulation (EC) No. 1831/2003 of the European Parliament and of the Council of 22 September 2003 on additives for use in animal nutrition) [
3]. Despite the advantages of restricted antibiotic use in animal production, antimicrobials are still used in the treatment of many infectious diseases in humans and animals.
Numerous efforts are being made to develop alternative treatments that could effectively replace antibiotics used for growth promotion and disease prevention, thus protecting human and animal health and minimizing the risk of infections [
4,
5]. Numerous protocols and methods for eliminating pathogenic microorganisms have been proposed, including immunotherapeutic methods (involving monoclonal antibodies that target specific pathogens and toxins without affecting the entire microbiome) [
6], immunomodulation (to stimulate the host's immune response) [
7,
8,
9,
10,
11], vaccines (vaccination programs can significantly decrease the prevalence of infectious diseases in human and animal populations) [
6], alternative antimicrobial treatments (such as antimicrobial peptides, silver nanoparticles, and other unconventional compounds that can provide an effective alternative to antibiotics in medicine and agriculture) [
12], bacteriophage therapy (involving viruses that selectively target and eliminate bacteria) [
13], as well as probiotics, prebiotics, symbiotics, and postbiotics (which stimulate the natural microbiome or exhibit anti-inflammatory, immunomodulatory or other activities) [
14].
Probiotic preparations can be easily administered to animals as feed additives, and they continue to attract growing interest in the livestock industry. Probiotics are beneficial microorganisms (mostly bacteria) that have been divided into three main groups based on their type and origin. Lactic acid bacteria (LAB), including
Lactobacillus spp. (such as
L. acidophilus,
L. casei, and
L. rhamnosus),
Bifidobacterium spp. (such as
B. bifidum,
B. breve, and
B. longum), and
Streptococcus spp. (such as
S. thermophilus) constitute the largest group of probiotics [
15]. The second group consists of
Saccharomyces boulardii yeasts [
16], and the third group comprises other microorganisms, including
Bacillus coagulans,
Escherichia coli Nissle 1917 (Mutaflor),
Enterococcus faecium, and
Propionibacterium freudenreichii [
17].
Probiotics deliver numerous benefits for the host organism. Their earliest recognized benefits include increased resistance to infections, stimulation of the immune system, and nutrient synthesis [
18], whereas anticarcinogenic [
19], antioxidant [
20], anti-inflammatory [
21], modulatory [
22], and antibacterial [
23] effects of probiotics have been described only recently. Preliminary research has shown that probiotics may possess antimicrobial activity, but their clinical efficacy in treating infections has not been extensively studied [
24]. However, there is evidence to indicate that probiotics can be useful in the prevention and treatment of infectious diseases [
25].
Probiotics exert numerous effects on the gastrointestinal tract (GIT) and gut-associated lymphoid tissue (GALT) which modulate intestinal function and immune responses by enhancing activation, adjustment, or tolerance [
26,
27]. Probiotics produce many bactericidal compounds that eliminate pathogens, adhere to the intestinal epithelium, and interact with pathogens and their toxins. Probiotics enhance the viability of epithelial cells, improve barrier defences and the immune response of the intestinal epithelium, thus promoting the homeostasis of gastrointestinal mucosa [
28].
However, the efficacy of probiotics can vary because probiotic strains may differ in their ability to stimulate immune processes, thus delivering different health benefits.
The aim of this study was to evaluate the effect of a multi-strain probiotic formulation containing three Lactobacillus strains (Lactobacillus plantarum AMT14, Lactobacillus plantarum AMT4, and Lactobacillus rhamnosus AMT15) and the Bifidobacterium animalis AMT30 strain on selected parameters of cellular innate immunity (phagocytosis and oxidative burst of peripheral blood granulocytes and monocytes) in lambs.
3. Discussion
The use of probiotics as feed additives in both monogastric and polygastric animals is not a new concept. For many years, researchers have been investigating the mechanism of action by which probiotics deliver health benefits and improve feed efficiency and performance in various animal species. These research efforts have been intensified in recent years, probably due to the continuous search for natural alternatives to antibiotics. In addition, research has shown that the efficacy of probiotics differs not only across microbial strains, but also across the supplemented macroorganisms.
In healthy adults, the commensal gut microbiome consists of various microorganisms that colonize a specific segment of the gastrointestinal tract [
29,
30]. These microorganisms can survive under changing environmental conditions because they strongly adhere to the intestinal epithelium and cannot be easily eliminated from the body [
31]. These microorganisms not only strengthen local immune defences against infection (GALT), but also modulate the systemic immune response. Microbe-specific molecules, including microbe-associated molecular patterns (MAMPs), their metabolites, and other signalling molecules, are released in the intestines and transferred from the intestinal lumen to the circulatory system. These molecules stimulate immunocompetent cells and prepare them for potential pathogen invasion [
30,
32]. However, the gut microbiome undergoes numerous changes, in particular in newborns, under the influence of both external and internal factors. In suckling animals, the digestive system is not yet fully colonized by healthy microbiota, and the immune system is not yet fully developed, which makes them more susceptible to infections than adult organisms [
33]. Weaning and the transition from mother's milk to concentrate feed is one of the critical moments in the early life of mammals, including lambs. Weaning often induces changes in immune system function, which can increase the prevalence of disease and decrease performance in lambs. The negative effects of weaning can be minimized by supplementing lamb diets with various probiotic strains. Dietary supplementation usually promotes gut colonization by commensal strains that increase intestinal barrier integrity, alleviate inflammations, and decrease the number of foreign particles in circulating blood, such as bacteria, viruses, dead cells, and other undesirable substances [
32].
Phagocytosis, a key mechanism of cellular innate immunity, is one of the processes that is responsible for removing these antigens from the body. Phagocytosis involves phagocytes that are able to identify and eliminate foreign and infected cells. These cells include both professional phagocytes (polymorphonuclear neutrophils, monocytes, monocyte-derived macrophages, and tissue-resident macrophages) and non-professional phagocytes (epithelial cells, fibroblasts, and dendritic cells). Professional phagocytes are rapidly mobilized and accumulate in large numbers in the site of infection. In turn, non-professional phagocytes are less effective, have a limited range of target particles, and eliminate antigens less rapidly than professional phagocytes [
4,
34]. Phagocytosis is a multi-stage process that is initiated by pattern recognition receptors (PRRs), including dectin-1, toll-like receptor 2 (TLR-2), complement receptor 3 (CRS3), lactosylceramide (CDw17), class A scavenger receptors (SRs), SR-A/CD204, macrophage receptor with collagenous structure (MARCO), and probably other receptors that can identify and bind specific pathogen-associated molecular patterns (PAMPs) or microorganisms [
35,
36]. A phagocyte engulfs the targeted molecule and forms a phagosome which then fuses with a lysosome to create a phagolysosome. The following intracellular killing mechanisms are initiated: non-oxidative mechanisms (not dependent on oxygen), such as the activation of basic proteins and hydrolytic enzymes, and oxidative (oxidative burst) mechanisms that produce ROS. During digestion, enzymes decompose foreign particles into simple chemical compounds that are removed from the phagocyte. In some cases, especially when phagocytes engulf bacteria and viruses, cells present fragments of foreign proteins (epitopes) on their surface. As a result, other immune cells can identify foreign particles and initiate the immune response [
37].
The tested multi-strain probiotic formulation (Lactobacillus plantarum AMT14, Lactobacillus plantarum AMT4, Lactobacillus rhamnosus AMT15, and Bifidobacterium animalis AMT30) was selected for the study because the effects of these bacterial strains on selected stages of phagocytosis in lambs have never been investigated in the literature. These Lactobacillus and Bifidobacterium strains are undoubtedly most widely used as supplements and additives in human and animal diets worldwide. They deliver numerous health benefits by exerting antibacterial, antiviral, and antifungal effects, and by decreasing pathogens' ability to bind to host receptors. However, immune response regulation appears to be the key mechanism by which these probiotics affect the host organism.
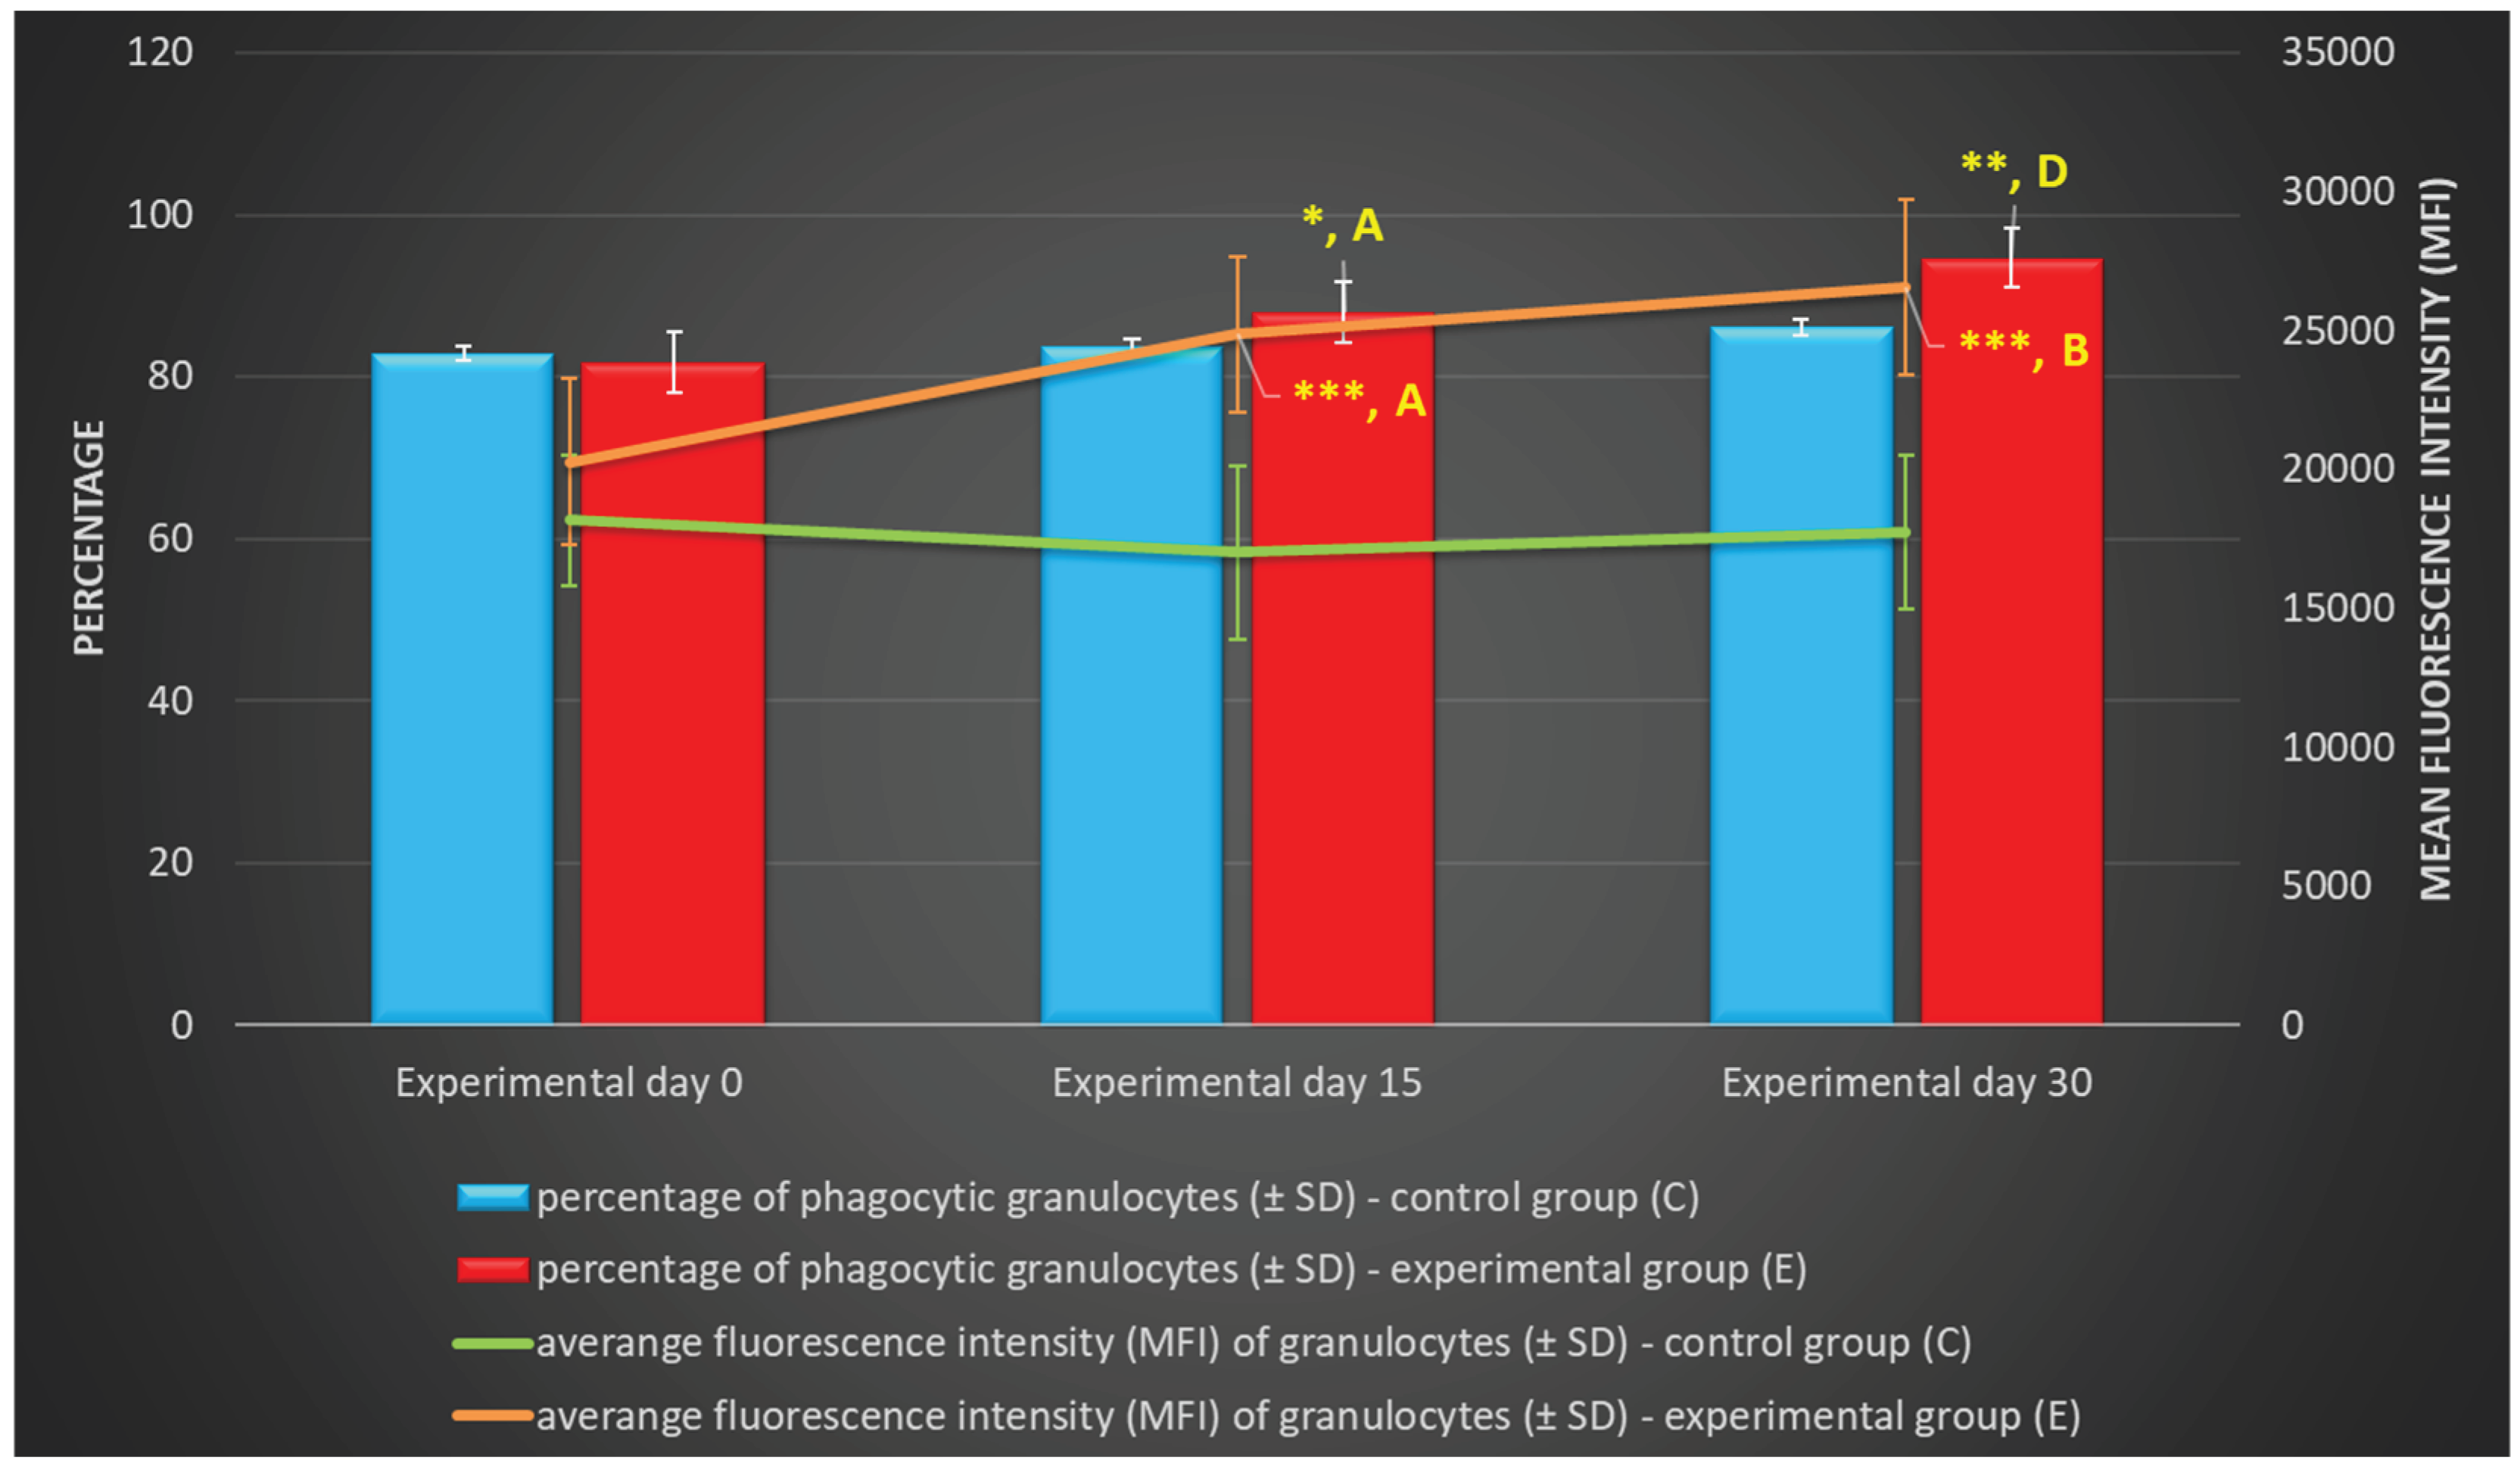
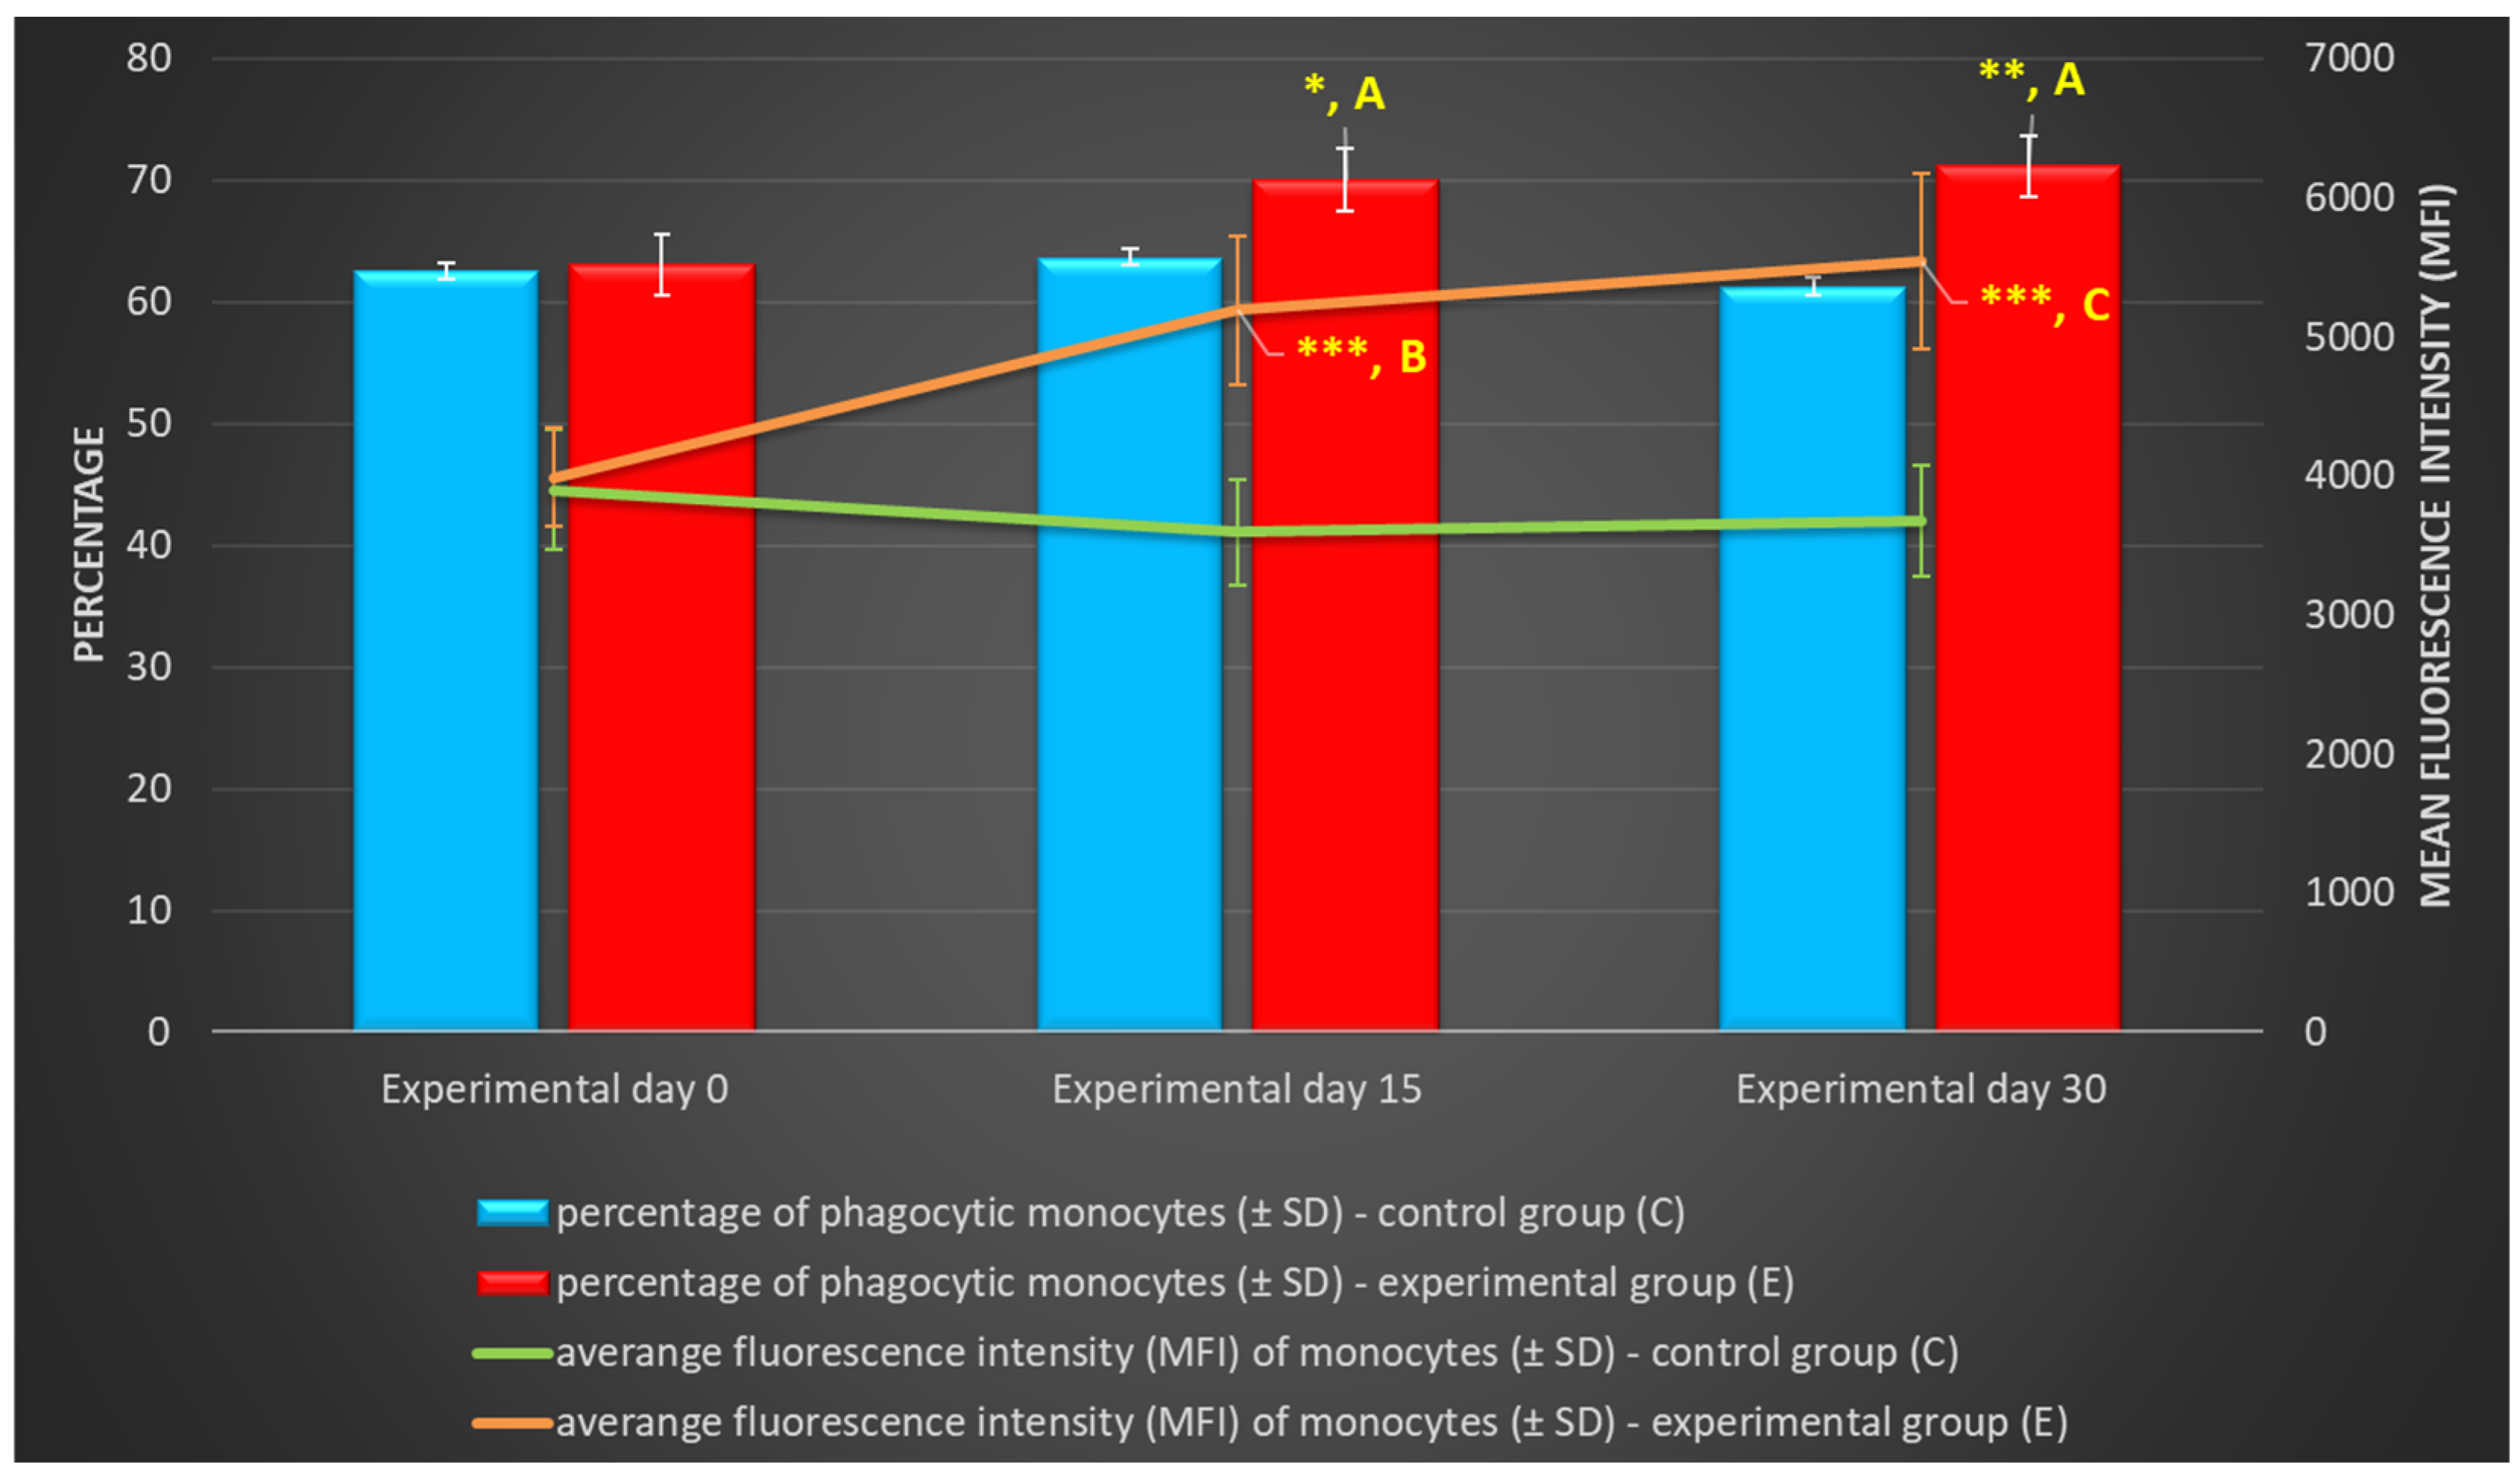
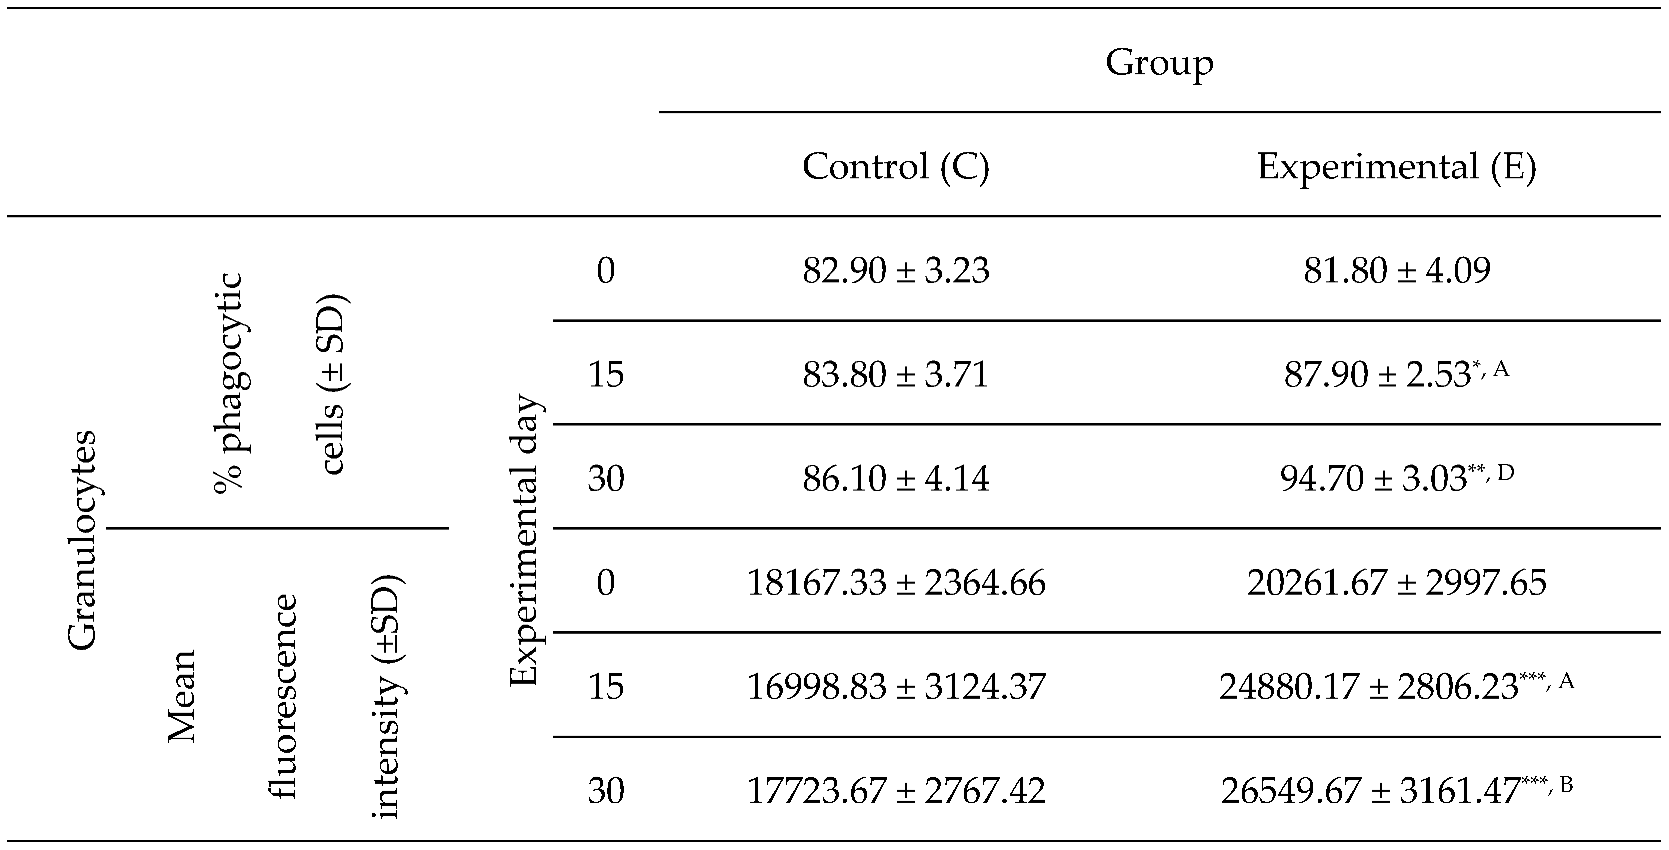
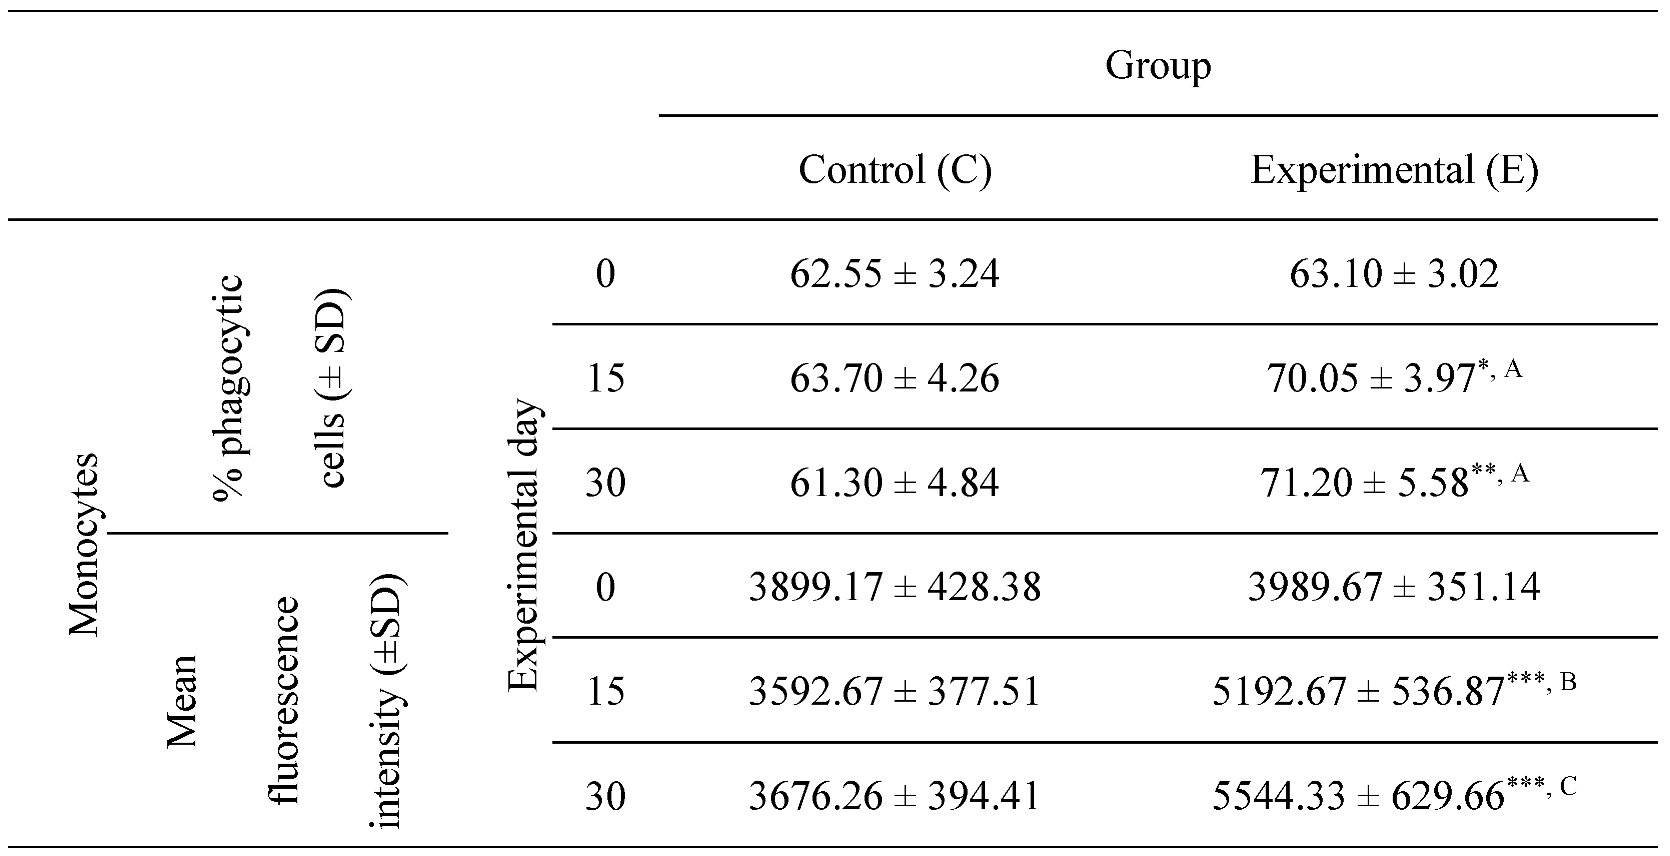
The above explains the significant increase in the phagocytic activity of monocytes and granulocytes, expressed by the percentage of phagocytic cells and the average number of bacteria eliminated by one phagocyte (MFI), in the group of lambs supplemented with the multi-strain probiotic formulation relative to the control group. This observation suggests that probiotic strains not only increased the number of phagocytic cells, but also enhanced the effectiveness of phagocytosis. Phagocytes also play an important role in triggering and regulating the specific immune response via cytokines and reactive intermediates released by macrophages [
38]. A review of the literature indicates that probiotics exert a highly selective and strain-specific effect on cellular immunity, and that phagocytosis is stimulated by only a limited number of strains. An increase in the activity of phagocytic cells was reported by Devyatkin et al. [
39] in sheep and lambs whose diets were supplemented with spore-forming
Bacillus subtilis and
Bacillus licheniformis bacteria for 30 days. Similar observations were made by Kausahal et al. [
40] in a study of mice whose diets were supplemented with
Lactobacillus acidophilus and
Bifidobacterium bifidum, and by Arunachalam et al. [
41] in a study of humans who consumed milk containing
Bifidobacterium lactis (HN019) for 6 weeks. In the former and latter study, old age did not affect the phagocytic potential of macrophages and polymorphonuclear cells, respectively. Rocha-Ramírez et al. [
42] examined the effect of four probiotic
Lactobacillus strains (
L. rhamnosus GG,
L. rhamnosus KLSD,
L. helveticus IMAU70129, and
L. casei IMAU60214) on the activity of human macrophages
in vitro. They found that the phagocytic activity of macrophages targeting both extracellular (
Staphylococcus aureus and
Escherichia coli) and intracellular pathogens (
Salmonella typhimurium) was intensified after 1 h of preincubation with heat-inactivated probiotic strains at a temperature of 37°C. In an ex vivo study, Gill et al. [
43] also observed an increase in the phagocytic activity of mononuclear and polymorphonuclear cells in humans after the consumption of
Bifidobacterium lactis HN019, in particular in immunocompromised individuals. In turn, Ren et al. [
44] conducted an in vivo study of mice supplemented with
Lactobacillus salivarius CICC 23174 or
Lactobacillus plantarum CGMCC 1.557 bacterial strains for 20 days and reported a highly significant, nearly 30% increase in the phagocytosis index (PI), but only in mice receiving
L. plantarum at a dose of 1 × 10
9 CFU/animal relative to the control group.
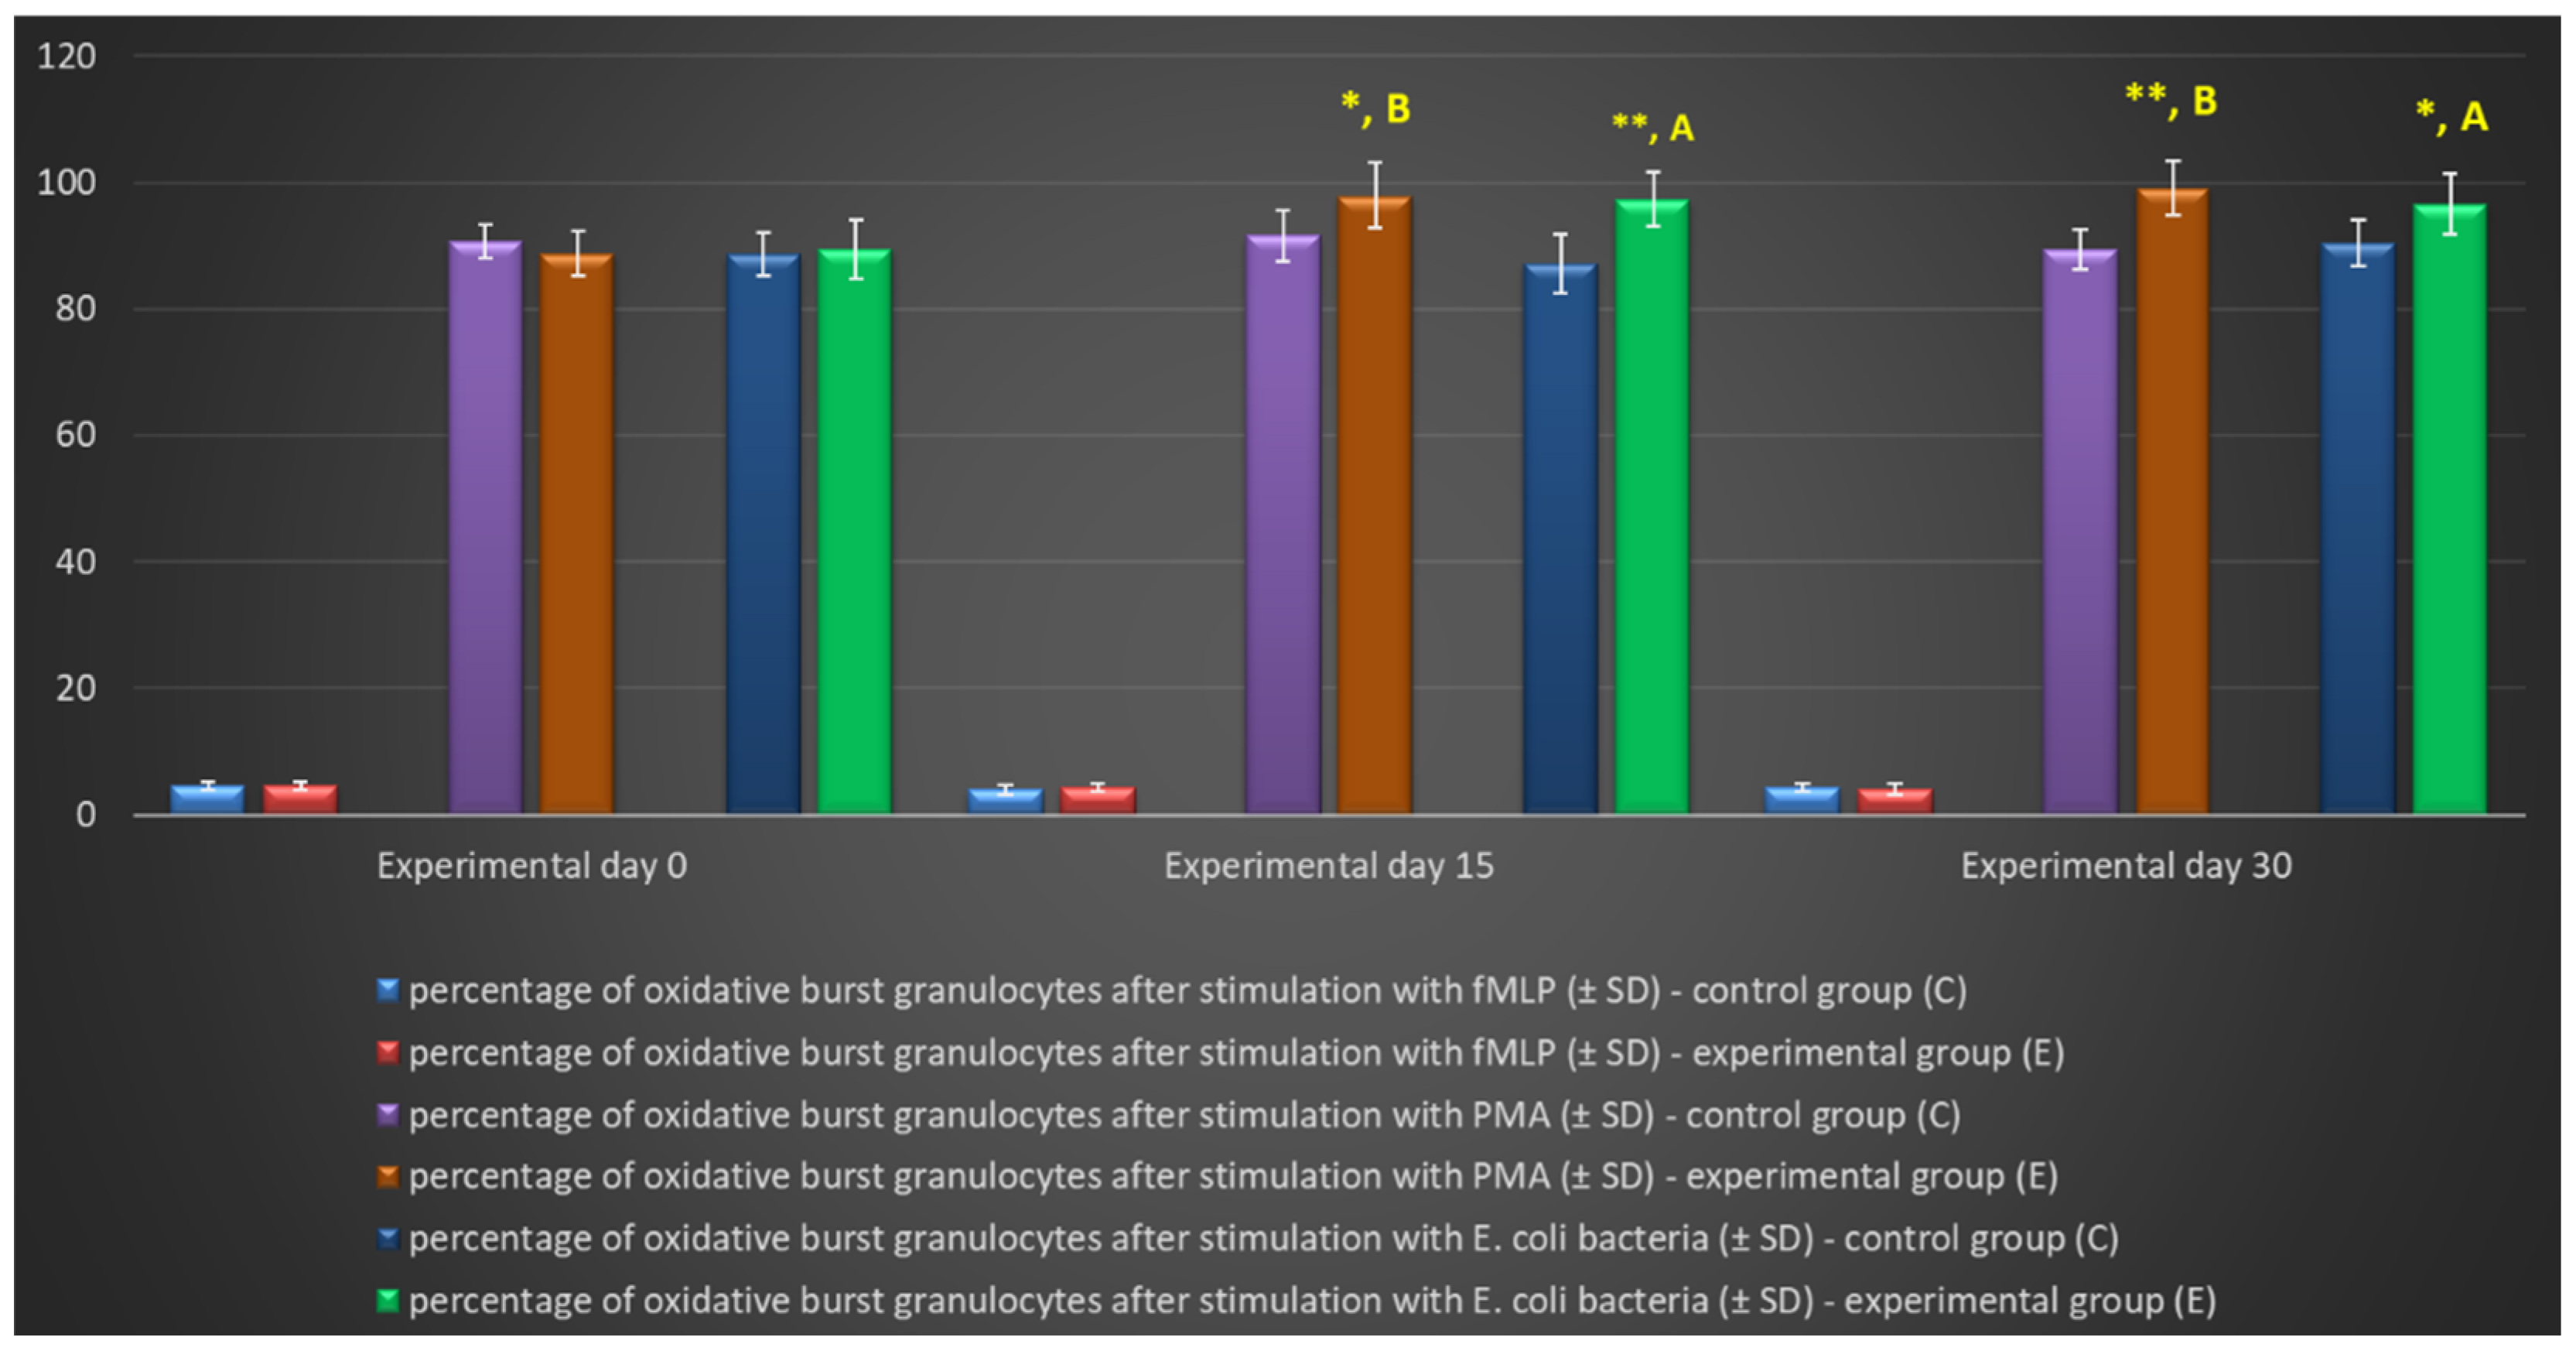
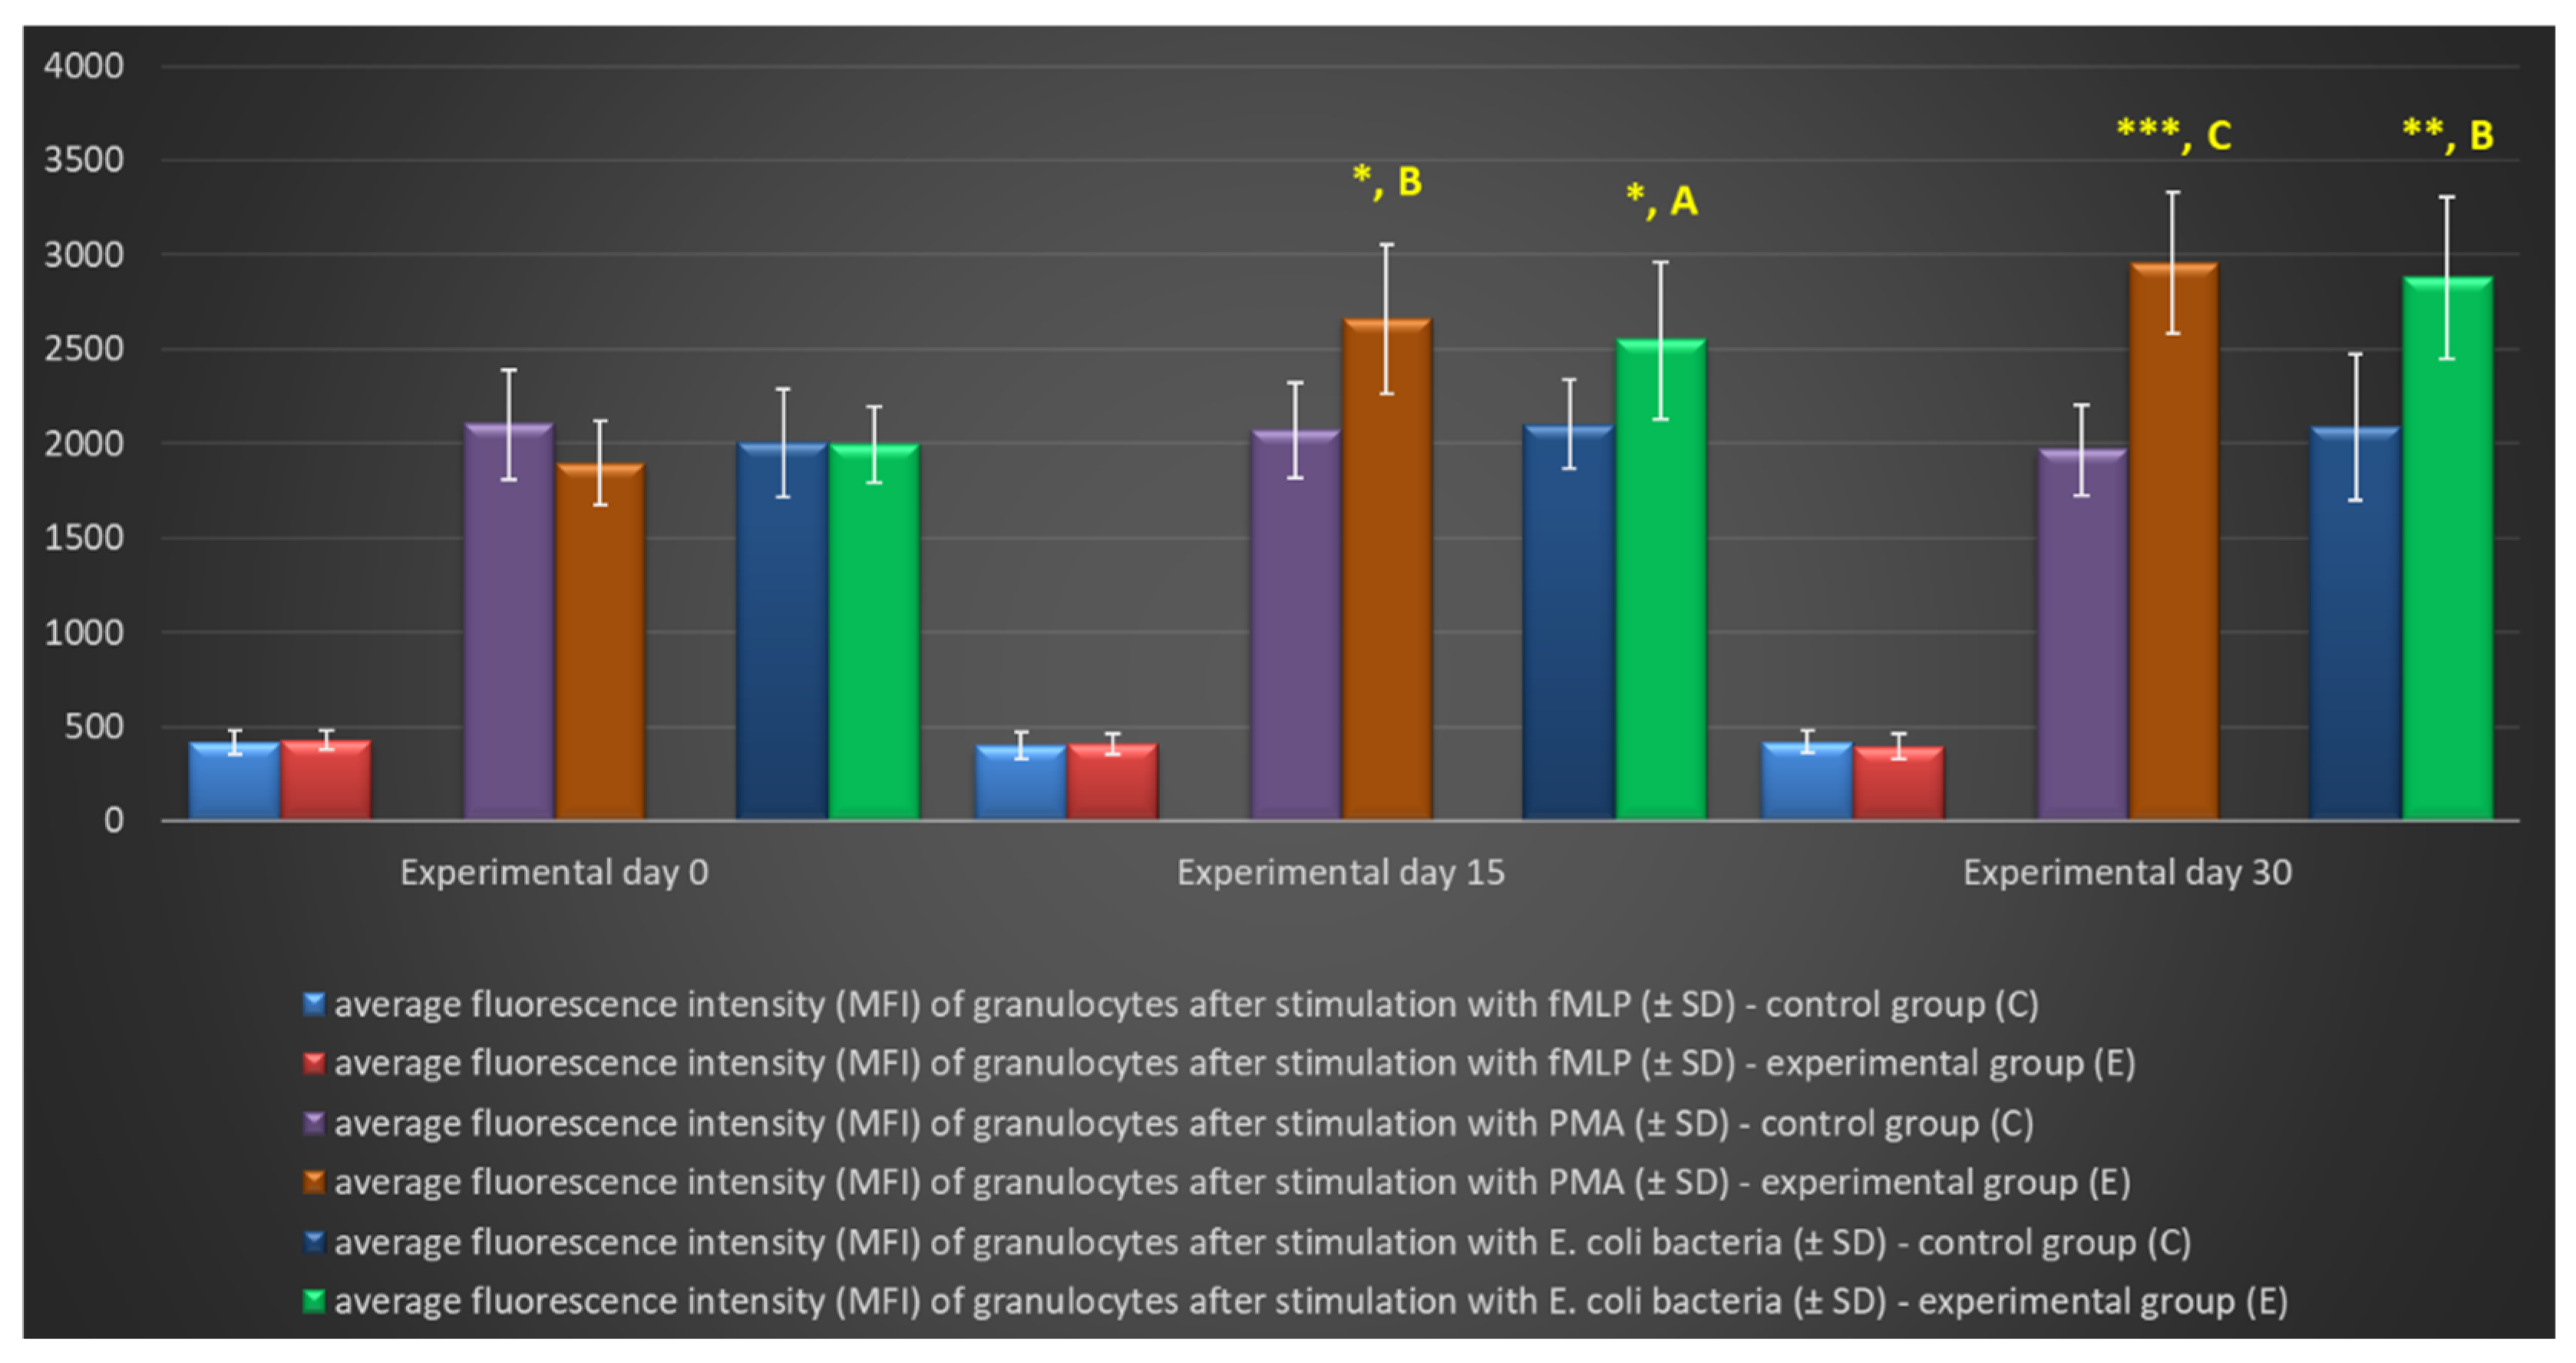
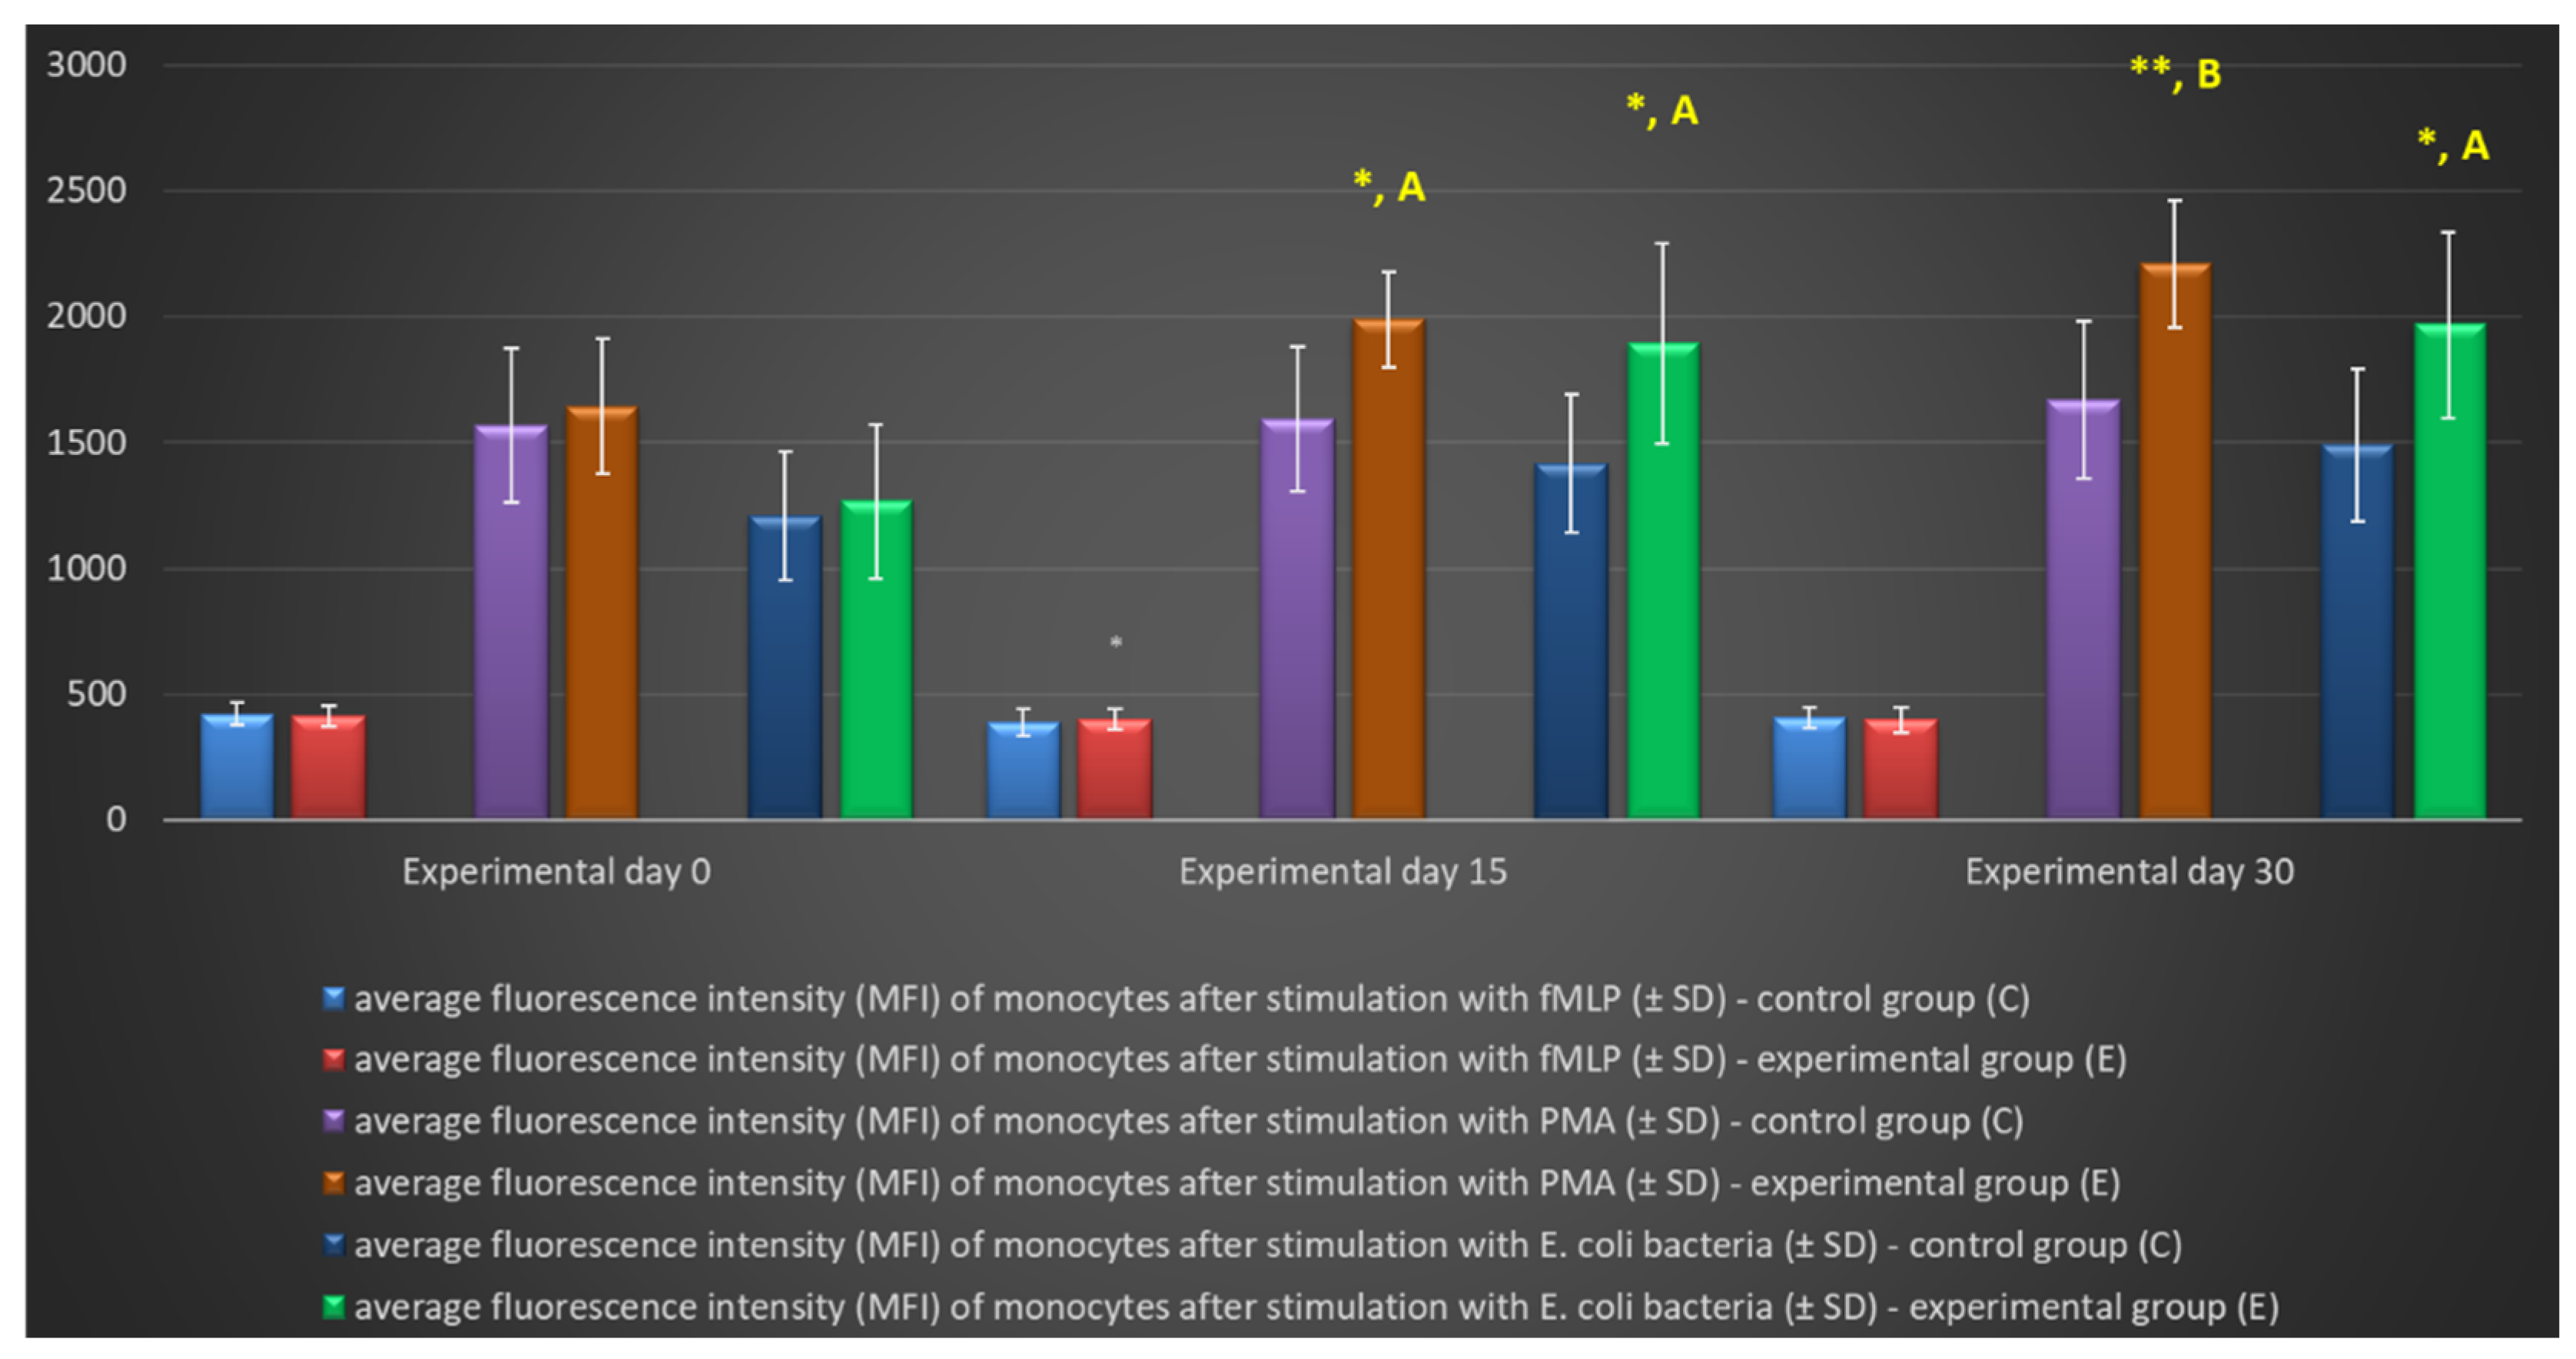
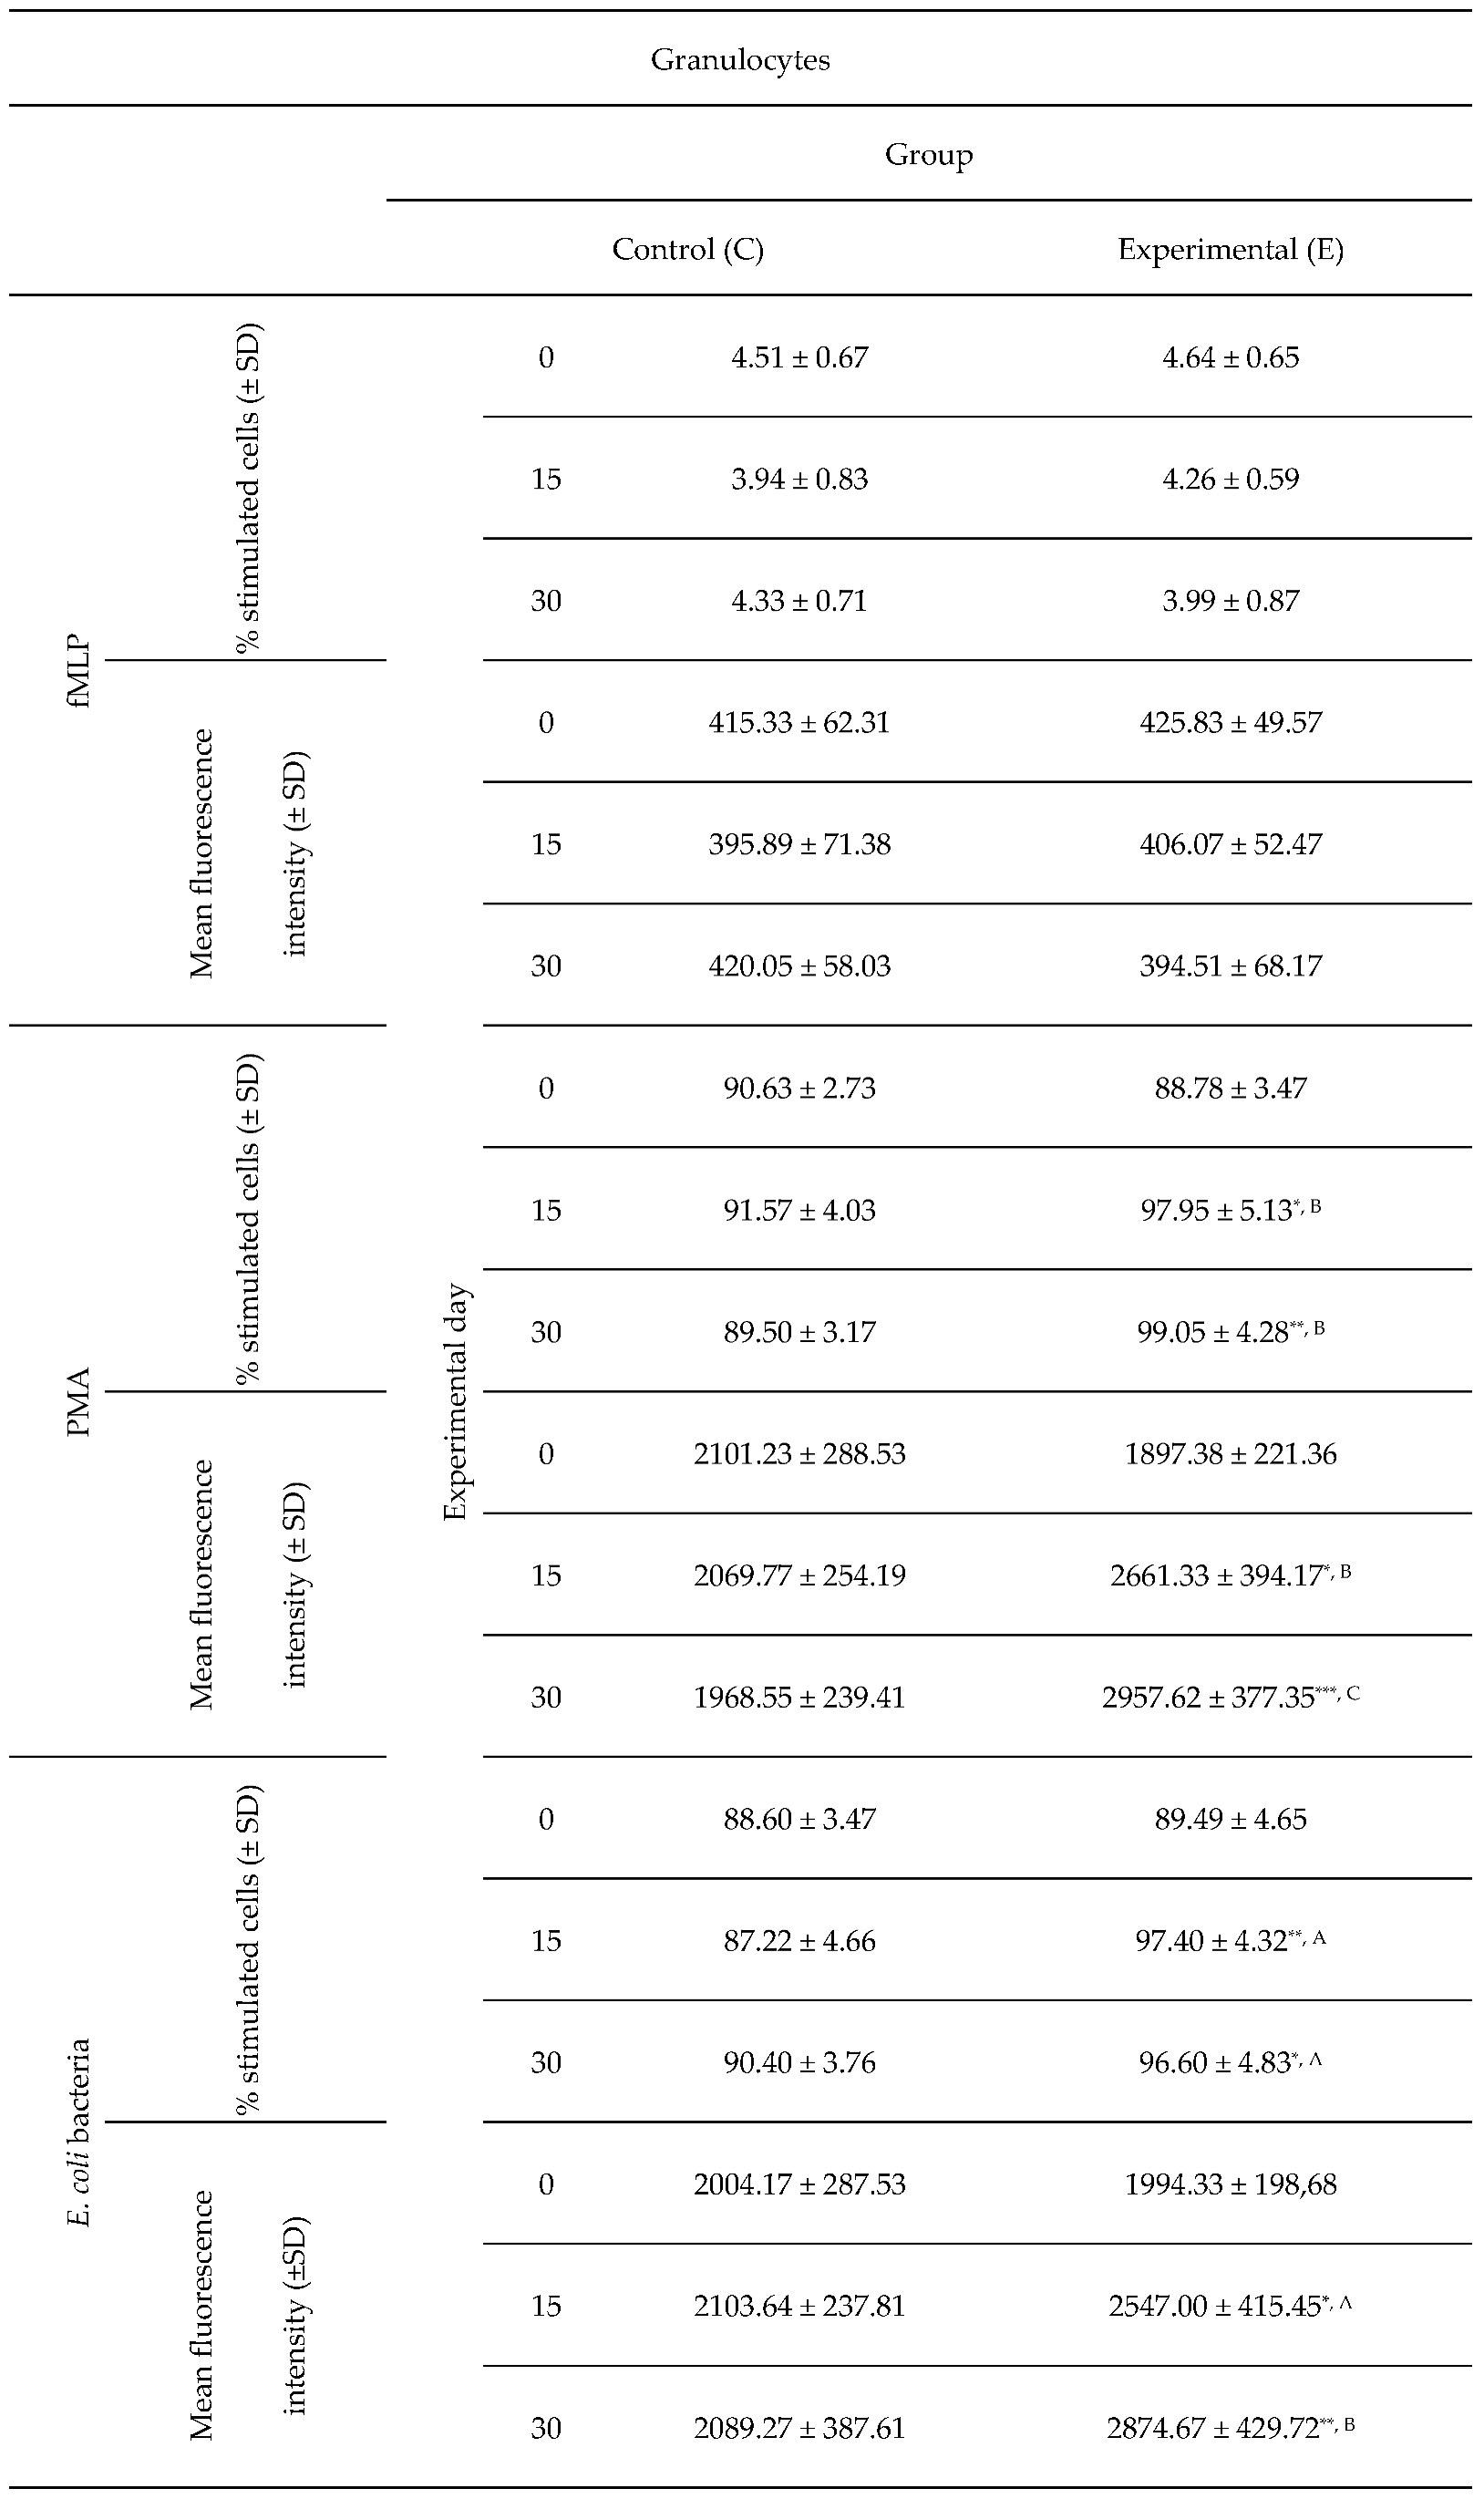
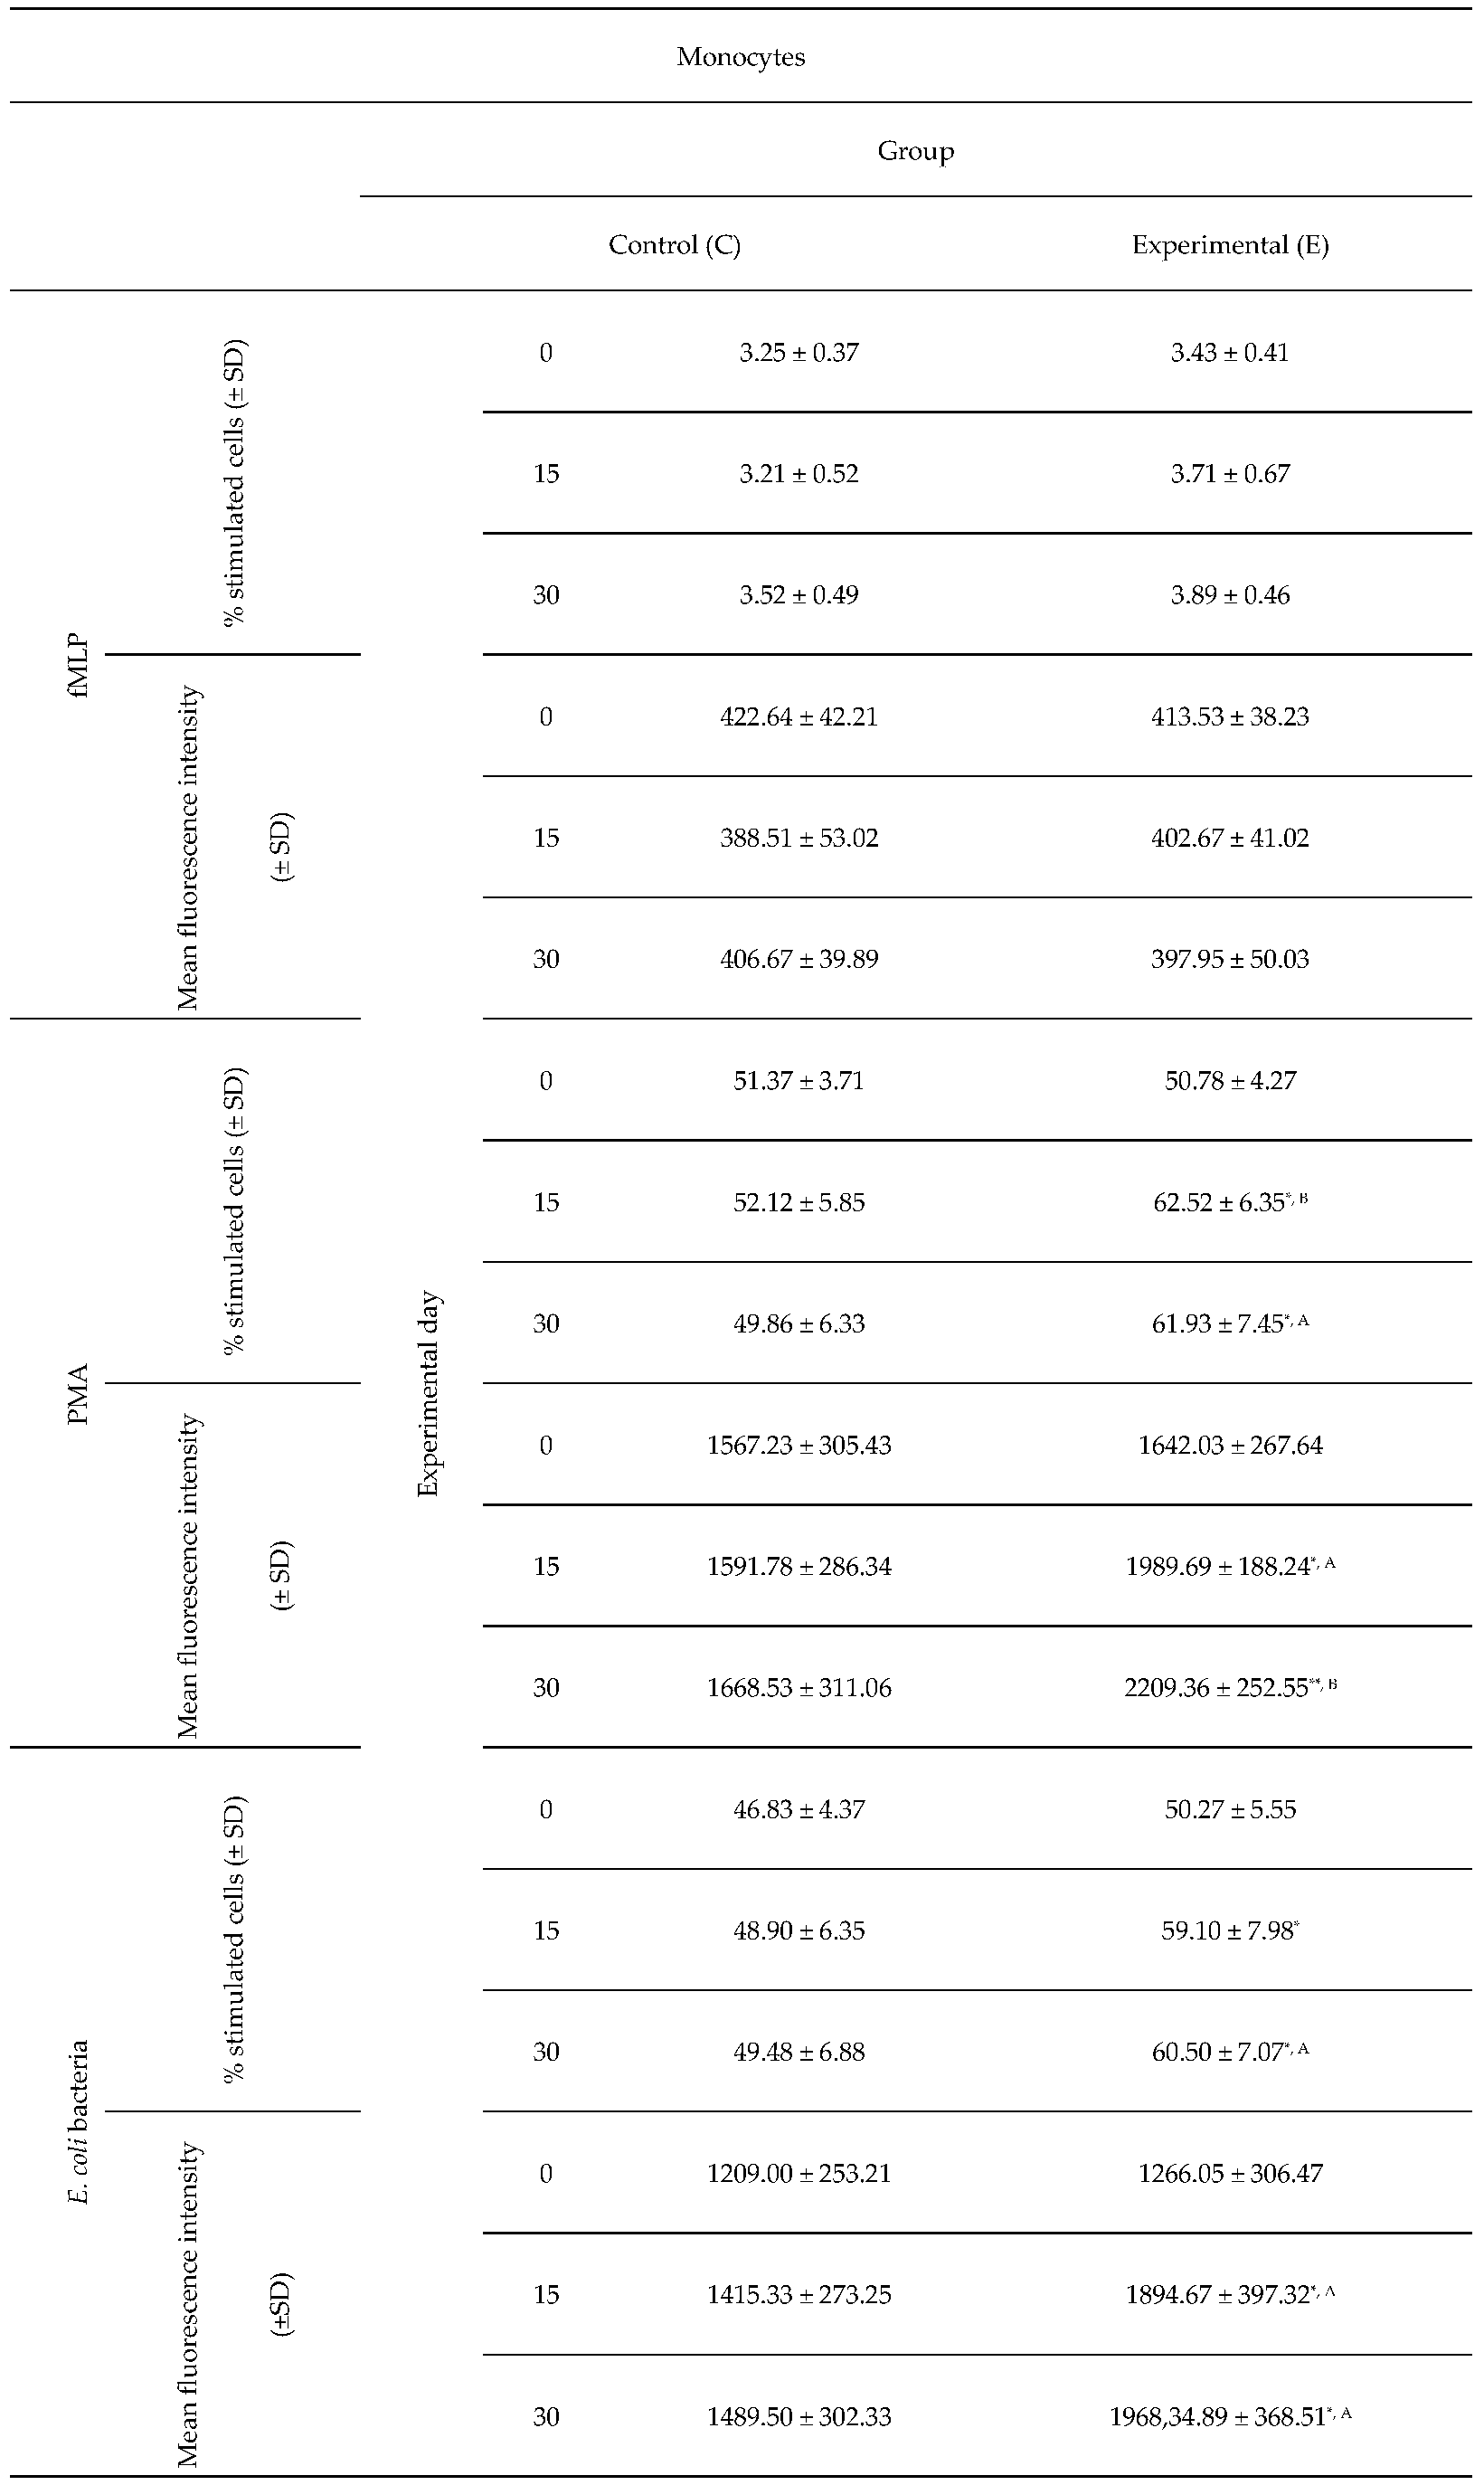
In the current study, the multi-strain probiotic formulation also intensified the intracellular killing activity of granulocytes and monocytes stimulated with PMA and
E. coli, expressed as the percentage of stimulated cells and MFI. Similar observations were made by Kapila et al. [
45] in mice fed milk fermented with
Lactobacillus helveticus NCDC292,
L. acidophilus NCDC15, or
L. paracasei for 60 days. In the cited study, the activity of neutrophil respiratory burst enzymes (cytochrome C reductase and myeloperoxidase), the activity of β-galactosidase and β-glucuronidase enzymes, and nitric oxide production increased during the first 30 days of the experiment, which enhanced the phagocytic activity of neutrophils and macrophages. As previously mentioned, Rocha-Ramirez et al. [
42] found that the challenge with lactic acid bacteria not only increased the phagocytic activity of macrophages, but also stimulated mononuclear phagocytes (monocytes and macrophages) to produce ROS, depending on the concentration and species of bacteria. The present findings are also corroborated by the results of a study conducted on mouse macrophages [
46] which released large amounts of ROS after stimulation with three
Lactobacillus strains (
L. reuteri 115,
L. johnsonii 142, ad
L. animalis/murinus 148). In turn, a study examining the effect of macrophage stimulation with three
Lactobacillus paracasei strains (KW3110, ATCC53103 and NRIC1942) revealed a clear correlation between phagocytosis and the production of ROS and, consequently, IL-12. Another study demonstrated that
Lactobacillus rhamnosus GG and
Lactobacillus paracasei Fn032 strains exerted antioxidant effects and modulated the redox status of a colonic fermentation system, which is related to their radical-scavenging ability or antibacterial effects [
48]. According to Donnet-Hughes et al. [
49], the supplementation of human diets with
Lactobacillus johnsonii La1 had no significant effect on the respiratory burst of phagocytes.
The ambiguous effect of various probiotic strains on phagocytosis, a mechanism of cellular innate immunity, could be directly linked with the fact that these cells are activated by surface receptors, and it could be indirectly associated with the release of cytokines from immunocompetent cells. Despite differences in the terminology associated with PAMPs and MAMPs, these structures (lipopolysaccharide, LPS, peptidoglycan, and lipoteichoic acids) are often similar, and they are identically identified and bound by nucleotide binding and oligomerization domain-containing protein 2 (NOD2)-like receptors (NLRs) and toll-like receptors (TLRs). These receptors belong to the group of PRRs that are characteristic of innate immune cells, including phagocytic cells [
50]. However, the mechanism by which the immune system differentiates healthy microbiota from pathogenic bacteria remains unknown. According to Gaboriau-Routhiau et al. [
51], Manicassamy et al. [
52], Gaboriau-Routhiau et al. [2009], and Manicassamy and Pulendran [2009], functional TLRs are also present on T cells, and direct triggering on TLRs can occur. There is considerable evidence to indicate that some probiotic bacteria can stimulate the anti-inflammatory pattern of cytokines (IL-10, TGF-β) via TLRs, whereas other probiotic strains, similarly to pathogenic bacteria, induce the production of proinflammatory cytokines (TNF-α, IL-12p70, and IL-23) that are responsible for the inflammatory response. A prolonged or excessive inflammatory response can damage tissues around the infection site and lead to defects in the intestinal barrier [
53,
54,
55,
56,
57,
58,
59,
60]. The cells of the innate immune system, including phagocytes, produce and release cytokines and other factors that stimulate the differentiation of naive T cells into subpopulations of effector Th1, Th2 Th17, or regulatory (T
reg) lymphocytes (TR1 and Th3) [
33]. Researchers generally agree that most TLR signalling pathways strongly stimulate macrophages and dendritic cells to produce IL-12 (p70), which promotes the differentiation of Th0 cells to Th1 cells and the production of interferon (IFN-γ) by Th1 cells [
61,
62]. Interferon is essential in the initial phase of a bacterial infection because it promotes the phagocyte-dependent protective response and suppresses a Th2-type humoral response [
63,
64]. IL-12 is an important cytokine that induces a Th1-type immune response and increases cellular immunity [
65], but according to Bafica et al. [
66] and Ichikawa et al. [
67], this correlation can be ambiguous. Velez et al. [
68] and Hua et al. [
69] demonstrated that various probiotic strains are able to stimulate a Th1-type immune response. Th1 cells promote the activation of phagocytes and antimicrobial training. In addition, TLR1, TLR2, and TLR4 bind the structures of probiotic bacteria and can also influence ROS production in macrophages [
70,
71]. Pelto et al. [
72] have suggested that an increase in the expression of complement receptors that play an important role in phagocytosis, including CR1, CR3, FcγRII, and FcαR, on neutrophils can also intensify the phagocytic activity of peripheral blood mononuclear cells (PBMCs). Similarly to bacterial LPS and viral products, proinflammatory cytokines acting via transcriptional factors NF-κB and AP-1 can also stimulate the secretion of IL-8 (CXCL-8), a chemokine that is responsible for the migration of phagocytes (neutrophils and macrophages) to the site of inflammation [
73].
Despite extensive research into probiotics' immunomodulatory effects on immune system functions, including the phagocytic activity of neutrophils and monocytes, many processes remain unknown and require further study. It should be noted that probiotics can exert different effects on phagocytosis, depending on the applied strain, the administered dose, and individual factors. Not all probiotics exert identical immunomodulatory effects, and further research is needed to elucidate their specific mechanisms of action.
4. Materials and Methods
4.1. Experimental Design
The study was conducted on a flock of Kamieniec sheep in a farm in Komalwy in the Region of Warmia and Mazury, Poland. Sixteen young rams, the offspring of 3-year-old ewes, were selected for the experiment. Lambs were divided into two groups of 8 animals each: a control group (group C) and an experimental group (group E), by the analogue method, based on their body weights at 10 days of age. The two groups were similar in body weights. The animals from both groups were slaughtered at the end of the experiment, i.e., at 40 days of age. Lambs were kept in two pens. During the experiment, the animals could move freely and had access to water free of antibiotics.
In both groups, the ewes and the lambs were fed identical diets according to the feeding system adopted in the farm. The ewes had ad libitum access to a total mixed ration (TMR) composed of grass silage (64%), maize silage (32%), concentrate (3.5%), and Milafos L mineral and vitamin premix (0.5%). Concentrate feed was prepared from ground oats (50%), ground wheat (30%), ground maize (10%), and ground soybeans (10%). The animals had unlimited access to Multi-Lisal Se mineral licks. Lambs were naturally fed colostrum in the first hour of life, and their diets in the first 10 days of life consisted solely of the mother's milk. Lambs were provided with ad libitum access to concentrate feed at 11 days of age. Group C lambs received a basal diet, whereas group E lambs received a basal diet supplemented with probiotics.
Beginning at 11 days of age, the diets of group E lambs were supplemented with a multi-strain probiotic formulation. The probiotic formulation contained four bacterial strains, including three Lactobacillus stains (Lactobacillus plantarum AMT14, Lactobacillus plantarum AMT4, and Lactobacillus rhamnosus AMT15) and one Bifidobacterium animalis AMT30 strain (Nature Science, Stawiguda, Poland) with a viable count of 1.0 × 10⁹ CFU/g. An aqueous solution of the probiotic formulation was administered per os once daily to each lamb according to the following schedule: age of 11-20 days – 10 mL of the solution (1 g of the multi-strain probiotic/animal), age of 21-30 days – 10 mL of the solution (2 g of the multi-strain probiotic/animal), and age of 31-40 days – 10 mL of the solution (3 g of the multi-strain probiotic/animal).
4.2. Sample Collection
Blood for analyses was sampled from the jugular vein (around 10 mL of fresh blood) at the beginning of the experiment before supplementation with the multi-strain probiotic (day 0), and on days 15 and 30 of the experiment. Blood samples were used to determine the phagocytic activity (Phagotest® kit) (Glycotope Biotechnology GmbH, Heidelberg, Germany) and oxidative metabolism (Phagoburst® kit) (Glycotope Biotechnology GmbH, Heidelberg, Germany) of peripheral blood granulocytes and monocytes by flow cytometry. All blood samples were collected before the morning feeding.
4.3. Determination of the Phagocytic Activity of Blood Granulocytes and Monocytes in Lambs with the Phagotest® kit
All test reagents were prepared in accordance with the manufacturer's recommendations in the leaflet attached to the product. One hundred μL of whole heparinised blood chilled to 0°C and 20 μL of chilled E. coli bacteria (Glycotope Biotechnology GmbH, Heidelberg, Germany) were added to each of the two 5 mL test tubes (blue, Beckman Coulter, Fullerton, CA, USA) (negative control and experimental samples) and shaken for around 3 s at low speed. The experimental sample was incubated for 10 min at 37°C, and the negative control sample was incubated in an ice bath at 0°C. After incubation, 100 μL of a quenching solution (Glycotope Biotechnology GmbH, Heidelberg, Germany) was added to each sample, and the samples were shaken. Three mL of the washing solution (Glycotope Biotechnology GmbH, Heidelberg, Germany) chilled to 0°C was added; the samples were centrifuged for 5 min at 4°C (250 x g), and the supernatant was removed. The rinsing procedure was performed twice, and 2 mL of the lysing solution (Glycotope Biotechnology GmbH, Heidelberg, Germany) with room temperature was added to each sample. The samples were shaken and incubated at room temperature for 20 min. The samples were centrifuged for 5 min at 4°C (250 x g), and the supernatant was removed. Three mL of the washing solution (Glycotope Biotechnology GmbH, Heidelberg, Germany) chilled to 0°C was added to each sample; the samples were centrifuged for 5 min at 4°C (250 x g), and the supernatant was removed. Two hundred μL of the DNA staining solution (Glycotope Biotechnology GmbH, Heidelberg, Germany) chilled to 0°C was added, the samples were shaken and incubated for 10 min in an ice bath. Cellular phagocytic activity was determined in a cytometer (FACSCelesta cytometer, BD Biosciences, San Jose, NJ, USA) in less than 60 min after the last reagent had been added. The Phagotest (Glycotope Biotechnology GmbH, Heidelberg, Germany) involves fluorescein (FITC)-stained E. coli bacteria which are phagocytised by macrophages. Cell nuclei are also stained. The test determines the number of phagocytising cells, granulocytes and monocytes separately, and their phagocytic activity, i.e., the number of bacteria ingested by a single cell, which is expressed by MFI.
4.4. Determination of the Oxidative Metabolism of Blood Granulocytes and Monocytes in Lambs with the Phagoburst® Kit
All test reagents were prepared in accordance with the manufacturer's recommendations in the leaflet attached to the product. Each analysed sample of whole heparinised blood was divided into four test tubes (blue, Beckman Coulter, Fullerton, CA, USA) of 100 μL each and chilled to 0°C. Twenty μL of chilled E. coli bacteria (Glycotope Biotechnology GmbH, Heidelberg, Germany) was added to the first sample (experimental), 20 μL of the washing solution (Orpegen Pharma, Heidelberg, Germany) was added to the second sample (negative control), 20 μL of fMLP (N-formyl-methionyl-leucyl-phenylalanine) (Glycotope Biotechnology GmbH, Heidelberg, Germany) was added to the third sample (low control), and 20 μL of PMA (4-phorbol-12-β-myristate-13-acetate) (Glycotope Biotechnology GmbH, Heidelberg, Germany) was added to the fourth sample (high control). Test tube contents were stirred and incubated for 10 min at 37°C (excluding the fMLP (Glycotope Biotechnology GmbH, Heidelberg, Germany) sample which was incubated for 7 min). After incubation, each test tube was supplemented with 20 μL of the substrate solution (Glycotope Biotechnology GmbH, Heidelberg, Germany) and thoroughly shaken. All samples were incubated for 10 min at 37 °C. After incubation, 2 mL of the lysing solution (Glycotope Biotechnology GmbH, Heidelberg, Germany) with room temperature was added. The test tubes were shaken and incubated at room temperature for 20 min. All samples were centrifuged for 5 min at 4°C (250 × g), and the supernatant was removed. All test tubes were rinsed once with 3 mL of the washing solution (Glycotope Biotechnology GmbH, Heidelberg, Germany), centrifuged for 5 min at 4°C (250 × g), after which the supernatant was removed. Two hundred μL of the staining solution chilled to 0°C was added to each sample, the test tubes were shaken and incubated for 10 min in an ice bath. The intracellular killing activity of phagocytes was determined in a cytometer (FACSCelesta cytometer, BD Biosciences, San Jose, NJ, USA) in less than 30 min after the last reagent had been added. Three activators were used to stimulate cells: E. coli bacteria (Glycotope Biotechnology GmbH, Heidelberg, Germany), PMA (Glycotope Biotechnology GmbH, Heidelberg, Germany) as the strong activator, and fMLP (Glycotope Biotechnology GmbH, Heidelberg, Germany) as the weak activator. Dihydrorodamine (123-DHR) was oxidized by mitochondria when H2O2 was added to induce oxidative stress, and it was converted to cation rhodamine 123 (R123), the fluorescence emitter.
4.5. FACS Acquisition and Analysis
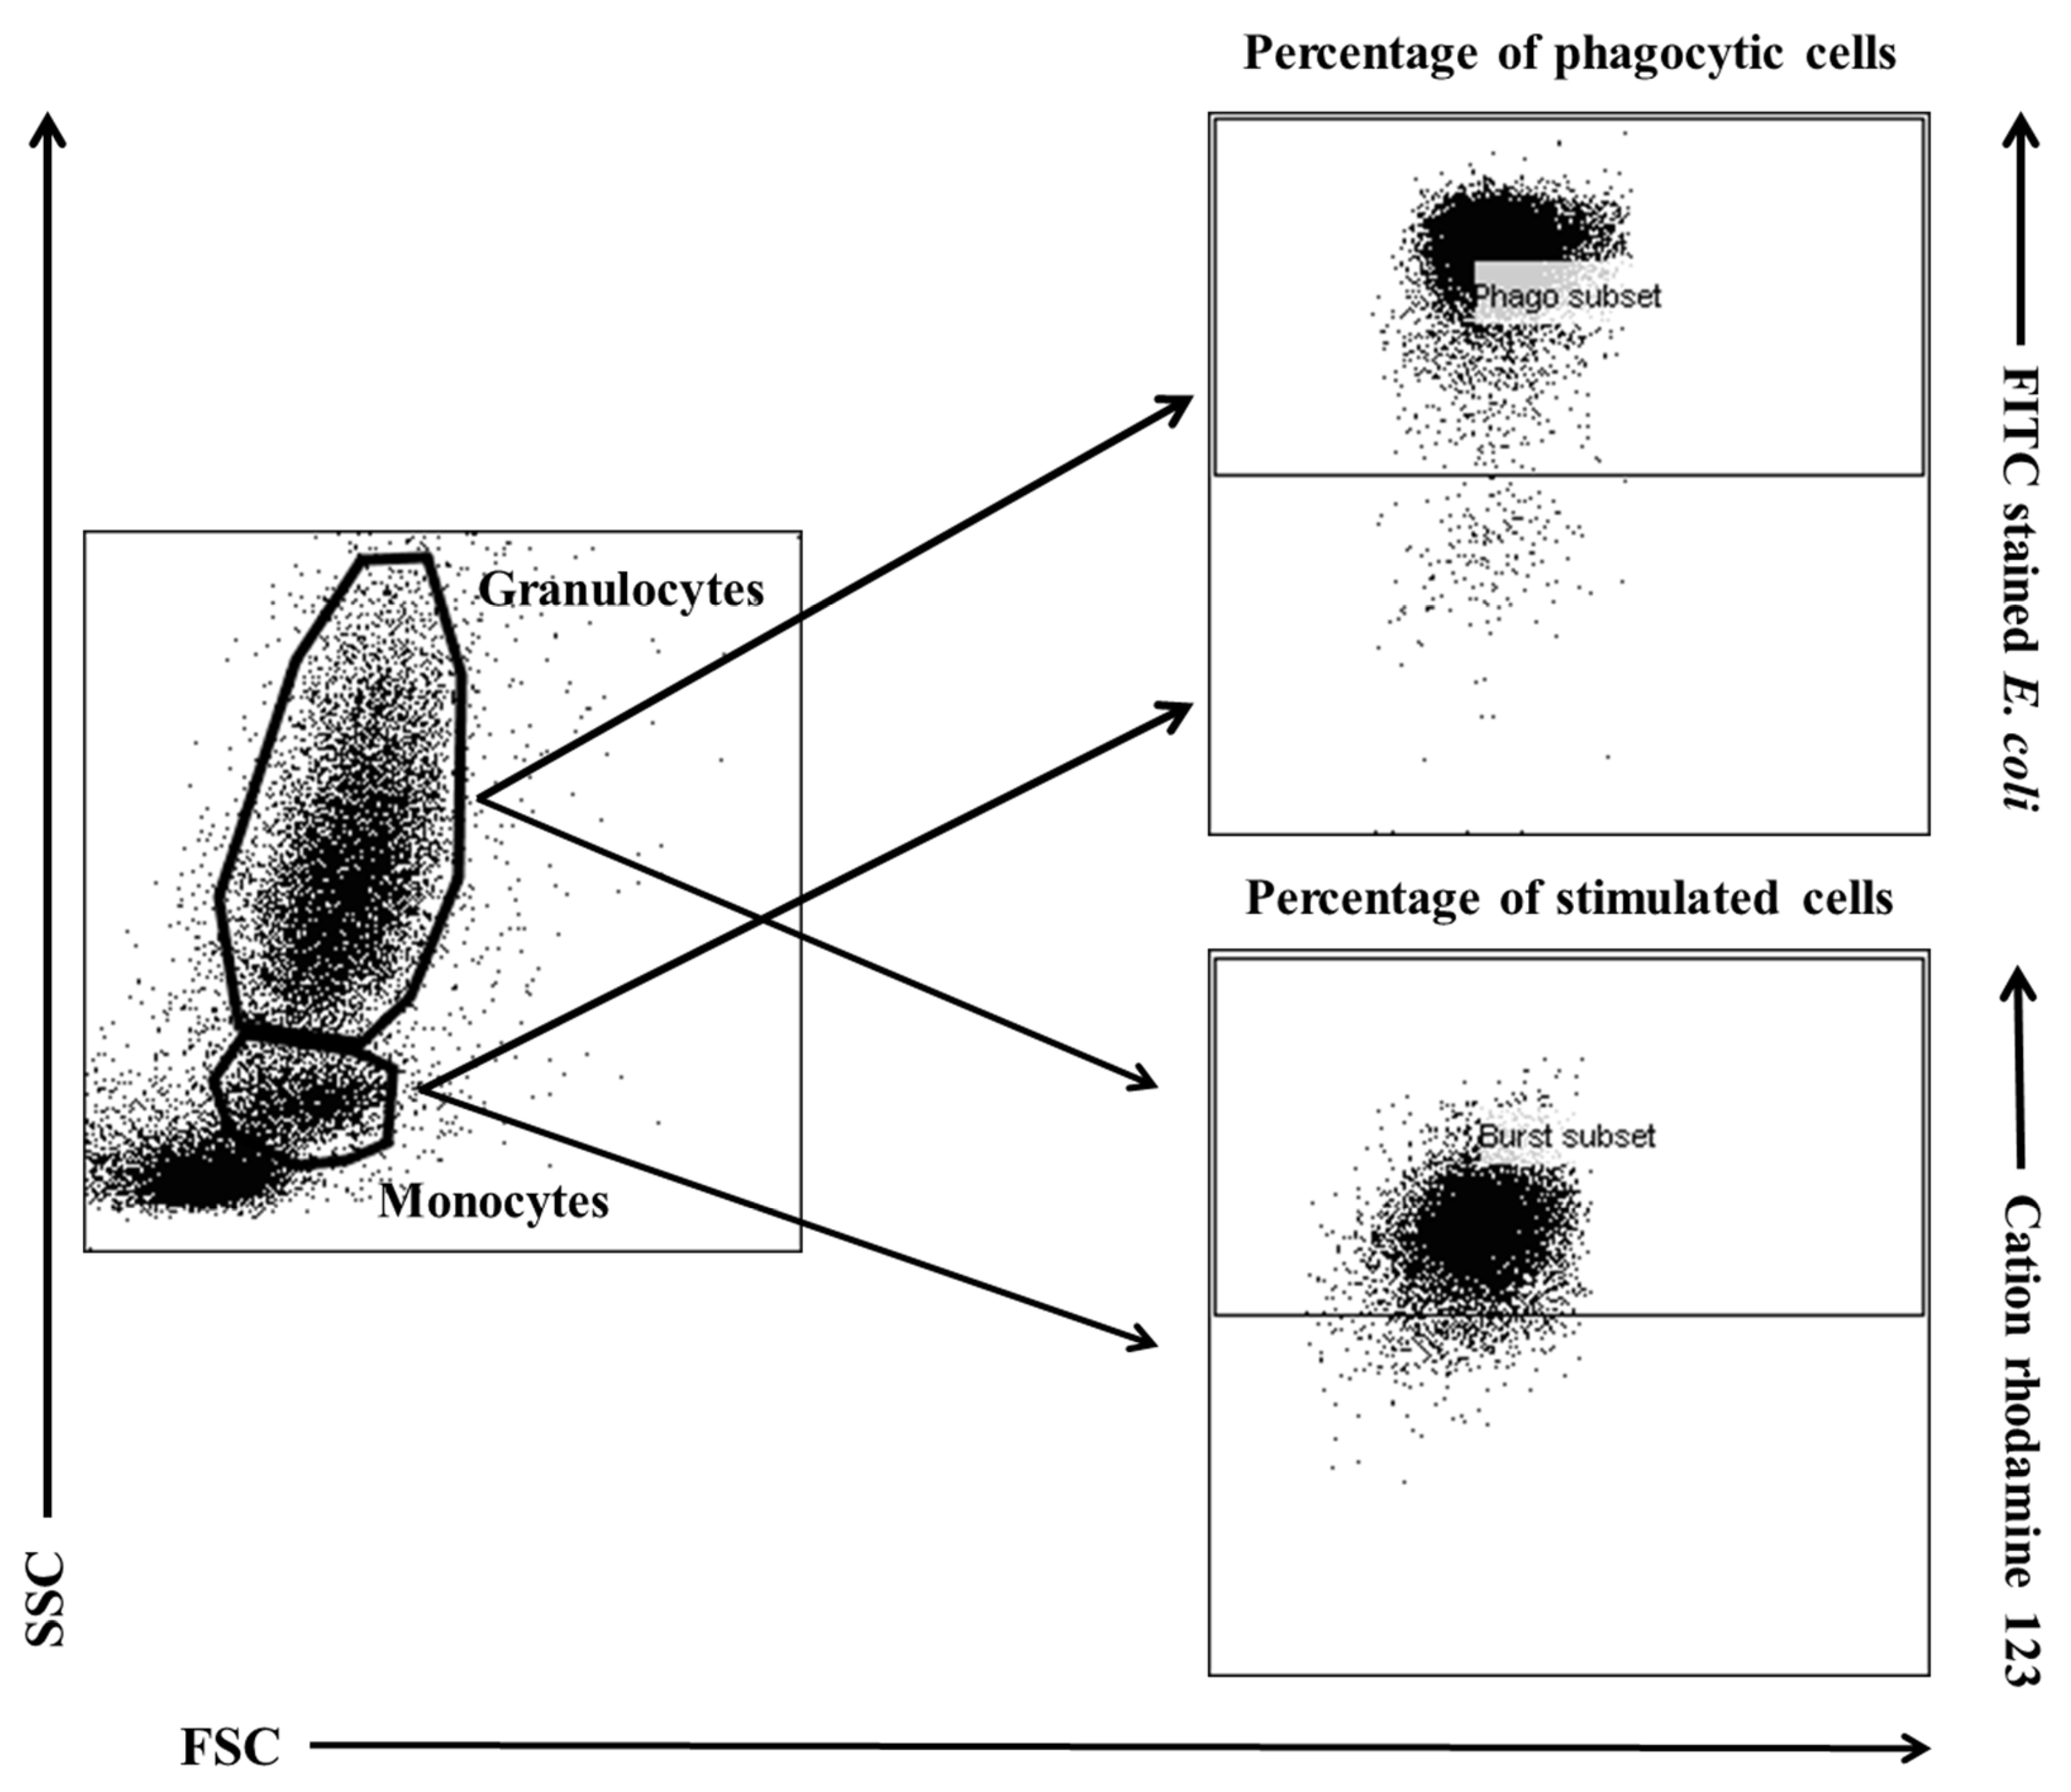
Flow cytometry was performed with a FACSCelesta cytometer (BD Biosciences, San Jose, NJ, USA). Data were acquired with FACSDiva version 6.1.3 software (BD Biosciences, San Jose, NJ, USA) and analysed in FlowJo 10 software (Tree Star, Ashland, Oregon, USA). The cytometry setup and tracking beads (CST; BD Biosciences, San Jose, NJ, USA) were used to initialise the photomultiplier tube (PMT). Unstained control cells and a single stain control for every fluorochrome were prepared and used to establish flow cytometric compensation (
Figure 11).
4.6. Statistical Analysis
Numerical results were presented as arithmetic means ± SD. The obtained results were processed statistically by two-way ANOVA for orthogonal design. In the post-hoc analysis, Dunnett’s test was used to compare day 0 with days 15 and 30 in group E (significance of differences between days: (A) p < 0.05; (B) p < 0.01; (C) p < 0.001; (D) p < 0.0001), and Tukey’s test for equal groups was used to compare group E with group C at each time point (significance of differences between groups: * p < 0.05; ** p < 0.01; *** p < 0.001; **** p < 0.0001). Data were processed statistically with the use of GraphPad Prism 7 software.
Figure 1.
Percentage and mean fluorescence intensity (MFI) of phagocytic granulocytes in lamb groups in the Phagotest. Key: C – control group; E – experimental group; SD - standard deviation; Numerical results were presented as the arithmetic mean ± SD. The significance level was set at 0.05. * p<0.05; ** p<0.01; *** p<0.001; A - p≤0.05; B - p≤0.01; D - p≤0.0001 relative to day 0.
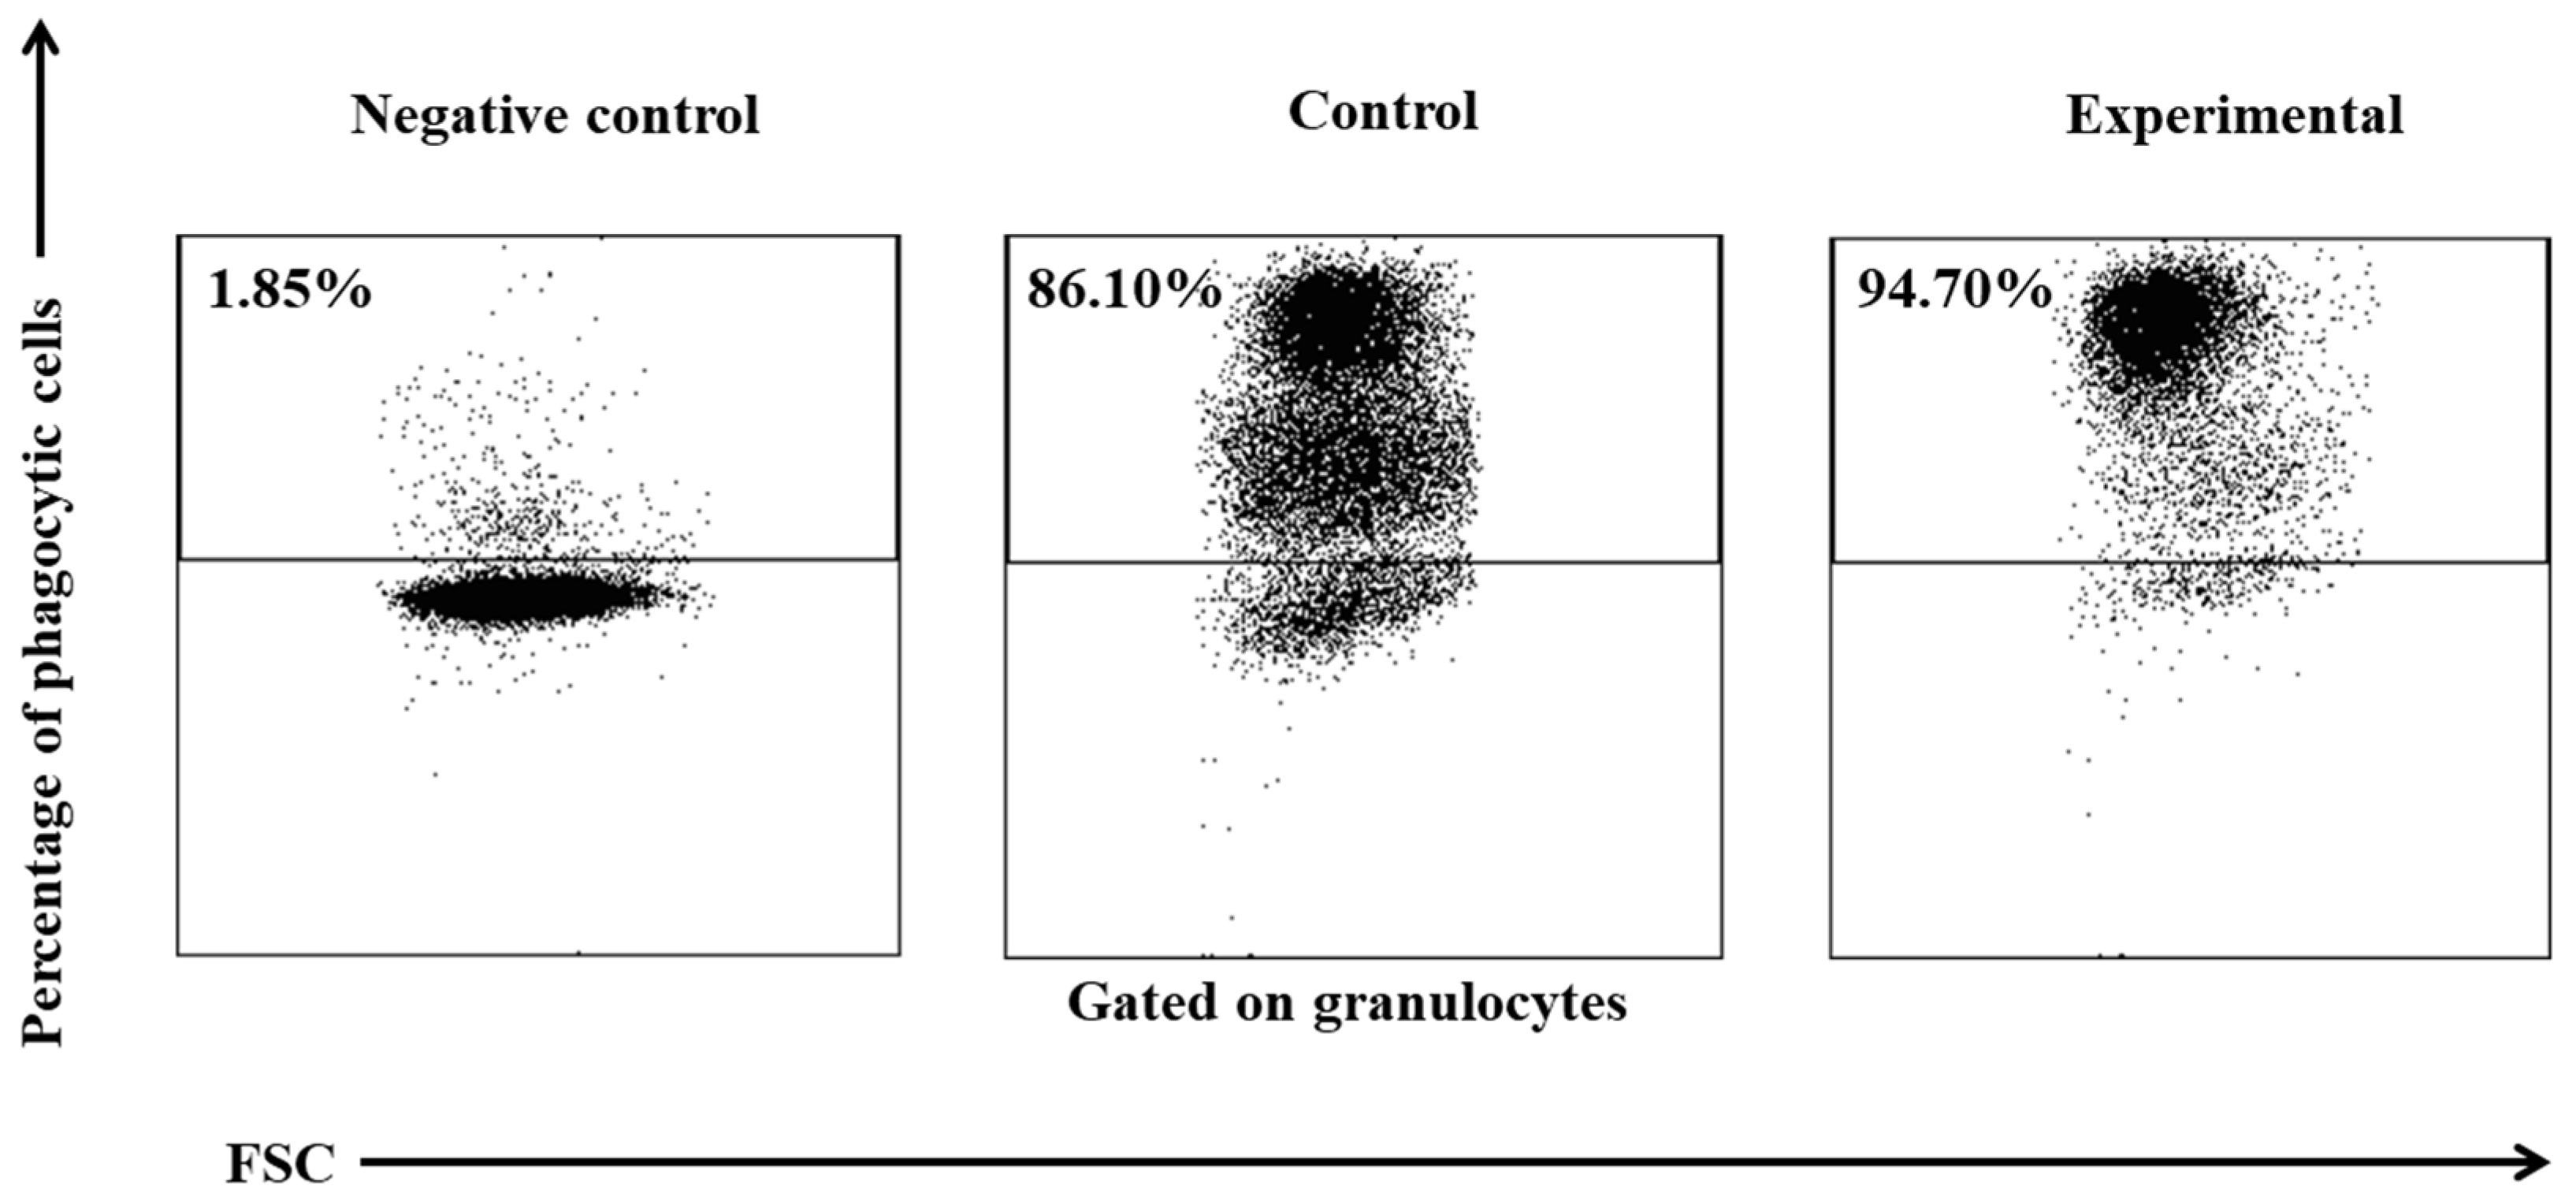
Figure 2.
Dot plot cytogram showing the percentage of phagocytic granulocytes in control and experimental lambs on experimental day 30. Whole heparinised blood from control and experimental group animals was incubated for 10 minutes with FITC-labelled E. coli in an ice bath at a temperature of 0°C (negative control) or in a water bath at a temperature of 37°C (control and multi-strain probiotic). The percentages of granulocytes with ingested E. coli (FITC) bacteria were gated.
Figure 3.
Percentage and mean fluorescence intensity (MFI) of phagocytic monocytes in lamb groups in the Phagotest. Key: C – control group; E – experimental group; SD - standard deviation; Numerical results were presented as the arithmetic mean ± SD. The significance level was set at 0.05. * p<0.05; ** p<0.01; *** p<0.001; **** p<0.0001; A - p≤0.05; B - p≤0.01; C - p≤0.001 relative to day 0.
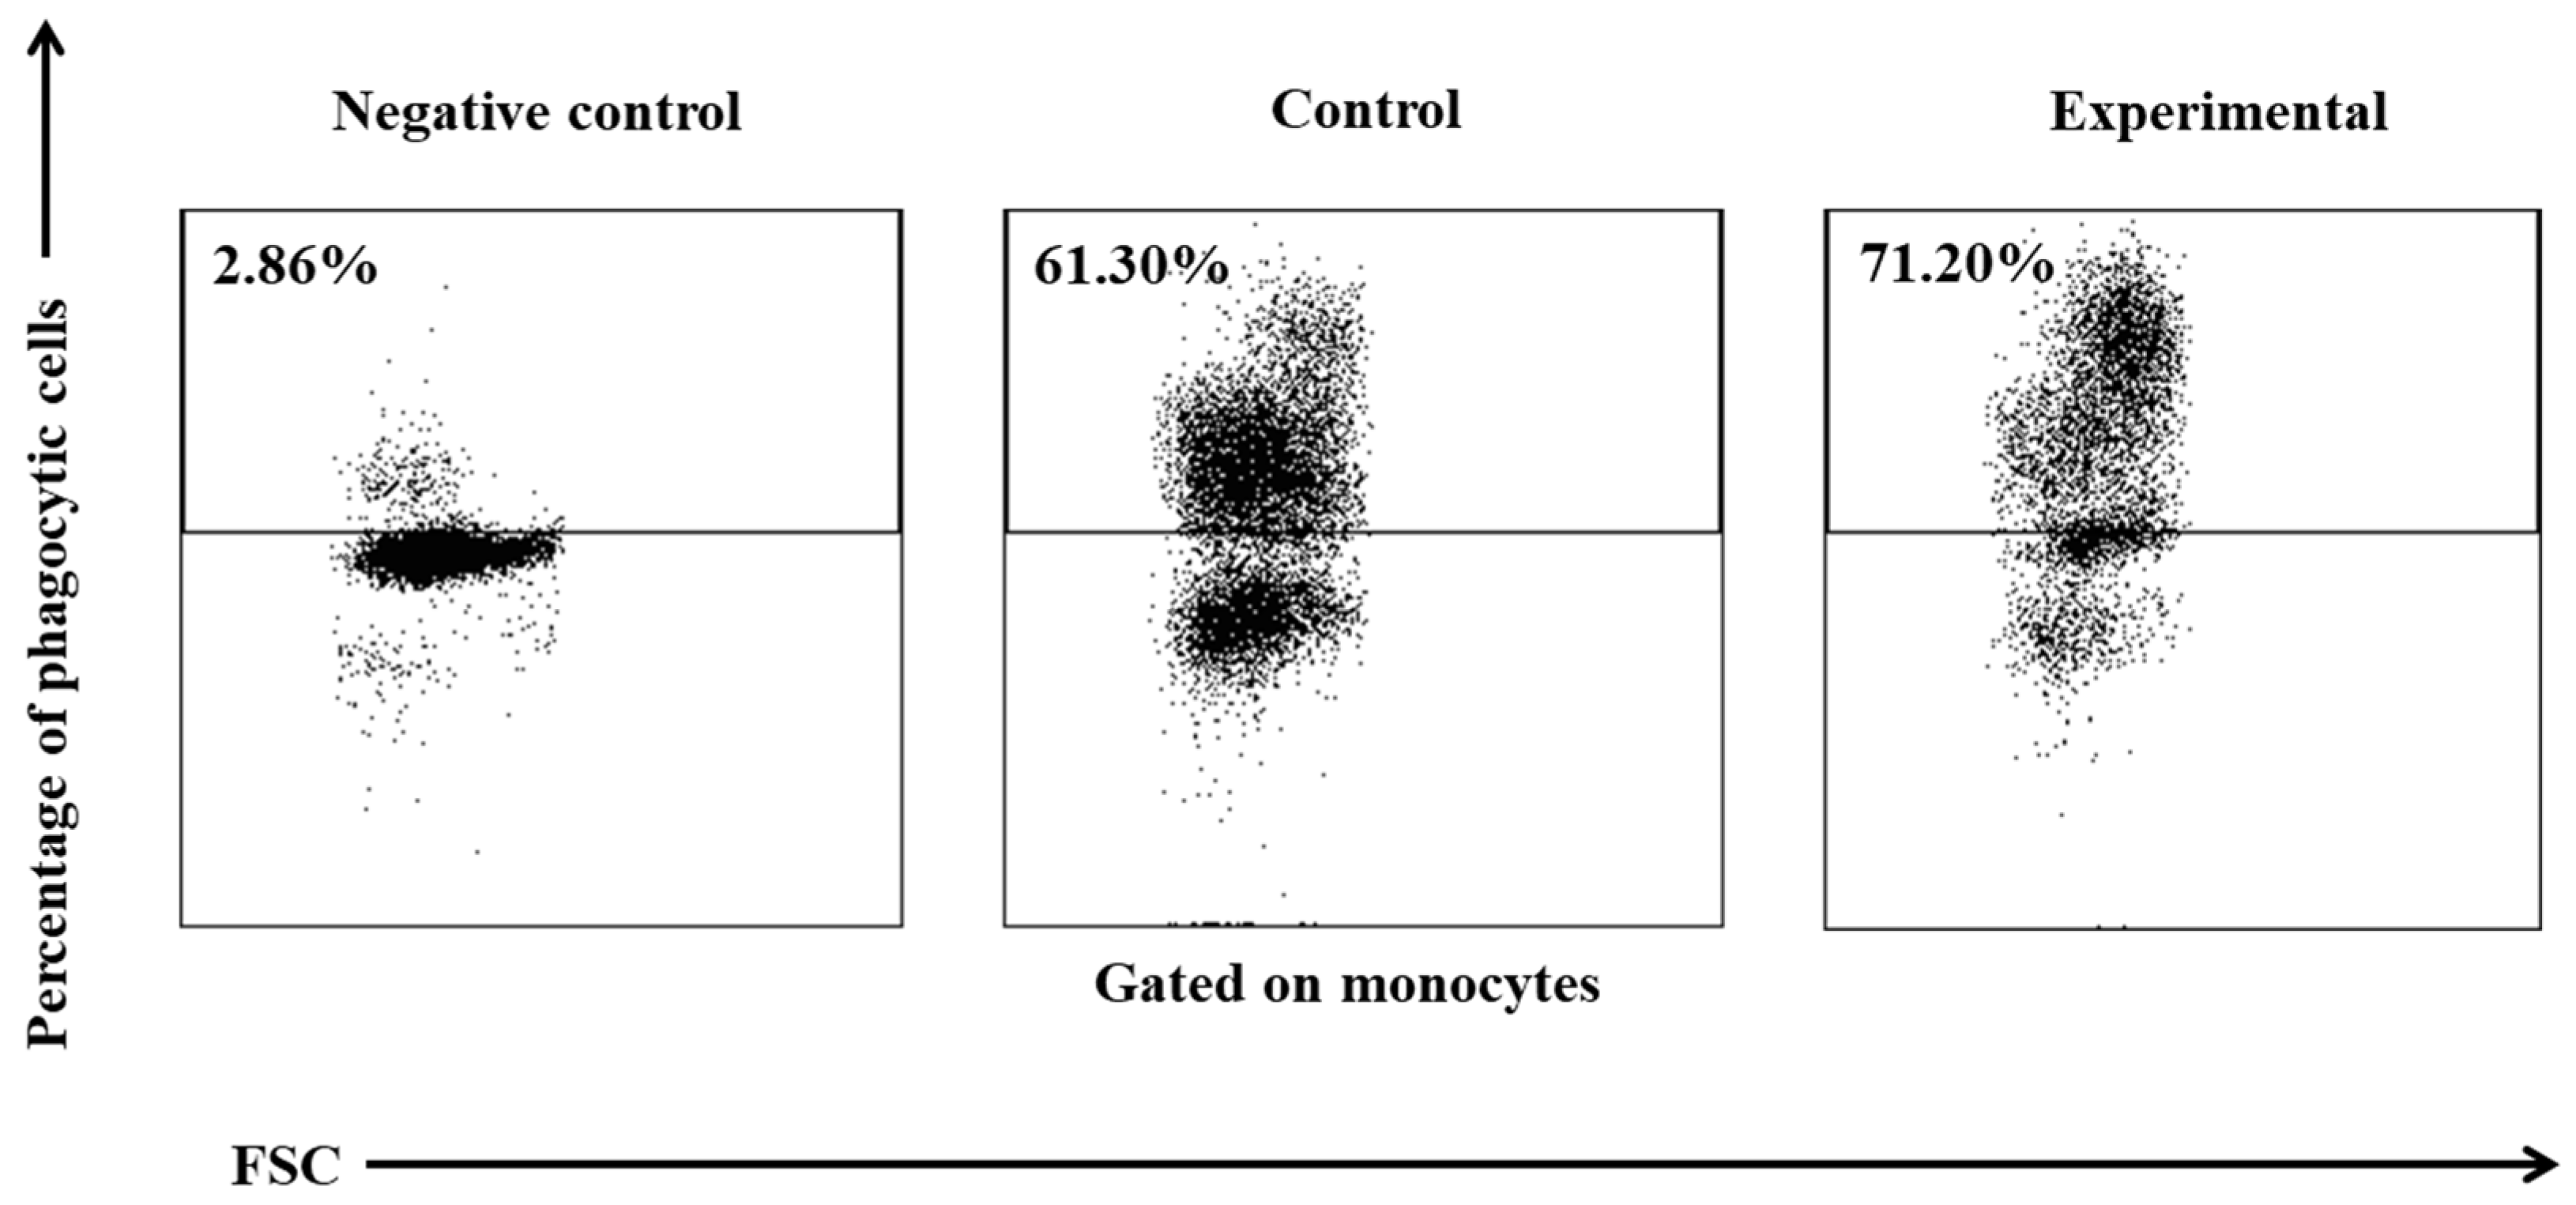
Figure 4.
Dot plot cytogram showing the percentage of phagocytic monocytes in control and experimental lambs on experimental day 30. Whole heparinised blood from control and experimental group animals was incubated for 10 minutes with FITC-labeled E. coli in an ice bath at a temperature of 0°C (negative control) or in a water bath at a temperature of 37°C (control and multi-strain probiotic). The percentages of granulocytes with ingested E. coli (FITC) bacteria were gated.
Figure 5.
Percentage of granulocytes stimulated to undergo respiratory burst in lamb groups after stimulation with fMLP, PMA and E. coli in the Phagoburst test. Key: C – control group; E – experimental group; SD – standard deviation; Numerical results were presented as the arithmetic mean ± SD. The significance level was set at 0.05. * p<0.05; ** p<0.01; A – p≤0.05; B – p≤0.01 relative to day 0.
Figure 6.
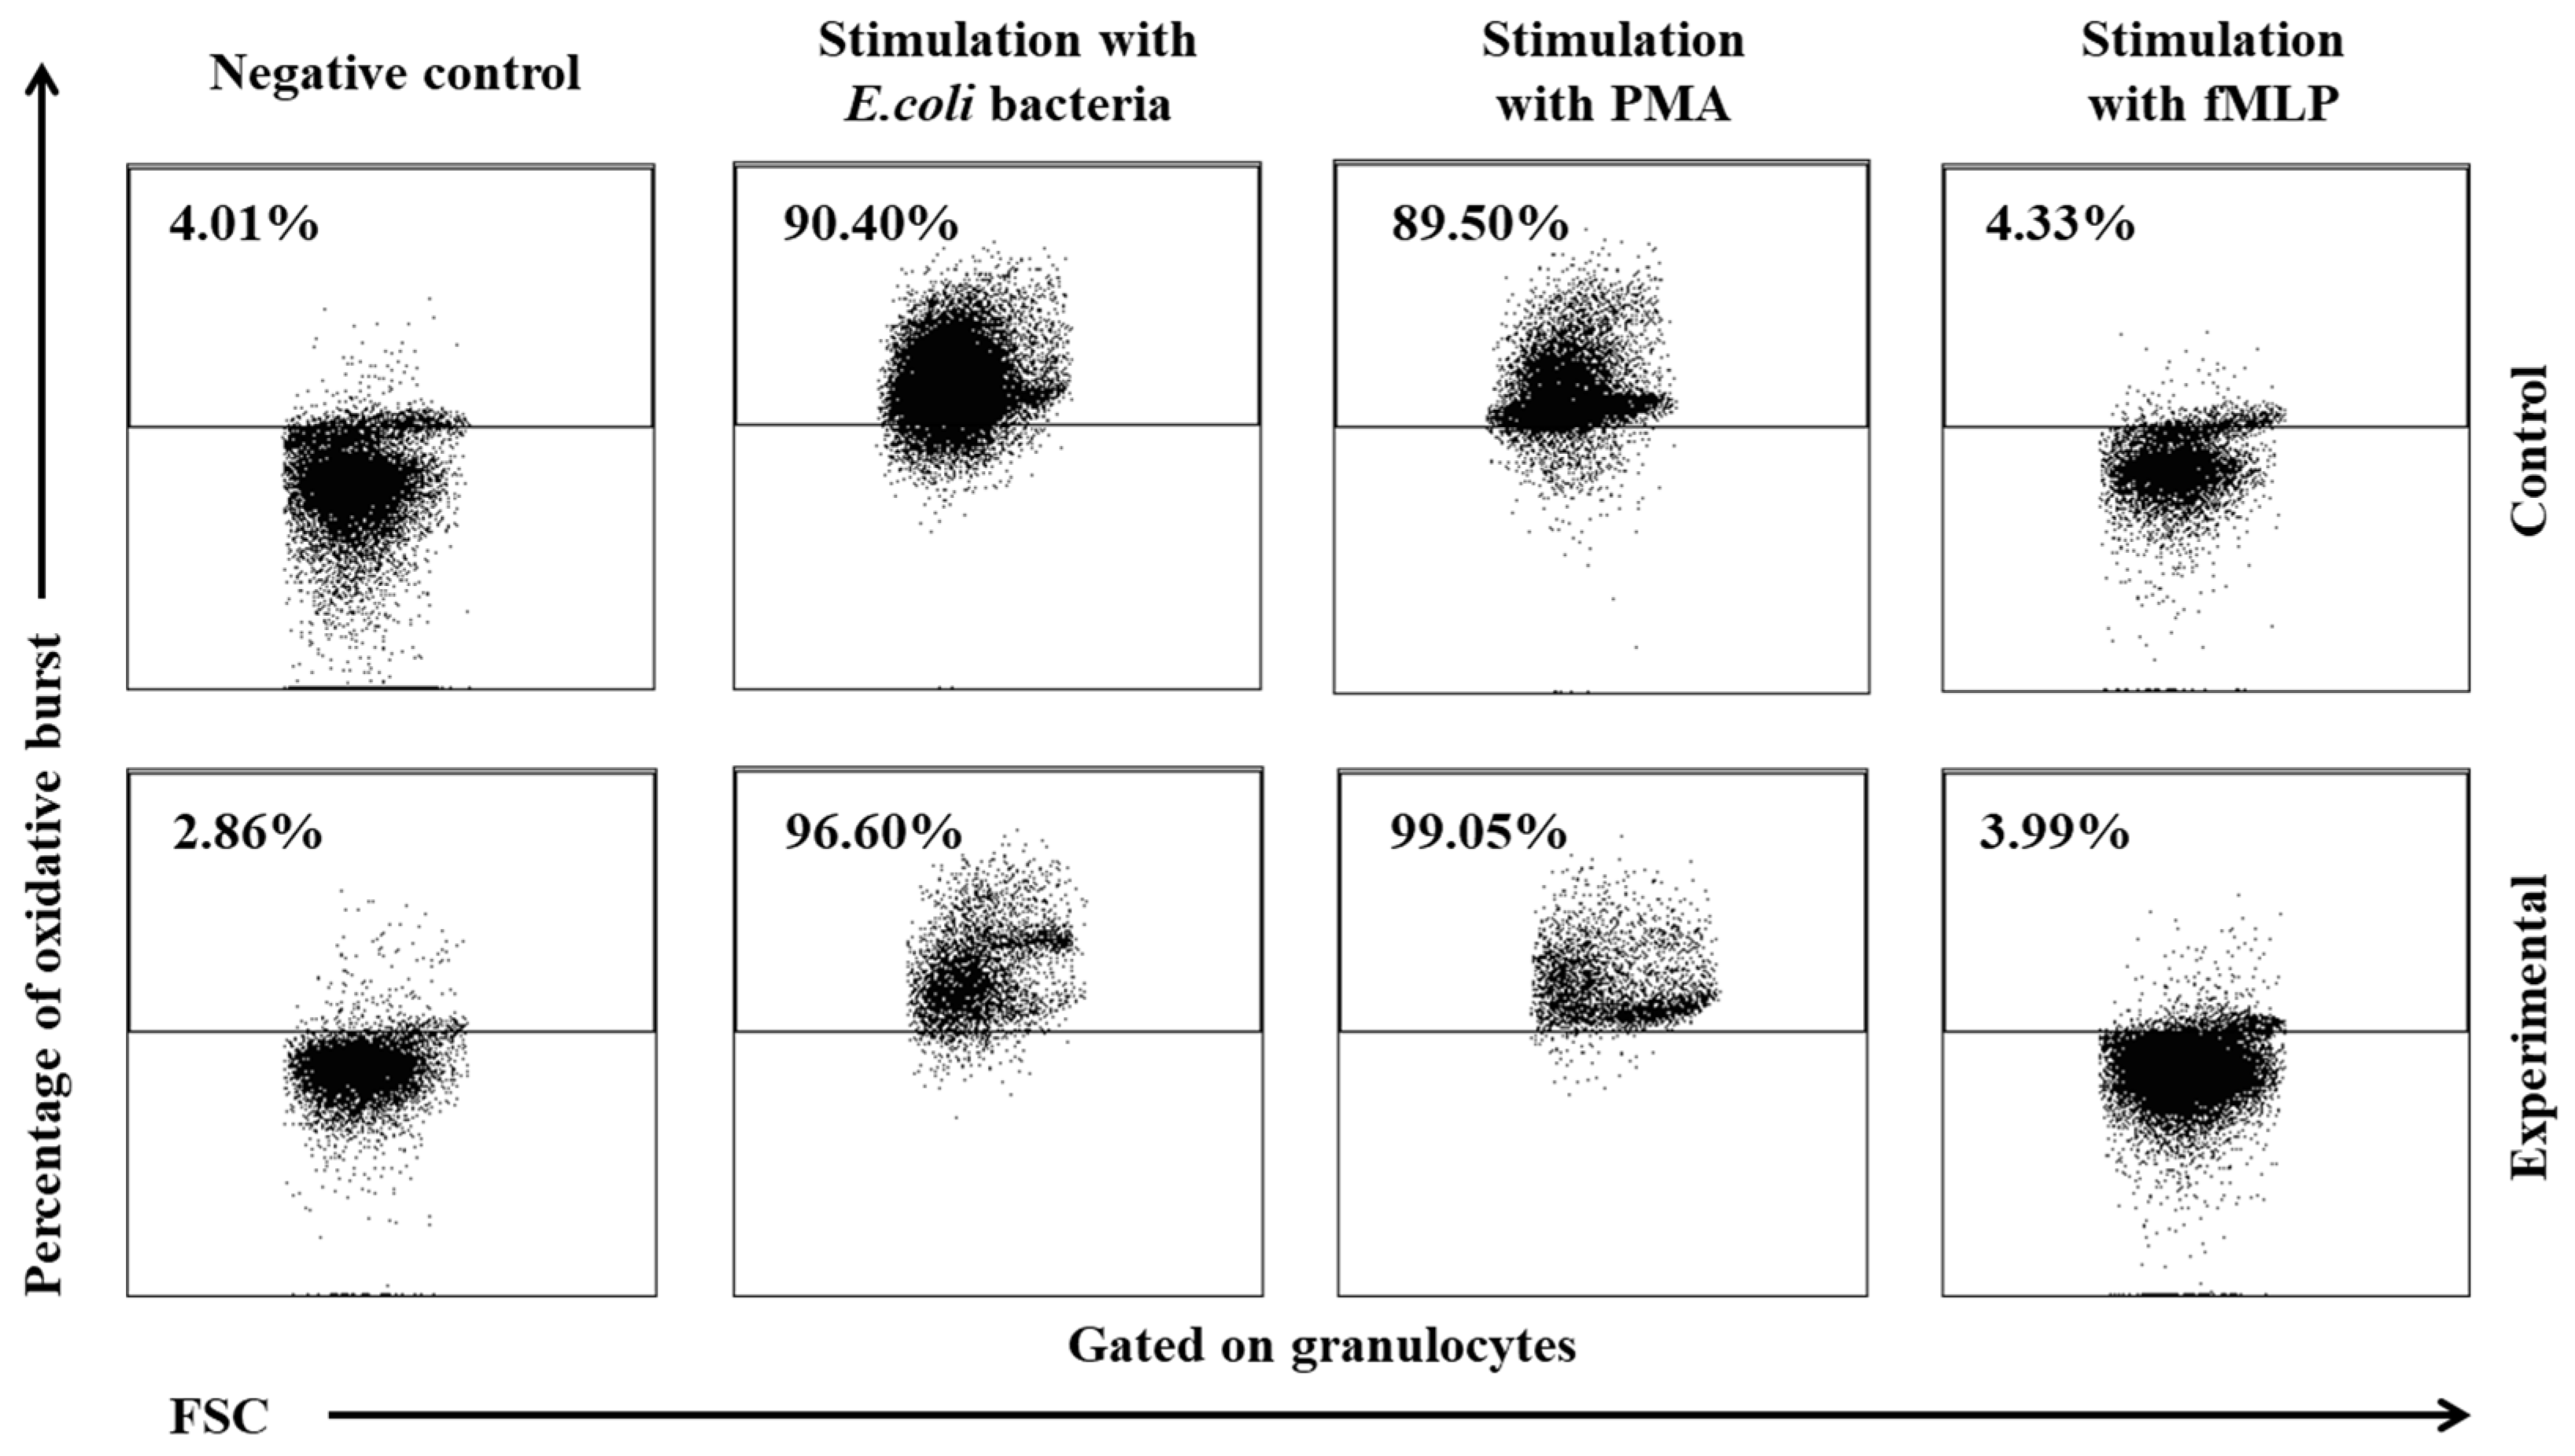
Dot plot cytogram showing the percentage of granulocytes stimulated to undergo respiratory burst in control and experimental lambs on experimental day 30. Whole heparinised blood from control group and experimental group (supplemented with the multi-strain probiotic) animals was divided into four test tubes. The samples were combined with the washing solution (negative control), E. coli bacteria (opsonizing stimulus), PMA (strong stimulus) or fMLP (weak stimulus) and incubated with dihydrorhodamine 123 in a water bath at a temperature of 37°C. After incubation, cells were lysed and the DNA staining solution was added. The percentages of granulocytes stimulated to undergo respiratory burst (conversion of dihydrorhodamine 123 to rhodamine 123) were gated.
Figure 7.
Mean fluorescence intensity (MFI) of granulocytes in lamb groups after stimulation with fMLP, PMA and E. coli in the Phagoburst test. Key: C – control group; E – experimental group; SD – standard deviation; Numerical results were presented as the arithmetic mean ± SD. The significance level was set at 0.05. * p<0.05; ** p<0.01; *** p<0.001; **** p<0.0001; A – p≤0.05; B – p≤0.01; C – p≤0.001; D – p≤0.0001 relative to day 0.
Figure 8.
Percentage of monocytes stimulated to undergo respiratory burst in lamb groups after stimulation with fMLP, PMA and E. coli in the Phagoburst test. Key: C – control group; E – experimental group; SD - standard deviation; Numerical results were presented as the arithmetic mean ± SD. The significance level was set at 0.05. * p<0.05; A - p≤0.05; B - p≤0.01 relative to day 0.
Figure 9.
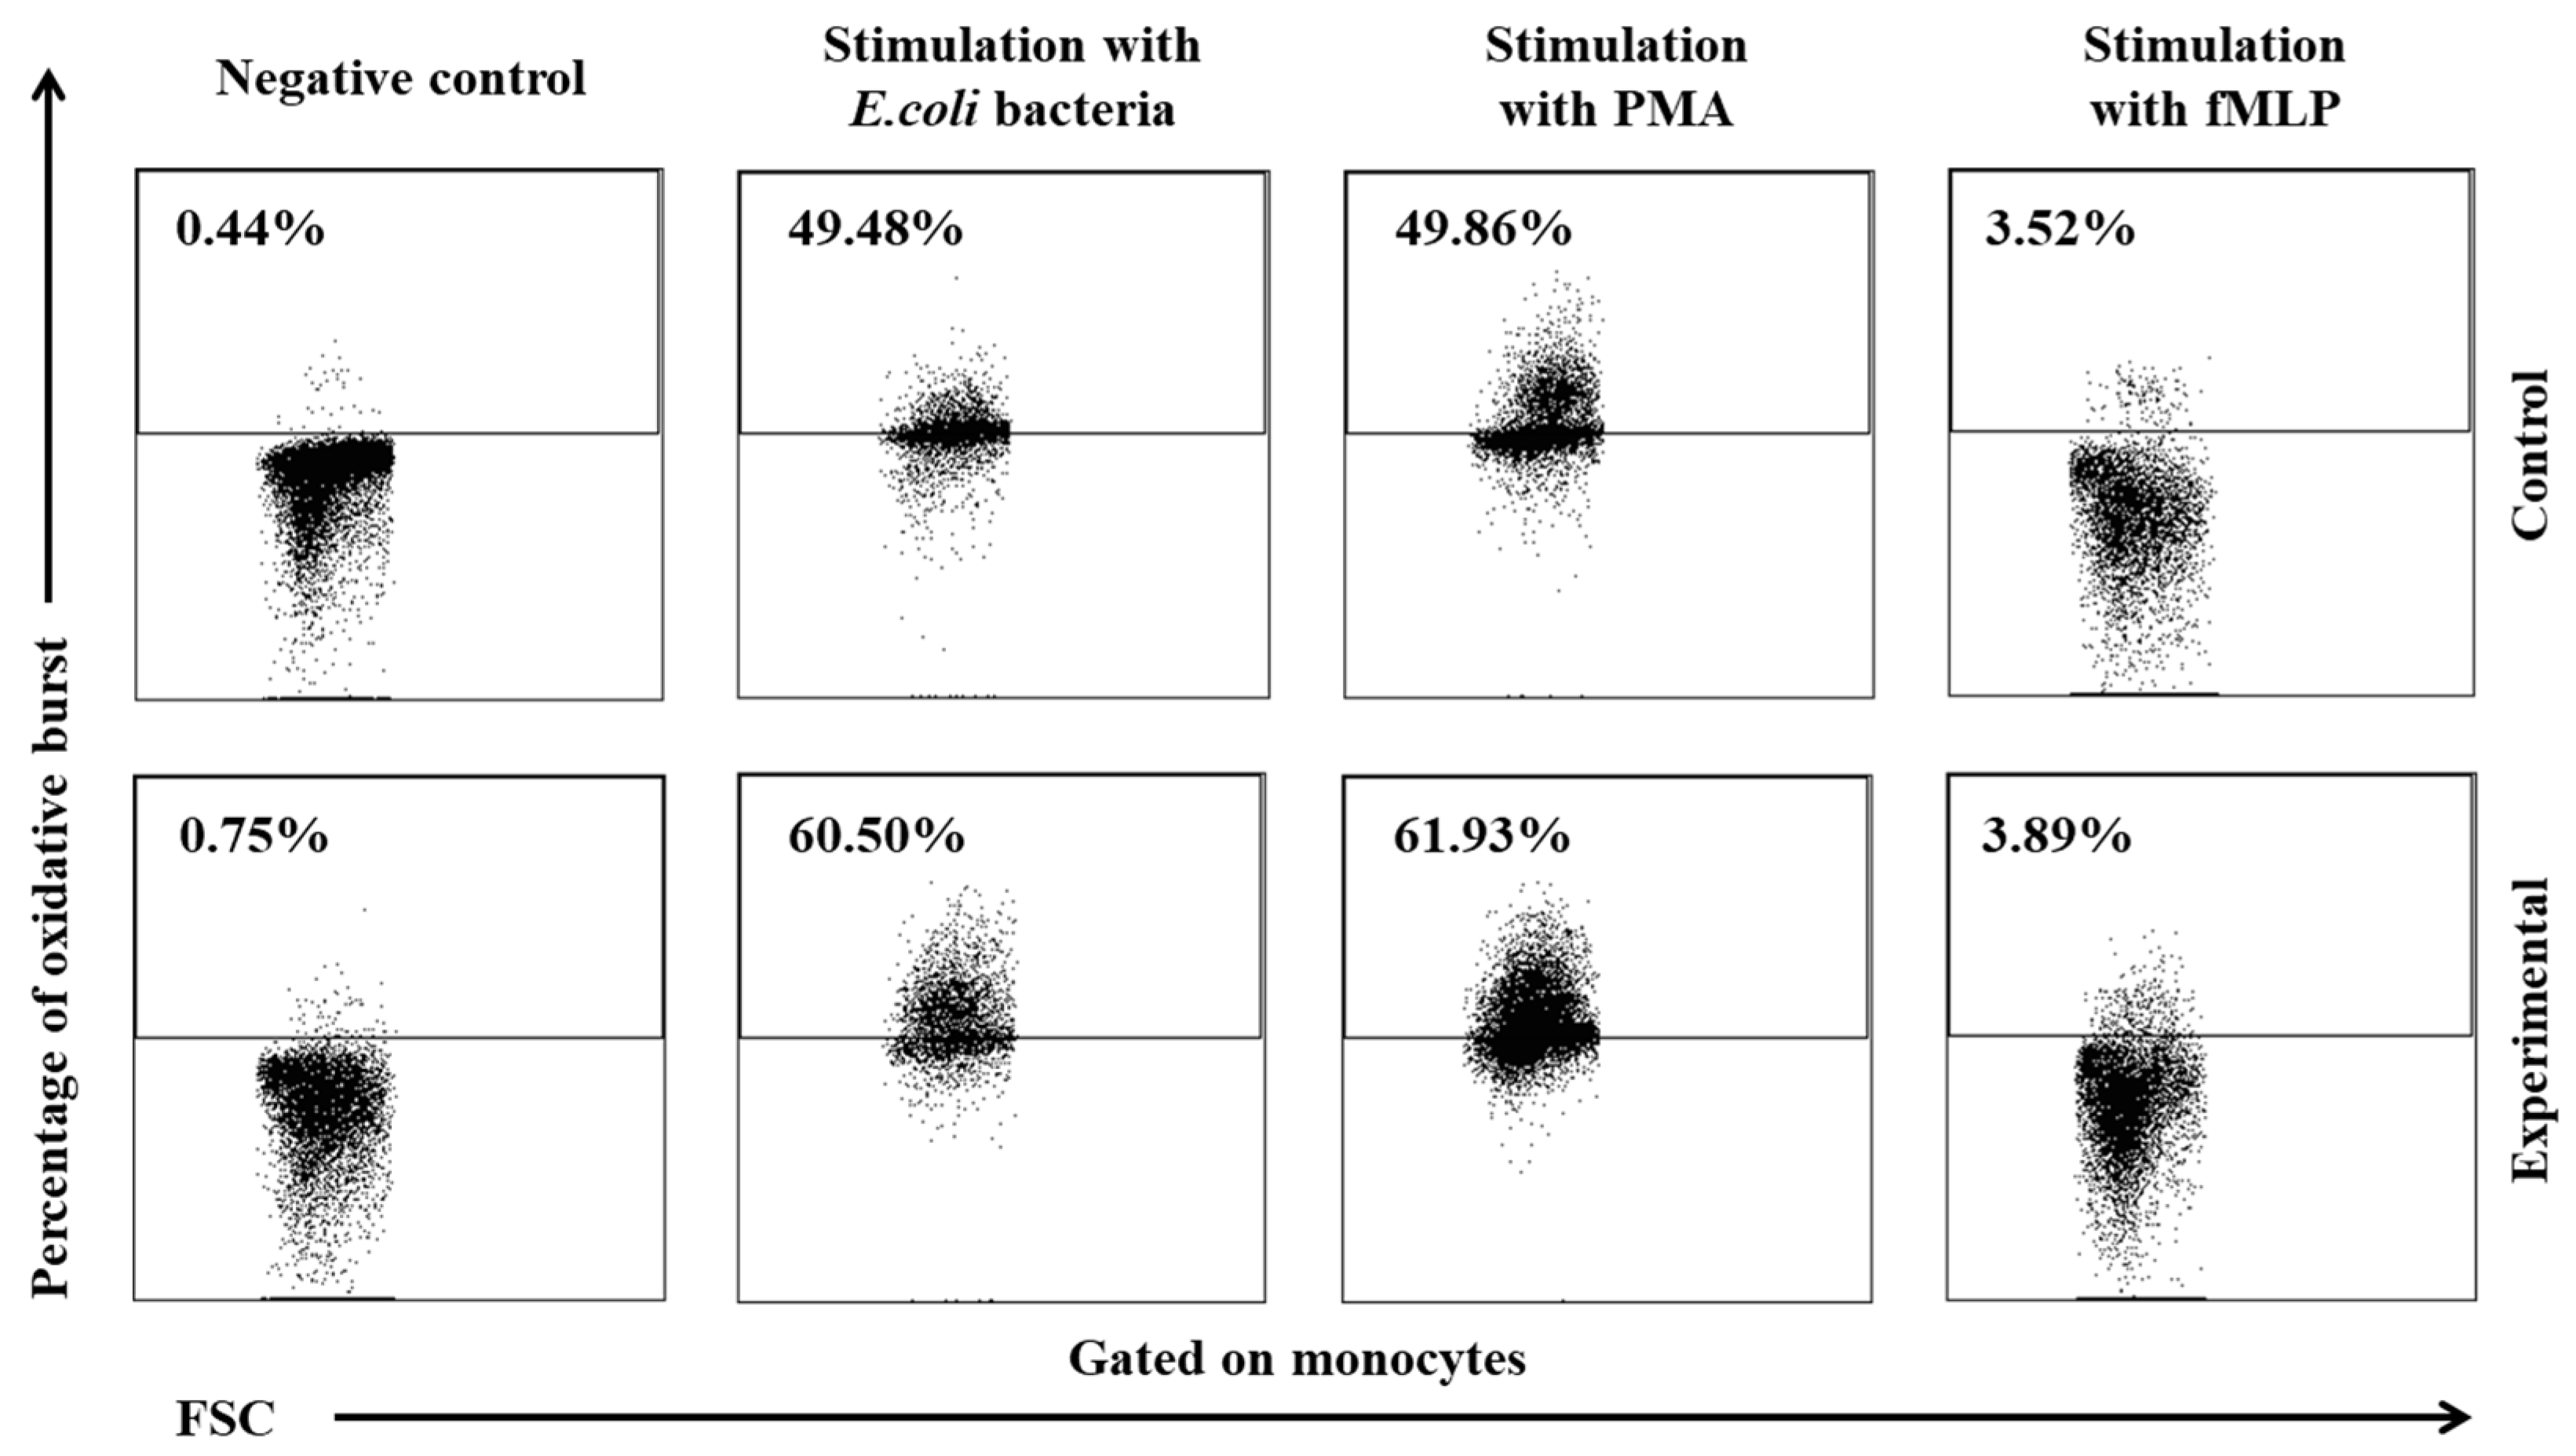
Dot plot cytogram showing the percentage of monocytes stimulated to undergo respiratory burst in control and experimental group lambs on experimental day 30. Whole heparinised blood from control group and experimental group (supplemented with the multi-strain probiotic) animals was divided into four test tubes. The samples were combined with the washing solution (negative control), E. coli bacteria (opsonizing stimulus), PMA (strong stimulus) or fMLP (weak stimulus) and incubated with dihydrorhodamine 123 in a water bath at a temperature of 37°C. After incubation, cells were lysed and the DNA staining solution was added. The percentages of granulocytes stimulated to undergo respiratory burst (conversion of dihydrorhodamine 123 to rhodamine 123) were gated.
Figure 10.
Mean fluorescence intensity (MFI) of monocytes in lamb groups after stimulation with fMLP, PMA and E. coli in the Phagoburst test. Key: C – control group; E – experimental group; SD - standard deviation; Numerical results were presented as the arithmetic mean ± SD. The significance level was set at 0.05. * p<0.05; ** p<0.01; *** p<0.001; **** p<0.0001; A - p≤0.05; B - p≤0.01; C - p≤0.001; D - p≤0.0001 relative to day 0.
Figure 11.
Gating strategy for analysing flow cytometry data. Granulocytes and monocytes were gated based on forward and side scatter (FSC/SSC) parameters. Each cell subset was analysed for the relative number of phagocytising cells and cells stimulated for respiratory burst (fMLP, PMA or E. coli bacteria).
Table 1.
Percentage of phagocytic granulocytes and mean fluorescence intensity of granulocytes in lamb groups in the Phagotest.
Table 1.
Percentage of phagocytic granulocytes and mean fluorescence intensity of granulocytes in lamb groups in the Phagotest.
Table 2.
Percentage of phagocytic monocytes and the mean fluorescence intensity of monocytes in lamb groups in the Phagotest. Key: SD - standard deviation; Numerical results were presented as the arithmetic mean ± SD. The significance level was set at 0.05. * p<0.05; ** p<0.01; *** p<0.001; A - p≤0.05; B - p≤0.01; C - p≤0.001 relative to day 0.
Table 3.
Average intracellular killing activity of granulocytes and mean fluorescence intensity in lamb groups after stimulation with fMLP, PMA and E. coli, as determined in the Phagoburst. Key: SD - standard deviation; Numerical results were presented as the arithmetic mean ± SD. The significance level was set at 0.05. * p<0.05; ** p<0.01; *** p<0.001; A - p≤0.05; B - p≤0.01; C - p≤0.001 relative to day 0.
Table 4.
Average intracellular killing activity of monocytes and mean fluorescence intensity in lamb groups after stimulation with fMLP, PMA and E. coli in the Phagoburst test. Key: SD – standard deviation; Numerical results were presented as the arithmetic mean ± SD. The significance level was set at 0.05. * p<0.05; ** p<0.01; A – p≤0.05; B – p≤0.01 relative to day 0.
