Submitted:
06 April 2024
Posted:
08 April 2024
You are already at the latest version
Abstract
Keywords:
1. Introduction
2. Materials and Methods
2.1. Cells and Live Virus Stock Preparation
2.2. Construction and Generation of Recombinant Baculoviruses Expressing RSV PreFg, RSV G and M Protein
2.3. Protein Expression and Confirmation
2.4. Production and Characterization of RSV-VLPs
2.5. Preparation of Inactivated RSV
2.6. Immunization and Challenge of Mice
2.7. Sample Collection and Processing
2.8. ELISA
2.9. Micro Neutralization Test
2.10. RSV-Specific Antibody-Secreting Cells
2.11. IFNγ and IL4 ELISpot
2.12. Cytokine Response after Immunization
2.13. Flow Cytometry
2.14. Statistical Analysis
3. Results
3.1. Generation of Transfer Vectors, Expression Bacmids and Protein Expression
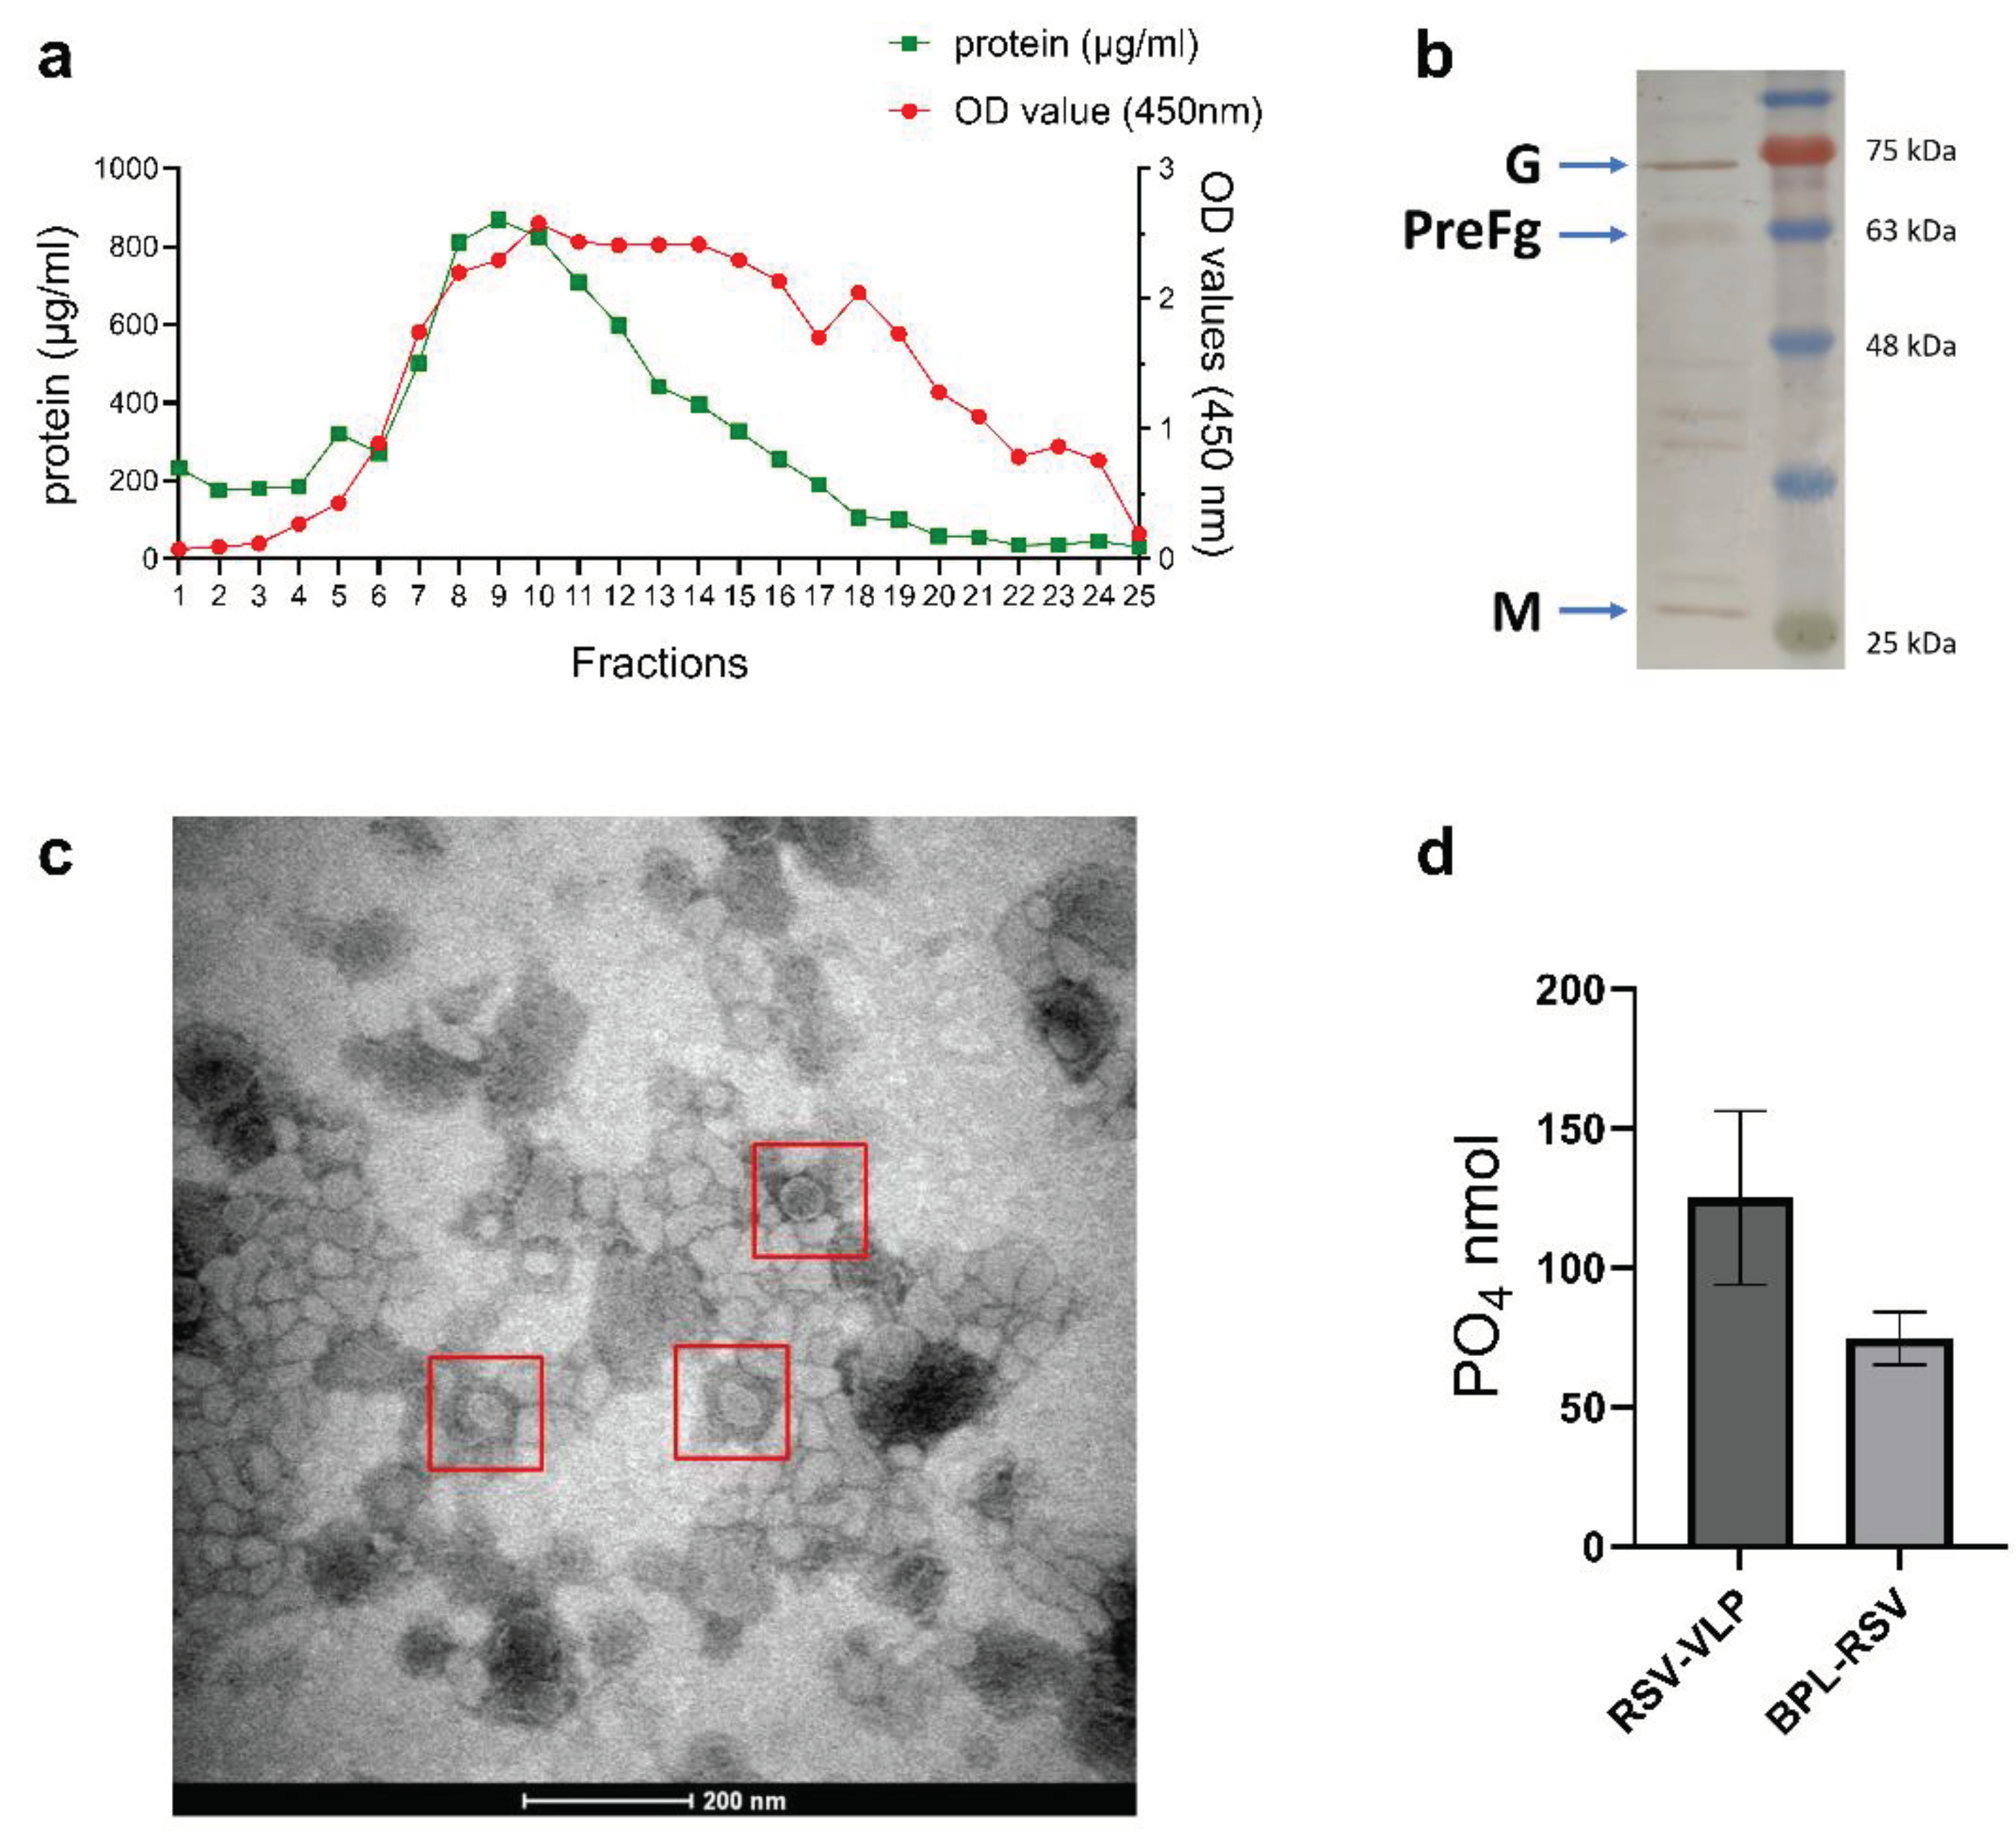
3.2. Production and Characterization of VLPs
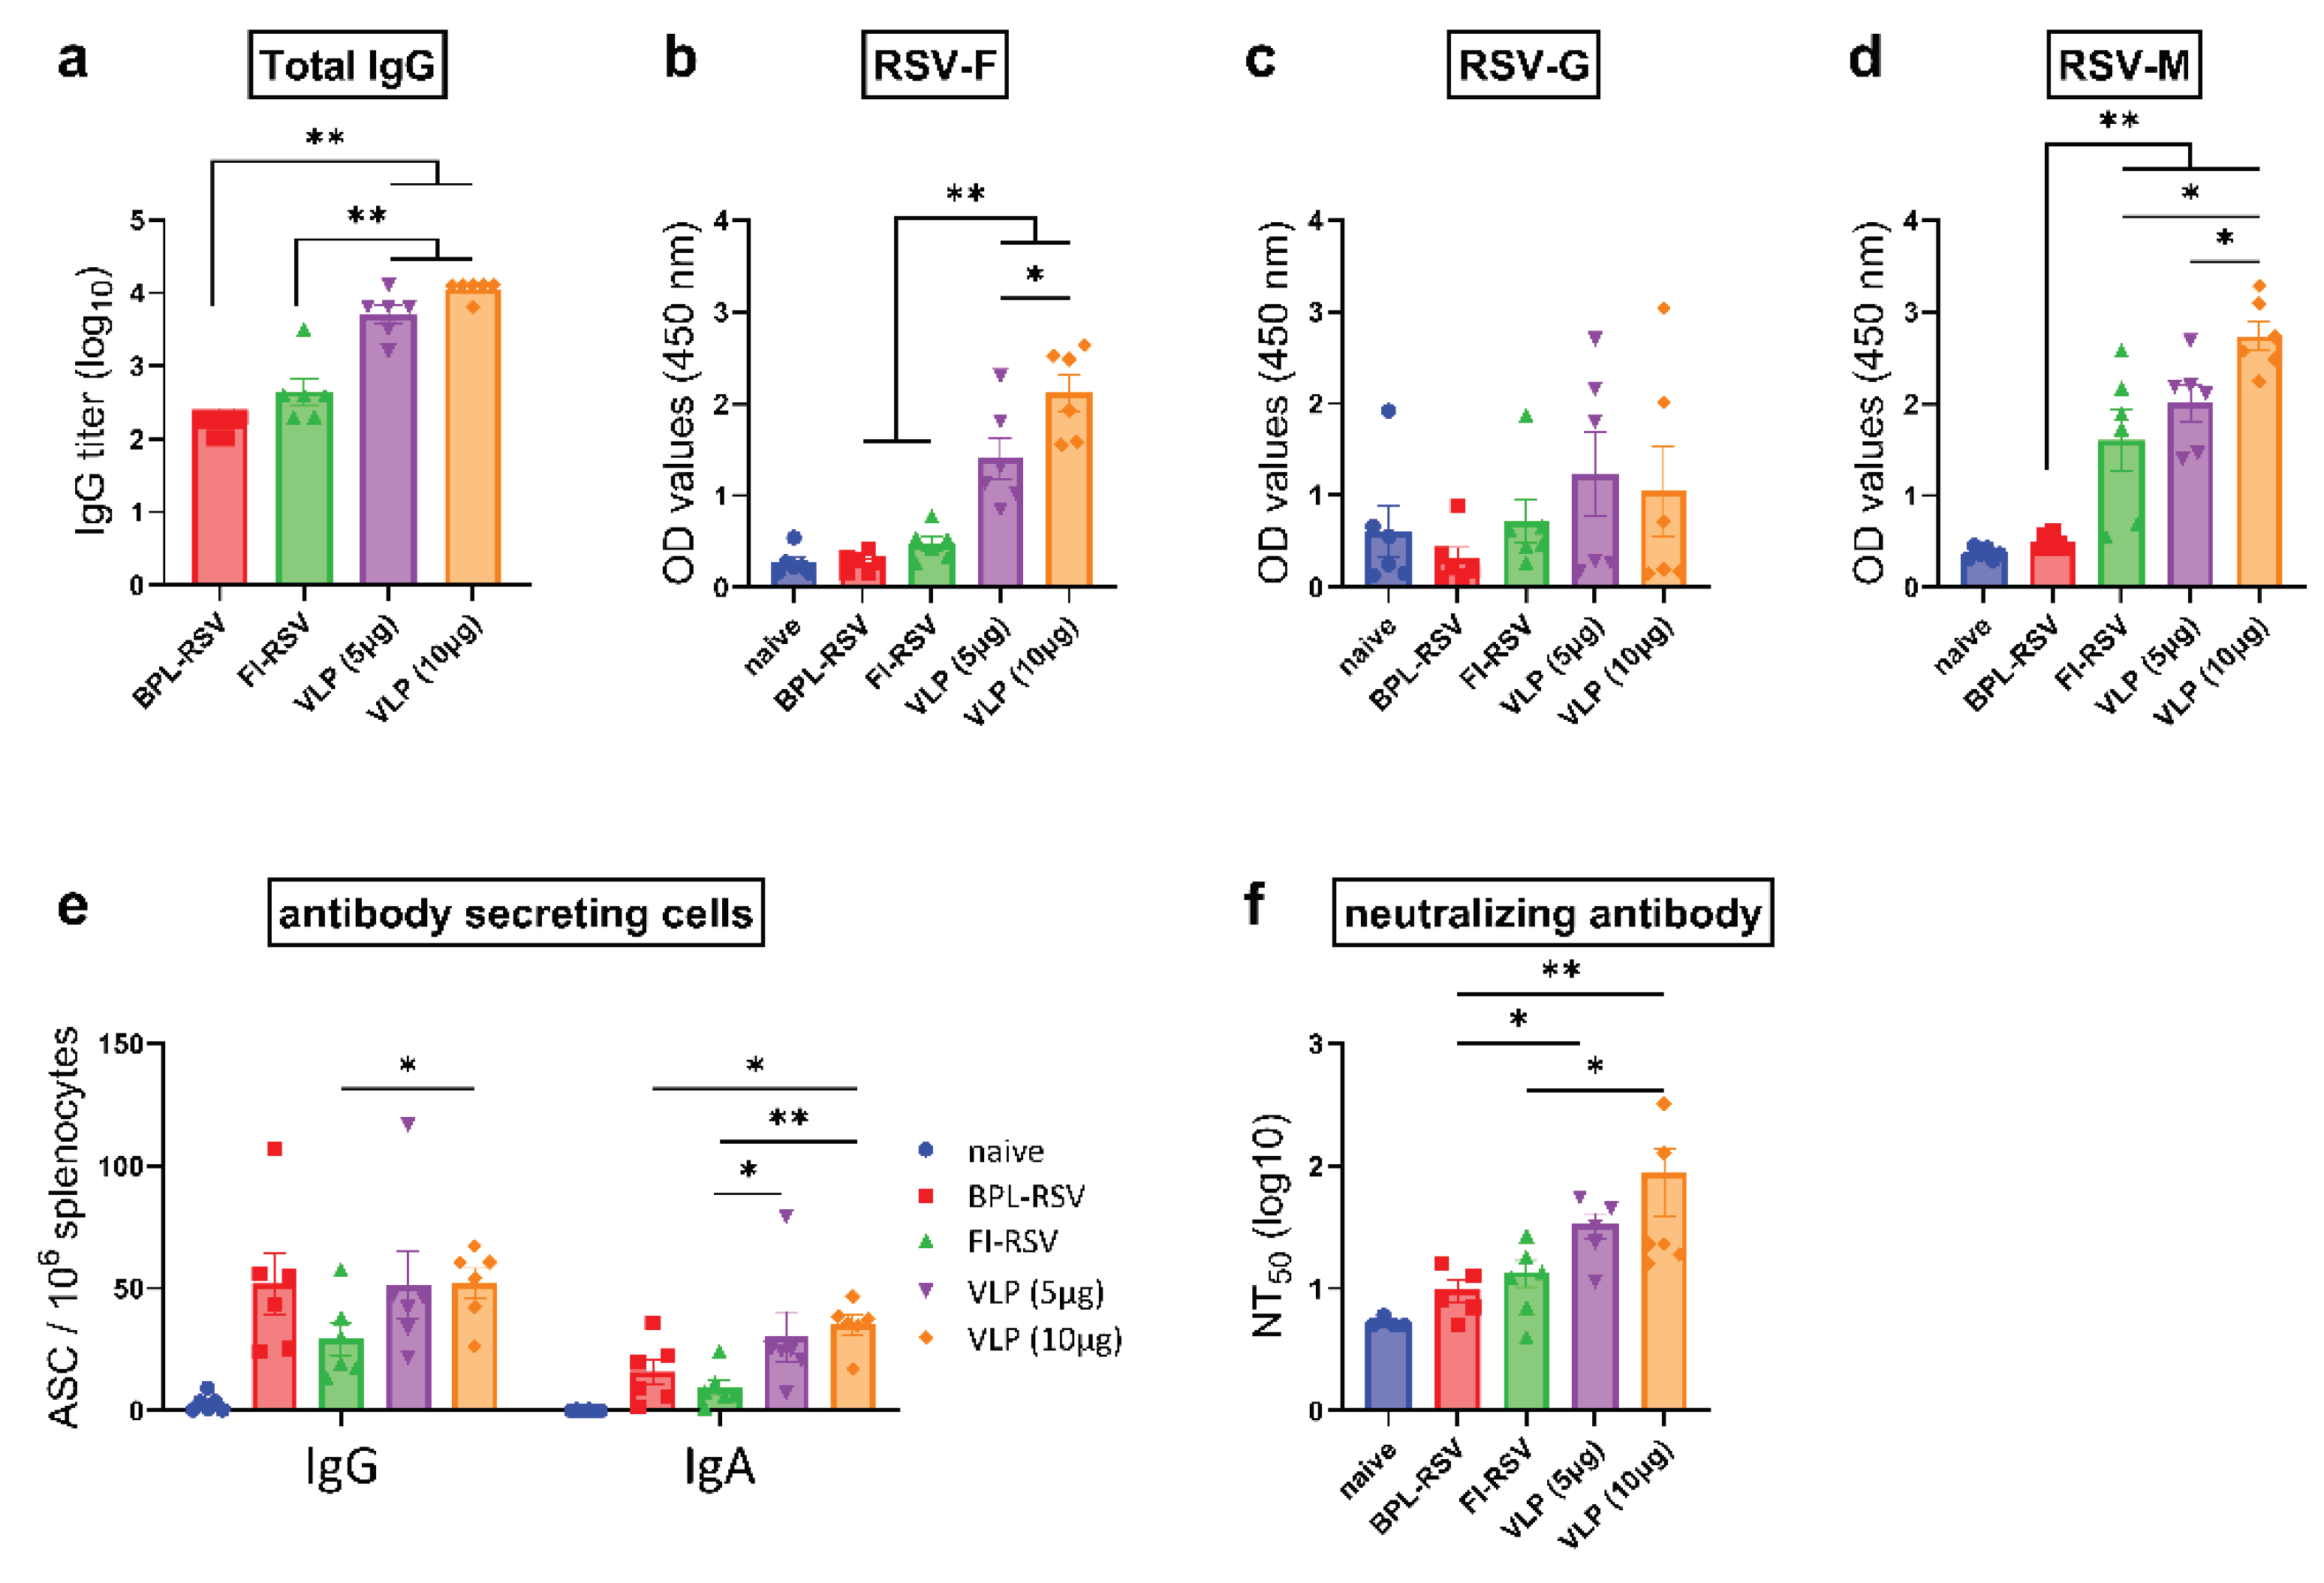
3.3. RSV-VLPs Induce Potent Humoral Immune Responses after Immunization
3.4. IgG Subclass Immune Responses after Immunization
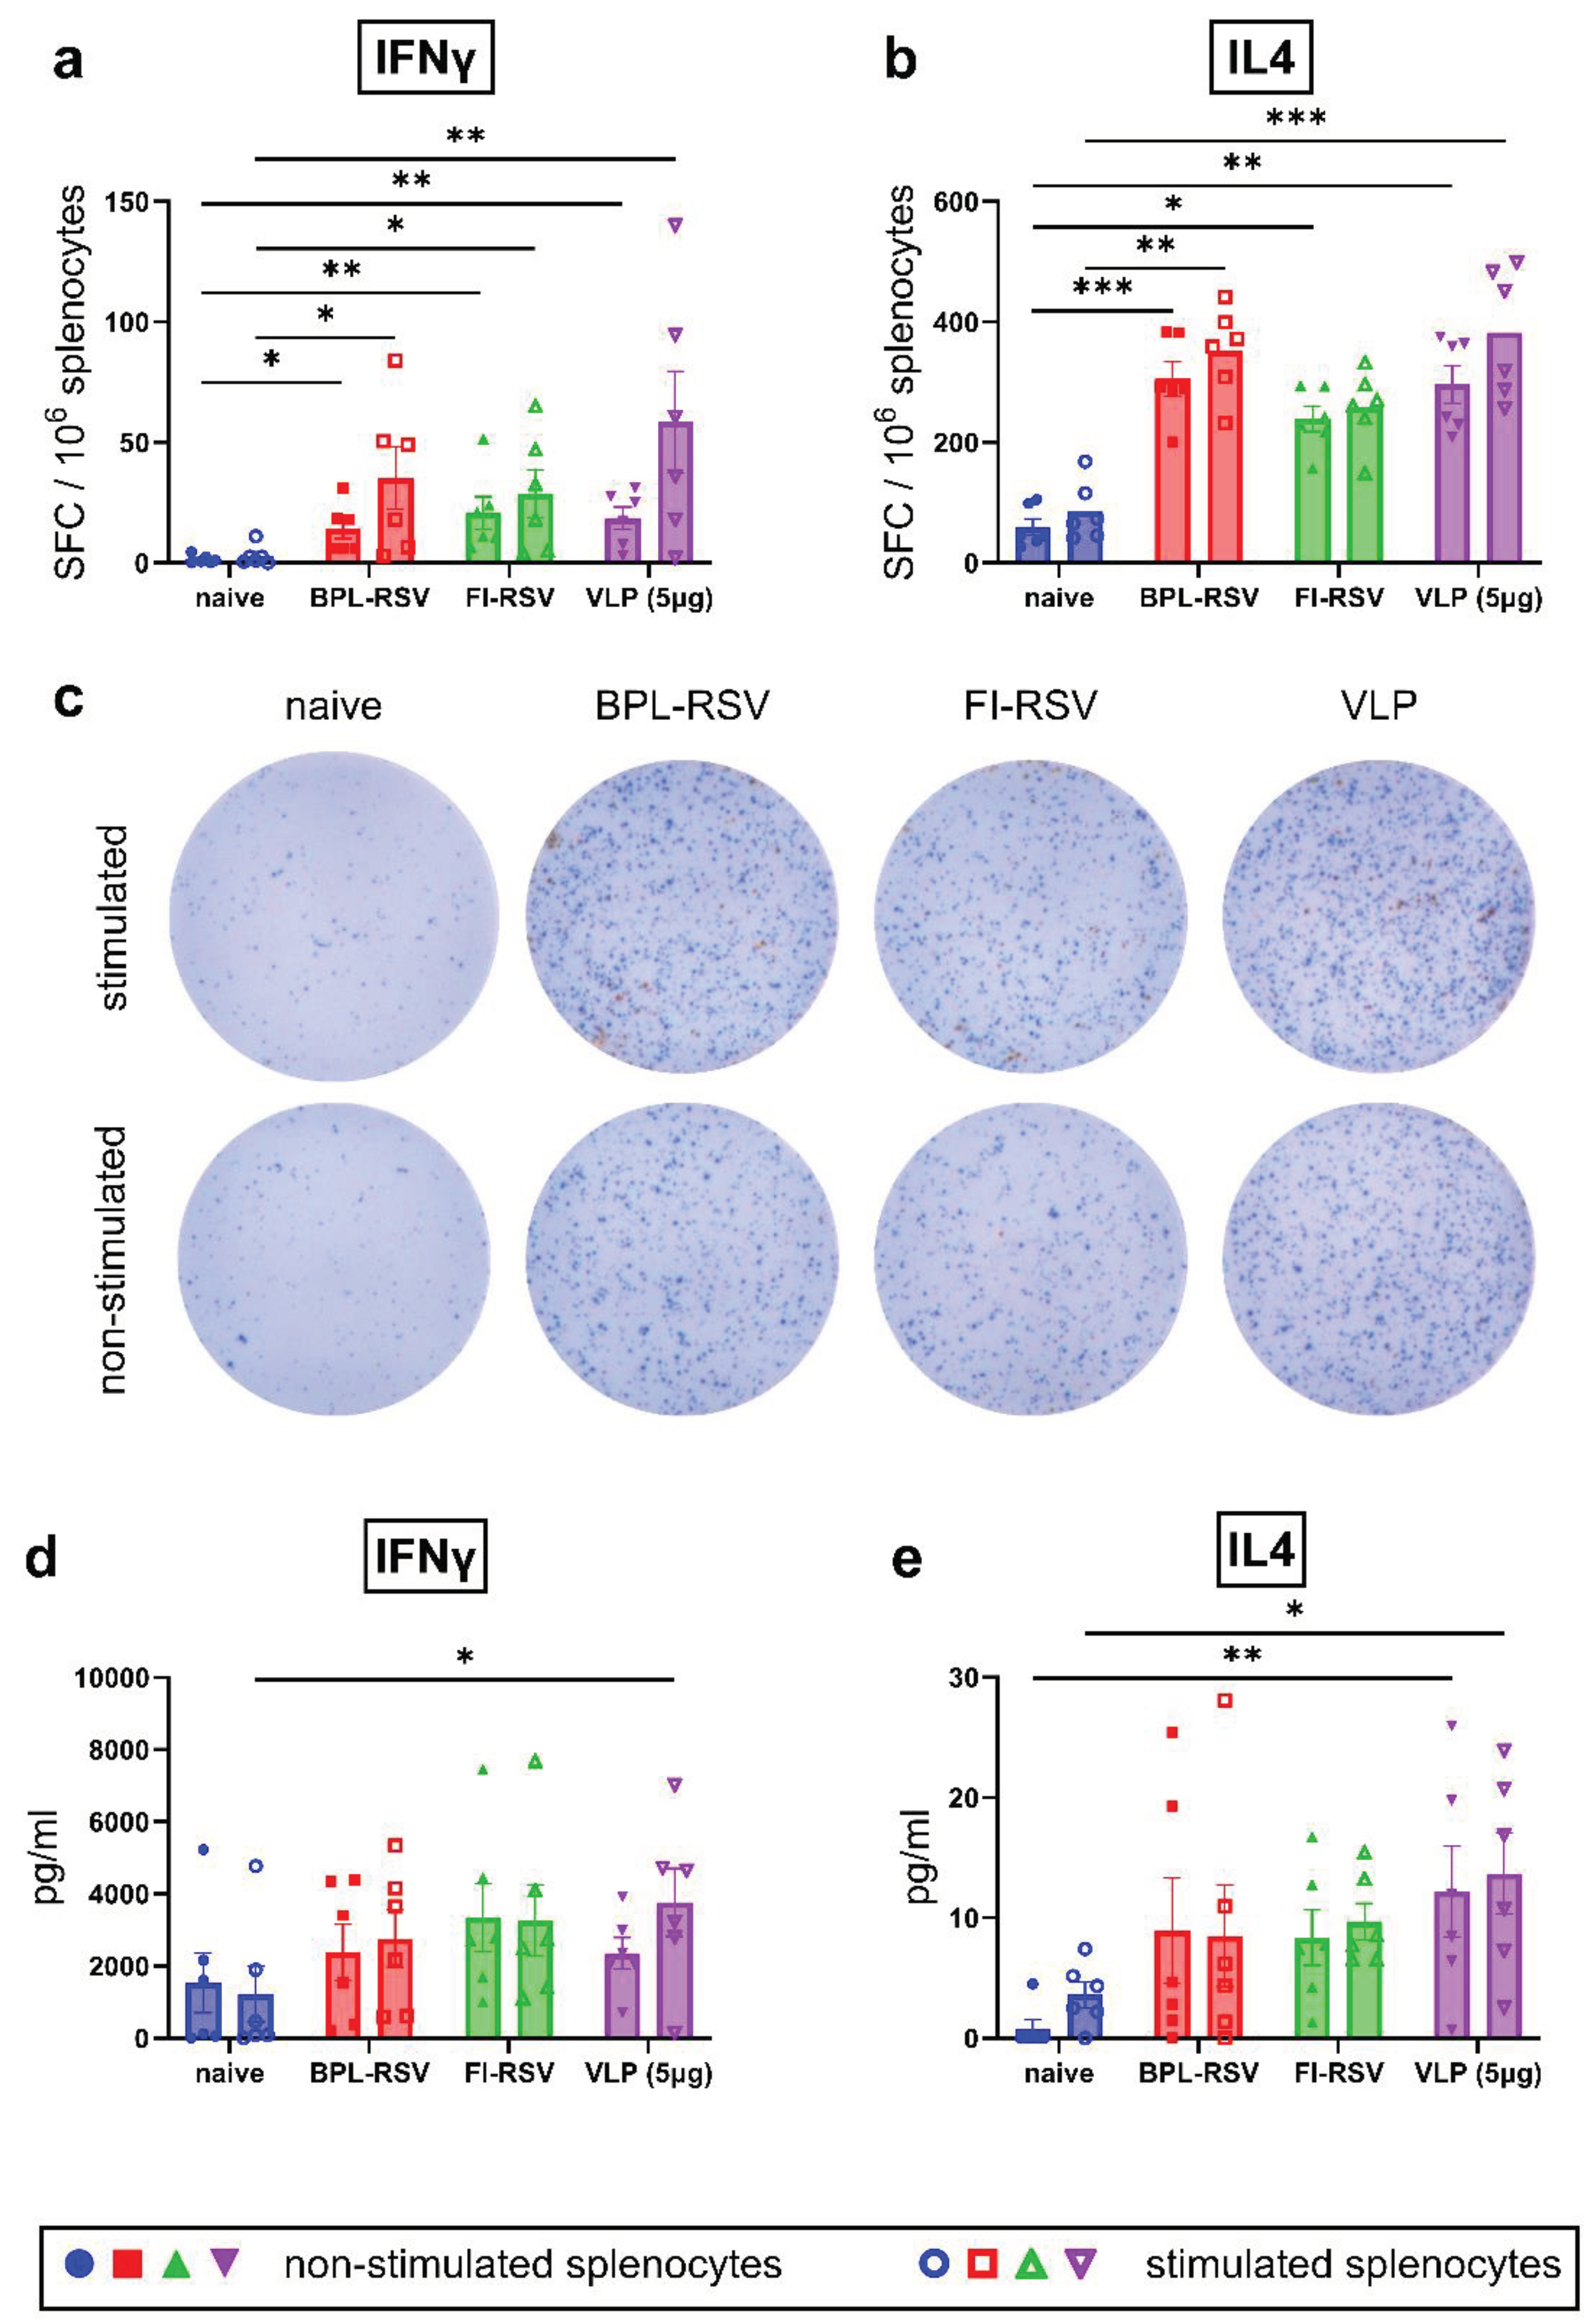
3.5. IFNγ- and IL4-Producing T Cells after Immunization
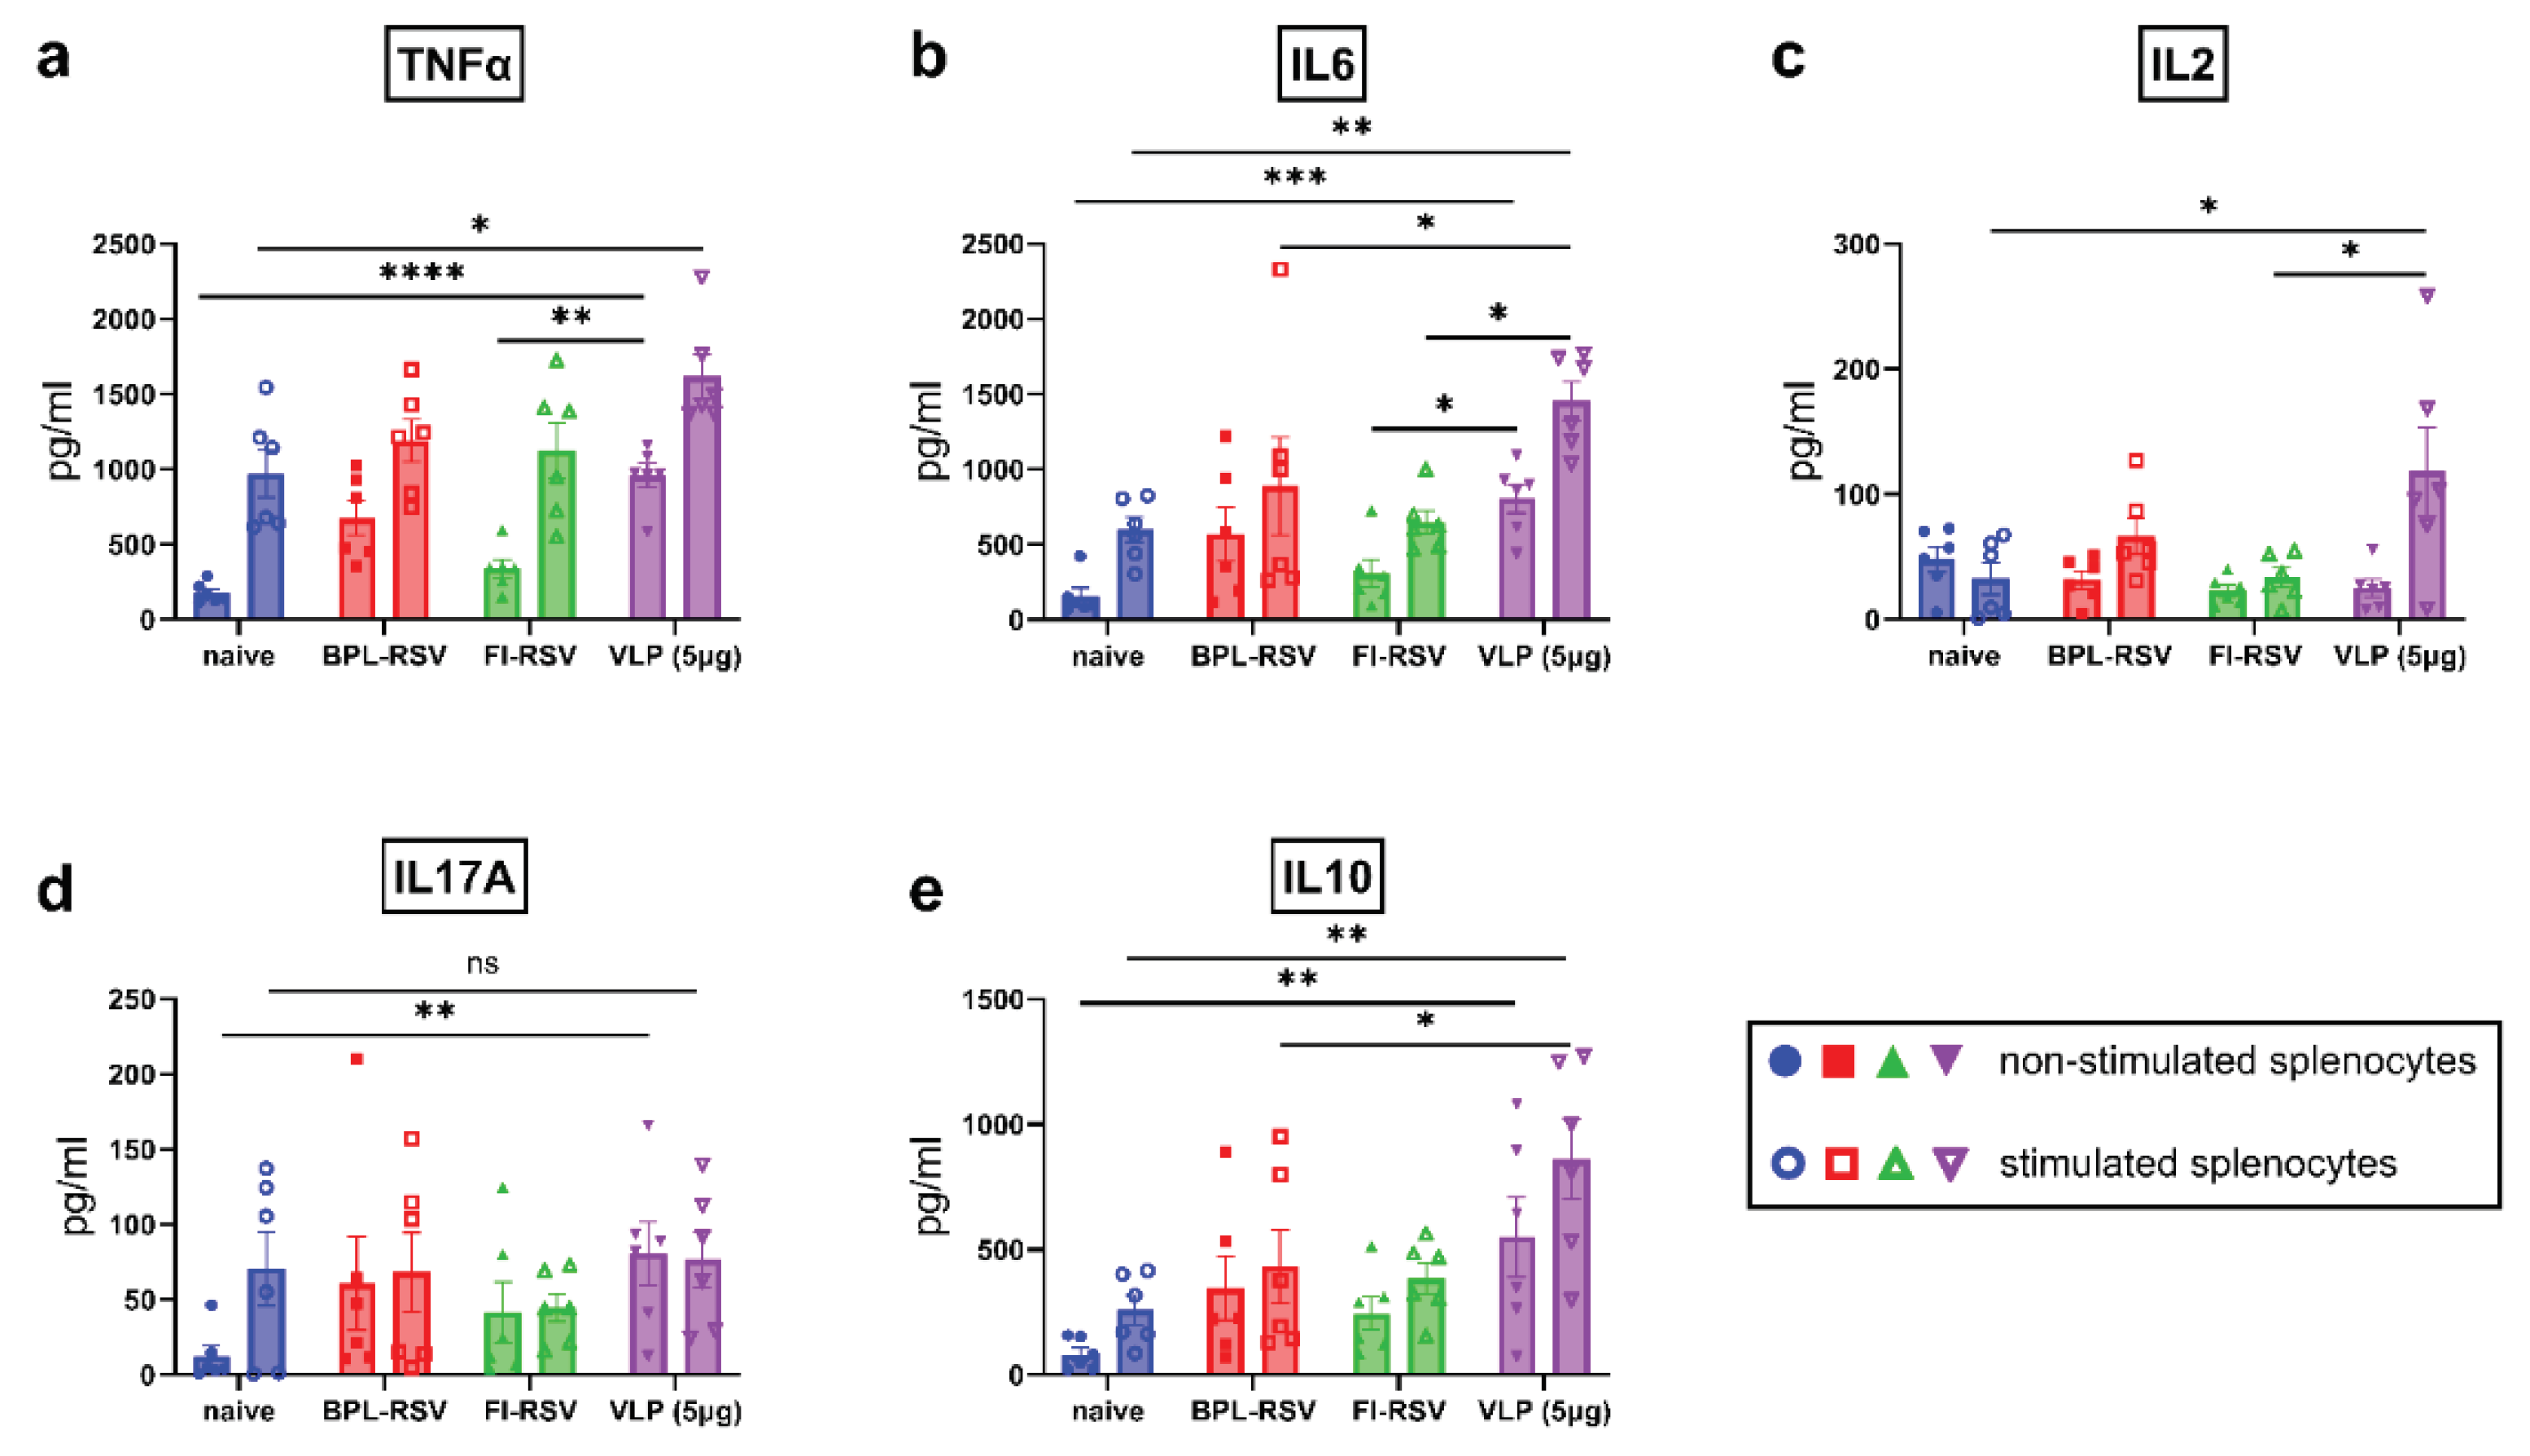
3.6. Inflammatory and Anti-Inflammatory Cytokine Responses after Immunization
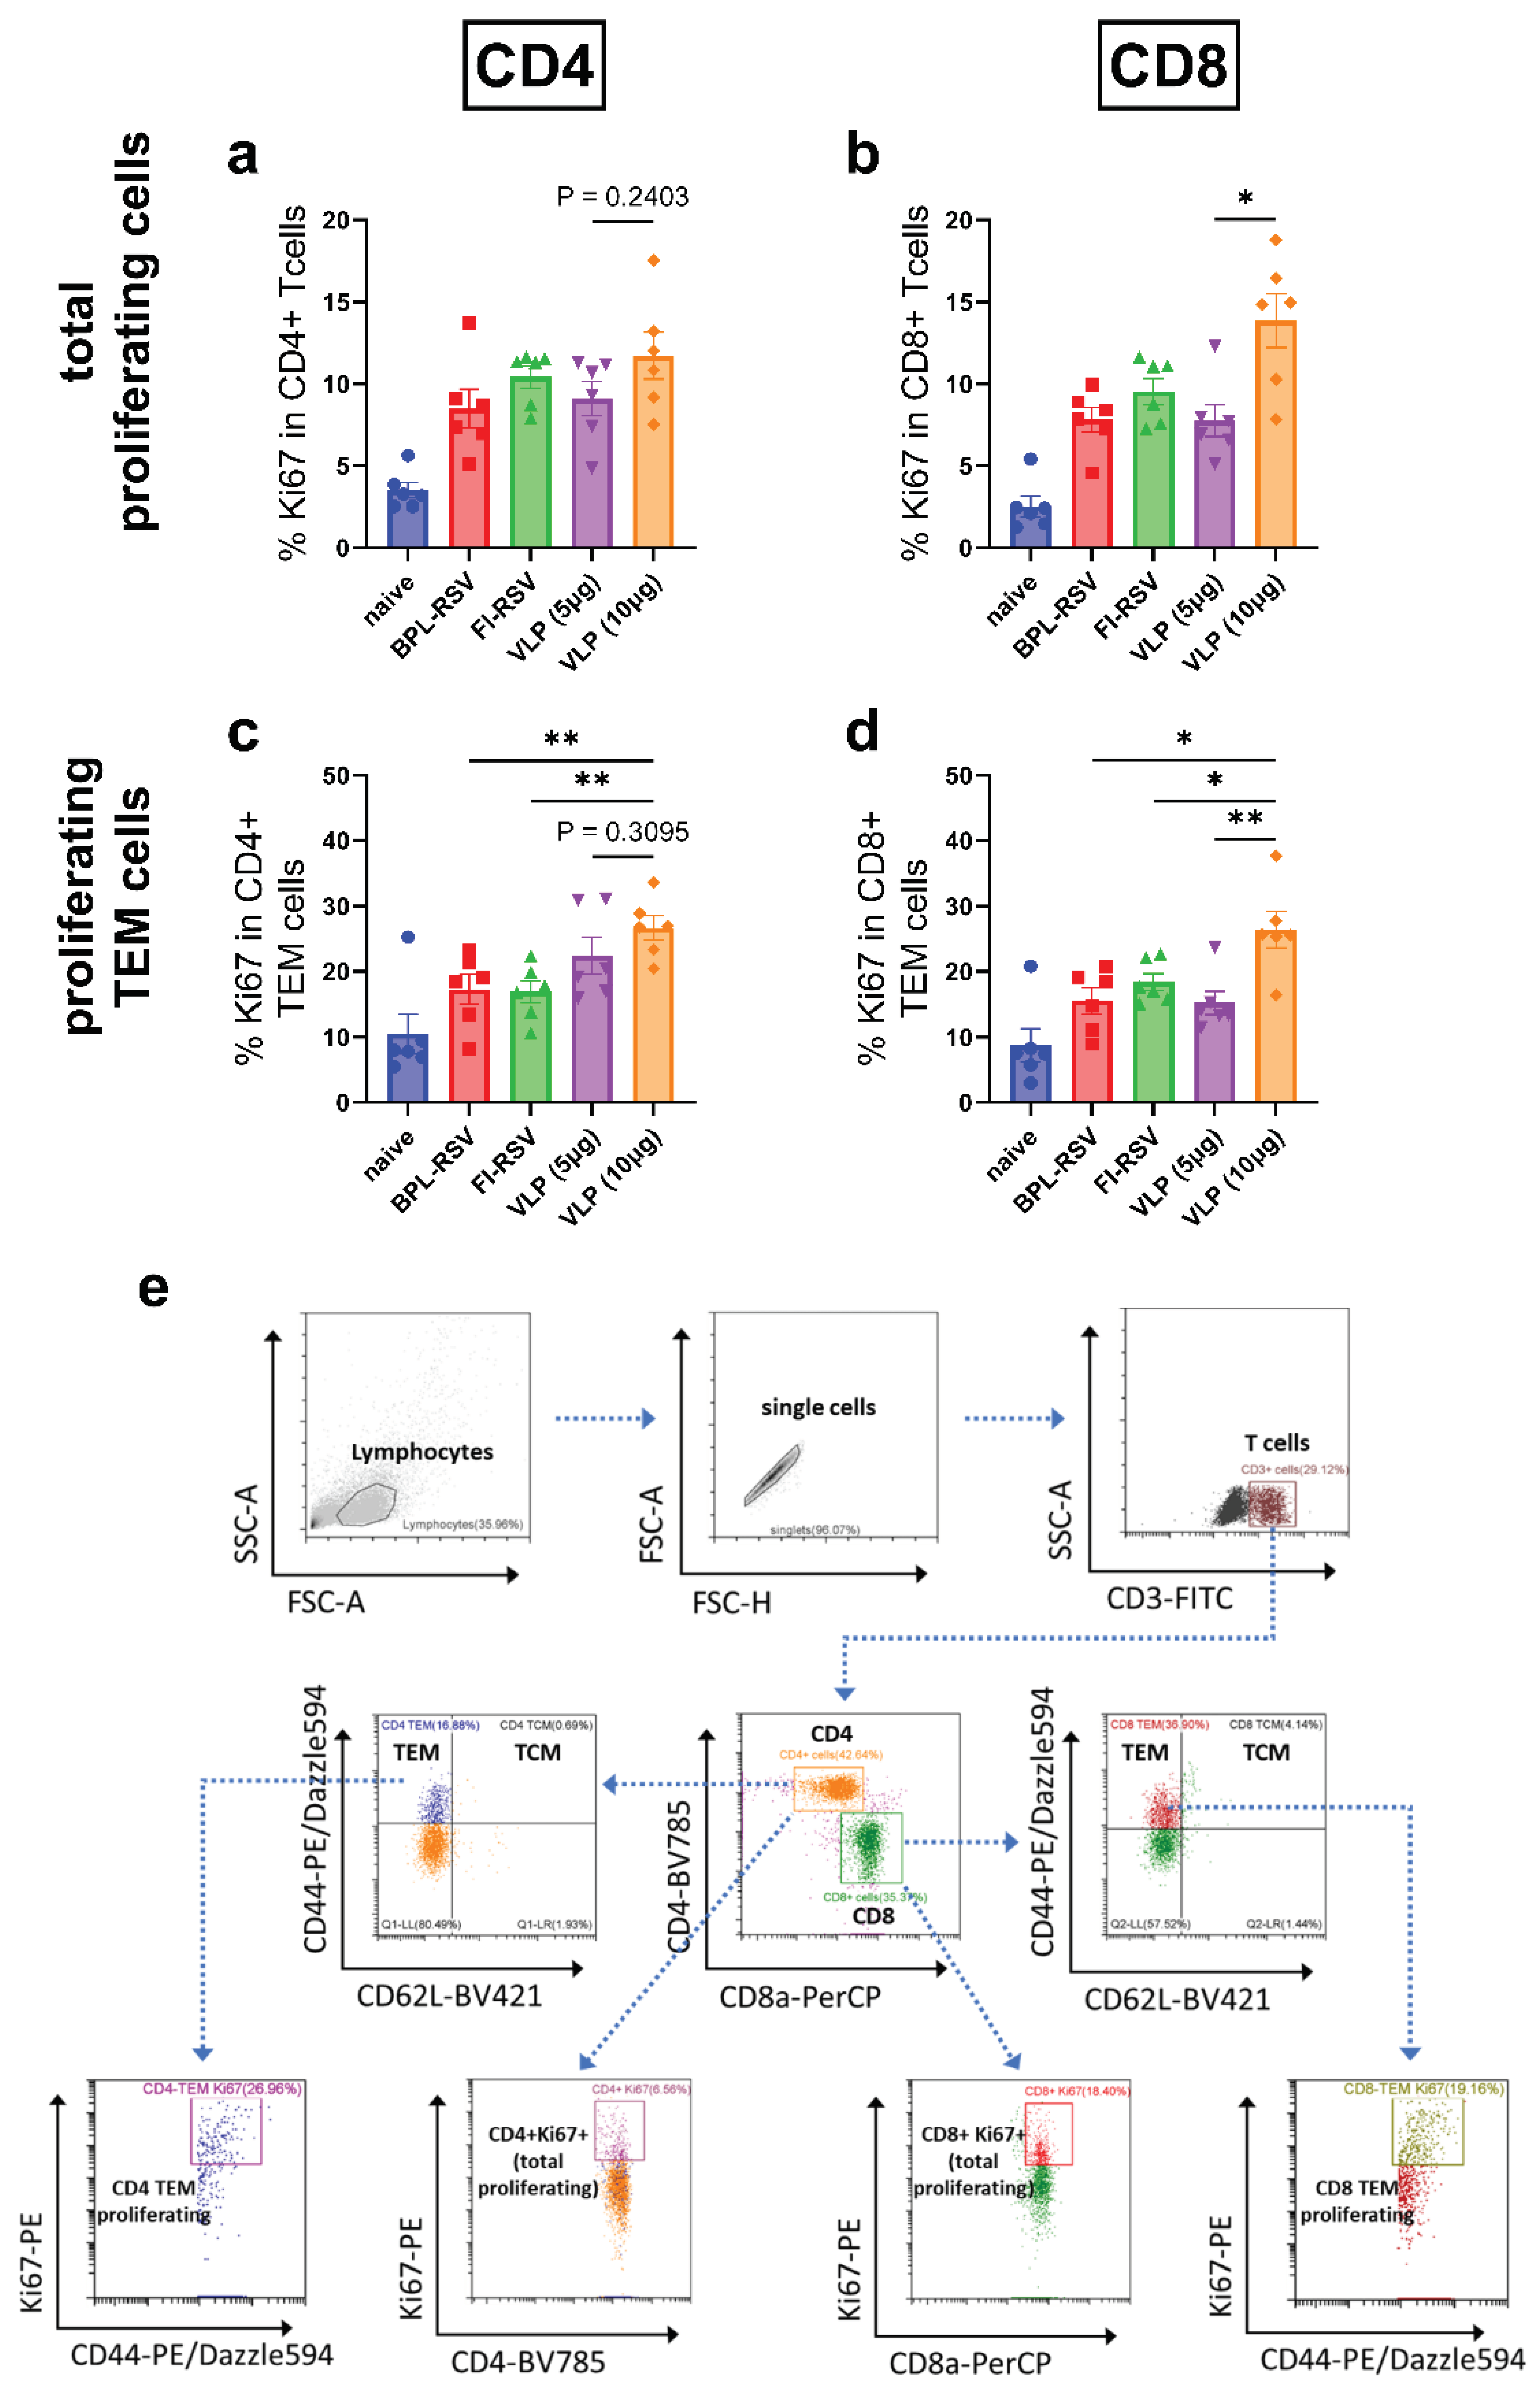
3.7. Memory T Cell Responses after Immunization
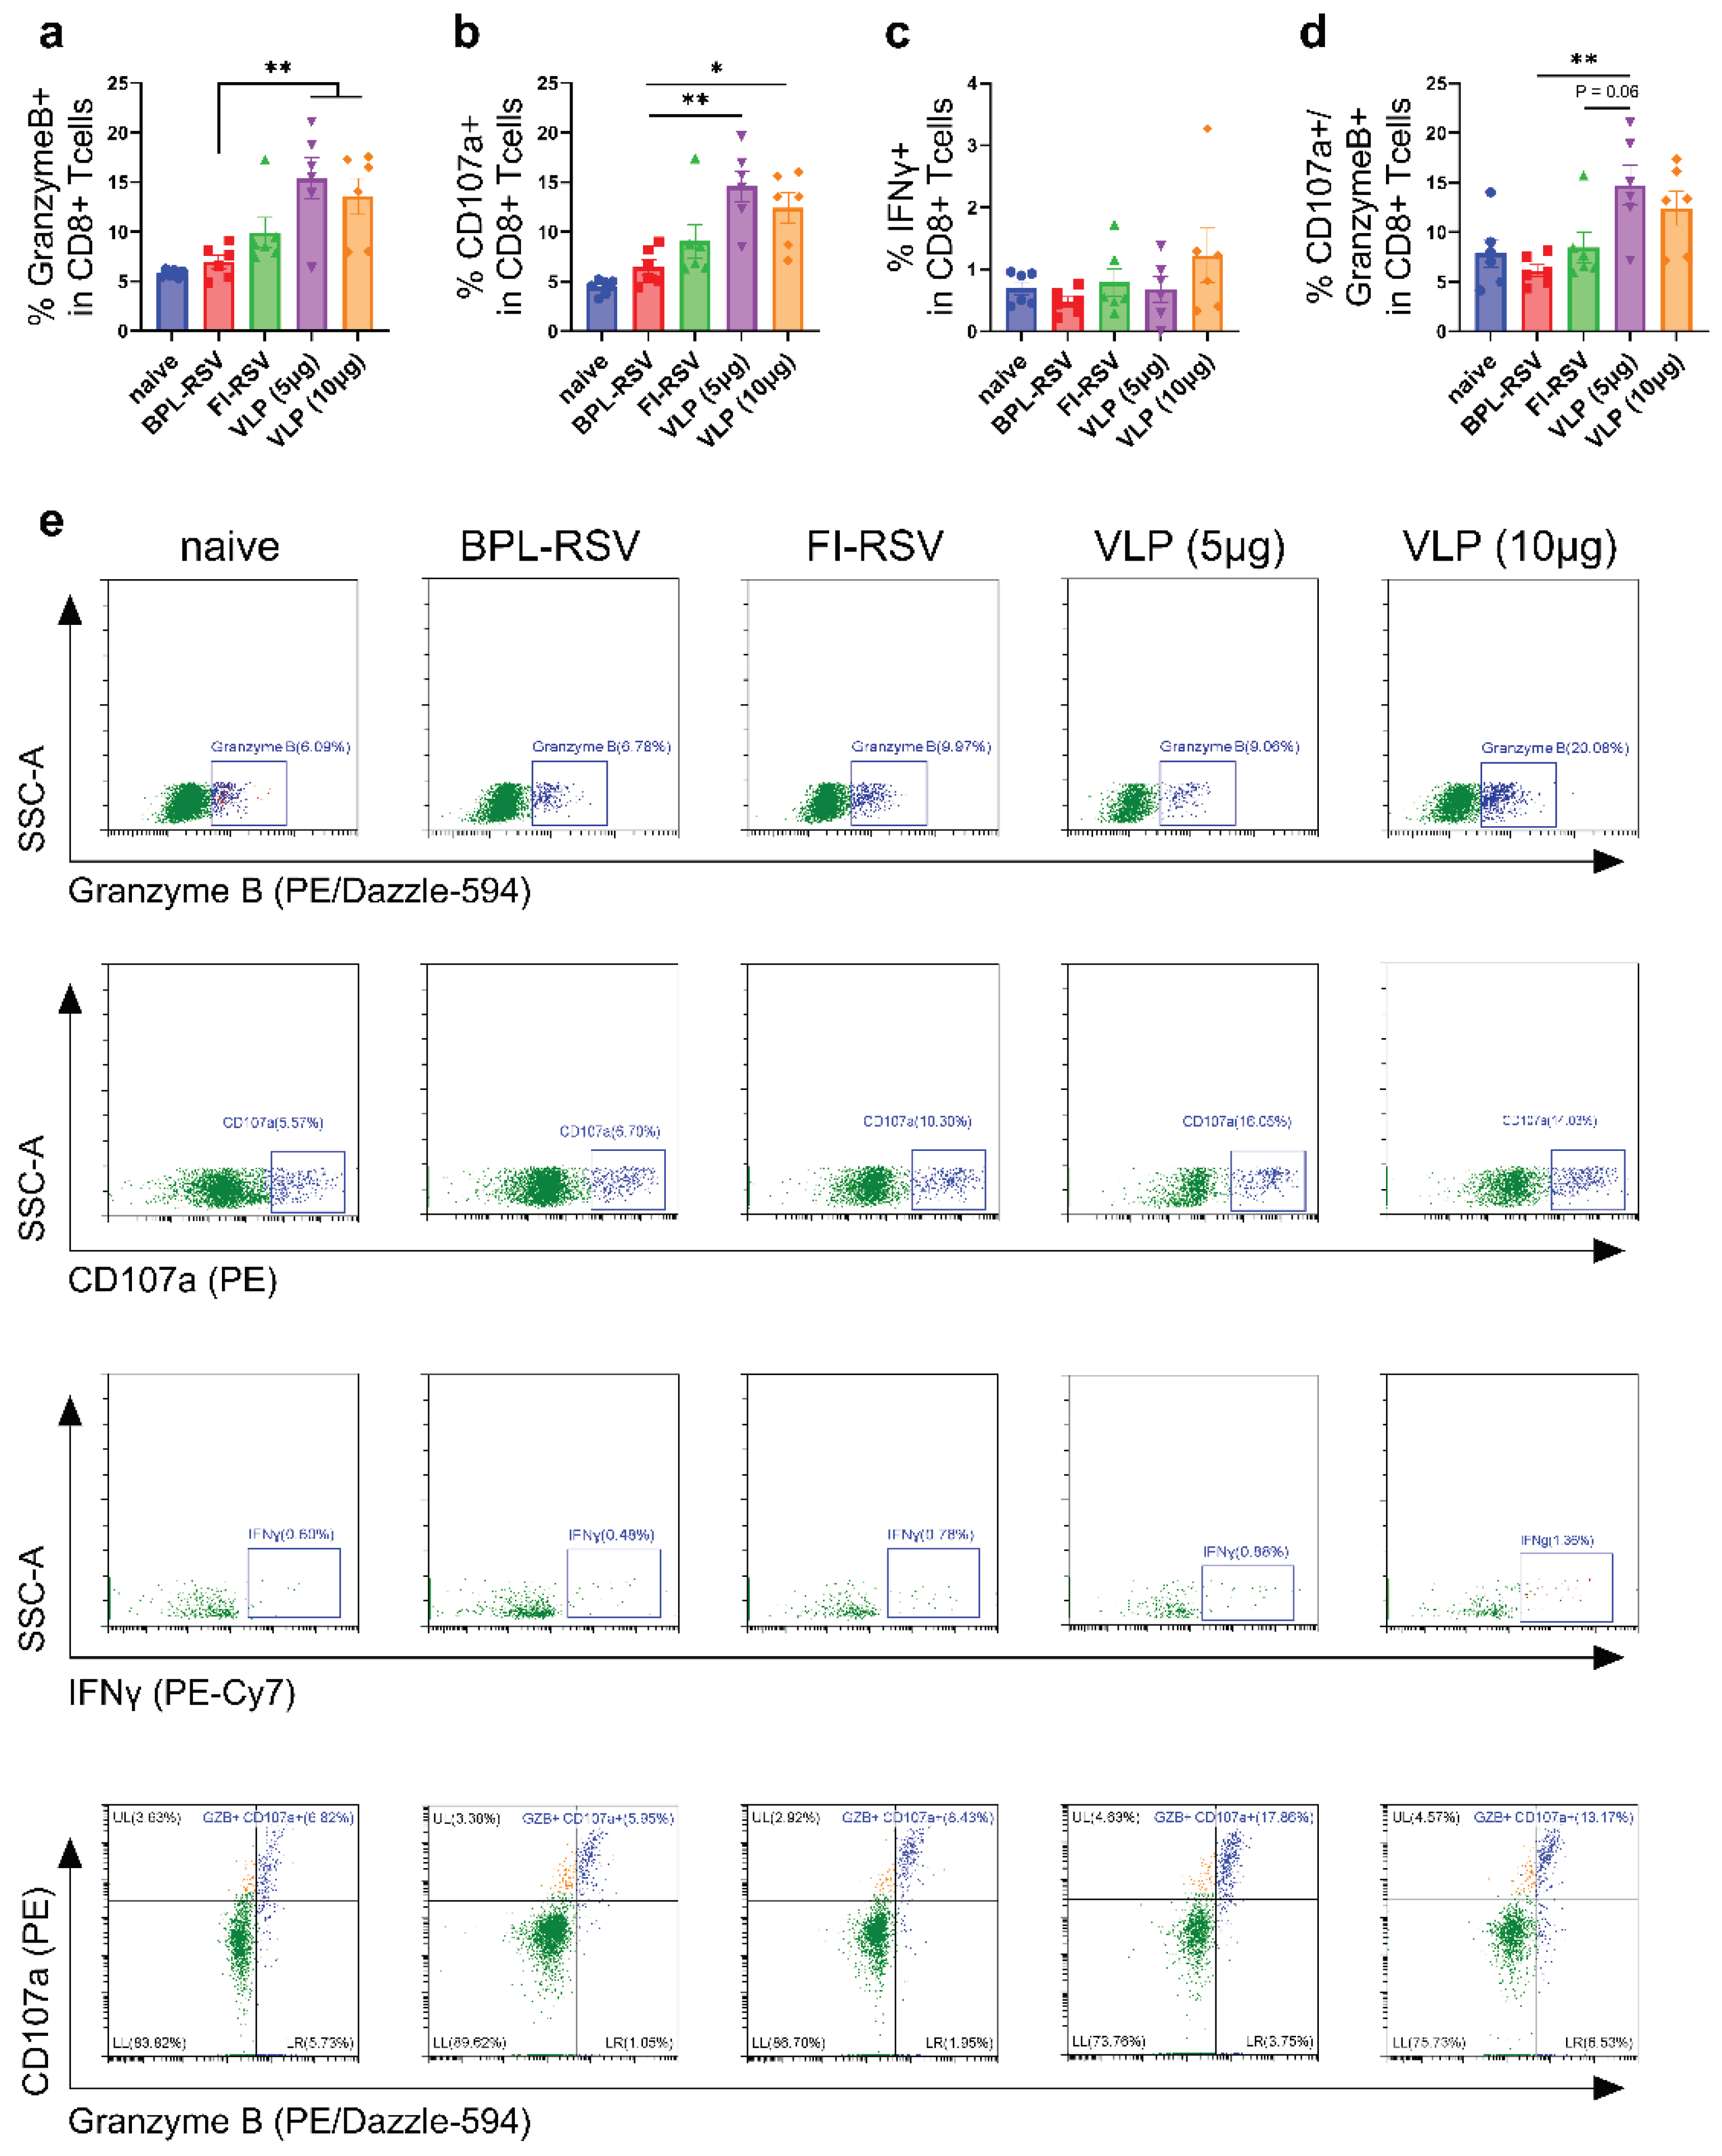
3.8. Cytotoxic CD8+ T Cell Response after Immunization
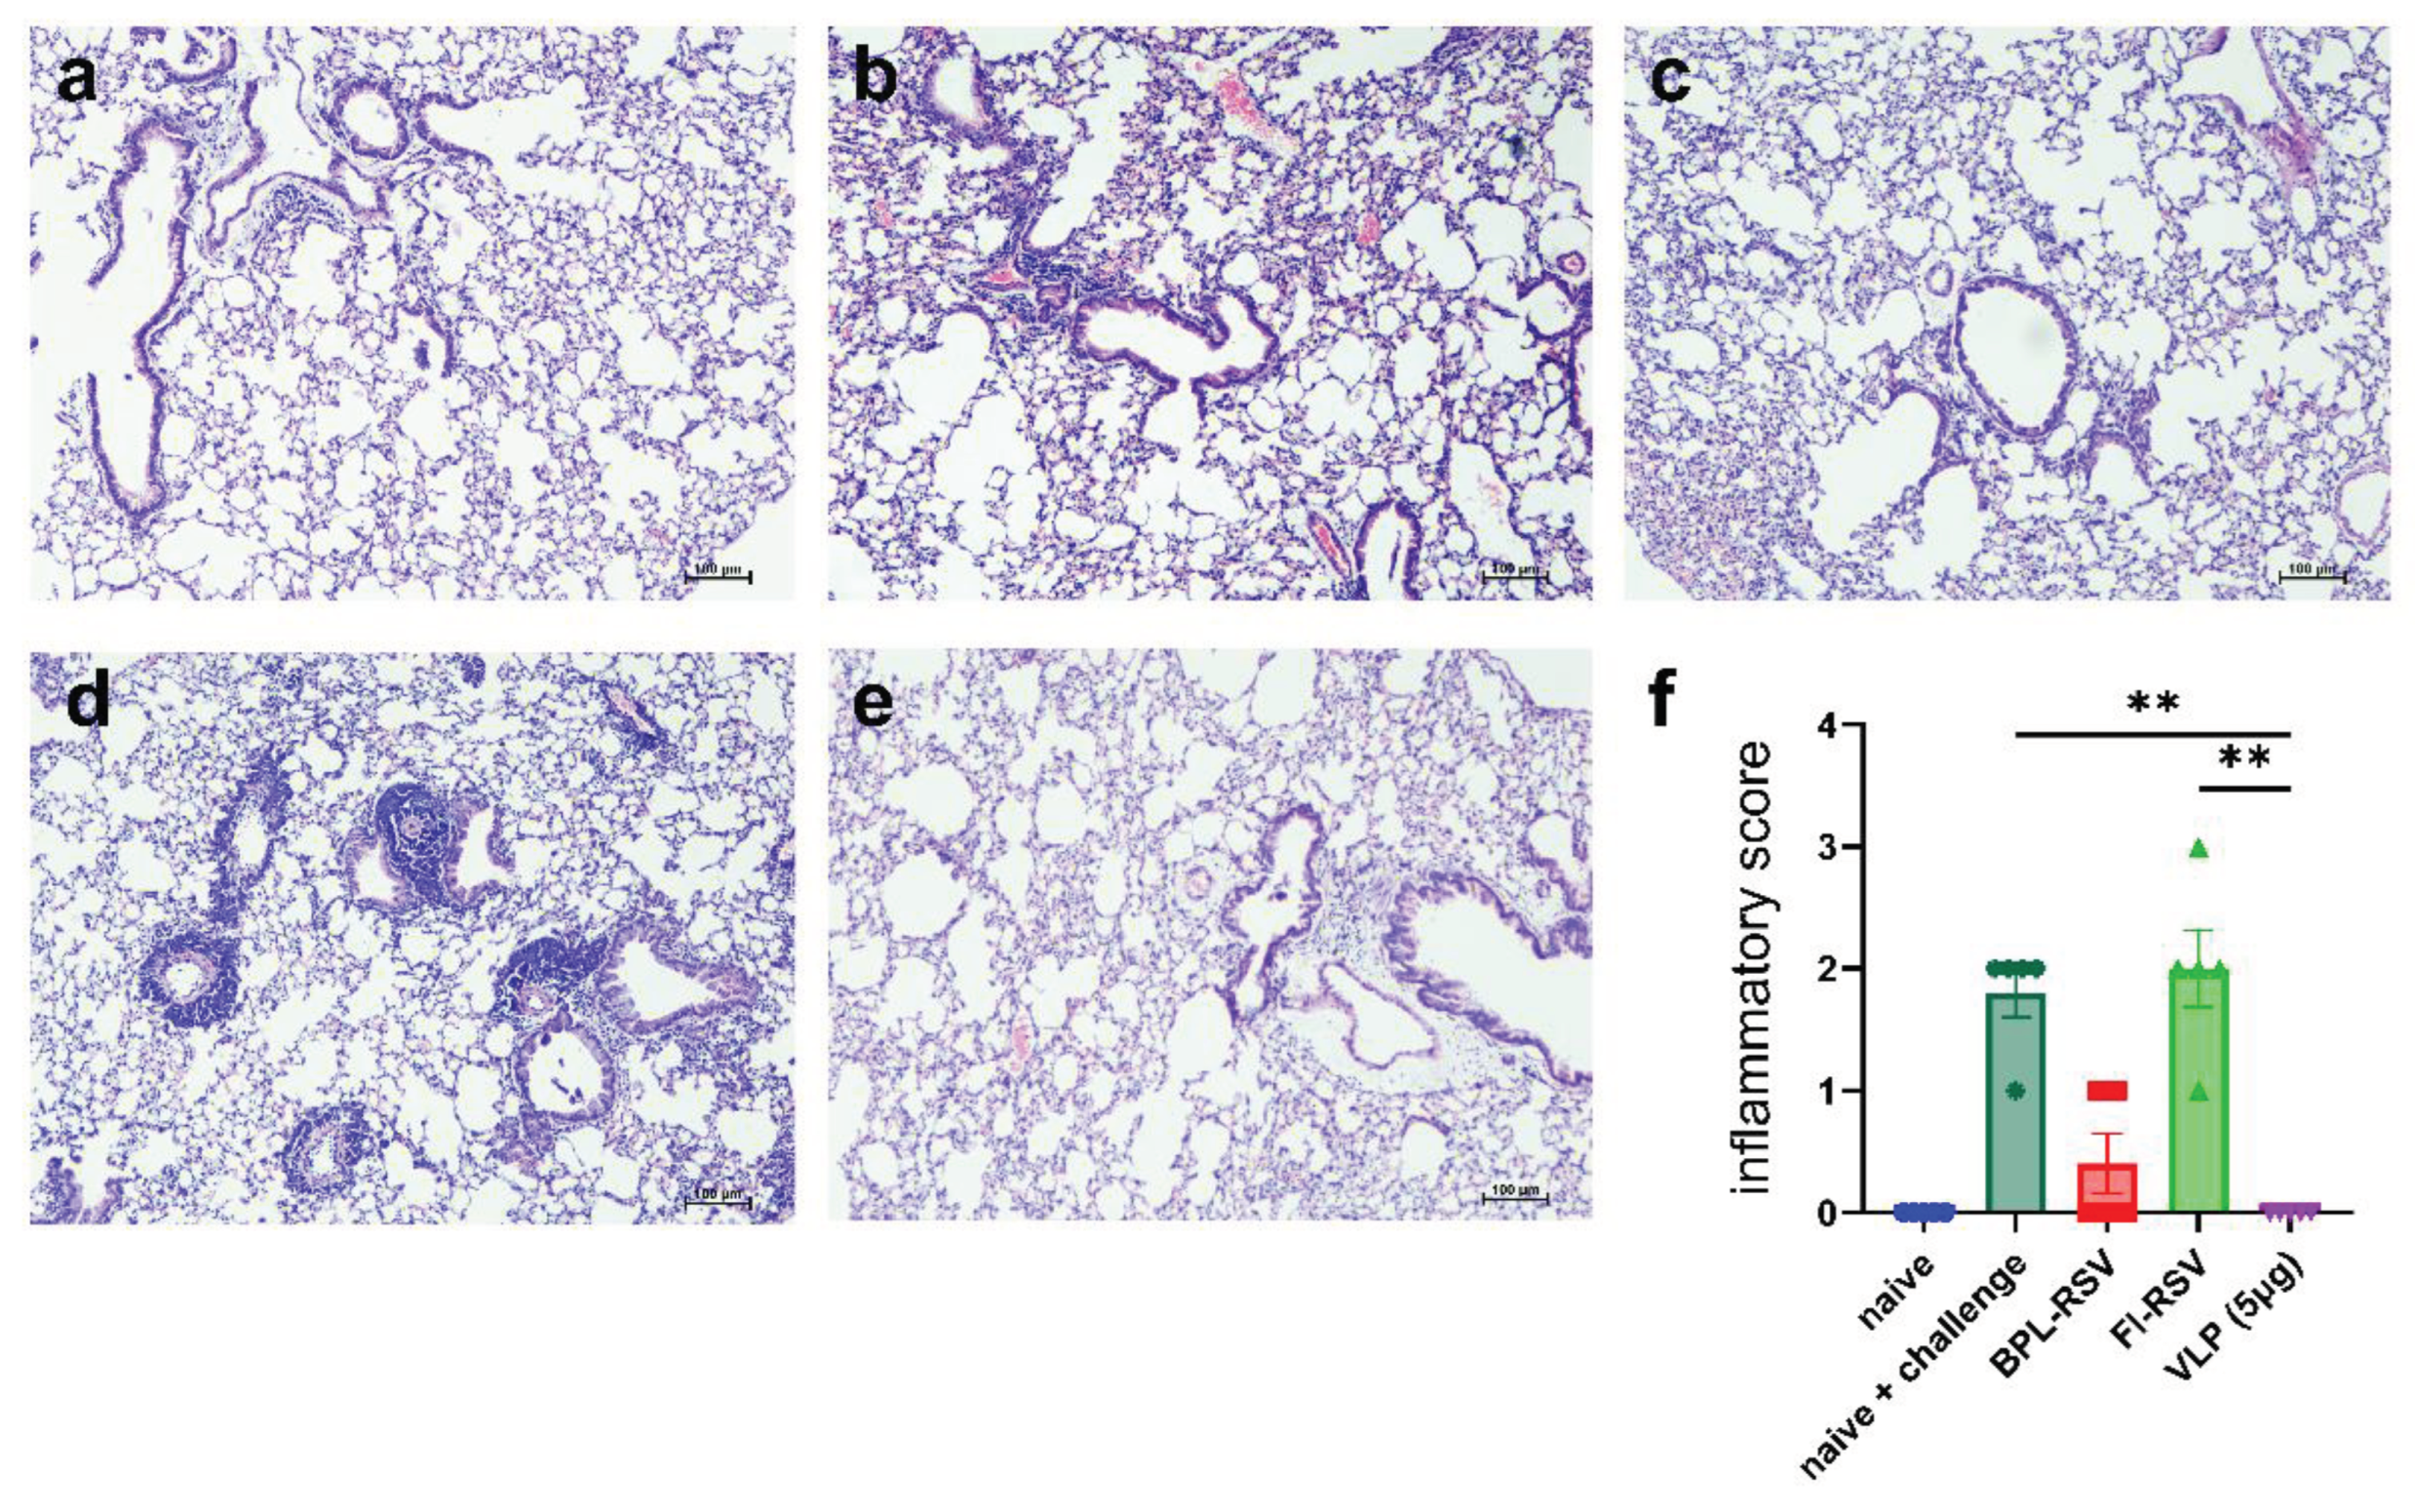
3.9. Protection from Live RSV after Challenge in Immunized Mice
4. Discussion
Author Contributions
Funding
Institutional Review Board Statement
Informed Consent Statement
Data Availability Statement
Acknowledgments
Conflicts of Interest
References
- Li, Y.; Wang, X.; Blau, D.M.; Caballero, M.T.; Feikin, D.R.; Gill, C.J.; Madhi, S.A.; Omer, S.B.; Simões, E.A.F.; Campbell, H.; et al. Global, Regional, and National Disease Burden Estimates of Acute Lower Respiratory Infections Due to Respiratory Syncytial Virus in Children Younger than 5 Years in 2019: A Systematic Analysis. The Lancet 2022, 399, 2047–2064. [Google Scholar] [CrossRef] [PubMed]
- Antillón, M.; Li, X.; Willem, L.; Bilcke, J.; Investigators, R.; Jit, M.; Beutels, P. The Age Profile of Respiratory Syncytial Virus Burden in Preschool Children of Low- and Middle-Income Countries: A Semi-Parametric, Meta-Regression Approach. PLoS Med 2023, 20, 1–25. [Google Scholar] [CrossRef] [PubMed]
- Shi, T.; McAllister, D.A.; O’Brien, K.L.; Simoes, E.A.F.; Madhi, S.A.; Gessner, B.D.; Polack, F.P.; Balsells, E.; Acacio, S.; Aguayo, C.; et al. Global, Regional, and National Disease Burden Estimates of Acute Lower Respiratory Infections Due to Respiratory Syncytial Virus in Young Children in 2015: A Systematic Review and Modelling Study. The Lancet 2017, 390, 946–958. [Google Scholar] [CrossRef] [PubMed]
- Li, X.; Willem, L.; Antillon, M.; Bilcke, J.; Jit, M.; Beutels, P. Health and Economic Burden of Respiratory Syncytial Virus (RSV) Disease and the Cost-Effectiveness of Potential Interventions against RSV among Children under 5 Years in 72 Gavi-Eligible Countries. BMC Med 2020, 18, 1–16. [Google Scholar] [CrossRef] [PubMed]
- Langedijk, A.C.; Bont, L.J. Respiratory Syncytial Virus Infection and Novel Interventions. Nat Rev Microbiol 2023, 21, 734–749. [Google Scholar] [CrossRef] [PubMed]
- Keam, S.J. Nirsevimab: First Approval. Drugs 2023, 83, 181–187. [Google Scholar] [CrossRef] [PubMed]
- Wittenauer, R.; Pecenka, C.; Baral, R. Cost of Childhood RSV Management and Cost-Effectiveness of RSV Interventions: A Systematic Review from a Low- and Middle-Income Country Perspective. BMC Med 2023, 21, 121. [Google Scholar] [CrossRef] [PubMed]
- Mezei, A.; Cohen, J.; Renwick, M.J.; Atwell, J.; Portnoy, A. Mathematical Modelling of Respiratory Syncytial Virus (RSV) in Low- and Middle-Income Countries: A Systematic Review. Epidemics 2021, 35, 100444. [Google Scholar] [CrossRef] [PubMed]
- Borchers, A.T.; Chang, C.; Gershwin, M.E.; Gershwin, L.J. Respiratory Syncytial Virus—A Comprehensive Review. Clin Rev Allergy Immunol 2013, 45, 331–379. [Google Scholar] [CrossRef]
- Swanson, K.A.; Balabanis, K.; Xie, Y.; Aggarwal, Y.; Palomo, C.; Mas, V.; Metrick, C.; Yang, H.; Shaw, C.A.; Melero, J.A.; et al. A Monomeric Uncleaved Respiratory Syncytial Virus F Antigen Retains Prefusion-Specific Neutralizing Epitopes. J Virol 2014, 88, 11802–11810. [Google Scholar] [CrossRef]
- Tripp, R.A.; Mejias, A.; Ramilo, O. Host Gene Expression and Respiratory Syncytial Virus Infection. Curr Top Microbiol Immunol 2013, 372, 193–209. [Google Scholar] [CrossRef]
- Walsh, E.E. Humoral, Mucosal, and Cellular Immune Response to Topical Immunization with a Subunit Respiratory Syncytial Virus Vaccine. J Infect Dis 1994, 170, 345–350. [Google Scholar] [CrossRef] [PubMed]
- Singh, S.R.; Dennis, V.A.; Carter, C.L.; Pillai, S.R.; Jefferson, A.; Sahi, S.V.; Moore, E.G. Immunogenicity and Efficacy of Recombinant RSV-F Vaccine in a Mouse Model. Vaccine 2007, 25, 6211–6223. [Google Scholar] [CrossRef] [PubMed]
- Sullender, W.M. Respiratory Syncytial Virus Genetic and Antigenic Diversity. Clin Microbiol Rev 2000, 13, 1–15. [Google Scholar] [CrossRef] [PubMed]
- McLellan, J.S.; Ray, W.C.; Peeples, M.E. Structure and Function of Respiratory Syncytial Virus Surface Glycoproteins. Curr Top Microbiol Immunol 2013, 372, 83–104. [Google Scholar] [CrossRef] [PubMed]
- Rainho-Tomko, J.N.; Pavot, V.; Kishko, M.; Swanson, K.; Edwards, D.; Yoon, H.; Lanza, L.; Alamares-Sapuay, J.; Osei-Bonsu, R.; Mundle, S.T.; et al. Immunogenicity and Protective Efficacy of RSV G Central Conserved Domain Vaccine with a Prefusion Nanoparticle. NPJ Vaccines 2022, 7, 74. [Google Scholar] [CrossRef] [PubMed]
- Ghildyal, R.; Ho, A.; Jans, D.A. Central Role of the Respiratory Syncytial Virus Matrix Protein in Infection. FEMS Microbiol Rev 2006, 30, 692–705. [Google Scholar] [CrossRef] [PubMed]
- Swain, J.; Bierre, M.; Veyrié, L.; Richard, C.-A.; Eleouet, J.-F.; Muriaux, D.; Bajorek, M. Selective Targeting and Clustering of Phosphatidylserine Lipids by RSV M Protein Is Critical for Virus Particle Production. Journal of Biological Chemistry 2023, 299, 105323. [Google Scholar] [CrossRef]
- Rutigliano, J.A.; Ruckwardt, T.J.; Martin, J.E.; Graham, B.S. Relative Dominance of Epitope-Specific CD8+ T Cell Responses in an F1 Hybrid Mouse Model of Respiratory Syncytial Virus Infection. Virology 2007, 362, 314. [Google Scholar] [CrossRef]
- Rutigliano, J.A.; Rock, M.T.; Johnson, A.K.; Crowe, J.E.; Graham, B.S. Identification of an H-2Db-Restricted CD8+ Cytotoxic T Lymphocyte Epitope in the Matrix Protein of Respiratory Syncytial Virus. Virology 2005, 337, 335–343. [Google Scholar] [CrossRef]
- Acosta, P.L.; Caballero, M.T.; Polack, F.P. Brief History and Characterization of Enhanced Respiratory Syncytial Virus Disease. Clinical and Vaccine Immunology 2016, 23, 189–195. [Google Scholar] [CrossRef] [PubMed]
- Mejias, A.; Rodríguez-Fernández, R.; Oliva, S.; Peeples, M.E.; Ramilo, O. The Journey to an RSV Vaccine. Ann Allergy Asthma Immunol 2020, 125, 36. [Google Scholar] [CrossRef] [PubMed]
- Waris, M.E.; Tsou, C.; Erdman, D.D.; Zaki, S.R.; Anderson, L.J. Respiratory Syncytial Virus Infection in BALB/c Mice Previously Immunized with Formalin-Inactivated Virus Induces Enhanced Pulmonary Inflammatory Response with a Predominant Th2-Like Cytokine Pattern. J Virol 1996, 70, 2852–2860. [Google Scholar] [CrossRef] [PubMed]
- Delgado, M.F.; Coviello, S.; Monsalvo, A.C.; Melendi, G.A.; Hernandez, J.Z.; Batalle, J.P.; Diaz, L.; Trento, A.; Chang, H.-Y.; Mitzner, W.; et al. Lack of Antibody Affinity Maturation Due to Poor Toll-like Receptor Stimulation Leads to Enhanced Respiratory Syncytial Virus Disease. Nat Med 2009, 15, 34–41. [Google Scholar] [CrossRef] [PubMed]
- Mazur, N.I.; Higgins, D.; Nunes, M.C.; Melero, J.A.; Langedijk, A.C.; Horsley, N.; Buchholz, U.J.; Openshaw, P.J.; McLellan, J.S.; Englund, J.A.; et al. The Respiratory Syncytial Virus Vaccine Landscape: Lessons from the Graveyard and Promising Candidates. Lancet Infect Dis 2018, 18, e295–e311. [Google Scholar] [CrossRef] [PubMed]
- Cullen, L.M.; Schmidt, M.R.; Morrison, T.G. The Importance of RSV F Protein Conformation in VLPs in Stimulation of Neutralizing Antibody Titers in Mice Previously Infected with RSV. Hum Vaccin Immunother 2017, 13, 2814–2823. [Google Scholar] [CrossRef] [PubMed]
- Luo, J.; Qin, H.; Lei, L.; Lou, W.; Li, R.; Pan, Z. Virus-like Particles Containing a Prefusion-Stabilized F Protein Induce a Balanced Immune Response and Confer Protection against Respiratory Syncytial Virus Infection in Mice. Front Immunol 2022, 13, 1054005. [Google Scholar] [CrossRef] [PubMed]
- Venkatesan, P. First RSV Vaccine Approvals. Lancet Microbe 2023, 4, e577. [Google Scholar] [CrossRef] [PubMed]
- Gonzá Lez-Reyes, L.; Begoñ, A.; Ruiz-Argü Ello, M.; García-Barreno, B.; Calder, L.; Ló Pez, J.A.; Albar, J.P.; Skehel, J.J.; Wiley, D.C.; Melero, J.A. Cleavage of the Human Respiratory Syncytial Virus Fusion Protein at Two Distinct Sites Is Required for Activation of Membrane Fusion. Proc Natl Acad Sci U S A 2001, 98, 9859–9864. [Google Scholar] [CrossRef]
- Patel, N.; Tian, J.H.; Flores, R.; Jacobson, K.; Walker, M.; Portnoff, A.; Gueber-Xabier, M.; Massare, M.J.; Glenn, G.; Ellingsworth, L.; et al. Flexible RSV Prefusogenic Fusion Glycoprotein Exposes Multiple Neutralizing Epitopes That May Collectively Contribute to Protective Immunity. Vaccines (Basel) 2020, 8, 1–20. [Google Scholar] [CrossRef]
- Patel, N.; Massare, M.J.; Tian, J.H.; Guebre-Xabier, M.; Lu, H.; Zhou, H.; Maynard, E.; Scott, D.; Ellingsworth, L.; Glenn, G.; et al. Respiratory Syncytial Virus Prefusogenic Fusion (F) Protein Nanoparticle Vaccine: Structure, Antigenic Profile, Immunogenicity, and Protection. Vaccine 2019, 37, 6112–6124. [Google Scholar] [CrossRef] [PubMed]
- Grgacic, E.V.L.; Anderson, D.A. Virus-like Particles: Passport to Immune Recognition. Methods 2006, 40, 60–65. [Google Scholar] [CrossRef] [PubMed]
- McGinnes Cullen, L.; Luo, B.; Wen, Z.; Zhang, L.; Durr, E.; Morrison, T.G. The Respiratory Syncytial Virus (RSV) G Protein Enhances the Immune Responses to the RSV F Protein in an Enveloped Virus-Like Particle Vaccine Candidate. J Virol 2023, 97, 1–15. [Google Scholar] [CrossRef] [PubMed]
- Ha, B.; Yang, J.E.; Chen, X.; Jadhao, S.J.; Wright, E.R.; Anderson, L.J. Two RSV Platforms for G, F, or G+F Proteins VLPs. Viruses 2020, 12, 906. [Google Scholar] [CrossRef] [PubMed]
- Lee, S.-H.; Chu, K.-B.; Kim, M.-J.; Mao, J.; Eom, G.-D.; Yoon, K.-W.; Ahmed, M.A.; Quan, F.-S. Virus-like Particle Vaccine Expressing the Respiratory Syncytial Virus Pre-Fusion and G Proteins Confers Protection against RSV Challenge Infection. Pharmaceutics 2023, 15, 782. [Google Scholar] [CrossRef]
- Lee, S.-H.; Chu, K.-B.; Kim, M.-J.; Quan, F.-S. Virus-Like Particles Assembled Using Respiratory Syncytial Virus Matrix Protein Elicit Protective Immunity in Mice. Infect Drug Resist 2023, 16, 6099–6110. [Google Scholar] [CrossRef] [PubMed]
- Ames, B.N. Assay of Inorganic Phosphate, Total Phosphate and Phosphatases. 1966; pp. 115–118.
- Shafique, M.; Wilschut, J.; de Haan, A. Induction of Mucosal and Systemic Immunity against Respiratory Syncytial Virus by Inactivated Virus Supplemented with TLR9 and NOD2 Ligands. Vaccine 2012, 30, 597–606. [Google Scholar] [CrossRef] [PubMed]
- Ramakrishnan, M.A. Determination of 50% Endpoint Titer Using a Simple Formula. World J Virol 2016, 5, 85–86. [Google Scholar] [CrossRef]
- Ward, C.; Maselko, M.; Lupfer, C.; Prescott, M.; Pastey, M.K. Interaction of the Human Respiratory Syncytial Virus Matrix Protein with Cellular Adaptor Protein Complex 3 Plays a Critical Role in Trafficking. PLoS ONE 2017, 12, e184629. [Google Scholar] [CrossRef]
- Kim, S.; Chang, J. Baculovirus-Based Vaccine Displaying Respiratory Syncytial Virus Glycoprotein Induces Protective Immunity against RSV Infection without Vaccine-Enhanced Disease. Immune Netw 2012, 12, 8–17. [Google Scholar] [CrossRef]
- McCurdy, L.H.; Graham, B.S. Role of Plasma Membrane Lipid Microdomains in Respiratory Syncytial Virus Filament Formation. J Virol 2003, 77, 1747–1756. [Google Scholar] [CrossRef] [PubMed]
- Bajorek, M.; Galloux, M.; Richard, C.-A.; Szekely, O.; Rosenzweig, R.; Sizun, C.; Eleouet, J.-F. Tetramerization of Phosphoprotein Is Essential for Respiratory Syncytial Virus Budding While Its N-Terminal Region Mediates Direct Interactions with the Matrix Protein. J Virol 2021, 95. [Google Scholar] [CrossRef] [PubMed]
- Patil, H.; Murugappan, S.; ter Veer, W.; Meijerhof, T.; de Haan, A.; Frijlink, H.W.; Wilschut, J.; Hinrichs, W.L.J.; Huckriede, A. Evaluation of Monophosphoryl Lipid A as Adjuvant for Pulmonary Delivered Influenza Vaccine. Journal of Controlled Release 2013, 174, 51–62. [Google Scholar] [CrossRef] [PubMed]
- Gosavi, M.; Kulkarni-Munje, A.; Patil, H.P. Dual Pattern Recognition Receptor Ligands CL401, CL413, and CL429 as Adjuvants for Inactivated Chikungunya Virus. Virology 2023, 585, 82–90. [Google Scholar] [CrossRef] [PubMed]
- Lee, S.; Chu, K.; Kim, M.; Mao, J.; Eom, G.; Yoon, K.; Ahmed, A.; Quan, F. Virus-like Particle Vaccine Expressing the Respiratory Syncytial Virus Pre-Fusion and G Proteins Confers Protection against RSV Challenge Infection. Pharmaceutics 2023, 15, 782. [Google Scholar] [CrossRef] [PubMed]
- Kim, M.J.; Chu, K.B.; Lee, S.H.; Mao, J.; Eom, G.D.; Yoon, K.W.; Moon, E.K.; Quan, F.S. Assessing the Protection Elicited by Virus-like Particles Expressing the RSV Pre-Fusion F and Tandem Repeated G Proteins against RSV RA2 Line19F Infection in Mice. Respir Res 2024, 25, 1–13. [Google Scholar] [CrossRef] [PubMed]
- Blanco, J.C.G.; Pletneva, L.M.; McGinnes-Cullen, L.; Otoa, R.O.; Patel, M.C.; Fernando, L.R.; Boukhvalova, M.S.; Morrison, T.G. Efficacy of a Respiratory Syncytial Virus Vaccine Candidate in a Maternal Immunization Model. Nat Commun 2018, 9. [Google Scholar] [CrossRef]
- Quan, F.S.; Kim, Y.; Lee, S.; Yi, H.; Kang, S.M.; Bozja, J.; Moore, M.L.; Compans, R.W. Viruslike Particle Vaccine Induces Protection against Respiratory Syncytial Virus Infection in Mice. Journal of Infectious Diseases 2011, 204, 987–995. [Google Scholar] [CrossRef] [PubMed]
- Bergeron, H.C.; Murray, J.; Juarez, M.G.; Nangle, S.J.; DuBois, R.M.; Tripp, R.A. Immunogenicity and Protective Efficacy of an RSV G S177Q Central Conserved Domain Nanoparticle Vaccine. Front Immunol 2023, 14, 1215323. [Google Scholar] [CrossRef]
- Su, C.; Zhong, Y.; Zhao, G.; Hou, J.; Zhang, S.; Wang, B. RSV Pre-Fusion F Protein Enhances the G Protein Antibody and Anti-Infectious Responses. NPJ Vaccines 2022, 7, 1–11. [Google Scholar] [CrossRef]
- Nimmerjahn, F.; Ravetch, J.V. Immunology: Divergent Immunoglobulin G Subclass Activity through Selective Fc Receptor Binding. Science (1979) 2005, 310, 1510–1512. [Google Scholar] [CrossRef]
- Shafique, M.; Meijerhof, T.; Wilschut, J.; de Haan, A. Evaluation of an Intranasal Virosomal Vaccine against Respiratory Syncytial Virus in Mice: Effect of TLR2 and NOD2 Ligands on Induction of Systemic and Mucosal Immune Responses. PLoS ONE 2013, 8, e61287. [Google Scholar] [CrossRef]
- Kamphuis, T.; Meijerhof, T.; Stegmann, T.; Lederhofer, J.; Wilschut, J.; de Haan, A. Immunogenicity and Protective Capacity of a Virosomal Respiratory Syncytial Virus Vaccine Adjuvanted with Monophosphoryl Lipid a in Mice. PLoS ONE 2012, 7. [Google Scholar] [CrossRef]
- Coutelier, J.P.; Van Der Logt, J.T.M.; Heessen, F.W.A.; Warnier, G.; Van Snick, J. IgG2a Restriction of Murine Antibodies Elicited by Viral Infections. Journal of Experimental Medicine 1987, 165, 64–69. [Google Scholar] [CrossRef] [PubMed]
- Huber, V.C.; McKeon, R.M.; Brackin, M.N.; Miller, L.A.; Keating, R.; Brown, S.A.; Makarova, N.; Perez, D.R.; MacDonald, G.H.; McCullers, J.A. Distinct Contributions of Vaccine-Induced Immunoglobulin G1 (IgG1) and IgG2a Antibodies to Protective Immunity against Influenza. Clinical and Vaccine Immunology 2006, 13, 981–990. [Google Scholar] [CrossRef]
- Bossie, A.; Vitetta, E.S. IFN-γ Enhances Secretion of IgG2a from IgG2a-Committed LPS-Stimulated Murine B Cells: Implications for the Role of IFN-γ in Class Switching. Cell Immunol 1991, 135, 95–104. [Google Scholar] [CrossRef] [PubMed]
- MOON, H.B.; SEVERINSON, E.; HEUSSER, C.; JOHANSSON, S.G.O.; MÖLLER, G.; PERSSON, U. Regulation of IgG1 and IgE Synthesis by Interleukin 4 in Mouse B Cells. Scand J Immunol 1989, 30, 355–361. [Google Scholar] [CrossRef] [PubMed]
- Swain, S.L.; McKinstry, K.K.; Strutt, T.M. Expanding Roles for CD4+ T Cells in Immunity to Viruses. Nat Rev Immunol 2012, 12, 136–148. [Google Scholar] [CrossRef]
- Crotty, S. T Follicular Helper Cell Biology: A Decade of Discovery and Diseases. Immunity 2019, 50, 1132–1148. [Google Scholar] [CrossRef]
- Ditoro, D.; Winstead, C.; Pham, D.; Witte, S.; Andargachew, R.; Singer, J.R.; Wilson, C.G.; Zindl, C.L.; Luther, R.J.; Silberger, D.J.; et al. Differential IL-2 Expression Defines Developmental Fates of Follicular versus Nonfollicular Helper T Cells. Science (1979) 2018, 361. [Google Scholar] [CrossRef]
- Swain, S.L.; McKinstry, K.K.; Strutt, T.M. Expanding Roles for CD4+ T Cells in Immunity to Viruses. Nat Rev Immunol 2012, 12, 136–148. [Google Scholar] [CrossRef] [PubMed]
- Wang, S.; Gao, X.; Shen, G.; Wang, W.; Li, J.; Zhao, J.; Wei, Y.Q.; Edwards, C.K. Interleukin-10 Deficiency Impairs Regulatory T Cell-Derived Neuropilin-1 Functions and Promotes Th1 and Th17 Immunity. Sci Rep 2016, 6, 1–16. [Google Scholar] [CrossRef] [PubMed]
- Schmidt, M.E.; Varga, S.M. The CD8 T Cell Response to Respiratory Virus Infections. Front Immunol 2018, 9, 357939. [Google Scholar] [CrossRef] [PubMed]
- Schmidt, M.E.; Meyerholz, D.K.; Varga, S.M. Pre-Existing Neutralizing Antibodies Prevent CD8 T Cell-Mediated Immunopathology Following Respiratory Syncytial Virus Infection. Mucosal Immunol 2020, 13, 507–517. [Google Scholar] [CrossRef] [PubMed]
- Woodland, D.L.; Hogan, R.J.; Zhong, W. Cellular Immunity and Memory to Respiratory Virus Infections. Immunol Res 2001, 24, 53–67. [Google Scholar] [CrossRef] [PubMed]
- Lee, S.; Stokes, K.L.; Currier, M.G.; Sakamoto, K.; Lukacs, N.W.; Celis, E.; Moore, M.L. Vaccine-Elicited CD8+ T Cells Protect against Respiratory Syncytial Virus Strain A2-Line19F-Induced Pathogenesis in BALB/c Mice. J Virol 2012, 86, 13016. [Google Scholar] [CrossRef]
- Gray, J.I.; Westerhof, L.M.; MacLeod, M.K.L. The Roles of Resident, Central and Effector Memory CD4 T-Cells in Protective Immunity Following Infection or Vaccination. Immunology 2018, 154, 574–581. [Google Scholar] [CrossRef]
- Knudson, C.J.; Hartwig, S.M.; Meyerholz, D.K.; Varga, S.M. RSV Vaccine-Enhanced Disease Is Orchestrated by the Combined Actions of Distinct CD4 T Cell Subsets. PLoS Pathog 2015, 11, 1–23. [Google Scholar] [CrossRef] [PubMed]
- Zhou, J.; Uddback, I.; Kohlmeier, J.E.; Christensen, J.P.; Thomsen, A.R. Vaccine Induced Memory CD8+ T Cells Efficiently Prevent Viral Transmission from the Respiratory Tract. Front Immunol 2023, 14. [Google Scholar] [CrossRef]
- Retamal-Díaz, A.; Covián, C.; Pacheco, G.A.; Castiglione-Matamala, A.T.; Bueno, S.M.; González, P.A.; Kalergis, A.M. Contribution of Resident Memory CD8+ T Cells to Protective Immunity Against Respiratory Syncytial Virus and Their Impact on Vaccine Design. Pathogens 2019, 8, 147. [Google Scholar] [CrossRef]
- Walpita, P.; Johns, L.M.; Tandon, R.; Moore, M.L. Mammalian Cell-Derived Respiratory Syncytial Virus-Like Particles Protect the Lower as Well as the Upper Respiratory Tract. PLoS ONE 2015, 10. [Google Scholar] [CrossRef] [PubMed]
- Vartak, A.; Sucheck, S.J. Recent Advances in Subunit Vaccine Carriers. Vaccines (Basel) 2016, 4, 1–18. [Google Scholar] [CrossRef] [PubMed]
- Kozak, M.; Hu, J. The Integrated Consideration of Vaccine Platforms, Adjuvants, and Delivery Routes for Successful Vaccine Development. Vaccines (Basel) 2023, 11, 695. [Google Scholar] [CrossRef] [PubMed]


| Target | Primer | Sequence (5′-3′) |
|---|---|---|
| M | Forward | CGCGGATCCATGGAAACATACGTGAACAAGCTTC |
| Reverse | CCGCTCGAGAGTAACTACTGGCGTGGTGTG | |
| G | Forward | CGCGGATCCATGCAAACATGTCCAAAAACAAG |
| Reverse | CCGCTCGAGAGTAACTACTGGCGTGGTGTG |
| Antibody | Clone | Source |
|---|---|---|
| CTL panel | ||
| CD3-FITC | 17A2 | BioLegend |
| CD8a-PerCP | 53-6.7 | BioLegend |
| CD107a-PE | 1D4B | BioLegend |
| Granzyme B-PE/Dazzle594 | QA16A02 | BioLegend |
| IFNγ-PECy7 | XMG1.2 | BioLegend |
| T cell proliferation panel | ||
| CD3-FITC | 17A2 | BioLegend |
| CD8a-PerCP | 53-6.7 | BioLegend |
| CD4-BV785 | RM4-5 | BioLegend |
| CD44-PE/Dazzle594 | IM7 | BioLegend |
| CD62L-BV421 | MEL-14 | BioLegend |
| Ki67-PE | 11F6 | BioLegend |
Disclaimer/Publisher’s Note: The statements, opinions and data contained in all publications are solely those of the individual author(s) and contributor(s) and not of MDPI and/or the editor(s). MDPI and/or the editor(s) disclaim responsibility for any injury to people or property resulting from any ideas, methods, instructions or products referred to in the content. |
© 2024 by the authors. Licensee MDPI, Basel, Switzerland. This article is an open access article distributed under the terms and conditions of the Creative Commons Attribution (CC BY) license (http://creativecommons.org/licenses/by/4.0/).


