1. Introduction
Temporal and spatial information is essential to human existence and development. Location-Based Services (LBS) utilize positioning and navigation technologies to provide users with a series of services based on temporal and spatial locations, playing an increasingly important role in various emerging fields such as smart cities, intelligent transportation, and industrial internet. Ubiquitous and trustworthy location services require the support of advanced positioning technologies. In outdoor environments, GNSS can provide high precision location information. However, due to the low penetrability of satellite signals, it is not possible to offer users high precision location services in non-exposed spaces such as indoor and underground environment [
1,
2]. Currently, positioning technologies in satellite denied environments worldwide include Bluetooth, UWB, WLAN, and mobile communication networks [
3]. Among these, mobile communication network is the most widely used wireless networks for ground coverage. Especially 5G networks can provide high-precision location services based on mobile communication networks has become a research hotspot [
4,
5,
6,
7,
8]. The primary technical bottleneck in improving 5G indoor positioning accuracy is the NLOS effect [
9]. In complex environments such as indoors and underground, wireless signal propagation is severely obstructed and reflected, resulting in NLOS phenomena [
10]. Since communication services in mobile communication networks are insensitive to delays, NLOS phenomena have a minor impact on communication quality. However, for positioning, NLOS can lead to increased positioning observation errors. The errors caused by NLOS may be much larger than the errors introduced by the ranging capability itself. Therefore, researching NLOS error suppression techniques in mobile communication networks is of great significance for achieving high-precision positioning.
Recently a large number of scholars have conducted extensive research on the NLOS error generation mechanism and compensation technology. The existing NLOS suppression technology is mainly divided into three categories, as shown in
Table 1.
The first category is detection, which involves initially identifying the observations of positioning signals. Observations that may be affected by NLOS are either directly removed or minimized in terms of their weight. The advantage of this approach is its simplicity, while its disadvantage is the lack of classification. [
11] proposed the consistency checking method to examine the residual range measurement or navigation solution, which is similar to the receiver autonomous integrity monitoring.
The second category is mitigation, which uses multiple features to classify the received positioning signals, and performs error suppression based on the observation feature classification results. Technologies such as machine learning and support vector machines have been widely used to classify and feature extraction of GNSS and wireless communication network observations [
14,
15,
16,
17]. [
18] proposed the reception of NLOS signals based on Vector tracking loop, and initially proved the effectiveness of the proposed method through field tests. However, there is currently a lack of comprehensive theoretical derivation and performance limit analysis for this type of method.
The third type is correction. In this type of technique, NLOS paths are considered as useful signals. Utilizing known three-dimensional maps for assisted positioning, potential reflection paths are inferred, and error correction is performed accordingly [
19,
20,
21,
22]. This is equivalent to obtaining a new observation quantity that is not affected by non-line-of-sight errors. This type of method can ideally remove the impact of NLOS errors on positioning, and can even bring additional improvements in performance. However, the computational complexity is very high, and it is difficult to meet the real-time requirements. In addition, the deployment on hardware platform is also a significant challenge.
The existing NLOS mitigation methods suffer from insufficient feature extraction of wireless signals, lack consideration of residual NLOS measurement errors during the position estimation process, and poor stability in the mixed positioning estimation results [
23,
24,
25]. To address these issues, this paper innovatively proposed a NLOS error identification, suppression, and position estimation method for 5G positioning terminals. The primary contributions of this paper are outlined as follows:
1) A method for discriminating and classifying NLOS observations based on decoupling the features of wireless signals is proposed. This method initially divides the indoor propagation channels into multiple categories and utilizes the results of channel classification to assess the severity of NLOS effects. Subsequently, it establishes selection criteria for filtering the ranging results of 5G positioning signals.
2) A position estimation method based on Square-Root Unscented Kalman Filter (SRUKF) is proposed. The square root of the state covariance is introduced, thereby avoiding the need for covariance reconstruction at each iteration. This approach offers advantages such as numerical stability and positive semi-definiteness of the state covariance. During the fusion process of mixed observations, it ensures the numerical stability of the filter’s position estimation output.
3) We perform a comprehensive comparison of the existing advanced methods and build a 5G localization system to support the validation of the proposed method in real complex indoor environment. Both the simulation and experimental results demonstrate the superiority of the proposed NLOS mitigation and location estimation method over existing methods.
The remainder of this paper is organized as follows. In
Section 2 the 5G positioning reference signal measurement model is given and related problems are described. In
Section 3 a NLOS mitigation and location estimation method for 5G positioning is proposed which is composed of the derivation of positioning performance limits, measurement identification and location estimation method for NLOS mitigation. In
Section 4 the performance of the proposed NLOS error mitigation algorithm is evaluated through the simulations as well as the experiment test. Finally, the discussion of this article are drawn in
Section 5.
2. Problem Description and System Model
This section introduces the 5G NR time-frequency resource mapping scheme. The 5G positioning reference signal (PRS) has an abundance of time-frequency resources which is expected to show better performance. The pseudorandom code of the PRS signal is generated by gold sequences and OFDM modulation is employed to achieve reliable data transmission in complex scenarios with a scalable OFDM numerology. The physical signal’s transmissions are organized into signal frames, subframes, and slots in the time domain. Each signal frame has a duration of 10ms and consists of 10 subframes with a subframe duration of 1ms. A subframe is formed by one or multiple slots. The resource element consists of one subcarrier in one OFDM symbol, which is the smallest physical time-frequency resource unit. The physical resource block is defined as 12 continuous subcarriers in one time slot.
In this study, factors such as positioning accuracy and resource occupancy rate are considered comprehensively. The parameter of 30KHz subcarrier spacing was used in our experiments and thus, one subframe has 2 slots, and each slot has 14 OFDM symbols. Comb-4 is adopted for resource mapping. This paper takes into account a wide range of parameters, including resource occupancy rate and placement accuracy. In our experiments, we selected a 30 kHz subcarrier spacing setting, which results in two slots per subframe with 14 OFDM symbols in each slot. Comb-4 is utilized for the mapping of resources.
In this section, we analyze the 5G PRS as an example. After appropriate adjustments, the proposed method can also be applied to the suppression of NLOS errors in other wireless signals. The baseband received signal at the terminal for 5G positioning can be represented as follows:
Where
represents the 5G signal sampled at time
t,
m denotes the identifier of the positioning base station in the network, M represents the total number of positioning base stations.
A indicates the amplitude value of the positioning signal,
C represents the ranging code sequence,
denotes the delay of the ranging code for base station,
and
denote the frequency and initial phase of the local carrier respectively,
represents the Doppler frequency shift,
n indicates the identifier of the NLOS base station,
represents the reflection coefficient of the NLOS signal,
denotes the delay caused by the NLOS effect relative to the direct path signal and
represents additive Gaussian white noise.
Achieving high-precision positioning of 5G PRS signals requires continuous signal tracking at the terminal side. The impact of NLOS effects on the code tracking loop is far greater than that on the carrier tracking loop. Assuming the terminal can completely strip the carrier from the received signal, the outputs of the early, prompt, and
L correlators can be represented as follows:
Where R represents the autocorrelation function, d represents the spacing between the early and late correlators,
represents the code phase difference of the direct path signal,
is the code phase difference of the NLOS signal and
represent the estimated values of the ranging results. Here, we mainly consider the scenario of 2D positioning, but it can be extended to 3D positioning as needed. The estimated values of ranging results at the terminal can be modeled as:
and
represents the coordinates of 5G base station and the terminal.
represents the estimated distance from the
mth base station to the terminal.
denotes zero-mean Gaussian noise,
is NLOS error term. The ranging results from M base stations are divided into two categories,
and
, representing line-of-sight and non-line-of-sight, respectively.
Where
is the indicator of channel state, 1 represents LOS channel, and -1 represents NLOS channel. In indoor environment the terminal often needs to provide position estimation results in the presence of a mixture of LOS and NLOS ranging results. The optimal set of ranging results available for the user terminal to choose from can be denoted as
Afterwards, there can be various methods to provide position estimation values based on ranging results. However, existing methods have not considered the incomplete identification of NLOS observations or incomplete suppression of NLOS errors. These residual NLOS errors can lead to a significant increase in positioning errors for 5G positioning.
3. The Proposed NLOS Mitigation and SRUKF Based Location Estimation Method for 5G Positioning
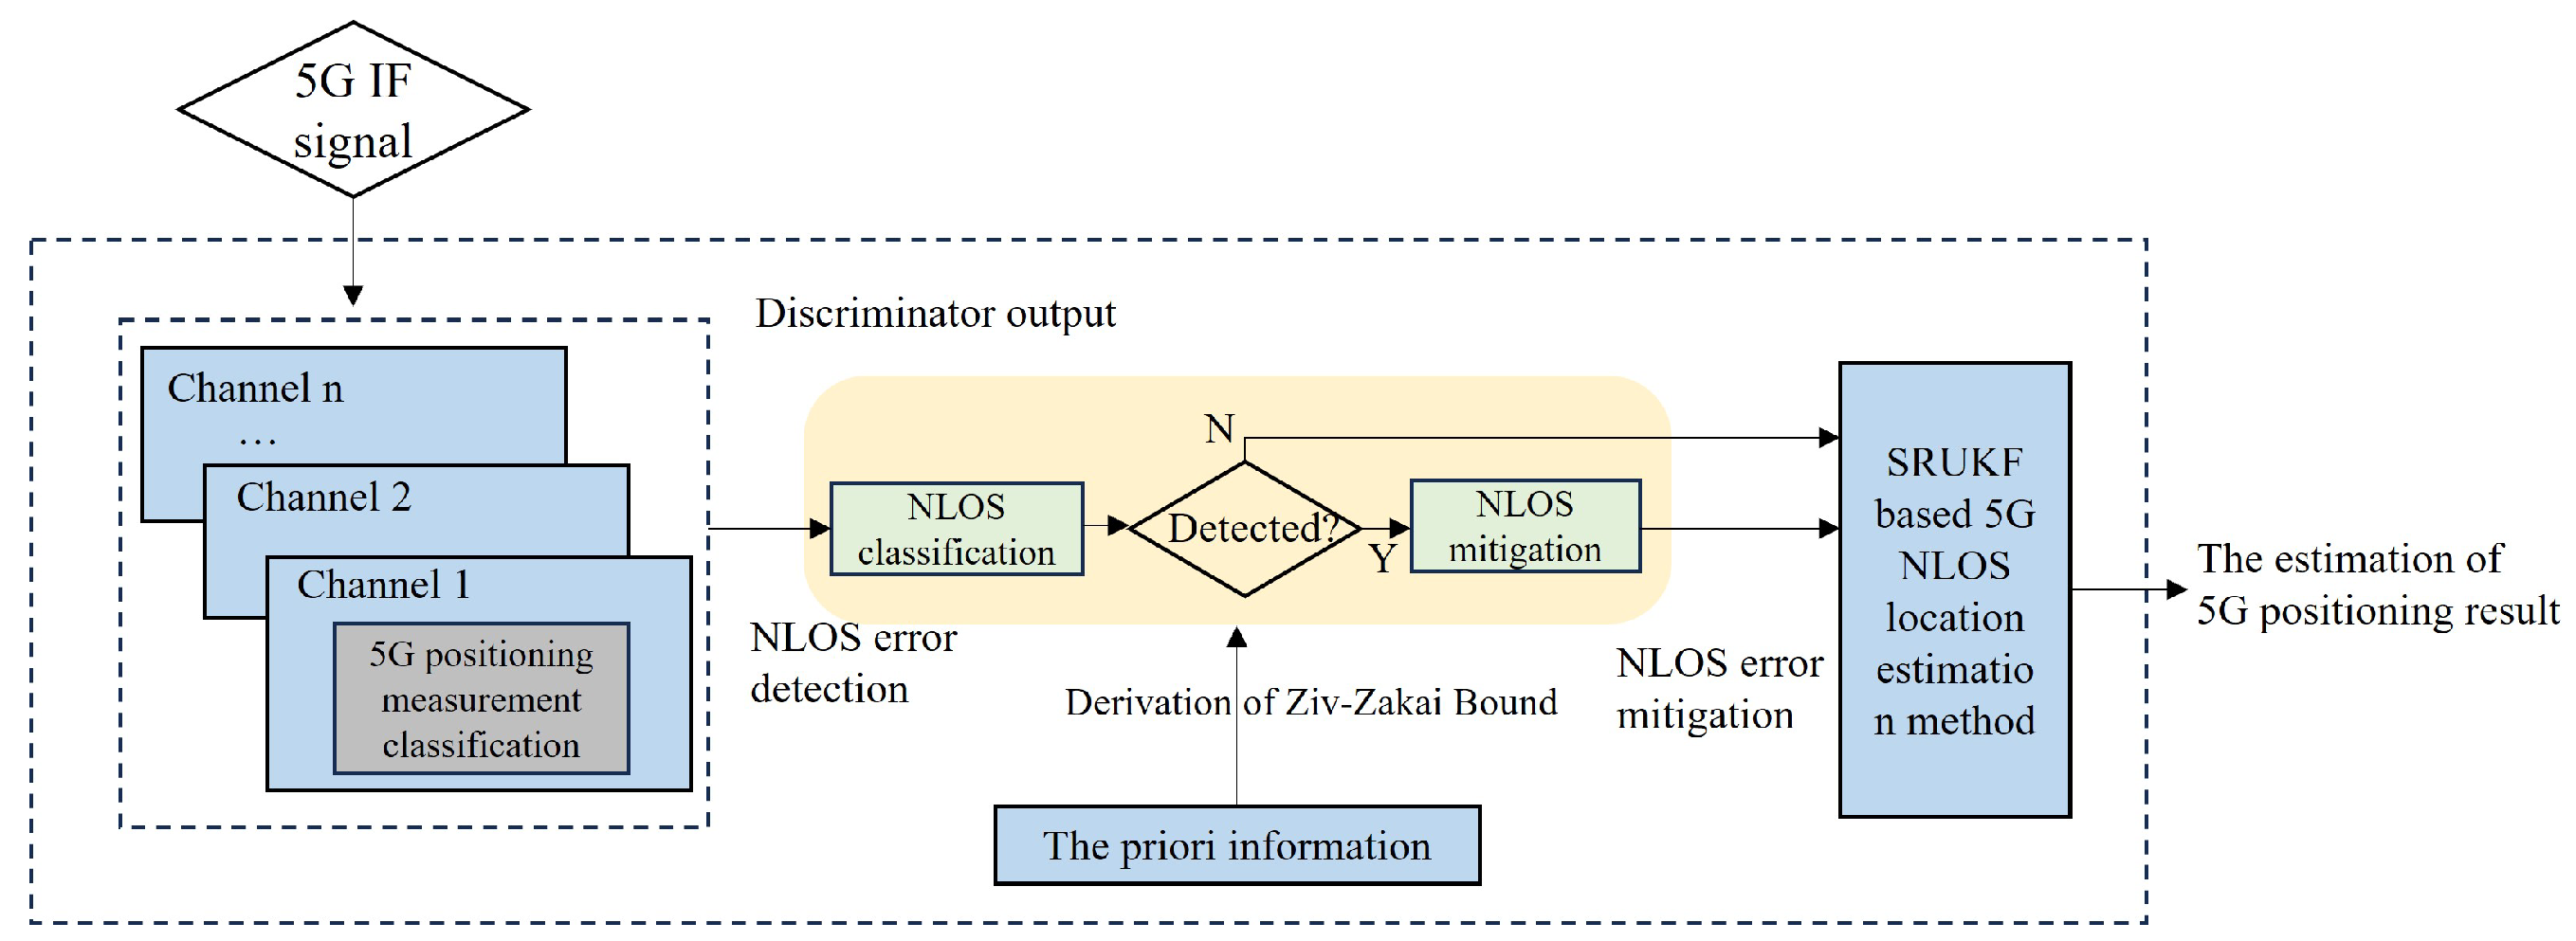
In this chapter, a NLOS mitigation and SRUKF based location estimation method (NM-SL) for 5G positioning terminals is proposed. Firstly, the performance limits of TOA estimation in indoor environments with mixed line-of-sight and NLOS channels is derived. Based on this, a strategy for filtering NLOS observations is proposed and a position estimation method for NLOS ranging errors based on SRUKF is introduced. The diagram of the proposed method is illustrated in
Figure 1.
3.1. Ziv-Zakai Bound on Time-of-Arrival Estimation with Statistical NLOS Channel Knowledge at the Receiver
In this section the performance limits of TOA estimation in NLOS channels is analyzed. Analytical expressions for the Cramér-Rao Bound (CRB) and Ziv-Zakai Bound (ZZB) of the root mean square error of in different NLOS conditions are derived. These performance limits can serve as effective benchmarks for designing practical TOA estimators. The 5G positioning terminal obtains estimation of TOA, denoted as
, from the received signal r(t) in Equation (
1). We assume that
is unknown and randomly distributed within the sampling time interval, and all NLOS components are observed within this sampling interval. The proposed performance boundary based on ZZB can be derived from the following general equation for root mean square error estimation
where
represents the estimation error of the ranging results in the positioning terminal. The core idea of ZZB is to transform the performance evaluation of an estimation problem into a binary detection problem with equal probability hypotheses.
Where
represents following probability distribution, it can be used to obtain the error probability corresponding to the optimal decision rule based on likelihood ratio test, further derived from formula (9) to obtain its performance lower bound. First, estimate the value of
, then make a decision between two hypotheses based on the minimum distance criterion, and obtain the performance lower bound by calculating the error probability of the optimal decision rule that minimizes the error probability.
When
is uniformly distributed within the sampling interval T, then ZZB can be expressed as
From the analysis above, it can be seen that the derivation of ZZB for NLOS channels has been transformed into the performance evaluation of a binary detection problem. Deriving ZZB requires evaluating the probability error function
for decision making between two hypotheses in Equation (
11). Under the condition where the channel state information is known, the ideal received signal
can be obtained along with the corresponding channel parameters
, and the likelihood ratio test results can be computed. This process can be equivalently interpreted as evaluating the corresponding error probability
for a binary discrimination system.
Where
is known, the error probability can be expressed as
Where
denotes the signal-to-noise ratio,
is the average received energy,
Q denotes the Gaussian Q-function. The normalized autocorrelation function is defined as follows:
where
By replacing
with
in Equation (
12), we can obtain the ZZB under the condition of channel state
.
On the basis of (17), by further deriving the idea of averaging on the vector
c, the unconditionally restricted ZZB can be obtained
The average error probability function can be expressed as
It should be noted that the premise of obtaining Equation (
18) is that the positioning terminal has accurate channel state information. Therefore, when the positioning terminal receives signals completely synchronized, ZZB can serve as a lower bound for the root mean square error of TOA estimation. Furthermore, Equation (
19) represents the average bit error probability using receiver coherent detection with perfect channel state information in the presence of NLOS and multipath. Many scholars have studied the coupling relationship between BEP and ZZB under different conditions [26]. Here, we adopt a method similar to [
27] to solve for
Substituting Equation (
14) and Equation (
20) into Equation (
19) can obtain the expression for the error probability function as follows
Where
represents the moment generating function (MGF). The specific derivation process can be referred to [
28]. Here, we only need to evaluate an integral with a finite limit. An effective method for evaluating the integral in the form of Equation (
21) can be found in [
29]. Therefore, under the condition of known accurate channel state information in an Additive White Gaussian Noise (AWGN) channel, the performance bound ZZB for wireless localization can be expressed as:
3.2. 5G NLOS Measurement Identification and Classification Method
When the available LOS signals are not sufficient to support localization, it becomes necessary to design a criterion for filtering ranging results to ensure that only beneficial NLOS signals are included in the positioning computation. The NLOS error at the 5G positioning terminal can be represented as
Where
represents the dielectric constant associated with obstacles in the propagation channel,
represents the attenuation constant associated with obstructing objects in the channel. L represents the number of paths for multipath,
and
respectively represent the amplitude and delay, the subscript DP stands for the direct path signal. It can be seen that the errors introduced by NLOS effects are closely related to the channel conditions. The key to select NLOS observations lies in extracting typical classification features from the waveform of the received signal. The extracted features must be strongly correlated with changes in the NLOS channel state.
To ensure the ease of implementation of the proposed method, we selected six common features from the 5G signal: Total Energy (TE), Maximum Peak Value (MPV), Signal-to-Noise Ratio (SNR), Rise Time (RT), Root Mean Square Delay Spread (RDS), and Kurtosis (KUR). Their definitions are shown in equations (24) - (29) respectively.
Where
is the total number of sampling points of the signal waveform received by the terminal, and i represents the sampling point index.
. When a wireless signal encounters obstacles, its total signal energy will inevitably experience significant attenuation. Additionally, LOS channels obstructed by obstacles can lead to significant fluctuations in RT, RDS, and KUR values. Moreover, areas with severe multipath effects often accompany severe NLOS errors, causing RDS to increase with the increase in multipath classification. Finally, KUR can also serve as an important indicator for assisting in judging the quality of NLOS observations. KUR values decrease significantly with the increase in severity of multipath interference.
The Fuzzy Comprehensive Evaluation is adopted to classify channel states. Let represent the feature set extracted from the signal waveform, and the corresponding distance estimation result be , where denotes the total number of classification features. The specific method for classifying NLOS channels is as follows:
Find the data closest to real-time measurements in the local sampled dataset. Let the local dataset under channel
p be denoted as
and
can be respectively considered as the factor domain and evaluation domain. Assuming the weight values
for the above features
regarding channel classification, the combination importance of
classification features can be viewed as a fuzzy set
in the feature domain
. The evaluation result is defined as a fuzzy set
in domain
, which can be obtained through the following fuzzy transformation:
can be expressed in matrix form as
. In this article, the fuzzy operation operation can be regarded as the inner product of two vectors.
The sampling data that achieves the maximum value in the evaluation result
is considered as the data closest to real time measurement. The corresponding
can be represented as
. A new local dataset
can be generated, where
represents the ranging error,
represents the current true channel condition. We identify the propagation channel of online measurements as one of the sample channels in
, or a mixture of multiple sample channels. When NLOS is determined, we can further predict the NLOS ranging error using the same method. There is an upper limit on the representative number of channels, the threshold can be expressed as
According to Equation (
33) if the volume of real-time test data exceeds the discrimination capability of this method, it is necessary to discard all data to avoid outliers that deviate significantly from the local data. Subsequently, the implementation of the NLOS identification and suppression method is as follows:
If the above conditions cannot be met, the positioning channel at this time can be divided into a combination of multiple channels, and these channels all meet the conditions
The NLOS suppression method can be denoted as
Where
3.3. SRUKF Based Location Estimation Method for NLOS Mitigation
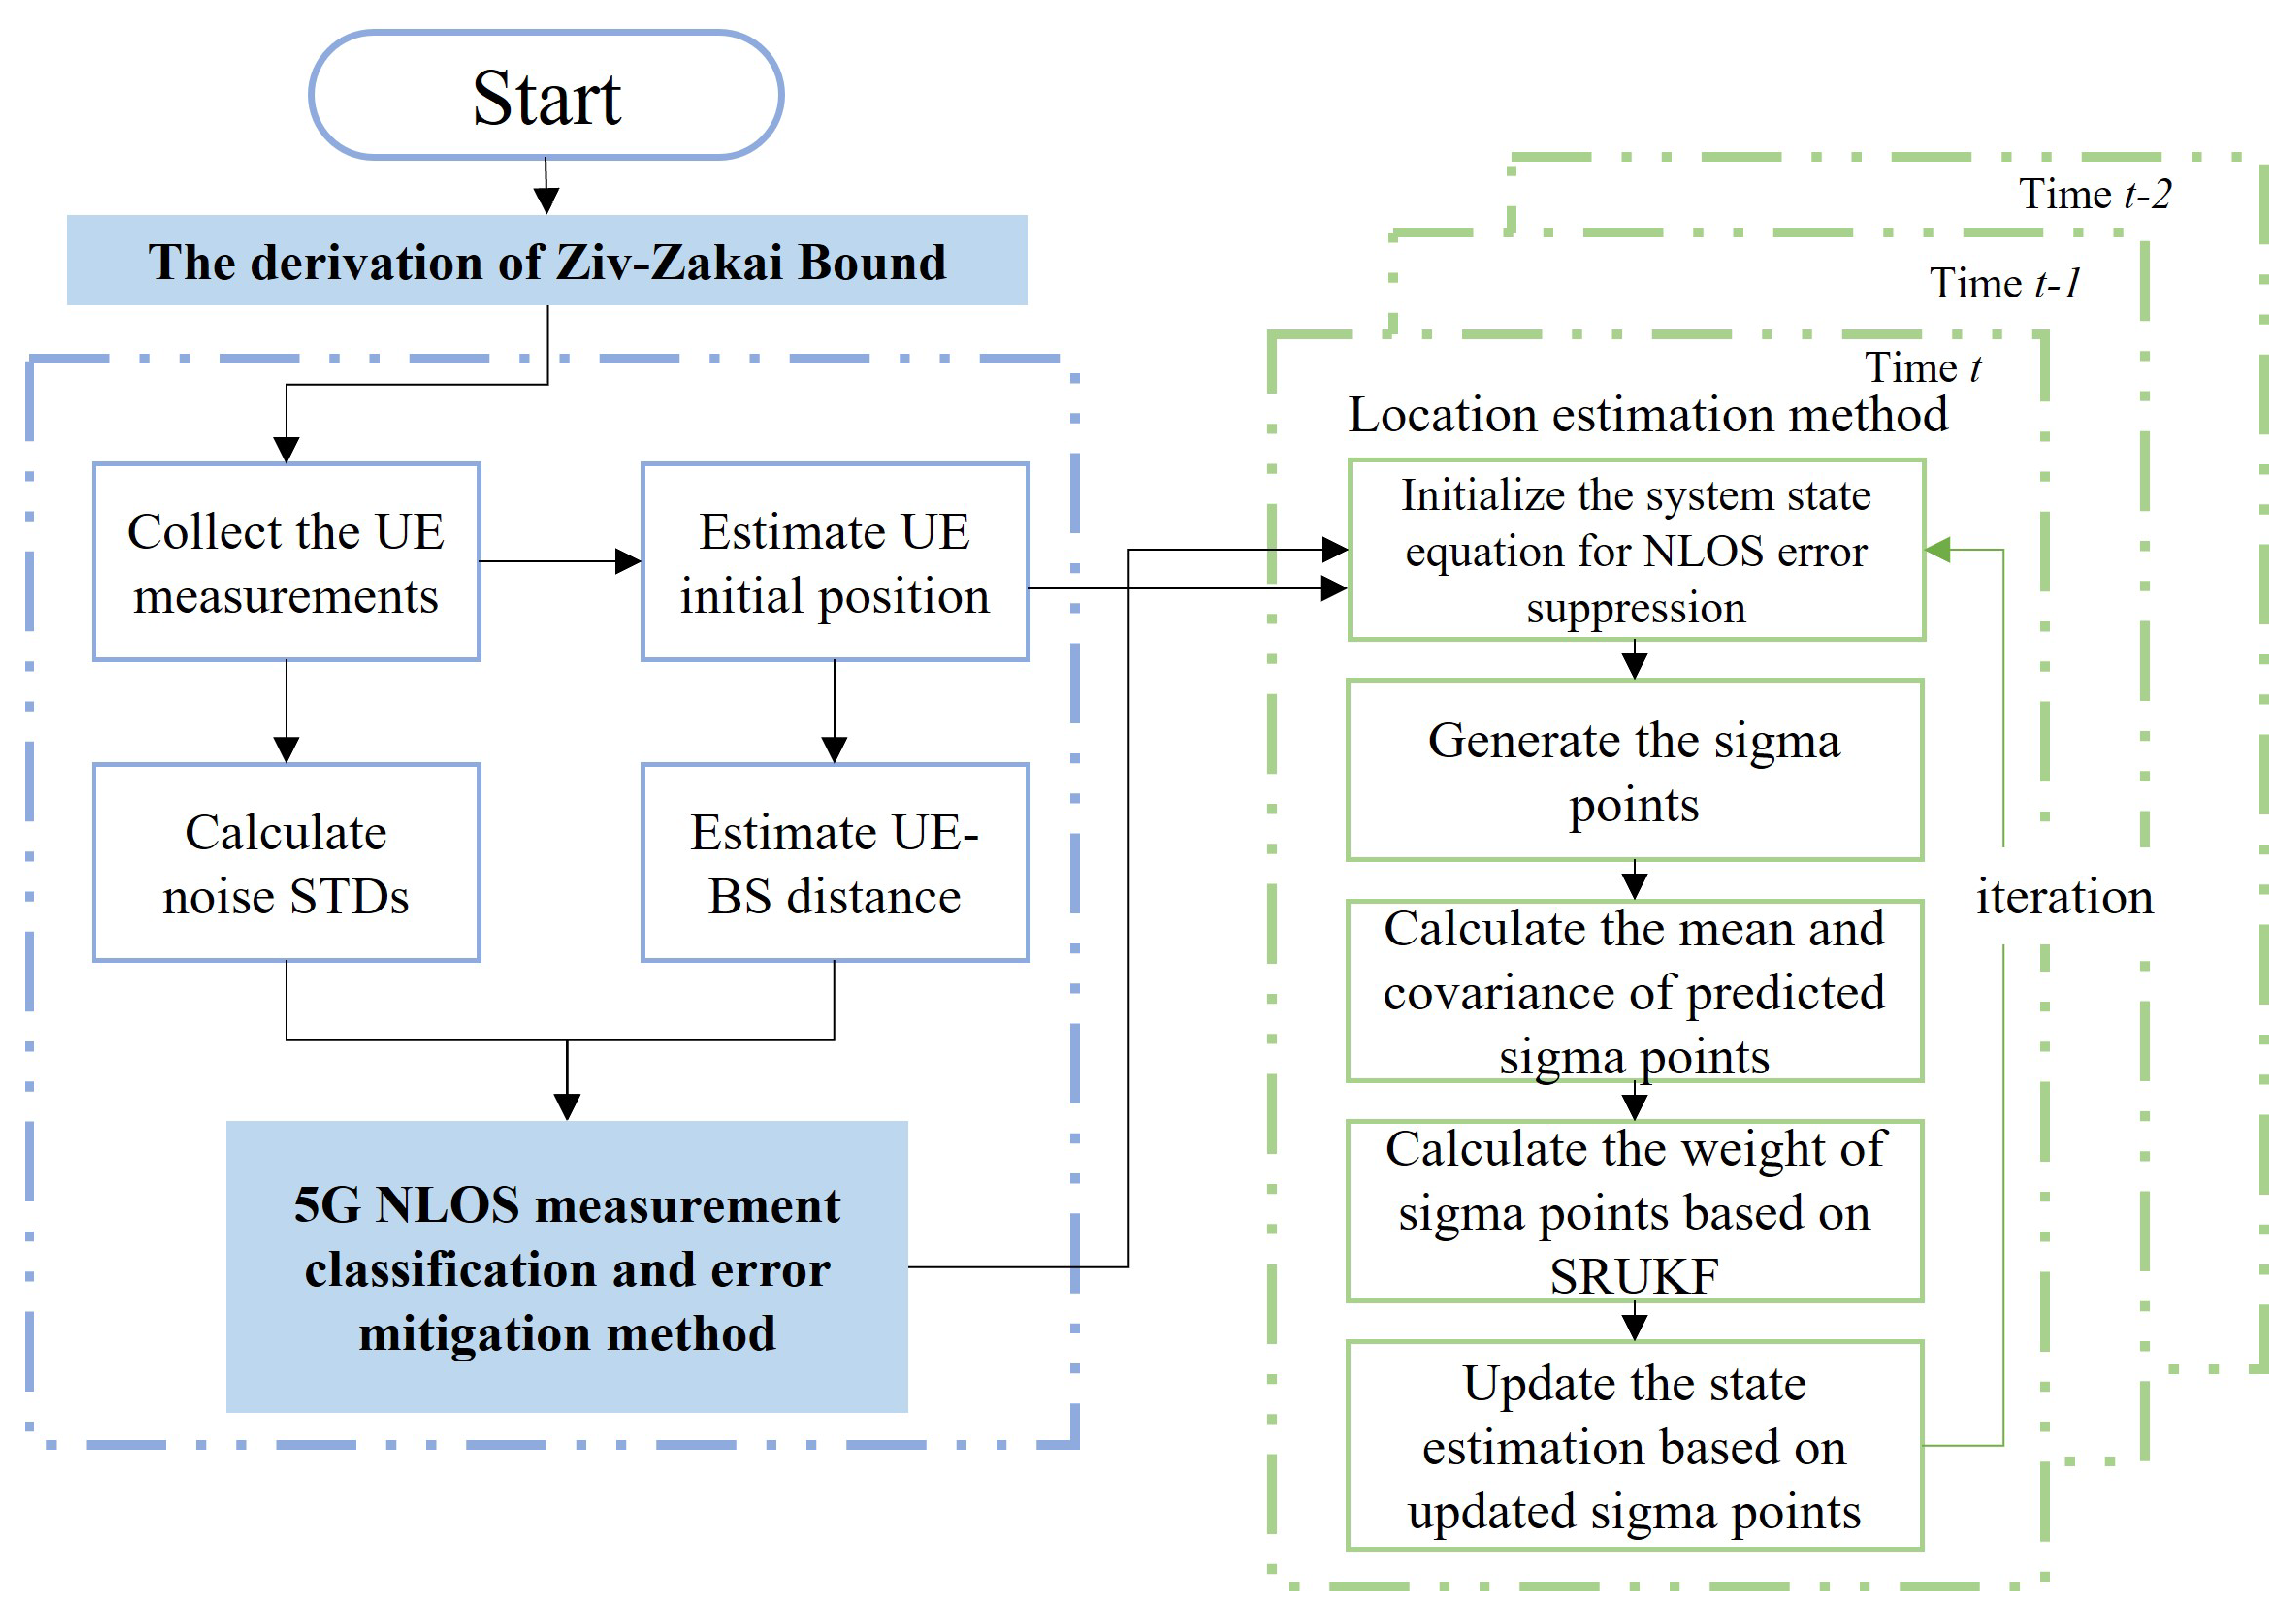
In the previous section, we presented a method for NLOS mitigation for each base station’s positioning signal. In this section, we select some NLOS observations based on the previous section for fused position estimation. To improve the numerical stability of the output results of the position estimator, we introduce the square root of the state covariance on the basis of the UKF. In the implementation of SRUKF, the square root of the state covariance is directly propagated, avoiding the need to reconstruct the covariance at each iteration. Additionally, the square root form has the additional advantages of numerical stability and positive semi-definiteness of the state covariance. It is essential to ensure the stability of the filter during the fusion process of LOS and NLOS observations. The implementation of the proposed method is shown in
Figure 2.
The initial system state follows a Gaussian distribution with mean m and variance P. From the system state matrix we can get 2L+1 sigma points. [
30] presented the way to calculate sigma point. The nonlinear function is used to propagate these sigma vectors.
The covariance of the 5G LOS and NLOS mixed positioning state prediction error can be expressed as
Where
is Gaussian process noise matrix at
and
denotes the estimate error covariance and its square root form
The square root of the state prediction covariance can be defined as follows by introducing the QR decomposition
In the SRUKF algorithm for 5G NLOS mitigation observations, process noise mainly consists of two parts: deterministic noise and stochastic noise. Deterministic noise can be addressed through prior knowledge, while stochastic noise caused by modeling errors should be accurately compensated. Due to the inaccuracies in modeling, the expected mean and covariance of the innovations may differ from the actual values. We propose a stability coefficient to address this issue.
The estimated innovation covariance
should be larger than or equal to the actual one
in order to maintain consistent estimation.
The innovation covariance has the following expression:
Where
denotes the covariance of the predicted state and the crosscovariance between the measurements and the predicted state is
Combining (45) and (46) leads to (47)
Incorporating across (43) to (47) yields (48), the fading factor introduced into the predicted state covariance should meets the requirements
Where
represents the covariance of the predicted state
denotes the cross-covariance of the state and measurement without the fading factor, given by
.
As a result, it can be confirmed that the lower bound of the stabilized coefficient
, as obtained in Equation (
48), can be utilized to mitigate modeling errors while maintaining the estimation consistency of the innovation. The square root of the predicted measurement covariance can be derived according to Equation (
41).
Here,
represents the dimension of the receiver.
, where
i ranges from 0 to
, signifies the propagated sigma point, and
denotes the predicted measurement results.
represents the Gaussian measurement noise matrix at time
. The term
represents the weight of the sigma points. The state covariance derived from QR decomposition can be calculated by:
Where
, and i ranges from 0 to
, denotes the propagated sigma points,
represents filtering gain.
4. Simulation and Experiment Results Analysis
In this section, we evaluate the performance of the proposed NM-SLE algorithm through simulation and field experiments. The effectiveness of the proposed method for NLOS observation identification and suppression is validated in real environments. The algorithm proposed can adequately exploit the features of NLOS signals and effectively suppress the residual NLOS measurement errors in the position estimation process. In both simulation and field experiments, we have compared the performance of the proposed localization algorithm with four existing advanced NLOS error elimination algorithms: SVM-REM[
16], Vector Tracking Loop (VTL)[
17], Virtual Base station(VBS) [
19] and Improved Robust Unscented Kalman filter (IRUKF)[
26]. The data set used in the simulation is composed of 12000 LOS samples and 5200 NLOS samples.
4.1. Simulation Results Analysis
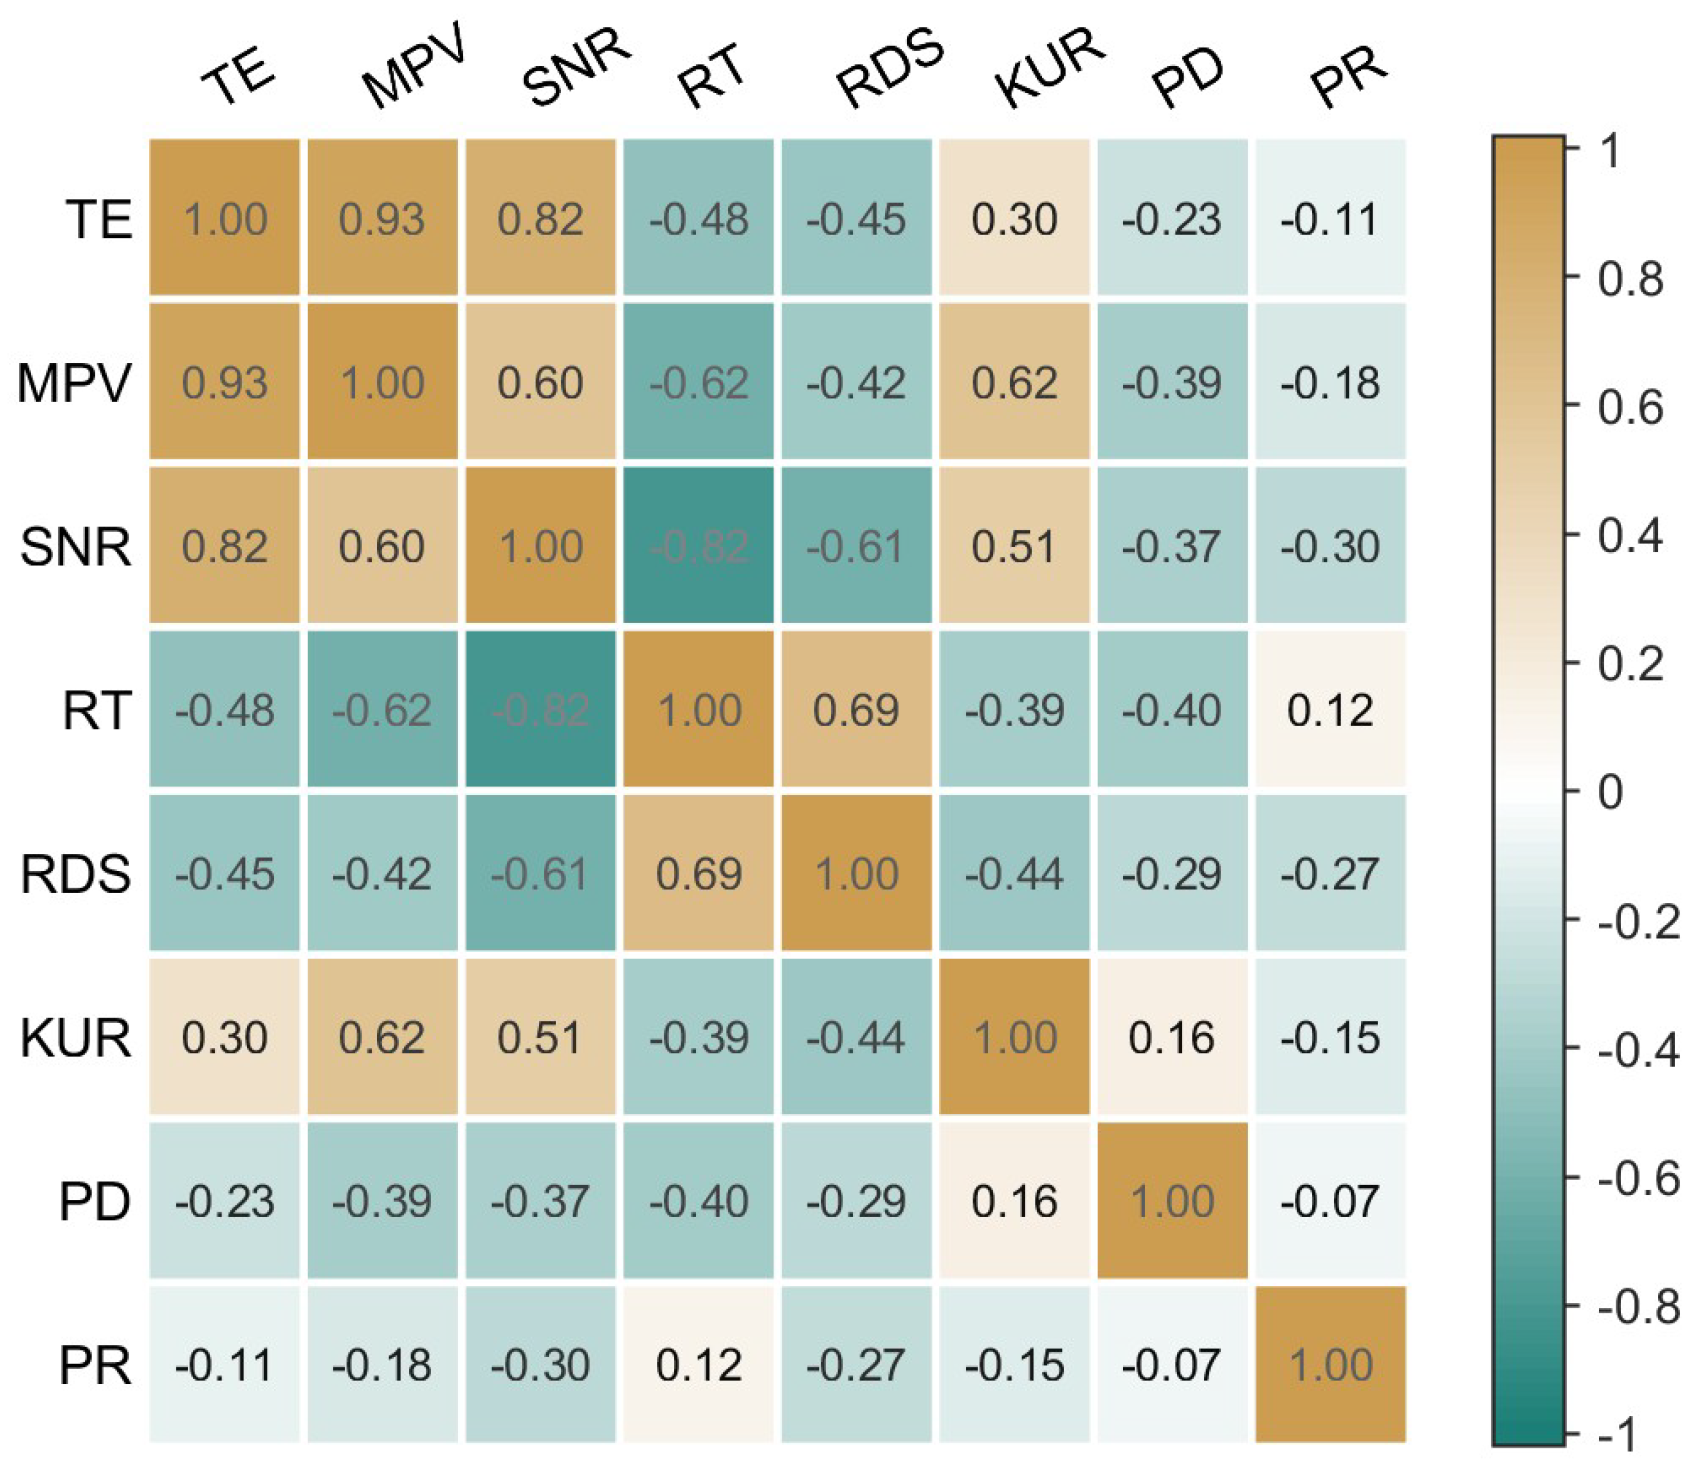
In
Figure 3, the correlation of candidate features selected for NLOS observations in this paper is presented using a correlation coefficient matrix plot. The correlation matrix in the figure is symmetric about the diagonal, and each color within the square corresponds to the same meaning and value. From the analysis of the figure, it can be observed that there is a significant positive correlation between MPV and TE, MPV and SNR, and MPV and KUR, with MPV showing particularly strong correlation with TE. On the other hand, there is a noticeable negative correlation between RT and SNR, RT and MPV, and RDS and SNR. The correlation among other features is relatively weak.
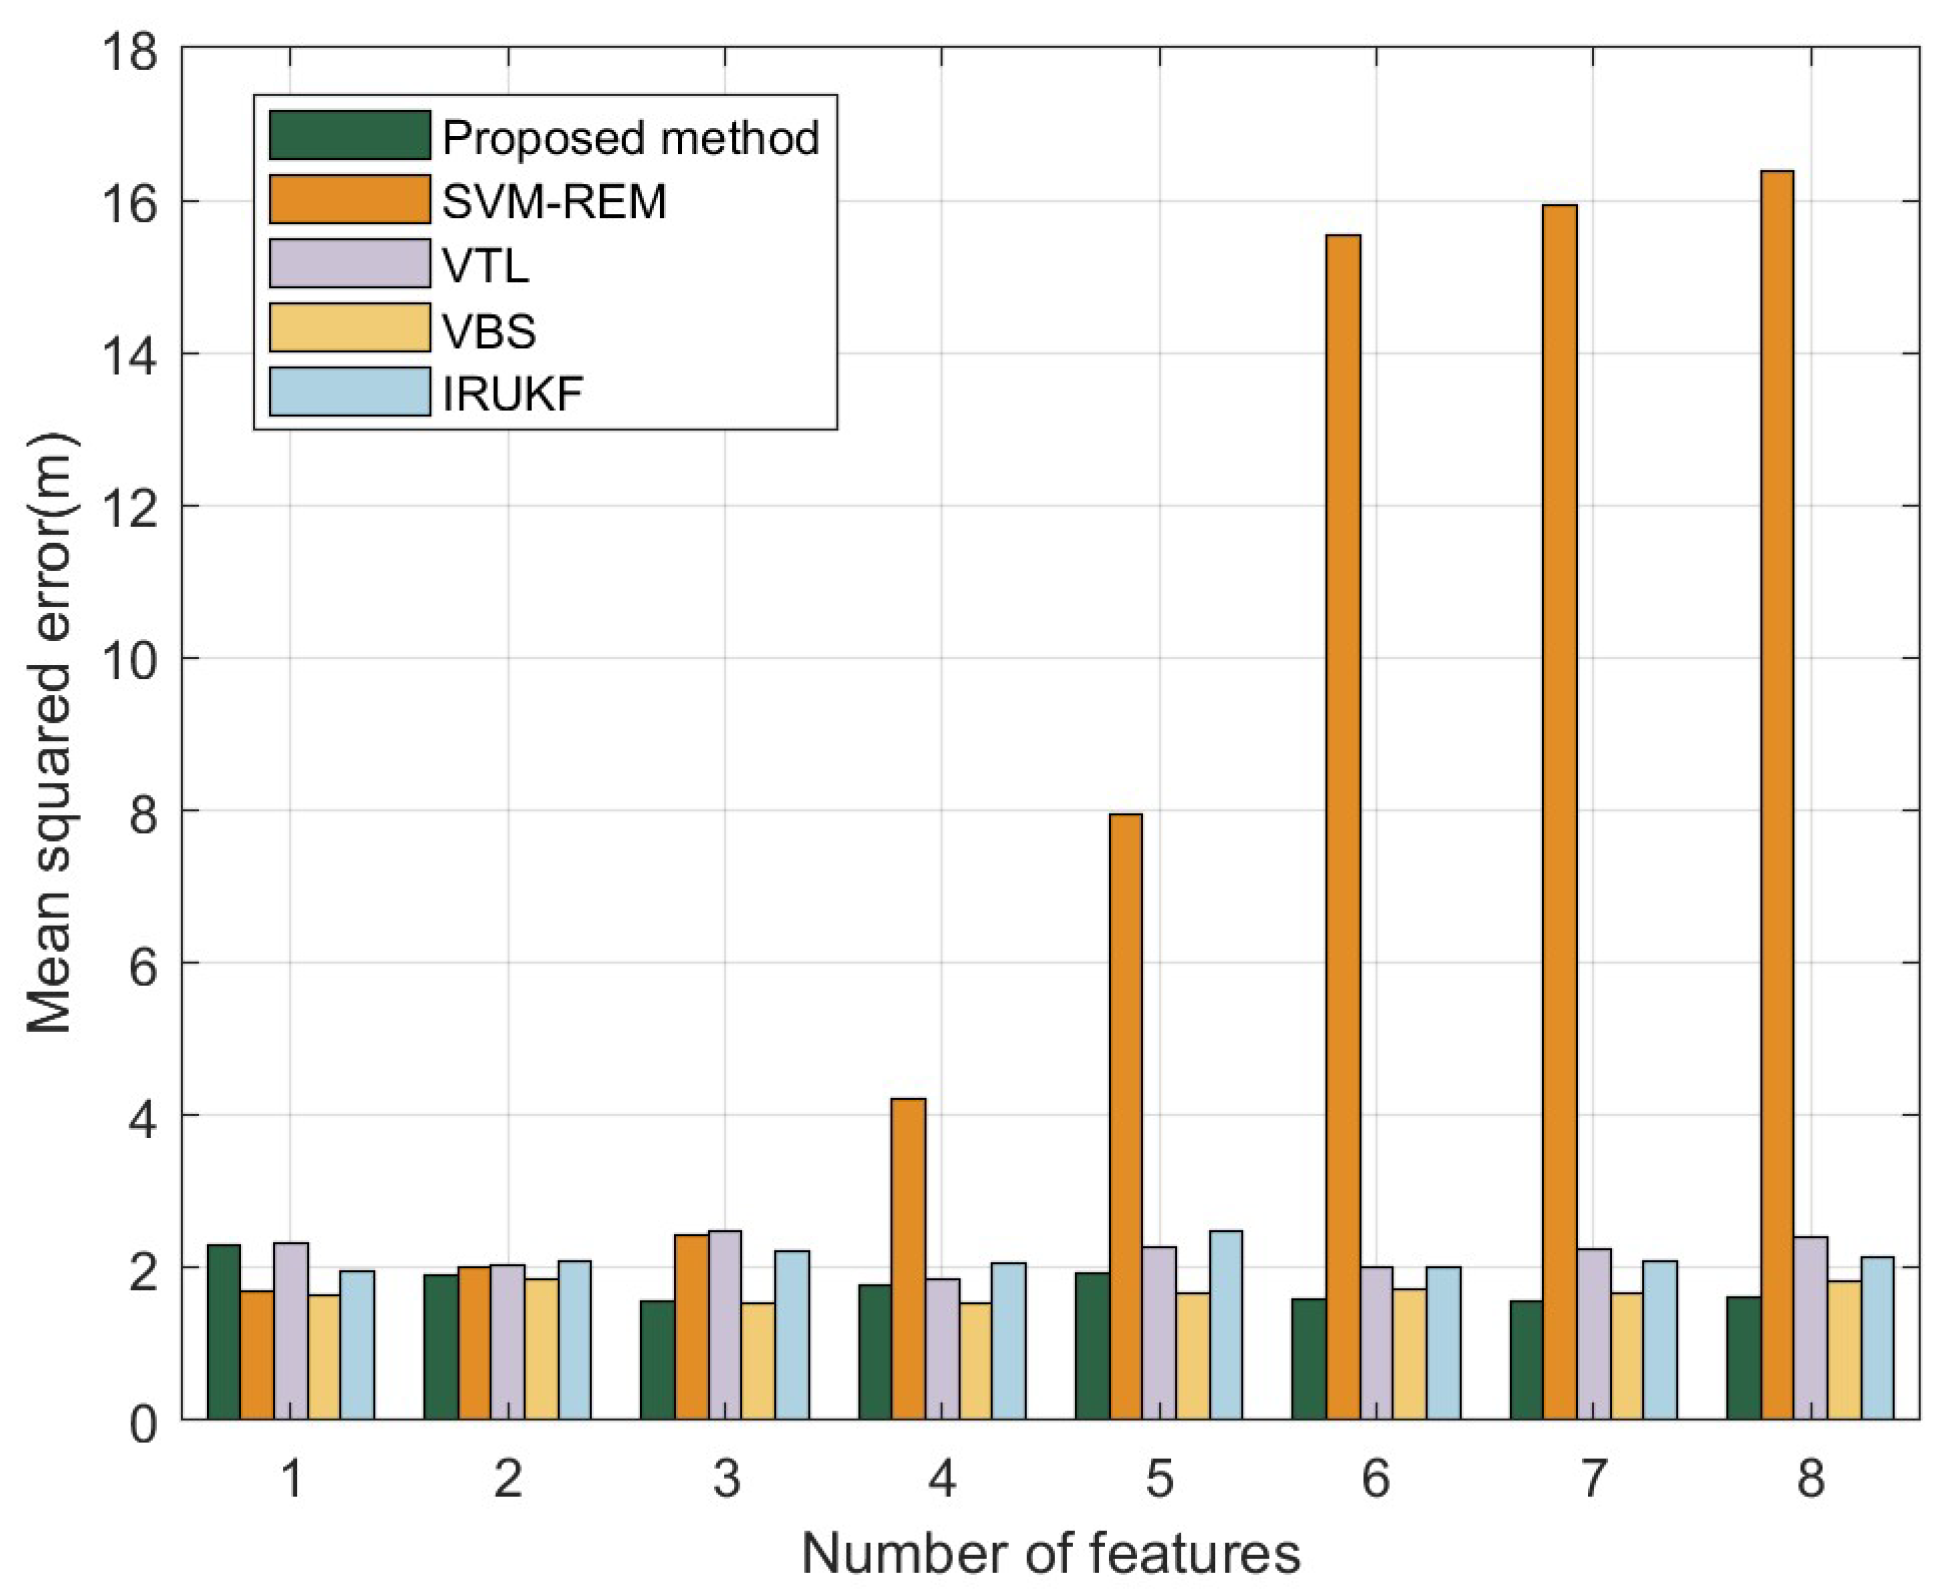
In
Figure 4, the overall performance of different methods are compared in terms of MSE. From the graph, it can be observed that SVM-REM exhibits a significant performance drop as the number of features increases, while the VBS method performs the best. The performance of the NM-SLE algorithm proposed in this paper is close to that of the VBS algorithm, with both methods showing lower errors compared to VTL and IRUKF algorithms. The average positioning errors for the proposed method, SVM-REM, VTL, VBS, and IRUKF algorithms are 1.56m, 8.16m, 1.91m, 1.52m, and 1.85m respectively.
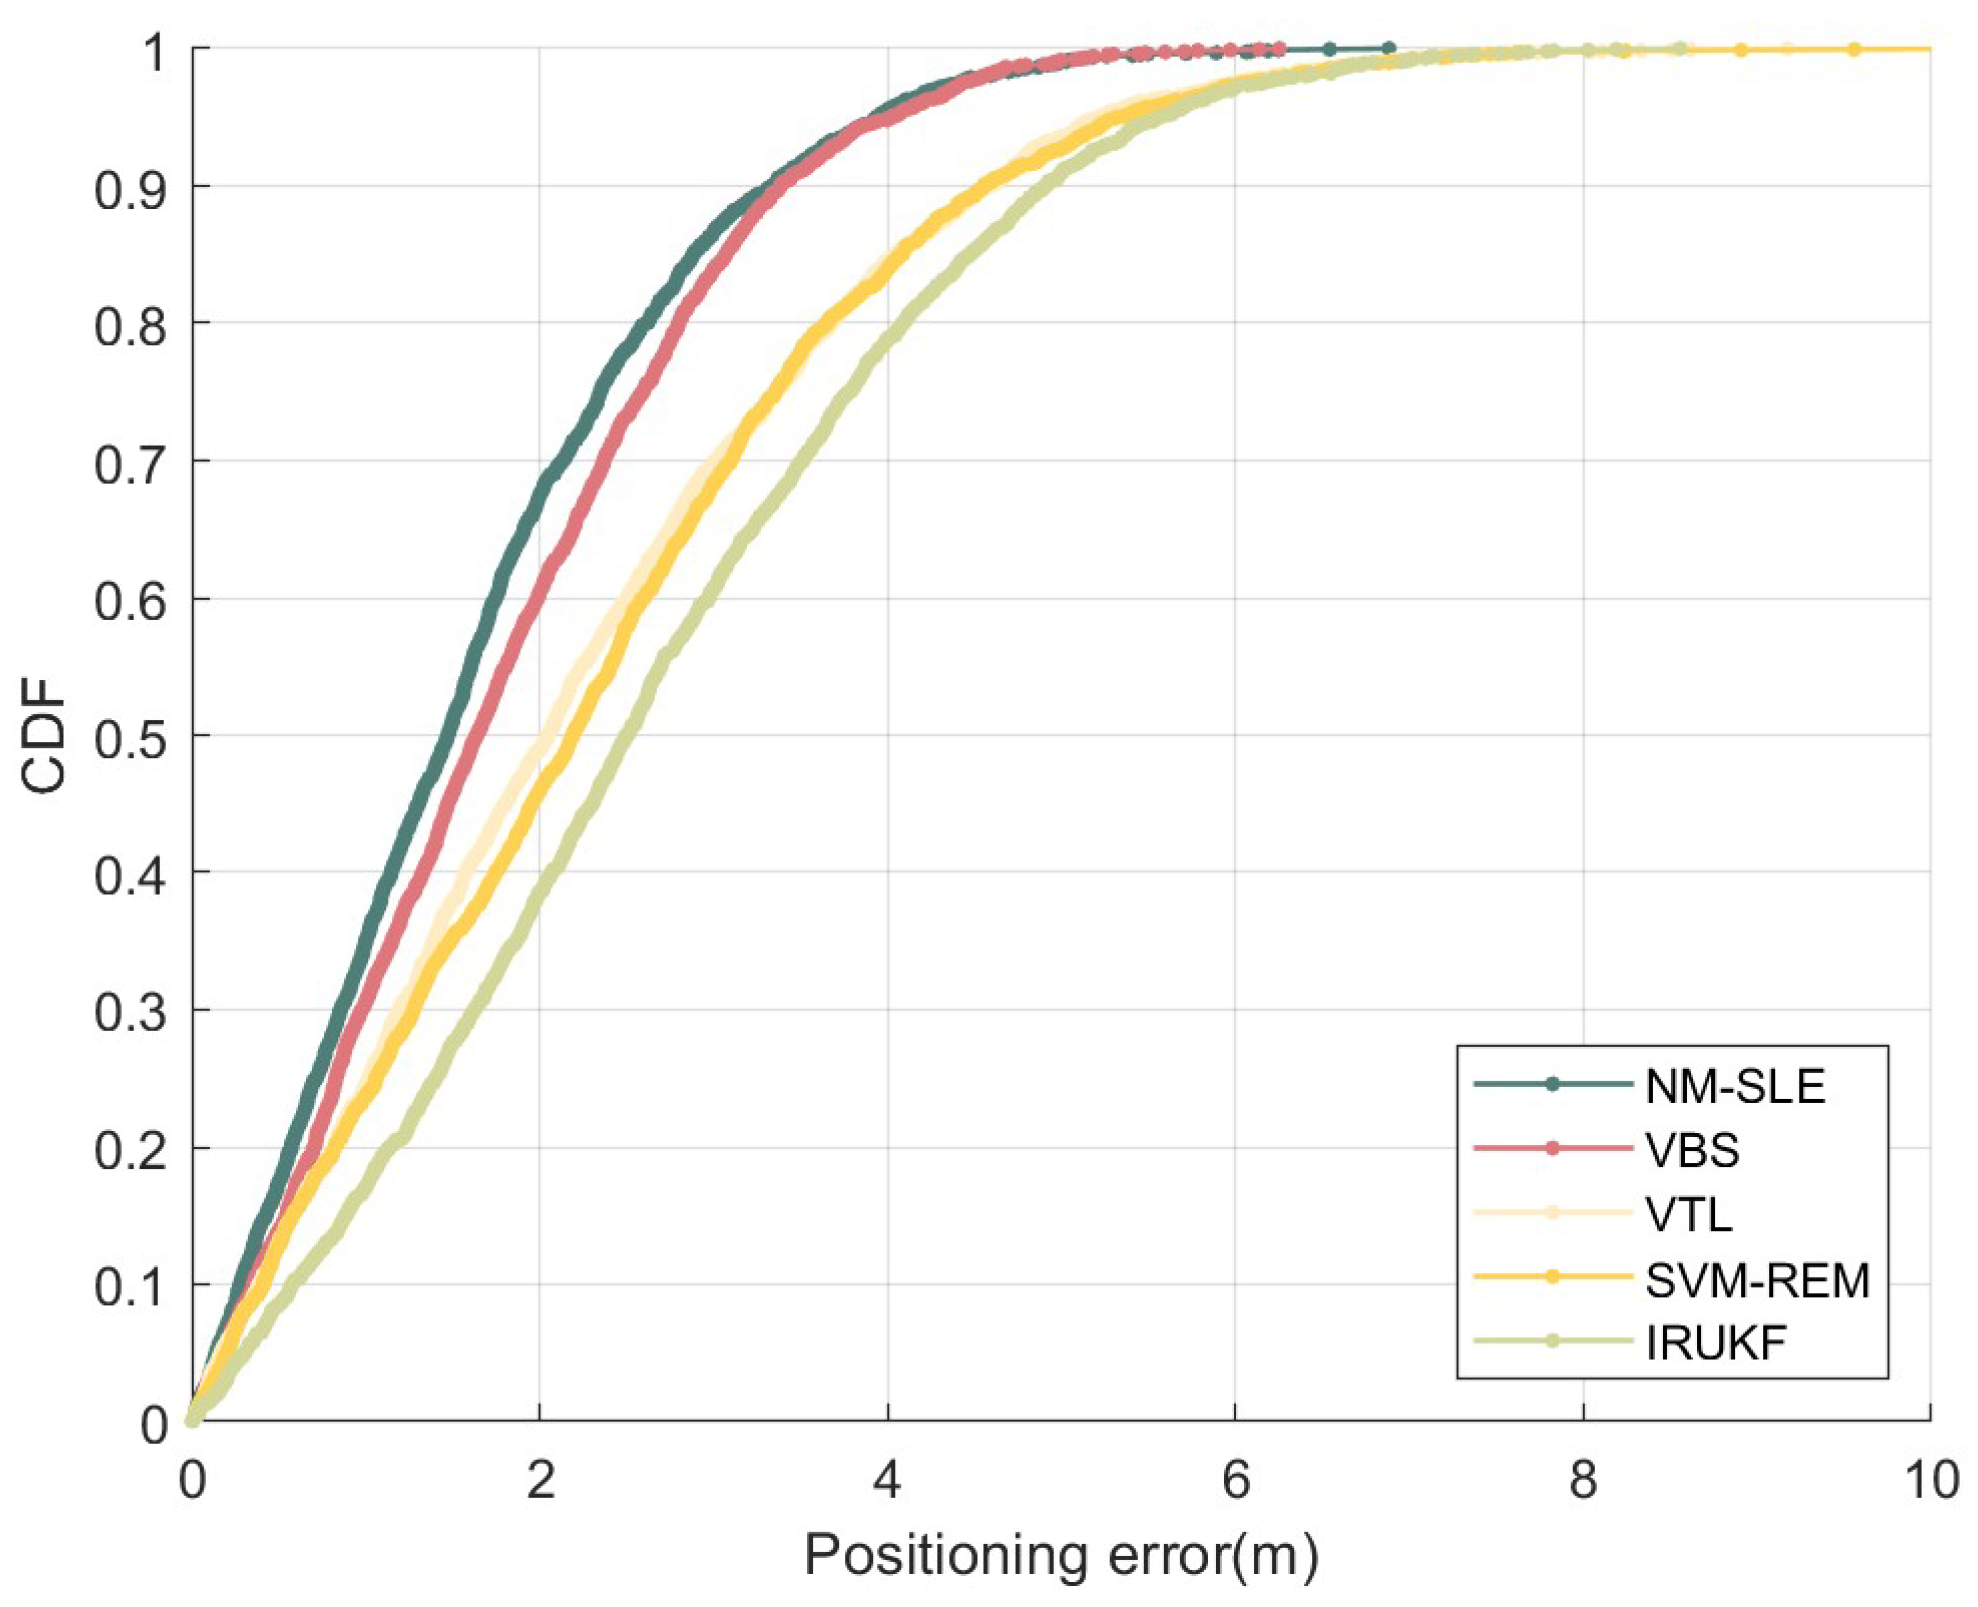
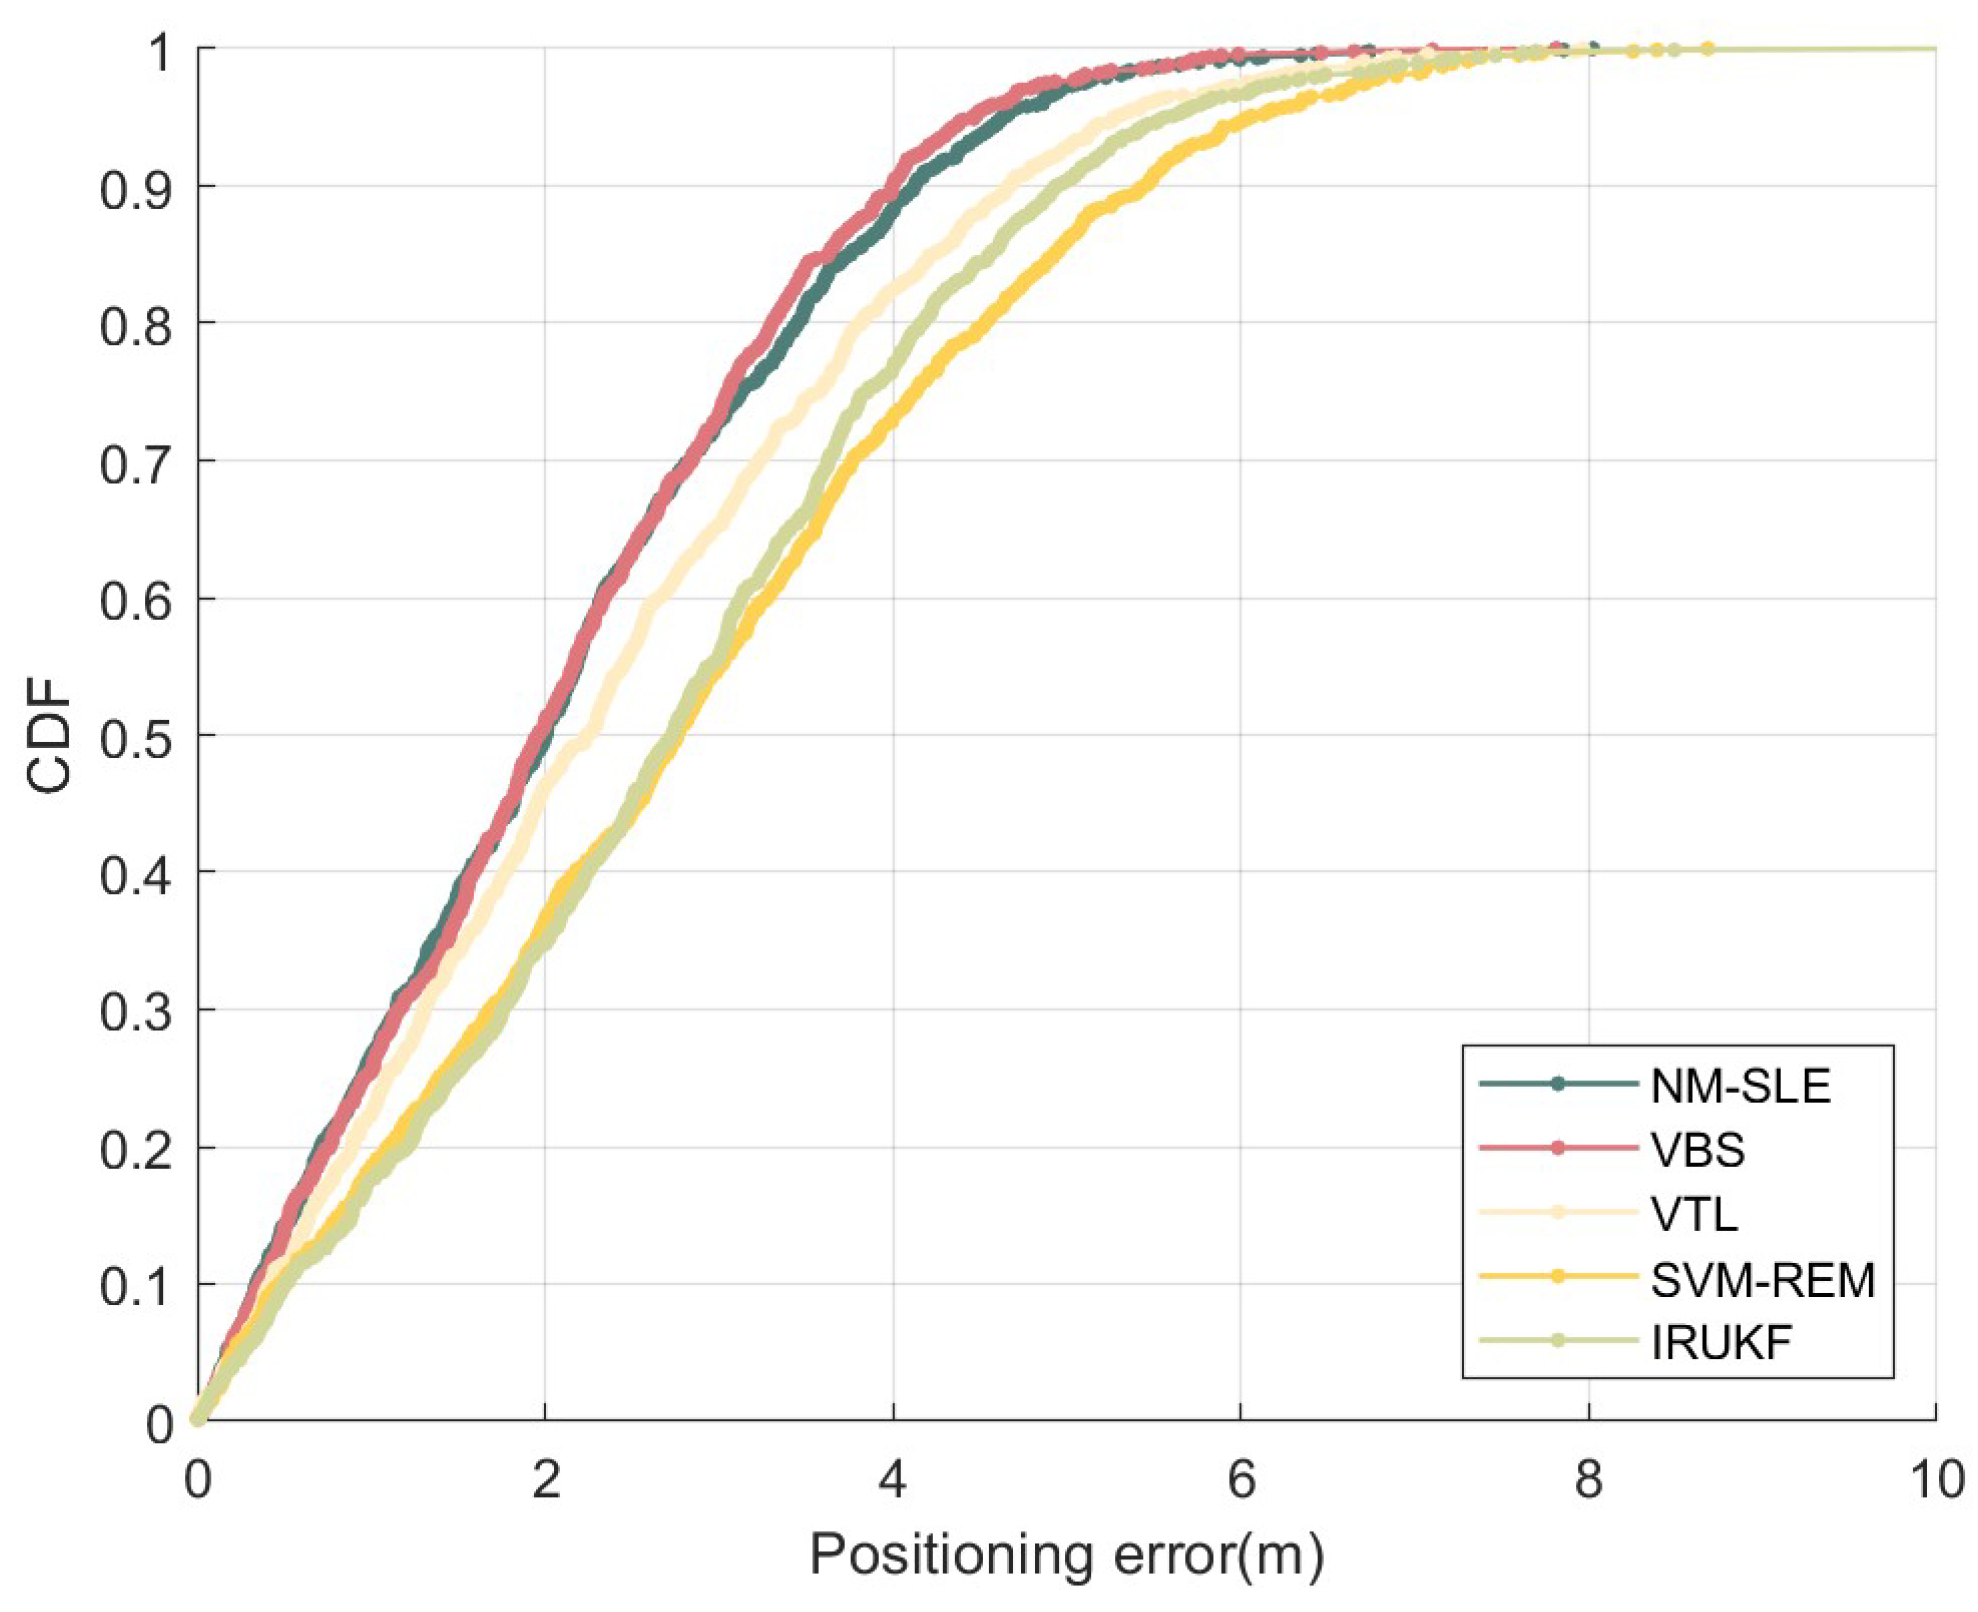
Figure 5 presents the cumulative distribution function (CDF) of positioning errors for the NM-SLE method proposed in this paper, as well as for SVM-REM, VTL, VBS, and IRUKF methods. It can be observed that the performance of the NM-SLE method and VBS is significantly better than the other three methods. At a 60% probability level, both NM-SLE and VBS achieve positioning accuracy better than 2 meters. The 90% positioning accuracy for NM-SLE, SVM-REM, VTL, VBS, and IRUKF methods are 3.31m, 4.59m, 4.57m, 3.42m, and 4.87m respectively.
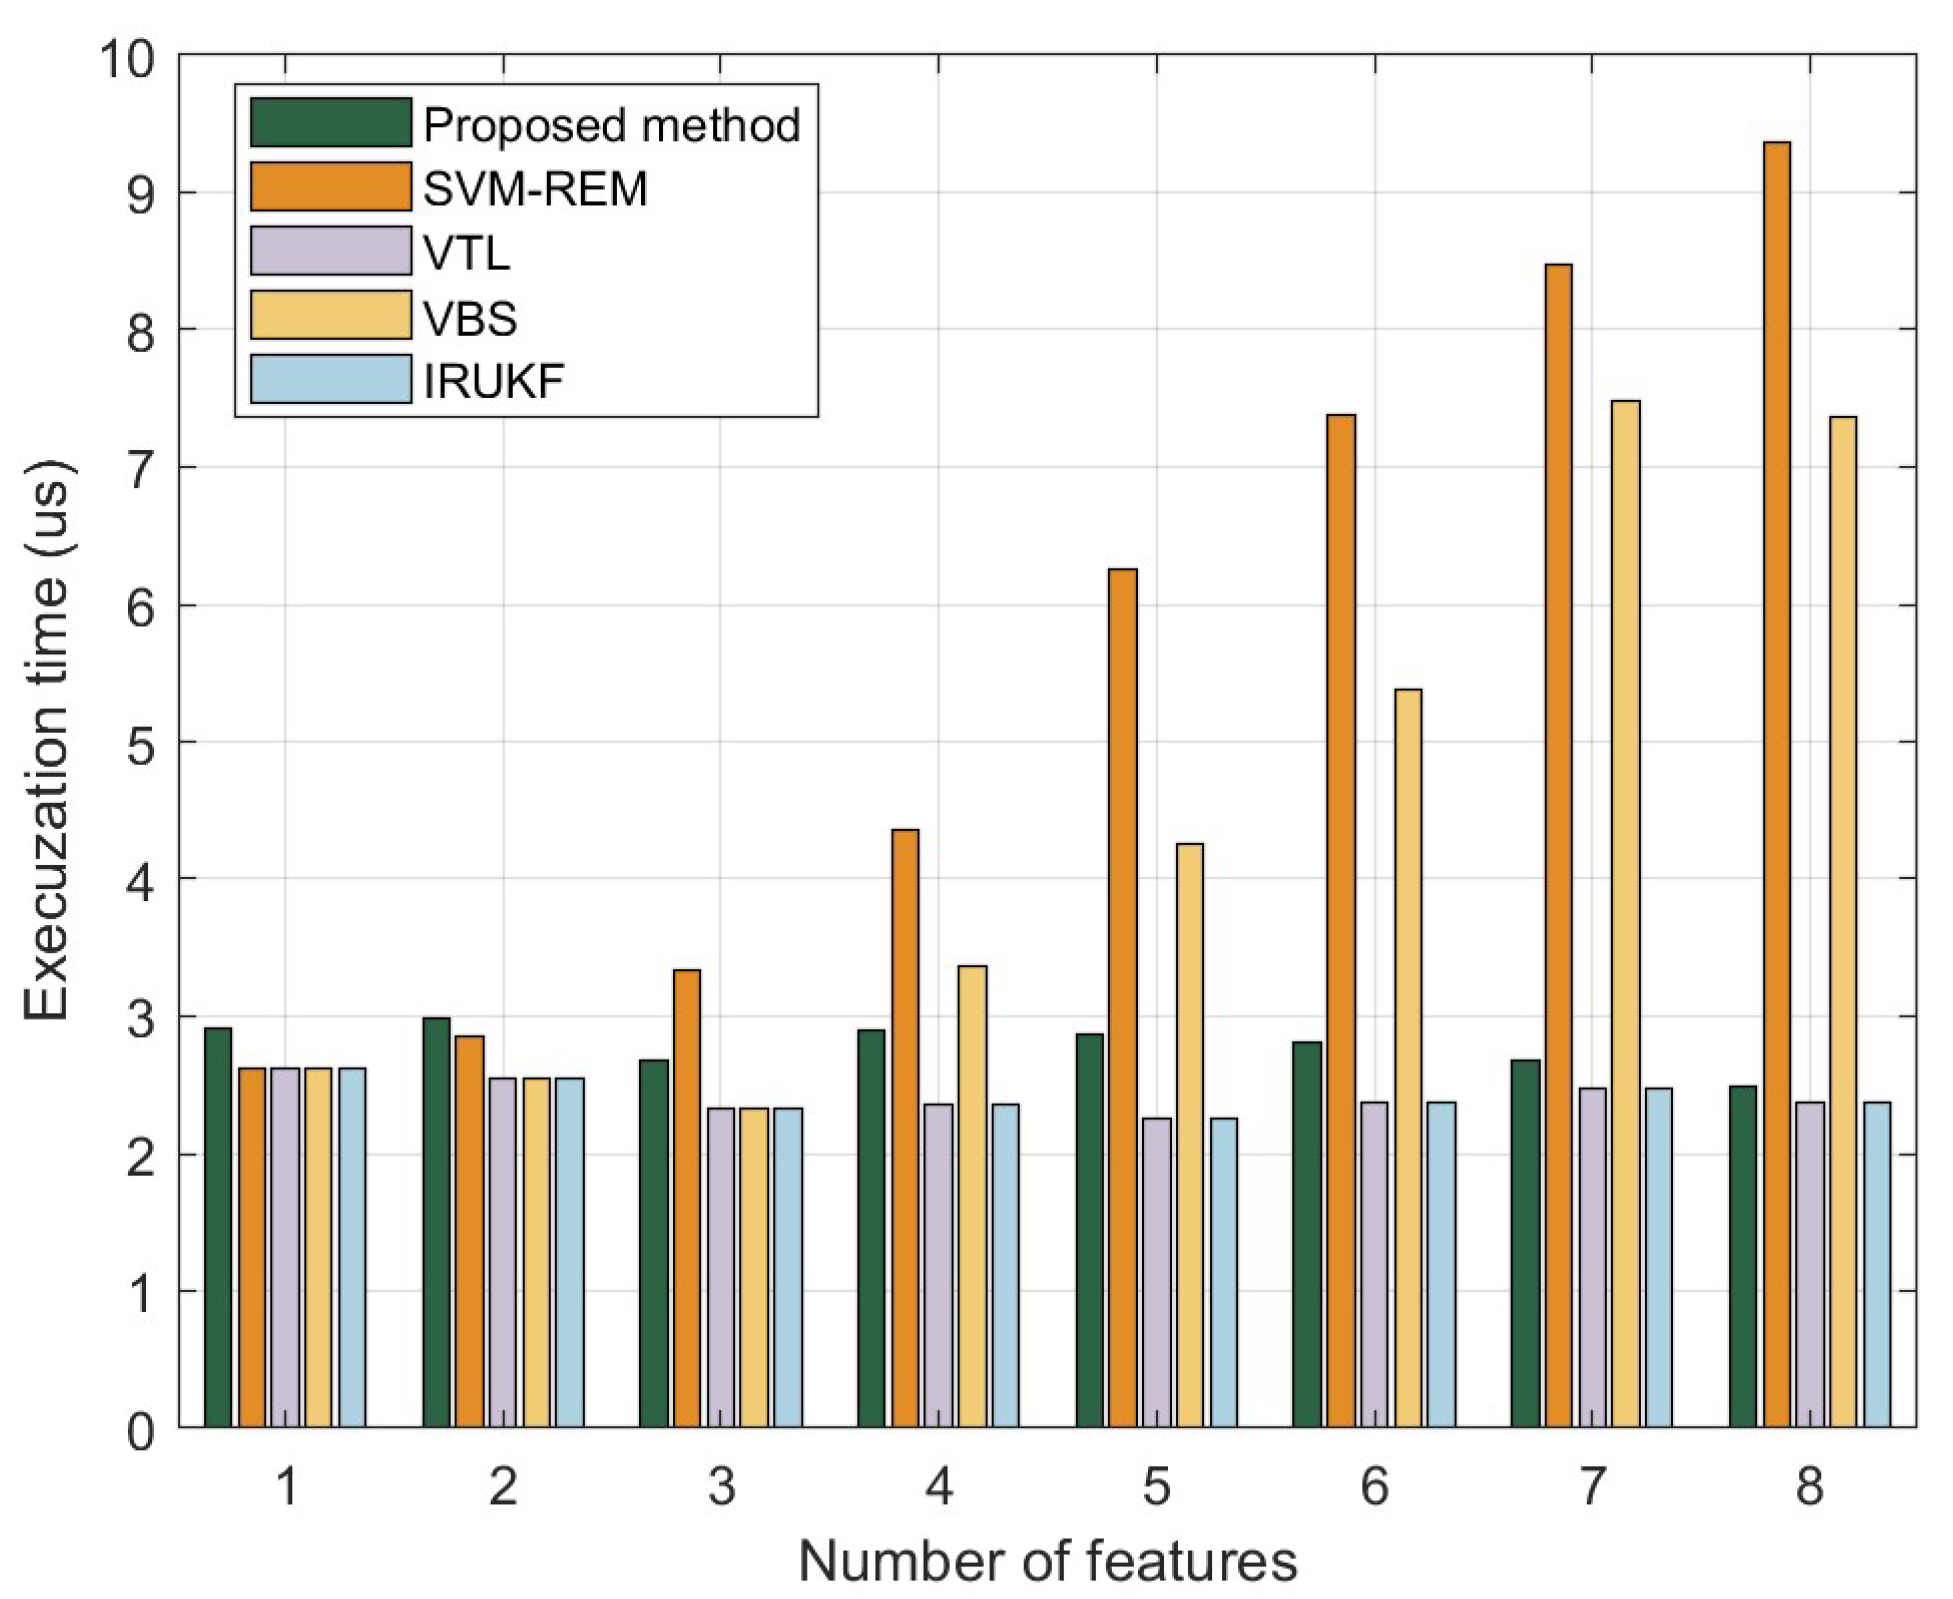
The average execution time of different NLOS suppression methods is presented in
Figure 6. The data shown in the graph were obtained by running the methods on a laptop. Although the absolute values may not be directly applicable to resource constrained embedded systems, the relative performance differences between different NLOS suppression methods still reflect their varying computational complexities.
Although this section has demonstrated the effectiveness of the proposed NM-SLE method through simulations, there are still some limitations that need further investigation. Firstly, due to hardware limitations, the simulations only considered data obtained in static scenarios. Further validation is required in dynamic scenarios. Additionally, different shapes and materials may have significant effects.
4.2. Experiment Results Analysis
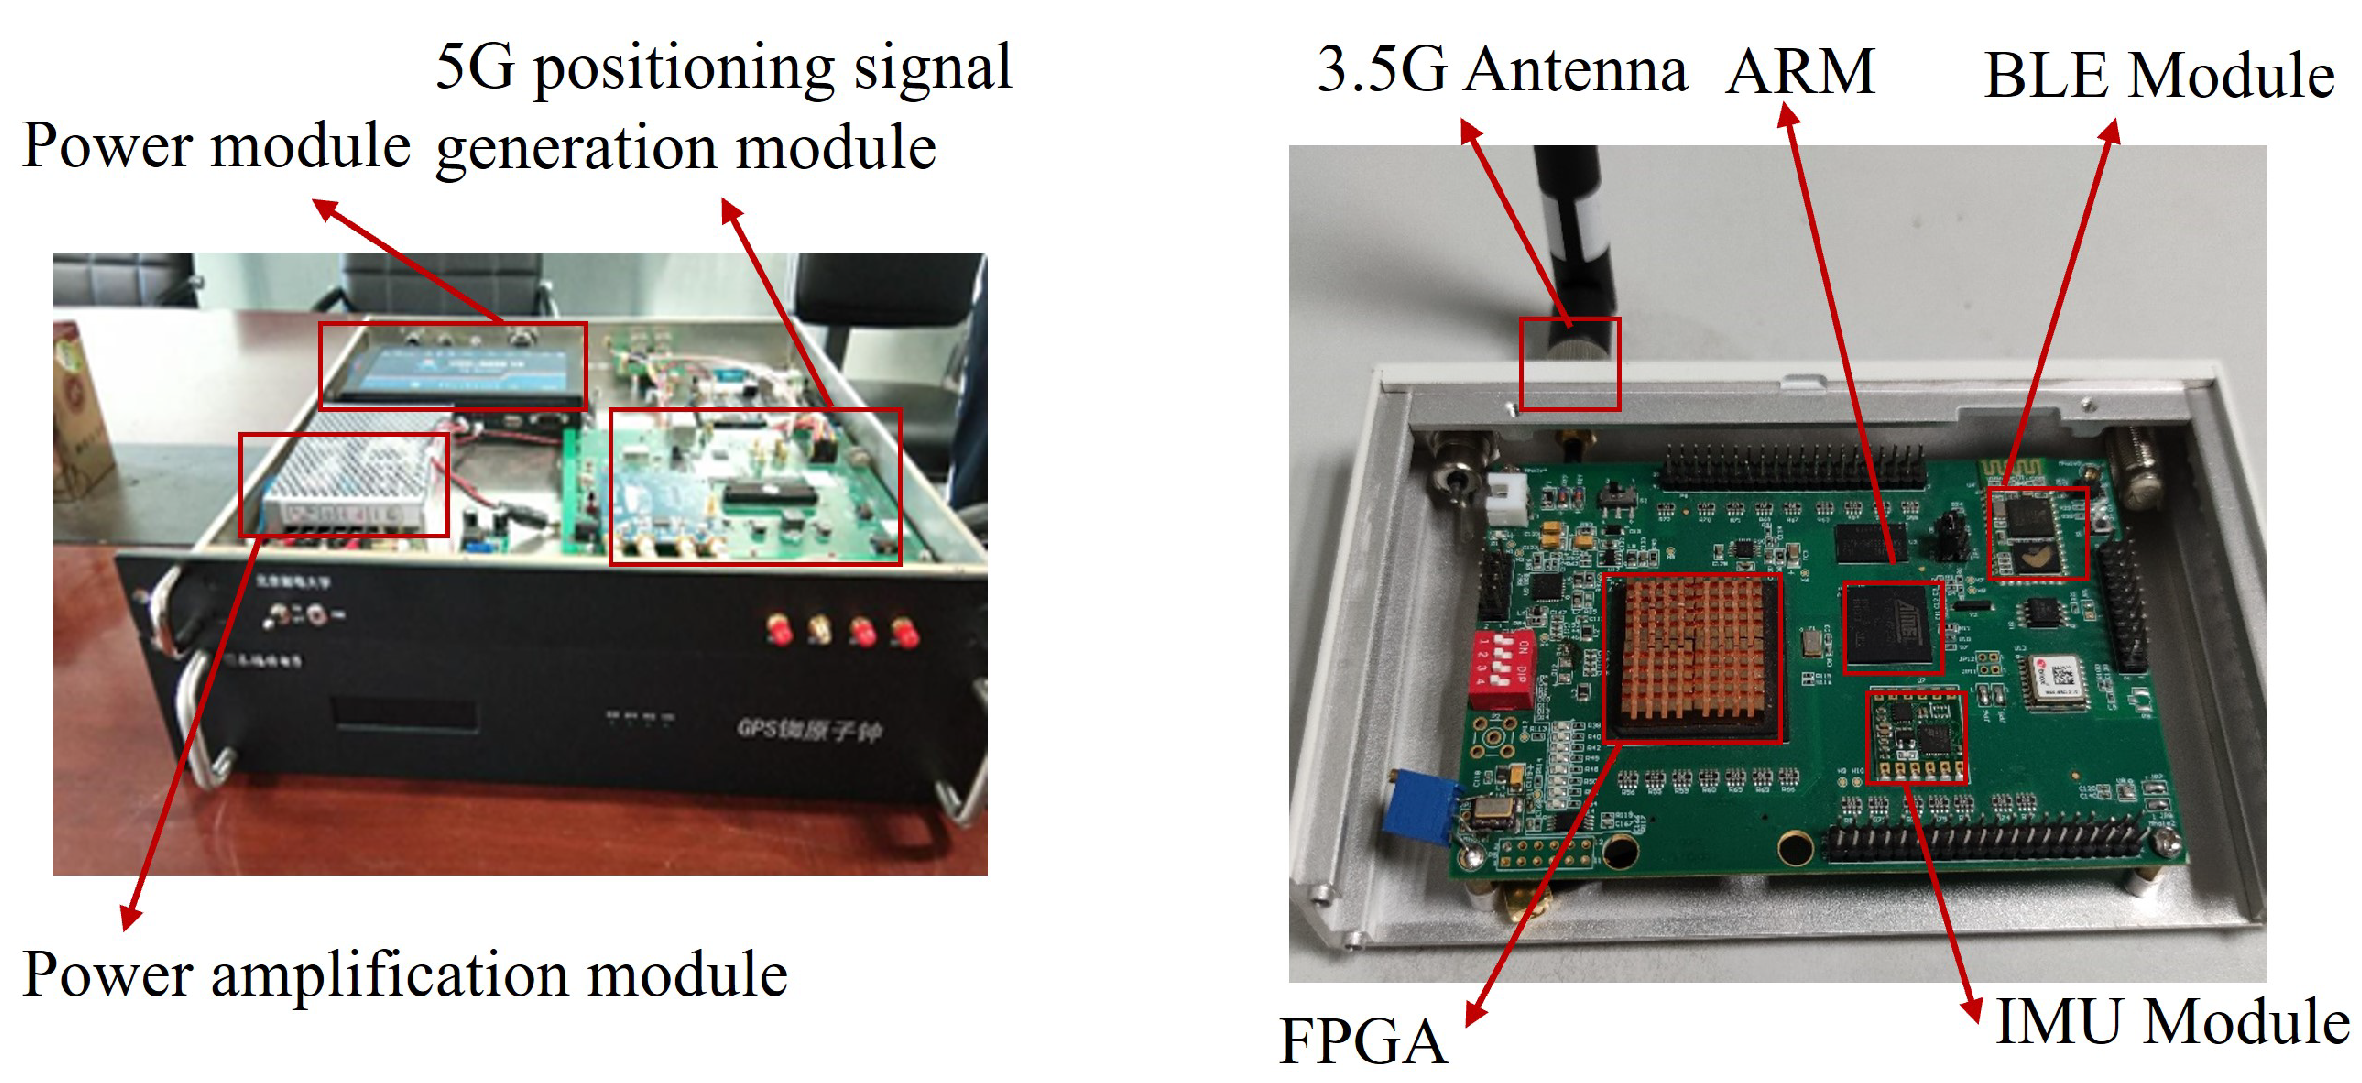
In this section, we built an indoor NLOS 5G positioning test platform based on 5G positioning signal transmitters, clock synchronization modules, atomic clocks, and 5G positioning terminals. The transmitters shared the same atomic clock and achieved time synchronization through fiber optic synchronization modules. The positioning terminals measured TDOA values and transmitted them back to a laptop for position calculation. In
Figure 7, the left side shows the physical structure of the 5G positioning signal transmitter used in the experiment, which consists of a power supply module, power amplification module, and positioning signal generation module. The right side shows the structure of the 5G positioning terminal. The terminal performs baseband signal processing and data demodulation in the FPGA, algorithm control and position calculation in the ARM processor, and information transmission via the Bluetooth module.
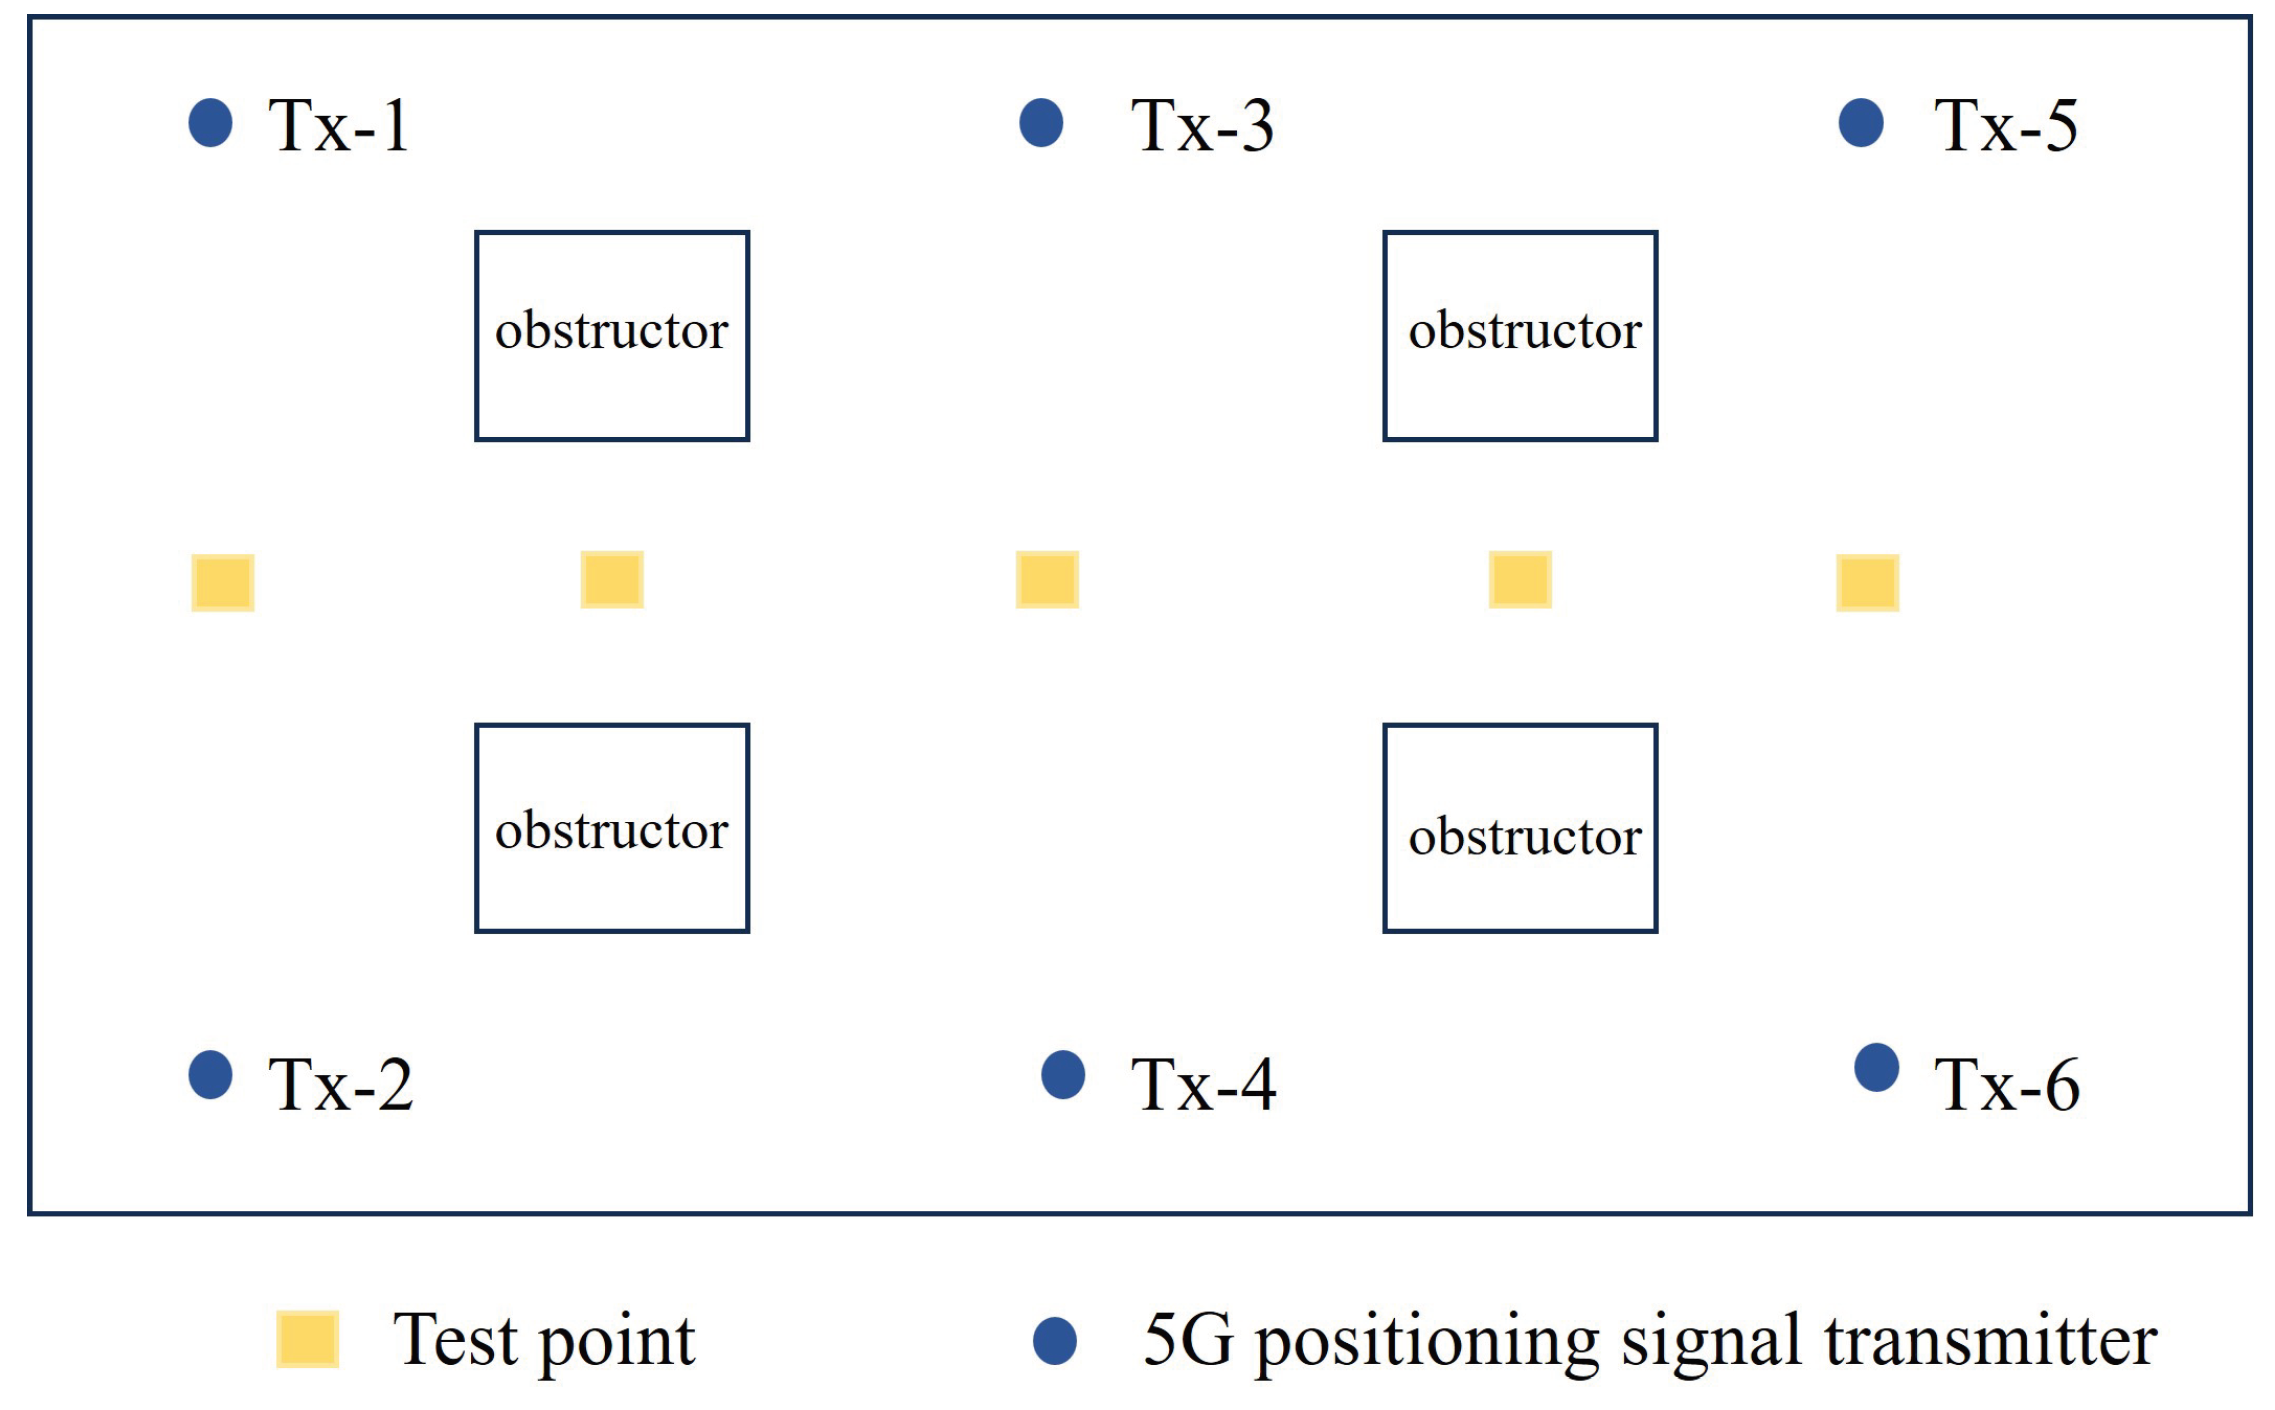
Figure 8 shows the experimental test scene. A total of six 5G positioning signal transmitters are deployed. There are 4 pillars in the center of the test area as wireless signal obstructions. The blue circle in the figure indicates the location of the positioning signal transmitter, and the yellow square indicates the location of the test point where the positioning terminal is placed.
In
Figure 9 the CDF of position error is displayed. The performance of each algorithm in the actual environment is slightly lower compared to the simulation results. The NM-SLE algorithm proposed in this paper outperforms the other four algorithms significantly. The positioning error is below 4 meters for over 90% of the cases. Additionally, the theoretical average values of the positioning error calculated from the derived CDF are presented in
Table 2. Compared to the other four algorithms, the proposed NM-SLE algorithm exhibits the best performance in field experiment.
5. Discussion
In this paper, we propose a method aimed at addressing the challenge of mitigating NLOS errors in 5G indoor localization. Our approach involves several key steps for 5G terminals: firstly, we perform classification and identification of NLOS observations based on decoupling wireless signal features, where indoor propagation channels are categorized into multiple classes to assess the severity of NLOS effects based on channel identification results. Secondly, we establish a 5G NLOS measurement identification and classification criteria for filtering ranging results. Finally, we introduce a position estimation method based on SRUKF to ensure the numerical stability of filter position estimation output results during the fusion of observations. The theoretical simulations and field experiment demonstrated the superior performance compared to four advanced methods: SVM-REM, VTL, VBS and IRUKF. The proposed method can provide crucial support for high precision localization in commercial 5G networks.
Author Contributions
Conceptualization, Z.D.; methodology, J.L.and E.H.; software, J.L.; validation, J.L.and E.H.; formal analysis, J.L.; investigation, Z.D.and J.L.; resources, J.L.; original draft preparation, J.L.and E.H.; editing, J.L.and Z.D.; visualization, J.L.; project administration, Z.D.. All authors have read and agreed to the published version of the manuscript.
Funding
This research was funded by the National Key Research and Development Program of China (grant number: 2022YFB3904702 and 2022YFB3904603).
Data Availability Statement
The data that support the findings of this study are available from the corresponding author upon reasonable request.
Acknowledgments
Thanks to Yunfei Huang, for resources support and project administration.
Conflicts of Interest
The authors declare no conflict of interest.
References
- Z. Z. M. Kassas, M. Maaref, J. J. Morales, J. J. Khalife and K. Shamei, "Robust Vehicular Localization and Map Matching in Urban Environments Through IMU, GNSS, and Cellular Signals," IEEE Intelligent Transportation Systems Magazine, vol. 12, no. 3, pp. 36-52, Fall 2020. [CrossRef]
- S.-H. Bach and S. -Y. Yi, "Constrained Least-Squares Trilateration for Indoor Positioning System Under High GDOP Condition," IEEE Transactions on Industrial Informatics, vol. 20, no. 3, pp. 4550-4558, March 2024. [CrossRef]
- Nunes, J.S.; Almeida, F.B.C.; Silva, L.S.V.; Santos, V.M.S.O.; Santos, A.A.B.; de Senna, V.; Winkler, I. Three-Dimensional Coordinate Calibration Models for Augmented Reality Applications in Indoor Industrial Environments. Appl. Sci. 2023, 13, 12548. [CrossRef]
- Raphael E. Nkrow, Bruno Silva, Dutliff Boshoff, Gerhard P. Hancke, "Transfer Learning-Based NLOS Identification for UWB in Dynamic Obstructed Settings", IEEE Transactions on Industrial Informatics, vol.20, no.3, pp.4839-4849, 2024.
- Philipp Mayer, Michele Magno, Luca Benini, "Self-Sustaining Ultrawideband Positioning System for Event-Driven Indoor Localization", IEEE Internet of Things Journal, vol.11, no.1, pp.1272-1284, 2024.
- Gianluca Torsoli, Moe Z. Win, Andrea Conti, "Blockage Intelligence in Complex Environments for Beyond 5G Localization", IEEE Journal on Selected Areas in Communications, vol.41, no.6, pp.1688-1701, 2023.
- Lismer Andres Caceres Najarro, Iickho Song, Kiseon Kim, "Fundamental Limitations and State-of-the-Art Solutions for Target Node Localization in WSNs: A Review", IEEE Sensors Journal, vol.22, no.24, pp.23661-23682, 2022.
- Bruno J. Silva, Gerhard P. Hancke, "Non-Line-of-Sight Identification Without Channel Statistics", IECON 2020 The 46th Annual Conference of the IEEE Industrial Electronics Society, pp.4489-4493, 2020.
- M. Agiwal, A. Roy and N. Saxena, "Next Generation 5G Wireless Networks: A Comprehensive Survey," IEEE Communications Surveys & Tutorials, vol. 18, no. 3, pp. 1617-1655, thirdquarter 2016. [CrossRef]
- I. Guvenc and C. -C. Chong, "A Survey on TOA Based Wireless Localization and NLOS Mitigation Techniques," IEEE Communications Surveys & Tutorials, vol. 11, no. 3, pp. 107-124, 3rd Quarter 2009. [CrossRef]
- L.-T. Hsu, H. Tokura, N. Kubo, Y. Gu, and S. Kamijo, “Multiple faulty GNSS measurement exclusion based on consistency check in urban canyons,” IEEE Sensors J., vol. 17, no. 6, pp. 1909–1917, Mar. 2017.
- J. Zhang, J. Salmi and E. -S. Lohan, "Analysis of Kurtosis-Based LOS/NLOS Identification Using Indoor MIMO Channel Measurement," IEEE Transactions on Vehicular Technology, vol. 62, no. 6, pp. 2871-2874, July 2013. [CrossRef]
- Y. Zhu, W. Xia, F. Yan and L. Shen, "NLOS Identification via AdaBoost for Wireless Network Localization," IEEE Communications Letters, vol. 23, no. 12, pp. 2234-2237, Dec. 2019. [CrossRef]
- Cha, K.-J.; Lee, J.-B.; Ozger, M.; Lee, W.-H. When Wireless Localization Meets Artificial Intelligence: Basics, Challenges, Synergies, and Prospects. Appl. Sci. 2023, 13, 12734. [CrossRef]
- B. Silva and G. P. Hancke, "Ranging Error Mitigation for Through-the-Wall Non-Line-of-Sight Conditions," IEEE Transactions on Industrial Informatics, vol. 16, no. 11, pp. 6903-6911, Nov. 2020. [CrossRef]
- Z. Yin, K. Cui, Z. Wu, and L. Yin, “Entropy-based TOA estimation and SVM-based ranging error mitigation in UWB ranging systems,” Sensors, vol. 15, no. 5, pp. 11701–11724, May 2015.
- B. Xu, Q. Jia and L. -T. Hsu, "Vector Tracking Loop-Based GNSS NLOS Detection and Correction: Algorithm Design and Performance Analysis," IEEE Transactions on Instrumentation and Measurement, vol. 69, no. 7, pp. 4604-4619, July 2020. [CrossRef]
- M. Sahmoudi, A. Bourdeau and J. -Y. Tourneret, "Deep fusion of vector tracking GNSS receivers and a 3D city model for robust positioning in urban canyons with NLOS signals," 2014 7th ESA Workshop on Satellite Navigation Technologies and European Workshop on GNSS Signals and Signal Processing (NAVITEC), Noordwijk, Netherlands, 2014, pp. 1-7.
- Z. Deng, X. Zheng, C. Zhang, H. Wang, L. Yin and W. Liu, "A TDOA and PDR Fusion Method for 5G Indoor Localization Based on Virtual Base Stations in Unknown Areas," IEEE Access, vol. 8, pp. 225123-225133, 2020.
- R. Zhang, W. Xia, F. Yan and L. Shen, "A single-site positioning method based on TOA and DOA estimation using virtual stations in NLOS environment," China Communications, vol. 16, no. 2, pp. 146-159, Feb. 2019.
- L.-T. Hsu, “Analysis and modeling GPS NLOS effect in highly urbanized area,” GPS Solutions, vol. 22, p. 7, Jan. 2018.
- Q. Wang, Z. Li, H. Zhang, Y. Yang and X. Meng, "An Indoor UWB NLOS Correction Positioning Method Based on Anchor LOS/NLOS Map," IEEE Sensors Journal, vol. 23, no. 24, pp. 30739-30750, 15 Dec.15, 2023. [CrossRef]
- Abdallah, B.; Khriji, S.; Chéour, R.; Lahoud, C.; Moessner, K.; Kanoun, O. Improving the Reliability of Long-Range Communication against Interference for Non-Line-of-Sight Conditions in Industrial Internet of Things Applications. Appl. Sci. 2024, 14, 868. [CrossRef]
- Zhu, W.; Zhao, R.; Zhang, H.; Lu, J.; Zhang, Z.; Wei, B.; Fan, Y. Improved Indoor Positioning Model Based on UWB/IMU Tight Combination with Double-Loop Cumulative Error Estimation. Appl. Sci. 2023, 13, 10046. [CrossRef]
- Q. Wang et al., "A Novel NLOS Identification and Error Mitigation Method for UWB Ranging and Positioning," IEEE Communications Letters, vol. 28, no. 1, pp. 48-52, Jan. 2024. [CrossRef]
- S. A. Alawsh and A. H. Muqaibel, "Compressive sensing based NBI mitigation in UWB systems in the presence of multiuser interference," 2016 IEEE Wireless Communications and Networking Conference, Doha, Qatar, 2016, pp. 1-6. [CrossRef]
- W. M. Gifford, D. Dardari and M. Z. Win, "The Impact of Multipath Information on Time-of-Arrival Estimation," IEEE Transactions on Signal Processing, vol. 70, pp. 31-46, 2022. [CrossRef]
- J.-Y. Tourneret, A. Ferrari and G. Letac, "The noncentral wishart distribution: properties and application to speckle imaging," IEEE/SP 13th Workshop on Statistical Signal Processing, 2005, Bordeaux, France, 2005, pp. 924-929. [CrossRef]
- M.Chiani, D. Dardari and M. K. Simon, "New exponential bounds and approximations for the computation of error probability in fading channels," IEEE Transactions on Wireless Communications, vol. 2, no. 4, pp. 840-845, July 2003. [CrossRef]
- S. J. Julier and J. K. Uhlmann, "Unscented filtering and nonlinear estimation," Proceedings of the IEEE, vol. 92, no. 3, pp. 401-422, March 2004. [CrossRef]
|
Disclaimer/Publisher’s Note: The statements, opinions and data contained in all publications are solely those of the individual author(s) and contributor(s) and not of MDPI and/or the editor(s). MDPI and/or the editor(s) disclaim responsibility for any injury to people or property resulting from any ideas, methods, instructions or products referred to in the content. |
© 2024 by the authors. Licensee MDPI, Basel, Switzerland. This article is an open access article distributed under the terms and conditions of the Creative Commons Attribution (CC BY) license (http://creativecommons.org/licenses/by/4.0/).
